Embed Size (px)
Citation preview

Fire Emission Production Simulator (FEPS) User's Guide
Version 1.0
Gary K. Anderson, David V. Sandberg and Robert A. Norheim
January 2004

Disclaimer The Fire Emission Production Simulator (FEPS) software is in the public domain and the recipient may not assert any proprietary rights thereto or represent them to anyone as other than Government-produced programs.
The FEPS software is provided “as is” without warranty of any kind, including but not limited to the implied warranties of merchantability and fitness for a particular purpose. The user assumes all responsibility for the accuracy and suitability of these programs for a specific application.
Reference herein to a specific commercial product, process, or service by trade name, trademark, manufacturer, or otherwise, does not necessarily constitute or imply its endorsement, recommendation, or favoring by the United States Government or any agency thereof. The views and opinions of authors expressed herein do not necessarily state or reflect those of the United States Government or any agency thereof.
Authors Gary K. Anderson is a senior engineer, URS Corporation 1501 Fourth Avenue, Suite 1400, Seattle, WA 98101-1662. David V. Sandberg is team leader of the Fire and Environmental Applications Team, USDA Forest Service Pacific Northwest Research Station, 3200 Jefferson Way, Corvallis, OR 97331. Robert A. Norheim is a research scientist with the College of Forest Resources, University of Washington, Seattle, WA 98195-2100.

i
Abstract Anderson, Gary K.; Sandberg, David V.; Norheim, Robert A.
Fire Emission Production Simulator (FEPS) is a user-friendly computer program designed for scientists and resource managers with some working knowledge of Microsoft Windows® applications. The software manages data concerning consumption, emissions and heat release characteristics of prescribed burns and wildland fires. Total burn consumption values are distributed over the life of the burn to generate hourly emission and release information. Data managed includes the amount and fuel moisture of various fuel strata, hourly weather, and a number of other factors. FEPS can be used for most forest, shrub and grassland types in North America and the world. The program allows users to produce reasonable results with very little information by providing default values and calculations; advanced users can customize the data they provide to produce very refined results.
Keywords: Prescribed burning, wildfires, fuel consumption, duff consumption, fuel moisture, plume rise, heat release.
Additional Information FEPS application updates and additional information may be found at http://www.fs.fed.us/pnw/fera/feps/.
Cooperative Acknowledgment
This publication was developed by David V. Sandberg of the USDA Forest Service Pacific Northwest Research Station, Fire and Environmental Research Applications team, and URS Corporation in cooperation with the Region 6 Aviation and Fire Management Office, USDA Forest Service, to better serve the needs of forest land managers.
This project was funded by the Joint Fire Science Program (98-1-9-05) and the National Fire Plan.
ii FEPS User's Guide
TABLE OF CONTENTS
ABOUT THIS USER'S GUIDE ....................................................................................................................IV
FEPS AS AN IMPROVEMENT TO EPM......................................................................................................5
FEPS BASICS ..............................................................................................................................................6
Starting FEPS ..............................................................................................................................................................6
Overview of Using FEPS.............................................................................................................................................6 Events ........................................................................................................................................................................7 Data Entry..................................................................................................................................................................8 Validating Data Entry................................................................................................................................................9 FEPS Screen Layout..................................................................................................................................................9 FEPS Online Help ...................................................................................................................................................11
FEPS DETAILS ..........................................................................................................................................12
Manage Events Screen ..............................................................................................................................................12
Data Entry Screens....................................................................................................................................................17 Overview of Data Entry...........................................................................................................................................17 Validating Data Entry..............................................................................................................................................18 Event Information Tab.............................................................................................................................................18 Fuel Loading Tab.....................................................................................................................................................20 Fuel Moisture Tab ...................................................................................................................................................25 Consumption Tab ....................................................................................................................................................28 Hourly Input Data Tab.............................................................................................................................................31
Reports and Charts Screen.......................................................................................................................................39 Overview of Reports................................................................................................................................................39 Overview of Charts..................................................................................................................................................41 Getting to the Reports and Charts screen.................................................................................................................42 Displaying Reports and Charts ................................................................................................................................42 Exporting Reports and Charts..................................................................................................................................43 Printing Reports and Charts.....................................................................................................................................43 Manipulating Reports in the Print Preview Window...............................................................................................43 Changing Report Units ............................................................................................................................................45 Returning to Data Entry...........................................................................................................................................45

Table of Contents iii
APPENDICES
APPENDIX A: CONVERSION FACTORS ................................................................................................46
APPENDIX B: INSTALLATION AND SYSTEM CONFIGURATION ........................................................47
Installing, Uninstalling and Reinstalling FEPS.......................................................................................................47
Checking Your System Display Configuration .......................................................................................................48
APPENDIX C: MODEL EQUATIONS .......................................................................................................50
Introduction ...............................................................................................................................................................50
FEPS Algorithms .......................................................................................................................................................51
Calculations Made for Fuel Moisture tab................................................................................................................51 Percent of Loading Consumed.................................................................................................................................51
Calculations Made for Consumption tab.................................................................................................................52 Fuel Consumption Calculations...............................................................................................................................52
Calculations on Hourly Input Data tab ...................................................................................................................57 Areal Measurements ................................................................................................................................................57 Meteorological Data ................................................................................................................................................58
Consumption Results Calculations...........................................................................................................................59
Emissions Results Calculations ................................................................................................................................62
Heat Rise Result Calculations...................................................................................................................................66
APPENDIX D: PARAMETER AND EQUATION MODIFICATIONS .........................................................68
Parameter/Equation Modifications Overview ........................................................................................................68
Managing Parameter/Equation Modifications........................................................................................................69 Parameters ...............................................................................................................................................................70 Custom Equations....................................................................................................................................................72 Leaving the Parameters/ Equation screen................................................................................................................75
APPENDIX E: THE NATIONAL FIRE DANGER RATING SYSTEM – 1978 FUEL MODEL DEFINITIONS....................................................................................................................................................................76

iv FEPS User's Guide
About This User's Guide
Welcome to Fire Emission Production Simulator (FEPS) version 1.0. FEPS is a user-friendly computer program that calculates fuel consumption, emissions and heat release parameters for scientists and resource managers who study and manage prescribed and wildland fires for management of forest and rangeland resources and have some working knowledge of Microsoft Windows® applications. Originally developed as a revision to the Emission Production Model (EPM) software, it has been renamed FEPS because of extensive changes in the model interface, data requirements, and the equations used.
This User Guide is divided into two sections:
FEPS Basics. This section, beginning on page 5, presents basic information you will need to know to use FEPS, such as installation and basic navigation.
FEPS Details. This section, beginning on page 12, provides detailed information on data entry and reporting.
Additional information is included in the appendices.
This document is the basis for a forthcoming USDA Forest Service General Technical Report, currently in preparation.
FEPS application updates and additional information may be found at http://www.fs.fed.us/pnw/fera/feps/.
Conventions This manual uses the following conventions:
• Menu selections, buttons, and dialog box names are shown in bold text. For example, “Select the File menu.”
• Key names are shown in SMALL CAPS. For example, “Press the ESCAPE key to exit FEPS.”
• Key combinations are shown separated by a hyphen (-). For example, “press CTRL-S” means, “hold down the CTRL key and press S.”
• “Click” refers to pressing the primary mouse button (Usually the left mouse button). • “Double click” refers to pressing the primary mouse button twice. • “Right click” refers to pressing the secondary mouse button.

FEPS Basics 5
FEPS as an Improvement to EPM Emission Production Model (EPM) is a FORTRAN-based model that has had widespread use for predicting emissions source strength from prescribed forest burning (Sandberg, David V. and Janice Peterson. 1984. “A source strength model for prescribed fire in coniferous logging slash.” Paper presented at the 1984 Annual Meeting, Air Pollution Control Association, Pacific Northwest Section; Portland). The program uses an integral method of prediction rather than a dynamic simulation, so it is limited to simple fires where area growth rates do not change significantly over the burning period. Although still usable, EPM has an outdated user interface and is technically deficient for long-smoldering fires and for fires that burn in several different fuel types or fire growth rates and is not suitable for most freely spreading wildland fires.
The Fire Emission Production Simulator, FEPS, is a dynamic simulation of fuel consumption, emission production, and plume buoyancy that can be used for a wide variety of fire environments. The user can initiate a program run from a library of “typical” fuelbed and fire progressions or from previously stored user defaults, providing a simple means to compile or plan emission inventories. The size and growth rate of typical fires can be adjusted to fit local applications.
FEPS incorporates a flexible user interface that allows the user to customize a burning Event. The user may adjust fuel loadings, fuel moistures, fuel consumption algorithms, fuelbed proportions and fire growth rates to fit specific events or situation, and can specify diurnal changes in meteorological conditions that will modify plume rise. Furthermore, many intermediate results are exposed to the user. The user may accept these results, or insert values of their own.

6 FEPS User's Guide
FEPS Basics This section introduces you to the basic information you need in order to use the Fire Emission Production Simulator (FEPS) version 1.0, including:
• How to start and exit FEPS.
• An overview of the FEPS screens and how to use them.
Starting FEPS You start FEPS from the Windows® Start menu.
To start FEPS:
1. Click the Windows Start button.
2. Select the Programs menu.
3. Click the FEPS menu choice under the USFS FEPS program group.
The FEPS introduction screen will appear for a few moments. Following this, the Manage Events Screen will appear. From this screen you may select, create, delete or export Events. You may also go directly to the results for an Event.
Exiting FEPS
FEPS does not automatically saves changes as you make them. To avoid a loss of work, FEPS will check to see if you are currently editing a record. If so, FEPS will give you the option of saving changes before exiting the application.
To exit FEPS:
1. From any main FEPS screen, click on File → Exit FEPS or press CTRL-X.
If you have made changes, FEPS will ask you if you wish to save them.
2. Click Yes to save the changes and exit. If a validation error occurs, other options will be presented,
3. Click No to exit FEPS without saving your changes,
4. Click Cancel to return to FEPS.
You can also exit FEPS by clicking the X button in the upper right hand corner of the FEPS window.
Overview of Using FEPS FEPS version 1.0 produces hourly emission and heat release data for prescribed and wildland fires. You start with a description of an Event. This description includes the name, location, start date, end date, and other miscellaneous properties. Then, for a given Event, you may specify up to five unique fuel profiles. Each profile includes fuel loading and fuel moisture information. Based on these data FEPS will calculate total fuel consumption for each profile. FEPS then determines flaming, short-term smoldering (< 2 hrs) and long-term smoldering involvement and consumption. Finally you indicate how the Event behaves over time. FEPS uses hourly data on fire size and local weather conditions to calculate emissions and heat release parameters on an hourly basis. Fuel characteristics for each hour are managed by distributing the fire across the five user-specified fuel profiles.

FEPS Basics 7
Events In order to use FEPS efficiently, it is important to understand how FEPS manages Events.
In FEPS, individual studies are called Events. An Event stores information about and calculates emission and release information for an entire burn (either a prescribed fire or a wildland fire) at a single location.
Because of the relative complexity of the data necessary to define an Event, users are not allowed to create one from blank input screens. All Events are created from existing Events, or System or User Defaults (templates). This approach helps the user make sure that an Event dataset is complete. However, it is incumbent on the user to review all of the supplied data, and revise it as necessary to make sure that they are correct. This procedure allows a user with less specific knowledge of a fire to accept the data in a System Default as a starting point and get reasonable results, and also allows users with more specific knowledge of a fire to completely customize the data used to compute emissions.
FEPS currently stores Events in three separate categories:
User Events
User Events represent a user-defined set of data about a specific burn. It represents specific actual or hypothetical burns at a single location over a defined period. The Event may include multiple ignition periods and may extend up to 30 days following the initial ignition period.
User Default
User Default Events represent a user-specific library of Events, intended for use in creating new User Events. If you have a User Event that you are continually using as the starting point for new Events, you can move it to a personal library of Default Events. You create User Defaults from valid User Events.
System Default
FEPS comes with a small library of System Default Events. These are intended to represent various generic burn scenarios and should serve as a good starting point for creating user Events. System Default Events may not be deleted or altered in any way. You may not create additional System Default Events.

8 FEPS User's Guide
Data Entry You enter data and produce reports in FEPS by using the following primary screens:
• Use the Manage Events screen to create a new Event, delete an existing Event, select an existing Event, or export an Event,
• Once an Event is created/selected use the five data entry screens, or tabs, to enter/edit Event information. Use the Event Information tab to initially define and enter information about an Event and define the period over which the Event occurs. Use the Fuel Loading, Fuel Moisture, Consumption and Hourly Input Data tabs to enter fuel loading, fuel moisture, fuel consumption and hourly data for the Event, and
• Use the Reports and Charts screen to view and print reports and charts.
Before discussing the details of data entry in these screens, basic methods for adding, editing and deleting information must be understood. All screens use consistent methods for adding, editing, and deleting information.
Creating a New Event
All Events must be created from a System Default, User Default, or valid User Event. First select the Event to be copied. From the menu, select File → Manage Events (or press CTRL-E). From the Manage Events screen, select “the basis for your Event” (i.e. Event Type). Select an available Event. Click Create (or press ALT-T.) Enter a new Event name and click Save. If no User Events are available, you must create one from a System Default or User Default.
Loading an existing Event
From the menu, select File → Manage Events (or press CTRL-E). This will display the Manage Events screen. Select “the basis for your Event” (i.e. Event Type). Select the Event. Click Load or press ALT-L. If no User Events are available, you must create one from a System Default or User Default. When initially installed, FEPS will only contain System Default Events.
Editing an Event After loading an existing Event or creating a new one, make the desired changes in the five data entry tabs. The status bar at the bottom of the window will indicate that the Event is being edited. Edits must be completed or canceled before navigating to other tabs. Details on the use of the five data entry tabs is given in the FEPS Details section starting on page 17. Note: System Default Events can be reviewed, but not changed.
Saving Edits to an Event
While editing, the status bar at the bottom of the window will indicate that the Event is being edited. In addition, the Save button becomes active. To save changes, click on the Save button, click on the Save Event icon on the toolbar, select File → Save Event from the menu, or press CTRL-S. Note: Saving changes may result in calculations and changes to other tabs. For Events longer than a few days, this may take a few seconds.
Canceling Changes
While editing, the status bar at the bottom of the window will indicate that the Event is being edited. In addition, the Cancel button becomes active. To cancel changes on the current tab, click on the Cancel button, click on the Cancel icon on the toolbar, or select Actions → Cancel Changes from the menu. Canceling changes will return the Event information to the last time the Event was saved.

FEPS Basics 9
Deleting an Event From the menu, select File → Manage Events (or press CTRL-E). Select “the basis for your Event” (i.e. Event Type). Select the Event to be deleted. Click Delete (or press ALT-D.)
Copying an Event To make a copy of an existing Event, follow the instructions for creating a new Event. Note: You may not create a copy of an invalid Event.
Converting a User Event to a
User Default
First load a valid User Event. From the menu, select File → Convert Event to User Default… The status bar will reflect the change.
Reports and Charts
Reports for valid Events may be accessed from a loaded Event, or from the Manage Events screen. From a loaded Event, select the Actions → Reports/Charts menu option or click the Reports/Charts icon on the toolbar. To access reports from the Manage Events screen, select File → Manage Events (or press CTRL-E). Select “the basis for your Event” (i.e. Event Type). Select the desired Event. Click Reports (or press ALT-R.)
Validating Data Entry Reports and charts can be generated only for Events with valid data, Thus, knowing that data is valid is important and is closely tracked by FEPS. Data validity information is maintained for each data entry tab as well as the Event as a whole. The status bar located at the bottom of the FEPS screen indicates whether the Event and or the currently displayed tab are valid.
If the status bar indicates that the current Event is invalid, but the current tab is valid, then you must manually view each of the other four tabs to determine where invalid data have been entered. Under certain circumstances, a change you make in the data on one tab may cause the data on another tab to become invalid. For example, if you delete a Fuel Profile you may invalidate the “% of are burning for each profile” columns in the Hourly Input Data tab.
FEPS Screen Layout As you navigate through FEPS, each screen is specific to action required at that time. There are however specific features in FEPS that remain available at all times regardless of where you are at the moment. These include items on the:
• Menu Bar
• Tool bar, and
• Status bar.

10 FEPS User's Guide
Menu Items The Menu Bar presents various commands and options. All of the major areas in the FEPS software can be accessed from the menu bar. Some menu items may not be available at all times; these will be grayed out when they are not available. For example, you cannot choose the Actions → Reports/Charts menu item if you have not saved your changes on a data entry tab.
File→Manage Events
Return to the Manage Events screen. On that screen, you may load another Event, create an Event, delete an Event, or Export an Event.
File→Import Event
Import an Event from an Event Export file. See the Importing an Event heading in the Manage Events Screen section.
File→Save Event Save any changes made to the current Event. File→Convert Event
to User Default Converts a currently loaded Event to a User Default. This process is not reversible and cannot be undone!
File→Exit Closes the application. If you are editing Event information, FEPS will allow you to save the information before exiting.
Actions→Cancel Changes
Resets information on the screen to the last saved version.
Actions→Cancel Import
This option replaces the Cancel Changes option when hourly data have been exported to Excel. This will cancel the export/import and return editing control to FEPS.
Actions→ Reports/Charts
Calculates all results for the current Event and displays the Reports and Charts screen.
Actions→ Equations
Displays the parameter / equation modification screen. See Appendix D: Parameter and Equation Modifications for information about this functionality.
Actions→Modify Event Data
This option replaces the Reports/Charts option when viewing the Reports and Charts screen. It returns to the data entry tabs.
Help→Contents Displays the FEPS on-line help. Help→About Displays current FEPS version information.
Tool Bar Items The Tool Bar is a collection of icons that represent commonly used features. Like certain menu items, some Tool Bar icons may not always be available; these will be grayed out when not available.
Return to the Manage Events screen. On that screen, you may load another Event, create an Event, delete an Event, or Export an Event.
Save any changes made to the current Event.
Resets information on the screen to the last saved version.
Converts a currently loaded Event to a User Default. This process is not reversible and cannot be undone
Calculates all results for the current Event and displays the Reports and Charts screen.
Returns to the data entry tabs. Displayed in place of the Reports/Charts icon when you are in the Reports and Charts screen.

FEPS Basics 11
Status Bar Items The status bar, located at the bottom of the screen, displays various information about the Event with which you are working.
Event Name The name of the currently loaded Event. Event Type The type of the currently loaded Event.
Fire Type The fire type for the currently loaded Event. Today’s date The computer’s system date. This will be today’s date unless your
computer is set to a different date. Event Validity This section indicates whether the currently loaded Event is valid. For
an Event to be valid the data entered on each tab must be complete and valid. FEPS checks validity each time information is saved. If the Event is invalid, proceed through each tab until you find the tab and data that are invalid.
Tab Validity The section indicates whether the current tab of the currently loaded Event is valid.
FEPS Online Help FEPS includes an online Help function. At nearly any point in the program you may access help by pressing the F1 key. This will bring up the FEPS online help with information specific to of FEPS you are currently in. If specific information is not available, the online help section will display a general overview of the application. You can also bring up the online Help system by choosing Help → Contents from the menu
The online help includes a Table of Contents to help you search for information.

12 FEPS User's Guide
FEPS Details
This section provides detailed instructions for data entry and report generation via each of the program screens in FEPS. It provides a detailed overview of the FEPS screens and available options. Each screen has buttons, tabs and/or scroll boxes to navigate among options. In general, tabs, buttons or data fields that have gray titles are not currently available to the user, but are available under other circumstances.
Manage Events Screen After starting the program, FEPS will display the Manage Events screen. This screen manages the Event libraries, including User Events, User Defaults, and System Defaults.
You can return to this screen from other screens by clicking the File → Manage Events from the menu or pressing CTRL-E.
Event Management Screen – Load, Create, Delete and Export Events
The top selection box includes the types of Events. The lower selection box includes all Events of the specified type available for the current user. For each Event this box will list its name, the Event fire type, the Event type, whether the Event is valid, and the first part of the description of the Event. If you select a different Event library from the upper box, the lower box will change to display the corresponding list of Events or Defaults.
The fourth status bar field indicates today’s date, as reported by the computer’s internal clock. The remainder of the status bar will remain blank until an Event is loaded.

FEPS Details 13
The following six buttons are available at the bottom of the screen:
• Load—use this button to load the currently selected Event,
• Create—use this button to initiate the creation a new Event. Once selected, additional options will become available on the screen.
• Delete—use this button to delete the selected Event.
• Export—use this button to export a single Event to a file. Once downloaded, the Event may be imported by other FEPS users,
• Reports—use this button to switch to the Reports and Charts screen for the selected event. The button will be unavailable (grayed out) if the selected Event is invalid.
• Cancel—this button will cancel the current operation (such as Create) or it will cancel the Manage Events screen and return FEPS to the screen that was displayed prior to the Manage Events screen.
These buttons will become enabled or disabled depending on the system status and the selections made. If you “hover” (hold steady) the mouse cursor over a button, a ToolTip box containing a description of its use will appear on the screen.
Loading an Event
To load an Event:
1. Select an Event type from the upper box (i.e. Basis for your Event),
2. Select an Event from the lower box, and
3. Click the Load button.
If you are using FEPS for the first time, no User Defaults or Events will exist. You will need to create an Event from a System Default.
If you load a System Default, you will only be able to review the data fields in the System Default. When you are reviewing a System Default, all data fields and buttons will be unavailable (grayed out), so you will not be able to make any changes. Additionally, the indicator “Read-Only” will appear in the center of the status bar.
Creating an Event
Creating an Event involves making a copy of an existing Event under a different name. You may use any valid User Event, any User Default, or any System Default as the basis for your Event. Once created, you may alter the Event as desired.
New Events may be created as User Events or User Defaults.
To create a new Event:
1. Select the relevant Event type from the upper box,
2. Select the Event from the lower box that will serve as the ‘parent’ of the new event, Click the Create button,
FEPS will display a box where you can enter the name and type of the new Event.
3. Enter an Event name,

14 FEPS User's Guide
Event Management Screen – Creating a new Event
4. Click on the radio button for the desired Event type (i.e. Select either “Save as Event” or “Save as User Default”), and
5. Click the Save button.
The new Event name must be unique. If an Event with that name already exists, FEPS will prompt you to enter a new different name. If the name is unique, FEPS will create and load the new Event.
Deleting an Event
To delete an existing Event:
1. Select the relevant Event type from the upper box,
2. Select the Event from the lower box, and
3. Click the Delete button.

FEPS Details 15
Exporting an Event
FEPS allows you to export Events. This may be done to move an Event from one copy of FEPS to another, to share an Event with another user, or to create archive backup.
To export a Event:
1. Select the relevant Event type from the upper box,
2. Select the Event from the lower box,
3. Click the Export button,
This will bring up the Export dialog.
Event Management Screen – Export Dialog
4. Enter a new name in the File Name box, and
5. Click on the Save button.
While you may choose any file extension you want, the import Event routine will expect all Event files to be saved with an *.fep file extension.
16 FEPS User's Guide
Importing an Event
Although there is no import button on this screen, the Import Event functionality is discussed here because it is directly associated with the Event export button located on this screen.
To import an Event, it must have first been exported using the FEPS Export functionality. If an FEPS Event file exists, the following steps may be followed to import it.
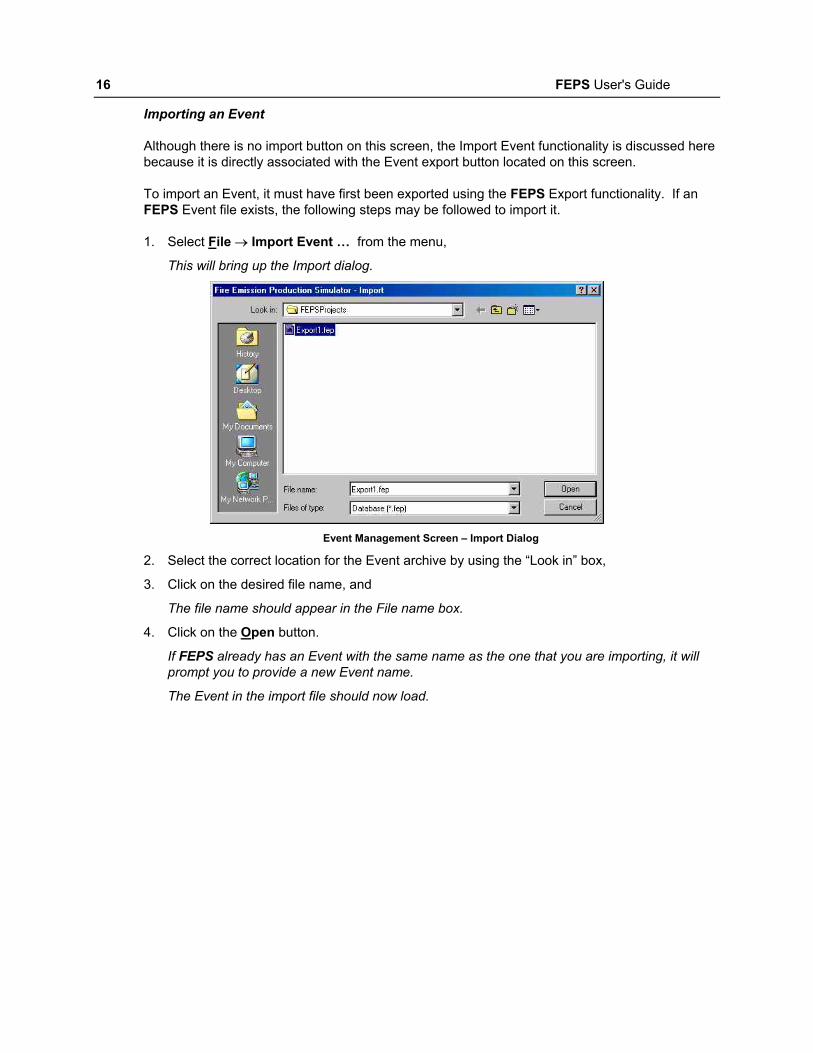
1. Select File → Import Event … from the menu,
This will bring up the Import dialog.
Event Management Screen – Import Dialog
2. Select the correct location for the Event archive by using the “Look in” box,
3. Click on the desired file name, and
The file name should appear in the File name box.
4. Click on the Open button.
If FEPS already has an Event with the same name as the one that you are importing, it will prompt you to provide a new Event name.
The Event in the import file should now load.
FEPS Details 17
Data Entry Screens Overview of Data Entry
After loading or creating an Event, FEPS will start on the Event Information tab. From here, any one of five data entry screens, or tabs, may be reached. The five tabs are labeled Event Information, Fuel Loading, Fuel Moisture, Consumption, and Hourly Input Data. There are several key elements to understanding how data should be entered.
While data can be entered on any tab in any order, it is strongly recommended that you enter data starting with the Event Information tab and proceeding across the tabs from left to right.
Data entered on each tab may change the intermediate results and subsequent data needs on later tabs (i.e. those tabs to the right of where changes have been made.) For example, if you change the dates on the Event Information tab, hourly data for each day now included will be listed on the Hourly Input tab. Similarly, if you make changes in the Moisture Profiles tab, the data in the Consumption tab will change.
Once you begin editing information on a tab, you may not leave that tab until you have saved or canceled your changes.
When you save your changes, FEPS will validate your responses. If you have left something out or entered a value outside of an allowable range, FEPS will provide a validation warning. At this point a user may return to the data entry screen to correct the problem or save the information as invalid. If any part of an Event is saved as invalid, the Event as a whole is also invalid. You may not use an invalid Event as a basis for creating other Events or generate reports or charts.
The following table summarizes each tab. They are explained in more detail starting on page 18.
Event Information
The first tab includes basic information about the Event. It shows the name, date, area, fire shape, and type of burn. It also includes general descriptive information. Changing the beginning or ending dates, and/or fire shape will affect the Hourly Input Data tab. If you change these fields, data on the Hourly Input Data tab may be altered or lost.
Fuel Loading A given Event may analyze a burn across as many as 5 unique Fuel Profiles. Each profile represents a unique region within the burn area, characterized by differing fuel loadings for the different fuel strata. On this tab, each profile is named and assigned an initial fuel loading. The profile names are reflected on subsequent data entry tabs. Initial profile fuel loadings may be entered manually, or by selecting a National Fire Danger Rating (NFDR) model. Even if you select a loading based on an NFDR model, you may customize the loading by overriding individual values. If you click on a given loading cell and press the F7 key, FEPS will present a selection of fuel loadings for different loading levels. Double clicking on a value will copy it to the fuel loading table.
Fuel Moisture There are two tables on this tab. The top defines six moisture profiles. Each profile lists fuel moisture by fuel size class. If a system default was used to create the current Event, the profiles contain generic “default” moisture values. You may change any individual value to customize your Event. The second table applies a moisture profile to each fuel profile. Based on the moisture percentages for a specific fuel moisture profile, FEPS will calculate default fuel consumption percentages (The percent of fuel loading that will be consumed). You may selectively change individual fuel consumption percentages.

18 FEPS User's Guide
Consumption This tab combines the information from the fuel loading tab and the fuel moisture tab to calculate total fuel consumption values for each profile. As with other values in FEPS, you may selectively change individual values.
Hourly Input Data
The Hourly Input Data tab takes the profile consumption values and distributes them over the time period established in the Event Information tab. Data are represented by: hourly changes in burn area, relative percentages of which profiles are involved at each hour, and certain meteorological information. This tab represents the most significant point of data entry. For each hour of the time period specified on the Event Information tab, data must be entered manually. To simplify the task, FEPS will load default data based on the parent Event or Default and information on the other tabs. In addition to the hourly data this tab contains a separate section to enter daily weather extremes. You must identify the maximum and minimum temperature and relative humidity for each day of the Event.
Validating Data Entry Reports and charts can be generated only for Events with valid data, Thus, knowing that data is valid is important and is closely tracked by FEPS. Data validity is maintained for each data entry tab as well as the Event as a whole. The status bar located at the bottom of the FEPS screen indicates whether the Event and or the currently displayed tab are valid.
If the status bar indicates that the current Event is invalid, but the current tab is valid, then you must manually view each of the other four tabs to determine where invalid data have been entered. Under certain circumstances, a change you make in the data on one tab may cause the data on another tab to become invalid. For example, if you delete a Fuel Profile you may invalidate the “% of are burning for each profile” columns in the Hourly Input Data tab.
Event Information Tab Once you have selected an Event from the Manage Events screen, FEPS will display the Event Information tab. The Event Information tab is where you specify the Event name, dates, location, and several miscellaneous fire parameters.
Normally you should set all Event Information before moving to other data entry tabs. The data entered on this tab sets up and controls the data requirements on the other tabs. For example, changing the beginning or ending dates, and/or fire shape will affect the Hourly Input Data tab. This is normal when you are first customizing an Event, but if you change these fields after you have set up data on the Hourly Input Data tab, some data on that tab may be altered or lost.
About Event Information
Event Name 25 char-acters
The name of the Event. Once an Event has been created, this is the only place that the Event name may be changed. This name is displayed on reports, in the status bar, the application title bar, and the Manage Event screen.
Start Date Date The date the fire starts. The length of an Event may not exceed 30 days.
End Date Date The fire end date. The end date should allow for the completion of the fire’s short- and long-term smoldering phases. The length of an Event may not exceed 30 days.

FEPS Details 19
Event Information Tab – Start Editing Here.
Fire Shape List The shape of the fire. The fire shape determines how the fire grows over time. In practical terms, it determines the equations used to interpolate between known fire areas on the Hourly Data Input tab. Options are:
• Freely Spreading Oval. This is the best choice for wildland fires. Areas are interpolated using a geometric formula (equation (20) in Appendix C).
• Linear Progression. This is the best choice for prescribed fires. Areas are interpolated using a linear formula (equation (19) in Appendix C).
Event Type List The underlying type of Event. This field is only used for informational/organizational purposes: Options are:
• Emission Inventory • Real Time Prediction • Burn/Fire Plan • Typical Event • Other
Fire Type List A general description of the type of fire. Options are:
• Wildland Fire Severe • Wildland Fire Low Severity • Broadcast Natural Fuel • Broadcast Slash • Piled Slash • Other
Note: canopy consumption occurs only if the fire type is

20 FEPS User's Guide
“Wildland Fire Severe”. Permit or Fire #
25 char-acters
Optional. The permit or fire number. This field is used for informational purposes only.
Description 50 char-acters
Optional. A description of the Event.
Comment No limit Optional. A memo field where additional information can be entered. There is no limit on the amount of text entered in this field.
Longitude Integer Optional. The longitude of the Event location. Enter degrees, minutes and seconds separately.
Latitude Integer Optional. The latitude of the Event location. Enter degrees, minutes and seconds separately.
Managing Event Information Editing Event Information
1. Click on or tab to the desired field
2. Make the necessary change
Some fields will restrict the types of data you may enter; for example, the Longitude fields will not allow you to enter anything except integer numbers.
Saving or canceling changes to the Event Information tab
After you change a value in any field, the Save and Cancel buttons will become enabled.
To save changes,
• Click the Save button,
• click the save icon on the toolbar, or
• select File → Save Event from the menu.
FEPS will validate the data. If all data meets the validation requirements FEPS will save the changes. If FEPS encounters a validation problem, it will warn you and ask whether you wish to save the Event with invalid data. You may save the Event as invalid and return at a later time to correct your data entry. You will not be able to run reports or use the Event as a basis for creating other Events as long as it is invalid.
To roll back all changes made since the last save:
• Click the Cancel button,
• click the Cancel icon on the toolbar, or
• select Actions → Cancel Changes from the menu.
Fuel Loading Tab A given Event may analyze a burn across as many as 5 unique fuel loading profiles. Each profile represents a unique region within the burn area, characterized by different fuel loadings for different forest layers (or fuel strata) and/or differing fuel moisture levels. The Fuel Loading tab allows you to establish the name and fuel loadings for each profile. The actual number of profiles

FEPS Details 21
used in FEPS calculations is determined in the Hourly Input Data tab. For each hour of the burn, you will be able to distribute the burn across one or more profiles. This tab will initially contain the
Fuel Loading Tab – Select a NFDR, or enter the value manually.
same profile names and loadings as the parent Event or Default. Unused profiles are typically designated with a profile name “Unused.”
In defining the Event, you need to first specify one or more profile names. These names will appear on subsequent data entry tabs. You may change these names at any time by returning to the Fuel Loading tab.
After specifying profile names, you must enter the fuel loading for each forest layer for each profile. You may select standard loadings by specifying a National Fire Danger Rating (NFDR) fuel model. If you select an NFDR fuel model, FEPS will set a loading for each fuel bed layer. Then the reference field will designate the NFDR model you selected, and fuel loadings will be displayed in blue. Appendix E includes a description of the NFDR fuel models. It also presents representative photos of each model.
You may modify individual layers to customize the loading to meet your needs. To remind you of where you have overridden NFDR fuel model loadings, values entered by the user and values from the worksheet are shown in red.
As an alternate way of entering fuel loadings, this tab allows you to select from a worksheet of typical fuel loadings. If you double-click on a given loading cell and, or click on a cell and press the F7 key, a worksheet of generic fuel loadings is presented. These generic loadings are presented as a function of general fuel loading density. (i.e. none, light, medium or heavy). Double clicking on a value will copy to the fuel loading table.
This worksheet contains typical values selected by the designers of FEPS for systems with which we are familiar. If these generic loadings do not represent typical values for the systems where you work, you may wish to change the values in the worksheet in a User Default. Then, when

22 FEPS User's Guide
you create new Events from that User Default and wish to select from typical loading values from the worksheet, the worksheet will contain values that are representative of your system.
About Fuel Loading Information Profile Name 50
char-acters
The profile name. These should be unique and descriptive of the setting. The names will be displayed on other data entry tabs and on your reports. While you may enter a profile name of up to 50 characters, they may not all be displayed.
Fuel Loading Profiles
double The loading for each layer of each fuel profile. Loadings are in tons per acre. Negative numbers may not be entered. Values assigned from NFDR fuel models are displayed in blue. Values entered by the user or selected from the worksheet are displayed in red. If the profile is initially selected from a NFDR fuel model, and you subsequently change individual values, the unchanged NFDR fuel model values will remain in blue. If the fuel loadings for your Event are not represented by an NFDR fuel model or by values on the worksheet, you can enter the fuel loadings specific to your Event.
NFDR 1 char-acter
You may assign a NFDR fuel model’s loadings to a fuel profile by entering the NFDR code in the NFDR field. To select from a list of NFDR fuel models, click on the NFDR ellipsis (…) button for a fuel profile. See Appendix E for information about NFDR fuel models.
NFDR Screen National Fire Danger Rating System fuel model loading values. A list of fuel loading profiles based on National Fire Danger Rating System fuel models. This screen is displayed once you click the NFDR ellipsis (…) button for a given fuel profile.
Reference 50 char-acters
Optional. This reference field allows you to briefly describe the origin of a specific fuel profile’s loading data. If you assign NFDR fuel model loadings to a fuel profile, the appropriate NFDR code will be displayed in the reference. If you override any values, the reference text will be changed to reflect that it is a modified NFDR fuel model. You may enter a custom reference at any time. If you subsequently assign NFDR fuel model loadings to a fuel profile, FEPS will prompt you to overwrite any custom reference.
Clear button This special button clears the profile. It will delete all information related to this profile throughout all data entry tabs. Clearing an Event may cause the Hourly Input Data of the Event to become invalid depending on how much the specific profile contributed to the hourly composition. (See Hourly Input Data tab)
Worksheet double The worksheet contains a set of generic values for each layer. You can select a loading based on a general fuel density.
Managing Fuel Loading Information Editing the Fuel Profiles table
If the fuel loadings for your Event are not represented by a NFDR fuel model or by values on the worksheet, directly modifying the fuel loadings allows you to enter the fuel loadings specific to your Event. 1. Click on or tab to the desired field; and
2. Make the necessary change.
Values entered by the user are displayed in red.

FEPS Details 23
Some fields will restrict the types of data you may enter; for example, the loading fields will not allow you to enter anything except integer numbers.
Assigning NFDR fuel model loadings
Appendix E contains descriptions and photographs of each NFDR fuel model to assist you in choosing appropriate fuel models and loadings for your burn.
There are two ways to assign a NFDR fuel model’s loading to an Event’s fuel profile.
• You may enter the NFDR code directly in a fuel profile’s NFDR field.
Or
1. Click on a NFDR ellipsis (…) button, and
This will display a table of NFDR fuel models and their loadings.
Selecting fuel loadings from a NFDR fuel model
2. Double click on a NFDR fuel model, or select the fuel model and click on the Select button.
FEPS will populate the fuel profile loading fields with NFDR values, displayed in blue.
To return to the loading table without selecting a fuel model:
• Press the ESCAPE key, or
• press ALT-C, or
• click on the Cancel button.
Selecting a value from the loading worksheet.
To choose a loading from the worksheet of representative loading values:
24 FEPS User's Guide
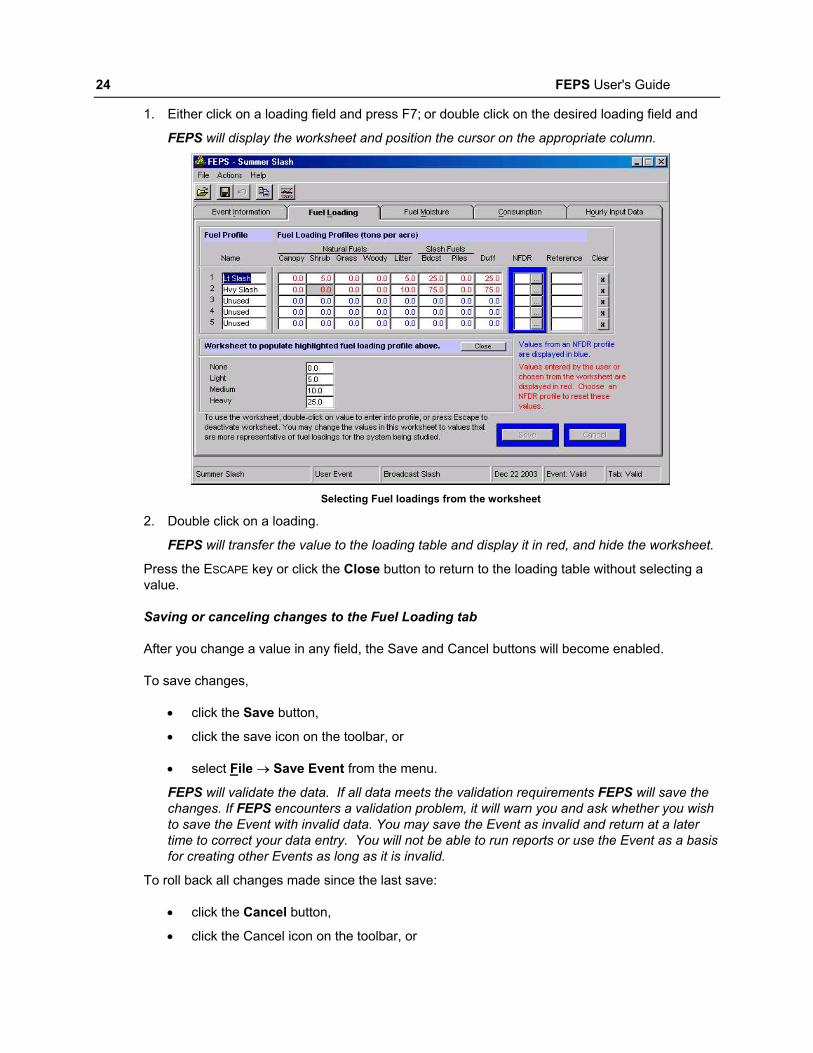
1. Either click on a loading field and press F7; or double click on the desired loading field and
FEPS will display the worksheet and position the cursor on the appropriate column.
Selecting Fuel loadings from the worksheet
2. Double click on a loading.
FEPS will transfer the value to the loading table and display it in red, and hide the worksheet.
Press the ESCAPE key or click the Close button to return to the loading table without selecting a value.
Saving or canceling changes to the Fuel Loading tab
After you change a value in any field, the Save and Cancel buttons will become enabled.
To save changes,
• click the Save button,
• click the save icon on the toolbar, or
• select File → Save Event from the menu.
FEPS will validate the data. If all data meets the validation requirements FEPS will save the changes. If FEPS encounters a validation problem, it will warn you and ask whether you wish to save the Event with invalid data. You may save the Event as invalid and return at a later time to correct your data entry. You will not be able to run reports or use the Event as a basis for creating other Events as long as it is invalid.
To roll back all changes made since the last save:
• click the Cancel button,
• click the Cancel icon on the toolbar, or

FEPS Details 25
• select Actions → Cancel Changes from the menu.
Removing a profile from the Event
While profiles are named and initialized on this tab, the data for a given profile extends through most of the data entry tabs. Thus, clearing a profile affects the other tabs. While this is normal when you are creating a new Event, you may lose data you entered if you are modifying an existing Event. To clear a profile from the Event
1. Click the Clear button on the row of the profile you wish to remove.
FEPS will delete all information related to this fuel profile. The profile name will revert to “Unused”, the fuel loadings will be zeroed out, and, in the Hourly Input Data tab, any entries in the “% of area burning for each fuel profile” column for the profile being cleared will be zeroed out and be allocated to the other columns proportionally.
2. Click the Save button.
Clearing an Event may cause the Hourly Input Data of the Event to become invalid depending on how much the specific profile contributed to the hourly fuel composition. FEPS will provide a warning when you save an Event that has had a profile cleared. (See Hourly Input Data tab)
Fuel Moisture Tab Fuel moisture plays a critical role in the calculation of the percentage of fuel consumed.
The Fuel Moisture tab does two things. The table in the top part of the tab allows you to establish and customize six specific fuel moisture profiles. For each fuel profile, you assign the moisture content (percent moisture) for each fuel size class. The initial fuel moisture values will be those from the parent Event or Default. You may override any individual value by simply changing the value and clicking Save. Fuel moisture profile values inherited from a System Default are displayed in blue. Values differing from those in the System Defaults (i.e., overwritten by a user at some point) are displayed in red.

26 FEPS User's Guide
Fuel Moisture Tab – Create custom Fuel Moisture Profiles and apply them to the Fuel Profiles.
These six moisture profiles are then applied to the fuel profiles in the table at the bottom of the tab. Each fuel profile must have a fuel moisture profile assigned to it. Based on the selected fuel moisture profile assigned, FEPS will instantly calculate the percent of fuel loading consumed for each profile using equations (1)-(3) in Appendix C. As with other tables in FEPS, if you wish to override a calculated consumption percentage, you may simply enter the desired value. Values calculated by FEPS are displayed in blue. Values overwritten by the user are displayed in red.
About Fuel Moisture Information Fuel Moisture Profiles
Integer Each fuel profile defines the percent moisture by fuel size class. FEPS allows you to define fuel moisture profiles for the following moisture categories:
• Very Dry, • Dry, • Moderate, • Moisture, • Wet, and • Very Wet.
Each profile may be customized to meet the specific fuel moisture present during your Event.
Fuel Profile 50 char-acters
The profile name. These are the names specified on the Fuel Loading tab. They are displayed to aid in data entry. They may only be changed on the Fuel Loading tab. Profile names may be truncated when displayed on this tab.
Percent of Fuel Loading –Assigning Fuel Moisture Profile
list Each row in the Percent of Fuel Loading Consumed table represents one of the fuel profiles from the Fuel Loading tab. You must assign a fuel moisture profile to each row, even if you will not be using all five fuel profiles in your Event. FEPS will calculate the percentage of fuel loading consumed based on the assigned

FEPS Details 27
fuel moisture profile. Assigning a fuel moisture profile will recalculate all fuel loading consumption values, replacing any user-specified values in the process.
Percent of Fuel Loading Consumed
Integer Based on the fuel moisture profile selected, FEPS will determine the percentage of initial loading that will be consumed using equations (1)-(3) in Appendix C. You may override any value in this table. Values overridden by the user will be replaced with calculated values anytime the fuel moisture profile is reassigned, even if it is reassigned to the same value.
Managing Fuel Moisture Information Editing the Fuel Moisture Profiles table
If the fuel moistures for your Event are not accurately represented by any of the fuel moisture profiles, directly modifying the values in the fuel moisture profiles allows you to enter the fuel moistures specific to your Event and customize them for each fuel profile. To make changes:
1. Click on or tab to the desired field, and
2. Make the necessary change
Values inherited from a System Default are displayed in blue. Values overwritten by the user are displayed in red.
These fields restrict the types of data you may enter. Specifically, the percent moisture and percent of loading consumed fields will not allow you to enter anything except integer numbers.
If you make changes to the fuel moisture profile values, you must save your changes or re-assign a fuel moisture profile to see how your changes affect fuel consumption in the lower portion of the tab.
Assigning a Fuel Moisture Profile
For each fuel profile, select the desired moisture profile from the list. Unlike other areas in FEPS, this selection is saved immediately and cannot be undone. You also may wish to make changes to the fuel moisture profile values.
Editing the Percent of Fuel Loading Consumed table
After you have assigned a fuel moisture profile for each of your fuel profiles, you can examine the percent of fuel loading consumed table that is calculated by FEPS. You may wish to override any of FEPS’s calculated values if you feel the calculations are inaccurate for your Event. To make changes:
1. Click on or tab to the desired field, and
2. Make the necessary change
Values calculated by FEPS are displayed in blue. Values overwritten by the user are displayed in red.
Saving or canceling changes to the Fuel Moisture tab
After you change a value in any field, the Save and Cancel buttons will become enabled.

28 FEPS User's Guide
To save changes,
• click the Save button,
• click the save icon on the toolbar, or
• select File → Save Event from the menu.
FEPS will validate the data. If all data meets the validation requirements FEPS will save the changes. If FEPS encounters a validation problem, it will warn you and ask whether you wish to save the Event with invalid data. You may save the Event as invalid and return at a later time to correct your data entry. You will not be able to run reports or use the Event as a basis for creating other Events as long as it is invalid.
To roll back all changes made since the last save:
• click the Cancel button,
• click the Cancel icon on the toolbar, or
• select Actions → Cancel Changes from the menu.
Note: The assignment of a fuel moisture profile may not be canceled.
Consumption Tab The Consumption tab uses the information from the previous tabs to calculate total fuel consumption by profile and forest layer. It then determines the portion of total consumption involved in flaming, short-term smoldering and long-term smoldering phases.
The values displayed on this tab are intermediate values in the FEPS calculations. They are calculated using equations (4) through (18) in Appendix C. For the beginning user, this exposure of intermediate values is meant to be informational. You may override any value in a white data entry field, but be cautious enter values that are within the expected range for that variable. Calculated values overridden by a user are displayed in red. Calculated values are displayed in blue.
All values on this tab are calculated from information entered on the Fuel Loading and Fuel Moisture tabs. You may select to override any calculated value displayed in a data

FEPS Details 29
Consumption Tab – Consumption related calculations for each Fuel Profile.
entry box. If you override a specific value, it will be displayed in red. When FEPS recalculates values for this form, it will not recalculate user-specified data unless directed to.
About Consumption Information Due to space constraints, many of the column headings on this tab are very abbreviated. If you “hover” (hold steady) the mouse cursor over the column heading, a ToolTip box containing the full name of the column will appear.
Fuel Profile 50 char The name of the fuel profile. These names are specified on the Fuel
Loading tab. They are displayed to aid in data entry. They may only be changed on the Fuel Loading tab. The full profile name may be truncated due to space constraints.
Fuel Consumption
double The total fuel consumed by fuel profile and forest layer. These are calculated values and may not be overridden or changed.
Total Consumption A/G (above ground)
double These fields represent the total above ground consumption. For each fuel profile, the above ground consumption is the sum of fuel consumption for the Canopy (Can), Shrub, Grass, Woody (Wdy), Litter, Broadcast (Bdcst), and Pile layers. These calculated totals can be overridden.
Total Consumption Duff
double The total fuel consumed by Profile for the duff forest layer. These calculated values can also be overridden.
Involvement (%)
integer Fraction of total consumption involved in the flaming, short-term smoldering, and long-term smoldering phases.
Consumption (tons/acre)
double Quantity of total consumption involved in the flaming, short-term smoldering, and long-term smoldering phases.
Depth (inches) double The depth of the flaming or short-term smoldering zone. Residence double The residence time for the flaming, short-term smoldering, and

30 FEPS User's Guide
Time (hours) long-term smoldering phases. Next Day double Decay rate, applied to the quantity of flaming, short-term
smoldering, or long-term smoldering consumption carried over to the next day.
Managing Consumption Information Editing the Fuel Consumption tables
You can examine the results of FEPS’s consumption calculations. You may wish to override any of FEPS’s calculated values if you feel the calculations are inaccurate for your Event. To make changes:
1. Click on or tab to the desired field, and
2. Make the necessary change.
Values calculated by FEPS are displayed in blue. Values overwritten by the user are displayed in red.
These fields restrict the types of data you may enter; for example, the total consumption fields will not allow you to enter anything except positive numbers.
Saving or canceling changes to the Consumption tab
After you change a value in any field, the Reset, Calculate and Save, and Cancel buttons will become enabled.
To recalculate the tab and save changes,
• click the Calculate and Save button,
• click the save icon on the toolbar, or
• select File → Save Event from the menu.
FEPS will validate the data. If all data meets the validation requirements FEPS will calculate the new consumption values based on your changes and save the changes. If FEPS encounters a validation problem, it will warn you and ask whether you wish to save the Event with invalid data. You may save the Event as invalid and return at a later time to correct your data entry. You will not be able to run reports or use the Event as a basis for creating other Events as long as it is invalid.
Saving changes will recalculate all non-overridden values (those in blue). FEPS will not recalculate user-specified values.
Resetting user-specified values.
This functionality, unique to this tab, allows you to reset fields that you had previously overridden. Normally in this tab, FEPS will only recalculate entries that do not have user-specified values. In order for FEPS to recalculate such a value, you must manually reset the entry field. You may reset individual entry fields, or all of the fields on the tab.
To reset an individual cell (note that this works only on cells previously overridden by the user, displayed in red):
1. Click on or tab to the cell, and

FEPS Details 31
2. Press F5.
The field will display a “--” in blue. The value will be recalculated when you press the Calculate and Save button or otherwise save the tab.
To reset the entire tab,
• click the Reset button, or
• press ALT-R.
Canceling Changes
To roll back all changes made since the last save:
• click the Cancel button,
• click the Cancel icon on the toolbar, or
• select Actions → Cancel Changes from the menu.
Hourly Input Data Tab The Hourly Input Data tab represents the last step in data entry. Based on the start and end dates established on the Event Information tab, FEPS will preset an eleven-column table with a row for each hour of the Event. The eleven columns include area information (total and for each fuel profile) and meteorological data.
This results in a very large number of values (222 for each day of the event) that need to be edited and updated to finish specifying an Event.
To assist in entering data on this tab, FEPS employs several features to simplify data entry. These are discussed below.
Date and Time
Date and Time fields may not be altered. If you need to change the dates of an Event, return to the Event Information tab, change the dates there and save the changes. Within the days of the Event, you control the hours the fire is burning using the Burn Area column. The first hour with a non-zero burn area represents the initial ignition time.

32 FEPS User's Guide
Hourly Input Data Tab – Hourly Data view
Burn Area
You only need to enter area information at the beginning and end of burn periods, or at time steps when there is a significant change in size, activity, or rate of growth. Three examples of when you might have size data you should enter are: (1) the ignition times for a prescription fire; (2) the area data from the morning and evening Fire Situation Analysis reports for a wildland fire (3) if a fire has a blow-up, you would enter the beginning and end acreages of the blow-up.
For intervening time steps, FEPS will interpolate between the areas that you specify directly, based on the fire type specified on the Event Information tab. If the fire type is
listed as “linear progression”, then the values between two user-specified areas will be interpolated linearly (equation (19) in Appendix C). If the fire type is a “free spreading oval”, then the area will be interpolated geometrically, based on the dimensions of an expanding oval (equation (20) in Appendix C). Areas entered by the user are indicated in bold red.
Profile and Weather Data
For these values, you must enter data for every row. As an aid, FEPS provides default values from the parent Event or Default. As you make changes, you may copy data down the column by pressing F6, or you may copy a day’s worth of data to the subsequent days of the Event by pressing F7.
There are two ways to enter Burn Area, Profile and Weather data. You may enter edit the values on the hourly input data screen, or you may edit the data in Microsoft Excel. In the latter case, FEPS can export the existing hourly data into a preformatted spreadsheet. This will allow you both to see more data at once than can be displayed in the FEPS screen, and also to use the familiar editing and navigation features of Excel. If you find editing the data in a spreadsheet easier, you may export the data to a spreadsheet, edit the data, save the spreadsheet and import the data back into FEPS. Both editing methods are described below. The Excel editing method

FEPS Details 33
requires that Microsoft Excel be properly installed. If FEPS cannot determine that Excel is properly installed, it will provide a warning at startup and the features that enable use of Excel editing of hourly data will be disabled.
In addition to the hourly data, you must also enter daily extremes of temperature and relative humidity.
About Hourly Input Data Information
The Hourly Input Data tab has two views, Hourly Data and Daily Extremes.
To choose between the two views,
1. Click on the button next to Hourly Data or press ALT-Y to select the hourly data view, or
2. click on the button next to Daily Temperature and Humidity Extremes or press ALT-D to select the daily extremes view.
If you wish, you can toggle back and forth between the two views without saving changes.
About Hourly Input Data Information—Hourly Data view
Due to space constraints, some of the column headings in the Hourly Data View on this tab are abbreviated. If you “hover” (hold steady) the mouse cursor over the column heading, a ToolTip box containing the full column name will appear. You can also click on the headings to get more information about the kind of data that goes into each column.
Date Date Not editable. The first column lists the date. Time integer
(0-23) Not editable. The hour of the day. Hours are represented from 0 through 23, which reflect midnight through 11 p.m. respectively.
Area (acres) integer Enter the cumulative area at the beginning and end of actual burn Events. FEPS will interpolate between values depending on the fire type specified on the Event Information tab. The area should be entered at times when the area is known specifically and at times when there is a change in the rate of growth of the fire. These manually entered values are shown in red. FEPS will interpolate between manually entered values. The interpolation will be either linear or curvilinear depending whether the Event’s Fire Shape (as entered in the Event Information tab) is “Linear Progression” or “Freely Spreading Oval” respecttively (equations (19) and (20) in Appendix C)
% area burning for each fuel profile
integer
The percentage of each fuel profile involved in the burn at the specified hour. One column for each of the five fuel profiles is presented. The column heading displays the profile names (which may be truncated due to space constraints). The sum across all five fuel profiles must equal 100% for every hour.
TransWind integer The wind speed (mph) at transport height. Wind @ Flame integer The wind speed (mph) at flame height. Pasquill Stability
integer The Pasquill stability class of the atmosphere. There are six Pasquill Stability categories: A through F. The Unstable classes (A, B, and C) occur during the daytime. The Stable classes (E and F) only occur at night. The Neutral class D can occur during the day

34 FEPS User's Guide
or night. Class A is ‘Very Unstable’ and corresponds to hot, calm days, which leads to the greatest amount of dispersion. A plume of smoke is broken up and spread widely with ‘A’ Stability. Class D is ‘Neutral’. It corresponds to windy days or the transition times of dawn and dusk. This is the most frequently occurring stability class. Class F is ‘Very Stable’ and corresponds to nights with low winds. A plume experiencing ‘F’ Stability will feature very little dispersion.
About Hourly Input Data Information— Daily Extremes View
Hourly Input Data Tab – Daily Weather Extreme view
Date Date Not editable. The first column lists the date Extremes “Min
Temp/ Max RH”
or
“Max Temp/ Min RH”
Not editable. Minimum and maximum daily values are entered on separate rows. It is assumed that minimum relative humidity occurs at the same time as maximum temperature and that maximum relative humidity occurs at the time of minimum temperature, and that the “maximum temp” hour falls later in the day then the “minimum temp” hour Enter the minimum temperature and maximum relative humidity on the “Min Temp/Max RH” rows and maximum temperature and minimum relative humidity on the “Max Temp/Min RH” rows.
Hour integer (0-23)
The hour at which the minimum or maximum temperature occurs for a given day.
Temp F integer
Minimum and maximum daily temperatures. Enter the minimum temperatures on the min rows, and the maximum temperatures on the max rows.
RH% integer Maximum and minimum daily relative humidities (RH). The minimum RH must be listed in the row for the maximum temperature, and the maximum RH must be listed in the row for the minimum temperature.

FEPS Details 35
Managing Hourly Input Data Information in FEPS – Hourly view Setting a Beginning or Ending Area.
1. Click on the area column at the desired date and time, and
2. Enter the new area.
Clearing a Beginning or Ending Area.
1. Click on the area column at the desired date and time; and
2. Press F5.
After setting or clearing an area, FEPS will recalculate the areas for the intervening time steps using interpolation.
These changes are not saved automatically. You must save your changes for them to be permanent.
Editing Fuel Profile Area Proportions and Meteorological Information
The five columns under the heading “% of area burning for each fuel profile” represent the percentage of the fire area corresponding to the five fuel profiles defined on the Fuel Loading tab. It is in these columns that you control which fuel profiles are involved in the fire and when they are involved. The sum of the five columns must equal 100% for each hour of the fire. If you change the proportion of one fuel profile for a given hour, the other fuel profiles need to be adjusted so that the sum is again 100%.
The meteorological data should be obtained from a weather station near the fire.
To change the any of the values in these columns:
1. Click or move to the desired field, and
2. Make the necessary change.
Some fields will restrict the types of data you may enter, for example, the % of area burning fields will not allow you to enter anything but integer numbers.
Copying Profile/Meteorological Information
Because of the large amount of data that might potentially need to be entered, there are several different ways of copying profile/meteorological data.
Data in a cell may be copied to all the rest of the cells below in that column. To copy down cells:
1. Click or move to the desired field, and
2. Press F6.
You may now move down lower, enter another value and copy it down. It this fashion, you can quickly edit an entire column of data.
36 FEPS User's Guide
Because meteorological data or burning behavior can cycle on a daily basis, complete profile (percent area) and meteorology data for a given 24 hour period may be copied to other days in the Event. To copy daily for percent area or meteorology data:
1. Click or move to any percent area or meteorology cell on the desired day, and
2. Press F7.
The data from the selected day are copied into every other day in the Event. If you are on a percent area column, the five percent area columns are copied, and if you are on a meteorology column, the three meteorology columns are copied. Data are copied on an hour-by-hour basis. Data from each hour of the selected day are copied to the corresponding hours of every day of the Event. This will not affect the total area column.
You may also copy data in a given column through typical cut and paste procedures.
1. Click or move to the desired field,
2. Press Ctrl-C to copy the value to the copy buffer,
3. Select a destination cell or range of cells within the same column,
4. Press CTRL-V to paste the value into the cells, and
FEPS will not make the change until you:
5. Press ENTER, Click on a different cell or move to a different cell.
Managing Hourly Input Data Information in Excel – Hourly view Managing hourly input data by exporting it to Excel is a useful alternative to editing the data through the FEPS user interface. Because the user focus is moved outside FEPS, it is important to note that until an Excel edit is completed and imported, or the import is canceled, all editing features within FEPS are disabled. This functionality is critical to maintaining data integrity. The Excel editing method requires that Microsoft Excel be properly installed. If FEPS cannot determine that Excel is properly installed, it will provide a warning at startup and the features that enable use of Excel editing of hourly data will be disabled.
Exporting data to Excel.
Before you can export data to Excel, you must save or cancel all current changes.
• Click the Export to Excel for editing button
FEPS will export the data and open a spreadsheet for you to use.
If the spreadsheet is already open FEPS will provide a warning and stop the export. Switch to Excel and close the spreadsheet, then back to FEPS and repeat.
When data are exported, any previous data saved in the spreadsheet is deleted and replaced with the data that currently resides in the hourly data table in FEPS.
Clearing a Beginning or Ending Area.
To specify the beginning or ending of user-defined area values, place an asterisk in the “User Specified Area” column. When FEPS imports the data it will use the areas in these rows as the basis for interpolating fire growth.

FEPS Details 37
Editing Fuel Profile Area Proportions and Meteorological Information
The five columns under the heading “% of area burning for each fuel profile” represent the percentage of the fire area corresponding to the five fuel profiles defined on the Fuel Loading tab. It is in these columns that you control which fuel profiles are involved in the fire. The sum of the five columns must equal 100% for each hour of the fire. If you change the proportion of one fuel profile for a given hour, the other fuel profiles need to be adjusted so that the sum is again 100%.
The meteorological data should be obtained from a weather station near the fire.
Importing data from Excel
Once you export the hourly data to Excel, FEPS will disable all editing features until the data are imported, or the import is canceled
Before you import the any changes you must save the spreadsheet. It is advisable but not required that you close the spreadsheet before initiating an import. To import data:
1. Return to FEPS
2. Click the Import edits From Excel button
FEPS requires that the Excel file comply with specific data types and ranges. When you import the data, FEPS will run a check of your file and list any errors. You will need to correct these errors before the data can be imported. Even after the data are imported, FEPS will perform an additional data validation before the changes are saved and results are updated.
3. Save or Cancel the changes
If you click the Save button, FEPS will validate the data. If all data meets the validation requirements FEPS will save the changes. If FEPS encounters a validation problem, it will warn you and ask whether you wish to save the Event with invalid data. You may save the Event as invalid and return at a later time to correct your data entry. You will not be able to run reports or use the Event as a basis for creating other Events as long as it is invalid.
Canceling an Excel data Import
Once you export the hourly data to Excel, FEPS will disable all editing features until the data are imported, or the import is canceled. To cancel an import and return editing control to FEPS:
• Click the Cancel Import button, or
• Select Actions → Cancel Changes from the menu.
Managing Hourly Input Data Information – Daily Extremes view There are only three columns that may be edited on this table. When updating fields make sure that the maximum values exceed the minimum values and that the hour of maximum temperature and minimum relative humidity falls later in the day then the hour of minimum temperature and maximum relative humidity. This allows the values for the rest of the day to be calculated using equations (22) through (25) in Appendix C.
The data should be obtained from a weather station near the fire.

38 FEPS User's Guide
Editing Information
To change the any of the values in these columns:
1. Click or move to the desired field, and
2. Make the necessary change.
These fields restrict the types of data you may enter; specifically, they will not allow you to enter anything except integer numbers.
Saving or canceling changes to the Hourly Data Input tab
After you change a value in any field, the Save and Cancel buttons will become enabled. You can also toggle between the Hourly Data and the Daily Extremes views and edit the information in each before you save changes. Pressing Save or Cancel affects the changes you made in both views in the Hourly Input Data tab.
To save changes,
• click the Save button,
• click the save icon on the toolbar,
• select File → Save Event from the menu, or
• press CTRL-S.
FEPS will validate the data. If all data meets the validation requirements FEPS will save the changes. If FEPS encounters a validation problem, it will warn you and ask whether you wish to save the Event with invalid data. You may save the Event as invalid and return at a later time to correct your data entry. You will not be able to run reports or use the Event as a basis for creating other Events as long as it is invalid.
Canceling Changes
To roll back all changes made since the last save:
• click the Cancel button,
• click the Cancel icon on the toolbar, or
• select Actions → Cancel Changes from the menu.

FEPS Details 39
Reports and Charts Screen Overview of Reports
FEPS provides a series of tabular reports and charts that document the results of a particular study. Reports may be viewed and/or exported in either “English” (Imperial) or Metric (SI) Units. These reports include:
• Event Data Report – presents a summary of the data entered to define an Event. This report mirrors the values entered in each of the data entry tabs. Values for unused profiles are intentionally left blank.
• Consumption / Emission Results— lists consumption for each phase of the fire (flaming, short-term smoldering, and long-term smoldering) and emissions of CO, CH4, and PM2.5 for each hour of the Event. It also includes basic Event information and total consumption and emissions of the specific Event. Consumption results are calculated using equations (26) through (31) in Appendix C. Specific columns include:
Column Units Description Equation Elapsed time hr
Total elapsed time from the beginning of the first day of the Event.
Date The date of each day in the Event. Hour hr The hour within each day of the Event. Temperature F Ambient temperature. 22-23 RH % Relative humidity 24-25 Fire Size Acres The cumulative size of the fire. 19-20
Sample Report – Consumption / Emissions Report

40 FEPS User's Guide
Fire Rate Acres /hr The rate of growth of area consumed. 21 Flaming Consumption
Tons/hr The flaming consumption rate of fuels at a given hour.
27
STS Consumption
Tons/hr The short-term smoldering consumption rate at a given hour.
28
LTS Consumption
Tons/hr The long-term smoldering consumption rate at a given hour.
29
Total Consumption
Tons/hr The total consumption rate at a given hour.
30
CO Emissions Lb/ min The CO emission rate at a given hour 33 CH4 Emissions Lb/ min The CH4 emission rate at a given hour 33 PM2.5 Emissions Lb/ min The PM2.5 emission rate at a given hour 33
• Buoyancy Results— lists buoyancy results for each hour of the Event. It also includes basic Event information. Buoyancy results are calculated using equations (32) through (46) in Appendix C. Specific columns include:
Column Units Description Equation Elapsed time hr
Total elapses time from the beginning of the first day of the Event.
Date The date of each day in the Event. Hour hr The hour within each day of the Event. Temperature F Ambient temperature. 22-23 RH % Relative humidity 24-25 Transport Wind mph Transport wind velocity. 34 Pasq Stab. class
Pasquill Stability Class
Diff Temp K/m Differential temperature gradient Briggs Stab Briggs stability coefficient. 35 Buoy Eff fraction Buoyancy efficiency 36 Entr Eff fraction Entrainment efficiency 37 Comb Eff fraction Combustion efficiency 32 Plume Heat Release
Btu/hr Heat release of the plume at a given hour 38
Briggs Bouy m4/s3 Briggs buoyancy factor 39 Plume rise Del H
m Plume Rise based on Briggs Maximum value.
43-44
Plume rise FEPS Max
m An empirical maximum plume rise. 46
Plume rise FEPS Min
m An empirical minimum plume rise. 45
PM2.5 Emissions lofted
Lb/min PM2.5 lofted emission rate at a given hour. 40
PM2.5 Emissions Drift Smoke
Lb/min PM2.5 drift/smoke emission rate at a given hour.
41

FEPS Details 41
• Emission Results— lists the emissions of CO, CH4, and PM2.5 for each hour of the Event. It also lists the drift percent of PM2.5. It also includes basic Event information and total consumption and emissions of the specific Event. Data on this report are calculated using equations (33) and (41) in Appendix C. Specific columns include:
Column Units Description Elapsed time Hr Elapsed time from the beginning of the first day of the Event. Date The date of each day in the Event. Hour hr The hour within each day of the Event. CO Emissions Lb/min The CO emission rate at a given hour CH4 Emissions Lb/min The CH4 emission rate at a given hour PM2.5 Emissions Lb/min The PM2.5 emission rate at a given hour PM2.5 Percent Drift
% The percent of total PM2.5 emission rate that are drift emissions.
Each time you run a tabular report, FEPS presents a summary table on the screen. You may preview and then print a final copy of the report, or export the report to a text or spreadsheet file.
Overview of Charts The charts include:
• Consumption by Combustion Stage— displays consumption by combustion stage over the life of the Event (calculated using equations (27)-(30) in Appendix C),
• Plume Rise— displays the results of several plume rise calculations (calculated using equations (43)-(46) in Appendix C),
Sample Chart – Plume Rise

42 FEPS User's Guide
• PM2.5 Emissions by Combustion Stage— displays PM2.5 emissions over time (equation (33) in Appendix C), and
• CO Emissions— displays CO emissions over time (equation (33) in Appendix C).
Charts are displayed in the FEPS window where they may be reviewed and printed.
Getting to the Reports and Charts screen FEPS will provide reports and charts only for events that are valid. After you have filled out as much information as you can about your Event in the five data entry tabs, you will want to see some reports and charts. The Reports and Charts screen may be accessed from the data entry tabs or from the Manage Events Screen.
Accessing the Report and Charts Screen.
To access the Reports and Charts screen from the Manage Events Screen:
1. Select a valid Event, and
2. Click the Reports button, select the Actions → Reports/Charts menu option, or click on the Reports/Charts icon on the Tool Bar.
To access the Reports and Charts screen while viewing or editing an Event:
1. If applicable, save or cancel any changes, and
2. Select the Actions → Reports/Charts menu option or click on the Reports/Charts icon on the Tool Bar.
Displaying Reports and Charts Results are displayed for the currently selected Event. To view a report or chart, simply select the desired report/chart from the pull down list labeled Select the report.
Report Selection Screen – Pick the desired report or chart from the list.

FEPS Details 43
Exporting Reports and Charts You can export reports (except for the Event Data report) to either a comma-delimited or Microsoft Excel file. Using the Print Preview button, you can also export any report to HTML or text format. You can export charts to bitmap, JPEG, or GIF formats. To export a report or chart;
1. Select the desired report/chart from the pull down list labeled Select the report,
2. Select the Save as type,
3. Enter the file path and name, and
4. Click the Save button.
The functionality to export reports to comma-delimited or Excel files is not available requires that Microsoft Excel be properly installed. If FEPS cannot determine that Excel is properly installed, it will provide a warning at startup and the features that enable use of report export will be disabled.. However, even without Excel installed, you can still export to a text or HTML file using the export function in the Print Preview screen.
Printing Reports and Charts To print a chart:
1. Select the desired chart using the pull-down list,
2. Select the desired units (English or Metric), and
3. Click the Print Chart button or press ALT-C.
To print a report:
1. Select the desired report using the pull-down list,
The results will be displayed in a summary table in the FEPS window.
2. Select the desired units (English or Metric),
3. Click the Print Preview button or press ALT-V, and
This will display the report preview in a separate window.
4. Click on the print button on the preview window’s toolbar in the upper left hand corner (see “Printing a Report”, below).
Manipulating Reports in the Print Preview Window Once displayed, an FEPS report print preview window has its own tool bar, as illustrated on the next page. The icons on this toolbar can be used to: • Print the report • Export the report to an HTML or text file, or • Zoom the report to see more or less of it on your screen.
Printing a Report
To print the report:
1. Click on the print icon,
2. Select the desired printer, and
3. Click on the Print button.

44 FEPS User's Guide
Printout Preview – Consumption / Emissions Report
Exporting a Report
All reports including the Event Data Report can be exported from the preview window. Reports can be exported to a text or HTML format.
To export the report to a file:
1. Click on the Export Report button, 2. Select the file type under “Save as Type”, 3. Select the destination for the file in the “Save in” pull down box, 4. Enter a file name, and 5. Click on the Save button.
Changing the size of the Report
To change the size of the report on your screen;
• Select a different scale from the Zoom pull down box.
Seeing more pages of the report
The Print Preview window displays only one page of the report at a time. Using the scroll bar only scrolls the page being displayed. To display another page, use the “Pages” controls at the bottom left of the window.
Closing the Preview Window
To return to FEPS when you are finished viewing, printing or exporting from the Preview window:
• Click the X button in the upper right hand corner of the preview window.

FEPS Details 45
Changing Report Units For all charts and reports except the Event Data Report, the results may be displayed or exported in either Metric (SI, or Système International d'Unités)or “English” (Imperial) units. You may change the units by clicking on the appropriate radio button located at the bottom of the Report selection screen. After changing the units you will need to redisplay or export the chart/report.
Returning to Data Entry Once you have finished with reports, you may return to the data entry tabs to modify your Event or to the Manage Events screen to start a new study.
To access the Data Entry tabs while viewing Reports and Charts:
• Select the Actions → Modify Event Data menu option, or
• click on the Modify Event Data icon on the Tool Bar, or.
• click the Modify Event Data button.

Appendix A 46
Appendix A: Conversion Factors
1 lb 453.59 g 1 lb 0.453,59 kg 1 ton 907.18 kg 1 lb/min 7.559,8 g/sec 1 lb/min 0.007,559,8 kg/sec 1 lb/min 27.215 kg/hr 1 ton/hr 251.99 g/sec 1 ton/hr 907.18 kg/hr 1 btu/hr 0.292,9 watts 1 acre 43,560 ft2 1 acre 4,046.9 m2 1 acre 0.004,046,9 km2 1 acre 0.4046873 hectare 1 ton/acre 224,166.65 kg/km2 1 ton/acre 0.224,2 kg/m2 1 inch 2.54 cm 1 inch 0.025,4 m 1 mile/hr 0.447 m/s 1 mile/hr 1.609 km/hr 1 btu/hr 0.292,9 joules/sec 1 btu/hr 1.0544 kJ/hr 1 btu/hr 0.000,292,9 kilowatts

Appendix B 47
Appendix B: Installation and System Configuration
Installing, Uninstalling and Reinstalling FEPS FEPS requires about 12.5 MB of hard disk space. Installing and reinstalling FEPS is done from the FEPS installation file FEPS.msi. If you are reinstalling FEPS for any reason, you must completely uninstall it first.
Note: When uninstalling FEPS, the database of Events is not automatically deleted. If you need to reinstall FEPS and wish to retain your library of Events and User Defaults, make a backup copy of the FEPS.mdb file from the FEPS application directory to another location on your hard drive before you begin the reinstall process. After reinstalling the application, you can recover your User Events by manually replacing the reinstalled FEPS.mdb file with your saved backup.
To Install FEPS:
1. Obtain the latest version of FEPS from http://www.fs.fed.us/pnw/fera/feps/.
2. Save the installation file “FEPS.msi” to a temporary location,
3. Double click on the FEPS.msi icon,
4. After the install program starts, click on the Next button,
5. Select the location on your computer where you would like the FEPS files to reside, and click the Next button,
6. On the “Confirm Installation” screen, click the Next button, and
7. After the installation is complete, click the Close button.
To Uninstall FEPS in Windows® 95, 98 or NT:
1. Click the Windows Start button,
2. Select the Settings menu item,
3. Click the Control Panel menu item,
4. Double click the Add/Remove Programs icon,
5. Click on Fuel Emission Production Simulator,
6. Click the Add/Remove button,
7. Click the Remove Fuel Emission Production Simulator radio button,
8. Click the Finish button, and
9. After the uninstallation is complete, click the Close button.
To Uninstall FEPS in Windows® XP:
1. Click the Windows Start button,
Windows XP includes a revised version of the Control Panel. To maintain similarity between versions, it is recommended that you access the control panel through the “classic view.”
2. Click the Switch to Classic View hypertext link on the left of the screen to view the control panel dialog in classic view.
3. Double click the Add/Remove Programs icon,

48 FEPS User's Guide
4. Click on Fuel Emission Production Simulator,
5. Click the Add/Remove button,
6. Click the Remove Fuel Emission Production Simulator radio button,
7. Click the Finish button, and
8. After the uninstallation is complete, click the Close button.
To Reinstall FEPS:
1. If you have been having problems with the program and wish to do a complete reinstallation, but have Events or User Defaults that you wish to save, export those Events and User Defaults to *.fep files.
2. Uninstall FEPS following the directions for your operating system, above,
3. If you wish to not save your library of Events or have been having problems with the program and wish to do a complete reinstallation, delete the FEPS.MDB file from the FEPS application directory (you may wish to delete the entire FEPS application directory),
4. Install FEPS following the installation directions above, and
5. Import your saved Events and User Defaults from your *.fep files, if applicable.
Checking Your System Display Configuration Before you start FEPS, check your system display configuration to make sure FEPS will run properly. The display properties must be set to use Windows® small (or normal) fonts. FEPS will run if your display is set to large fonts, but some text may be cut off.
To check your display configuration in Windows® 98/NT/2000:
1. Click the Windows Start button.
2. Select the Settings menu item.
3. Click the Control Panel menu item.
4. Double click on the Display icon.
5. Select the Settings tab.
6. Click the Advanced button.
7. Select the General tab.
This screen will show the computer's current font size setting. If it is not set to “Small Fonts” then change the setting. (NOTE: If you change the setting you may need to restart the computer before the change takes effect. The computer will tell you if this is necessary. Note that this will change the fonts displayed by all of your applications, not just FEPS.)
8. Select “Small Fonts” in the Font Size box.
9. Click the OK button on this screen.
10. Click the OK button on the Display Properties screen.
11. Close the Control Panel.
To check your display configuration in Windows® XP:
1. Click the Windows Start button.

Appendix B: Installation and System Configuration 49
2. Click the Control Panel menu item.
Windows XP includes a revised version of the Control Panel. To maintain similarity between versions, it is recommended that you access the control panel through the “classic view.”
3. Click the Switch to Classic View hypertext link on the left of the screen to view the control panel in classic view.
4. Double click on the Display icon.
5. Select the Settings tab.
6. Click the Advanced button.
7. Select the General tab.
This screen will show the computer's current font size setting. If it is not set to “Normal” then change the setting. (NOTE: If you change the setting XP will allow you to accept the changes without restarting the computer. It is recommended that you restart the computer. Note that this will change the fonts displayed by all of your applications, not just FEPS.)
8. Select “Normal Size (96 dpi)” in the DPI Setting box.
9. Click the “Restart the computer before applying the new display settings” radio button.
10. Click the OK button on this screen.
11. Click the OK button on the Display Properties screen.
12. Close the Control Panel.

Appendix C 50
Appendix C: Model Equations This appendix provides equations used by the FEPS model. It presents equations used to calculate both intermediate and final results.
Introduction The Emissions Production Model (EPM) was designed over a decade ago to help managers estimate and mitigate the rates of heat, particles, and carbon gas emissions from controlled burns of harvest-slash residue in Northwest forests.
In updating EPM, a significant number of improvements were made, to the usability, applicability, and accuracy of the model. The calculation approach was totally redesigned, and the model has been renamed FEPS.
FEPS incorporates a flexible user interface that allows the user to customize a burning Event. Furthermore, many intermediate results are exposed to the user. The user may accept these results, or insert values of their own.
The user enters data using five tabbed data entry screens, starting with (1) basic Event information and (2) fuel loadings. When (3) fuel moisture information is defined, FEPS calculates (4) total consumption. The results of the total consumption calculation may be accepted by the user or replaced with specific values. Next, the user enters (5) hourly fire size and meteorological information. Finally all data and intermediate results are combined to calculate hourly consumption, emissions and heat release information, which are presented in charts and tabular reports.
This technical section presents equations in the order they are applied. Calculations that are used in the data entry tabs are described first, followed by intermediate calculations, and lastly the overall consumption, emission and heat release calculations.
The documentation for each equation includes a table that describes each variable of the equation, its units, and a code that describes where the variable can be viewed or modified in FEPS, and whether it is a result of a previously calculated equation. The location code for the result of the equation is also given, and represents where the result can be viewed. The codes are defined in the following table.
Location Codes
Code Description FL - Fuel Loading Tab
- Fuel Moisture Tab FM a Values are entered on the Fuel Moisture tab as part of the fuel moisture profiles.
C - Consumption Tab - Hourly Input Data Tab a Values are entered on the Hourly Data portion of the Hourly Input Data Tab b Values are entered on the Daily Temperature and Humidity Extremes portion of the
Hourly Input Data Tab
HI
c Value is set indirectly by choosing a Pasquill Stability Class - Values are set by FEPS and may only be changed by manually resetting the values
in the FEPS.mdb database a table tblConstants
Admin
b table tblEmpiricalEF

Appendix C: Model Equations 51
- Cannot be entered or edited a Values may not be entered, but the category and resulting values are selected by
assigning a fuel moisture profile to each fuel profile.
CBE
b Values are populated by the system. Eq. # - The parameter is a result of the specified equation. ND - This intermediate result is not displayed by FEPS Report - This result is displayed on a FEPS report.
FEPS Algorithms FEPS allows the user to define up to five fuel profiles for each Event. By allowing multiple fuel profiles, FEPS can simulate burn Events over varying vegetation types. Each profile is defined independently. Intermediate calculations are carried out separately for each profile. On the Hourly Data Input tab, the user specifies the percentage of each fuel profile involved during each hour. For the final Event results, individual fuel profile results are combined by weighted average.
Calculations Made for Fuel Moisture tab Equations (1) through (3) are used to calculate the data displayed on the bottom table of the Fuel Moisture tab, based on data on the Fuel Loading tab and in the top table of the Fuel Moisture tab.
Percent of Loading Consumed FEPS allows the user to specify up to six moisture profiles. The moisture profiles range from very dry to very wet. Each moisture profile defines fuel moisture percentages by fuel size class. Each fuel profile in an Event is assigned one moisture profile. FEPS then calculates the percent of loading consumed in each fuel layer.
Percent Canopy, Shrub, Grass, or Duff Loading Consumed The fraction of canopy, shrub, grass or duff loading consumed is calculated using equation (1). It is used in equations (4) and (16).
( )mcfL eLC 11*100 −−= (1) Where:
Variable Definition Units Location LCL The percent of loading consumed, for
layer L. % FM
mcf Moisture category factor. -- CBEa Moisture category factors are: Moisture Canopy Shrub Grass Duff Very Dry 0.33 0.25 0.125 0.33 Dry 0.5 0.33 0.25 0.5 Moderate 1 0.5 1 1 Moist 2 1 2 2 Wet 4 2 4 4 Very Wet 5 4 5 5
Two special notes apply to canopy consumption: (1) Canopy is consumed only if the Fire type set in the Event Information tab is Wildland Fire – Severe; and (2) if the fraction Woody fuel loading consumed is equal to zero then the fraction Canopy loading consumed is assumed to equal zero.

52 FEPS User's Guide
Percent Woody or Broadcast Loading Consumed The fraction of woody fuel or broadcast loading consumed is calculated using equation (2). It is used in equation (4).
( )[ ]{ })100max,0(min
***100 10001000
==
−+= hrhrBsensBCRL MLCLCLCLCLC (2)
Where:
Variable Definition Units Location LCL The percent of loading consumed, for
layer L. % FM
M1000hr 1000 hour fuel moisture content. % FMa LCR Adjustment factor for natural woody
fuels. 0.6 for Woody Fuels, 1.0 for Broadcast fuels.
fraction Admina
LCBC Benchmark consumption, 0.31. fraction Admina LCsens Consumption sensitivity to moisture,
0.03. -- Admina
LCB1000hr Benchmark 1000 hr moisture, 31. % Admina
Percent Litter or Pile Loading Consumed The percent loading consumed is assumed to be a constant relationship as follows:
LCL FLC *100= (3) Where:
Variable Definition Units Location LCL The percent of loading consumed, for
layer L. % FM
FLC Fraction Loading Consumed. fraction Admina
Fraction loading consumed is: Moisture Litter Piles Very Dry 100 99 Dry 100 95 Moderate 100 90 Moist 100 85 Wet 100 80 Very Wet 100 70
Calculations Made for Consumption tab Equations (4) through (18) are used to calculate the data displayed on the Consumption tab, based on information on the Fuel Loading and Fuel Moisture tabs.
Fuel Consumption Calculations Tons consumed per layer are displayed on the Consumption tab. To allow for flexibility, the user may change the total above ground and duff layer values to match any custom value.

Appendix C: Model Equations 53
Consumption by layer is calculated using equation (4):
100/* LLL FLCC = (4)
Where: Variable Definition Units Location CL Consumption of layer L. tons/acre C LCL The percent of loading consumed, for
layer L. % FM
(Eq.1,2 & 3) FL Fuel loading of layer L. tons/acre FL
Total above-ground consumption (CAG )is the sum of Canopy, Shrub, Grass, Woody, Litter, Broadcast and Pile layer consumption. Below-ground consumption (CBG) is equal to the duff consumption. These are used in equations (5) and (6).
Flaming Phase Calculations Flaming Phase calculations include:
• Flaming phase involvement, • Flaming phase consumption, • Depth of flaming phase consumption, • Flaming residence time (TFLAM), and • The decay rate of the flaming phase.
Flaming involvement is calculated using equation (5). It is used in equations (10) and (26).
( )TIAG CCAGIf ekInv /*1*100 −−= (5)
Where:
Variable Definition Units Location Invf Flaming phase involvement. % C CAG Total above ground consumption. tons/acre C (Eq. 4) KAGI Flame involvement sensitivity
coefficient, 1. -- Admina
CTI Consumption threshold for total flame involvement, 10.
tons/acre Admina
Flaming phase consumption is calculated using equation (6). It is used in equations (7), (11), (16) and (27).
BGcbgAGcagf CkCkC ** += (6)
Where: Variable Definition Units Location Cf Flaming phase consumption. tons/acre C CAG Total above ground consumption. tons/acre C (Eq. 4) CBG Total below ground consumption. tons/acre C (Eq. 4) kcag Above ground flaming phase
consumption coefficient, 0.5. -- Admina
kcbg Below ground flaming phase consumption coefficient, 0.2.
-- Admina

54 FEPS User's Guide
The depth of flaming phase consumption is calculated using equation (7), and is used in equation (8).
fff BCD = (7)
Where:
Variable Definition Units Location Df Flaming phase depth. inches C Cf Flaming phase consumption. tons/acre C (Eq. 6) Bf Duff bulk density, 20. tons/acre-inch Admina
The flaming phase residence time constant is calculated using equation (8), and is used in equation (9).
( ) 60** 21
TFLAMNfTFLAMTFLAM DkkTFLAM = (8)
Where:
Variable Definition Units Location TFLAM Flaming phase residence time constant. hours C Df Flaming phase depth. inches C (Eq. 7) kTFLAM1 TFLAM coefficient, 4/3. -- Admina kTFLAM2 TFLAM coefficient, 8. -- Admina NTFLAM Diffusivity dependency, 0.5. -- Admina
The decay, or holdover, is calculated using equation (9), and is used in equation (27).
( )TFLAMf eDecay 11= (9)
Where:
Variable Definition Units Location Decayf Flaming phase decay rate (holdover). 1/hours C (Eq. 7) TFLAM Flaming phase residence time constant. hours C
Short-Term Smoldering Phase (< 2hrs) Calculations Short-term smoldering (STS) phase calculations are very similar to the flaming phase calculations. They include:
• STS phase involvement, • STS phase consumption, • Depth of STS phase consumption, • STS residence time, and • The decay rate of the STS phase.
STS phase involvement is assumed to equal the flaming phase involvement, as shown in equation (10). It is used in equation (28).
fSTS InvInv = (10)

Appendix C: Model Equations 55
Where:
Variable Definition Units Location InvSTS STS phase involvement. % C Invf Flaming phase involvement. % C
STS phase consumption is calculated using equation (11). It is used in equations (16) and (28).
−=
ftotal
fSTS CC
CC min (11)
Where:
Variable Definition Units Location CSTS STS phase consumption. tons/acre C Cf Flaming phase consumption. tons/acre C (Eq. 6) Ctotal Total consumption. tons/acre C
Depth of STS phase consumption is calculated using equation (12), and is used in equation (13).
STSSTSSTS BCD = (12) Where:
Variable Definition Units Location DSTS STS phase depth. inches C CSTS STS phase consumption. tons/acre C
(Eq.11) BSTS STS depth sensitivity to consumption, 12. ton/acre-inch Admina
The STS phase residence time constant is calculated using equation (13), and is used in equation (14).
( ) 60** 21
EDRNSTSEDREDR DkkEDR = (13)
Where:
Variable Definition Units Location EDR STS phase residence time constant. hours C DSTS STS phase depth. inches C (Eq. 12) kEDR1 EDR coefficient, 8/3. -- Admina kEDR2 EDR coefficient, 8. -- Admina NEDR Diffusivity dependency, 0.5. -- Admina
The decay, or holdover, is calculated using equation (14), and is used in equation (28).
( )EDR
S eDecay 11= (14)
Where: Variable Definition Units Location DecayS STS phase decay rate (holdover). 1/hours C EDR STS phase residence time constant. hours C (Eq. 13)

56 FEPS User's Guide
Long-Term Smoldering Phase (> 2hrs) Calculations Long-term smoldering (LTS) Phase calculations are very similar to the flaming phase calculations. They include:
• LTS phase involvement, • LTS phase consumption, • LTS phase residence time, and • The decay rate of the LTS phase.
LTS involvement is calculated using equation (15). It is used in equations (16), (17) and (29).
( )DBMDuffLTI MMkLTS eInv *100= (15)
Where:
Variable Definition Units Location InvLTS LTS phase involvement. % C KLTI LTS involvement sensitivity, 1. -- Admina MDUFF Duff Moisture Content. % CBE MDBM Duff Benchmark Moisture, 130. % Admina
LTS Consumption is calculated using equation (16), and is used in equation (29).
( ) )0(min100*
max =
−−−
=DuffLTSDuff
STSflamtotalLTS CINVF
CCCC (16)
Where:
Variable Definition Units Location CLTS LTS phase consumption. tons/acre C Cflam Flaming phase consumption. tons/acre C (Eq.6) CSTS STS phase consumption. tons/acre C (Eq. 11) Ctotal Total consumption. tons/acre C InvLTS LTS phase involvement. % C (Eq. 15) FDUFF Duff Fuel Load. tons/acre FL CDUFF Duff Consumed in flame and STS. tons/acre CBE (Eq. 4)
The LTS phase residence time constant is calculated using equation (17), and is used in equation (18).
( ) 1001* 1−−= eInvkRDR LTSRDR (17)
Where: Variable Definition Units Location RDR LTS phase residence time constant. hours C InvLTS LTS phase involvement. % C (Eq. 15) kRDR RDR coefficient, 12. -- Admina

Appendix C: Model Equations 57
The decay, or holdover, is calculated using equation (18), and is used in equation (29).
( )RDRL eDecay 11= (18)
Where:
Variable Definition Units Location DecayL LTS phase decay rate (holdover). 1/hours C RDR LTS phase residence time constant. hours C (Eq. 17)
Calculations on Hourly Input Data tab FEPS calculates equations (18) through (24) with data from the Hourly Input Data tab. The subscript “i” refers to a time step, or hour, of the fire burning period. These results are all reported on the Consumptions/Emissions report.
Areal Measurements
Fire Size The fire size represents the cumulative fire size at a given hour. The user specifies the total cumulative fire size at known times during the Event. FEPS will interpolate between the user-specified fire sizes using one of two equations, depending on the fire type. For a fire with a fire shape of “linear progression” (generally prescription burns), intermediate areas for each hour are calculated using the following equation.
( ) ( ) ( )[ ]jkjijkji HHHHAreaAreaAreaArea −−−+= * (19) For a freely spreading oval fire shape (generally wildland fires), intermediate areas for each hour are calculated as follows:
( ) ( ) ( )[ ]22* jkjijkji HHHHAreaAreaAreaArea −−−+= (20) Where: Variable Definition Units Location Areai Total cumulative area at hour i. acres HIa Areaj User-specified cumulative area at hour j. acres HIa Areak User-specified cumulative area at hour k. acres HIa Hi Hour I -- CBEb Hj Hour j. -- CBEb Hk Hour k. -- CBEb
Note: kij HHH ≤≤ Fire size is used in equation (21) and (37). The results of the interpolation are displayed on the hourly data input tab and in the reports.

58 FEPS User's Guide
Area Consumption Rate Since FEPS uses an hour time step, the area consumption rate is calculated using equation (21). It is used in equations (27), (28), (29), (37), (45), and (46).
1−−= iii AreaAreaAR (21)
Where: Variable Definition Units Location ARi The rate of increase in burn area
between hour i-1 and hour i. acres/hr Report
Areai-1 Cumulative area at hour i-1. acres HIa
(Eq.19, 20) Areai Cumulative area at hour i. acres HIa
(Eq.19, 20)
Meteorological Data To simplify the entry of hourly temperature and relative humidity, FEPS interpolates hourly values based on daily maximums and minimums. The interpolation is done using diurnal weather calculations equations developed by Beck and Trevitt (Beck, Judi A. and C.F. Trevitt, 1989. “Forecasting diurnal variations in meteorological parameters for predicting fire behavior.” Canadian Journal of Forest Research 19:791-797.)
Temperature Temperature is calculated using two different equations. Equation (22) is used for each hour of the event during the daily daytime heating period:
( ) ( ) ( )( ) sn
nx
nnxnt tttwhen
tttt
TTTT <<
−−
−+= ,2sin* π (22)
Equation (23) is used for those hours of the Event during the daily nighttime cooling period:
( )( ) ( )
( )ss
tttt
nxnt tttwheneTTTT ns
s
′+<<′−+′=
′−−
−
24,* 24γ
(23)
Where: Variable Definition Units Location Tt Temperature at time t. ºC Report Tx Maximum temperature of current day. ºC HIb Tn Minimum temperature of current day. ºC HIb T'n Minimum temperature of next day. ºC HIb tn Time of minimum temperature. -- HIb tx Time of maximum temperature. -- HIb ts Time of sunset, assumed to be 6 pm as
an average. -- CBE
γ Decay constant, -3. -- CBE
Hourly temperature is used in equation (35) and is displayed in the reports.
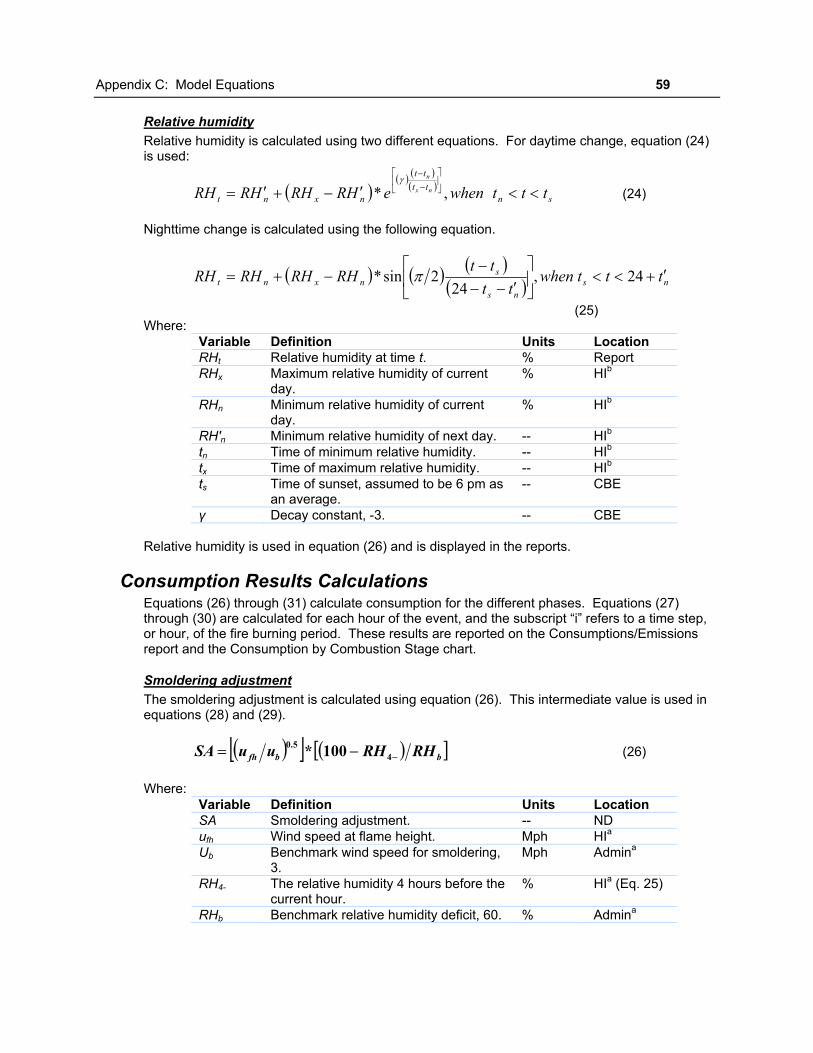
Appendix C: Model Equations 59
Relative humidity Relative humidity is calculated using two different equations. For daytime change, equation (24) is used:
( )( ) ( )
( )sn
tttt
nxnt tttwheneHRRHHRRH nx
n
<<′−+′=
−−
,*γ
(24)
Nighttime change is calculated using the following equation.
( ) ( ) ( )( ) ns
ns
snxnt tttwhen
tttt
RHRHRHRH ′+<<
′−−
−−+= 24,
242sin* π
(25) Where:
Variable Definition Units Location RHt Relative humidity at time t. % Report RHx Maximum relative humidity of current
day. % HIb
RHn Minimum relative humidity of current day.
% HIb
RH'n Minimum relative humidity of next day. -- HIb tn Time of minimum relative humidity. -- HIb tx Time of maximum relative humidity. -- HIb ts Time of sunset, assumed to be 6 pm as
an average. -- CBE
γ Decay constant, -3. -- CBE
Relative humidity is used in equation (26) and is displayed in the reports.
Consumption Results Calculations Equations (26) through (31) calculate consumption for the different phases. Equations (27) through (30) are calculated for each hour of the event, and the subscript “i” refers to a time step, or hour, of the fire burning period. These results are reported on the Consumptions/Emissions report and the Consumption by Combustion Stage chart.
Smoldering adjustment The smoldering adjustment is calculated using equation (26). This intermediate value is used in equations (28) and (29).
( )[ ] ( )[ ]bbfh RHRHuuSA −−= 4
5.0 100* (26)
Where: Variable Definition Units Location SA Smoldering adjustment. -- ND ufh Wind speed at flame height. Mph HIa Ub Benchmark wind speed for smoldering,
3. Mph Admina
RH4- The relative humidity 4 hours before the current hour.
% HIa (Eq. 25)
RHb Benchmark relative humidity deficit, 60. % Admina

60 FEPS User's Guide
Flaming Phase Consumption Rate Rates of flaming phase consumption at any given hour are calculated using equation (27). They are used in equations (30), (31), (32), and (36).
( ) ( )fiffff
iif DecayCRDecayCInv
ARCR *1**100
* 1,, −+−= (27)
Where:
Variable Definition Units Location CRf,i Flaming phase consumption rate at
hour i tons/hour Report
CRf,I-1 Flaming phase consumption rate at hour i-1.
tons/hour CBE
ARi The rate of increase in burn area between hour i-1 and hour i.
Acres/hr CBE (Eq. 21)
Invf Flaming phase involvement. % C Cf Flaming phase consumption. tons/acre C (Eq. 6) Decayf Flaming phase decay rate (holdover). 1/hours C (Eq. 9)
STS Phase Consumption Rate Short-term smoldering (STS) phase consumption rates are calculated using equation (28). They are used in equations (30), (31), (32), and (36).
( ) ( )SiSTSSSTSSTS
iiSTS DecayCRDecayCInv
ARSACR *1**100
** 1,, −+−=
(28) Where:
Variable Definition Units Location CRSTS,i STS phase consumption rate at hour i. tons/hour Report CRSTS,I-1 STS phase consumption rate at hour i-
1. tons/hour CBE
SA Smoldering adjustment. -- CBE (Eq. 26)
ARi The rate of increase in burn area between hour i-1 and hour i.
Acres/hr CBE (Eq. 21)
InvSTS STS phase involvement. % C (Eq. 10) CSTS STS phase consumption. tons/acre C (Eq. 11) DecayS STS phase decay rate (holdover). 1/hours C (Eq. 14)
LTS Phase Consumption rate Long-term smoldering (LTS) phase consumption rates are calculated using equation (29). They are used in equations (30), (31), (32), and (36).
( ) ( )LiLTSLLTSLTS
iiLTS DecayCRDecayCInv
ARSACR *1**100
** 1,, −+−=
(29)
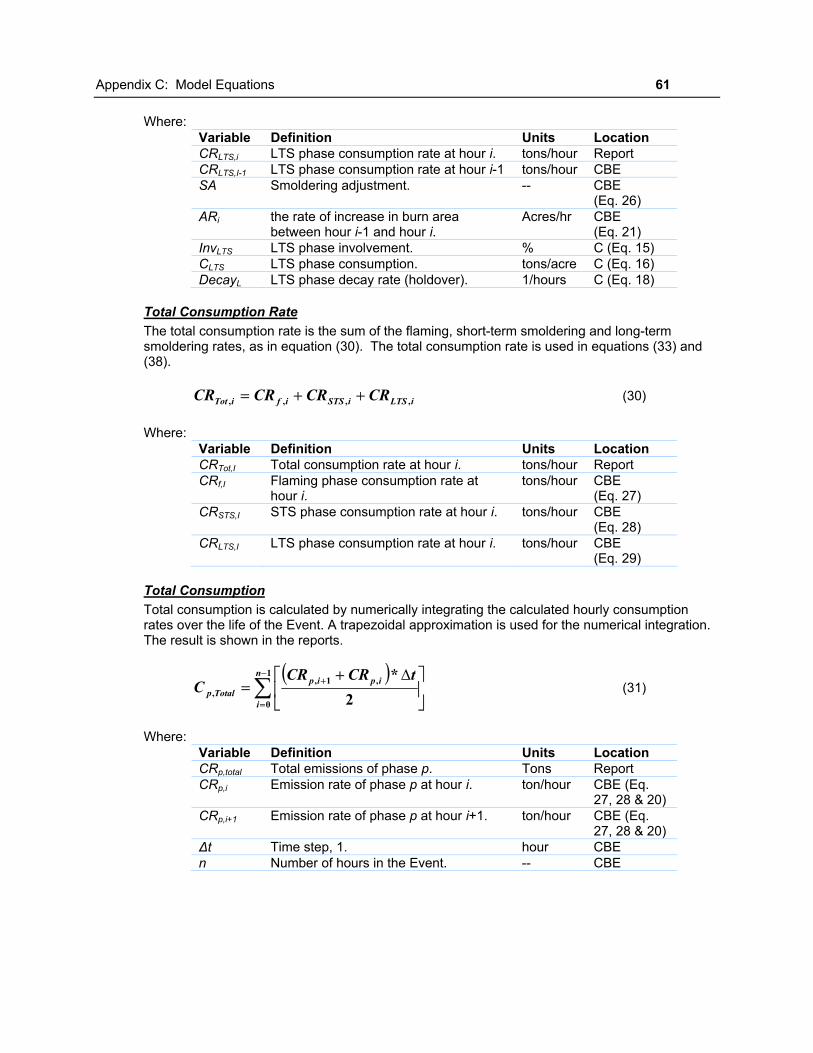
Appendix C: Model Equations 61
Where: Variable Definition Units Location CRLTS,i LTS phase consumption rate at hour i. tons/hour Report CRLTS,I-1 LTS phase consumption rate at hour i-1 tons/hour CBE SA Smoldering adjustment. -- CBE
(Eq. 26) ARi the rate of increase in burn area
between hour i-1 and hour i. Acres/hr CBE
(Eq. 21) InvLTS LTS phase involvement. % C (Eq. 15) CLTS LTS phase consumption. tons/acre C (Eq. 16) DecayL LTS phase decay rate (holdover). 1/hours C (Eq. 18)
Total Consumption Rate The total consumption rate is the sum of the flaming, short-term smoldering and long-term smoldering rates, as in equation (30). The total consumption rate is used in equations (33) and (38).
iLTSiSTSifiTot CRCRCRCR ,,,, ++= (30)
Where: Variable Definition Units Location CRTot,I Total consumption rate at hour i. tons/hour Report CRf,I Flaming phase consumption rate at
hour i. tons/hour CBE
(Eq. 27) CRSTS,I STS phase consumption rate at hour i. tons/hour CBE
(Eq. 28) CRLTS,I LTS phase consumption rate at hour i. tons/hour CBE
(Eq. 29)
Total Consumption Total consumption is calculated by numerically integrating the calculated hourly consumption rates over the life of the Event. A trapezoidal approximation is used for the numerical integration. The result is shown in the reports.
( )
∑−
=
+
+=
1
0
,1,, 2
*n
i
ipipTotalp
tCRCRC
∆ (31)
Where:
Variable Definition Units Location CRp,total Total emissions of phase p. Tons Report CRp,i Emission rate of phase p at hour i. ton/hour CBE (Eq.
27, 28 & 20) CRp,i+1 Emission rate of phase p at hour i+1. ton/hour CBE (Eq.
27, 28 & 20) ∆t Time step, 1. hour CBE n Number of hours in the Event. -- CBE

62 FEPS User's Guide
Emissions Results Calculations Equations (32) through (42) calculate the various efficiency and emissions results. Equations (32) through (41) are calculated for each hour of the event, and the subscript “i” refers to a time step, or hour, of the fire burning period. They are reported on the Buoyancy Results report.
Combustion Efficiency Combustion efficiency is calculated using equation (32). It is used in equations (33) and (38).
( )
( )1***
,,,
,,,
+++++
=iLTSiSTSif
iLTSLTSiSTSSTSiffi CRCRCR
CRkCRkCRkCEff (32)
Where:
Variable Definition Units Location CEffi Combustion efficiency at hour i. -- Report CRf,i Flaming phase consumption rate at
hour i. tons/hour CBE
(Eq. 27) CRSTS,i LTS consumption rate at hour i. tons/hour CBE
(Eq. 28) CRLTS,i The rate of increase in burn area
between hour i-1 and hour i. tons/hour CBE
(Eq. 29) kf Flaming phase combustion efficiency
coefficient, 0.90. % Admina
kSTS STS combustion efficiency coefficient, 0.76.
% Admina
kLTS LTS combustion efficiency coefficient, 0.76.
% Admina
Emissions Emissions are a function of empirical emission factors, the total consumption rate and the combustion efficiency. The following general equation applies to all pollutants. The results of this equation are used in equations (40), (41) and (42), and are reported in all three tabular reports and two charts.
(33)
Where:
Variable Definition Units Location ERa,i Emission rate of pollutant a at hour i. lb/min Report CRTot,i Total consumption rate at hour i. tons/hour CBE
(Eq. 30) Kef,a Emission factor constant for pollutant a. g/kg Adminb EFa Emission factor coefficient for pollutant a. g/kg Adminb CEffi Combustion efficiency at hour i. % CBE CRTot,i Total consumption rate at hour i. tons/hour CBE 2 Metric conversion factor lb/ton / g/kg (2). CBE 60 Minutes per hour. CBE
( ) 602*** ,,, iTotiaaefia CRCEffEFKER −=

Appendix C: Model Equations 63
Emission factor constants and coefficients are: Pollutant Constant (Kef) Coefficient (EFa) CO2 0 1833 CO 961 984 CH4 42.7 43.2 PM2.5 67.4 66.8
Transport Wind
The transport wind speed at hour i used in further heat release calculations is modified slightly from the values entered by the user. It is the maximum of: the current transport wind entered in the hourly data grid, or twice the value entered for the previous hour. It is further limited to a minimum value of Wmin. This intermediate value is calculated by equation (34). It is used in equations (43) and (44).
=′
− wi
wii
KWKW
WW
**2*max
1
min
(34)
Where:
Variable Definition Units Location W'i Modified wind speed at hour i. M/sec ND Wi User-entered Transport wind speed at hour i. Mph CBE Wi-1 User-entered Transport wind speed at hour i-1. Mph Adminb Kw Unit conversion from mph to M/sec, 0.447. M/sec/
Mph Adminb
Wmin Minimum Transport wind speed, 5. M/sec Adminb
Differential Temperature Gradient The differential temperature gradient (lapse rate) is a function of the Pasquill stability class. Users enter the Pasquill stability class for each hour. FEPS uses the following values to calculate the Briggs stability parameter.
Pasquill Stability Class
Differential Temperature Gradient
K/M A -0.009 B -0.008 C -0.006 D 0 E 0.015 F 0.025
Briggs Stability Parameter The Briggs stability parameter is calculated using equation (35).
ii TTs ∆*8.9= (35)
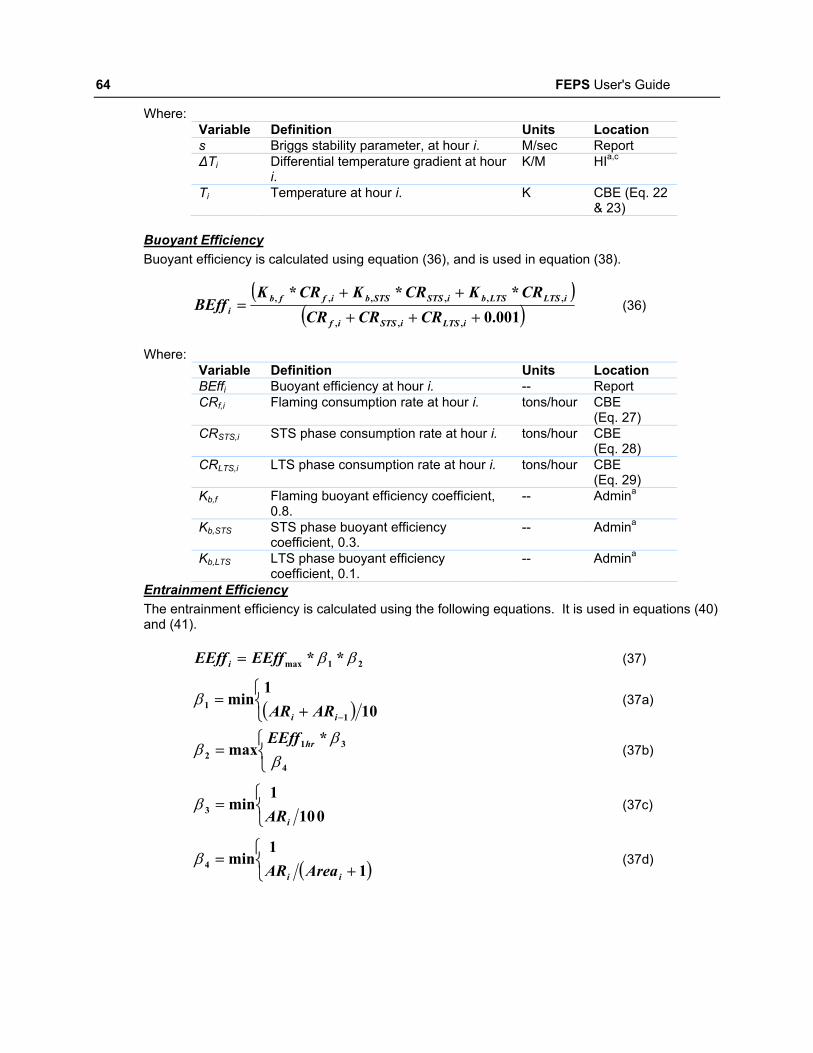
64 FEPS User's Guide
Where: Variable Definition Units Location s Briggs stability parameter, at hour i. M/sec Report ∆Ti Differential temperature gradient at hour
i. K/M HIa,c
Ti Temperature at hour i. K CBE (Eq. 22 & 23)
Buoyant Efficiency Buoyant efficiency is calculated using equation (36), and is used in equation (38).
( )
( )001.0***
,,,
,,,,,,
+++
++=
iLTSiSTSif
iLTSLTSbiSTSSTSbiffbi CRCRCR
CRKCRKCRKBEff (36)
Where:
Variable Definition Units Location BEffi Buoyant efficiency at hour i. -- Report CRf,i Flaming consumption rate at hour i. tons/hour CBE
(Eq. 27) CRSTS,i STS phase consumption rate at hour i. tons/hour CBE
(Eq. 28) CRLTS,i LTS phase consumption rate at hour i. tons/hour CBE
(Eq. 29) Kb,f Flaming buoyant efficiency coefficient,
0.8. -- Admina
Kb,STS STS phase buoyant efficiency coefficient, 0.3.
-- Admina
Kb,LTS LTS phase buoyant efficiency coefficient, 0.1.
-- Admina
Entrainment Efficiency The entrainment efficiency is calculated using the following equations. It is used in equations (40) and (41).
21max ** ββEEffEEff i = (37)
( )
+=
− 101
min1
1ii ARAR
β (37a)
=4
312
*max
ββ
β hrEEff (37b)
=010
1min3
iARβ (37c)
( )
+=
11
min4ii AreaAR
β (37d)

Appendix C: Model Equations 65
Where: Variable Definition Units Location EEffi Entrainment efficiency at hour i. -- Report ARi The rate of increase in burn area
between hour i-1 and hour i. acres/hr CBE
(Eq. 21) ARi-1 The rate of increase in burn area
between hour i-2 and hour i-1. acres/hr CBE
(Eq. 21) Areai Cumulative burn area at hour i. acres HIa (Eq. 19 &
21) EEffmax Maximum entrainment efficiency, 0.95. -- Admina EEffi1hr Entrainment efficiency in first hour or
100 Acre/hr growth rate, 0.80. -- Admina
Heat Release Heat release is calculated using equation (38), and is used in equation (39).
2000*****, hEEffBEffCEffCRQ iiiiToti = (38)
Where:
Variable Definition Units Location Qi Heat release at hour i. -- Report CRTot,I Total consumption rate at hour i. ton/hour CBE
(Eq. 30) BEffi Buoyant efficiency at hour i. -- CBE
(Eq. 36) Eeffi Entrainment efficiency at hour i. -- CBE
(Eq. 37) CEffi Combustion efficiency at hour i. -- CBE
(Eq. 32) h Heat of combustion, 8000. BTU/lb Adminb 2000 Pounds per ton. CBE
Briggs Buoyancy Briggs buoyancy is calculated using equation (39). It is used in equations (43) and (44).
00000258.0*ii QF = (39)
Where:
Variable Definition Units Location Fi Briggs buoyancy factor. M4/sec3 Report Qi Heat release at hour i. btu/hour CBE
(Eq. 38)
Lofted and drift PM2.5 PM2.5 emissions are partitioned into two phases based on the calculated entrainment efficiency. Lofted PM2.5 are those emissions entrained in the plume. Drift emissions make up the remaining PM2.5
Lofted and Drift emissions are calculated using the following equations, and are reported in the Buoyancy Report, Emissions Report, and PM2.5 Chart.

66 FEPS User's Guide
Lofted PM2.5:
iiPMiPM EEffERLofted *,, 5.25.2= (40)
Drift PM2.5:
( )iiPMiPM EEffERDrift −= 1*,, 5.25.2 (41)
Where:
Variable Definition Units Location LoftedPM2.5,I Lofted PM2.5 emission rate at hour i. lb/min Report DriftPM2.5,I Drift PM2.5 emission rate at hour i. lb/min CBE ERa,i Total emission rate of PM2.5 at hour i. lb/min CBE
(Eq. 33) EEffi Entrainment efficiency at hour i. -- CBE
(Eq. 37)
Total Emissions Total emissions are calculated by numerically integrating the calculated hourly emission rates over the life of the Event. A trapezoidal approximation is used for the numerical integration.
( )
∑−
=
+
+=
1
0
,1,, 2
*n
i
iaiaTotala
tERERE
∆ (42)
Where:
Variable Definition Units Location Ea,total Total emissions of pollutant a. lb/min Report ERa,i Emission rate of pollutant a at hour i. lb/min CBE
(Eq. 33) ERa,i+1 Emission rate of pollutant a at hour i+1. lb/min CBE
(Eq. 33) ∆t Time step, 60. min. CBE n Number of hours in the Event. -- CBE
Heat Rise Result Calculations FEPS calculates heat rise in several different ways. These include the maximum heat rise based on the work of G. A. Briggs (1975, “Plume Rise Predictions” in Lectures on Air Pollution and Envi-ronmental Impact Analyses, American Meteorological Society, Boston), and empirical minimum and maximum heat rise values based on equations developed by David V. Sandberg (manuscript in prep.). These are calculated using equations (43) through (46). These equations are calcu-lated for each hour of the event, and the subscript “i” refers to a time step, or hour, of the fire burning period. These results are reported in the Buoyancy Report and the Plume Rise Chart.
Briggs maximum heat rise If the Briggs stability factor, s, is greater than 0, Briggs maximum heat rise is calculated thus:
( )[ ]
′′′
=iiii
iii WsWF
WFH7.38***4.2
7.38*min 333.0
6.0
max,∆ (43)

Appendix C: Model Equations 67
If the Briggs stability factor is less than 0 the following equation is used:
iii WFH ′= 7.38*6.0max,∆ (44)
Where:
Variable Definition Units Location ∆Hmax, I Briggs maximum heat rise at hour i. M Report Fi Briggs buoyancy factor. M4/sec3 CBE
(Eq. 39) W'I Modified wind speed at hour i. M/sec CBE
(Eq. 34)
FEPS Minimum Heat Rise FEPS calculates an empirical minimum plume rise, i.e. elevation at the bottom of the plume using the following equation:
( )BotARARBotBotiF e
eP
PH 111min, * −
−
−=∆ (45)
Where:
Variable Definition Units Location ∆HF-min, i FEPS empirical minimum heat rise at
hour i. M Report
ARi The rate of increase in burn area between hour i-1 and hour i.
acres/hr CBE (Eq. 21)
PBot Maximum efficient plume bottom elevation, default, 4000.
M Adminb
ARBot Benchmark rate of increase, 400. acres/hr Adminb
FEPS Maximum Heat Rise FEPS calculates an empirical maximum heat rise using the following equation:
( )TopARARTopTopiF e
eP
PH 111max, * −
−
−=∆ (46)
Where: Variable Definition Units Location ∆HF-max, i FEPS empirical minimum heat rise at
hour i. M Report
ARi The rate of increase in burn area between hour i-1 and hour i.
acres/hr CBE (Eq. 21)
PTop Maximum efficient plume rise, 8000. M Adminb ARTop Benchmark rate of increase, 400. acres/hr Adminb

Appendix D 68
Appendix D: Parameter and Equation Modifications
To allow FEPS users to investigate alternative calculation approaches, FEPS includes functionality that allows the user to modify the parameters and equations used to model Events.
Warning: While this functionality adds flexibility in modeling Events, it comes with some risk. The user takes on the responsibility to make sure that the equations and parameters are sound and that in modifying equations, they adhere to the guidance presented in this section.
Incorrectly implemented modifications may cause the application to produce erroneous answers, become unstable or simply crash. Do not use these features unless you fully understand the instructions listed below. It is also recommended that you export any important Events or make a backup copy of the FEPS.MDB file in the FEPS program directory, in the unlikely chance that applying a modified equation corrupts the database.
Finally, by changing either the parameters or equations, the modeled results become the sole responsibility of the user. The results must be viewed only within the context of the modified equations.
Parameter/Equation Modifications Overview Parameter/Equation modifications are Event-specific. You can make these modifications and save them with a specific Event. This allows the user to easily compare and contrast the effects of changes in parameters and equations.
Based on the structure of the equations, FEPS allows the user to override parameters in more then half if its underlying equations. If a simple change in parameter or constant is not sufficient, you may modify the underlying calculations further by using an alternative, modified form of an equation. It is important to note that alternative equations must still use the variables and intermediate calculations of earlier steps in the overall calculation. In modifying the alternative equations, you are limited to defining a function in terms of specific predefined parameters and intermediate results. You may add any additional constants you wish.
The structures of the alternative equations are defined in Excel spreadsheets. There is only one alternative equation spreadsheet for each subject equation. Furthermore the alternative equation definitions are not saved with any specific Event. So while it is possible to save alternative parameters individually for each Event, FEPS only allows one alternative definition for each equation at a time. The specification of whether the default or alternative equation is used is saved with a specific Event. If you export an Event that relies upon a modified alternative equation, you will need to manually preserve a copy of the modified equation definition.
For any Event where you have made modifications to the parameters of an equation, or selected an alternate form of an equation, FEPS will display a reminder note in the Event Information tab.
The modification and use of alternative equations requires that Microsoft Excel be properly installed. If FEPS cannot determine that Excel is properly installed, it will provide a warning at startup and the features that enable use of the alterative equations will be disabled.

Appendix D: Parameter and Equation Modifications 69
Managing Parameter/Equation Modifications To modify a parameter or equation, you must first select the User Event that you wish to modify. (See Manage Events Screen)
Accessing the Parameter/Equation Modification Section
1. Select Actions → Equations from the menu,,
The first time you enter the Parameter/Equation management screen, FEPS will display a warning message briefly explaining the risk of modifying equations.
2. After reading the warning, click the OK button.
FEPS will load the initial Parameter/Equation Modification Management Screen.
Parameter/Equation Modification Management Screen (“Equation List”)
This screen lists all equations for which either parameters and/or equations can be modified. The equation numbers match those from Appendix C.
Number The number of the matching equation as defined in Appendix C. In general, equations are listed in the order used by FEPS.
Equation Description
A basic description of the equation.
Customizable Parameters
Indicates whether the parameters of a specific equation may be modified.
Customizable Equations
Indicates whether the calculation may use an alternative form of the equation in an equation spreadsheet.
Customization in Use
Displays the status of each equation for the specified Event. Possible Entries include: • None – The default parameters and equations will be used for
this Event.

70 FEPS User's Guide
• Parameters – Some or all of the parameters for the equation have been modified for the current Event. FEPS will use the default equation.
• Equation – The alternate equation, as found in the relevant spreadsheet will be used. FEPS will use the default parameters. (i.e. the default parameters will be passed to the alternative equation spreadsheet. How they are used depends on the modifications to the equation.)
• Parameters and Equation – The calculation will be based on modified parameters and will use the alternative equation.
The user does not edit the values in this table. They are set by FEPS depending on the actual setup for the equations for each Event as specified by the user.
Resetting all Parameter and Equation Modifications
If you have made changes to the parameters and/or have designated alternative equations for an Event, but wish to restore all the default FEPS parameters and equations for the Event, click the Reset All button. All parameters will be restored to their default values, and FEPS will use its default equations for calculations. Note that any alternative equations you may have created in spreadsheets will be retained in the spreadsheets.
Exiting the Parameter/Equation Modification Section
When you have finished making changes to parameters and equations, click the Close button to return to the data entry tabs for the Event.
Parameters Modifying Parameters
Each equation is based on a unique set of parameters. Once you have loaded an Event and navigated to the Parameters/Equation screen:
1. Select the desired equation,
2. Click the Customize Button,
FEPS displays the available parameters, along with the system default values as a reference.
3. Enter any revised parameter values.
FEPS provides buttons to allow you to save or cancel these changes. Furthermore you will not be able to leave this screen until you either save or cancel your changes.

Appendix D: Parameter and Equation Modifications 71
Example Parameters Screen (Equation 1 Canopy)
Saving or canceling Parameter changes
After changes have been made the Save and Cancel buttons will become enabled.
To save changes,
• Click the Save button,
• click the save icon on the toolbar,
• select File → Save Event from the menu, or
• press CTRL-S.
FEPS will validate the data. If all data meets the validation requirements FEPS will save the changes. If FEPS encounters a validation problem, it will provide a description of the problem. You must correct all invalid entries before FEPS will allow you to save the changes.
To roll back all changes made since the last save:
• Click the Cancel button,
• click the Cancel icon on the toolbar,select Actions → Cancel Changes from the menu, or
• press ALT-C.

72 FEPS User's Guide
Parameters Screen in edit mode.
Resetting Parameters
To reset the parameters for this Equation and Event:
• Click the Reset Parameters button.
FEPS will reset all parameters to their default values and save those changes.
Custom Equations Using a custom equation involves two distinct steps. You must first modify the alternative equation, and then manually specify whether the alternative equation is to be used. By separating these two steps, it is possible to easily switch back and forth between two equations.
Modifying Equations
The alternative equations reside in a set of spreadsheets. There is one spreadsheet for each available equation. These may be modified within the rules specified below.
Before modifying an equation it is advisable to save a copy of the spreadsheet. The spreadsheets may be found in the “EquationSpreadsheets” subdirectory, located under the FEPS application directory. To open the spreadsheet and modify the equation load an Event and navigate to the Parameters/Equation screen:
1. Select the desired Equation,
2. Click the Customize button,
If the Open Equation Spreadsheet button and the Use Equation from Spreadsheet button are disabled, you have selected an equation that does not allow an alternative version (or Excel is not installed).

Appendix D: Parameter and Equation Modifications 73
Parameters Screen
3. Click the Open Equation Spreadsheet button
FEPS will remind you to save all changes to the spreadsheet.
4. Click OK to continue.
FEPS will start Excel and load the alternative spreadsheet for the selected equation.
5. Make any changes to the equation.
6. Save and close the spreadsheet.
This will establish an alternative equation. See “Using the Alternative Equation.”
Guidelines for modifying the equation spreadsheet are as follows:
FEPS uses the equation stored in cell A1. This equation uses the parameters in column B of the yellow table. These parameters represent variables entered in various FEPS data entry screens as well as other constants and parameters used by the equation, including the results of intermediate calculations that cannot be modified directly. Note that the parameters displayed in the yellow table above are not editable and are simply placeholders; they will be replaced dynamically each time the spreadsheet is called and the equation is calculated. Parameters in blue are not used in the standard equation but are passed from FEPS for use in experimental equations.
You may revise the equation in A1 in any manner as long as it uses the pre-specified parameters and/or any additional constants you wish to add. If you wish to use additional, static, parameters, add them in the green table at the bottom, and use them in your equation in cell A1. These will not be passed to or from FEPS. You may add constants in the green section or simply code them in the equation. Adding them to the green section will allow for better documentation.

74 FEPS User's Guide
The Spreadsheet for the Canopy Consumption Equation
Some equations, such as the Entrainment Efficiency equation, include intermediate calculations in other parts of the spreadsheet. You may use other parts of the spreadsheet for intermediate calculations, as long as the final return value is in cell A1.
If you wish to change any of the equation constants or parameters that can be edited, refer to the description of the equation in Appendix C of the FEPS documentation to determine where in FEPS you can change the parameters. The revised parameters will be passed to this spreadsheet at calculation time.
Be sure to save the spreadsheet after making modifications.
Using the Alternative Equation
To specify whether the alternative equation should be used, first load an Event and navigate to the Parameters/Equation screen
1. Click on the Use Equation from Spreadsheet checkbox to select or deselect this option.
If the box has a check, then FEPS will use the alternative equation.

Appendix D: Parameter and Equation Modifications 75
Parameters Screen
2. Click the Close button.
Once the Close button is clicked, FEPS will recalculate all results using revised parameters and equations as specified.
Specifying the use of one or more alternative equations will result in slower execution of the FEPS calculations. If alternative equations are used for equations, which are calculated for every hour of an Event, execution will be even slower. It may also cause some delay in moving between data entry tabs.
The alternative equation spreadsheets originally supplied by the FEPS installation include the default form of each equation. You may specify the use of an alternative equation without first modifying the equation definition. This will produce the same result as using the default equation.
Leaving the Parameters/ Equation screen When you have finished making changes to an equation, you can exit the Parameters/Equation screen one of in two ways.
• Click on the Equation List button if you wish to modify another equation or change any other parameters,
FEPS will return to the Parameter/Equation Modification Management Screen containing the list of equations that can be modified.
• Or, click the Close button if you do not wish to modify another equation or change any other parameters.
FEPS will return to the data entry tabs for the Event.

Appendix E 76
Appendix E: The National Fire Danger Rating System – 1978 Fuel Model Definitions This appendix contains a table with a detailed description of each National Fire Danger Rating fuel model, and photographs representing typical settings for each fuel model. The information in this table comes from Deeming, John E., Robert E. Burgan, and Jack D. Cohen. 1977. The National Fire Danger Rating System-1978. General Technical Report INT-39. Ogden, Utah, USDA Forest Service, Intermountain Forest and Range Experiment Station. 63 pages. The photos following the table are drawn from Anderson, H.E. 1982. Aids to determining fuel models for estimating fire behavior. USDA Forest Service General Technical Report INT-122. Ogden, Utah, USDA Forest Service, Intermountain Forest and Range Experiment Station. 22 pages. Fuel Model Description
A This fuel model represents western grasslands vegetated by annual grasses and forbs. Brush or trees may be present but are very sparse, occupying less than a third of the area. Examples of types where Fuel Model A should be used are cheatgrass and medusahead. Open pinyon-juniper, sagebrush-grass, and desert shrub associations may appropriately be assigned this fuel model if the woody plants meet the density criteria. The quantity and continuity of the ground fuels vary greatly with rainfall from year to year.
B Mature, dense fields of brush 6 feet or more in height are represented by this fuel model. One-fourth or more of the aerial fuel in such stands is dead. Foliage burns readily. Model B fuels are potentially very dangerous, fostering intense fast-spreading fires. This model is for California mixed chaparral generally 30 years or older. The F model is more appropriate for pure chamise stands. The B model may be used for the New Jersey pine barrens.
C Open pine stands typify Model C fuels. Perennial grasses and forbs are the primary ground fuel but there is enough needle litter and branchwood present to contribute significantly to the fuel loading. Some brush and shrubs may be present but they are of little consequence. Situations covered by Fuel Model C are open, longleaf, slash, ponderosa, Jeffrey, and sugar pine stands. Some pinyon-juniper stands may qualify.
D This fuel model is specifically for the palmetto-gallberry understory-pine overstory association of the southeast coastal plains. It can be also used for the so-called "low pocosins" where Fuel Model O might be too severe. This model should only be used in the Southeast because of a high moisture of extinction.
E Use this model after leaf fall for hardwood and mixed hardwood-conifer types where the hardwoods dominate. The fuel is primarily hardwood leaf litter. The oak-hickory types are best represented by Fuel Model E, but E is an acceptable choice for northern hardwoods and mixed forests of the Southeast. In high winds, the fire danger may be underrated because rolling and blowing leaves are not accounted for. In the summer after the trees have leafed out, Fuel Model E should be replaced by fuel Model R.
F Fuel Model F is the only one of the 1972 NFDRS Fuel Models whose application has changed. Model F now represents mature closed chamise stands and oakbrush fields of Arizona, Utah, and Colorado. It also applies to young, closed stands and mature, open stands of California mixed chaparral. Open stands of pinyon-juniper are represented; however, fire activity will be overrated at low windspeeds and where there is sparse ground fuels.
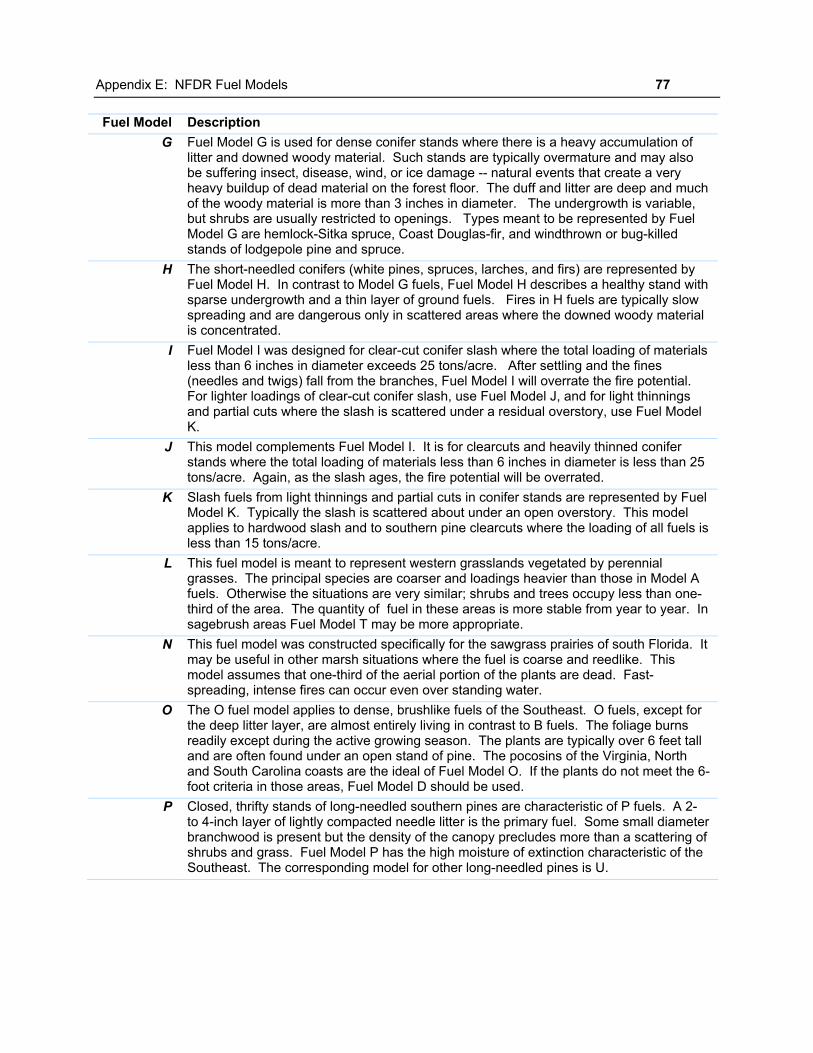
Appendix E: NFDR Fuel Models 77
Fuel Model Description G Fuel Model G is used for dense conifer stands where there is a heavy accumulation of
litter and downed woody material. Such stands are typically overmature and may also be suffering insect, disease, wind, or ice damage -- natural events that create a very heavy buildup of dead material on the forest floor. The duff and litter are deep and much of the woody material is more than 3 inches in diameter. The undergrowth is variable, but shrubs are usually restricted to openings. Types meant to be represented by Fuel Model G are hemlock-Sitka spruce, Coast Douglas-fir, and windthrown or bug-killed stands of lodgepole pine and spruce.
H The short-needled conifers (white pines, spruces, larches, and firs) are represented by Fuel Model H. In contrast to Model G fuels, Fuel Model H describes a healthy stand with sparse undergrowth and a thin layer of ground fuels. Fires in H fuels are typically slow spreading and are dangerous only in scattered areas where the downed woody material is concentrated.
I Fuel Model I was designed for clear-cut conifer slash where the total loading of materials less than 6 inches in diameter exceeds 25 tons/acre. After settling and the fines (needles and twigs) fall from the branches, Fuel Model I will overrate the fire potential. For lighter loadings of clear-cut conifer slash, use Fuel Model J, and for light thinnings and partial cuts where the slash is scattered under a residual overstory, use Fuel Model K.
J This model complements Fuel Model I. It is for clearcuts and heavily thinned conifer stands where the total loading of materials less than 6 inches in diameter is less than 25 tons/acre. Again, as the slash ages, the fire potential will be overrated.
K Slash fuels from light thinnings and partial cuts in conifer stands are represented by Fuel Model K. Typically the slash is scattered about under an open overstory. This model applies to hardwood slash and to southern pine clearcuts where the loading of all fuels is less than 15 tons/acre.
L This fuel model is meant to represent western grasslands vegetated by perennial grasses. The principal species are coarser and loadings heavier than those in Model A fuels. Otherwise the situations are very similar; shrubs and trees occupy less than one-third of the area. The quantity of fuel in these areas is more stable from year to year. In sagebrush areas Fuel Model T may be more appropriate.
N This fuel model was constructed specifically for the sawgrass prairies of south Florida. It may be useful in other marsh situations where the fuel is coarse and reedlike. This model assumes that one-third of the aerial portion of the plants are dead. Fast-spreading, intense fires can occur even over standing water.
O The O fuel model applies to dense, brushlike fuels of the Southeast. O fuels, except for the deep litter layer, are almost entirely living in contrast to B fuels. The foliage burns readily except during the active growing season. The plants are typically over 6 feet tall and are often found under an open stand of pine. The pocosins of the Virginia, North and South Carolina coasts are the ideal of Fuel Model O. If the plants do not meet the 6-foot criteria in those areas, Fuel Model D should be used.
P Closed, thrifty stands of long-needled southern pines are characteristic of P fuels. A 2- to 4-inch layer of lightly compacted needle litter is the primary fuel. Some small diameter branchwood is present but the density of the canopy precludes more than a scattering of shrubs and grass. Fuel Model P has the high moisture of extinction characteristic of the Southeast. The corresponding model for other long-needled pines is U.

78 FEPS User's Guide
Fuel Model Description Q Upland Alaskan black spruce is represented by Fuel Model Q. The stands are dense
but have frequent openings filled with usually inflammable shrub species. The forest floor is a deep layer of moss and lichens, but there is some needle litter and small-diameter branchwood. The branches are persistent on the trees, and ground fires easily reach into the tree crowns. This fuel model may be useful for jack pine stands in the Lake States. Ground fires are typically slow spreading, but a dangerous crowning potential exists. Users should be alert to such events and note those levels of SC and BI when crowning occurs.
R This fuel model represents the hardwood areas after the canopies leaf out in the spring. It is provided as the off-season substitute for E. It should be used during the summer in all hardwood and mixed conifer-hardwood stands where more than half of the overstory is deciduous.
S Alaskan or alpine tundra on relatively well-drained sites is the S fuel. Grass and low shrubs are often present, but the principal fuel is a deep layer of lichens and moss. Fires in these fuels are not fast spreading or intense, but are difficult to extinguish.
T The bothersome sagebrush-grass types of the Great Basin and the Intermountain West are characteristic of T fuels. The shrubs burn easily and are not dense enough to shade out grass and other herbaceous plants. the shrubs must occupy at lease one-third of the site or the A or L fuel models should be used. Fuel Model T might be used for immature scrub oak and desert shrub associations in the West, and the scrub oak-wire grass type in the Southeast.
U Closed stands of western long-needled pines are covered by this model. The ground fuels are primarily litter and small branchwood. Grass and shrubs are precluded by the dense canopy but occur in the occasional natural opening. Fuel Model U should be used for ponderosa, Jeffrey, sugar pine, and red pine stands of the Lake States. Fuel Model P is the corresponding model for southern pine plantations.
Fuel Model A

Appendix E: NFDR Fuel Models 79
Fuel Model B

80 FEPS User's Guide
Fuel Model C

Appendix E: NFDR Fuel Models 81
Fuel Model D
Fuel Model E

82 FEPS User's Guide
Fuel Model G

Appendix E: NFDR Fuel Models 83
Fuel Model H

84 FEPS User's Guide
Fuel Model I
Fuel Model J

Appendix E: NFDR Fuel Models 85
Fuel Model J (Cont.)

86 FEPS User's Guide
Fuel Model K

Appendix E: NFDR Fuel Models 87
Fuel Model L

88 FEPS User's Guide
Fuel Model N

Appendix E: NFDR Fuel Models 89
Fuel Model O

90 FEPS User's Guide
Fuel Model P

Appendix E: NFDR Fuel Models 91
Fuel Model Q

92 FEPS User's Guide
Fuel Model R

Appendix E: NFDR Fuel Models 93
Fuel Model S

94 FEPS User's Guide
Fuel Model T

Appendix E: NFDR Fuel Models 95
Fuel Model T (Cont.)
Fuel Model U