Embed Size (px)
Citation preview

8/7/2019 Finnie & Mueller, 2008-The Effects of Family Income
http://slidepdf.com/reader/full/finnie-mueller-2008-the-effects-of-family-income 1/52
A MESA Project Research Paper
The Effects of Family Income, Parental
Education and Other Background
Factors on Access to Post ‐ Secondary
Education in Canada
Evidence from the YITS
Ross Finnie
University of Ottawa
Richard E. Mueller
University of Lethbridge
JULY 2008
Educational Policy Institute Queen’s University School of Policy Studies Canada Millennium Scholarship Foundation

8/7/2019 Finnie & Mueller, 2008-The Effects of Family Income
http://slidepdf.com/reader/full/finnie-mueller-2008-the-effects-of-family-income 2/52
The Effects of Family Income and Other Factors on Access to PSE in Canada
www.mesa ‐ project.org P a g e | 2
The
MESA
Project
The Measuring the Effectiveness of Student Aid Project , or the MESA Project, is a four ‐
year research effort being conducted by the Educational Policy Institute and the School
for Policy Studies at Queen's University on behalf of the Canada Millennium Scholarship
Foundation. It has been designed to answer the following four questions:
After graduating from high school, teenagers coming from low ‐ income
backgrounds face a choice as to attend college or university, or not. For those
who did attend, how do they compare to those who did not?
Does providing more funding in a student’s first few years of further education
attract more low ‐ income students to post ‐ secondary education?
Does providing more funding in a student’s first few years of further education
make it more likely for low ‐ income students to stay in and graduate?
Are low ‐ income students different across Canada?
This paper is part of a series of research papers solicited from some of the leading
Canadian researchers in the field of post ‐ secondary education; the researchers were
asked to write about issues of access and persistence in post ‐ secondary education in
Canada. The requirements for the papers were that the researchers use one of several
currently ‐ existing Statistics Canada databases or another source of Canadian data. Each
of the papers commissioned during this project is available for downloading from the
MESA Project website at www.mesa ‐ project.org .
The findings and conclusions expresses in this paper are those of the authors and do not
necessarily represent those of MESA Project.
Please cite as:
Finnie, Ross, and Mueller, Richard E. (2008). The Effects of Family Income,
Parental Education and Other Background Factors on Access to Post ‐ Secondary
Education in Canada: Evidence from the YITS. A MESA Project Research Paper.
Toronto, ON: Educational Policy Institute.

8/7/2019 Finnie & Mueller, 2008-The Effects of Family Income
http://slidepdf.com/reader/full/finnie-mueller-2008-the-effects-of-family-income 3/52
The Effects of Family Income and Other Factors on Access to PSE in Canada
www.mesa ‐ project.org P a g e | 3
The Partners
The Educational Policy Institute is an international, non ‐ profit think tank dedicated to
the study of educational opportunity. Our mission is to provide high ‐ level research and
analysis to support policymakers and practitioners and expand educational opportunity
to all students. EPI handles overall project management and co ‐ ordination, data privacy
& cleaning, and integration of the final results at the end of the project.
(www.educationalpolicy.org)
The School of Policy Studies at Queen's University is a leading centre for advanced
education, research, debate and interaction with the non ‐ academic world in the fields
of public administration and industrial relations. Continuing the long ‐ standing
commitment of Queen's University to excellence in these areas, they are training the
next generation of leaders for life in a global age. Their master's programs link theory
with practice to provide students with fundamental knowledge of the economic,
political, social and technological changes that are transforming the way we live and the
way we work. Students enhance their communication and research skills, and gain new
skills in management, policy analysis, economics and quantitative methods. Their
graduates are well prepared to contribute to policy ‐ making, human resource
management and industrial relations in a variety of public, private and nonprofit
organizations. The School for Policy Studies manages the Research Review Committee
for the MESA Project, which is responsible for funding contributory research projects
that highlight important policy areas of interest. (www.queensu.ca/sps)
The Canada Millennium Scholarship Foundation is a private, independent organization
created by an act of Parliament in 1998. It encourages Canadian students to strive for
excellence and pursue their post ‐ secondary studies. The Foundation distributes $325
million in the form of bursaries and scholarships each year throughout Canada. Its
objectives are to improve access to post ‐ secondary education for all Canadians,
especially those facing economic or social barriers; to encourage a high level of student
achievement and engagement in Canadian society; and to build a national alliance of organizations and individuals around a shared post ‐ secondary agenda. The Foundation
is funding the MESA Project overall, and has negotiated access to its student
administrative
lists
with
each
of
the
provinces
on
the
project's
behalf.
(www.millenniumscholarships.ca)

8/7/2019 Finnie & Mueller, 2008-The Effects of Family Income
http://slidepdf.com/reader/full/finnie-mueller-2008-the-effects-of-family-income 4/52

8/7/2019 Finnie & Mueller, 2008-The Effects of Family Income
http://slidepdf.com/reader/full/finnie-mueller-2008-the-effects-of-family-income 5/52

8/7/2019 Finnie & Mueller, 2008-The Effects of Family Income
http://slidepdf.com/reader/full/finnie-mueller-2008-the-effects-of-family-income 6/52
The Effects of Family Income and Other Factors on Access to PSE in Canada
www.mesa ‐ project.org P a g e | 6
Introduction
There now exists a substantial body of research on the importance of family background
influences, tuition levels, and other related variables on access to post ‐ secondary
education (PSE) – in Canada as for other countries. For economists, this emphasis on
financial factors makes perfect sense. The price mechanism is considered to be
important in any investment decision – which is how the choice of schooling level is
typically viewed. And the availability of the funds required to make the investment – in
this context often proxied by or otherwise related to family income level – is an equally
critical factor, especially in a context where capital markets may limit access to financing
because prospective students are often unable to provide sufficient collateral to back
their borrowing (see for example, Barr, 1993, Chapman, 1997).
Recent scholarly research in the area of access to PSE (e.g., Cunha, et al., 2006,
Heckman, 2007) has, however, shifted the emphasis to non ‐ financial factors as a newer
generation of empirical work has indicated that financial resources are but one of many
important determinants of PSE participation. This line of research contends that it is
long ‐ term factors, such as family background, over short ‐ term factors, such as credit
constraints, which are of greatest importance in determining access to PSE. Since many
of these factors are correlated with family income in the short ‐ term period when PSE
decisions are made, it is often erroneously stated that this short ‐ term credit constraint
is what prohibits low ‐ income individuals from attending PSE. The implication of this
work is powerful: policy should be more directed towards students earlier in life if the
long ‐ term goal is to increase PSE participation.
This is not to imply that financial resources are not important, only that they may be
correlated with other variables which are also significant determinants of PSE
participation, and thus there may have been a misguided assignment of the influence of these financial variables. For policy purposes, identifying the most important
determinants of access to PSE is obviously important for choosing the most effective
policy levers for changing access rates (and the underlying opportunities which drive
those rates), especially if overall PSE budgets are more or less fixed and spending on one

8/7/2019 Finnie & Mueller, 2008-The Effects of Family Income
http://slidepdf.com/reader/full/finnie-mueller-2008-the-effects-of-family-income 7/52
The Effects of Family Income and Other Factors on Access to PSE in Canada
www.mesa ‐ project.org P a g e | 7
access lever (e.g., loans, grants, or loser tuition) means less spending on another (e.g.,
earlier interventions).
Furthermore, if student loans and grants and/or decreased tuition are not having the
desired effect on access and retention, than these resources may simply amount to
“rent” accumulating to those whose PSE decisions are not sensitive to these financial
variables and would have been attending anyway. Governments would perhaps likely do
better at targeting their resources to, say, better preparing students for gaining
admission into PSE institutions or improving individuals’ educational success or work
habits at lower levels, ultimately enhancing the probability of PSE participation.
Carneiro and Heckman (2002) succinctly summarize the argument, noting that children
whose parents have higher income have better access to quality schools, and these
same parents shape the tastes and expectations of their children. They are also able to
better nurture the intellect of their children by assisting and directing their studies. They
also note that cognitive ability – at least as measured by IQ on standardized tests – is
formed by the age of 14 and that the influences of family factors accumulate from birth
so that scholastic ability is determined by the end of high school. Again, the implication
of these arguments is that policies aimed at influencing young people at the time of transition from high school to PSE could be inappropriately targeted. Rather, any
attempts at intervention should likely be conducted much earlier when the cognitive
maturity of young people is being developed.
With the exception of Carneiro and Heckman (2002), and a handful of other recent
studies of this generation which address the importance of family background on access
to PSE (e.g., Cameron and Heckman, 1998; Ermisch and Francesconi, 2001; Keane and
Wolpin, 2001; Cunha, et al., 2006; Heckman, 2007), relatively little data has been
brought to bear on this topic, and we believe our data to have certain strengths that can
be found in no previous studies, these being the particularly rich set of background
variables that can be added to the models. This is especially true in the Canadian
context, and to the best of our knowledge, ours is the first study using Canadian data
which attempts to estimate the importance of a broader set of family and student
background influences on access to PSE in this fashion. 1 In particular, we focus on the
background of young adults at the time when they are 15 ‐ years old to assess the
importance of these factors on entering either college or university.
The contribution of this paper is, therefore, to include a much richer series of
background variables into the analysis, thus allowing us to analyse the effects of both
the more traditionally measured determinants of access to PSE (e.g., family income) as
well as the various sets of other background variables that also may be of importance. It
is this latter group of factors that maybe correlated with financial variables, and yet may
1 Frenette (2007) also exploits these data, but address a different question: what factors explain the difference in PSE
participation rates of individuals from different family income quartiles? He addresses this by using a standard Oaxacadecomposition approach.

8/7/2019 Finnie & Mueller, 2008-The Effects of Family Income
http://slidepdf.com/reader/full/finnie-mueller-2008-the-effects-of-family-income 8/52

8/7/2019 Finnie & Mueller, 2008-The Effects of Family Income
http://slidepdf.com/reader/full/finnie-mueller-2008-the-effects-of-family-income 9/52
The Effects of Family Income and Other Factors on Access to PSE in Canada
www.mesa ‐ project.org P a g e | 9
The Literature
As noted above, a good share of the literature on access to PSE amongst young people
has addressed the impacts of tuition levels and family background (the two often
interacted).
Carneiro and Heckman (2002) review the US literature and add new evidence
supporting the paramount importance of long ‐ term factors, such as family background,
over short ‐ term factors, such as credit constraints. Since many of these background
factors are correlated with family income in the short ‐ term period when PSE decisions
are made, it is often erroneously stated that this indicator of short ‐ term credit
constraint is what prohibits low ‐ income individuals from attending PSE.
Studies by Cameron and Heckman (1998, 2001), Keane and Wolpin (2001), and Cunha,
et al. (2006), to name but a few, also support this conclusion. Similarly, Murray (2002)
notes that successful (in terms of income) parents tend to have successful children. The
implication of this research is that PSE participation is largely determined long before
the actual point of entry into higher education and that relaxing short ‐ term credit
constraints have only have a minimal effect on participation. Keane (2002:293), for
example, commenting on the income divide in college attendance in the US notes that
this inequality “appears to be driven by unequal human ‐ capital accumulation prior to
the college ‐ going age.” The policy implication of these studies is that trying to relax
short ‐ term financial constraints in attending PSE will be largely ineffective.
This body of work represents the point of departure for the current paper. We utilize
the extensive background information contained in the YITS‐ A database to address
access to PSE in Canada. Specifically, we add to the existing literature by including a
more comprehensive set of background variables which are determined before entry
into PSE to assess the impact of these variables on access to college and university and
how introducing these additional variables affects estimates of the more conventional
measures, such as family income, as well as parental education.

8/7/2019 Finnie & Mueller, 2008-The Effects of Family Income
http://slidepdf.com/reader/full/finnie-mueller-2008-the-effects-of-family-income 10/52
The Effects of Family Income and Other Factors on Access to PSE in Canada
www.mesa ‐ project.org P a g e | 10
This work also fits into a specifically Canadian literature. The accumulated evidence
suggests that the demand for PSE in Canada is price inelastic (Junor and Usher, 2004),
although tuition increases may have a larger impact on individuals from low ‐ income
families (Coelli, 2005). Both Christophides, et al. (2001) and Corak, et al. (2003) include
parental income in their models of PSE participation and find that it is important for
university attendance, but not college, while tuition generally had little general effect,
but may have more impact on individuals from low income families. Frenette (2005) and
Drolet (2005) similarly find that PSE attendance gap between high ‐ and low ‐ income
families is narrowed when colleges and universities are both considered, but that
students from low ‐ income family are less likely to attend either, especially university.
Two recent studies (Frenette, 2005, 2007), have also cast doubt on the credit constraint
hypothesis. In the first study, Frenette uses the deregulation of professional program
tuition in Ontario as a natural experiment. He discovers that it is students from middle
class families who saw their participation in these programs decline the most, not those
from lower ‐ income families. In the second study, using the same YITS‐ A data we
employ, he shows that very little of the university participation gap between students
from families in the first and fourth income quartiles can be explained by credit
constraints. Rather it is differences in standardized test scores and high school marks
that explain the majority (and almost all) of the gap. The combined results of this body
of work again suggests that resources aimed at relaxing credit constraints (e.g., loans
and even grants) may be misdirected and might be better utilized at improving student
performance at (or before) the high school level or providing better information to
students and their families about the costs and benefits of education.

8/7/2019 Finnie & Mueller, 2008-The Effects of Family Income
http://slidepdf.com/reader/full/finnie-mueller-2008-the-effects-of-family-income 11/52
The Effects of Family Income and Other Factors on Access to PSE in Canada
www.mesa ‐ project.org P a g e | 11
Methodology
This research uses a relatively standard empirical model for estimating access to PSE,
where access is taken to be a function of different sets of influences, working from a
smaller set of regressors, including the principal family background variables
conventionally included in such models, and building to a more comprehensive set of regressors representing the other kinds of influences measured in the YITS‐ A – thus
moving from a “short” regression to progressively “longer” regressions.
The model may be expressed as follows:
Y = X1β1 + X2β2 + X3β3 + μ
where Y is the access measure of interest (participation in college or university), the Xi
are vectors of covariates that influence Y, the β i are the coefficients associated with each
set of X, and μ is the classical stochastic error term.
X1 comprises the most conventional family background variables such as family income,
parental education, family type, etc. which are typically taken in the literature to be the
important indicators of the advantages of family background in terms of going on to
PSE. That is, individuals from higher income families or (especially) those with more
highly educated parents (it turns out) are more likely to go on to PSE, particularly at the
university level. These simpler/shorter models will capture the total effects of these
variables on access, regardless of the path of those influences (i.e., direct or indirect),
while picking up the influences of other omitted factors with which they are correlated.
X2 includes one element of the wider range of variables available in the YITS. This set is
comprised of various (scholastic) “ability” measures, such as the individual’s high school
grades (overall and in certain specific subjects, such as math and English), and other
related indicators.

8/7/2019 Finnie & Mueller, 2008-The Effects of Family Income
http://slidepdf.com/reader/full/finnie-mueller-2008-the-effects-of-family-income 12/52
The Effects of Family Income and Other Factors on Access to PSE in Canada
www.mesa ‐ project.org P a g e | 12
A next set of regressors, X3, include other kinds of influences that have been gaining
increasing attention as perhaps constituting some of the more important determinants
of access to PSE. These include measures of “engagement” and “inclusion,” such as how
connected the student felt to his or her high school, a student’s self ‐ appraisal of confidence and competence, parental behaviours regarding monitoring and disciplining
their children, etc.
It should be recognised that these additional influences do not necessarily have a
natural, “econometrically ‐ correct” ordering in terms of their inclusion, partly because
we do not yet understand these processes very well. Further work will undoubtedly
continue our advances in this respect. What is most important to the current analysis,
however, is that:(i) they are all determined before the entry into PSE (which is when
they have been measured – i.e., during the earlier pre ‐ PSE cycles of the YITS‐ A), (ii) they
can affect access to PSE, and (iii) they might in turn be related to family background.
Hence, including them will comprise an exercise in moving towards (i) identifying a fuller
set of influences of access to PSE, and (ii) seeing how adding such additional measures
affects our understanding of the direct and indirect effects of family background on
access to PSE.
Various particular specifications of this model are estimated, all of which use a
multinomial logit set ‐ up to differentiate between access to college and university. 2 It is
important here to explain the difference between these two kinds of PSE in the
Canadian context. “University” includes what is conventionally referred to as “college”
in the American context, and includes all types of programs that deliver bachelors
degrees. Otherwise put, virtually all institutions in Canada that grant such degrees are
referred to as “universities,” even if they only offer programs at the bachelors level, and
regardless of their size. The classic liberal arts college that is found in the U.S. would
thus be a university in Canada. In contrast, “colleges” , or what are often referred to
more completely as “community colleges” offer shorter, more practical programs,
usually lasting from a few months to two years (or even longer in some cases) and in
many cases include trade schools. The resulting credential is a college diploma – as
opposed to the degrees offered by universities.
Our multinomial setup up thus allows the regressors in our models to have different
effects on college and university participation, while allowing these processes to be
related.
One potential issue in the estimation of these models is the potential endogeneity of at
least some of the right ‐ hand side variables. For example, students who want to get into
university will likely work harder to achieve the better grades in high school required to
2 We are aware that the use of a multinomial logit model requires the assumption of independence of irrelevantalternative, an assumption that is strong given that the decision to go to college or university are not likely independent.We estimated a number of the specifications outlined below using a multinomial probit model (which does not require thisstrong assumption). In none of the cases did the results change markedly from those presented below in Tables 2 and 3.

8/7/2019 Finnie & Mueller, 2008-The Effects of Family Income
http://slidepdf.com/reader/full/finnie-mueller-2008-the-effects-of-family-income 13/52
The Effects of Family Income and Other Factors on Access to PSE in Canada
www.mesa ‐ project.org P a g e | 13
gain admission to this level of schooling (and to have more choice among those to which
they are accepted). Thus, high school grades are not strictly exogenous to the PSE
participation outcome. There exist a variety of ways to overcome (although not
necessarily eliminate) this endogeneity problem. But in this paper we simply take such
measures at face value, which is consistent with our goal of estimating the empirical
relationships in question and seeing how they change (or not) as the model includes
richer sets of regressors. Adding the more complete sets of explanatory variables may
not eliminate the bias caused by endogeneity, but it should at least attenuate the
problem.

8/7/2019 Finnie & Mueller, 2008-The Effects of Family Income
http://slidepdf.com/reader/full/finnie-mueller-2008-the-effects-of-family-income 14/52
The Effects of Family Income and Other Factors on Access to PSE in Canada
www.mesa ‐ project.org P a g e | 14
The Data
The Youth in Transition Survey – Sample A (or YITS‐ A) initially interviewed 15 ‐ year olds,
their parents, and their high school administrators in 2000. Two follow ‐ up surveys of the
young people (only) were conducted in 2002 and then again in 2004. In this latter wave
of the survey, the young people were 19 ‐ years of age, the point at which individuals
have made at least their initial choices about entering PSE.
The dependent variables in our study – representing entry into either college or
university – thus differentiate those who have decided to enter PSE at this point in their
lives versus all others – including those who have decided not to attend as well as those
who may go later. While it would also be interesting – and in some ways more
interesting – to look at access when individuals are older and would therefore have had
more time to return to their studies after not entering PSE directly from high school,
other work has found that the relationship between participation in PSE and family
background (as well as most other influences) does not differ very much with the age of the individuals included in the samples (at least among young people generally). Our
analysis is in any event constrained by the data available, and we consider our estimates
to at minimum provide an initial set of results which at least begin to get at the issues
being addressed, perhaps to be returned to after the release of the 2006 survey YITS‐ A
data.
While our study is national in scope, the exception to this general coverage is that the
samples exclude those living in Quebec. Because Quebec has a special system of PSE –
Collège
d'enseignement
général
et
professionnel ,
or
CEGEP
as
it
is
commonly
known
–
students in Quebec only attend secondary education up to the equivalent of grade 11,
and then attend CEGEP to either prepare for university (two years of CEGEP) or to
complete a technical program (usually two or three years of CEGEP). We drop Quebec
from our analysis since there is no way in these data to disaggregate the two streams,
and this could potentially confound our analysis, since university ‐ bound students would
be classified as college students if included in terms of their CEGEP attendance, and the

8/7/2019 Finnie & Mueller, 2008-The Effects of Family Income
http://slidepdf.com/reader/full/finnie-mueller-2008-the-effects-of-family-income 15/52
The Effects of Family Income and Other Factors on Access to PSE in Canada
www.mesa ‐ project.org P a g e | 15
differentiation of college ‐ and university ‐ bound students is fundamental to our analysis.
Observations from the territories are also eliminated due to small sample sizes.
PSE participation is defined in our analysis as the first program that a student entered,
rather than the highest level attended. This is principally owing to the fact that more
information is available on the first program than on subsequent programs as well as
the fact that we are concerned with the specific transition from high school to PSE in
this research. This said, given the relative youth of our samples, for most students the
level of the first program is the same as the level of the highest program – at least so far
in their lives. (With future waves of the YITS data, the dynamics relating to first versus
subsequent programs could be addressed, including switches from one level of PSE to
another (i.e., between college and university).
Since individuals who have studied outside of Canada might have quite different
backgrounds and experiences, we eliminate them from the sample. For the same
reason, non ‐ Canadian citizens and those with unknown immigration status are dropped.
Finally, we drop those individuals for which there are missing data as well as those who
are continuing in high school, since we obviously do not observe any potential transition
into PSE for this latter group. 3
The final sample contains 7,852 males and 8,211 females. At times, however, this
number is reduced slightly due to missing values of some of the variables included in the
different models. A full accounting of the observations dropped from the sample is
contained in Appendix Table A‐ 1.
3 Another issue we ignore is the effect of working during school and the effect of employment, number of hours worked,etc. on the post-secondary education choice. It is our opinion this is an important and complex issue and one that is better left for a separate analysis using these or other data.

8/7/2019 Finnie & Mueller, 2008-The Effects of Family Income
http://slidepdf.com/reader/full/finnie-mueller-2008-the-effects-of-family-income 16/52
The Effects of Family Income and Other Factors on Access to PSE in Canada
www.mesa ‐ project.org P a g e | 16
Results
The Baseline Models
The initial estimation results are presented in Table 1, for males and females. These
represent a set of baseline estimates that are interesting on their own, and that provide
a point of departure for the analysis that follows as additional variables are added to the
model. The major result to come from this exercise and one that is increasingly
prominent in the literature (e.g., Ermisch and Francesconi, 2001) is that the effect of parental income – especially in the late ‐ teen years when PSE decisions are made – is
diminished greatly once we control for parental education. 4
For example, the results with controls for males that do not include parental education
show that a parental income level of $100,000 and over is associated with a 19.1
percentage point increase in the probability of attending university compared to the
control group of $50,000 to $75,000. When parental education level is included,
however, this figure drops to about six percentage points. For females, the
corresponding estimates are 19.8 and 10.3 percentage points. For college access, there
are no statistically significant income effects except in the final model for females,
where those from the poorest families have significantly lower participation rates.
What is also interesting is that although direct comparison of the income and education
effects is not possible because of the different nature (and metrics) of the two sets of
measures (dollars versus years), the parental income effects appear to be much smaller
in magnitude than those of parental education, at least with respect to university
entrance. For example, having a parent with a bachelor’s degree increases the
probability of going to university by 31.2 percentage points for males, compared to
4 In the case of two-parent families, parental education represents the highest level of the two parents. Using other measures (such as the average level or the different levels of the two parents) yields similar findings.

8/7/2019 Finnie & Mueller, 2008-The Effects of Family Income
http://slidepdf.com/reader/full/finnie-mueller-2008-the-effects-of-family-income 17/52
The Effects of Family Income and Other Factors on Access to PSE in Canada
www.mesa ‐ project.org P a g e | 17
someone from a family with high school as the highest level of parental education.
Contrast this with the aforementioned six percentage point increase for males from
families with incomes over $100,000 compared to incomes in the $50,000 ‐ 75,000 range.
In addition, we note that parental education effects both college and university
attendance – these influences running in opposite directions. Thus, for example, males
with a parent with a graduate (or professional) degree are (ceteris paribus) 45.1 percent
more likely to go to university than the comparison group (parents have completed high
school), but this comes partly at the cost of 9.2 percent lower rates of college
attendance. This makes sense: parental education changes not only how many
individuals go on to PSE (the net increase of 35.9 percent represented by the two effects
taken together in the example just given), but also the distribution of the kind of schooling they engage in (increasing university level schooling and decreasing college
level participation). The multinomial logit model used here captures these effects in the
econometrically appropriate manner, and also in a manner which is expositionally
convenient.
Our results are also consistent with those provided by Sacerdote (2002), who also finds
that father’s income (as proxied by occupation) and father’s education are important
determinants of entrance to PSE. He compares children randomly assigned to adoptive
families with children who live with their birth parents (the control group). He finds that
both groups are similarly influenced by income, but education is an important
determinant of PSE participation only for non ‐ adoptees – which of course has meaning
for the interpretation of the two kinds of influences. This finding is echoed by Plug and
Vijverberg (2003) who model parental ability as having both a direct effect on their
children’s educational attainment as well as an indirect effect through income. They
argue that higher ability parents earn higher incomes and these incomes are also
important inputs into a child’s education. They find that the effects of parental ability
are reduced from about 70 ‐ 75 per cent of the total ability transfer to some 55 ‐ 60 per
cent when the indirect effects of ability on income are included in the model. Restuccia
and Urrutia (2004) show that most of the intergenerational persistence in educational
attainment can be accounted for by innate ability, but that the quality of early education
can enlarge these exogenous differences in ability over time.
Adding High School Grades to the Model
Next we turn to analysing the influence on access to PSE of the grades that students
received in high school at the time of the first wave of the survey in 2000 when these
young people were 15 ‐ years old. The results of these estimations are presented in a
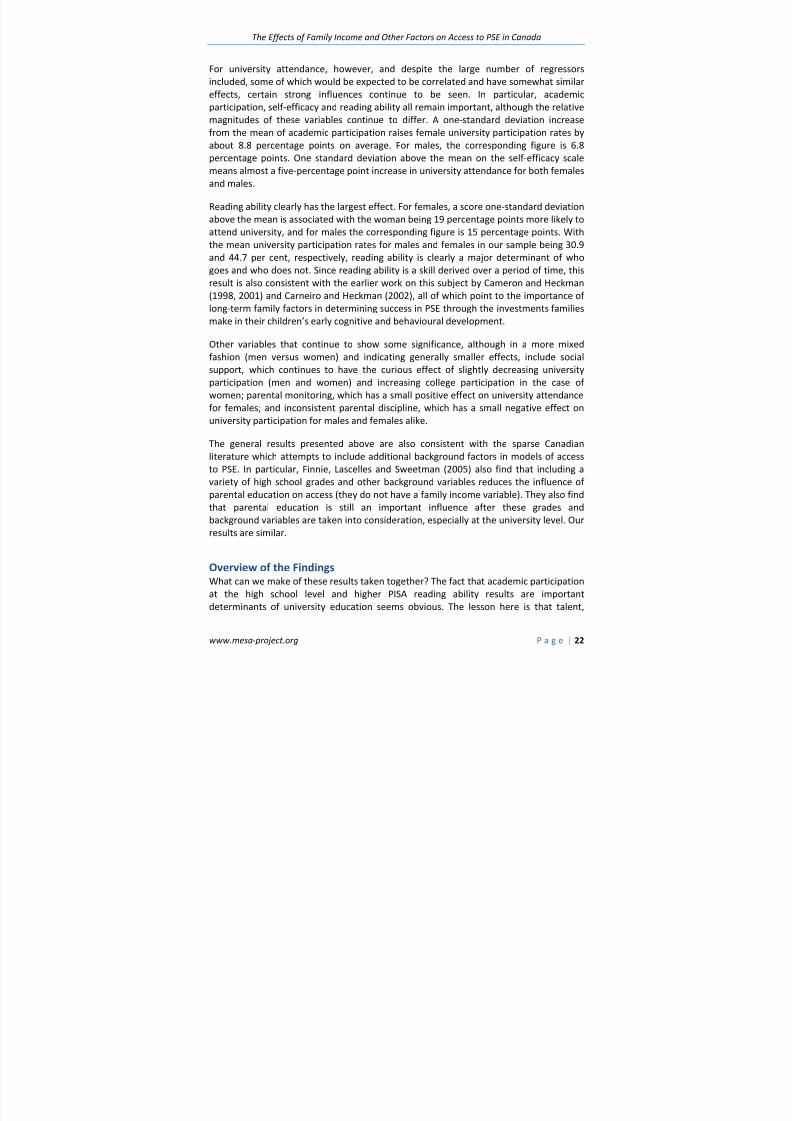
condensed form in Tables 2a and 2b (males and females, respectively). The baseline
results from the full model estimated in Table 1 are also included to facilitate the
relevant comparisons.

8/7/2019 Finnie & Mueller, 2008-The Effects of Family Income
http://slidepdf.com/reader/full/finnie-mueller-2008-the-effects-of-family-income 18/52
The Effects of Family Income and Other Factors on Access to PSE in Canada
www.mesa ‐ project.org P a g e | 18
The overall high school average grade (numerical score) has a negative effect on college
participation and a positive effect on university participation. The estimates suggest that
a ten ‐ percentage point higher grade average will result in about a three ‐ percentage
point decrease in college attendance, but about a 21 percentage point increase in
university participation. Thus, higher grades shift the distribution of PSE participation
from college to university, with a strong net increase in PSE participation. These results
are almost identical for both females and males. 5
High school grades in each of math, language, and science (also numerical scores), also
yield coefficients of the same sign, although of smaller magnitudes, suggesting that it is
overall grades, rather than any individual grade, that is important in determining
participation in university or college. Indeed, when the model is estimated with all
grades included (column 5), it is the overall grade that is of paramount importance in
determining university attendance.
An interesting particular result is that the math grade is numerically the least important
in determining university attendance, whether the variable enters the model
individually or jointly with the other grade variables. The lack of numeracy skills (at least
as reflected by the math grade) does not appear to be as important as the language
grade in any of the specifications for either sex. Of course this result could change if we
were to look at specific area of study, with math grades likely to be related to entry into
the sciences, engineering, and other disciplines which depend more on the related skill
sets.
Another interesting result is that the effects of parental income remain relatively
unchanged when high school grades are included, whereas the effect of parental
education is attenuated, in some cases significantly so, in both the cases of males and
females. For example, the effect of having parents who are a university graduate on
males’ university attendance declines from 45.1 percentage points in the model with no
grade variables (the “Baseline” results), to 24.2 percent when they are all included
(column 5). For women, the change is from 37.2 percent to 19.9 percent. These results
suggest that the influence of parental education works, at least in part, through high
school grades, whereas income is capturing something other than this – indeed, perhaps
a “pure” income effect (an inference which is strengthened by the results which follow).
This finding is interesting to compare to what is reported in Carneiro and Heckman,
2002 (and in other work by Heckman and various co ‐ authors). They find that the
significant effects of family income on U.S. college attendance (“university” for us) are
5 Categorical grades were also tried in place of the continuous numerical grades in these two tables (e.g., 50-60%, 60-70%, etc.). The results were essential the same as those presented here; those with higher grades were less likely toparticipate in college but more likely to participate in university. The numerical grades used here were set at the means of these categorical variables (e.g., 60-70 per cent equals 65 per cent, etc.). Appendix Table A-2 contains details of thegrade distributions. Grades were also entered as a quadratic in the model. Again, there were no important differences withthe results presented here.

8/7/2019 Finnie & Mueller, 2008-The Effects of Family Income
http://slidepdf.com/reader/full/finnie-mueller-2008-the-effects-of-family-income 19/52
The Effects of Family Income and Other Factors on Access to PSE in Canada
www.mesa ‐ project.org P a g e | 19
largely eliminated once an IQ test score obtained when the person was in his or her mid
teens is included in the model. Their interpretation – in a context where they do not
include parental education in their models – is that family income is, in the absence of the test score, proxying a family’s inputs to the child’s schooling and other such
influences. Our finding of a reduced parental education effect as high school grades are
added presumably stems from a similar set of relationships, except that it is the effects
of parental education on a child’s high school outcomes which is being captured when
grades are omitted from the model, rather than the effects of family income on these.
Meanwhile, our finding of an enduring income effect suggests money might be
mattering at the point of entry into PSE in a way Heckman and Carneiro did not find.
Adding the Scale Variables
The YITS also includes a set of “scale” variables, which are indices derived from batteries
of questions designed to measure various aspects of a person’s engagement in high
school, self ‐ esteem, parental behaviours, etc. A full description of these variables, which
are based on data collected in the first survey when the individuals in the sample were
age ‐ 15, can be found in Appendix Table A‐ 3. Accompanying summary statistics are
contained in Table A‐ 4.
These variables, with the exception of reading ability (see below), are normalized at
mean zero and a standard deviation of one. This is important to keep in mind when
interpreting the results below. 6 The influence of these scale variables on college and
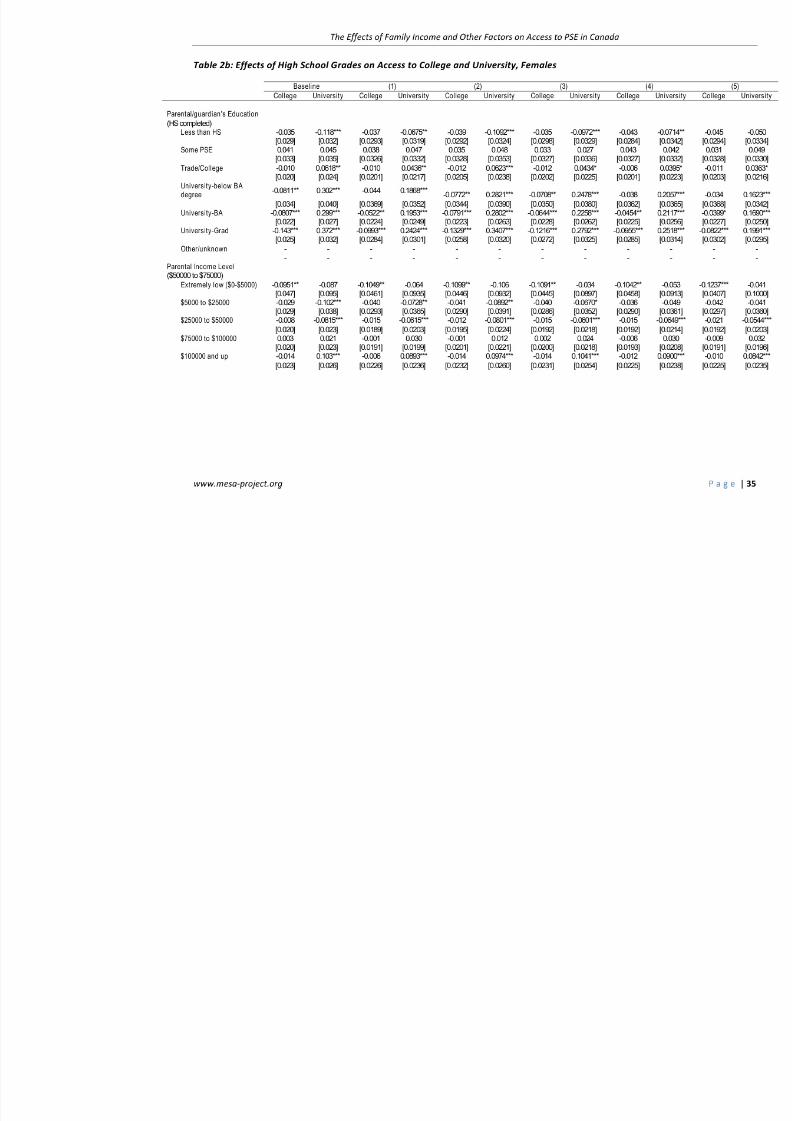
university attendance is reported in Tables 3a and 3b for males and females. These are
again entered into the basic model individually and then jointly in the final column of these tables. 7
Each of the three high school engagement variables (as well as the two subcategories
that comprise the academic engagement variable – academic identification and
academic participation) is positively related to university attendance, but has little
influence on college attendance.
The most important of these is academic participation (a measure of attending school,
doing homework, etc.) which is important on its own and also as comprising one ‐ half of the academic engagement variable, which is a simple average of academic participation
and academic identification, the latter being basically a measure of valuing and
belonging at school. For females, being one standard deviation above the mean on this
academic participation scale increases university attendance by about 13.9 percentage
6 The variables also tend to have substantial distributions (Appendix Table A-4), indicating that they are indeed capturingsomething, which is of course reflected in the significant effects they seem to carry as seen in the results which follow.
7 To check for non-linearities, separate estimates were conducted using both a quadratic specification of the scalevariables as well as categorical dummy variables. As with the case of high school grades, there are no importantdifferences between these results and the results reported here.

8/7/2019 Finnie & Mueller, 2008-The Effects of Family Income
http://slidepdf.com/reader/full/finnie-mueller-2008-the-effects-of-family-income 20/52
The Effects of Family Income and Other Factors on Access to PSE in Canada
www.mesa ‐ project.org P a g e | 20
points, and for males the figure is about 10.6 percentage points. Thus, students who
attend class regularly, complete assignments on time, and spend more time studying,
are much more likely to attend university than those who do not have these habits. The
academic identification effects are significant, but a little weaker, in the 6 ‐ 7 percent
effect range.
In addition, the influence of parental education declines in importance once academic
participation is included, suggesting that the two variables are positively correlated,
presumably because parents with more education tend to teach their children to have
good work habits and so on – or because they otherwise purchase the inputs
(extracurricular activities, clubs, etc.) that build these behaviours, or because they
otherwise transfer or generate the attributes that build academic participation.
Social engagement reflects the degree to which an individual feels accepted, respected
and included in the high school environment, and although it is positively related to
university participation for both males and females, the effects are relatively weak.
Those who are one standard deviation above the mean on this measure, for example,
are about two percentage points more likely to attend university. The measure has no
significant effect on college attendance.
Self ‐ perception would also seem to be an important determinant of PSE participation.
Self ‐ perception is captured by three separate variables: self ‐ esteem is a measure of self ‐worth and self ‐ acceptance, self ‐ efficacy is the student’s own perception of his or her
competence and confidence in performing class work, and self ‐ mastery is a measure of being in control of one’s own destiny. Students who scored high on any or all of these
measures might be more prepared to enter PSE, and the results in fact show that all
three are positively and significantly correlated with university – but not college –
attendance, at least when entered individually. Self ‐ efficacy, however, has the largest
effect for both males and females, about twice the impact of the other two measures.
Social support is statistically important for males, but the coefficient estimates are
relatively small, and the variable is not significant for females. These results thus suggest
that those who look to improving these elements of a young person’s situation as a
means of causing more of them to enrol in PSE would, therefore, appear to have the
odds stacked against them in terms of getting significant results with any such
strategies.
Parental behaviour is divided into three subcategories: “monitoring behaviour”
addresses how well parents feel informed about the activities of their children, while
“nurturance behaviour” and “inconsistent discipline” are both self ‐ explanatory. Of these, monitoring behaviour is positively related to university attendance for both males
and females, while nurturing is important only for males. Neither has any influence on
college participation. Finally, inconsistent discipline is negatively related to participation
in university for both sexes but again is not related to college participation. The

8/7/2019 Finnie & Mueller, 2008-The Effects of Family Income
http://slidepdf.com/reader/full/finnie-mueller-2008-the-effects-of-family-income 21/52
The Effects of Family Income and Other Factors on Access to PSE in Canada
www.mesa ‐ project.org P a g e | 21
magnitudes of these influences lay in the 2 ‐ 3 percentage range (university attendance)
where significant, less where not (not surprisingly).
Reading ability is an extraordinarily important correlate of PSE participation. This
variable has a mean of 500 and a standard deviation of 100 and was created from the
cross ‐ national Programme for International Student Assessment (PISA) reading test
results. The point estimates show that females who were one ‐ standard deviation above
the mean were, on average, 23 ‐ percentage points more likely of attending university
(and just slightly less likely to attend college). For males, the corresponding figure is 18 ‐
percentage points.
Of note here is the fact that the effects of parental education do not change very much
when the scale variables are added, implying that these variables are not highly related
in their effects. The exceptions to this are academic participation, self ‐ efficacy, and
reading ability in the case of university participation. In the first two instances the
effects of parental education declines to a moderate degree, while the inclusion of the
reading score decreases the value of parental education at the bachelor’s and graduate
levels (for example) by approximately one ‐ third for both males and females (compare
columns 1 and 13 in Tables 3a and 3b). The PISA reading score is a standardized test and
these results are again comparable to those obtained by Carneiro and Heckman (2002)
who also use standardized test scores to explain differences in college attendance in the
United States.
It is important to note that the PISA scores are based on actual tests, whereas the high
school grades (such as those shown in Tables 2a and 2b) are self ‐ reported. Finnie and
Meng (2005) have shown that these types of test score measures of skill perform better
than self ‐ assessments of skill. In particular, they use literacy as an example using both
types of measures (i.e., test scores and self ‐ reported ability), and find that the self ‐assessed measure tends to lead to a significant underestimation of the effect of literacy
on employment compared to the test measure. In the present work, this bias may also
be present, as indicated by the greater estimated effect and associated decrease in the
magnitude of the parental education variable (mainly at the BA and graduate school
levels) when the standardized test score is included (Tables 3) versus when the self ‐assessed measure of ability are included in the models (Tables 2).8
When all these scale variables are considered together (column 15 in the tables), the
results continue to suggest relatively little influence on college participation – hardly
surprising given the general lack of impact when entered individually.
8 One only needs to compare the decline in the BA and graduate school coefficient values in Tables 2 and Tables 3 whenmeasures of reading ability are included. In the former case (column 3 of Tables 2a and 2b), it is the main language gradeof the last year in high school (self-reported) which is included whereas in the latter case (column 13 of Tables 3a and 3b)it is the administrative PISA reading test score which is used. Inclusion of the self-reported measure results in a modestdecline in the influences of parental education, whereas in the latter case these drops are quite dramatic.
8/7/2019 Finnie & Mueller, 2008-The Effects of Family Income
http://slidepdf.com/reader/full/finnie-mueller-2008-the-effects-of-family-income 22/52
The Effects of Family Income and Other Factors on Access to PSE in Canada
www.mesa ‐ project.org P a g e | 22
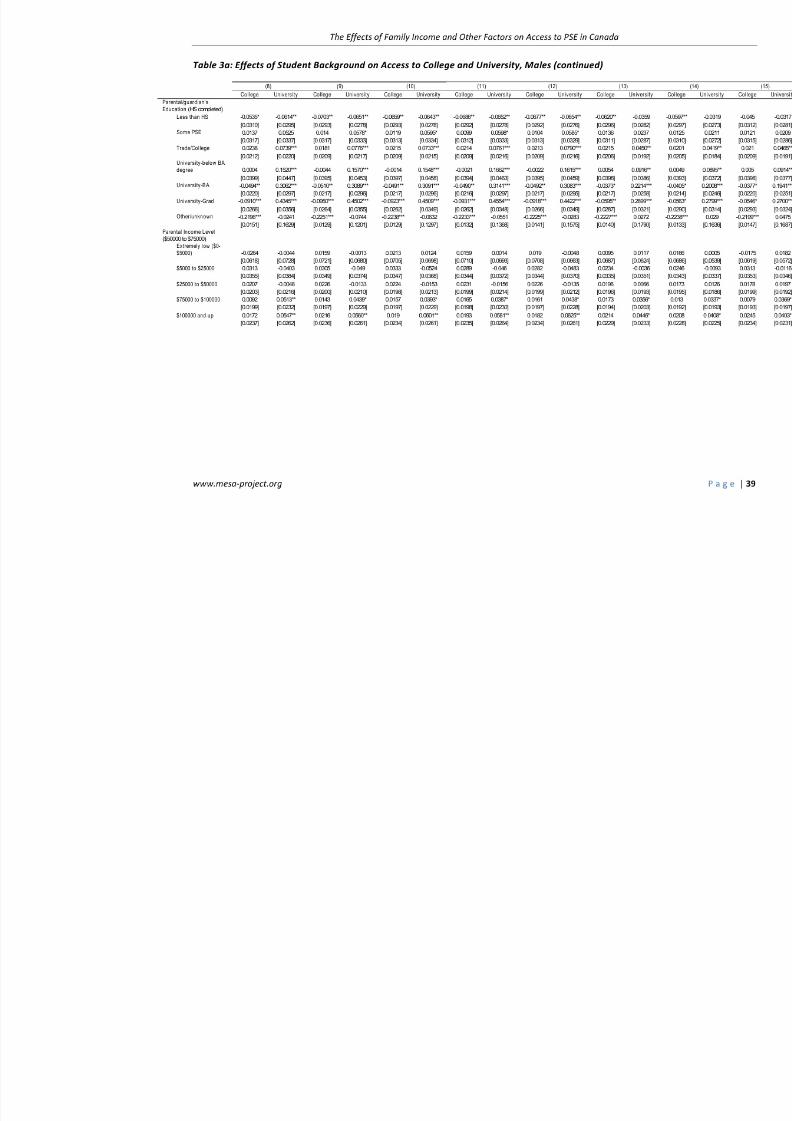
For university attendance, however, and despite the large number of regressors
included, some of which would be expected to be correlated and have somewhat similar
effects, certain strong influences continue to be seen. In particular, academic
participation, self ‐ efficacy and reading ability all remain important, although the relative
magnitudes of these variables continue to differ. A one ‐ standard deviation increase
from the mean of academic participation raises female university participation rates by
about 8.8 percentage points on average. For males, the corresponding figure is 6.8
percentage points. One standard deviation above the mean on the self ‐ efficacy scale
means almost a five ‐ percentage point increase in university attendance for both females
and males.
Reading ability clearly has the largest effect. For females, a score one ‐ standard deviation
above the mean is associated with the woman being 19 percentage points more likely to
attend university, and for males the corresponding figure is 15 percentage points. With
the mean university participation rates for males and females in our sample being 30.9
and 44.7 per cent, respectively, reading ability is clearly a major determinant of who
goes and who does not. Since reading ability is a skill derived over a period of time, this
result is also consistent with the earlier work on this subject by Cameron and Heckman
(1998, 2001) and Carneiro and Heckman (2002), all of which point to the importance of long ‐ term family factors in determining success in PSE through the investments families
make in their children’s early cognitive and behavioural development.
Other variables that continue to show some significance, although in a more mixed
fashion (men versus women) and indicating generally smaller effects, include social
support, which continues to have the curious effect of slightly decreasing university
participation (men and women) and increasing college participation in the case of
women; parental monitoring, which has a small positive effect on university attendance
for females; and inconsistent parental discipline, which has a small negative effect on
university participation for males and females alike.
The general results presented above are also consistent with the sparse Canadian
literature which attempts to include additional background factors in models of access
to PSE. In particular, Finnie, Lascelles and Sweetman (2005) also find that including a
variety of high school grades and other background variables reduces the influence of parental education on access (they do not have a family income variable). They also find
that parental education is still an important influence after these grades and
background variables are taken into consideration, especially at the university level. Our
results are similar.
Overview of the Findings
What can we make of these results taken together? The fact that academic participation
at the high school level and higher PISA reading ability results are important
determinants of university education seems obvious. The lesson here is that talent,

8/7/2019 Finnie & Mueller, 2008-The Effects of Family Income
http://slidepdf.com/reader/full/finnie-mueller-2008-the-effects-of-family-income 23/52
The Effects of Family Income and Other Factors on Access to PSE in Canada
www.mesa ‐ project.org P a g e | 23
working hard and being responsible about one’s studies is important. These effects are
also clearly related to parental education (especially parents with a BA or above) as the
coefficients on these variables indicate that they are less important (direct)
determinants of university participation when these other background variables are
added to the model.
The transmission mechanism from parent to child, however, cannot be ascertained from
our estimates. Do highly educated parents push their children harder, provide them
with more and/or better developmental inputs, or are reading ability and academic
work habits transmitted by some other mechanism? Indeed, is there a pure (genetic)
heritability component to these relationships? Understanding these relationships and
mechanisms would, of course, be a useful line for further research, using the YITS data
or other kinds of analysis.
The generally small and often insignificant coefficients on the parental behaviour
variables seem to provide some supporting evidence for the kinds of explanation that
lay beyond parents simply pushing their children to do better or providing them with
richer developmental experiences. In any case, our results do underline the importance
of family background and natural skill endowments as emphasized by Cameron and
Heckman (2001), Keane and Wolpin (2001), and Carneiro and Heckman (2002), to name
but three of the relevant recent studies.
Finally, the models all point to a smaller, but robust, direct/independent effect of family
income on access to PSE, regardless of what other explanatory variables are added to
the model – after the estimated influence decline sharply with the addition of the
parental education variables. Family income is not, it seems, just capturing inputs to a
child’s development or the other kinds of influences which our fuller models are able to
control for. Again, the precise manner in which family income directly affects access to
PSE remains beyond the scope of this paper.

8/7/2019 Finnie & Mueller, 2008-The Effects of Family Income
http://slidepdf.com/reader/full/finnie-mueller-2008-the-effects-of-family-income 24/52
The Effects of Family Income and Other Factors on Access to PSE in Canada
www.mesa ‐ project.org P a g e | 24
Conclusions and Policy Implications
This research has addressed how various background factors are related to college and
university in Canada, and a number of interesting results have been found. Most
important, probably, is that that our findings agree with the increasingly common result
found in the literature that the impact of parental income is greatly reduced once a
broader set of explanatory variables are added to the model. In our case, the greatest
part of the decline occurs when parental education is included. In other words, parental
education – and the various influences to which parental education appears to be
related (such as a child’s reading ability in high school) – and not parental income is
what largely drives young people to attend PSE in general, and university in particular.
That being said, a smallish “pure” (direct) income effect remains. Our other major
findings are as follows.
First, a major determinant of university participation is the individual’s score on the
reading portion of the cross ‐ country PISA test – probably our best measure of overall/general “ability,” while also representing a particular skill set (i.e., literacy).
Second, overall high school grades, as well as the three subject grades under
consideration, also tend to be positively correlated with university attendance, and
more weakly, negatively correlated with college attendance (as students with higher
grades evidently shift their PSE participation from college to university). Furthermore, it
is the overall high school grade, rather than any individual subject grade, which has the
largest influence. This is an interesting result since it is often assumed that language arts
and mathematics grades are the most important determinants of academic success.
Still, our result makes sense in light of the fact that most students take a general studies
program upon entering university, so it is not surprising that a comparably general
credential is the most important determinant of PSE participation at that level. These
results also make sense given the structure of the university and college systems in
Canada; the former is more exclusive, with admission being based on high school
grades, while the latter is generally characterised by more open admission policies.

8/7/2019 Finnie & Mueller, 2008-The Effects of Family Income
http://slidepdf.com/reader/full/finnie-mueller-2008-the-effects-of-family-income 25/52
The Effects of Family Income and Other Factors on Access to PSE in Canada
www.mesa ‐ project.org P a g e | 25
Third, engagement at high school, especially academic participation, which essentially
relates to an individual’s work habits, is also a significant determinant of university (but
not college) participation. In fact, it is the most important of all the engagement
variables, although self ‐ efficacy (or a feeling of competence and confidence at school) is
also significant.
Fourth, when high school grades, academic participation, or the reading score on the
PISA are added to the basic model, the direct effect of parental education is diminished,
but is far from eliminated, and remains an important (independent) determinant of access to PSE, especially university. The largest drop in the parental education effect
comes from the inclusion of the PISA reading ability score, probably the most reliable
indicator of ability among the background variables included in the model (many of which are self ‐ reported).
In other words, parental education appears to work through these other sets of variables (reading ability, course grades, student behaviours, etc.) to influence access to
PSE. We cannot, however, identify from these estimates the precise path that this
influence takes. It could be the result of highly educated parents expecting more of their
children, teaching their children better work habits, providing them with more and
better developmental inputs, shaping their preferences for PSE and the sorts of careers
and lifestyles it entails, or it could be due to some other inputs or other characteristic
passed on from parent to child which are correlated with parental education, but not
observed nor controlled for in the estimates. Further disentangling these relationships
would clearly an important avenue for future research.
The policy implications of this research are not straightforward. Parental education is
correlated with other background variables that are themselves important determinants
of PSE participation. It is unrealistic to expect policy to change the exigent level of parental education, although policy could influence its level for today’s young people for
when they themselves are parents. Therefore, the short ‐ term policy focus must be on
the factors to which parental education is related, as well as the other direct influences
on access to PSE identified in our models, such as reading ability, academic
participation, and high school grades.
Still, this may not be as simple as it seems. Current research in this area (Cunha, et al.,
2006; Cunha and Heckman, 2007) rejects the idea that economic outcomes such as
access to higher education can be adequately explained using an additive
nature/nurture dichotomy. Rather the acquisition of skills is complex and involves the
interaction between cognitive, non ‐ cognitive and environmental influences.
Furthermore, investment in skill formation feeds on past investments in the same. Yet

8/7/2019 Finnie & Mueller, 2008-The Effects of Family Income
http://slidepdf.com/reader/full/finnie-mueller-2008-the-effects-of-family-income 26/52
The Effects of Family Income and Other Factors on Access to PSE in Canada
www.mesa ‐ project.org P a g e | 26
although it is investments early in life which have the highest rate of return, the lack of these investments can (at least in part) be overcome by investments later in life.9
According to Heckman (2000) cognitive abilities (as measured by IQ) may peak early in
life and remain stable after about age 10, but other abilities such as motivation, self ‐
discipline, and social skills can be enhanced at later ages. These are factors which more
or less correspond to the variables included in the present research which are positively
related to university access. This implies that even those individuals with a low
probability of PSE participation based on family background may be able to overcome
this obstacle with the development of complementary skills as they move through
childhood and into adolescence. It is the processes by which these complementary skills
are acquired after ten years of age, but before the PSE decision is made, that would
provide a most useful avenue of research in the medium ‐ term, as policy makers ponder
the question of bringing today’s post ‐ primary school students into PSE.
And it is perhaps here where new resources need to be principally targeted if access
patterns are to be significantly changed, rather than – for example – continuing to focus
on student financial aid. Adequate student aid is certainly a critical element of any
access policy, but it is only one of many, and students need to i) be prepared for PSE, and ii) want to go to PSE before any aid policy can facilitate the resulting choices for
entering the system. And it seems likely from this research and what others have been
reporting of late that any gains in this respect will have to focus on more fundamental
issues, and developments earlier in a person’s life, rather than simply provide enough
financial support at the point a person may choose to enter the system.
9 Heckman and Masterov (2007: 6) note:” Gaps in college attendance across socioeconomic groups are largely shaped by abilities
formed in the early years. Gaps in child ability across families of different income levels are associated with parental environments
and parenting practices. Early interventions can partially remediate these deficits. Later interventions are much less effective.”
Heckman (2007) also extensively discusses this factors associated with this participation gap between socioeconomic groups.

8/7/2019 Finnie & Mueller, 2008-The Effects of Family Income
http://slidepdf.com/reader/full/finnie-mueller-2008-the-effects-of-family-income 27/52
The Effects of Family Income and Other Factors on Access to PSE in Canada
www.mesa ‐ project.org P a g e | 27
References
Barr, N. (1993). Alternative Funding Resources for Higher Education. The Economic
Journal, 103 (418), 718 ‐ 728.
Cameron, S.V., & Heckman, J.J. (1998). Life Cycle Schooling and Dynamic Selection Bias:
Models and Evidence for Five Cohorts of American Males. Journal of Political Economy,
106 (2), 262 ‐ 333.
Cameron, S. V.,& Heckman, J.J. (2001). The Dynamics of Educational Attainment for
Black, Hispanic, and White Males. Journal of Political Economy, 109 (3), 455 ‐ 99.
Carneiro, P., & Heckman, J.J. (2002). The Evidence on Credit Constraints in Post ‐
Secondary Schooling. The Economic Journal, 112 (482), 705 ‐ 34.
Chapman, B. (1997). Conceptual Issues and the Australian Experience with Income
Contingent Charges for Higher Education. The Economic Journal, 107 (442), 738 ‐ 51.
Christophides, L.N., Cirello, J. & Hoy, M. (2001). Family Income and Post ‐ Secondary
Education in Canada. Canadian Journal of Higher Education , 31 (1), 177 ‐ 208.
Coelli, M. (2005). Tuition, Rationing and Inequality in Post ‐ Secondary Education
Attendance. University of British Columbia Working Paper.
Corak, M., Lipps, G. & Zhao, J. (2003). Family Income and Participation in Post ‐ Secondary
Education.
Analytical
Studies
Research
Paper,
Number
210.
Ottawa,
ON:
Statistics
Canada.
Cunha, F., Heckman, J.J., Lochner, L., & Masterov, D.V. (2006). Interpreting Evidence of Life Cycle Skill Formation. In E.A. Hanushek & F. Welch (Ed.), Handbook of the Economics
of Education (Vol. 1, pp. 697 ‐ 812). New York, NY: Elsevier.

8/7/2019 Finnie & Mueller, 2008-The Effects of Family Income
http://slidepdf.com/reader/full/finnie-mueller-2008-the-effects-of-family-income 28/52
The Effects of Family Income and Other Factors on Access to PSE in Canada
www.mesa ‐ project.org P a g e | 28
Cunha, F., & Heckman, J.J. (2007). The Technology of Skill Formation. American
Economic Review, Papers and Proceedings, 97 (2), 31 ‐ 47.
Drolet, M. (2005). Participation in Post ‐ secondary Education in Canada: Has the Role of Parental Income and Education Changed over the 1990s? Analytical Studies Branch
Research Paper Series, Number 243. Ottawa, ON: Statistics Canada.
Ermisch, J., & Francesconi, M. (2001). Family Matters: Impacts of Family Background on
Educational Attainments. Economica, 68 (270), 137 ‐ 56.
Finnie, R., Lascelles, E., & Sweetman, A. (2005). Who Goes? The Direct and Indirect
Effects of Family Background on Access to Postsecondary Education. In Beach, C. M.,
Boadway, R. W., & McInnis, R. M. (Ed.), Higher Education in Canada (pp. 295 ‐ 338).
Montreal and Kingston: McGill‐ Queen’s University Press.
Finnie, R., & Meng, R. (2005). Literacy and Labour Market Outcomes: Self ‐ assessment
versus Test Score Measures. Applied Economics, 37 (17), 1935 ‐ 51.
Frenette, M. (2005). The Impact of Tuition Fees on University Access: Evidence from a
Large ‐ scale Price Deregulation in Professional Programs . Analytical Studies Research
Paper Series, Number 263. Ottawa, ON: Statistics Canada
Frenette, M. (2007). Why are Youth from Lower ‐ income Families Less Likely to Attend
University? Evidence from Academic Abilities, Parental Influences, and Financial
Constraints. Analytical Studies Research Paper Series, Number 295. Ottawa, ON:
Statistics Canada.
Heckman, J.J. (2000). Policies to Foster Human Capital. Research in Economics, 54 (1), 3 ‐
56.
Heckman, J.J. (2007). The Economics, Technology and Neuroscience of Human Capability
Formation. NBER Working Paper No. 13195 .
Heckman, J.J., & Masterov, D.V. (2007). The Productivity Argument for Investing in
Young Children. NBER Working Paper No. 13016 .
Junor, S., & Usher A. (2004). The Price of Knowledge 2004: Access and Student Finance in
Canada . Montreal: The Canadian Millennium Scholarship Foundation.
Keane, M.P. (2002). Financial Aid, Borrowing Constraints, and College Attendance:
Evidence from Structural Estimates. American Economic Review, Papers and
Proceedings, 92 (2), 293 ‐ 7.
Keane, M.P., & Wolpin K.I. (2001). The Effect of Parental Transfers and Borrowing
Constraints on Education Attainment. International Economic Review, 42 (4), 1051 ‐ 1103.

8/7/2019 Finnie & Mueller, 2008-The Effects of Family Income
http://slidepdf.com/reader/full/finnie-mueller-2008-the-effects-of-family-income 29/52
The Effects of Family Income and Other Factors on Access to PSE in Canada
www.mesa ‐ project.org P a g e | 29
Murray, C. (2002). IQ and Income Inequality in a Sample of Sibling Pairs from
Advantaged Family Backgrounds. American Economic Review, Papers and Proceedings,
92 (2), 339 ‐ 43.
Plug, E., & Vijverberg, W. (2003). Schooling, Family Background, and Adoption: Is it
Nature or is it Nurture?. Journal of Political Economy, 111 (3), 611 ‐ 41.
Restuccia, D., & Urrutia, C. (2004). Intergenerational Persistence in Earnings: The Role of Early and College Education. American Economic Review, 94 (5), 1354 ‐ 78.
Sacerdote, B. (2002). The Nature and Nurture of Economic Outcomes. American
Economic Review, Papers and Proceedi ngs, 92 (2), 344 ‐ 48.

8/7/2019 Finnie & Mueller, 2008-The Effects of Family Income
http://slidepdf.com/reader/full/finnie-mueller-2008-the-effects-of-family-income 30/52
The Effects of Family Income and Other Factors on Access to PSE in Canada
www.mesa ‐ project.org P a g e | 30
Tables

8/7/2019 Finnie & Mueller, 2008-The Effects of Family Income
http://slidepdf.com/reader/full/finnie-mueller-2008-the-effects-of-family-income 31/52

8/7/2019 Finnie & Mueller, 2008-The Effects of Family Income
http://slidepdf.com/reader/full/finnie-mueller-2008-the-effects-of-family-income 32/52
The Effects of Family Income and Other Factors on Access to PSE in Canada
www.mesa ‐ project.org
Table 1: Multinomial Logit Estimates of Access to College and University (continued) Males
(1) (2) (1) College University College University College Univ
Visible Minority & Canadian by immigration(others)-0.0122 -0.112** -0.0188 -0.0682 0.000965 -0.0898 [0.055] [0.046] [0.054] [0.053] [0.063] [0.062]
Parental/guardian's Education(HS completed)Less than HS -0.0691** -0.0676**
[0.029] [0.027] Some PSE 0.0119 0.0585*
[0.031] [0.033] Trade/College 0.0212 0.0761***
[0.021] [0.022] University-below BAdegree -0.00123 0.163***
[0.039] [0.046] University-BA -0.0488** 0.312***
[0.022] [0.030] University-Grad -0.0922*** 0.451***
[0.026] [0.035] Other/unknown - -
- - Parental Income Level($50000 to $75000)
Extremely low ($0-$5000) 0.015 -0.0209 0.0159 0.00268 -0.101** -0.0773 [0.071] [0.080] [0.071] [0.069] [0.046] [0.097]
$5000 to $25000 0.016 -0.108*** 0.03 -0.0481 -0.0226 -0.191*** [0.033] [0.034] [0.035] [0.037] [0.029] [0.036]
$25000 to $50000 0.0198 -0.0567*** 0.0228 -0.0134 -0.00074 -0.124*** [0.020] [0.022] [0.020] [0.021] [0.019] [0.023]
$75000 to $100000 0.00145 0.110*** 0.0167 0.0401* -0.0121 0.0659*** [0.019] [0.025] [0.020] [0.023] [0.020] [0.024]
$100000 and up -0.0105 0.191*** 0.0191 0.0601** -0.0526** 0.198*** [0.022] [0.028] [0.023] [0.026] [0.022] [0.025]
Observations 7852 7852 8311
Notes: Average marginal effects are shown. Omitted categories are in parenthesis. Standard errors are in brackets. *** p<0.01, ** p<0.05,

8/7/2019 Finnie & Mueller, 2008-The Effects of Family Income
http://slidepdf.com/reader/full/finnie-mueller-2008-the-effects-of-family-income 33/52

8/7/2019 Finnie & Mueller, 2008-The Effects of Family Income
http://slidepdf.com/reader/full/finnie-mueller-2008-the-effects-of-family-income 34/52
The Effects of Family Income and Other Factors on Access to PSE in Canada
www.mesa ‐ project.org
Table 2a: Effects of High School Grades on Access to College and University, Males (continued)
Baseline (1) (2) (3) College University College Universit y College Universit y College Universi ty
Overall grade of last year HS (numerical) -0.0033*** 0.0211***
[0.0008] [0.0006]
Math grade of last year HS (numerical) -0.0012** 0.0101***
[0.0006] [0.0006]
Main language grade of last year HS (numerical) -0.0024*** 0.0137***
[0.0007] [0.0006]
Science grade of HS(numerical) -0.001[0.00
Observations 7852 7677 7626 7643
Notes: Average marginal effects are shown. Omitted categories are in parenthesis. Controls include all those in Table 1. Standard errors a p<0.1. Full results are available upon request.
8/7/2019 Finnie & Mueller, 2008-The Effects of Family Income
http://slidepdf.com/reader/full/finnie-mueller-2008-the-effects-of-family-income 35/52

8/7/2019 Finnie & Mueller, 2008-The Effects of Family Income
http://slidepdf.com/reader/full/finnie-mueller-2008-the-effects-of-family-income 36/52
The Effects of Family Income and Other Factors on Access to PSE in Canada
www.mesa ‐ project.org
Table 2b: Effects of High School Grades on Access to College and University, Females (continued)
Baseline (1) (2) (3) College University College University College University College University
Overall grade of last year HS (numerical) -0.0034*** 0.0219***
[0.0008] [0.0007]
Math grade of last year HS (numerical) -0.0010* 0.0080***
[0.0005] [0.0007]
Main language grade of last year HS (numerical) -0.0013* 0.0149***
[0.0007] [0.0007]
Science grade of HS (numerical) -0.003
[0.00
Observations 8311 8204 8136 8160
Notes: Average marginal effects are shown. Omitted categories are in parenthesis. Controls include all those in Table 1. Standard errors a p<0.1. Full results are available upon request.

8/7/2019 Finnie & Mueller, 2008-The Effects of Family Income
http://slidepdf.com/reader/full/finnie-mueller-2008-the-effects-of-family-income 37/52

8/7/2019 Finnie & Mueller, 2008-The Effects of Family Income
http://slidepdf.com/reader/full/finnie-mueller-2008-the-effects-of-family-income 38/52
8/7/2019 Finnie & Mueller, 2008-The Effects of Family Income
http://slidepdf.com/reader/full/finnie-mueller-2008-the-effects-of-family-income 39/52

8/7/2019 Finnie & Mueller, 2008-The Effects of Family Income
http://slidepdf.com/reader/full/finnie-mueller-2008-the-effects-of-family-income 40/52
The Effects of Family Income and Other Factors on Access to PSE in Canada
www.mesa ‐ project.org
Table 3a: Effects of Student Background on Access to College and University, Males (continued)
(8) (9) (10) (11) (12) (College University College University College University College University College University C
HS EngagementsAcademic
identification
Academic participation
Academicengagement
Social engagement
Overall engagement
Self-perception:Self-esteem
Self-efficacy
Self-mastery 0.0085 0.0513*** [0.0071] [0.0074]
Social Support: -0.0029 0.0459*** [0.0071] [0.0078]
Parents' Behaviours:Monitoringbehaviour 0.0149* 0.0302***
[0.0077] [0.0084] Nurturancebehaviour -0.001 0.0223***
[0.0071] [0.0079] Inconsistentdiscipline(Rejection-oriented behaviour) -0.0067 -0.0357***
[0.0071] [0.0075] Reading Ability:
-0.0002** [0.0001]
Observations 7569 7774 7846 7850 7850 7844 Notes: Average marginal effects are shown. Omitted categories are in parenthesis. Controls include all those in Table 1. Standard errors a p<0.1. Full results are available upon request.

8/7/2019 Finnie & Mueller, 2008-The Effects of Family Income
http://slidepdf.com/reader/full/finnie-mueller-2008-the-effects-of-family-income 41/52

8/7/2019 Finnie & Mueller, 2008-The Effects of Family Income
http://slidepdf.com/reader/full/finnie-mueller-2008-the-effects-of-family-income 42/52
The Effects of Family Income and Other Factors on Access to PSE in Canada
www.mesa ‐ project.org
Table 3b: Effects of Student Background on Access to College and University, Females (continued)
Baseli ne (1) (2) (3) (4) (5) College University College University College University College University College University College
Self-perception:Self-esteem
Self-efficacy
Self-mastery
Social Support:
Parents' Behaviours:Monitoring behaviour
Nurturance behaviour
Inconsistent discipline(Rejection-orientedbehaviour)
Reading Ability:
Observations 8311 8311 8309 8309 8311 8309
Notes: Average marginal effects are shown. Omitted categories are in parenthesis. Controls include all those in Table 1. Standard errors a p<0.1. Full results are available upon request.

8/7/2019 Finnie & Mueller, 2008-The Effects of Family Income
http://slidepdf.com/reader/full/finnie-mueller-2008-the-effects-of-family-income 43/52

8/7/2019 Finnie & Mueller, 2008-The Effects of Family Income
http://slidepdf.com/reader/full/finnie-mueller-2008-the-effects-of-family-income 44/52
The Effects of Family Income and Other Factors on Access to PSE in Canada
www.mesa ‐ project.org
Table 3b: Effects of Student Background on Access to College and University, Females (continued)
(8) (9) (10) (11) (12) (13) College University College University College University College University College University College
Self-perception:Self-esteem
Self-efficacy
Self-mastery -0.0038 0.0548*** [0.0073] [0.0083]
Social Support:0.0170** 0.0126 [0.0070] [0.0085]
Parents' Behaviours:Monitoring behaviour -0.0032 0.0383***
[0.0080] [0.0096] Nurturance behaviour -0.0043 0.0047
[0.0073] [0.0083] Inconsistent discipline(Rejection-orientedbehaviour) -0.0044 -0.0355***
[0.0068] [0.0076] Reading Ability:
-0.0003*** 0.0023[0.0001] [0.000
Observations 8151 8254 8306 8306 8306 8304 Notes: Average marginal effects are shown. Omitted categories are in parenthesis. Controls include all those in Table 1. Standard errors a p<0.1. Full results are available upon request.

8/7/2019 Finnie & Mueller, 2008-The Effects of Family Income
http://slidepdf.com/reader/full/finnie-mueller-2008-the-effects-of-family-income 45/52
The Effects of Family Income and Other Factors on Access to PSE in Canada
www.mesa ‐ project.org P a g e | 45
Table A1: Sample Selection
Male Female% of obs.
in thestartingsample
% of lostin eachstage of
exclusion
# of obs.left
% of obs.in the
startingsample
% of lostin eachstage of
exclusion
# of obs.left
Starting sample(YITS-A participants over all 3 cycles) 10,226 10,521
QC, Territories o r Outsid e Canada
PS institution in QC 13.79 17.19
Last year of high school in QC 23.36 22.53
HS attended at cyc le1 is in QC 23.56 22.70
Ever resident in QC 23.74 22.99
Ever resident, taken HS or PSE in QC 24.13 23.72
PS institution in Territories or ou tside Canada 0.66 0.89
Last year of high schoo l in Territories or outside Canada 0.39 0.57
Ever resident in Territories or o utside Canada 0.24 0.52
Any of the above 25.00 25.00 8,415 25.03 25.03 8,713
HS continuer or status unknown 6.54 6.05 7,961 4.01 3.39 8,458
Non-Canadian citizen / immigrant status unknown 0.75 0.70 7,931 0.99 0.93 8,422
Missing values
Unknown visible minority status 0.34 0.32 7,909 0.40 0.51 8,395
PSE
Unknown level of PSE program 0.49 0.93
Unknown type of PSE institution 0.19 0.48
Unknown PSE 0.64 0.69 7,852 1.15 1.03 8,311
Missing values in s cale variablesHS Engagement
Academic identification -
Academic participation - -
Academic engagement - -
Social engagement -
Overall engagement - -
Self-perception
Self-esteem 3.47 2.20
Self-efficacy 1.32 0.77
Self-mastery 3.96 2.40
Social Support 1.14 0.89Parents' Behaviour
Monitoring behaviour - -
Nurturance behaviour - -
Inconsistent discipline(Rejection-oriented behaviour) - -
Reading Abil ity 0.14 0.19
Missing value of any s cale variable 5.64 4.91 7,426 3.76 3.70 8,049

8/7/2019 Finnie & Mueller, 2008-The Effects of Family Income
http://slidepdf.com/reader/full/finnie-mueller-2008-the-effects-of-family-income 46/52
The Effects of Family Income and Other Factors on Access to PSE in Canada
www.mesa ‐ project.org P a g e | 46
Table A1: Sample Selection (continued)
Male Female% of obs.
in thestartingsample
% of lostin eachstage of
exclusion
# of obs.left
% of obs.in the
startingsample
% of lostin eachstage of
exclusion
# of obs.left
Missing values in last year HS gradesOverall grade in last year HS 2.77 1.97
Math grade in last year HS 2.87 2.42
Main language grade in last year HS 2.80 2.10
Science grade in HS at cycle 1 8.79 6.39Missing value of any HS grade 12.82 9.42 6,685 9.46 6.62 7,486

8/7/2019 Finnie & Mueller, 2008-The Effects of Family Income
http://slidepdf.com/reader/full/finnie-mueller-2008-the-effects-of-family-income 47/52

8/7/2019 Finnie & Mueller, 2008-The Effects of Family Income
http://slidepdf.com/reader/full/finnie-mueller-2008-the-effects-of-family-income 48/52

8/7/2019 Finnie & Mueller, 2008-The Effects of Family Income
http://slidepdf.com/reader/full/finnie-mueller-2008-the-effects-of-family-income 49/52
The Effects of Family Income and Other Factors on Access to PSE in Canada
www.mesa ‐ project.org P a g e | 49
ST33Q01
ST33Q02
ST33Q03
On average, time spent each week on homework and study in these subject areas:
test language, mathematics and science, respectively.
Academic identification
Description: Measures a respondent’s academic identification with high school, the focus of attention is on two components of identification, valuing and belonging. A student
who fails to identify with school is expected to have a lack of valuing for the school
and a lack of feelings of belonging to the school.
Related Questions:
YSA8I I get along well with teachers;
YSA8J I am interested in what I am learning in class;
YSA9E School is one of the most important things in my life;
YSA9F Many of the things we learn in class are useless;
YSA9G Most of my teachers don’t really care about me YSA9H Most of the time, I would like to be any place other than in school;
YSA9J Most of what I learn in school will be useful when I get a job;
YSA9L School is often a waste of time;
YSA9M School is more important than most people think;
YSA9N Most of my teachers do a good job of teaching;
ST30Q03 Most of my teachers really listen to what I have to say;
ST30Q04 If I need extra help, I will receive it from my teachers;
ST30Q05 Most of my teachers treat me fairly;
ST31Q07 My school is a place where I do not want to go;
ST32Q06 I am giving interesting homework.
Self ‐ perception:
Self ‐ esteem
Description: The self ‐ esteem scale that was chosen for YITS is Morris Rosenberg‘s22 self ‐ esteem
scale (RSE) (Rosenberg, 1965, p.17). Rosenberg defines selfesteem as favourable or
unfavourable attitudes towards self and proposes a series of ten questions to
measure it.Within the context of YITS, RSE attempts to measure adolescents’ global
feelings of self ‐ worth or self ‐ acceptance.
Related Questions:
YSI1A I feel I am a person of worth, at least on an equal basis with others;
YSI1B I feel that I have a number of good qualities;
YSI1C All in all, I tend to feel that I am a failure;
YSI1D I am able to do things as well as most other people;
YSI1E I feel I do not have much to be proud of;
YSI1F I have a positive attitude toward myself;
YSI1G On the whole, I am satisfied with myself;
YSI1H I wish I could like myself more;
YSI1I I certainly feel useless at times;
YSI1J At times I think I am no good at all.
Self ‐ efficacy
Description: Defines academic self ‐ efficacy as the student’s competence and confidence in
performance of class work as perceived by the student. This concept should be
distinguished from global self ‐ efficacy or mastery which is the belief that one has
control over one’s own destiny.
Related Questions:
YSA8K I am certain I can understand the most difficult material presented in texts;
YSA8L I am confident I can understand the most complex material presented by teacher;
YSA8M I am confident I can do an excellent job on assignments and tests;

8/7/2019 Finnie & Mueller, 2008-The Effects of Family Income
http://slidepdf.com/reader/full/finnie-mueller-2008-the-effects-of-family-income 50/52
The Effects of Family Income and Other Factors on Access to PSE in Canada
www.mesa ‐ project.org P a g e | 50
YSA8N I am certain I can master the skills being taught Self ‐ mastery
Description: The powerlessness scale chosen by YITS is based upon the work of Pearlin and
Schooler (1978). This scale, referred to as the Mastery scale25, assesses a feeling of powerlessness without reference to concrete life situations. Mastery can be defined
as a measure that assesses “the extent to which one regards one’s lifechances as
being under one’s own control in contrast to being fatalistically ruled” (Pearlin and
Schooler, 1978). Hence, if one scores high on the mastery scale, one does not feel
powerless.
Related Questions:
YSI2A Sometimes I feel I’m being pushed around in life;
YSI2B What happens to me in the future mostly depends on me;
YSI2C There is really no way I can solve some of the problems I have;
YSI2D There is little I can do to change many of the important things in my life;
YSI2E I often feel helpless in dealing with the problems of life;
YSI2F I have little control over the things happen to me;
YSI2G I can do just about anything I really set my mind to.
Social Support:
Description: Measures the availability of social supports, via friends, family and other sources for
the youth. Three aspects are included: reliable alliance (the assurance that others can
be counted upon for practical help), attachment (emotional closeness) and guidance
(advice or information). These aspects are most directly related to problem ‐ solving
within the context of stress. Two items were proposed to measure each of these
aspects for a total of six items.
Related Questions:
YSD1A If something went wrong, no one would help me;
YSD1B I have family and friends who help me feel safe, secure and happy;
YSD1C There is someone I trust whom I would turn to for advice if I were having problems;
YSD1D There is no one I feel comfortable talking about problems with;
YSD1E There is no one I feel close to;
YSD1F There are people I can count on in times of trouble
Parents' Behaviours: Parents who are supportive of their youth’s education, who are involved in their
youth’s school and who have a firm but responsive parenting style have a positive
influence on their youth’s achievement and educational attainment. The parenting
practices scales are designed to measure three facets of parenting: nurturance,
inconsistent rejection ‐ oriented discipline (rejection) and monitoring. An overall
parenting scale was not formed from the three subscales.
Monitoring behaviour
Description: Measures parents’ monitoring behaviour. A monitoring parent is defined as one who
believes that he or she is knowledgeable about his or her child's activities,
whereabouts and friends.
Related Questions:
PB17A Know where child goes at night;
PB17D Know what child is doing when he/she goes out;
PB17G Know who child spends time with when he/she goes out.
Nurturance behaviour
Description: Measures parents’ nurturing behaviours. Nurturance represents child ‐ centered
effective parenting practices such as nurturance, involvement, and positive
reinforcement.

8/7/2019 Finnie & Mueller, 2008-The Effects of Family Income
http://slidepdf.com/reader/full/finnie-mueller-2008-the-effects-of-family-income 51/52
The Effects of Family Income and Other Factors on Access to PSE in Canada
www.mesa ‐ project.org P a g e | 51
Related Questions: Derived from the frequency with which parents:
PB17C Praise child;
PB17F Listen to child’s ideas and options;
PB17J Make sure child knows that they are appreciated;
PB17M Speak of good things those children does;
PB17O Seem proud of the things child does.
Inconsistent discipline (Rejection ‐ oriented behaviour) Description: measures parents’ inconsistent discipline or rejection ‐ oriented behaviours,
Related Questions:
PB17B Soon forget a rule that they have made;
PB17E Nag child about little things;
PB17H Keep rules only when it suits themselves;
PB17I Get angry and yell at child;
PB17L Threaten punishment more often than using it;
PB17N Enforce or do not enforce rules depending on their mood
Student's performance score in reading
Description: Weighted likelihood estimate in reading ability, which is provided for all students
who
answered
at
least
one
reading
question.
It
was
transformed
to
a
scale
with
a
mean of 500 and a standard deviation of 100 by using the data for the participating
OECD countries only (except the Netherlands).
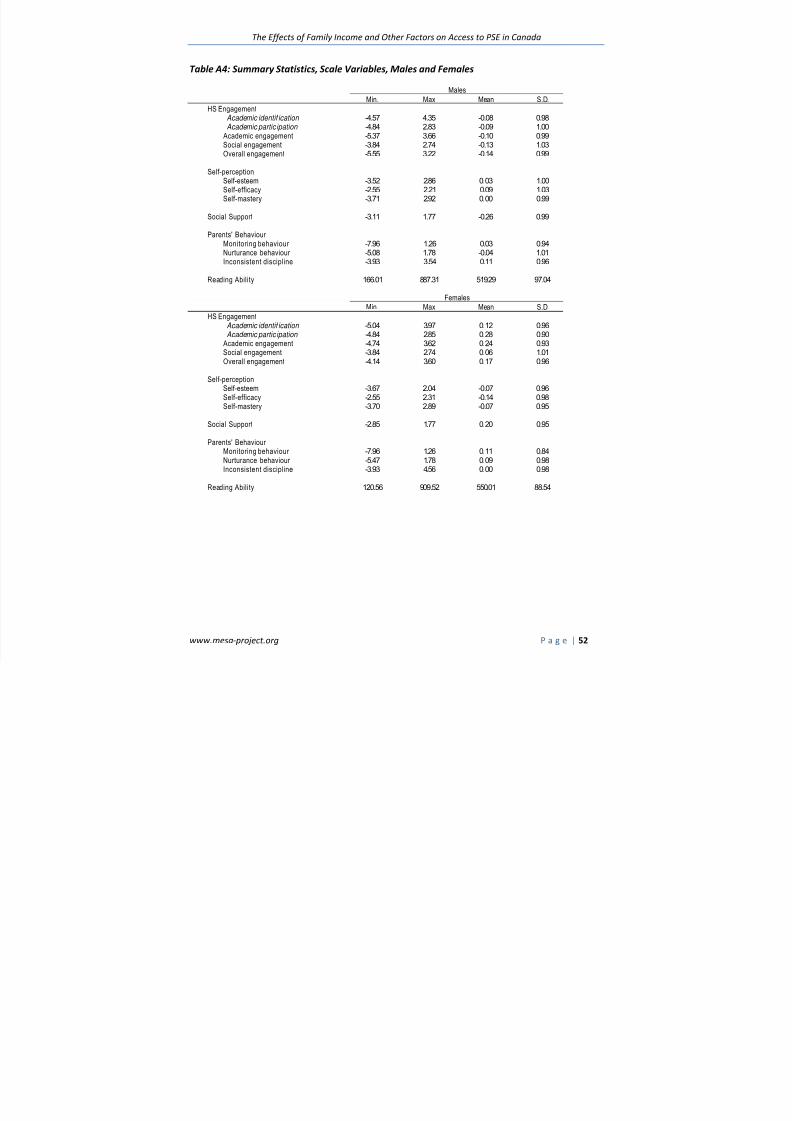
8/7/2019 Finnie & Mueller, 2008-The Effects of Family Income
http://slidepdf.com/reader/full/finnie-mueller-2008-the-effects-of-family-income 52/52
The Effects of Family Income and Other Factors on Access to PSE in Canada
Table A4: Summary Statistics, Scale Variables, Males and Females
MalesMin. Max Mean S.D.
HS EngagementAcademic identif ication -4.57 4.35 -0.08 0.98Academic partic ipation -4.84 2.83 -0.09 1.00
Academic engagement -5.37 3.66 -0.10 0.99Social engagement -3.84 2.74 -0.13 1.03Overall engagement -5.55 3.22 -0.14 0.99
Self-perceptionSelf-esteem -3.52 2.86 0.03 1.00Self-efficacy -2.55 2.21 0.09 1.03Self-mastery -3.71 2.92 0.00 0.99
Social Support -3.11 1.77 -0.26 0.99
Parents' Behaviour Monitoring behaviour -7.96 1.26 0.03 0.94Nurturance behaviour -5.08 1.78 -0.04 1.01
Inconsistent discipline -3.93 3.54 0.11 0.96Reading Ability 166.01 887.31 519.29 97.04
FemalesMin. Max Mean S.D.
HS EngagementAcademic identif ication -5.04 3.97 0.12 0.96Academic partic ipation -4.84 2.85 0.28 0.90
Academic engagement -4.74 3.62 0.24 0.93Social engagement -3.84 2.74 0.06 1.01Overall engagement -4.14 3.60 0.17 0.96
Self-perceptionSelf-esteem -3.67 2.04 -0.07 0.96
Self-efficacy -2.55 2.31 -0.14 0.98Self-mastery -3.70 2.89 -0.07 0.95
Social Support -2.85 1.77 0.20 0.95
Parents' Behaviour Monitoring behaviour -7.96 1.26 0.11 0.84Nurturance behaviour -5.47 1.78 0.09 0.98Inconsistent discipline -3.93 4.56 0.00 0.98
Reading Ability 120.56 909.52 550.01 88.54