Embed Size (px)
Citation preview

Financial statementsChapter 4.1 Financial statements 136
Statement of comprehensive income 138
Statement of financial position 139
Statement of changes in equity 140
Cash flow statement 141
Administered schedule of comprehensive income 142
Administered schedule of assets and liabilities 143
Administered reconciliation schedule 144
Administered cash flow statement 145
Notes to and forming part of the
financial statements 146
Department of Social Services Annual Report 2015–2016
136
4
Cha
pter
4.1
Fi
nanc
ial s
tate
men
ts
Department of Social Services Annual Report 2015–2016
136
4
Cha
pter
4.1
Fina
ncia
l sta
tem
ents

Part 4—Financial statements | Chapter 4: Financial statements
137
4C
hapt
er 4
.1
Fina
ncia
l sta
tem
ents
Sitting left to right, Scott Dilley (CFO), Finn Pratt (Secretary) and Grant Hehir (Auditor-General).
Standing left to right: Saminda Maddumahewa, Jane Meier, Stephen Sheehan, Kris Cala, Helen Martin, Sasha Dordevic, Jillian Sellars, Sue Shaw, Russell Deburgh, Anne McRoberts, John Riley, Deanne Jones, Ryan Delaney, Jo Penny, Julia Carden, Rod Griffiths, Rebecca Reilly, Stuart McBeth, Jenny Morison, Christopher Chiang, Denny Flack, Zi Ling Matthews, Hinson Leung, Elizabeth Blak, Nelly Kurniati, Bahareh Zadeh, Danielle Blundell, Natasha Lakhan and Lesa Craswell.
Department of Social Services
Statement by the Secretary and Chief Finance Officer
In our opinion, the attached financial statements for the year ended 30 June 2016 comply with subsection 42(2) of the Public Governance, Performance and Accountability Act 2013 (PGPA Act), and are based on properly maintained financial records as per subsection 41(2) of the PGPA Act.
In our opinion, at the date of this statement, there are reasonable grounds to believe that the Department of Social Serices (DSS) will be able to pay its debts as and when they fall due.
Finn Pratt AO PSM
Secretary
29 August 2016
Scott Dilley
Chief Finance Officer
29 August 2016
Department of Social Services Annual Report 2015–2016
138
4
Cha
pter
4.1
Fi
nanc
ial s
tate
men
ts
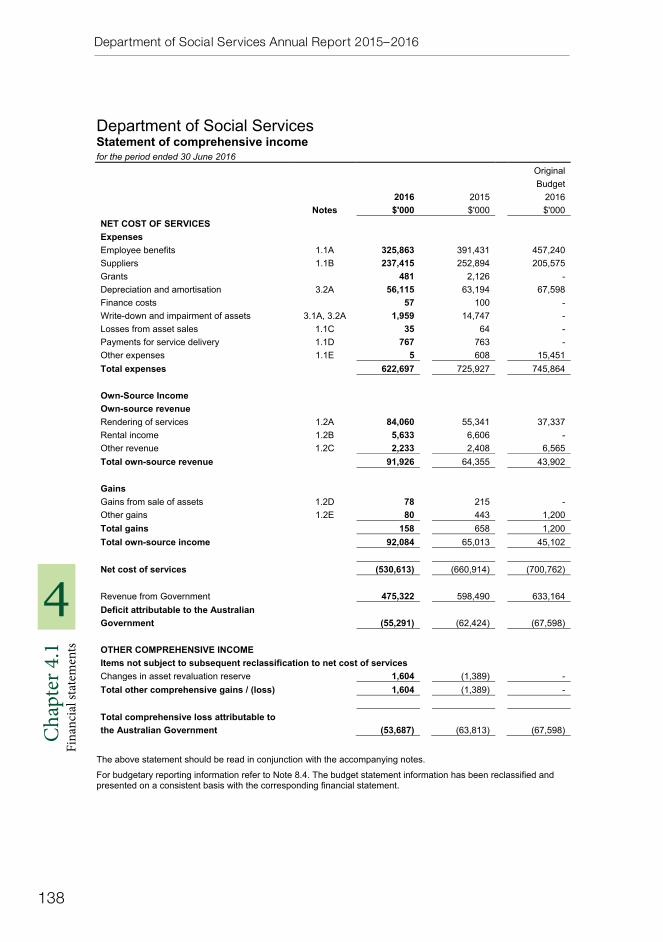
Department of Social Services Statement of comprehensive income for the period ended 30 June 2016
2016 2015
Original Budget
2016 Notes $'000 $'000 $'000
NET COST OF SERVICES Expenses Employee benefits 1.1A 325,863 391,431 457,240 Suppliers 1.1B 237,415 252,894 205,575 Grants 481 2,126 - Depreciation and amortisation 3.2A 56,115 63,194 67,598 Finance costs 57 100 - Write-down and impairment of assets 3.1A, 3.2A 1,959 14,747 - Losses from asset sales 1.1C 35 64 - Payments for service delivery 1.1D 767 763 - Other expenses 1.1E 5 608 15,451 Total expenses 622,697 725,927 745,864
Own-Source Income Own-source revenue Rendering of services 1.2A 84,060 55,341 37,337 Rental income 1.2B 5,633 6,606 - Other revenue 1.2C 2,233 2,408 6,565Total own-source revenue 91,926 64,355 43,902
GainsGains from sale of assets 1.2D 78 215 - Other gains 1.2E 80 443 1,200Total gains 158 658 1,200 Total own-source income 92,084 65,013 45,102
Net cost of services (530,613) (660,914) (700,762)
Revenue from Government 475,322 598,490 633,164 Deficit attributable to the Australian Government (55,291) (62,424) (67,598)
OTHER COMPREHENSIVE INCOME Items not subject to subsequent reclassification to net cost of services Changes in asset revaluation reserve 1,604 (1,389) - Total other comprehensive gains / (loss) 1,604 (1,389) -
Total comprehensive loss attributable to the Australian Government (53,687) (63,813) (67,598)
The above statement should be read in conjunction with the accompanying notes.
For budgetary reporting information refer to Note 8.4. The budget statement information has been reclassified and presented on a consistent basis with the corresponding financial statement.

Part 4—Financial statements | Chapter 4: Financial statements
139
4C
hapt
er 4
.1
Fina
ncia
l sta
tem
ents
Department of Social Services Statement of financial position as at 30 June 2016
2016 2015
Original Budget
2016 Notes $'000 $'000 $'000
ASSETS Financial Assets Cash and cash equivalents 5.4A 5,075 8,589 3,086Trade and other receivables 3.1A 123,052 164,371 206,272 Total financial assets 128,127 172,960 209,358
Non-Financial Assets Leasehold improvements 3.2A 14,247 31,047 31,701 Property, plant and equipment 3.2A 37,169 24,675 22,156 Intangibles 3.2A 133,478 113,619 117,133 Other non-financial assets 3.2B 23,369 18,610 14,790 Total non-financial assets 208,263 187,951 185,780
Assets held for sale 557 59 - Total assets 336,947 360,970 395,138
LIABILITIES Payables Suppliers 3.3A 34,918 34,185 26,366 Other payables 3.3B 17,270 37,936 45,157 Total payables 52,188 72,121 71,523
Provisions Employee provisions 6.1A 82,005 118,876 146,089 Other provisions 3.4A 3,189 6,504 3,963Total provisions 85,194 125,380 150,052 Total liabilities 137,382 197,501 221,575 Net assets 199,565 163,469 173,563
EQUITY Contributed equity 384,794 295,011 369,521 Reserves 67,699 66,095 58,553 Accumulated deficit (252,928) (197,637) (254,511) Total equity 199,565 163,469 173,563
The above statement should be read in conjunction with the accompanying notes.
For budgetary reporting information refer to Note 8.4. The budget statement information has been reclassified and presented on a consistent basis with the corresponding financial statement.

Department of Social Services Annual Report 2015–2016
140
4
Cha
pter
4.1
Fi
nanc
ial s
tate
men
ts
Department of Social Services Statement of changes in equity as at 30 June 2016
2016 2015
Original Budget
2016CONTRIBUTED EQUITY/CAPITAL Notes $'000 $'000 $'000Opening balance Balance carried forward from previous period 295,011 252,877 288,423 Transactions with owners Equity injection - Appropriations 66,357 16,373 66,357 Departmental capital budget 40,772 18,734 19,394 Restructuring 8.1A (17,346) 7,027 (10,029)Total transactions with owners 89,783 42,134 75,722Closing balance as at 30 June 384,794 295,011 364,145
ASSET REVALUATION RESERVE Opening balance Balance carried forward from previous period 66,095 67,484 67,484 Comprehensive income Other comprehensive income 1,604 (1,389) -Total comprehensive income 1,604 (1,389) -Closing balance as at 30 June 67,699 66,095 67,484
RETAINED EARNINGS Opening balance Balance carried forward from previous period (197,637) (135,213) (190,468)Comprehensive income Deficit for the period (55,291) (62,424) (67,598)Total comprehensive income (55,291) (62,424) (67,598)Closing balance as at 30 June (252,928) (197,637) (258,066)
TOTAL EQUITY Contributed equity 384,794 295,011 364,145Reserves 67,699 66,095 67,484Accumulated deficit (252,928) (197,637) (258,066)Closing balance as at 30 June 199,565 163,469 173,563
The above statement should be read in conjunction with the accompanying notes.
For budgetary reporting information refer to Note 8.4. The budget statement information has been reclassified and presented on a consistent basis with the corresponding financial statement.
Accounting Policy
Equity Injections
Amounts appropriated which are designated as 'equity injections' for a financial year (less any formal reductions) and Departmental Capital Budgets (DCBs) are recognised directly in contributed equity in that financial year.
Restructuring of Administrative Arrangements
Net assets received from or relinquished to another Government entity under a restructuring of administrative arrangements are adjusted at their book value directly against contributed equity.

Part 4—Financial statements | Chapter 4: Financial statements
141
4C
hapt
er 4
.1
Fina
ncia
l sta
tem
ents
Department of Social Services Cash flow statement for the period ended 30 June 2016
2016 2015
Original Budget
2016 Notes $'000 $'000 $'000
OPERATING ACTIVITIES Cash received Appropriations 576,505 674,899 637,716 Sale of goods and rendering of services 88,170 70,495 37,337 Net GST received 27,656 26,594 - Other - 7 6,618Total cash received 692,331 771,995 681,671
Cash used Employees 319,140 412,202 456,132 Suppliers 285,112 277,868 207,411 Grant payments 481 2,126 - Payments for service delivery 767 763 - Section 74 receipts transferred to Official Public Account 87,946 70,463 - Other - - 18,264 Total cash used 693,446 763,422 681,807 Net cash from / (used by) operating activities 5.4A (1,115) 8,573 (136)
INVESTING ACTIVITIES Cash received Proceeds from sales of property, plant and equipment 103 255 - Total cash received 103 255 -
Cash used Purchase of property, plant and equipment 23,513 13,667 85,751 Purchase of intangibles 61,932 46,455 - Total cash used 85,445 60,122 85,751 Net cash used by investing activities (85,342) (59,867) (85,751)
FINANCING ACTIVITIES Cash received Appropriations - Equity injections 41,636 33,826 66,357 Appropriations - Departmental capital budget 41,307 22,834 19,394 Total cash received 82,943 56,660 85,751 Net cash from financing activities 82,943 56,660 85,751
Net increase / (decrease) in cash held (3,514) 5,366 (136) Cash and cash equivalents at the beginning of the reporting period 8,589 3,223 3,222Cash and cash equivalents at the end of the reporting period 5.4A 5,075 8,589 3,086
The above statement should be read in conjunction with the accompanying notes.
For budgetary reporting information refer to Note 8.4. The budget statement information has been reclassified and presented on a consistent basis with the corresponding financial statement.
Department of Social Services Annual Report 2015–2016
142
4
Cha
pter
4.1
Fi
nanc
ial s
tate
men
ts
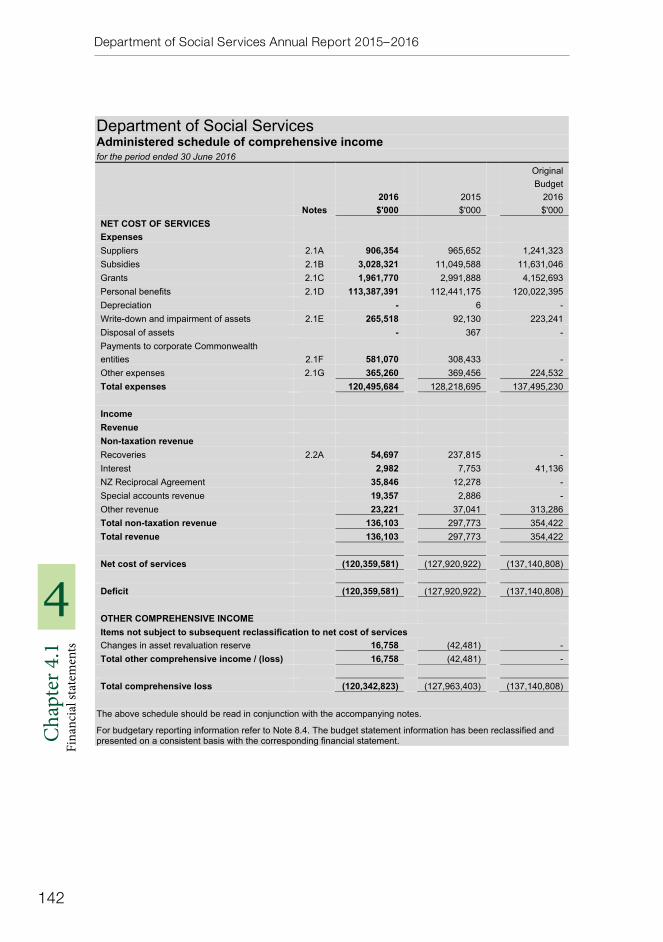
Department of Social Services Administered schedule of comprehensive income for the period ended 30 June 2016
2016 2015
Original Budget
2016 Notes $'000 $'000 $'000
NET COST OF SERVICES Expenses Suppliers 2.1A 906,354 965,652 1,241,323 Subsidies 2.1B 3,028,321 11,049,588 11,631,046 Grants 2.1C 1,961,770 2,991,888 4,152,693 Personal benefits 2.1D 113,387,391 112,441,175 120,022,395 Depreciation - 6 - Write-down and impairment of assets 2.1E 265,518 92,130 223,241 Disposal of assets - 367 - Payments to corporate Commonwealth entities 2.1F 581,070 308,433 - Other expenses 2.1G 365,260 369,456 224,532 Total expenses 120,495,684 128,218,695 137,495,230
IncomeRevenue Non-taxation revenue Recoveries 2.2A 54,697 237,815 - Interest 2,982 7,753 41,136 NZ Reciprocal Agreement 35,846 12,278 - Special accounts revenue 19,357 2,886 - Other revenue 23,221 37,041 313,286 Total non-taxation revenue 136,103 297,773 354,422 Total revenue 136,103 297,773 354,422
Net cost of services (120,359,581) (127,920,922) (137,140,808)
Deficit (120,359,581) (127,920,922) (137,140,808)
OTHER COMPREHENSIVE INCOME Items not subject to subsequent reclassification to net cost of services Changes in asset revaluation reserve 16,758 (42,481) - Total other comprehensive income / (loss) 16,758 (42,481) -
Total comprehensive loss (120,342,823) (127,963,403) (137,140,808)
The above schedule should be read in conjunction with the accompanying notes.
For budgetary reporting information refer to Note 8.4. The budget statement information has been reclassified and presented on a consistent basis with the corresponding financial statement.
Part 4—Financial statements | Chapter 4: Financial statements
143
4C
hapt
er 4
.1
Fina
ncia
l sta
tem
ents
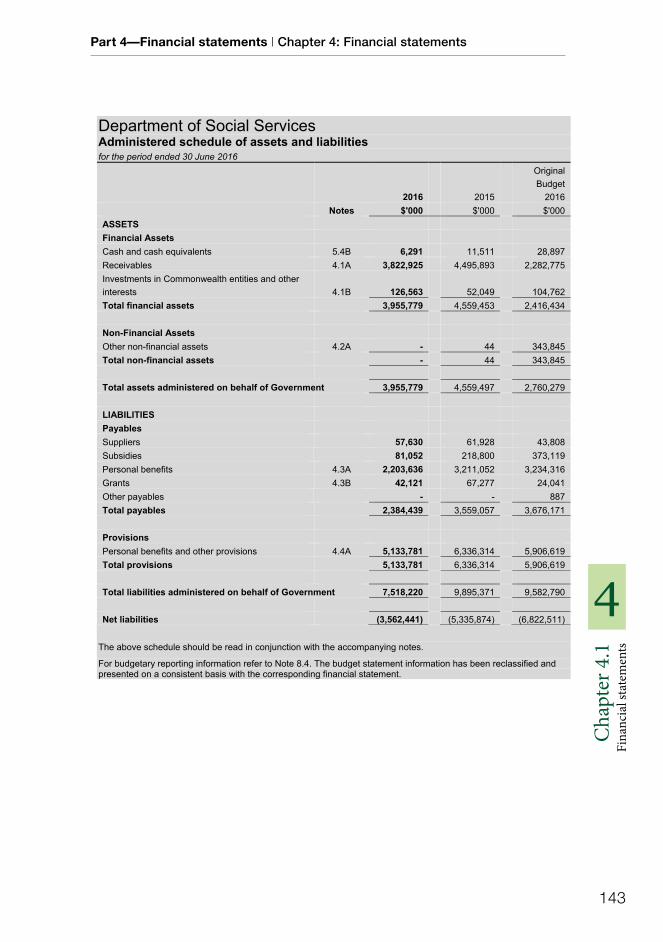
Department of Social Services Administered schedule of assets and liabilities for the period ended 30 June 2016
2016 2015
Original Budget
2016 Notes $'000 $'000 $'000
ASSETS Financial Assets Cash and cash equivalents 5.4B 6,291 11,511 28,897 Receivables 4.1A 3,822,925 4,495,893 2,282,775 Investments in Commonwealth entities and other interests 4.1B 126,563 52,049 104,762 Total financial assets 3,955,779 4,559,453 2,416,434
Non-Financial Assets Other non-financial assets 4.2A - 44 343,845 Total non-financial assets - 44 343,845
Total assets administered on behalf of Government 3,955,779 4,559,497 2,760,279
LIABILITIES Payables Suppliers 57,630 61,928 43,808 Subsidies 81,052 218,800 373,119 Personal benefits 4.3A 2,203,636 3,211,052 3,234,316 Grants 4.3B 42,121 67,277 24,041 Other payables - - 887Total payables 2,384,439 3,559,057 3,676,171
Provisions Personal benefits and other provisions 4.4A 5,133,781 6,336,314 5,906,619 Total provisions 5,133,781 6,336,314 5,906,619
Total liabilities administered on behalf of Government 7,518,220 9,895,371 9,582,790
Net liabilities (3,562,441) (5,335,874) (6,822,511)
The above schedule should be read in conjunction with the accompanying notes.
For budgetary reporting information refer to Note 8.4. The budget statement information has been reclassified and presented on a consistent basis with the corresponding financial statement.

Department of Social Services Annual Report 2015–2016
144
4
Cha
pter
4.1
Fi
nanc
ial s
tate
men
ts
Department of Social Services Administered reconciliation schedule for the period ended 30 June 2016
2016 2015 $'000 $'000
Opening assets less liabilities as at 1 July (5,335,874) (5,388,147)
Net cost of services Income 136,103 297,773 Expenses
Payments to entities other than corporate Commonwealth entities (119,914,614) (127,910,262) Payments to corporate Commonwealth entities (581,070) (308,433)
Other comprehensive income: Revaluations transferred to reserves 16,758 (42,481)
Transfers (to) / from the Australian Government: Appropriation transfers from Official Public Account:
Annual appropriations Payments to entities other than corporate Commonwealth entities 3,600,712 4,772,464 Payments and investments to corporate Commonwealth entities 638,826 332,669 Special appropriations Payments to individuals and entities other than corporate Commonwealth entities 119,004,039 125,088,350
Appropriation transfers to Official Public Account: Transfers to Official Public Account (763,222) (933,464) Administered receipts collected by other agencies (629,169) (615,760)
Restructuring (net) 367,624 (567,054) Net withholdings of personal benefit overpayments through equity (86,950) (81,338) Other non-reportable items recognised by DSS (15,604) 19,809 Closing assets less liabilities as at 30 June (3,562,441) (5,335,874)
The above schedule should be read in conjunction with the accompanying notes.
Accounting Policy
Administered Cash Transfers to and from the Official Public Account
Revenue collected by DSS for use by the Government rather than DSS is administered revenue. Collections are transferred to the Official Public Account (OPA) which is maintained by the Department of Finance. Conversely, cash is drawn from the OPA to make payments under Parliamentary appropriation on behalf of the Government. These transfers to and from the OPA are adjustments to the administered cash held by DSS on behalf of the Government and reported as such in the schedule of administered cash flows and in the administered reconciliation schedule.
Part 4—Financial statements | Chapter 4: Financial statements
145
4C
hapt
er 4
.1
Fina
ncia
l sta
tem
ents
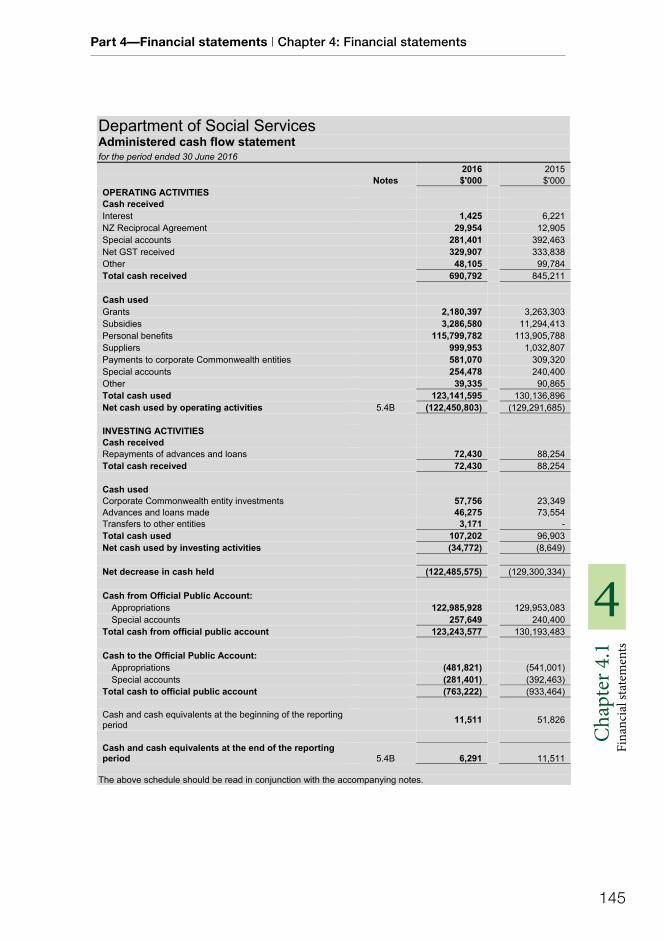
Department of Social Services Administered cash flow statement for the period ended 30 June 2016
2016 2015 Notes $'000 $'000
OPERATING ACTIVITIES Cash received Interest 1,425 6,221NZ Reciprocal Agreement 29,954 12,905 Special accounts 281,401 392,463 Net GST received 329,907 333,838 Other 48,105 99,784 Total cash received 690,792 845,211
Cash used Grants 2,180,397 3,263,303 Subsidies 3,286,580 11,294,413 Personal benefits 115,799,782 113,905,788 Suppliers 999,953 1,032,807 Payments to corporate Commonwealth entities 581,070 309,320 Special accounts 254,478 240,400 Other 39,335 90,865 Total cash used 123,141,595 130,136,896 Net cash used by operating activities 5.4B (122,450,803) (129,291,685)
INVESTING ACTIVITIES Cash received Repayments of advances and loans 72,430 88,254 Total cash received 72,430 88,254
Cash used Corporate Commonwealth entity investments 57,756 23,349 Advances and loans made 46,275 73,554 Transfers to other entities 3,171 - Total cash used 107,202 96,903 Net cash used by investing activities (34,772) (8,649)
Net decrease in cash held (122,485,575) (129,300,334)
Cash from Official Public Account: Appropriations 122,985,928 129,953,083 Special accounts 257,649 240,400
Total cash from official public account 123,243,577 130,193,483
Cash to the Official Public Account: Appropriations (481,821) (541,001) Special accounts (281,401) (392,463)
Total cash to official public account (763,222) (933,464)
Cash and cash equivalents at the beginning of the reporting period 11,511 51,826
Cash and cash equivalents at the end of the reporting period 5.4B 6,291 11,511
The above schedule should be read in conjunction with the accompanying notes.

Department of Social Services Annual Report 2015–2016
146
4
Cha
pter
4.1
Fi
nanc
ial s
tate
men
ts
Department of Social Services Annual Report 2015–2016
146
4
Cha
pter
4.1
Fina
ncia
l sta
tem
ents
Department of Social Services Notes to and forming part of the financial statements
Overview ........................................................................................................................................................ 147 1. Financial Performance ............................................................................................................................. 149
1.1 Expenses .............................................................................................................................................. 149 1.2 Own-Source Revenue and Gains ......................................................................................................... 151
2. Income and Expenses Administered on Behalf of Government ......................................................... 153 2.1 Administered – Expenses ..................................................................................................................... 153 2.2 Administered – Income ......................................................................................................................... 155
3. Departmental Financial Position ............................................................................................................. 156 3.1 Financial Assets .................................................................................................................................... 156 3.2 Non-Financial Assets ............................................................................................................................ 158 3.3 Payables ............................................................................................................................................... 162 3.4 Other Provisions ................................................................................................................................... 163
4. Assets and Liabilities Administered on Behalf of Government .......................................................... 164 4.1 Administered – Financial Assets .......................................................................................................... 164 4.2 Administered – Non-Financial Assets................................................................................................... 166 4.3 Administered – Payables ...................................................................................................................... 167 4.4 Administered – Other Provisions .......................................................................................................... 168
5. Funding ...................................................................................................................................................... 169 5.1 Appropriations ....................................................................................................................................... 169 5.2 Special Accounts .................................................................................................................................. 175 5.3 Net Cash Appropriation Arrangements................................................................................................. 177 5.4 Cash Flow Reconciliations ................................................................................................................... 178
6. People ........................................................................................................................................................ 180 6.1 Employee Provisions ............................................................................................................................ 180 6.2 Senior Management Personnel Remuneration .................................................................................... 181
7. Managing Uncertainties ........................................................................................................................... 182 7.1 Contingent Assets and Liabilities .......................................................................................................... 182 7.2 Financial Instruments ........................................................................................................................... 183 7.3 Administered – Financial Instruments .................................................................................................. 185 7.4 Fair Value Measurement ...................................................................................................................... 188 7.5 Administered – Fair Value Measurement ............................................................................................. 190
8. Other Information ..................................................................................................................................... 192 8.1 Restructuring ........................................................................................................................................ 192 8.2 Reporting of Outcomes ......................................................................................................................... 196 8.3 Breach of Section 83 of the Constitution .............................................................................................. 199 8.4 Explanations of Major Variances to Budget ......................................................................................... 201
08316 DSS AR_text_08.indd 146 30/09/16 4:49 PM

Part 4—Financial statements | Chapter 4: Financial statements
147
4C
hapt
er 4
.1
Fina
ncia
l sta
tem
ents
Department of Social Services Notes to and forming part of the financial statements OverviewObjectives of the Department of Social Services
The Department of Social Services (DSS) is a Government controlled, not for profit entity formed in 2013. DSS is a critical source of social policy advice for the Australian Government. It works in partnership with other government and non-government organisations, particularly with the Department of Human Services (DHS), to ensure the effective development, management and delivery of a diverse range of policies, programs and services that are focused on improving the lifetime wellbeing of people and families in Australia.
In the 2016 financial year, DSS was responsible for four active outcomes, with an additional outcome for which functions have transferred to the Department of Health. These outcomes are:
Outcome 1: Social Security - Financial support for individuals and families who are unable to fully support themselves by providing a sustainable payments and concessions system.
Outcome 2: Families and Communities - Stronger families and more resilient communities by developing civil society and by providing family and community services.
As a result of the Administrative Arrangement Order (AAO) issued on 21 September 2015, the responsibilities for child care policy and programs and coordination of early childhood development policy transferred to the Department of Education and Training.
Outcome 3: Ageing and Aged Care - Improved wellbeing for older Australians through targeted support, access to quality care and related information services.
As a result of the AAO issued on 30 September 2015, the responsibilities for aged care policy and programs transferred to the Department of Health.
Outcome 4: Housing - Increased housing supply, improved community housing and assisting individuals experiencing homelessness through targeted support and services.
Outcome 5: Disability and Carers - Improved independence of, and participation by, people with disability, including improved support for carers, by providing targeted support and services.
The Basis of Preparation
The financial statements are general purpose financial statements and are required by section 42(2) of the Public Governance, Performance and Accountability Act 2013 (PGPA Act).
The financial statements have been prepared in accordance with:
Financial Reporting Rule (FRR) 2016 for reporting periods ending on or after 1 July 2015; and Australian Accounting Standards and Interpretations issued by the Australian Accounting Standards Board
(AASB) that apply for the reporting period.
The financial statements have been prepared on an accrual basis and are in accordance with the historical cost convention, except for certain assets and liabilities that are reported at fair value. Except where stated, no allowance is made for the effect of changing prices on the results or the financial position. The financial statements are presented in Australian dollars, exclusive of GST and values are rounded to the nearest thousand dollars unless otherwise specified.
Unless an alternative treatment is specifically required by an accounting standard or the FRRs, assets and liabilities are recognised in the statement of financial position when and only when it is probable that future economic benefits will flow to DSS or a future sacrifice of economic benefits will be required and the amounts of the assets or liabilities can be reliably measured. However, assets and liabilities arising under executable contracts are not recognised unless required by an accounting standard. Assets and liabilities that are not recognised are disclosed as a commitment or reported in the contingencies note.
Unless alternative treatment is specifically required by an accounting standard, income and expenses are recognised in the statement of comprehensive income when and only when the flow, consumption or loss of economic benefits has occurred and can be reliably measured.
Comparative Figures for 2015 Financial Year
The comparative 2015 financial year includes part-year transactions and balances for the delivery of child care policy and programs (a component of outcome 2) and full-year transactions and balances for the delivery of aged care policy and programs (outcome 3).
As a result of the AAOs issued on 21 September 2015 and 30 September 2015, the impacts of the Machinery of Government (MoG) changes have been reflected in Restructuring, refer to Note 8.1.
Certain comparative amounts have been reclassified or adjusted to conform with the 2016 financial year’s reporting presentation.
Department of Social Services Annual Report 2015–2016
148
4
Cha
pter
4.1
Fi
nanc
ial s
tate
men
ts
Department of Social Services Notes to and forming part of the financial statements New Australian Accounting Standards
Adoption of New and Future Australian Accounting Standard Requirements
There have been no further new standards, revised standards, amended standards or interpretations that were issued by the AASB prior to the sign off date, which are applicable to the current and future reporting periods which have a material financial impact on DSS.
Taxation
DSS is exempt from all forms of taxation except Fringe Benefits Tax (FBT) and the Goods and Services Tax (GST). Revenues, expenses, assets and liabilities are recognised net of GST except:
a) where the amount of GST incurred is not recoverable from the Australian Taxation Office (ATO); and
b) for receivables and payables.
Reporting of Administered Activities
Administered revenues, expenses, assets, liabilities and cash flows are disclosed in the administered schedules and related notes.
Except where otherwise stated, administered items are accounted for on the same basis and using the same policies as for departmental items, including the application of Australian Accounting Standards.
Events After the Reporting Period
There are no known events requiring adjustment to the financial statements that have occurred after the reporting period.

Part 4—Financial statements | Chapter 4: Financial statements
149
4C
hapt
er 4
.1
Fina
ncia
l sta
tem
ents
Department of Social Services Notes to and forming part of the financial statements 1. Financial Performance
Expenses 1.12016 2015 $'000 $'000
Note 1.1A: Employee Benefits Wages and salaries 237,022 297,044 Superannuation:
Defined contribution plans 17,306 22,133 Defined benefit plans 27,871 38,960
Leave and other entitlements 30,147 21,978 Separation and redundancies 13,517 11,316 Total employee benefits 325,863 391,431
Accounting Policy
Accounting policies for employee related expenses is contained in Section 6: People.
Note 1.1B: Suppliers Goods and services supplied or rendered Consultants and contractors 114,974 106,640 IT and communication 35,330 34,398 Travel and accommodation 6,886 7,553 Member sitting fees 157 8,790 Motor vehicle expenses 967 1,240 Building expenses (excluding operating lease rentals) 12,198 14,949 Training 4,625 5,107 Recruitment 1,373 761 Other 13,735 13,723 Total goods and services supplied or rendered 190,245 193,161
Goods supplied 7,895 7,094Services rendered 182,350 186,067 Total goods and services supplied or rendered 190,245 193,161
Other suppliers Operating lease rentals in connection with:
Sublease - 1,412Minimum lease payments 41,042 48,815 Contingent rentals 371 439
Workers compensation expenses 5,757 9,067 Total other suppliers 47,170 59,733 Total suppliers 237,415 252,894

Department of Social Services Annual Report 2015–2016
150
4
Cha
pter
4.1
Fi
nanc
ial s
tate
men
ts
Department of Social Services Notes to and forming part of the financial statements 1.1 Expenses (continued)
Note 1.1B: Suppliers (continued)
Leasing commitments DSS has 13 leases (2015: 23 leases) relating to office accommodation including one lease under a memorandum of understanding and two data centre leases. The Tuggeranong Office Park is the only office location with a significant accommodation lease commitment.
DSS lease payments are subject to review by a variety of mechanisms; and these include predetermined fixed escalations, a link to Labour Price Index (LPI) and Consumer Price Index (CPI) movements, or in accordance with a market review of comparable leases. Contingent rental payments are determined by market review, LPI and CPI movements.
2016 2015 $'000 $'000
Commitments for minimum lease payments in relation to non-cancellable operating leases are payable as follows:
Within 1 year 31,492 55,188 Between 1 to 5 years 106,457 150,761 More than 5 years 253,773 312,573
Total operating lease commitments 391,722 518,522
Accounting Policy
Leases
A distinction is made between finance leases and operating leases. Finance leases effectively transfer from the lessor to the lessee substantially all the risks and rewards incidental to ownership of leased assets. An operating lease is a lease that is not a finance lease. In operating leases, the lessor effectively retains substantially all such risks and benefits.
Operating lease payments are expensed on a straight-line basis which is representative of the pattern of benefits derived from the leased assets.
DSS does not have any finance leases.
Note 1.1C: Losses from Asset Sales Property, plant and equipment:
Proceeds from sale 22 29 Carrying value of assets sold (57) (93)
Total losses from asset sales 35 64
Note 1.1D: Payments for Service Delivery Payments to Australian Tax Office for service delivery 606 602 Payments to Department of Veterans' Affairs for service delivery 161 161 Total payments for service delivery 767 763
Note 1.1E: Other Expenses Change in estimate of makegood provision 5 608 Total other expenses 5 608
Part 4—Financial statements | Chapter 4: Financial statements
151
4C
hapt
er 4
.1
Fina
ncia
l sta
tem
ents
Department of Social Services Notes to and forming part of the financial statements
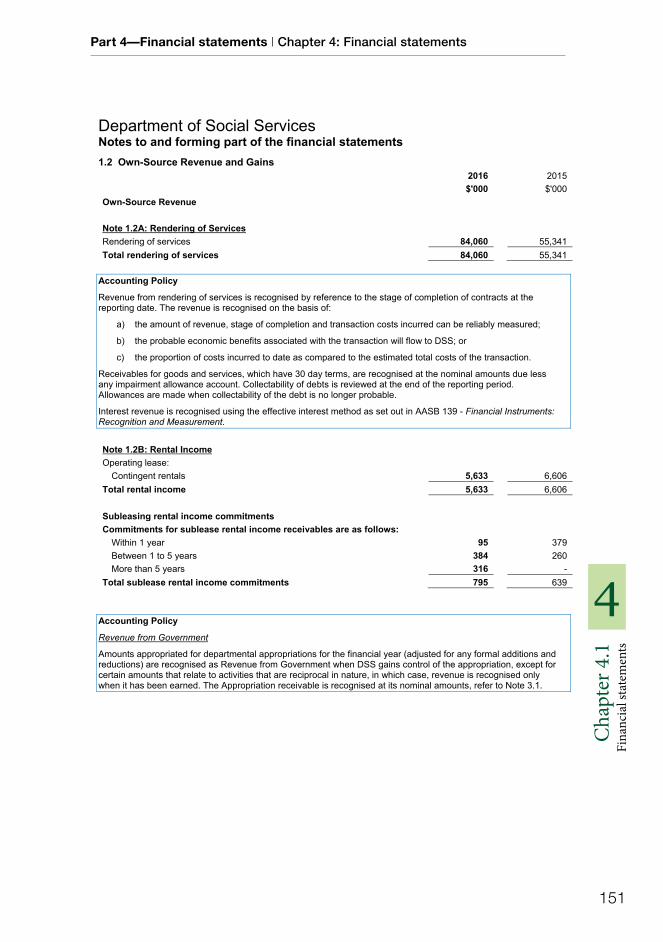
Own-Source Revenue and Gains 1.22016 2015 $'000 $'000
Own-Source Revenue
Note 1.2A: Rendering of Services Rendering of services 84,060 55,341 Total rendering of services 84,060 55,341
Accounting Policy
Revenue from rendering of services is recognised by reference to the stage of completion of contracts at the reporting date. The revenue is recognised on the basis of:
a) the amount of revenue, stage of completion and transaction costs incurred can be reliably measured;
b) the probable economic benefits associated with the transaction will flow to DSS; or
c) the proportion of costs incurred to date as compared to the estimated total costs of the transaction.
Receivables for goods and services, which have 30 day terms, are recognised at the nominal amounts due less any impairment allowance account. Collectability of debts is reviewed at the end of the reporting period. Allowances are made when collectability of the debt is no longer probable.
Interest revenue is recognised using the effective interest method as set out in AASB 139 - Financial Instruments: Recognition and Measurement.
Note 1.2B: Rental Income Operating lease:
Contingent rentals 5,633 6,606 Total rental income 5,633 6,606
Subleasing rental income commitments Commitments for sublease rental income receivables are as follows:
Within 1 year 95 379Between 1 to 5 years 384 260More than 5 years 316 -
Total sublease rental income commitments 795 639
Accounting Policy
Revenue from Government
Amounts appropriated for departmental appropriations for the financial year (adjusted for any formal additions and reductions) are recognised as Revenue from Government when DSS gains control of the appropriation, except for certain amounts that relate to activities that are reciprocal in nature, in which case, revenue is recognised only when it has been earned. The Appropriation receivable is recognised at its nominal amounts, refer to Note 3.1.
Department of Social Services Annual Report 2015–2016
152
4
Cha
pter
4.1
Fi
nanc
ial s
tate
men
ts
Department of Social Services Notes to and forming part of the financial statements 1.2 Own-Source Revenue and Gains (continued)
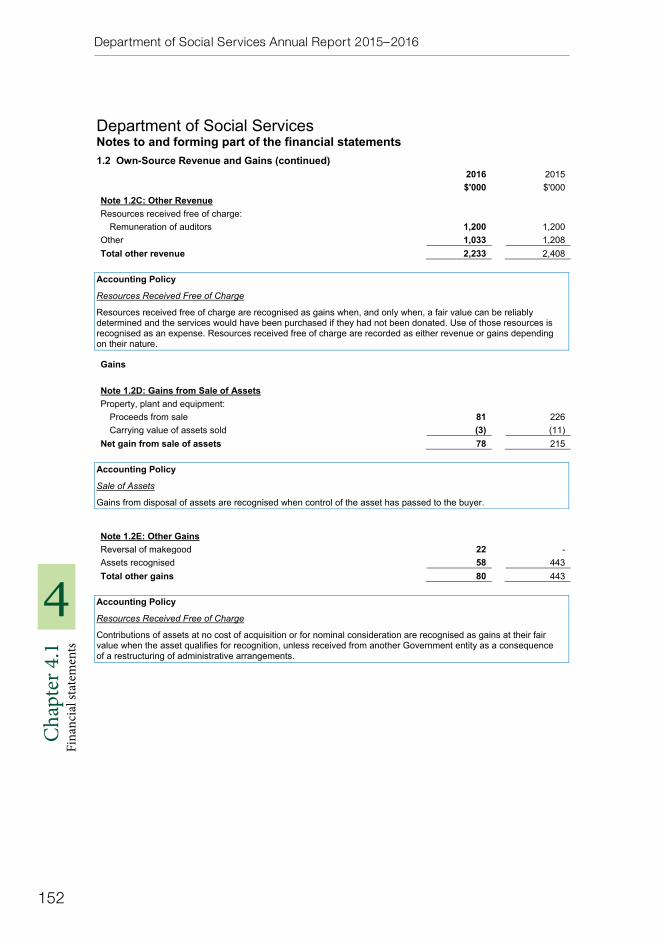
2016 2015 $'000 $'000
Note 1.2C: Other Revenue Resources received free of charge:
Remuneration of auditors 1,200 1,200 Other 1,033 1,208 Total other revenue 2,233 2,408
Accounting Policy
Resources Received Free of Charge
Resources received free of charge are recognised as gains when, and only when, a fair value can be reliably determined and the services would have been purchased if they had not been donated. Use of those resources is recognised as an expense. Resources received free of charge are recorded as either revenue or gains depending on their nature.
Gains
Note 1.2D: Gains from Sale of Assets Property, plant and equipment:
Proceeds from sale 81 226 Carrying value of assets sold (3) (11)
Net gain from sale of assets 78 215
Accounting Policy
Sale of Assets
Gains from disposal of assets are recognised when control of the asset has passed to the buyer.
Note 1.2E: Other Gains Reversal of makegood 22 -Assets recognised 58 443 Total other gains 80 443
Accounting Policy
Resources Received Free of Charge
Contributions of assets at no cost of acquisition or for nominal consideration are recognised as gains at their fair value when the asset qualifies for recognition, unless received from another Government entity as a consequence of a restructuring of administrative arrangements.

Part 4—Financial statements | Chapter 4: Financial statements
153
4C
hapt
er 4
.1
Fina
ncia
l sta
tem
ents
Department of Social Services Notes to and forming part of the financial statements 2. Income and Expenses Administered on Behalf of Government
Administered – Expenses 2.12016 2015 $'000 $'000
Note 2.1A: Suppliers Goods and services supplied or rendered Consultants and contractors 46,074 90,441 Advertising, legal and marketing costs 8,912 3,089 Settlement services 56,854 58,749 Disability employment services 774,527 790,688 Other 19,987 22,677 Total goods and services supplied or rendered 906,354 965,644
Goods Supplied 14,008 14,344 Services rendered 892,346 951,300 Total services rendered 906,354 965,644
Other suppliers Operating lease rentals in connection with:
Minimum lease payments - 8Total other suppliers - 8Total suppliers 906,354 965,652
DSS has no future administered lease commitments.
Note 2.1B: Subsidies Subsidies in connection with:
Aged Care 2,946,750 10,964,326 Other 81,571 85,262
Total subsidies 3,028,321 11,049,588
Note 2.1C: Grants Public sector:
Australian Government entities (related parties) 7,088 7,514 Local Governments 51,846 115,266
Private sector: External parties 119,883 228,676 Non-profit organisations 1,782,953 2,640,432
Total grants 1,961,770 2,991,888
Accounting Policy
Grants and Subsidies
DSS administers a number of grant and subsidy schemes on behalf of the Government. These schemes include grants to State, Territory and Local Governments and a range of grants to non-government, not-for-profit organisations and other recipients for activities associated with community development and supporting individuals. Subsidies mainly relate to aged care programs which transferred to the Department of Health as part of the AAO issued 30 September 2015.

Department of Social Services Annual Report 2015–2016
154
4
Cha
pter
4.1
Fi
nanc
ial s
tate
men
ts
Department of Social Services Notes to and forming part of the financial statements 2.1 Administered Expenses (continued)
2016 2015 $'000 $'000
Note 2.1D: Personal Benefits Direct:
Income Support for Seniors 43,321,795 41,484,178 Family Tax Benefit 20,753,089 20,869,757 Working Age Payments 17,126,109 16,857,754 Income Support for People with Disability 16,662,210 16,688,592 Income Support for Carers 7,791,276 7,429,695 Student Payments 3,371,103 3,479,580 Paid Parental Leave 692,830 635,636 Child Care Rebate 412,701 592,451 Allowances and Concessions for Seniors 81,488 284,145 Child Care Benefit 66,789 103,541 Income Support for Vulnerable People 64,187 64,604 Ageing and Service Improvement 63,623 75,207 Child Payments 55,892 58,252 Other 55,815 55,006
Indirect: Child Care Payments - Indirect 1,495,117 2,467,063 Paid Parental Leave - Indirect 1,373,367 1,295,714
Total personal benefits 113,387,391 112,441,175
Accounting Policy
Personal Benefits
DSS administers a number of personal benefit payments on behalf of the Government that provide income support, family assistance and other entitlements to individuals. Payments to recipients are determined in accordance with provisions under social security law and other legislation. Payments made under social security law are assessed, determined and paid by DHS under delegation from DSS.
DSS receives and reports appropriations for payments made by DHS on behalf of DSS.
The Social Security (Administration) Act 1999 and the A New Tax System (Family Assistance) (Administration) Act 1999 impose an obligation on recipients to disclose to DHS information about financial and personal circumstances that affect entitlement to payment. This is a necessary part of DHS's administration, which acknowledges that, at the time certain information is required, only the recipient is in a position to provide that information.
Unreported changes in circumstances can lead to incorrect payment, even if no deliberate fraud is intended. However, risks associated with relying on voluntary disclosure by recipients are mitigated by a comprehensive portfolio risk management plan, underpinned by compliance strategies, which have been built up over many years. The compliance framework has been designed to meet the requirements of social security legislation.
The compliance framework does not rely solely on information provided by recipients to determine their entitlement. A comprehensive risk management strategy minimises the potential for incorrect payment by subjecting recipients to a variety of review processes. If debts are identified, DHS seeks recovery in a lump sum or by instalments. While the risk management strategy is principally directed at minimising debts, the detection of underpayments will also result in an adjustment to their level of entitlement.
Student Payments are determined in accordance with the Student Assistance Act 1973.
Payments to recipients under the Parental Leave Pay are determined in accordance with the Paid Parental Leave Act 2010. Payments can be made directly to the recipients or indirectly through the employers.
Part 4—Financial statements | Chapter 4: Financial statements
155
4C
hapt
er 4
.1
Fina
ncia
l sta
tem
ents
Department of Social Services Notes to and forming part of the financial statements 2.1 Administered Expenses (continued)
2016 2015 $'000 $'000
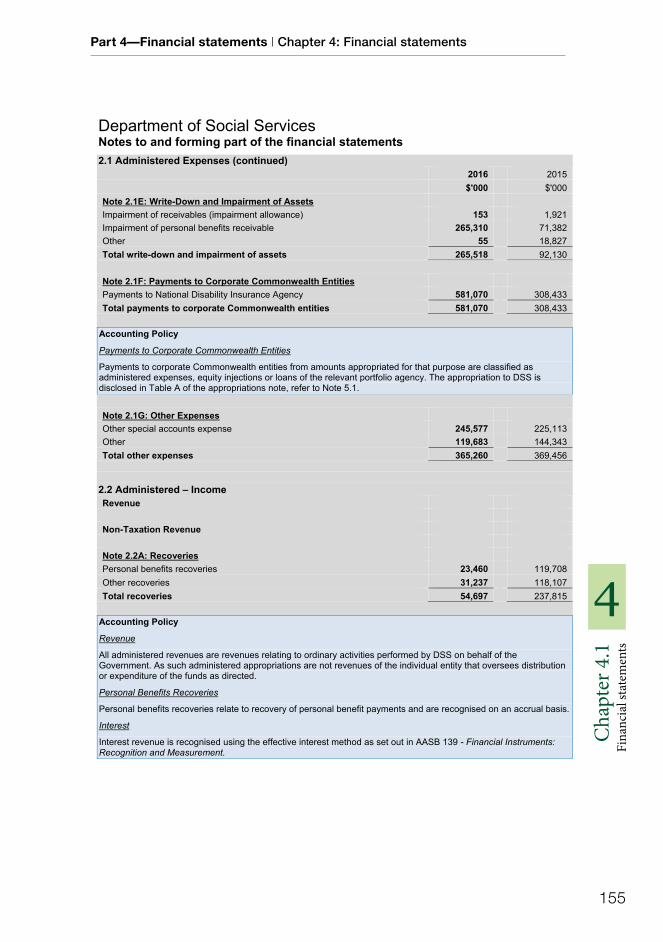
Note 2.1E: Write-Down and Impairment of Assets Impairment of receivables (impairment allowance) 153 1,921 Impairment of personal benefits receivable 265,310 71,382 Other 55 18,827 Total write-down and impairment of assets 265,518 92,130
Note 2.1F: Payments to Corporate Commonwealth Entities Payments to National Disability Insurance Agency 581,070 308,433 Total payments to corporate Commonwealth entities 581,070 308,433
Accounting Policy
Payments to Corporate Commonwealth Entities
Payments to corporate Commonwealth entities from amounts appropriated for that purpose are classified as administered expenses, equity injections or loans of the relevant portfolio agency. The appropriation to DSS is disclosed in Table A of the appropriations note, refer to Note 5.1.
Note 2.1G: Other Expenses Other special accounts expense 245,577 225,113 Other 119,683 144,343 Total other expenses 365,260 369,456
Administered – Income 2.2Revenue
Non-Taxation Revenue
Note 2.2A: Recoveries Personal benefits recoveries 23,460 119,708 Other recoveries 31,237 118,107 Total recoveries 54,697 237,815
Accounting Policy
Revenue
All administered revenues are revenues relating to ordinary activities performed by DSS on behalf of the Government. As such administered appropriations are not revenues of the individual entity that oversees distribution or expenditure of the funds as directed.
Personal Benefits Recoveries
Personal benefits recoveries relate to recovery of personal benefit payments and are recognised on an accrual basis.
Interest
Interest revenue is recognised using the effective interest method as set out in AASB 139 - Financial Instruments: Recognition and Measurement.

Department of Social Services Annual Report 2015–2016
156
4
Cha
pter
4.1
Fi
nanc
ial s
tate
men
ts
Department of Social Services Notes to and forming part of the financial statements 3. Departmental Financial Position
Financial Assets 3.12016 2015 $'000 $'000
Note 3.1A: Trade and Other Receivables Goods and services receivables 13,430 4,625 Total goods and services receivables 13,430 4,625
Appropriations receivables: For existing programs 52,910 104,991 For departmental capital budget - 1,114 For equity injection 50,421 41,204
Total appropriations receivables 103,331 147,309
Other receivables: GST receivable from the Australian Taxation Office 4,889 3,435 Other 1,523 9,002
Total other receivables 6,412 12,437 Total trade and other receivables (gross) 123,173 164,371
Less impairment allowance (121) -Total trade and other receivables (net) 123,052 164,371
Trade and other receivables (net) expected to be recovered: No more than 12 months 123,052 164,371
Total trade and other receivables (net) 123,052 164,371
Trade and other receivables (gross) aged as follows: Not overdue 121,652 163,915 Overdue by: 0 to 30 days 830 417 31 to 60 days 452 8 61 to 90 days 53 - More than 90 days 186 31
Total trade and other receivables (gross) 123,173 164,371
Impairment allowance aged as follows: Not overdue (8) -Overdue by: 0 to 30 days (4) - More than 90 days (109) -
Total impairment allowance (121) -
Reconciliation of the Impairment Allowance
Movements in relation to 2016 Goods and services Total
$'000 $'000 Opening balance as at 1 July 2015 - -
Increase recognised in net cost of services 149 149 Amounts written off (28) (28)
Closing balance as at 30 June 2016 121 121
Part 4—Financial statements | Chapter 4: Financial statements
157
4C
hapt
er 4
.1
Fina
ncia
l sta
tem
ents
Department of Social Services Notes to and forming part of the financial statements 3.1 Financial Assets (continued)
Note 3.1A: Trade and Other Receivables (continued)
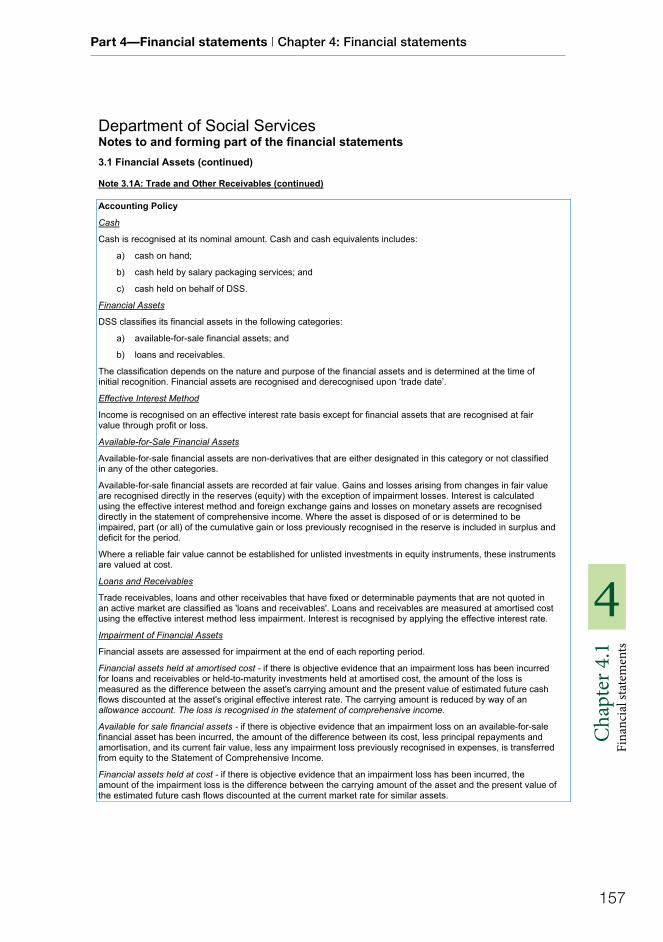
Accounting Policy
Cash
Cash is recognised at its nominal amount. Cash and cash equivalents includes:
a) cash on hand;
b) cash held by salary packaging services; and
c) cash held on behalf of DSS.
Financial Assets
DSS classifies its financial assets in the following categories:
a) available-for-sale financial assets; and
b) loans and receivables.
The classification depends on the nature and purpose of the financial assets and is determined at the time of initial recognition. Financial assets are recognised and derecognised upon ‘trade date’.
Effective Interest Method
Income is recognised on an effective interest rate basis except for financial assets that are recognised at fair value through profit or loss.
Available-for-Sale Financial Assets
Available-for-sale financial assets are non-derivatives that are either designated in this category or not classified in any of the other categories.
Available-for-sale financial assets are recorded at fair value. Gains and losses arising from changes in fair value are recognised directly in the reserves (equity) with the exception of impairment losses. Interest is calculated using the effective interest method and foreign exchange gains and losses on monetary assets are recognised directly in the statement of comprehensive income. Where the asset is disposed of or is determined to be impaired, part (or all) of the cumulative gain or loss previously recognised in the reserve is included in surplus and deficit for the period.
Where a reliable fair value cannot be established for unlisted investments in equity instruments, these instruments are valued at cost.
Loans and Receivables
Trade receivables, loans and other receivables that have fixed or determinable payments that are not quoted in an active market are classified as 'loans and receivables'. Loans and receivables are measured at amortised cost using the effective interest method less impairment. Interest is recognised by applying the effective interest rate.
Impairment of Financial Assets
Financial assets are assessed for impairment at the end of each reporting period.
Financial assets held at amortised cost - if there is objective evidence that an impairment loss has been incurred for loans and receivables or held-to-maturity investments held at amortised cost, the amount of the loss is measured as the difference between the asset's carrying amount and the present value of estimated future cash flows discounted at the asset's original effective interest rate. The carrying amount is reduced by way of an allowance account. The loss is recognised in the statement of comprehensive income.
Available for sale financial assets - if there is objective evidence that an impairment loss on an available-for-sale financial asset has been incurred, the amount of the difference between its cost, less principal repayments and amortisation, and its current fair value, less any impairment loss previously recognised in expenses, is transferred from equity to the Statement of Comprehensive Income.
Financial assets held at cost - if there is objective evidence that an impairment loss has been incurred, the amount of the impairment loss is the difference between the carrying amount of the asset and the present value of the estimated future cash flows discounted at the current market rate for similar assets.
Department of Social Services Annual Report 2015–2016
158
4
Cha
pter
4.1
Fi
nanc
ial s
tate
men
ts
Department of Social Services Notes to and forming part of the financial statements
Non-Financial Assets 3.2
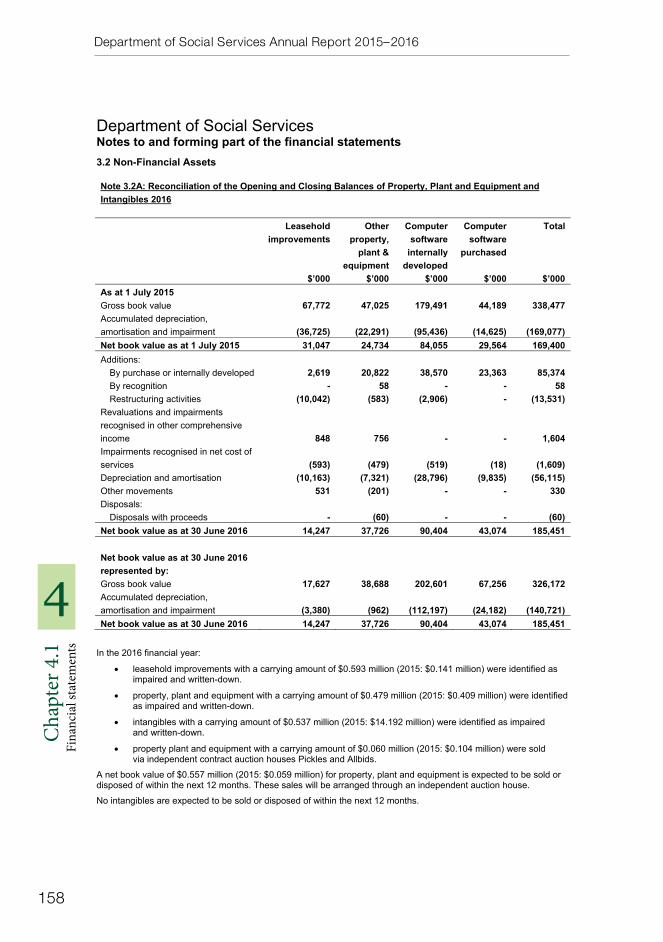
Note 3.2A: Reconciliation of the Opening and Closing Balances of Property, Plant and Equipment and Intangibles 2016
Leasehold improvements
Other property,
plant & equipment
Computersoftware
internally developed
Computersoftware
purchased
Total
$’000 $’000 $’000 $’000 $’000 As at 1 July 2015 Gross book value 67,772 47,025 179,491 44,189 338,477 Accumulated depreciation, amortisation and impairment (36,725) (22,291) (95,436) (14,625) (169,077) Net book value as at 1 July 2015 31,047 24,734 84,055 29,564 169,400 Additions:
By purchase or internally developed 2,619 20,822 38,570 23,363 85,374 By recognition - 58 - - 58 Restructuring activities (10,042) (583) (2,906) - (13,531)
Revaluations and impairments recognised in other comprehensive income 848 756 - - 1,604 Impairments recognised in net cost of services (593) (479) (519) (18) (1,609) Depreciation and amortisation (10,163) (7,321) (28,796) (9,835) (56,115) Other movements 531 (201) - - 330 Disposals:
Disposals with proceeds - (60) - - (60) Net book value as at 30 June 2016 14,247 37,726 90,404 43,074 185,451
Net book value as at 30 June 2016 represented by: Gross book value 17,627 38,688 202,601 67,256 326,172 Accumulated depreciation, amortisation and impairment (3,380) (962) (112,197) (24,182) (140,721) Net book value as at 30 June 2016 14,247 37,726 90,404 43,074 185,451
In the 2016 financial year:
leasehold improvements with a carrying amount of $0.593 million (2015: $0.141 million) were identified as impaired and written-down.
property, plant and equipment with a carrying amount of $0.479 million (2015: $0.409 million) were identified as impaired and written-down.
intangibles with a carrying amount of $0.537 million (2015: $14.192 million) were identified as impaired and written-down.
property plant and equipment with a carrying amount of $0.060 million (2015: $0.104 million) were sold via independent contract auction houses Pickles and Allbids.
A net book value of $0.557 million (2015: $0.059 million) for property, plant and equipment is expected to be sold or disposed of within the next 12 months. These sales will be arranged through an independent auction house.
No intangibles are expected to be sold or disposed of within the next 12 months.

Part 4—Financial statements | Chapter 4: Financial statements
159
4C
hapt
er 4
.1
Fina
ncia
l sta
tem
ents
Department of Social Services Notes to and forming part of the financial statements 3.2 Non-Financial Assets (continued)
Note 3.2A: Reconciliation of the Opening and Closing Balances of Property, Plant and Equipment and Intangibles 2015
Leasehold improvements
Otherproperty,
plant &equipment
Computer software internally
developed
Computer software
purchased
Total
$’000 $’000 $’000 $’000 $’000 As at 1 July 2014 Gross book value 61,559 42,245 169,320 32,820 305,944 Accumulated depreciation, amortisation and impairment (20,557) (14,669) (80,615) (9,871) (125,712) Net book value as at 1 July 2014 41,002 27,576 88,705 22,949 180,232 Additions:
By purchase or internally developed 2,172 7,859 31,404 13,683 55,118 By recognition 437 442 - - 879 Restructuring activities 2,583 25 8,557 - 11,165
Revaluations recognised in net cost of services (1,389) - - - (1,389) Impairments recognised in net cost of services (141) (409) (14,148) (44) (14,742) Depreciation and amortisation (15,222) (10,499) (30,463) (7,010) (63,194) Other movements 1,605 (156) - (14) 1,435 Disposals: -
Disposals with proceeds - (104) - - (104) Net book value as at 30 June 2015 31,047 24,734 84,055 29,564 169,400 Net book value as at 30 June 2015 represented by: -Gross book value 67,772 47,025 179,491 44,189 338,477 Accumulated depreciation, amortisation and impairment (36,725) (22,291) (95,436) (14,625) (169,077) Net book value as at 30 June 2015 31,047 24,734 84,055 29,564 169,400
Department of Social Services Annual Report 2015–2016
160
4
Cha
pter
4.1
Fi
nanc
ial s
tate
men
ts
Department of Social Services Notes to and forming part of the financial statements 3.2 Non-Financial Assets (continued)
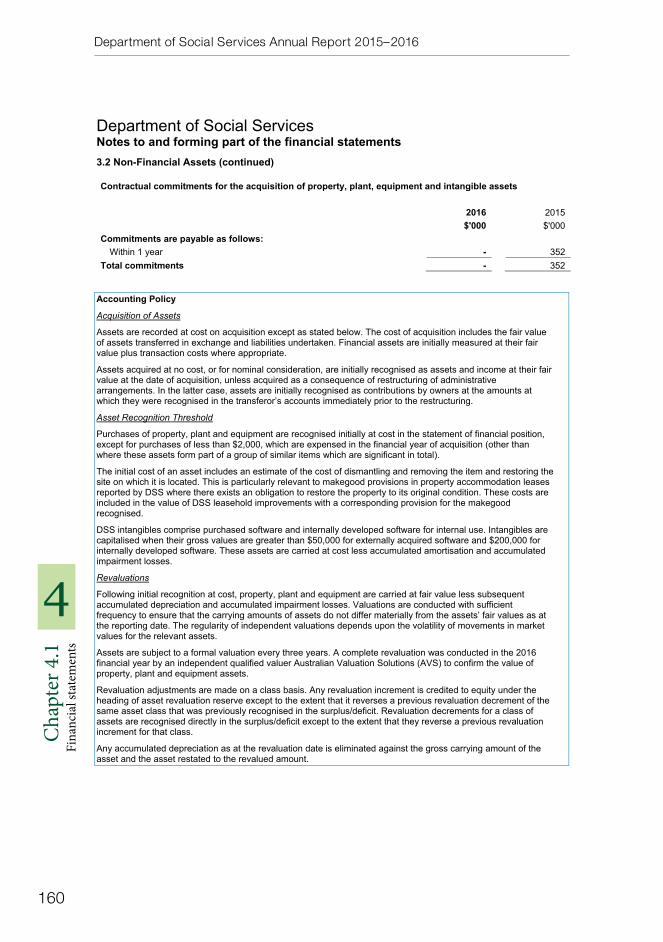
Contractual commitments for the acquisition of property, plant, equipment and intangible assets
2016 2015 $'000 $'000
Commitments are payable as follows: Within 1 year - 352
Total commitments - 352
Accounting Policy
Acquisition of Assets
Assets are recorded at cost on acquisition except as stated below. The cost of acquisition includes the fair value of assets transferred in exchange and liabilities undertaken. Financial assets are initially measured at their fair value plus transaction costs where appropriate.
Assets acquired at no cost, or for nominal consideration, are initially recognised as assets and income at their fair value at the date of acquisition, unless acquired as a consequence of restructuring of administrative arrangements. In the latter case, assets are initially recognised as contributions by owners at the amounts at which they were recognised in the transferor’s accounts immediately prior to the restructuring.
Asset Recognition Threshold
Purchases of property, plant and equipment are recognised initially at cost in the statement of financial position, except for purchases of less than $2,000, which are expensed in the financial year of acquisition (other than where these assets form part of a group of similar items which are significant in total).
The initial cost of an asset includes an estimate of the cost of dismantling and removing the item and restoring the site on which it is located. This is particularly relevant to makegood provisions in property accommodation leases reported by DSS where there exists an obligation to restore the property to its original condition. These costs are included in the value of DSS leasehold improvements with a corresponding provision for the makegood recognised.
DSS intangibles comprise purchased software and internally developed software for internal use. Intangibles are capitalised when their gross values are greater than $50,000 for externally acquired software and $200,000 for internally developed software. These assets are carried at cost less accumulated amortisation and accumulated impairment losses.
Revaluations
Following initial recognition at cost, property, plant and equipment are carried at fair value less subsequent accumulated depreciation and accumulated impairment losses. Valuations are conducted with sufficient frequency to ensure that the carrying amounts of assets do not differ materially from the assets’ fair values as at the reporting date. The regularity of independent valuations depends upon the volatility of movements in market values for the relevant assets.
Assets are subject to a formal valuation every three years. A complete revaluation was conducted in the 2016 financial year by an independent qualified valuer Australian Valuation Solutions (AVS) to confirm the value of property, plant and equipment assets.
Revaluation adjustments are made on a class basis. Any revaluation increment is credited to equity under the heading of asset revaluation reserve except to the extent that it reverses a previous revaluation decrement of the same asset class that was previously recognised in the surplus/deficit. Revaluation decrements for a class of assets are recognised directly in the surplus/deficit except to the extent that they reverse a previous revaluation increment for that class.
Any accumulated depreciation as at the revaluation date is eliminated against the gross carrying amount of the asset and the asset restated to the revalued amount.

Part 4—Financial statements | Chapter 4: Financial statements
161
4C
hapt
er 4
.1
Fina
ncia
l sta
tem
ents
Department of Social Services Notes to and forming part of the financial statements 3.2 Non-Financial Assets (continued)
Depreciation
Depreciable property, plant and equipment assets are written-off to their estimated residual values over their estimated useful lives using, in all cases, the straight-line method of depreciation.
Software is amortised on a straight-line basis over its anticipated useful life.
Depreciation rates applying to each class of depreciable asset are based on the following estimated useful lives:2016 2015
Leasehold improvements Lesser of 10 years or lease term
Lesser of 10 years or lease term
Plant and equipment 3 to 10 years 3 to 10 years Artwork 1 to 50 years 1 to 50 years Software 2 to 8 years 2 to 8 years
Impairment
All property, plant and equipment assets were assessed by DSS for impairment as at 30 June 2016. Where indications of impairment exist, the asset’s recoverable amount is estimated and an impairment adjustment made if the asset’s recoverable amount is less than its carrying amount.
The recoverable amount of an asset is the higher of its fair value less costs to sell and its value in use. Value in use is the present value of the future cash flows expected to be derived from the asset. Where the future economic benefit of an asset is not primarily dependent on the asset’s ability to generate future cash flows, and the asset would be replaced if DSS were deprived of the asset, its value in use is taken to be its depreciated replacement cost.
All software assets were assessed for an indication of impairment as at 30 June 2016.
Derecognition
An item of property, plant and equipment is derecognised upon disposal or when no further future economic benefits are expected from its use or disposal.
2016 2015 $'000 $'000
Note 3.2B: Other Non-Financial Assets No more than 12 months 15,454 14,114 More than 12 months 7,915 4,496
Total other non-financial assets 23,369 18,610
No indicators of impairment were found for other non-financial assets.
Department of Social Services Annual Report 2015–2016
162
4
Cha
pter
4.1
Fi
nanc
ial s
tate
men
ts
Department of Social Services Notes to and forming part of the financial statements
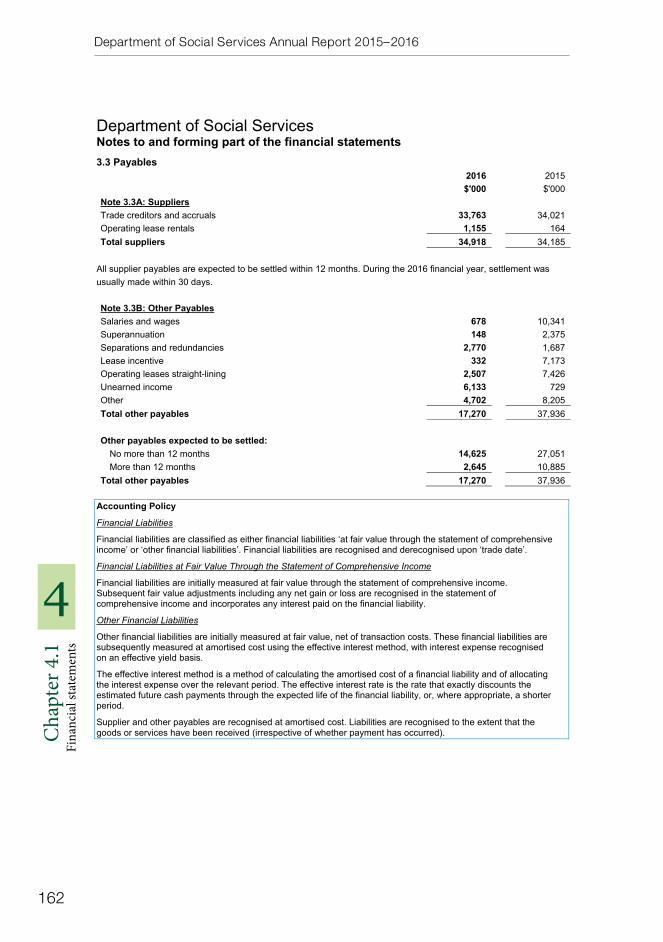
Payables 3.32016 2015 $'000 $'000
Note 3.3A: Suppliers Trade creditors and accruals 33,763 34,021 Operating lease rentals 1,155 164 Total suppliers 34,918 34,185
All supplier payables are expected to be settled within 12 months. During the 2016 financial year, settlement was usually made within 30 days.
Note 3.3B: Other Payables Salaries and wages 678 10,341 Superannuation 148 2,375 Separations and redundancies 2,770 1,687 Lease incentive 332 7,173 Operating leases straight-lining 2,507 7,426 Unearned income 6,133 729 Other 4,702 8,205 Total other payables 17,270 37,936
Other payables expected to be settled: No more than 12 months 14,625 27,051 More than 12 months 2,645 10,885
Total other payables 17,270 37,936
Accounting Policy
Financial Liabilities
Financial liabilities are classified as either financial liabilities ‘at fair value through the statement of comprehensive income’ or ‘other financial liabilities’. Financial liabilities are recognised and derecognised upon ‘trade date’.
Financial Liabilities at Fair Value Through the Statement of Comprehensive Income
Financial liabilities are initially measured at fair value through the statement of comprehensive income. Subsequent fair value adjustments including any net gain or loss are recognised in the statement of comprehensive income and incorporates any interest paid on the financial liability.
Other Financial Liabilities
Other financial liabilities are initially measured at fair value, net of transaction costs. These financial liabilities are subsequently measured at amortised cost using the effective interest method, with interest expense recognised on an effective yield basis.
The effective interest method is a method of calculating the amortised cost of a financial liability and of allocating the interest expense over the relevant period. The effective interest rate is the rate that exactly discounts the estimated future cash payments through the expected life of the financial liability, or, where appropriate, a shorter period.
Supplier and other payables are recognised at amortised cost. Liabilities are recognised to the extent that the goods or services have been received (irrespective of whether payment has occurred).
Part 4—Financial statements | Chapter 4: Financial statements
163
4C
hapt
er 4
.1
Fina
ncia
l sta
tem
ents
Department of Social Services Notes to and forming part of the financial statements
Other Provisions 3.4
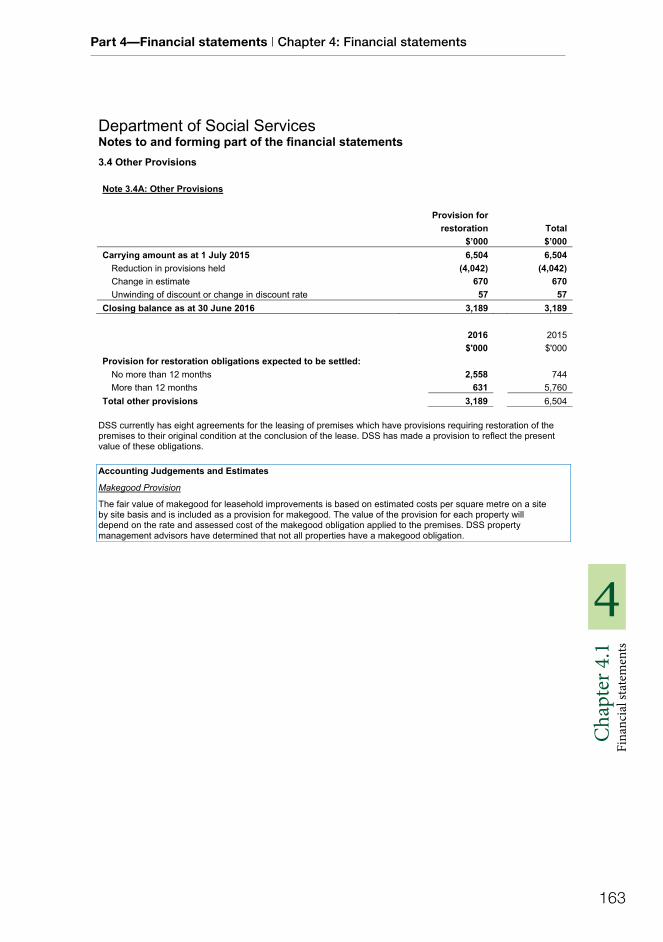
Note 3.4A: Other Provisions
Provision for restoration Total
$’000 $’000 Carrying amount as at 1 July 2015 6,504 6,504
Reduction in provisions held (4,042) (4,042) Change in estimate 670 670 Unwinding of discount or change in discount rate 57 57
Closing balance as at 30 June 2016 3,189 3,189
2016 2015 $'000 $'000
Provision for restoration obligations expected to be settled: No more than 12 months 2,558 744More than 12 months 631 5,760
Total other provisions 3,189 6,504
DSS currently has eight agreements for the leasing of premises which have provisions requiring restoration of the premises to their original condition at the conclusion of the lease. DSS has made a provision to reflect the present value of these obligations.
Accounting Judgements and Estimates
Makegood Provision
The fair value of makegood for leasehold improvements is based on estimated costs per square metre on a site by site basis and is included as a provision for makegood. The value of the provision for each property will depend on the rate and assessed cost of the makegood obligation applied to the premises. DSS property management advisors have determined that not all properties have a makegood obligation.

Department of Social Services Annual Report 2015–2016
164
4
Cha
pter
4.1
Fi
nanc
ial s
tate
men
ts
Department of Social Services Notes to and forming part of the financial statements 4. Assets and Liabilities Administered on Behalf of Government
Administered – Financial Assets 4.12016 2015
Note 4.1A: Receivables $'000 $'000 Personal benefits and subsidies:
Recovery of personal benefit payments1 4,031,832 4,019,449 Aged Care subsidies - 58,003
Total personal benefits and subsidies 4,031,832 4,077,452
Advances and loans: Advance payments for personal benefits 315,225 312,818 Aged Care facilities - 262,149 Student Financial Supplement Scheme2 411,400 531,200 Student Start-Up Loan 30,098 -Pension Loan Scheme 31,052 31,578 Other loans - 410
Total advances and loans 787,775 1,138,155
Other receivables: GST receivable from the Australian Taxation Office 14,626 19,043 Other receivables 13,551 30,222
Total other receivables 28,177 49,265
Total receivables (gross) 4,847,784 5,264,872 Less impairment allowance:
Personal benefits (1,014,345) (764,813) Other (10,514) (4,166)
Total impairment allowance (1,024,859) (768,979) Total receivables (net) 3,822,925 4,495,893
Receivables (gross) aged as follows: Not overdue 4,042,669 4,473,773 Overdue by: 0 to 30 days 27,024 30,379 31 to 60 days 25,063 20,733 61 to 90 days 21,786 24,708 More than 90 days 731,242 715,279
Total receivables (gross) 4,847,784 5,264,872 Impairment allowance aged as follows:
Not overdue (993,203) (745,157) Overdue by: 0 to 30 days (1,054) (730) 31 to 60 days (975) (517) 61 to 90 days (849) (527) More than 90 days (28,778) (22,048)
Total impairment allowance (1,024,859) (768,979)
1. Personal benefits mainly relate to Family Tax Benefit of $1,476.100 million (2015: $1,419.200 million), Parenting Payments of $782.787 million (2015: $697.840 million), Newstart Allowance of $647.005 million (2015: $485.257 million) and Disability Support Pension of $288.847 million (2015: $254.467 million).
2. Student Financial Supplement Scheme loan receivable is recognised at net value.

Part 4—Financial statements | Chapter 4: Financial statements
165
4C
hapt
er 4
.1
Fina
ncia
l sta
tem
ents
Department of Social Services Notes to and forming part of the financial statements 4.1 Administered – Financial Assets (continued)
2016 2015 Note 4.1A: Receivables (continued) $'000 $'000 Receivables (net) expected to be recovered:
No more than 12 months 1,178,040 1,213,423 More than 12 months 2,644,885 3,282,470
Total receivables (net) 3,822,925 4,495,893
Reconciliation of the Impairment Allowance:
Movement in total impairment allowance Receivables
2016 2015 $'000 $'000
Opening balance as at 1 July 768,979 676,069 Increase recognised in net loss 255,880 92,910
Closing balance as at 30 June 1,024,859 768,979
Accounting Policy
Loans and Receivables
Where loans and receivables are not subject to concessional treatment, they are carried at amortised cost using the effective interest method. Gains and losses due to impairment, derecognition and amortisation are recognised through the administered schedule of comprehensive income. Where loans are subject to concessional treatment, they are calculated using the discounted cash flow method. The discount and unwinding components of the concessional loans are recognised through the administered schedule of comprehensive income.
Significant Accounting Judgements and Estimates
Family Tax Benefit
At any point in time there are a number of eligible recipients who have received a benefit in excess of their entitlement and owe money to the Commonwealth. The Australian Government Actuary (AGA) has provided advice on the likely level of debt recovery.
The AGA also calculates the impairment allowance associated with the Family Tax Benefit (FTB) receivable. The allowance relies on periodic analysis of longitudinal unit record data to estimate the proportion of the outstanding non-lodger debt which might be considered receivable and the doubtful debt associated with each category of debt. An allowance is also made for debt which is not yet recorded on the DHS Debt Management Information System but is likely to have occurred. There is uncertainty associated with all elements of the estimation process, particularly given policy and apparent behavioural responses over recent years.
Student Financial Supplement Scheme
The Student Financial Supplement Scheme (SFSS) was a voluntary loan scheme for tertiary students to help cover their expenses while they studied. The SFSS closed on 31 December 2003 and no new loans have been issued since this date. Existing SFSS debts are collected through the tax system and voluntary repayments can also be made.
For the 2016 financial year, DSS engaged the AGA to provide the fair value estimate of the SFSS receivable as at 30 June 2016.
The model used by the AGA generates individual income profiles for all those who have an outstanding debt at the valuation date. The income projections are based on analysis of data provided by the ATO on the historical income distributions of those who have completed their study in the past. The model has a projection period of 45 years and the incomes generated are used to calculate the future compulsory repayments which are expected to be made against the outstanding debt.
The fair value of the receivable is then derived by discounting the nominal value of projected repayments using the yield curve for Commonwealth Government securities as at 30 June 2016.

Department of Social Services Annual Report 2015–2016
166
4
Cha
pter
4.1
Fi
nanc
ial s
tate
men
ts
Department of Social Services Notes to and forming part of the financial statements 4.1 Administered – Financial Assets (continued)
2016 2015 Note 4.1B: Investments in Commonwealth Entities and Other Interests $'000 $'000 Investments in Commonwealth entities:
National Disability Insurance Agency 125,586 51,035 Total investments in Commonwealth entities 125,586 51,035
Other interests: Yarra Community Housing 977 1,014
Total other interests 977 1,014 Total investments in Commonwealth entities and other interests 126,563 52,049
All investments in Commonwealth entities and other interests are expected to be recovered more than 12 months after the reporting period.
Accounting Policy
The above investments are reported at fair value, based on the latest management accounts or unaudited financial statements provided by each entity.
Administered Investments
Administered investments in subsidiaries, joint ventures and associates are not consolidated because their consolidation is relevant only at the whole of government level.
Administered investments other than those held for sale are classified as available-for-sale and are measured at their fair value as at 30 June 2016. Fair value has been taken to be the Australian Government's proportional interest in the net assets of the entities as at the end of the reporting period recorded in the latest management accounts or unaudited financial statements provided.
Investment in Commonwealth Entities
The Commonwealth has 100% of the equity interest in the National Disability Insurance Agency (NDIA). The NDIA provides individual control and choice in the delivery of reasonable and necessary care and support to improve the independence, and the social and economic participation of eligible people with disability, their families and carers, and associated referral services.
Investments in Other Interests
The Commonwealth has an interest in a property occupied by the Yarra Community Housing located in Melbourne. The principal activity of the entity is the provision of community housing facilities. The Commonwealth owns 31% of the unimproved market value of the land. The equity in this property is secured by a deed of agreement between the Commonwealth and the Yarra Community Housing Ltd, with the Commonwealth holding a controlling interest over the use of the property.
Administered – Non-Financial Assets 4.22016 2015 $'000 $'000
Note 4.2A: Other Non-Financial Assets Total prepayments expected to be recovered:
No more than 12 months - 44Total other non-financial assets - 44
No indicators of impairment were found for other non-financial assets.
Contractual commitments for the acquisition of property, plant, equipment and intangible assets
Commitments are payable as follows: Within 1 year - 5,517Between 1 to 5 years - 4,308
Total commitments - 9,825
Part 4—Financial statements | Chapter 4: Financial statements
167
4C
hapt
er 4
.1
Fina
ncia
l sta
tem
ents
Department of Social Services Notes to and forming part of the financial statements
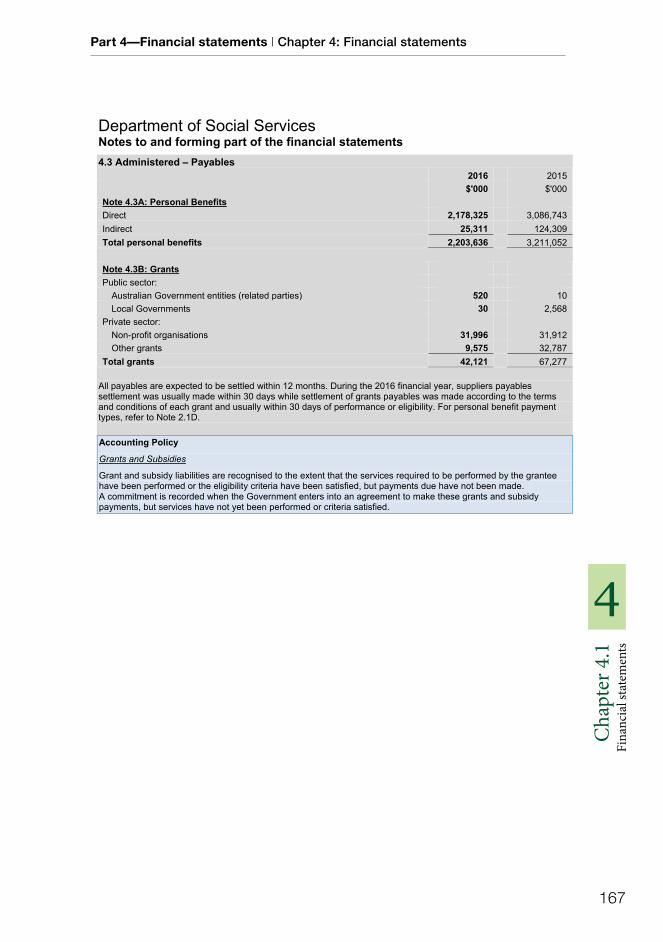
Administered – Payables4.32016 2015 $'000 $'000
Note 4.3A: Personal Benefits Direct 2,178,325 3,086,743 Indirect 25,311 124,309 Total personal benefits 2,203,636 3,211,052
Note 4.3B: Grants Public sector:
Australian Government entities (related parties) 520 10 Local Governments 30 2,568
Private sector: Non-profit organisations 31,996 31,912 Other grants 9,575 32,787
Total grants 42,121 67,277
All payables are expected to be settled within 12 months. During the 2016 financial year, suppliers payables settlement was usually made within 30 days while settlement of grants payables was made according to the terms and conditions of each grant and usually within 30 days of performance or eligibility. For personal benefit payment types, refer to Note 2.1D.
Accounting Policy
Grants and Subsidies
Grant and subsidy liabilities are recognised to the extent that the services required to be performed by the grantee have been performed or the eligibility criteria have been satisfied, but payments due have not been made. A commitment is recorded when the Government enters into an agreement to make these grants and subsidy payments, but services have not yet been performed or criteria satisfied.
Department of Social Services Annual Report 2015–2016
168
4
Cha
pter
4.1
Fi
nanc
ial s
tate
men
ts
Department of Social Services Notes to and forming part of the financial statements
Administered – Other Provisions 4.4
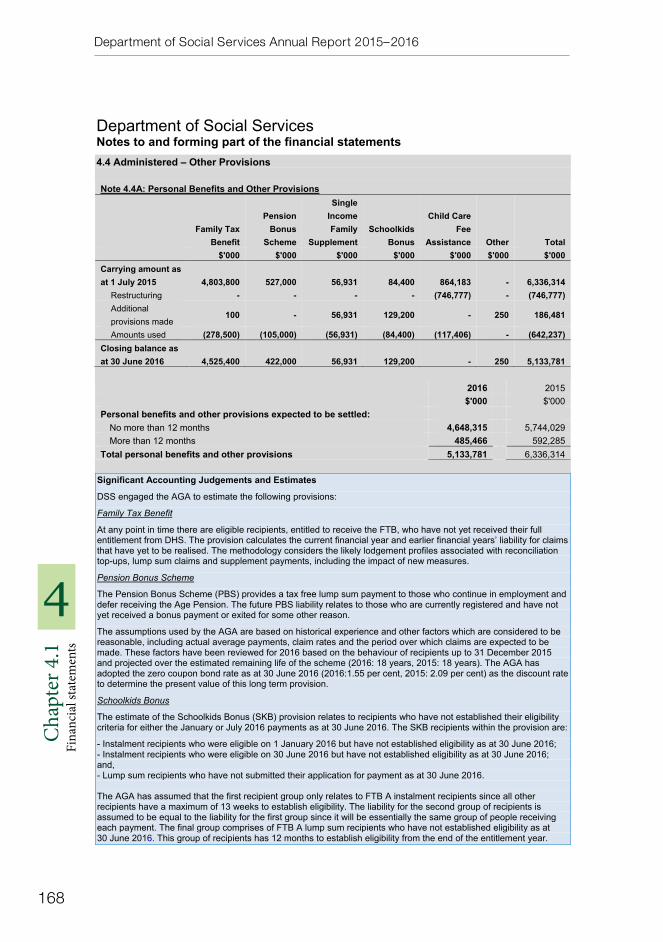
Note 4.4A: Personal Benefits and Other Provisions
Family Tax Benefit
Pension Bonus
Scheme
Single Income Family
Supplement Schoolkids
Bonus
Child Care Fee
Assistance Other Total $'000 $'000 $'000 $'000 $'000 $'000 $'000
Carrying amount as at 1 July 2015 4,803,800 527,000 56,931 84,400 864,183 - 6,336,314
Restructuring - - - - (746,777) - (746,777) Additional provisions made
100 - 56,931 129,200 - 250 186,481
Amounts used (278,500) (105,000) (56,931) (84,400) (117,406) - (642,237) Closing balance as at 30 June 2016 4,525,400 422,000 56,931 129,200 - 250 5,133,781
2016 2015 $'000 $'000
Personal benefits and other provisions expected to be settled: No more than 12 months 4,648,315 5,744,029 More than 12 months 485,466 592,285
Total personal benefits and other provisions 5,133,781 6,336,314
Significant Accounting Judgements and Estimates
DSS engaged the AGA to estimate the following provisions:
Family Tax Benefit
At any point in time there are eligible recipients, entitled to receive the FTB, who have not yet received their full entitlement from DHS. The provision calculates the current financial year and earlier financial years’ liability for claims that have yet to be realised. The methodology considers the likely lodgement profiles associated with reconciliation top-ups, lump sum claims and supplement payments, including the impact of new measures.
Pension Bonus Scheme
The Pension Bonus Scheme (PBS) provides a tax free lump sum payment to those who continue in employment and defer receiving the Age Pension. The future PBS liability relates to those who are currently registered and have not yet received a bonus payment or exited for some other reason.
The assumptions used by the AGA are based on historical experience and other factors which are considered to be reasonable, including actual average payments, claim rates and the period over which claims are expected to be made. These factors have been reviewed for 2016 based on the behaviour of recipients up to 31 December 2015 and projected over the estimated remaining life of the scheme (2016: 18 years, 2015: 18 years). The AGA has adopted the zero coupon bond rate as at 30 June 2016 (2016:1.55 per cent, 2015: 2.09 per cent) as the discount rate to determine the present value of this long term provision.
Schoolkids Bonus
The estimate of the Schoolkids Bonus (SKB) provision relates to recipients who have not established their eligibility criteria for either the January or July 2016 payments as at 30 June 2016. The SKB recipients within the provision are:
- Instalment recipients who were eligible on 1 January 2016 but have not established eligibility as at 30 June 2016; - Instalment recipients who were eligible on 30 June 2016 but have not established eligibility as at 30 June 2016; and, - Lump sum recipients who have not submitted their application for payment as at 30 June 2016.
The AGA has assumed that the first recipient group only relates to FTB A instalment recipients since all other recipients have a maximum of 13 weeks to establish eligibility. The liability for the second group of recipients is assumed to be equal to the liability for the first group since it will be essentially the same group of people receiving each payment. The final group comprises of FTB A lump sum recipients who have not established eligibility as at 30 June 2016. This group of recipients has 12 months to establish eligibility from the end of the entitlement year.
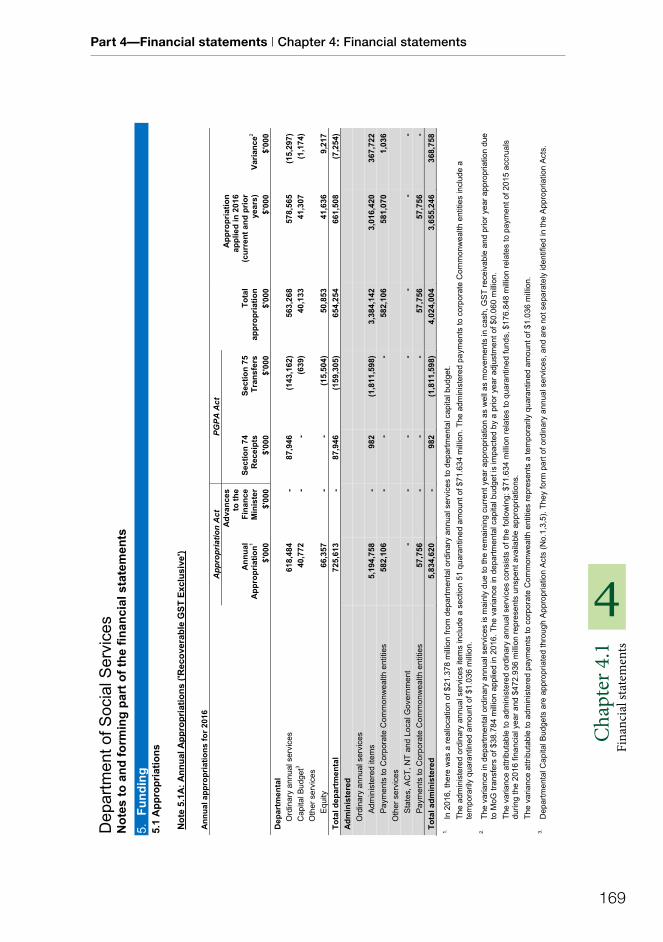
Part 4—Financial statements | Chapter 4: Financial statements
169
4C
hapt
er 4
.1
Fina
ncia
l sta
tem
ents
Dep
artm
ent o
f Soc
ial S
ervi
ces
Not
es to
and
form
ing
part
of t
he fi
nanc
ial s
tate
men
ts
5.Fu
ndin
g A
ppro
pria
tions
5.
1 Not
e 5.
1A: A
nnua
l App
ropr
iatio
ns ('
Rec
over
able
GST
Exc
lusi
ve')
Ann
ual a
ppro
pria
tions
for 2
016
App
ropr
iatio
n A
ct
PGPA
Act
Tota
l ap
prop
riatio
n
App
ropr
iatio
n ap
plie
d in
201
6 (c
urre
nt a
nd p
rior
year
s)
Ann
ual
App
ropr
iatio
n1
Adv
ance
s to
the
Fina
nce
Min
iste
r Se
ctio
n 74
R
ecei
pts
Sect
ion
75
Tran
sfer
s Va
rianc
e2
$'00
0 $'
000
$'00
0 $'
000
$'00
0 $'
000
$'00
0 D
epar
tmen
tal
O
rdin
ary
annu
al s
ervi
ces
618,
484
- 87
,946
(1
43,1
62)
563,
268
578,
565
(15,
297)
C
apita
l Bud
get3
40,7
72
- -
(639
) 40
,133
41
,307
(1
,174
) O
ther
ser
vice
s E
quity
66
,357
-
- (1
5,50
4)
50,8
53
41,6
36
9,21
7
Tota
l dep
artm
enta
l 72
5,61
3 -
87,9
46
(159
,305
) 65
4,25
4 66
1,50
8 (7
,254
) A
dmin
iste
red
Ord
inar
y an
nual
ser
vice
s A
dmin
iste
red
item
s 5,
194,
758
- 98
2(1
,811
,598
) 3,
384,
142
3,01
6,42
036
7,72
2P
aym
ents
to C
orpo
rate
Com
mon
wea
lth e
ntiti
es
582,
106
- -
- 58
2,10
658
1,07
01,
036
Oth
er s
ervi
ces
Sta
tes,
AC
T, N
T an
d Lo
cal G
over
nmen
t -
- -
- -
- -
Pay
men
ts to
Cor
pora
te C
omm
onw
ealth
ent
ities
57
,756
- -
- 57
,756
57,7
56 -
Tota
l adm
inis
tere
d 5,
834,
620
-98
2(1
,811
,598
) 4,
024,
004
3,65
5,24
6 36
8,75
8 1.
In 2
016,
ther
e w
as a
real
loca
tion
of $
21.3
78 m
illio
n fro
m d
epar
tmen
tal o
rdin
ary
annu
al s
ervi
ces
to d
epar
tmen
tal c
apita
l bud
get.
The
adm
inis
tere
d or
dina
ry a
nnua
l ser
vice
s ite
ms
incl
ude
a se
ctio
n 51
qua
rant
ined
am
ount
of $
71.6
34 m
illio
n. T
he a
dmin
iste
red
paym
ents
to c
orpo
rate
Com
mon
wea
lth e
ntiti
es in
clud
e a
tem
pora
rily
quar
antin
ed a
mou
nt o
f $1.
036
mill
ion.
2.
The
varia
nce
in d
epar
tmen
tal o
rdin
ary
annu
al s
ervi
ces
is m
ainl
y du
e to
the
rem
aini
ng c
urre
nt y
ear a
ppro
pria
tion
as w
ell a
s m
ovem
ents
in c
ash,
GS
T re
ceiv
able
and
prio
r yea
r app
ropr
iatio
n du
e to
MoG
tran
sfer
s of
$38
.784
mill
ion
appl
ied
in 2
016.
The
var
ianc
e in
dep
artm
enta
l cap
ital b
udge
t is
impa
cted
by
a pr
ior y
ear a
djus
tmen
t of $
0.06
0 m
illio
n.Th
e va
rianc
e at
tribu
tabl
e to
adm
inis
tere
d or
dina
ry a
nnua
l ser
vice
s co
nsis
ts o
f the
follo
win
g: $
71.6
34 m
illio
n re
late
s to
qua
rant
ined
fund
s, $
176.
848
mill
ion
rela
tes
to p
aym
ent o
f 201
5 ac
crua
ls
durin
g th
e 20
16 fi
nanc
ial y
ear a
nd $
472.
936
mill
ion
repr
esen
ts u
nspe
nt a
vaila
ble
appr
opria
tions
. Th
e va
rianc
e at
tribu
tabl
e to
adm
inis
tere
d pa
ymen
ts to
cor
pora
te C
omm
onw
ealth
ent
ities
repr
esen
ts a
tem
pora
rily
quar
antin
ed a
mou
nt o
f $1.
036
mill
ion.
3.
Dep
artm
enta
l Cap
ital B
udge
ts a
re a
ppro
pria
ted
thro
ugh
App
ropr
iatio
n A
cts
(No.
1,3,
5). T
hey
form
par
t of o
rdin
ary
annu
al s
ervi
ces,
and
are
not
sep
arat
ely
iden
tifie
d in
the
App
ropr
iatio
n A
cts.

Department of Social Services Annual Report 2015–2016
170
4
Cha
pter
4.1
Fi
nanc
ial s
tate
men
ts
Dep
artm
ent o
f Soc
ial S
ervi
ces
Not
es to
and
form
ing
part
of t
he fi
nanc
ial s
tate
men
ts
5.1
App
ropr
iatio
ns (c
ontin
ued)
N
ote
5.1A
: Ann
ual A
ppro
pria
tions
('R
ecov
erab
le G
ST E
xclu
sive
') (c
ontin
ued)
Ann
ual a
ppro
pria
tions
for 2
015
A
ppro
pria
tion
Act
P
GP
A A
ct
A
ppro
pria
tion
appl
ied
in 2
015
(cur
rent
and
pr
ior y
ears
) A
nnua
lA
ppro
pria
tion1,
2 A
FM
Sec
tion
74
Sec
tion
75
Tota
l ap
prop
riatio
n V
aria
nce3
$'00
0 $'
000
$'00
0 $'
000
$'00
0 $'
000
$'00
0 D
epar
tmen
tal
O
rdin
ary
annu
al s
ervi
ces4
605,
540
- 70
,463
24
,290
70
0,29
3 69
0,77
3 9,
520
C
apita
l Bud
get5
18,7
34
- -
439
19,1
73
22,8
34
(3,6
61)
Oth
er s
ervi
ces
Equ
ity
16,3
73
- -
- 16
,373
33
,826
(1
7,45
3)
Tota
l dep
artm
enta
l 64
0,64
7 -
70,4
63
24,7
29
735,
839
747,
433
(11,
594)
A
dmin
iste
red
Ord
inar
y an
nual
ser
vice
s A
dmin
iste
red
item
s 4,
533,
853
- 3,
464
239,
875
4,77
7,19
24,
180,
812
596,
380
Pay
men
ts to
Cor
pora
te C
omm
onw
ealth
ent
ities
32
9,76
2 -
- -
329,
762
309,
320
20,4
42O
ther
ser
vice
s S
tate
s, A
CT,
NT
and
Loca
l Gov
ernm
ent
- -
- -
- 51
7(5
17)
Pay
men
ts to
Cor
pora
te C
omm
onw
ealth
ent
ities
23
,349
- -
- 23
,349
23,3
49 -
Tota
l adm
inis
tere
d 4,
886,
964
-3,
464
239,
875
5,13
0,30
3 4,
513,
998
616,
305
1.Th
e ad
min
iste
red
ordi
nary
ann
ual s
ervi
ces
item
s in
clud
e $2
1.76
4 m
illio
n th
at h
ave
been
qua
rant
ined
but
not
yet
redu
ced
by la
w: $
8.27
9 m
illio
n re
late
s to
sav
ings
mea
sure
s, $
10.4
85 m
illio
n re
late
s to
mov
emen
t of f
unds
bet
wee
n ye
ars
and
$3.0
00 m
illio
n is
real
loca
ted
to d
epar
tmen
tal c
apita
l in
the
2015
fina
ncia
l yea
r.Th
e ad
min
iste
red
paym
ents
to c
orpo
rate
Com
mon
wea
lth e
ntiti
es in
clud
e $2
1.32
9 m
illio
n th
at h
as b
een
quar
antin
ed d
ue to
the
trans
fer o
f the
Sec
tor D
evel
opm
ent F
und
as a
resu
lt of
a
sect
ion
51 d
eter
min
atio
n.
2.In
201
5, th
ere
was
a n
et $
12.1
67 m
illio
n ad
just
men
t for
dep
artm
enta
l ord
inar
y an
nual
ser
vice
s th
at m
et th
e re
cogn
ition
crit
eria
of a
form
al re
duct
ion
in re
venu
e (in
acc
orda
nce
with
FR
R P
art 6
D
iv 3
), th
e ap
prop
riatio
ns h
ad n
ot b
een
amen
ded
befo
re th
e en
d of
the
repo
rting
per
iod.
3.
The
varia
nce
in d
epar
tmen
tal o
rdin
ary
annu
al s
ervi
ces
is m
ainl
y du
e to
the
rem
aini
ng c
urre
nt y
ear a
ppro
pria
tions
as
wel
l as
mov
emen
ts in
cas
h an
d G
ST
rece
ivab
le a
nd p
rior y
ear a
ppro
pria
tion
appl
ied
in 2
015.
The
ann
ual a
ppro
pria
tion
and
appr
opria
tion
appl
ied
in 2
015
also
incl
udes
an
amou
nt fo
r Dep
artm
enta
l Cap
ital B
udge
t.Th
e va
rianc
e at
tribu
tabl
e to
adm
inis
tere
d or
dina
ry a
nnua
l ser
vice
s co
nsis
ts o
f the
follo
win
g: $
21.7
64 m
illio
n re
late
s to
qua
rant
ined
fund
s, $
86.5
02 m
illio
n re
late
s to
pay
men
t of 2
014
accr
uals
du
ring
2015
, $66
1.11
8 m
illio
n re
pres
ents
uns
pent
ava
ilabl
e ap
prop
riatio
ns (w
hich
incl
udes
fund
ing
requ
ired
for 2
015
accr
uals
). Th
e va
rianc
e at
tribu
tabl
e to
adm
inis
tere
d pa
ymen
ts to
cor
pora
te C
omm
onw
ealth
ent
ities
is d
ue to
the
trans
fer o
f sec
tor d
evel
opm
ent f
und
of $
21.3
29 m
illio
n an
d a
paym
ent o
f 201
4 ac
crua
ls o
f $0
.887
mill
ion
durin
g th
e 20
15 fi
nanc
ial y
ear.
4.
Dep
artm
ent o
f Em
ploy
men
t spe
nt m
oney
from
the
Con
solid
ated
Rev
enue
Fun
d (C
RF)
on
beha
lf of
DS
S (A
dmin
iste
red)
. The
mon
ey s
pent
has
bee
n in
clud
ed in
the
tabl
e ab
ove.
5.
Dep
artm
enta
l Cap
ital B
udge
ts a
re a
ppro
pria
ted
thro
ugh
App
ropr
iatio
n A
ct (N
o. 1
, 3 &
5).
They
form
par
t of o
rdin
ary
annu
al s
ervi
ces,
and
are
not
sep
arat
ely
iden
tifie
d in
the
App
ropr
iatio
n A
cts.
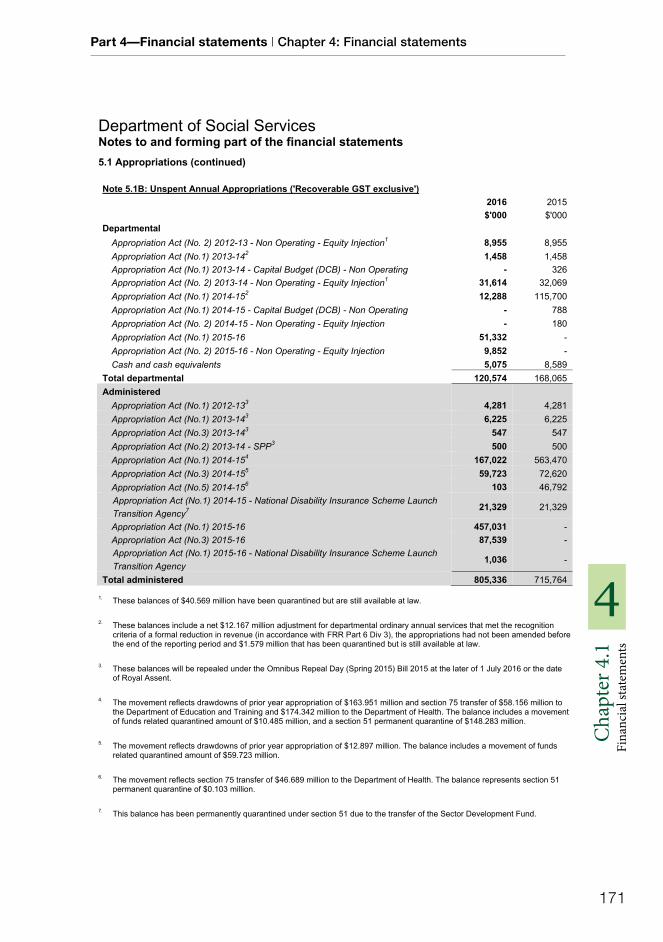
Part 4—Financial statements | Chapter 4: Financial statements
171
4C
hapt
er 4
.1
Fina
ncia
l sta
tem
ents
Department of Social Services Notes to and forming part of the financial statements 5.1 Appropriations (continued)
Note 5.1B: Unspent Annual Appropriations ('Recoverable GST exclusive') 2016 2015 $'000 $'000
Departmental Appropriation Act (No. 2) 2012-13 - Non Operating - Equity Injection1 8,955 8,955Appropriation Act (No.1) 2013-142 1,458 1,458Appropriation Act (No.1) 2013-14 - Capital Budget (DCB) - Non Operating - 326Appropriation Act (No. 2) 2013-14 - Non Operating - Equity Injection1 31,614 32,069 Appropriation Act (No.1) 2014-152 12,288 115,700 Appropriation Act (No.1) 2014-15 - Capital Budget (DCB) - Non Operating - 788Appropriation Act (No. 2) 2014-15 - Non Operating - Equity Injection - 180Appropriation Act (No.1) 2015-16 51,332 - Appropriation Act (No. 2) 2015-16 - Non Operating - Equity Injection 9,852 - Cash and cash equivalents 5,075 8,589
Total departmental 120,574 168,065 Administered
Appropriation Act (No.1) 2012-133 4,281 4,281Appropriation Act (No.1) 2013-143 6,225 6,225Appropriation Act (No.3) 2013-143 547 547Appropriation Act (No.2) 2013-14 - SPP3 500 500Appropriation Act (No.1) 2014-154 167,022 563,470 Appropriation Act (No.3) 2014-155 59,723 72,620 Appropriation Act (No.5) 2014-156 103 46,792 Appropriation Act (No.1) 2014-15 - National Disability Insurance Scheme Launch Transition Agency7 21,329 21,329
Appropriation Act (No.1) 2015-16 457,031 - Appropriation Act (No.3) 2015-16 87,539 - Appropriation Act (No.1) 2015-16 - National Disability Insurance Scheme Launch Transition Agency
1,036 -
Total administered 805,336 715,764
1. These balances of $40.569 million have been quarantined but are still available at law.
2. These balances include a net $12.167 million adjustment for departmental ordinary annual services that met the recognition criteria of a formal reduction in revenue (in accordance with FRR Part 6 Div 3), the appropriations had not been amended beforethe end of the reporting period and $1.579 million that has been quarantined but is still available at law.
3. These balances will be repealed under the Omnibus Repeal Day (Spring 2015) Bill 2015 at the later of 1 July 2016 or the date of Royal Assent.
4. The movement reflects drawdowns of prior year appropriation of $163.951 million and section 75 transfer of $58.156 million to the Department of Education and Training and $174.342 million to the Department of Health. The balance includes a movement of funds related quarantined amount of $10.485 million, and a section 51 permanent quarantine of $148.283 million.
5. The movement reflects drawdowns of prior year appropriation of $12.897 million. The balance includes a movement of funds related quarantined amount of $59.723 million.
6. The movement reflects section 75 transfer of $46.689 million to the Department of Health. The balance represents section 51 permanent quarantine of $0.103 million.
7. This balance has been permanently quarantined under section 51 due to the transfer of the Sector Development Fund.
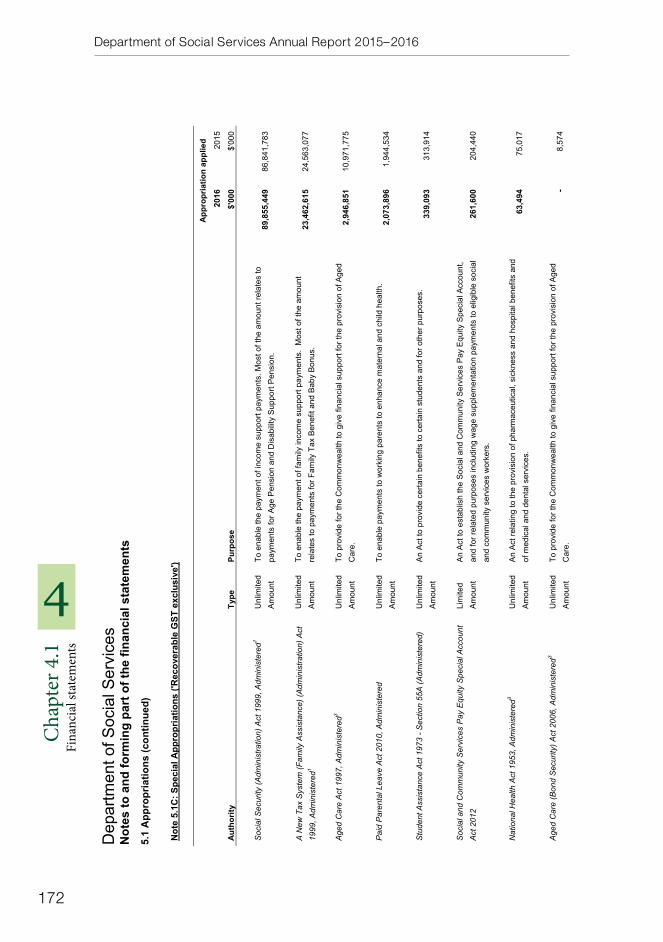
Department of Social Services Annual Report 2015–2016
172
4
Cha
pter
4.1
Fi
nanc
ial s
tate
men
ts
Dep
artm
ent o
f Soc
ial S
ervi
ces
Not
es to
and
form
ing
part
of t
he fi
nanc
ial s
tate
men
ts
5.1
App
ropr
iatio
ns (c
ontin
ued)
Not
e 5.
1C: S
peci
al A
ppro
pria
tions
('R
ecov
erab
le G
ST e
xclu
sive
')
Aut
horit
y Ty
pe
Purp
ose
App
ropr
iatio
n ap
plie
d
2016
20
15
$'00
0$'
000
Soc
ial S
ecur
ity (A
dmin
istra
tion)
Act
199
9, A
dmin
iste
red1
Unl
imite
dA
mou
ntTo
ena
ble
the
paym
ent o
f inc
ome
supp
ort p
aym
ents
. Mos
t of t
he a
mou
nt re
late
s to
pa
ymen
ts fo
r Age
Pen
sion
and
Dis
abili
ty S
uppo
rt P
ensi
on.
89,8
55,4
4986
,841
,783
A N
ew T
ax S
yste
m (F
amily
Ass
ista
nce)
(Adm
inis
tratio
n) A
ct
1999
, Adm
inis
tere
d1
Unl
imite
dA
mou
ntTo
ena
ble
the
paym
ent o
f fam
ily in
com
e su
ppor
t pay
men
ts.
Mos
t of t
he a
mou
nt
rela
tes
to p
aym
ents
for F
amily
Tax
Ben
efit
and
Bab
y B
onus
. 23
,462
,615
24,5
63,0
77
Age
d C
are
Act
199
7, A
dmin
iste
red3
Unl
imite
dA
mou
ntTo
pro
vide
for t
he C
omm
onw
ealth
to g
ive
finan
cial
sup
port
for t
he p
rovi
sion
of A
ged
Car
e.
2,94
6,85
110
,971
,775
Pai
d P
aren
tal L
eave
Act
201
0, A
dmin
iste
red
Unl
imite
dA
mou
ntTo
ena
ble
paym
ents
to w
orki
ng p
aren
ts to
enh
ance
mat
erna
l and
chi
ld h
ealth
. 2,
073,
896
1,94
4,53
4
Stu
dent
Ass
ista
nce
Act
197
3 - S
ectio
n 55
A (A
dmin
iste
red)
U
nlim
ited
Am
ount
An
Act
to p
rovi
de c
erta
in b
enef
its to
cer
tain
stu
dent
s an
d fo
r oth
er p
urpo
ses.
33
9,09
331
3,91
4
Soc
ial a
nd C
omm
unity
Ser
vice
s P
ay E
quity
Spe
cial
Acc
ount
A
ct 2
012
Lim
ited
Am
ount
An
Act
to e
stab
lish
the
Soc
ial a
nd C
omm
unity
Ser
vice
s P
ay E
quity
Spe
cial
Acc
ount
, an
d fo
r rel
ated
pur
pose
s in
clud
ing
wag
e su
pple
men
tatio
n pa
ymen
ts to
elig
ible
soc
ial
and
com
mun
ity s
ervi
ces
wor
kers
. 26
1,60
020
4,44
0
Nat
iona
l Hea
lth A
ct 1
953,
Adm
inis
tere
d3U
nlim
ited
Am
ount
An
Act
rela
ting
to th
e pr
ovis
ion
of p
harm
aceu
tical
, sic
knes
s an
d ho
spita
l ben
efits
and
of
med
ical
and
den
tal s
ervi
ces.
63
,494
75,0
17
Age
d C
are
(Bon
d S
ecur
ity) A
ct 2
006,
Adm
inis
tere
d3U
nlim
ited
Am
ount
To p
rovi
de fo
r the
Com
mon
wea
lth to
giv
e fin
anci
al s
uppo
rt fo
r the
pro
visi
on o
f Age
d C
are.
-
8,57
4

Part 4—Financial statements | Chapter 4: Financial statements
173
4C
hapt
er 4
.1
Fina
ncia
l sta
tem
ents
Dep
artm
ent o
f Soc
ial S
ervi
ces
Not
es to
and
form
ing
part
of t
he fi
nanc
ial s
tate
men
ts
5.1.
App
ropr
iatio
ns (c
ontin
ued)
Not
e 5.
1C: S
peci
al A
ppro
pria
tions
('R
ecov
erab
le G
ST e
xclu
sive
') (c
ontin
ued)
Aut
horit
y Ty
pe
Purp
ose
App
ropr
iatio
n ap
plie
d
2016
20
15
$'00
0$'
000
Ear
ly Y
ears
Qua
lity
Fund
Spe
cial
Acc
ount
Act
201
32Li
mite
dA
mou
ntA
n A
ct to
pro
vide
fund
ing
to a
ppro
ved
cent
reba
sed
long
day
car
e se
rvic
es, t
o be
use
d ex
clus
ivel
y fo
r pay
ing
rem
uner
atio
n, a
nd o
ther
em
ploy
men
t-rel
ated
cos
ts a
nd
expe
nses
, in
rela
tion
to e
mpl
oyee
s in
the
early
chi
ldho
od e
duca
tion
and
care
sec
tor.
- 16
5,00
0
Pub
lic G
over
nanc
e, P
erfo
rman
ce a
nd A
ccou
ntab
ility
Act
20
13 -
Sec
tion
77, A
dmin
iste
red
Ref
und
To p
rovi
de a
n ap
prop
riatio
n w
here
an
Act
or o
ther
law
requ
ires
or p
erm
its th
e re
paym
ent o
f an
amou
nt re
ceiv
ed b
y th
e C
omm
onw
ealth
and
apa
rt fro
m th
is s
ectio
n th
ere
is n
o sp
ecifi
c ap
prop
riatio
n fo
r the
repa
ymen
t. 18
123
6
Bus
ines
s S
ervi
ces
Wag
e A
sses
smen
t Too
l Pay
men
t Sch
eme
Act
201
5 --
Sec
tion
99,A
dmin
iste
red4
Lim
ited
Am
ount
An
Act
to e
stab
lish
the
BS
WA
T pa
ymen
t sch
eme
for m
akin
g pa
ymen
ts in
rela
tion
to
the
use
of th
e B
usin
ess
Ser
vice
s W
age
Ass
essm
ent T
ool.
860
-
Tota
l spe
cial
app
ropr
iatio
ns a
pplie
d
11
9,00
4,03
9 12
5,08
8,35
0
1.D
VA
spe
nt m
oney
from
the
CR
F on
beh
alf o
f DS
S a
gain
st th
e fo
llow
ing
spec
ial a
ppro
pria
tions
:
- S
ocia
l Sec
urity
(Adm
inis
tratio
n) A
ct 1
999,
Adm
inis
tere
d; a
nd
- A
New
Tax
Sys
tem
(Fam
ily A
ssis
tanc
e) (A
dmin
istra
tion)
Act
199
9, A
dmin
iste
red.
2.R
espo
nsib
ility
for t
he a
dmin
istra
tion
of a
n el
emen
t of t
his
Act
tran
sfer
red
to th
e D
epar
tmen
t of E
duca
tion
and
Trai
ning
on
21 S
epte
mbe
r 201
5.
3.R
espo
nsib
ility
for t
he a
dmin
istra
tion
of th
is A
ct tr
ansf
erre
d to
the
Dep
artm
ent o
f Hea
lth o
n 30
Sep
tem
ber 2
015.
4.
The
2016
app
ropr
iatio
n ap
plie
d re
late
s to
am
ount
s pr
edom
inan
tly u
sed
for e
stab
lishm
ent a
nd a
dmin
istra
tion
cost
s of
the
BS
WA
T pa
ymen
t sch
eme.

Department of Social Services Annual Report 2015–2016
174
4
Cha
pter
4.1
Fi
nanc
ial s
tate
men
ts
Department of Social Services Notes to and forming part of the financial statements 5.1 Appropriations (continued)
Note 5.1D: Disclosure by Agent in Relation to Annual and Special Appropriations ('Recoverable GST exclusive')
Attorney-General's Department1
2016 $'000 Total receipts 155,403Total payments (155,403)
Attorney-General's Department1
2015 $'000
Total receipts 155,437 Total payments (155,437)
1. DSS has drawing rights for Attorney-General's Department annual appropriation for the Family Relationship Services program.

Part 4—Financial statements | Chapter 4: Financial statements
175
4C
hapt
er 4
.1
Fina
ncia
l sta
tem
ents
Department of Social Services Notes to and forming part of the financial statements
Special Accounts 5.2
Social and Community Services Pay Equity Special
Account1
Services for Other Entities and Trust Moneys2
2016 2015 2016 2015 $'000 $'000 $'000 $'000
Balance brought forward from previous period 175,432 118,598 21,914 6,788Increases: Total increase 262,887 205,009 18,313 22,306 Available for payments 438,319 323,607 40,227 29,094 Decreases: Administered
Payments made (236,124) (148,175) (13,427) (7,180) Balance transferred to the Department of Health - - (3,171) -
Total administered (236,124) (148,175) (16,598) (7,180) Total decreases (236,124) (148,175) (16,598) (7,180) Total balance carried to the next period 202,195 175,432 23,629 21,914
Early Years Quality Fund Special Account3
National Disability Special Account4
2016 2015 2016 2015 $'000 $'000 $'000 $'000
Balance brought forward from previous period 105,395 - 7,046 7,629Increases: Total increase 201 189,857 - -Available for payments 105,596 189,857 7,046 7,629 Decreases: Administered
Payments made (3,548) (84,462) (1,379) (583) Balance transferred to the Department of Education and Training (102,048) - - -
Total administered (105,596) (84,462) (1,379) (583) Total decreases (105,596) (84,462) (1,379) (583) Total balance carried to the next period - 105,395 5,667 7,046

Department of Social Services Annual Report 2015–2016
176
4
Cha
pter
4.1
Fi
nanc
ial s
tate
men
ts
Department of Social Services Notes to and forming part of the financial statements 5.2 Special Accounts (continued)
Social and Community Services Pay Equity Special Account1. Appropriation: Public Governance, Performance and Accountability Act 2013; section 80.
Establishing Instrument: Social and Community Services Pay Equity Special Account Act 2012; section 5.
Purpose: To distribute the Commonwealth's contribution of its share of the equal remuneration order pay increases for social and community service sector workers in Commonwealth-funded programs.
This account was established on 8 November 2012 in accordance with the Social and Community Services Pay Equity Special Account Act 2012.
This account is non-interest bearing and the balance is held in the Official Public Account.
Services for Other Entities and Trust Moneys 2. Appropriation: Public Governance, Performance and Accountability Act 2013; section 78.
Establishing Instrument: Financial Management and Accountability Determination 2010/14.
Purpose: For the disbursement of amounts held on trust or otherwise for the benefit of a person other than the Commonwealth and for services relating to other governments and bodies that are not PGPA Act Agencies.
This account is non-interest bearing and the balance is held in the Official Public Account.
This Special Account consists of the following sub-accounts:
National Framework.
National Campaign - Violence Against Women.
National Centre of Excellence.
Home and Community Care Planning and Development.
The Way Forward Cross Jurisdictional Work.
Community Care Access Support System.
Survey of Disability, Ageing and Carers.
The sub-accounts Home and Community Care Planning and Development, The Way Forward Jurisdictional Work, Community Care Access Support System and Survey of Disability, Ageing and Carers have transferred to the Department of Health as a result of the AAO issued on the 30 September 2015.
Early Years Quality Fund Special Account3. Appropriation: Public Governance, Performance and Accountability Act 2013; section 80.
Establishing Instrument: Early Years Quality Fund Special Account Act 2013.
Purpose: To improve quality outcomes for children in early childhood education and care services by enhancing professionalism in the early childhood education and care sector, including through improved attraction and retention of a skilled and professional workforce.
This account transferred to the Department of Education and Training as a result of the AAO issued on 21 September 2015.
This account is non-interest bearing and the balance is held in the Official Public Account.
National Disability Special Account4. Appropriation: Public Governance, Performance and Accountability Act 2013; section 78.
Establishing Instrument: Financial Management and Accountability Determination 2006/30.
Purpose: For expenditure on projects that relate to the National Disability Special Account.
This account is non-interest bearing and the balance is held in the Official Public Account.
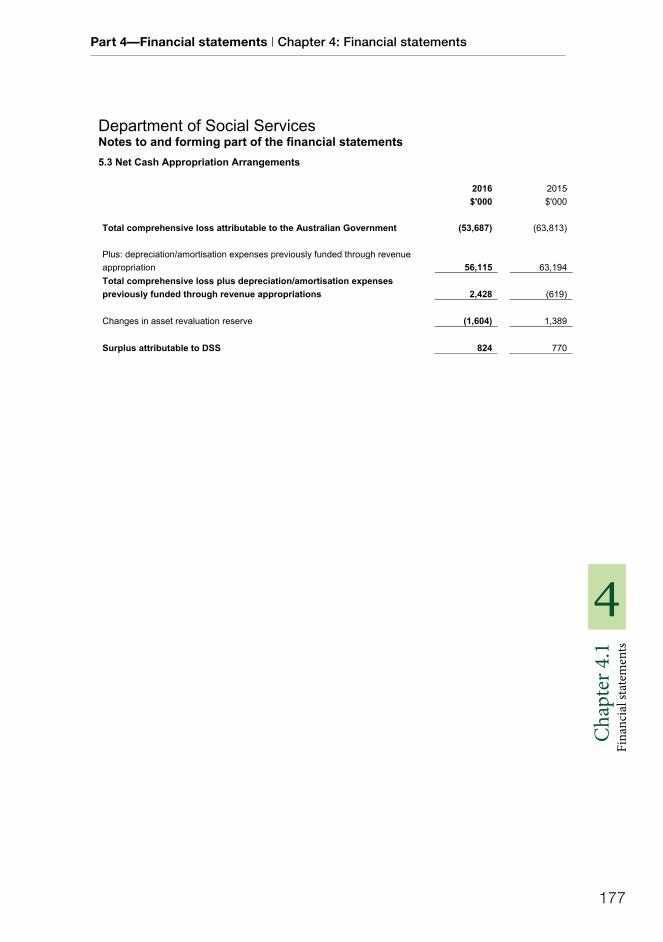
Part 4—Financial statements | Chapter 4: Financial statements
177
4C
hapt
er 4
.1
Fina
ncia
l sta
tem
ents
Department of Social Services Notes to and forming part of the financial statements
Net Cash Appropriation Arrangements 5.3
2016 2015 $'000 $'000
Total comprehensive loss attributable to the Australian Government (53,687) (63,813)
Plus: depreciation/amortisation expenses previously funded through revenue appropriation 56,115 63,194 Total comprehensive loss plus depreciation/amortisation expenses previously funded through revenue appropriations 2,428 (619)
Changes in asset revaluation reserve (1,604) 1,389
Surplus attributable to DSS 824 770
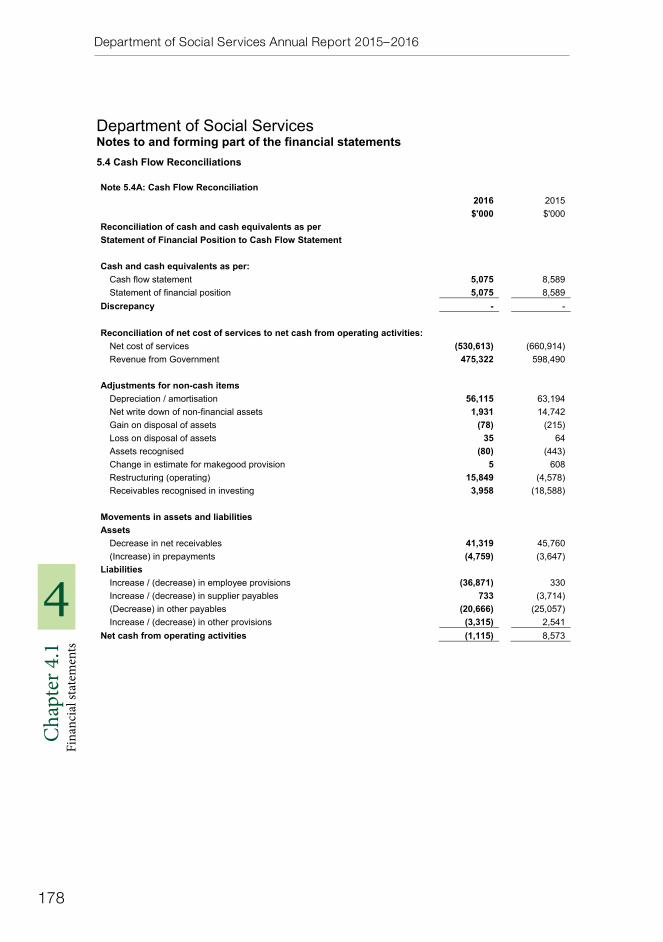
Department of Social Services Annual Report 2015–2016
178
4
Cha
pter
4.1
Fi
nanc
ial s
tate
men
ts
Department of Social Services Notes to and forming part of the financial statements
Cash Flow Reconciliations 5.4
Note 5.4A: Cash Flow Reconciliation 2016 2015 $'000 $'000
Reconciliation of cash and cash equivalents as per Statement of Financial Position to Cash Flow Statement
Cash and cash equivalents as per: Cash flow statement 5,075 8,589 Statement of financial position 5,075 8,589
Discrepancy - -
Reconciliation of net cost of services to net cash from operating activities: Net cost of services (530,613) (660,914) Revenue from Government 475,322 598,490
Adjustments for non-cash items Depreciation / amortisation 56,115 63,194 Net write down of non-financial assets 1,931 14,742 Gain on disposal of assets (78) (215) Loss on disposal of assets 35 64Assets recognised (80) (443) Change in estimate for makegood provision 5 608Restructuring (operating) 15,849 (4,578) Receivables recognised in investing 3,958 (18,588)
Movements in assets and liabilities Assets
Decrease in net receivables 41,319 45,760 (Increase) in prepayments (4,759) (3,647)
Liabilities Increase / (decrease) in employee provisions (36,871) 330Increase / (decrease) in supplier payables 733 (3,714) (Decrease) in other payables (20,666) (25,057) Increase / (decrease) in other provisions (3,315) 2,541
Net cash from operating activities (1,115) 8,573
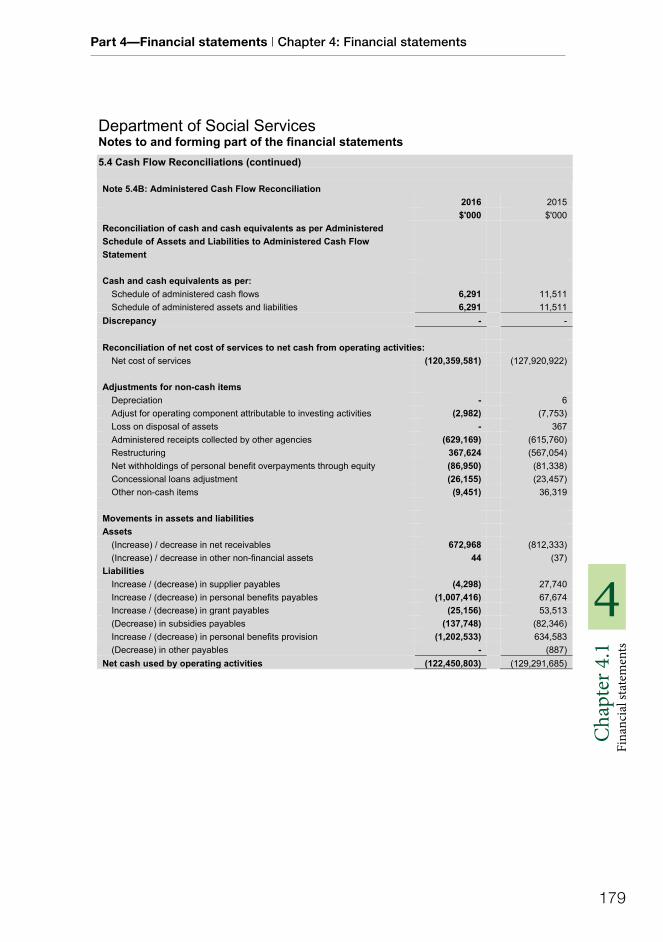
Part 4—Financial statements | Chapter 4: Financial statements
179
4C
hapt
er 4
.1
Fina
ncia
l sta
tem
ents
Department of Social Services Notes to and forming part of the financial statements 5.4 Cash Flow Reconciliations (continued)
Note 5.4B: Administered Cash Flow Reconciliation 2016 2015 $'000 $'000
Reconciliation of cash and cash equivalents as per Administered Schedule of Assets and Liabilities to Administered Cash Flow Statement
Cash and cash equivalents as per: Schedule of administered cash flows 6,291 11,511 Schedule of administered assets and liabilities 6,291 11,511
Discrepancy - -
Reconciliation of net cost of services to net cash from operating activities: Net cost of services (120,359,581) (127,920,922)
Adjustments for non-cash items Depreciation - 6Adjust for operating component attributable to investing activities (2,982) (7,753) Loss on disposal of assets - 367Administered receipts collected by other agencies (629,169) (615,760) Restructuring 367,624 (567,054) Net withholdings of personal benefit overpayments through equity (86,950) (81,338) Concessional loans adjustment (26,155) (23,457) Other non-cash items (9,451) 36,319
Movements in assets and liabilities Assets
(Increase) / decrease in net receivables 672,968 (812,333) (Increase) / decrease in other non-financial assets 44 (37)
Liabilities Increase / (decrease) in supplier payables (4,298) 27,740 Increase / (decrease) in personal benefits payables (1,007,416) 67,674 Increase / (decrease) in grant payables (25,156) 53,513 (Decrease) in subsidies payables (137,748) (82,346) Increase / (decrease) in personal benefits provision (1,202,533) 634,583 (Decrease) in other payables - (887)
Net cash used by operating activities (122,450,803) (129,291,685)
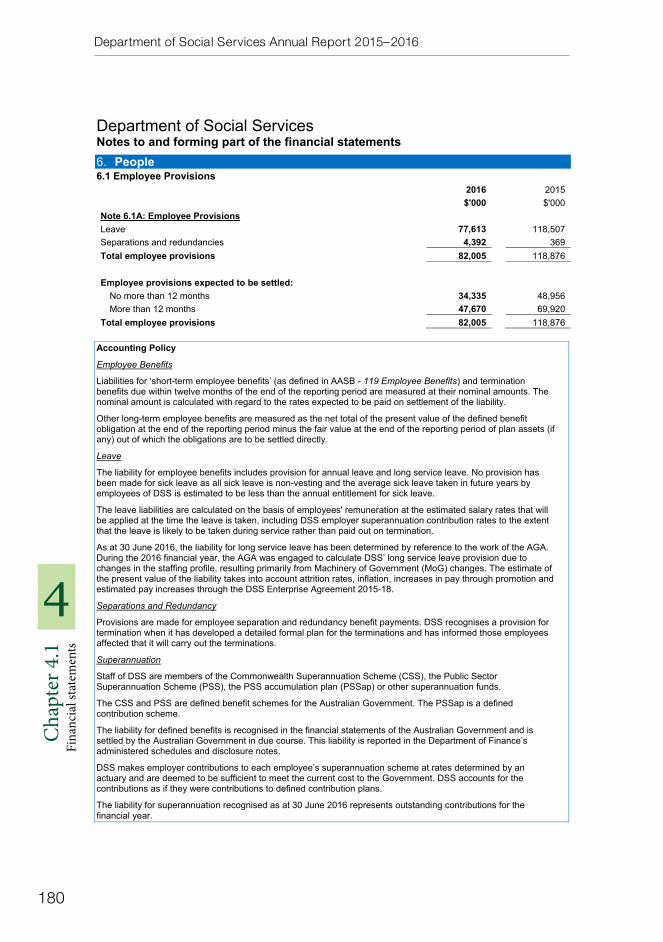
Department of Social Services Annual Report 2015–2016
180
4
Cha
pter
4.1
Fi
nanc
ial s
tate
men
ts
Department of Social Services Notes to and forming part of the financial statements 6. People
Employee Provisions 6.12016 2015 $'000 $'000
Note 6.1A: Employee Provisions Leave 77,613 118,507 Separations and redundancies 4,392 369 Total employee provisions 82,005 118,876
Employee provisions expected to be settled: No more than 12 months 34,335 48,956 More than 12 months 47,670 69,920
Total employee provisions 82,005 118,876
Accounting Policy
Employee Benefits
Liabilities for ‘short-term employee benefits’ (as defined in AASB - 119 Employee Benefits) and termination benefits due within twelve months of the end of the reporting period are measured at their nominal amounts. The nominal amount is calculated with regard to the rates expected to be paid on settlement of the liability.
Other long-term employee benefits are measured as the net total of the present value of the defined benefit obligation at the end of the reporting period minus the fair value at the end of the reporting period of plan assets (if any) out of which the obligations are to be settled directly.
Leave
The liability for employee benefits includes provision for annual leave and long service leave. No provision has been made for sick leave as all sick leave is non-vesting and the average sick leave taken in future years by employees of DSS is estimated to be less than the annual entitlement for sick leave.
The leave liabilities are calculated on the basis of employees' remuneration at the estimated salary rates that will be applied at the time the leave is taken, including DSS employer superannuation contribution rates to the extent that the leave is likely to be taken during service rather than paid out on termination.
As at 30 June 2016, the liability for long service leave has been determined by reference to the work of the AGA. During the 2016 financial year, the AGA was engaged to calculate DSS’ long service leave provision due to changes in the staffing profile, resulting primarily from Machinery of Government (MoG) changes. The estimate of the present value of the liability takes into account attrition rates, inflation, increases in pay through promotion and estimated pay increases through the DSS Enterprise Agreement 2015-18.
Separations and Redundancy
Provisions are made for employee separation and redundancy benefit payments. DSS recognises a provision for termination when it has developed a detailed formal plan for the terminations and has informed those employees affected that it will carry out the terminations.
Superannuation
Staff of DSS are members of the Commonwealth Superannuation Scheme (CSS), the Public Sector Superannuation Scheme (PSS), the PSS accumulation plan (PSSap) or other superannuation funds.
The CSS and PSS are defined benefit schemes for the Australian Government. The PSSap is a defined contribution scheme.
The liability for defined benefits is recognised in the financial statements of the Australian Government and is settled by the Australian Government in due course. This liability is reported in the Department of Finance’s administered schedules and disclosure notes.
DSS makes employer contributions to each employee’s superannuation scheme at rates determined by an actuary and are deemed to be sufficient to meet the current cost to the Government. DSS accounts for the contributions as if they were contributions to defined contribution plans.
The liability for superannuation recognised as at 30 June 2016 represents outstanding contributions for the financial year.
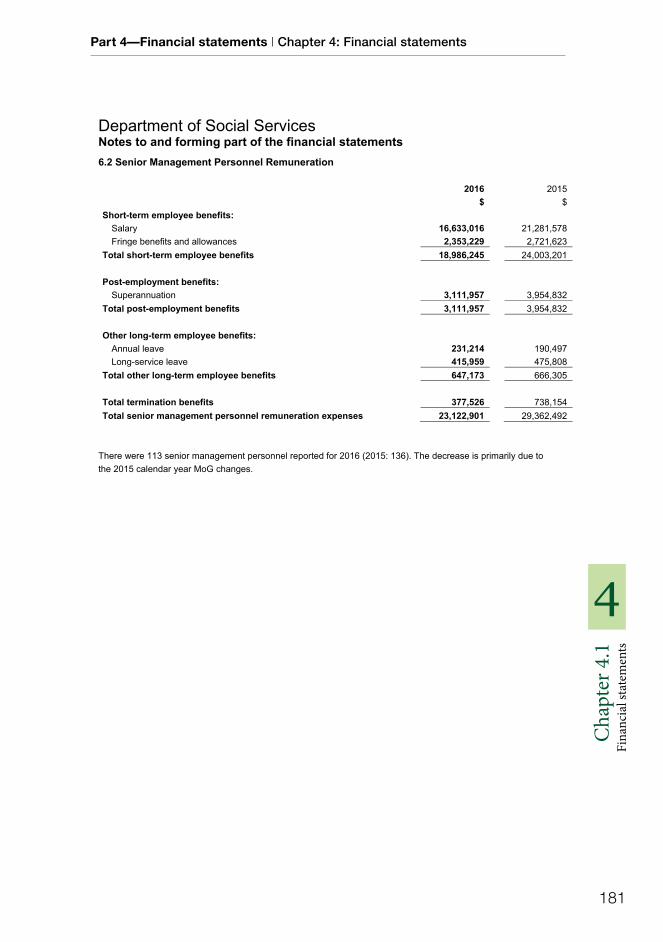
Part 4—Financial statements | Chapter 4: Financial statements
181
4C
hapt
er 4
.1
Fina
ncia
l sta
tem
ents
Department of Social Services Notes to and forming part of the financial statements
Senior Management Personnel Remuneration 6.2
2016 2015 $ $
Short-term employee benefits: Salary 16,633,016 21,281,578 Fringe benefits and allowances 2,353,229 2,721,623
Total short-term employee benefits 18,986,245 24,003,201
Post-employment benefits: Superannuation 3,111,957 3,954,832
Total post-employment benefits 3,111,957 3,954,832
Other long-term employee benefits: Annual leave 231,214 190,497 Long-service leave 415,959 475,808
Total other long-term employee benefits 647,173 666,305
Total termination benefits 377,526 738,154 Total senior management personnel remuneration expenses 23,122,901 29,362,492
There were 113 senior management personnel reported for 2016 (2015: 136). The decrease is primarily due to the 2015 calendar year MoG changes.
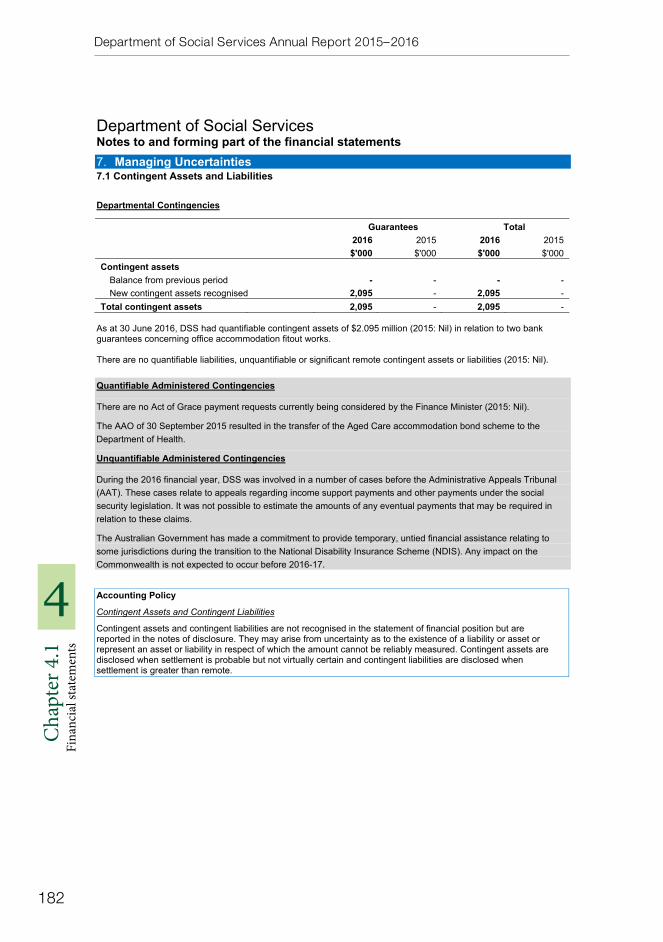
Department of Social Services Annual Report 2015–2016
182
4
Cha
pter
4.1
Fi
nanc
ial s
tate
men
ts
Department of Social Services Notes to and forming part of the financial statements 7. Managing Uncertainties
Contingent Assets and Liabilities 7.1
Departmental Contingencies
Guarantees Total 2016 2015 2016 2015 $'000 $'000 $'000 $'000
Contingent assets Balance from previous period - - - -New contingent assets recognised 2,095 - 2,095 -
Total contingent assets 2,095 - 2,095 -
As at 30 June 2016, DSS had quantifiable contingent assets of $2.095 million (2015: Nil) in relation to two bank guarantees concerning office accommodation fitout works.
There are no quantifiable liabilities, unquantifiable or significant remote contingent assets or liabilities (2015: Nil).
Quantifiable Administered Contingencies
There are no Act of Grace payment requests currently being considered by the Finance Minister (2015: Nil).
The AAO of 30 September 2015 resulted in the transfer of the Aged Care accommodation bond scheme to the Department of Health.
Unquantifiable Administered Contingencies
During the 2016 financial year, DSS was involved in a number of cases before the Administrative Appeals Tribunal (AAT). These cases relate to appeals regarding income support payments and other payments under the social security legislation. It was not possible to estimate the amounts of any eventual payments that may be required in relation to these claims.
The Australian Government has made a commitment to provide temporary, untied financial assistance relating to some jurisdictions during the transition to the National Disability Insurance Scheme (NDIS). Any impact on the Commonwealth is not expected to occur before 2016-17.
Accounting Policy
Contingent Assets and Contingent Liabilities
Contingent assets and contingent liabilities are not recognised in the statement of financial position but are reported in the notes of disclosure. They may arise from uncertainty as to the existence of a liability or asset or represent an asset or liability in respect of which the amount cannot be reliably measured. Contingent assets are disclosed when settlement is probable but not virtually certain and contingent liabilities are disclosed when settlement is greater than remote.

Part 4—Financial statements | Chapter 4: Financial statements
183
4C
hapt
er 4
.1
Fina
ncia
l sta
tem
ents
Department of Social Services Notes to and forming part of the financial statements
Financial Instruments 7.2
Note 7.2A: Credit Risk
DSS is exposed to minimal credit risk as loans and receivables are cash, trade receivables and other receivables. The maximum exposure to credit risk is the risk that arises from potential default of a debtor. This amount is equal to the total amount of trade and other receivables that is $14.953 million in 2016 (2015: $13.627 million).
DSS has assessed the risk of the default on payment and $0.121 million has been allocated in 2016 (2015: Nil) to an impairment allowance account for trade receivables. DSS manages its credit risk by undertaking background and credit checks prior to allowing a debtor relationship. In addition, DSS has policies and procedures that guide employees' application of debt recovery techniques.
DSS holds no collateral to mitigate against credit risk.
Maximum exposure to credit risk (excluding any collateral or credit enhancements) 2016 2015 $'000 $'000
Financial assets carried at amount not best representing maximum exposure to credit risk
Cash and cash equivalents 5,075 8,589Trade and other receivables 14,953 13,627
Total financial assets carried at amount not best representing maximum exposure to credit risk 20,028 22,216
Credit quality of financial instruments not past due or individually determined as impaired Not past due nor
impairedNot past due nor impaired
Past due or impaired
Past due or impaired
2016 2015 2016 2015 $'000 $'000 $'000 $'000
Receivables for goods and services 12,097 4,424 1,333 201Other 1,327 8,747 196 255
Total 13,424 13,171 1,529 456
Ageing of financial assets that were past due but not impaired for 2016 0 to 30 31 to 60 61 to 90 90+
days days days days Total $'000 $'000 $'000 $'000 $'000
Receivables for goods and services 816 440 33 35 1,324 Other 10 12 20 42 84
Total 826 452 53 77 1,408
Ageing of financial assets that were past due but not impaired for 2015 0 to 30 31 to 60 61 to 90 90+
days days days days Total $'000 $'000 $'000 $'000 $'000
Receivables for goods and services 201 - - - 201Other 216 8 - 31 255
Total 417 8 - 31 456

Department of Social Services Annual Report 2015–2016
184
4
Cha
pter
4.1
Fi
nanc
ial s
tate
men
ts
Department of Social Services Notes to and forming part of the financial statements 7.2 Financial Instruments (continued)
Note 7.2B: Liquidity Risk
DSS' financial liabilities are payables. The exposure to liquidity risk was based on the notion that DSS will encounter difficulty in meeting its obligations associated with financial liabilities. This is highly unlikely as DSS is appropriated funding from the Australian Government and DSS manages its appropriations to ensure it has adequate funds to meet payments as they fall due. In addition, DSS has policies in place to ensure timely payments are made when due and has no past experience of default.
The maturities for financial liabilities for DSS are within one year in both the current and prior financial year.
DSS has no derivative financial liabilities in both the current and prior financial year.
Note 7.2C: Market Risk
DSS holds both basic financial instruments, available for sale and held-to-maturity investments that do not expose DSS to certain market risks. DSS is not exposed to 'Currency risk', 'Other price risk' or 'Interest rate risk'.
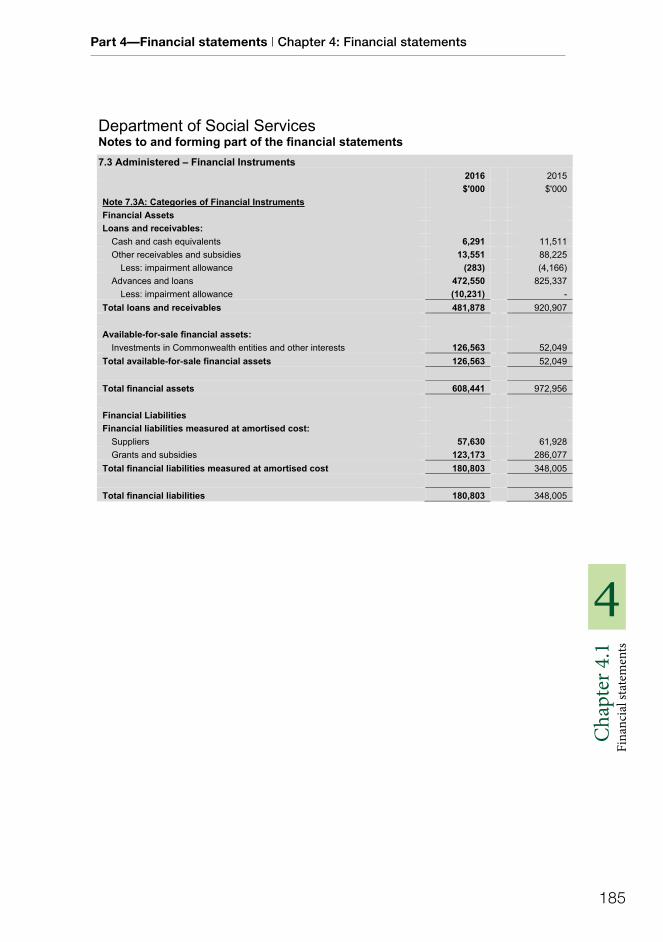
Part 4—Financial statements | Chapter 4: Financial statements
185
4C
hapt
er 4
.1
Fina
ncia
l sta
tem
ents
Department of Social Services Notes to and forming part of the financial statements
Administered – Financial Instruments 7.32016 2015 $'000 $'000
Note 7.3A: Categories of Financial Instruments Financial Assets Loans and receivables:
Cash and cash equivalents 6,291 11,511 Other receivables and subsidies 13,551 88,225
Less: impairment allowance (283) (4,166) Advances and loans 472,550 825,337
Less: impairment allowance (10,231) - Total loans and receivables 481,878 920,907
Available-for-sale financial assets: Investments in Commonwealth entities and other interests 126,563 52,049
Total available-for-sale financial assets 126,563 52,049
Total financial assets 608,441 972,956
Financial Liabilities Financial liabilities measured at amortised cost:
Suppliers 57,630 61,928 Grants and subsidies 123,173 286,077
Total financial liabilities measured at amortised cost 180,803 348,005
Total financial liabilities 180,803 348,005
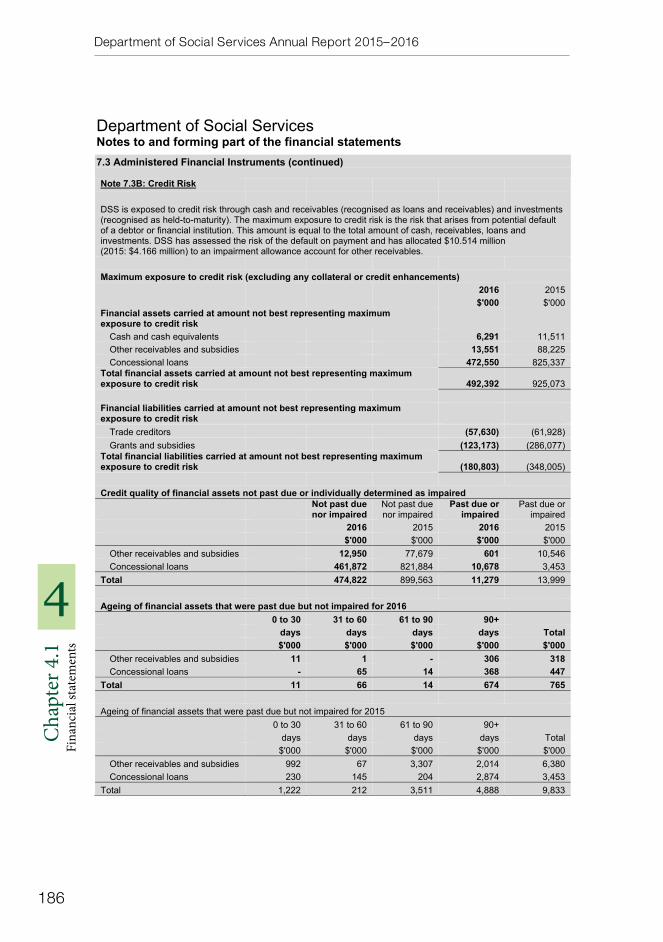
Department of Social Services Annual Report 2015–2016
186
4
Cha
pter
4.1
Fi
nanc
ial s
tate
men
ts
Department of Social Services Notes to and forming part of the financial statements 7.3 Administered Financial Instruments (continued)
Note 7.3B: Credit Risk
DSS is exposed to credit risk through cash and receivables (recognised as loans and receivables) and investments (recognised as held-to-maturity). The maximum exposure to credit risk is the risk that arises from potential default of a debtor or financial institution. This amount is equal to the total amount of cash, receivables, loans and investments. DSS has assessed the risk of the default on payment and has allocated $10.514 million (2015: $4.166 million) to an impairment allowance account for other receivables.
Maximum exposure to credit risk (excluding any collateral or credit enhancements) 2016 2015 $'000 $'000
Financial assets carried at amount not best representing maximum exposure to credit risk
Cash and cash equivalents 6,291 11,511 Other receivables and subsidies 13,551 88,225 Concessional loans 472,550 825,337
Total financial assets carried at amount not best representing maximum exposure to credit risk 492,392 925,073
Financial liabilities carried at amount not best representing maximum exposure to credit risk
Trade creditors (57,630) (61,928) Grants and subsidies (123,173) (286,077)
Total financial liabilities carried at amount not best representing maximum exposure to credit risk (180,803) (348,005)
Credit quality of financial assets not past due or individually determined as impaired Not past due nor impaired
Not past due nor impaired
Past due or impaired
Past due or impaired
2016 2015 2016 2015 $'000 $'000 $'000 $'000
Other receivables and subsidies 12,950 77,679 601 10,546 Concessional loans 461,872 821,884 10,678 3,453
Total 474,822 899,563 11,279 13,999
Ageing of financial assets that were past due but not impaired for 2016 0 to 30 31 to 60 61 to 90 90+
days days days days Total $'000 $'000 $'000 $'000 $'000
Other receivables and subsidies 11 1 - 306 318 Concessional loans - 65 14 368 447
Total 11 66 14 674 765
Ageing of financial assets that were past due but not impaired for 2015 0 to 30 31 to 60 61 to 90 90+
days days days days Total $'000 $'000 $'000 $'000 $'000
Other receivables and subsidies 992 67 3,307 2,014 6,380 Concessional loans 230 145 204 2,874 3,453
Total 1,222 212 3,511 4,888 9,833
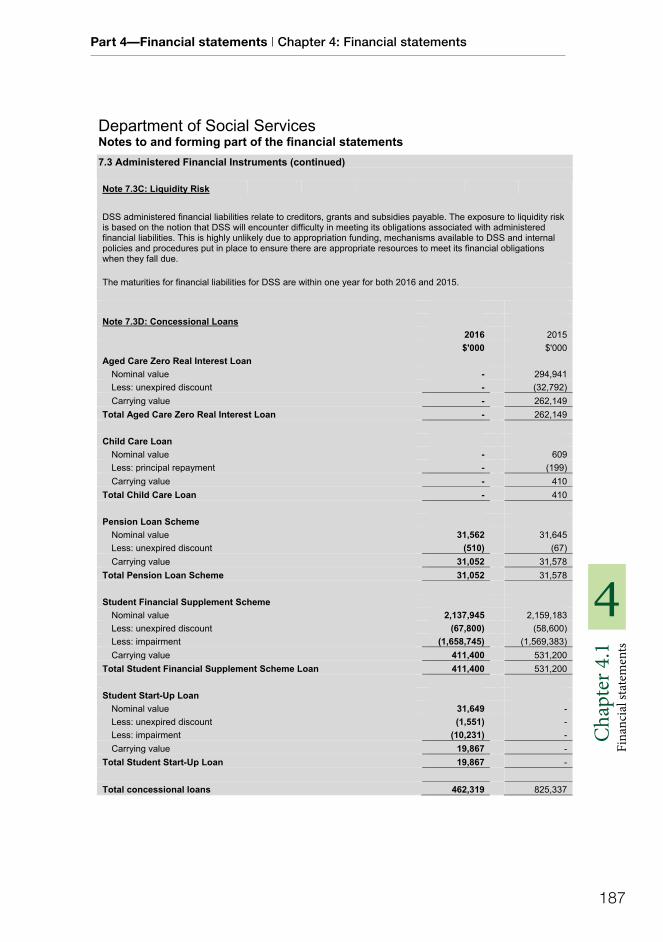
Part 4—Financial statements | Chapter 4: Financial statements
187
4C
hapt
er 4
.1
Fina
ncia
l sta
tem
ents
Department of Social Services Notes to and forming part of the financial statements 7.3 Administered Financial Instruments (continued)
Note 7.3C: Liquidity Risk
DSS administered financial liabilities relate to creditors, grants and subsidies payable. The exposure to liquidity risk is based on the notion that DSS will encounter difficulty in meeting its obligations associated with administered financial liabilities. This is highly unlikely due to appropriation funding, mechanisms available to DSS and internal policies and procedures put in place to ensure there are appropriate resources to meet its financial obligations when they fall due.
The maturities for financial liabilities for DSS are within one year for both 2016 and 2015.
Note 7.3D: Concessional Loans 2016 2015 $'000 $'000
Aged Care Zero Real Interest Loan Nominal value - 294,941 Less: unexpired discount - (32,792) Carrying value - 262,149
Total Aged Care Zero Real Interest Loan - 262,149
Child Care Loan Nominal value - 609Less: principal repayment - (199) Carrying value - 410
Total Child Care Loan - 410
Pension Loan Scheme Nominal value 31,562 31,645 Less: unexpired discount (510) (67) Carrying value 31,052 31,578
Total Pension Loan Scheme 31,052 31,578
Student Financial Supplement Scheme Nominal value 2,137,945 2,159,183 Less: unexpired discount (67,800) (58,600) Less: impairment (1,658,745) (1,569,383) Carrying value 411,400 531,200
Total Student Financial Supplement Scheme Loan 411,400 531,200
Student Start-Up Loan Nominal value 31,649 - Less: unexpired discount (1,551) - Less: impairment (10,231) - Carrying value 19,867 -
Total Student Start-Up Loan 19,867 -
Total concessional loans 462,319 825,337

Department of Social Services Annual Report 2015–2016
188
4
Cha
pter
4.1
Fi
nanc
ial s
tate
men
ts
Department of Social Services Notes to and forming part of the financial statements
Fair Value Measurement 7.4The following tables provide an analysis of assets and liabilities that are measured at fair value. The different levels of fair value are defined below:
Level 1: Quoted prices (unadjusted) in active markets for identical assets or liabilities that DSS can access at measurement date;
Level 2: Inputs other than quoted prices included within Level 1 that are observable for the asset or liability, either directly or indirectly; and
Level 3: Unobservable inputs for the asset or liability.
Note 7.4A: Fair Value Measurements, Valuations Techniques and Inputs Used1
Fair value measurements at the end of the reporting period
For Levels 2 and 3 fair value measurements
2016 2015 Category (Level 1, 2 or 3)4
Valuation technique(s)2 Inputs used $'000 $'000
Non-financial assets3
Leasehold improvements 11,769 30,476 3 DepreciatedReplacement
Cost
Replacement Cost New
(price per square metre)
Consumedeconomic benefit /
Obsolescence of asset
Property, plant and equipment 14,855 11,047 2 Market Approach Adjusted market transactions
1,598 767 3 Market Approach Adjusted market transactions
21,273 12,920 3 DepreciatedReplacement
Cost
Replacement Cost New
Consumedeconomic benefit /
Obsolescence of asset
Assets under construction - leasehold improvements
2,478 571 2 ReplacementCost
Replacement Cost New
Total non-financial assets 51,973 55,781Total fair value measurements of assets 51,973 55,781
1. DSS did not measure any non-financial assets at fair value on a non-recurring basis as at 30 June 2016.
2. There have been changes to the valuation techniques for assets in the property, plant and equipment class. In instances where sufficient observable inputs, such as market transactions of similar assets, were (not) identified in this financial year, the valuation technique was changed from a Depreciated Replacement Cost (DRC) (Market) approach to a Market (DRC) approach.
3. Fair value measurements - highest and best use differs from current use for non-financial assets (NFAs). DSS' assets are held for operational purposes and not held for the purposes of deriving a profit. The current use of all NFAs is considered their highest and best use.
4. Recurring and non-recurring Level 3 fair value measurements - valuation processes DSS engaged the service of AVS to conduct a detailed external valuation of all non-financial assets at 30 June 2016 and has relied upon those outcomes to establish carrying amounts. An annual assessment is undertaken to determine whether the carrying amount of the assets is materially different from the fair value. Comprehensive valuations are carried out at least once every three years. AVS has provided written assurance to DSS that the models developed are in compliance with AASB 13 – Fair Value Measurement.
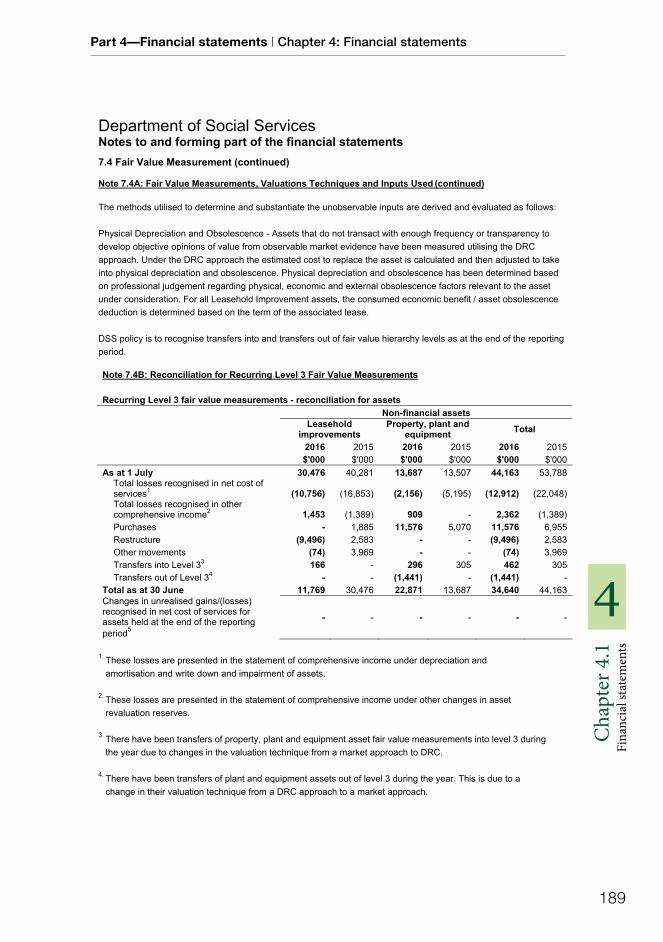
Part 4—Financial statements | Chapter 4: Financial statements
189
4C
hapt
er 4
.1
Fina
ncia
l sta
tem
ents
Department of Social Services Notes to and forming part of the financial statements 7.4 Fair Value Measurement (continued)
Note 7.4A: Fair Value Measurements, Valuations Techniques and Inputs Used (continued)
The methods utilised to determine and substantiate the unobservable inputs are derived and evaluated as follows:
Physical Depreciation and Obsolescence - Assets that do not transact with enough frequency or transparency to develop objective opinions of value from observable market evidence have been measured utilising the DRC approach. Under the DRC approach the estimated cost to replace the asset is calculated and then adjusted to take into physical depreciation and obsolescence. Physical depreciation and obsolescence has been determined based on professional judgement regarding physical, economic and external obsolescence factors relevant to the asset under consideration. For all Leasehold Improvement assets, the consumed economic benefit / asset obsolescence deduction is determined based on the term of the associated lease.
DSS policy is to recognise transfers into and transfers out of fair value hierarchy levels as at the end of the reporting period.
Note 7.4B: Reconciliation for Recurring Level 3 Fair Value Measurements
Recurring Level 3 fair value measurements - reconciliation for assets Non-financial assets
Leasehold improvements
Property, plant and equipment Total
2016 2015 2016 2015 2016 2015 $'000 $'000 $'000 $'000 $'000 $'000
As at 1 July 30,476 40,281 13,687 13,507 44,163 53,788 Total losses recognised in net cost of services1 (10,756) (16,853) (2,156) (5,195) (12,912) (22,048) Total losses recognised in other comprehensive income2 1,453 (1,389) 909 - 2,362 (1,389) Purchases - 1,885 11,576 5,070 11,576 6,955Restructure (9,496) 2,583 - - (9,496) 2,583Other movements (74) 3,969 - - (74) 3,969Transfers into Level 33 166 - 296 305 462 305Transfers out of Level 34 - - (1,441) - (1,441) -
Total as at 30 June 11,769 30,476 22,871 13,687 34,640 44,163 Changes in unrealised gains/(losses) recognised in net cost of services for assets held at the end of the reporting period5
- - - - - -
1. These losses are presented in the statement of comprehensive income under depreciation and amortisation and write down and impairment of assets.
2. These losses are presented in the statement of comprehensive income under other changes in asset revaluation reserves.
3. There have been transfers of property, plant and equipment asset fair value measurements into level 3 during the year due to changes in the valuation technique from a market approach to DRC.
4. There have been transfers of plant and equipment assets out of level 3 during the year. This is due to a change in their valuation technique from a DRC approach to a market approach.
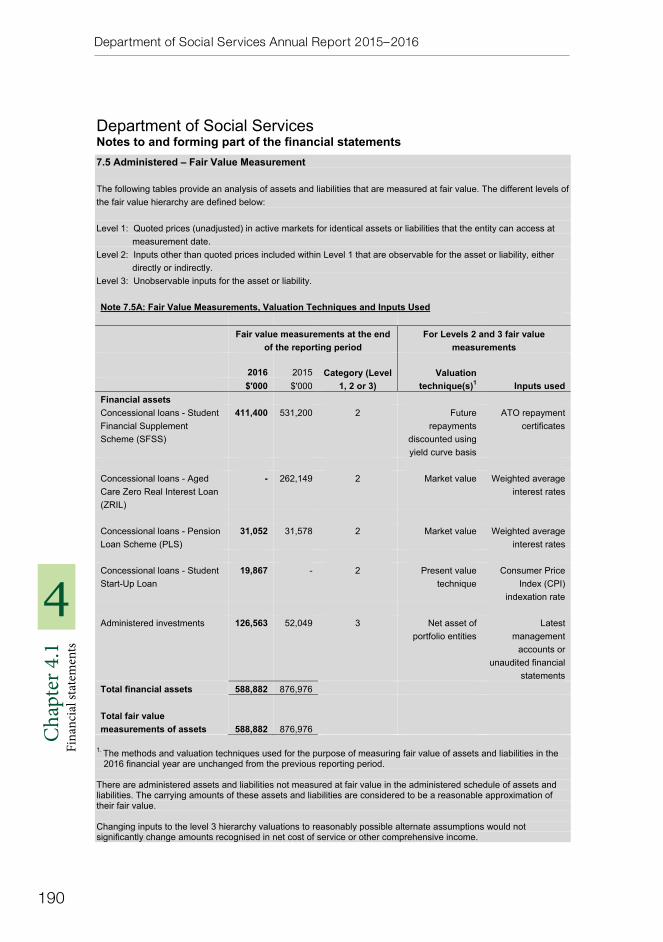
Department of Social Services Annual Report 2015–2016
190
4
Cha
pter
4.1
Fi
nanc
ial s
tate
men
ts
Department of Social Services Notes to and forming part of the financial statements
Administered – Fair Value Measurement 7.5
The following tables provide an analysis of assets and liabilities that are measured at fair value. The different levels of the fair value hierarchy are defined below:
Level 1: Quoted prices (unadjusted) in active markets for identical assets or liabilities that the entity can access at measurement date.
Level 2: Inputs other than quoted prices included within Level 1 that are observable for the asset or liability, either directly or indirectly.
Level 3: Unobservable inputs for the asset or liability.
Note 7.5A: Fair Value Measurements, Valuation Techniques and Inputs Used
Fair value measurements at the end of the reporting period
For Levels 2 and 3 fair value measurements
2016 2015 Category (Level 1, 2 or 3)
Valuationtechnique(s)1 Inputs used $'000 $'000
Financial assets Concessional loans - Student Financial Supplement Scheme (SFSS)
411,400 531,200 2 Future repayments
discounted using yield curve basis
ATO repayment certificates
Concessional loans - Aged Care Zero Real Interest Loan (ZRIL)
- 262,149 2 Market value Weighted average interest rates
Concessional loans - Pension Loan Scheme (PLS)
31,052 31,578 2 Market value Weighted average interest rates
Concessional loans - Student Start-Up Loan
19,867 - 2 Present value technique
Consumer Price Index (CPI)
indexation rate
Administered investments 126,563 52,049 3 Net asset of portfolio entities
Latestmanagement
accounts or unaudited financial
statements Total financial assets 588,882 876,976
Total fair value measurements of assets 588,882 876,976
1. The methods and valuation techniques used for the purpose of measuring fair value of assets and liabilities in the 2016 financial year are unchanged from the previous reporting period.
There are administered assets and liabilities not measured at fair value in the administered schedule of assets and liabilities. The carrying amounts of these assets and liabilities are considered to be a reasonable approximation of their fair value.
Changing inputs to the level 3 hierarchy valuations to reasonably possible alternate assumptions would not significantly change amounts recognised in net cost of service or other comprehensive income.
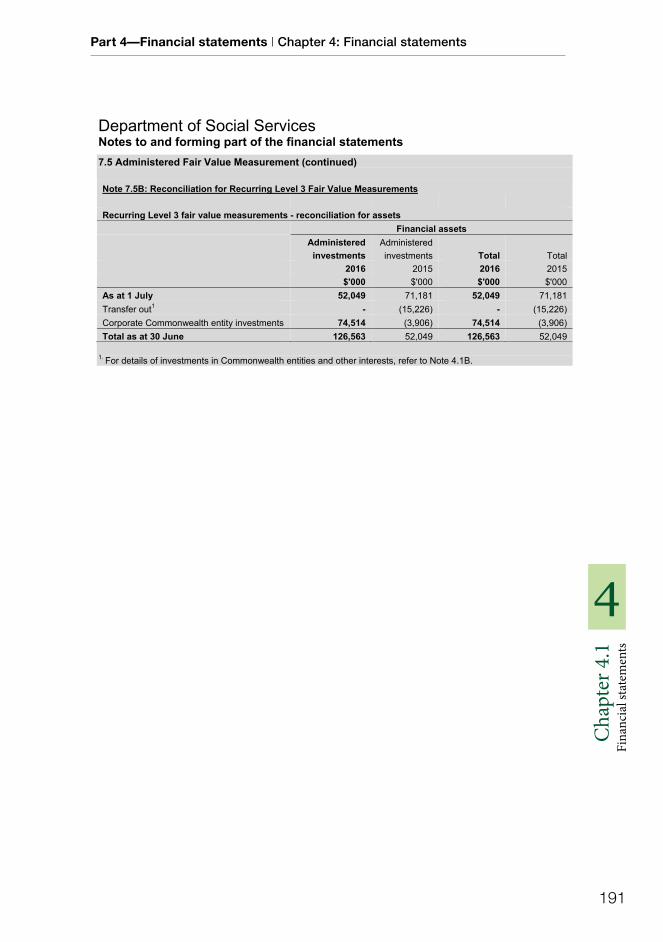
Part 4—Financial statements | Chapter 4: Financial statements
191
4C
hapt
er 4
.1
Fina
ncia
l sta
tem
ents
Department of Social Services Notes to and forming part of the financial statements 7.5 Administered Fair Value Measurement (continued)
Note 7.5B: Reconciliation for Recurring Level 3 Fair Value Measurements
Recurring Level 3 fair value measurements - reconciliation for assets Financial assets
Administered investments
Administered investments Total Total
2016 2015 2016 2015 $'000 $'000 $'000 $'000
As at 1 July 52,049 71,181 52,049 71,181 Transfer out1 - (15,226) - (15,226) Corporate Commonwealth entity investments 74,514 (3,906) 74,514 (3,906) Total as at 30 June 126,563 52,049 126,563 52,049
1. For details of investments in Commonwealth entities and other interests, refer to Note 4.1B.
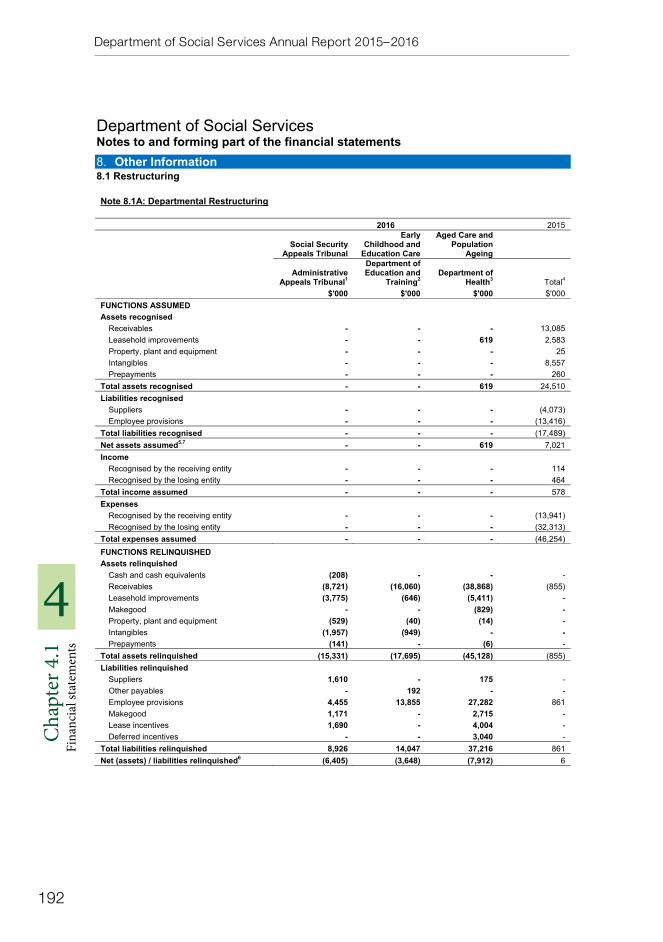
Department of Social Services Annual Report 2015–2016
192
4
Cha
pter
4.1
Fi
nanc
ial s
tate
men
ts
Department of Social Services Notes to and forming part of the financial statements 8. Other Information
Restructuring 8.1
Note 8.1A: Departmental Restructuring
2016 2015
Social Security Appeals Tribunal
Early Childhood and
Education Care
Aged Care and Population
Ageing
Administrative Appeals Tribunal1
Department of Education and
Training2Department of
Health3 Total4
$'000 $'000 $'000 $'000 FUNCTIONS ASSUMED Assets recognised
Receivables - - - 13,085Leasehold improvements - - 619 2,583Property, plant and equipment - - - 25Intangibles - - - 8,557Prepayments - - - 260
Total assets recognised - - 619 24,510 Liabilities recognised
Suppliers - - - (4,073)Employee provisions - - - (13,416)
Total liabilities recognised - - - (17,489) Net assets assumed5,7 - - 619 7,021 Income
Recognised by the receiving entity - - - 114Recognised by the losing entity - - - 464
Total income assumed - - - 578Expenses
Recognised by the receiving entity - - - (13,941) Recognised by the losing entity - - - (32,313)
Total expenses assumed - - - (46,254) FUNCTIONS RELINQUISHED Assets relinquished
Cash and cash equivalents (208) - - - Receivables (8,721) (16,060) (38,868) (855)Leasehold improvements (3,775) (646) (5,411) - Makegood - - (829) - Property, plant and equipment (529) (40) (14) - Intangibles (1,957) (949) - - Prepayments (141) - (6) -
Total assets relinquished (15,331) (17,695) (45,128) (855)Liabilities relinquished
Suppliers 1,610 - 175 - Other payables - 192 - - Employee provisions 4,455 13,855 27,282 861Makegood 1,171 - 2,715 - Lease incentives 1,690 - 4,004 - Deferred incentives - - 3,040 -
Total liabilities relinquished 8,926 14,047 37,216 861Net (assets) / liabilities relinquished6 (6,405) (3,648) (7,912) 6
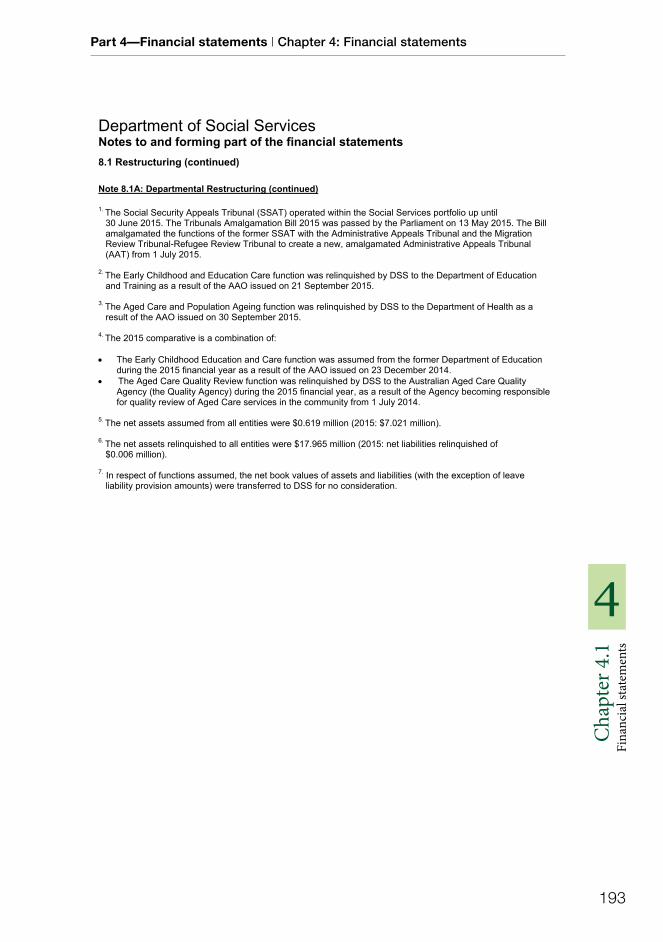
Part 4—Financial statements | Chapter 4: Financial statements
193
4C
hapt
er 4
.1
Fina
ncia
l sta
tem
ents
Department of Social Services Notes to and forming part of the financial statements 8.1 Restructuring (continued)
Note 8.1A: Departmental Restructuring (continued)
1. The Social Security Appeals Tribunal (SSAT) operated within the Social Services portfolio up until 30 June 2015. The Tribunals Amalgamation Bill 2015 was passed by the Parliament on 13 May 2015. The Bill amalgamated the functions of the former SSAT with the Administrative Appeals Tribunal and the Migration Review Tribunal-Refugee Review Tribunal to create a new, amalgamated Administrative Appeals Tribunal (AAT) from 1 July 2015.
2. The Early Childhood and Education Care function was relinquished by DSS to the Department of Education and Training as a result of the AAO issued on 21 September 2015.
3. The Aged Care and Population Ageing function was relinquished by DSS to the Department of Health as a result of the AAO issued on 30 September 2015.
4. The 2015 comparative is a combination of:
The Early Childhood Education and Care function was assumed from the former Department of Education during the 2015 financial year as a result of the AAO issued on 23 December 2014.
The Aged Care Quality Review function was relinquished by DSS to the Australian Aged Care Quality Agency (the Quality Agency) during the 2015 financial year, as a result of the Agency becoming responsible for quality review of Aged Care services in the community from 1 July 2014.
5. The net assets assumed from all entities were $0.619 million (2015: $7.021 million).
6. The net assets relinquished to all entities were $17.965 million (2015: net liabilities relinquished of $0.006 million).
7. In respect of functions assumed, the net book values of assets and liabilities (with the exception of leave liability provision amounts) were transferred to DSS for no consideration.
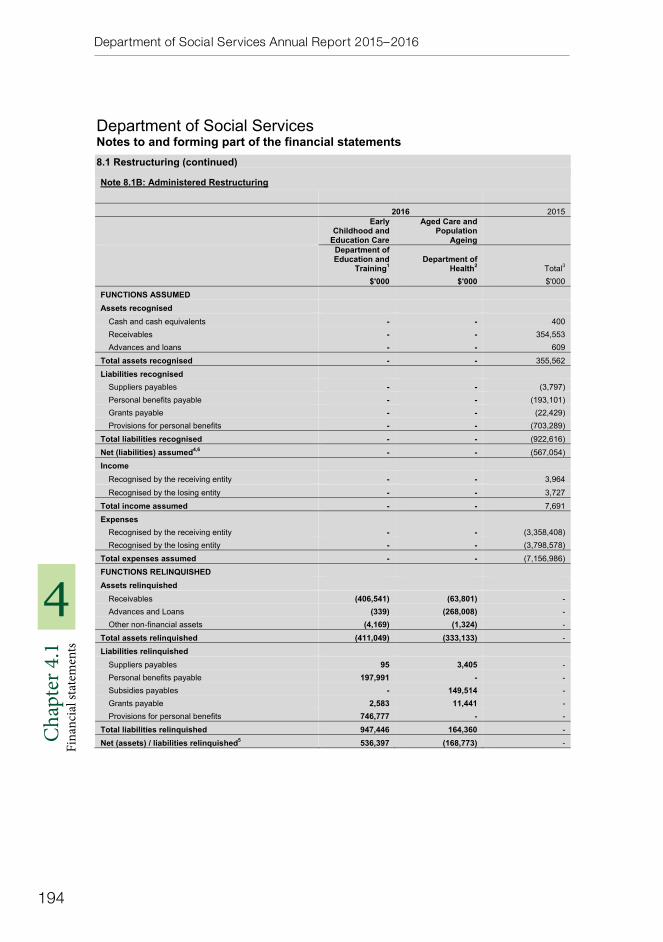
Department of Social Services Annual Report 2015–2016
194
4
Cha
pter
4.1
Fi
nanc
ial s
tate
men
ts
Department of Social Services Notes to and forming part of the financial statements 8.1 Restructuring (continued)
Note 8.1B: Administered Restructuring
2016 2015 Early
Childhood and Education Care
Aged Care and Population
Ageing Department of Education and
Training1Department of
Health2 Total3
$'000 $'000 $'000 FUNCTIONS ASSUMED Assets recognised
Cash and cash equivalents - - 400Receivables - - 354,553Advances and loans - - 609
Total assets recognised - - 355,562 Liabilities recognised
Suppliers payables - - (3,797) Personal benefits payable - - (193,101) Grants payable - - (22,429) Provisions for personal benefits - - (703,289)
Total liabilities recognised - - (922,616) Net (liabilities) assumed4,6 - - (567,054) Income
Recognised by the receiving entity - - 3,964Recognised by the losing entity - - 3,727
Total income assumed - - 7,691Expenses
Recognised by the receiving entity - - (3,358,408) Recognised by the losing entity - - (3,798,578)
Total expenses assumed - - (7,156,986) FUNCTIONS RELINQUISHED Assets relinquished
Receivables (406,541) (63,801) - Advances and Loans (339) (268,008) - Other non-financial assets (4,169) (1,324) -
Total assets relinquished (411,049) (333,133) -Liabilities relinquished
Suppliers payables 95 3,405 - Personal benefits payable 197,991 - - Subsidies payables - 149,514 - Grants payable 2,583 11,441 - Provisions for personal benefits 746,777 - -
Total liabilities relinquished 947,446 164,360 -Net (assets) / liabilities relinquished5 536,397 (168,773) -

Part 4—Financial statements | Chapter 4: Financial statements
195
4C
hapt
er 4
.1
Fina
ncia
l sta
tem
ents
Department of Social Services Notes to and forming part of the financial statements 8.1 Restructuring (continued)
Note 8.1B: Administered Restructuring (continued)
1. The Early Childhood and Education Care function was relinquished by DSS to the Department of Education and Training as a result of the AAO issued on 21 September 2015. Other special account balances of $102.048 million that did not form part of the DSS administered schedule of assets and liabilities, and excluded from this note, were also transferred to Department of Education and Training.
2. The Aged Care and Population Ageing function was relinquished by DSS to the Department of Health as a result of the AAO issued on 30 September 2015.
3. The Early Childhood Education and Care function was assumed from the former Department of Education as a result of the AAO issued on 23 December 2014.
4. In 2015, the net liabilities assumed from all entities were $567.054 million.
5. The net liabilities relinquished to all entities were $367.624 million.
6. In respect of functions assumed, the net book values of assets and liabilities were transferred to DSS for no consideration.

Department of Social Services Annual Report 2015–2016
196
4
Cha
pter
4.1
Fi
nanc
ial s
tate
men
ts
Dep
artm
ent o
f Soc
ial S
ervi
ces
Not
es to
and
form
ing
part
of t
he fi
nanc
ial s
tate
men
ts
Rep
ortin
g of
Out
com
es
8.2 Not
e 8.
2A: N
et C
ost o
f Out
com
e D
eliv
ery
Out
com
e 1
Soci
al S
ecur
ity
Out
com
e 2
Fam
ilies
and
C
omm
uniti
es
Out
com
e 3
Age
ing
and
Age
d C
are
Out
com
e 4
Hou
sing
O
utco
me
5 D
isab
ility
and
Car
ers
Paym
ents
to c
orpo
rate
C
omm
onw
ealth
en
titie
s1N
ot a
ttrib
uted
To
tal
2016
2015
2016
2015
2016
2015
2016
2015
2016
2015
2016
2015
2016
2015
2016
2015
$'00
0 $'
000
$'00
0$'
000
$'00
0$'
000
$'00
0$'
000
$'00
0$'
000
$'00
0$'
000
$'00
0$'
000
$'00
0 $'
000
Dep
artm
enta
l
Exp
ense
s 13
6,58
7 15
0,42
5 19
8,93
3 22
7,34
5 93
,063
22
8,52
6 58
,651
24
,123
13
4,98
2 93
,508
-
2,00
0 48
1 -
622,
697
725,
927
Ow
n-so
urce
inco
me
(20,
221)
(1
2,20
3)
(28,
996)
(20,
659)
(13,
734)
(20,
945)
(8,4
70)
(2,2
29)
(20,
663)
(8,9
77)
- -
- -
(92,
084)
(6
5,01
3)
Adm
inis
tere
d
Exp
ense
s 10
9,53
4,12
6 10
7,39
8,87
1 4,
989,
398
5,96
9,55
9 3,
672,
952
13,0
66,5
45
73,2
99
67,5
95
1,64
4,83
9 1,
407,
692
581,
070
308,
433
- -
120,
495,
684
128,
218,
695
Ow
n-so
urce
inco
me
(82,
592)
(1
59,0
02)
(28,
598)
(13,
259)
(17,
746)
(82,
344)
(296
)(7
,856
) (6
,871
)(3
5,31
2) -
- -
-(1
36,1
03)
(297
,773
) N
et c
ost o
f out
com
e de
liver
y110
9,56
7,90
0 10
7,37
8,09
1 5,
130,
737
6,16
2,98
63,
734,
535
13,1
91,7
8212
3,18
481
,633
1,
752,
287
1,45
6,91
158
1,07
031
0,43
348
1-
120,
890,
194
128,
581,
836
1. P
aym
ents
to c
orpo
rate
Com
mon
wea
lth e
ntiti
es a
re n
ot re
late
d to
Out
com
es b
ut a
re in
clud
ed in
this
dis
clos
ure
so th
at th
e to
tal r
econ
cile
s an
d ag
rees
to th
e re
sour
cing
tabl
e.
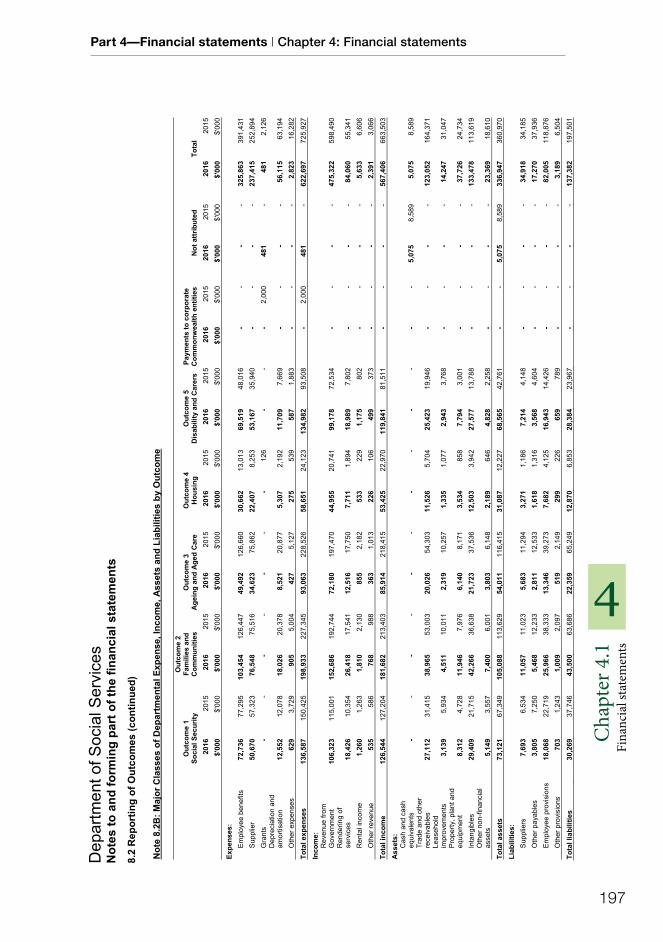
Part 4—Financial statements | Chapter 4: Financial statements
197
4C
hapt
er 4
.1
Fina
ncia
l sta
tem
ents
Dep
artm
ent o
f Soc
ial S
ervi
ces
Not
es to
and
form
ing
part
of t
he fi
nanc
ial s
tate
men
ts
8.2
Rep
ortin
g of
Out
com
es (c
ontin
ued)
Not
e 8.
2B: M
ajor
Cla
sses
of D
epar
tmen
tal E
xpen
se, I
ncom
e, A
sset
s an
d Li
abili
ties
by O
utco
me
Out
com
e 1
Soci
al S
ecur
ity
Out
com
e 2
Fam
ilies
and
C
omm
uniti
es
Out
com
e 3
Age
ing
and
Age
d C
are
Out
com
e 4
Hou
sing
O
utco
me
5 D
isab
ility
and
Car
ers
Paym
ents
to c
orpo
rate
C
omm
onw
ealth
ent
ities
Not
attr
ibut
ed
Tota
l 20
1620
1520
1620
1520
1620
1520
1620
1520
1620
1520
1620
1520
1620
1520
1620
15$'
000
$'00
0$'
000
$'00
0$'
000
$'00
0$'
000
$'00
0$'
000
$'00
0$'
000
$'00
0$'
000
$'00
0$'
000
$'00
0
Expe
nses
:E
mpl
oyee
ben
efits
72
,736
77
,295
10
3,45
4 12
6,44
7 49
,492
12
6,66
0 30
,662
13
,013
69
,519
48
,016
-
- -
-32
5,86
3 39
1,43
1 S
uppl
ier
50,6
70
57,3
23
76,5
48
75,5
16
34,6
23
75,8
62
22,4
07
8,25
3 53
,167
35
,940
-
- -
-23
7,41
5 25
2,89
4 G
rant
s -
- -
- -
- -
126
- -
-2,
000
481
-48
12,
126
Dep
reci
atio
n an
d am
ortis
atio
n 12
,552
12
,078
18
,026
20
,378
8,
521
20,8
77
5,30
7 2,
192
11,7
09
7,66
9 -
- -
-56
,115
63
,194
O
ther
exp
ense
s 62
93,
729
905
5,00
4 42
75,
127
275
539
587
1,88
3 -
- -
-2,
823
16,2
82
Tota
l exp
ense
s 13
6,58
7 15
0,42
5 19
8,93
322
7,34
593
,063
228,
526
58,6
5124
,123
13
4,98
293
,508
-2,
000
481
-62
2,69
7 72
5,92
7
Inco
me:
R
even
ue fr
om
Gov
ernm
ent
106,
323
115,
001
152,
686
192,
744
72,1
80
197,
470
44,9
55
20,7
41
99,1
78
72,5
34
- -
- -
475,
322
598,
490
Ren
derin
g of
se
rvic
es
18,4
26
10,3
54
26,4
18
17,5
41
12,5
16
17,7
50
7,71
1 1,
894
18,9
89
7,80
2 -
- -
-84
,060
55
,341
R
enta
l inc
ome
1,26
0 1,
263
1,81
0 2,
130
855
2,18
2 53
322
91,
175
802
- -
- -
5,63
3 6,
606
Oth
er re
venu
e 53
558
676
898
836
31,
013
226
106
499
373
- -
- -
2,39
1 3,
066
Tota
l inc
ome
126,
544
127,
204
181,
682
213,
403
85,9
1421
8,41
553
,425
22,9
70
119,
841
81,5
11-
--
-56
7,40
6 66
3,50
3
Ass
ets:
C
ash
and
cash
eq
uiva
lent
s -
- -
- -
- -
- -
- -
-5,
075
8,58
9 5,
075
8,58
9 Tr
ade
and
othe
r re
ceiv
able
s 27
,112
31
,415
38
,965
53
,003
20
,026
54
,303
11
,526
5,
704
25,4
23
19,9
46
- -
- -
123,
052
164,
371
Leas
ehol
d im
prov
emen
ts
3,13
9 5,
934
4,51
1 10
,011
2,
319
10,2
57
1,33
5 1,
077
2,94
3 3,
768
- -
- -
14,2
47
31,0
47
Pro
perty
, pla
nt a
nd
equi
pmen
t8,
312
4,72
8 11
,946
7,
976
6,14
0 8,
171
3,53
4 85
87,
794
3,00
1 -
- -
-37
,726
24
,734
In
tang
ible
s 29
,409
21
,715
42
,266
36
,638
21
,723
37
,536
12
,503
3,
942
27,5
77
13,7
88
- -
- -
133,
478
113,
619
Oth
er n
on-fi
nanc
ial
asse
ts
5,14
9 3,
557
7,40
0 6,
001
3,80
3 6,
148
2,18
9 64
64,
828
2,25
8 -
- -
-23
,369
18
,610
Tota
l ass
ets
73,1
21
67,3
49
105,
088
113,
629
54,0
1111
6,41
531
,087
12,2
27
68,5
6542
,761
--
5,07
58,
589
336,
947
360,
970
Liab
ilitie
s:
Sup
plie
rs
7,69
3 6,
534
11,0
57
11,0
23
5,68
3 11
,294
3,
271
1,18
6 7,
214
4,14
8 -
- -
-34
,918
34
,185
O
ther
pay
able
s 3,
805
7,25
0 5,
468
12,2
33
2,81
1 12
,533
1,
618
1,31
6 3,
568
4,60
4 -
- -
-17
,270
37
,936
E
mpl
oyee
pro
visi
ons
18,0
68
22,7
19
25,9
66
38,3
33
13,3
46
39,2
73
7,68
2 4,
125
16,9
43
14,4
26
- -
- -
82,0
05
118,
876
Oth
er p
rovi
sion
s 70
31,
243
1,00
9 2,
097
519
2,14
9 29
922
665
978
9 -
- -
-3,
189
6,50
4
Tota
l lia
bilit
ies
30,2
69
37,7
46
43,5
0063
,686
22,3
5965
,249
12,8
706,
853
28,3
8423
,967
--
--
137,
382
197,
501

Department of Social Services Annual Report 2015–2016
198
4
Cha
pter
4.1
Fi
nanc
ial s
tate
men
ts
Dep
artm
ent o
f Soc
ial S
ervi
ces
Not
es to
and
form
ing
part
of t
he fi
nanc
ial s
tate
men
ts
8.2
Rep
ortin
g of
Out
com
es (c
ontin
ued)
Not
e 8.
2C: M
ajor
Cla
sses
of A
dmin
iste
red
Expe
nses
, Inc
ome,
Ass
ets,
and
Lia
bilit
ies
by O
utco
mes
Out
com
e 1
Soci
al S
ecur
ity
Out
com
e 2
Fam
ilies
and
C
omm
uniti
es
Out
com
e 3
Age
ing
and
Age
d C
are
Out
com
e 4
Hou
sing
Out
com
e 5
Dis
abili
ty a
nd
Car
ers
Paym
ents
to
corp
orat
e C
omm
onw
ealth
en
titie
s N
ot a
ttrib
uted
Tota
l
2016
2015
2016
2015
2016
2015
2016
2015
2016
2015
2016
2015
2016
2015
2016
2015
$'00
0 $'
000
$'00
0$'
000
$'00
0$'
000
$'00
0$'
000
$'00
0$'
000
$'00
0$'
000
$'00
0$'
000
$'00
0 $'
000
Expe
nses
:
Sup
plie
rs
541,
106
97,9
79
101,
798
18,1
18
60,6
55
-10
579
0,20
3 80
1,98
8 -
- -
-90
6,35
4 96
5,65
2
Sub
sidi
es
9,00
4 8,
844
61,
941
2,94
6,75
0 10
,970
,692
71
,965
64
,790
59
63,
321
- -
- -
3,02
8,32
1 11
,049
,588
Gra
nts
115
597,
414
569,
696
606,
828
1,81
9,15
0 1,
334
2,70
0 75
6,18
3 60
0,33
7 -
- -
-1,
961,
770
2,99
1,88
8
Per
sona
l ben
efits
10
9,18
5,80
4 10
7,27
7,33
6 4,
043,
728
5,08
8,60
4 63
,623
75
,235
-
- 94
,236
-
- -
- -
113,
387,
391
112,
441,
175
Pay
men
ts to
cor
pora
te
Com
mon
wea
lth e
ntiti
es
- -
- -
- -
- -
- -
581,
070
308,
433
- -
581,
070
308,
433
Oth
er
339,
253
111,
580
250,
271
207,
520
37,6
33
140,
813
- -
3,62
1 2,
046
- -
- -
630,
778
461,
959
Tota
l exp
ense
s 10
9,53
4,12
6 10
7,39
8,87
14,
989,
398
5,96
9,55
93,
672,
952
13,0
66,5
4573
,299
67,5
95
1,64
4,83
91,
407,
692
581,
070
308,
433
--
120,
495,
684
128,
218,
695
Inco
me:
Non
-taxa
tion
reve
nue
82,5
92
159,
002
28,5
98
13,2
59
17,7
46
82,3
44
296
7,85
6 6,
871
35,3
12
- -
- -
136,
103
297,
773
Tota
l inc
ome
82,5
92
159,
002
28,5
9813
,259
17,7
4682
,344
296
7,85
6 6,
871
35,3
12-
--
-13
6,10
3 29
7,77
3
Ass
ets:
Cas
h an
d ca
sh e
quiv
alen
ts
6,07
4 3,
088
-3,
863
-3,
345
- -
- -
- -
217
1,21
5 6,
291
11,5
11
Rec
eiva
bles
3,
817,
660
3,69
6,19
7 5,
153
443,
994
-33
1,84
6 -
16,8
92
112
6,96
4 -
- -
-3,
822,
925
4,49
5,89
3 In
vest
men
ts in
Com
mon
wea
lth
entit
ies
and
othe
r int
eres
ts
- -
- -
- -
- -
- -
125,
586
51,0
35
977
1,01
4 12
6,56
3 52
,049
Oth
er n
on-fi
nanc
ial a
sset
s -
- -
7 -
- -
- -
37 -
- -
- 44
Tota
l ass
ets
3,82
3,73
4 3,
699,
285
5,15
344
7,86
4-
335,
191
-16
,892
11
27,
001
125,
586
51,0
351,
194
2,22
93,
955,
779
4,55
9,49
7
Liab
ilitie
s:
Sup
plie
rs
881,
282
19,2
86
16,0
42
-19
,854
-
154
38,2
56
24,5
96
- -
- -
57,6
30
61,9
28
Sub
sidi
es
- 67
4 -
410
-15
2,91
8 80
,976
64
,751
76
47 -
- -
-81
,052
21
8,80
0
Per
sona
l ben
efits
2,
044,
978
2,95
6,36
5 64
,428
25
4,68
7 -
- -
- 94
,230
-
- -
- -
2,20
3,63
6 3,
211,
052
Gra
nts
- -
3,45
9 6,
298
-49
,844
37
5038
,625
11
,085
-
- -
-42
,121
67
,277
P
erso
nal b
enef
its a
nd o
ther
pr
ovis
ions
5,
133,
781
5,47
2,13
1 -
864,
183
- -
- -
- -
- -
- -
5,13
3,78
1 6,
336,
314
Tota
l lia
bilit
ies
7,17
8,84
7 8,
430,
452
87,1
731,
141,
620
-22
2,61
681
,013
64,9
55
171,
187
35,7
28-
--
-7,
518,
220
9,89
5,37
1

Part 4—Financial statements | Chapter 4: Financial statements
199
4C
hapt
er 4
.1
Fina
ncia
l sta
tem
ents
Department of Social Services Notes to and forming part of the financial statements
Breach of Section 83 of the Constitution 8.3
Compliance with Statutory Conditions for Payments from the Consolidated Revenue Fund
Table A – Summary 2016
Appropriations identified
as subject to conditions
Payments in 2016
Review complete?
Breaches identified
for payments made
during 2016
Potential Breaches
2016
Remedial
action taken or
proposed1
Amount
$’000 Yes/No Yes/No Amount
$’000 Yes/No Indicative
extant
SPECIAL APPROPRIATIONS
A New Tax System (Family
Assistance) (Administration)
Act 1999
23,464,274 Yes No - Yes See footnote 2
and 6 -
Aged Care Act 1997 3,007,553 No No - Yes See footnote 6 -
Business Services Wage
Assessment Tool Payment
Scheme Act 2015
860 Yes No - No - -
National Health Act 1953 63,494 No No - Yes See footnote 6 -
Paid Parental Leave Act
2010 2,082,098 Yes No - Yes See footnote 3 -
Social Security
(Administration) Act 1999 89,855,470 Yes No - Yes See footnote 4 -
Student Assistance Act 1973 339,093 Yes No - Yes See footnote 5 -
Early Years Quality Fund
Special Account 449 No No - No See footnote 6 -
National Disability Special
Account1,379 Yes No - No - -
Services for Other Entities
and Trust Monies 16,620 Yes No - No - -
Social & Community
Services Pay Equity Special
Account
236,115 Yes No - No - -
Annual Appropriation Act
No.1 2015-16 (National
Rental Affordability Scheme)
56,513 Yes No - No - -
Annual Appropriation Act
No.1 2015-16 4,347,149 Yes Yes 4 Yes See footnote 7 -

Department of Social Services Annual Report 2015–2016
200
4
Cha
pter
4.1
Fi
nanc
ial s
tate
men
ts
Department of Social Services Notes to and forming part of the financial statements 8.3 Breach of Section 83 of the Constitution (continued)
Compliance with Statutory Conditions for Payments from the Consolidated Revenue Fund (continued) 1. L= legislative change; S= systems change; P=planned; M=made (e.g. SM, or LP) 2. The value of potential contraventions in respect of payments under A New Tax System (Family Assistance) Act 1999
and A New Tax System (Family Assistance) (Administration) Act 1999 was $1,247.024 million representing 840,608 new debts raised. A total of $528.441 million was recovered during the 2016 financial year; a further $28.600 million was waived or written off.
3. The value of potential contraventions in respect of payments under Paid Parental Leave Act 2010 was $11.887 million representing 5,085 new debts raised. A total of $9.756 million was recovered during the 2016 financial year; a further $0.139 million was waived or written off.
4. The value of potential contraventions in respect of payments under Social Security (Administration) Act 1999 was $1,367.614 million representing 1,452,201 new debts raised. A total of $789.172 million was recovered during the 2016 financial year; a further $100.268 million was waived or written off.
5. The value of potential contraventions in respect of payments under Student Assistance Act 1973 was $12.537 million representing 17,121 new debts raised. A total of $9.586 million was recovered during the 2016 financial year; a further $1.089 million was waived or written off.
6. The Early Childhood and Education Care function was relinquished by DSS to the Department of Education as a result of the AAO issued on 21 September 2015; subsequently the Aged Care and Population Ageing function was relinquished by DSS to the Department of Health as a result of the AAO issued on 30 September 2015.
7. Through regular internal reconciliation processes, five instances totalling $3,770.27 of potential breaches have been identified as at 30 June 2016. These instances relate to adjustments from Administered to Departmental Appropriation within Appropriation Bill (No. 1) 2015-16.

Part 4—Financial statements | Chapter 4: Financial statements
201
4C
hapt
er 4
.1
Fina
ncia
l sta
tem
ents
Department of Social Services Notes to and forming part of the financial statements
Explanations of Major Variances to Budget 8.4The following provides explanations of major variances between the original budget as presented in the 2015-16 Social Services Portfolio Budget Statements (PBS) and the 2015-16 final outcome as presented in accordance with Australian Accounting Standards for DSS. The 2015-16 PBS contains the original financial statements’ budget estimates presented to Parliament in respect of the 2016 financial year. The budget is not audited.
Variances are considered to be ‘major’ based on the following criteria: the variance between budget and actual is greater than +/- 10% of the original budget for a line item; or the variance between budget and actual is greater than 2% of the relevant sub-total (i.e. total expenses, total
income, total assets or total liabilities); or an item below this threshold but is considered important for the reader’s understanding or is relevant to an
assessment of the discharge of accountability and to an analysis of performance of DSS.
Note 8.4A: Departmental Major Budget Variances for 2016
Explanations of major variances Affected schedules The variance to the 2015-16 original Budget estimate mainly relates to a decrease in funding through the 2015-16 Portfolio Additional Estimates Statements (PAES), as a result of the 21 September and 30 September 2015 AAOs which transferred the Child Care function from DSS to the Department of Education and Training and the Aged Care function from DSS to the Department of Health.
In particular: - Total own-source income is $46.982 million higher than the 2015-16 Budget estimate
mainly as a result of delivering a higher than expected volume of MoG related MoU corporate services to other departments.
- Total provisions are $64.858 million lower than the 2015-16 Budget estimate due to the MOG transfer of DSS employees to the Aged Care and Child Care functions that were not known at the time of publication.
- Total equity is $26.002 million higher than the 2015-16 Budget estimate mainly due to a $21.378 million capital appropriation for MoG related corporate support services.
Total expenses Revenue from Government Total financial assets Total non-financial assets Total payables
Total own-source income
Total provisions
Statement of changes in equity
In addition, cash received other includes $27.656 million net GST received that was not included in the 2015-16 Budget estimate. The Cash used includes $87.946 million Section 74 receipts to the Official Public Account (OPA) which were reported on a net basis in the 2015-16 Budget estimate.
Cash flow statement operating activities

Department of Social Services Annual Report 2015–2016
202
4
Cha
pter
4.1
Fi
nanc
ial s
tate
men
ts
Department of Social Services Notes to and forming part of the financial statements
8.4 Explanations of Major Variances to Budget (continued)
Note 8.4B: Administered Major Budget Variances for 2016
Explanations of major variances Affected schedules The variance to the 2015-16 Budget estimate mainly relates to a decrease in appropriation through the 2015-16 Portfolio Additional Estimates Statements (PAES), as a result of the 21 September and 30 September 2015 AAOs which transferred the responsibility for the Child Care function from DSS to the Department of Education and Training and the Aged Care function from DSS to the Department of Health.
In particular: - Administered expenses in 2015-16 were $16,999.546 million lower than Budget which
was predominantly driven by variances in aged care and child care subsidies expenses of $8,602.725 million, personal benefits expenses of $6,635.004 million, and grants expenses of $2,190.923 million.
- Administered income in 2015-16 was $218.319 million lower than Budget which was predominantly driven by a variance in other aged care revenue of $290.065 million offset by a variance in recoveries revenue of $54.697 million.
- Administered assets in 2015-16 were $1,195.500 million higher than Budget which was predominantly driven by a variance in aged care and child care receivables of $1,540.150 million offset by a variance in other non-financial assets of $343.845 million.
- Administered liabilities in 2015-16 were $2,064.570 million lower than Budget which was predominantly driven by variances in personal benefits payables of $1,030.680 million, subsidies payables of $292.067 million, as well as personal benefits and other provisions of $772.838 million.
Total expenses Total income Total assets Total liabilities
Subsidies expenses Grants expenses Personal Benefits expenses
Other revenue Recoveries revenue
Receivables Other non-financial assets
Personal Benefits payables Subsidies payables Personal benefits and other provisions
Personal benefits expense is $6,635.004 million lower than Budget and relates to changes to recipient numbers and average rates, machinery of government changes as disclosed above, and delays to the passage of legislation including Paid Parental Leave Act 2010,A New Tax System (Family Assistance) (Administration) Act 1999 and Social Security (Administration) Act 1999 included in the 2015-16 Social Services Portfolio Budget Statements.
Personal Benefits expenses
The variance in receivables relates to differences in disclosure between DSS 2015-16 financial statements and the 2015-16 Social Services Portfolio Budget Statements. The 2015-16 Social Services Portfolio Budget Statements discloses a $2,175.306 million appropriation receivable amount in receivables, while the financial statements discloses this amount in equity. The variance in other non-financial assets relates to no prepayments reported by DSS as at 30 June 2016.
Receivables Other non-financial assets