Embed Size (px)
Citation preview
Financial Statement Financial Statement AnalysisAnalysis
Financial Statement Financial Statement AnalysisAnalysis
© Pearson Education Limited 2004Fundamentals of Financial Management, 12/e
Created by: Gregory A. Kuhlemeyer, Ph.D.Carroll College, Waukesha, WI
Financial Financial Statement AnalysisStatement AnalysisFinancial Financial Statement AnalysisStatement Analysis
Financial Statements
A Possible Framework for Analysis
Balance Sheet Ratios
Income Statement and Income Statement/Balance Sheet Ratios
Trend Analysis
Common-Size and Index Analysis
Financial Statements
A Possible Framework for Analysis
Balance Sheet Ratios
Income Statement and Income Statement/Balance Sheet Ratios
Trend Analysis
Common-Size and Index Analysis
Examples of External Uses Examples of External Uses of Statement Analysisof Statement AnalysisExamples of External Uses Examples of External Uses of Statement Analysisof Statement Analysis
Trade CreditorsTrade Creditors -- Focus on the liquidity of the firm.
BondholdersBondholders -- Focus on the long-term cash flow of the firm.
ShareholdersShareholders -- Focus on the profitability and long-term health of the firm.
Trade CreditorsTrade Creditors -- Focus on the liquidity of the firm.
BondholdersBondholders -- Focus on the long-term cash flow of the firm.
ShareholdersShareholders -- Focus on the profitability and long-term health of the firm.
Examples of Internal Uses Examples of Internal Uses of Statement Analysisof Statement AnalysisExamples of Internal Uses Examples of Internal Uses of Statement Analysisof Statement Analysis
PlanPlan -- Focus on assessing the current financial position and evaluating potential firm opportunities.
ControlControl -- Focus on return on investment for various assets and asset efficiency.
UnderstandUnderstand -- Focus on understanding how suppliers of funds analyze the firm.
PlanPlan -- Focus on assessing the current financial position and evaluating potential firm opportunities.
ControlControl -- Focus on return on investment for various assets and asset efficiency.
UnderstandUnderstand -- Focus on understanding how suppliers of funds analyze the firm.
Primary Types of Primary Types of Financial StatementsFinancial StatementsPrimary Types of Primary Types of Financial StatementsFinancial Statements
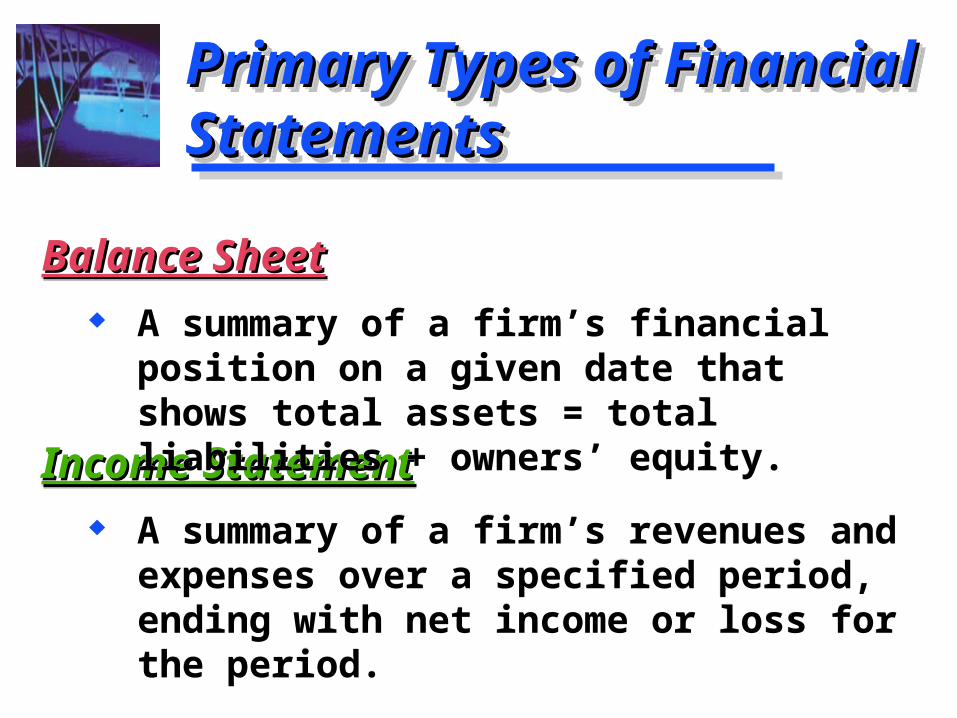
Income StatementIncome Statement A summary of a firm’s revenues and
expenses over a specified period, ending with net income or loss for the period.
Income StatementIncome Statement A summary of a firm’s revenues and
expenses over a specified period, ending with net income or loss for the period.
Balance SheetBalance Sheet A summary of a firm’s financial position on
a given date that shows total assets = total liabilities + owners’ equity.
Balance SheetBalance Sheet A summary of a firm’s financial position on
a given date that shows total assets = total liabilities + owners’ equity.
Basket Wonders’ Balance Basket Wonders’ Balance Sheet (Asset Side)Sheet (Asset Side)Basket Wonders’ Balance Basket Wonders’ Balance Sheet (Asset Side)Sheet (Asset Side)
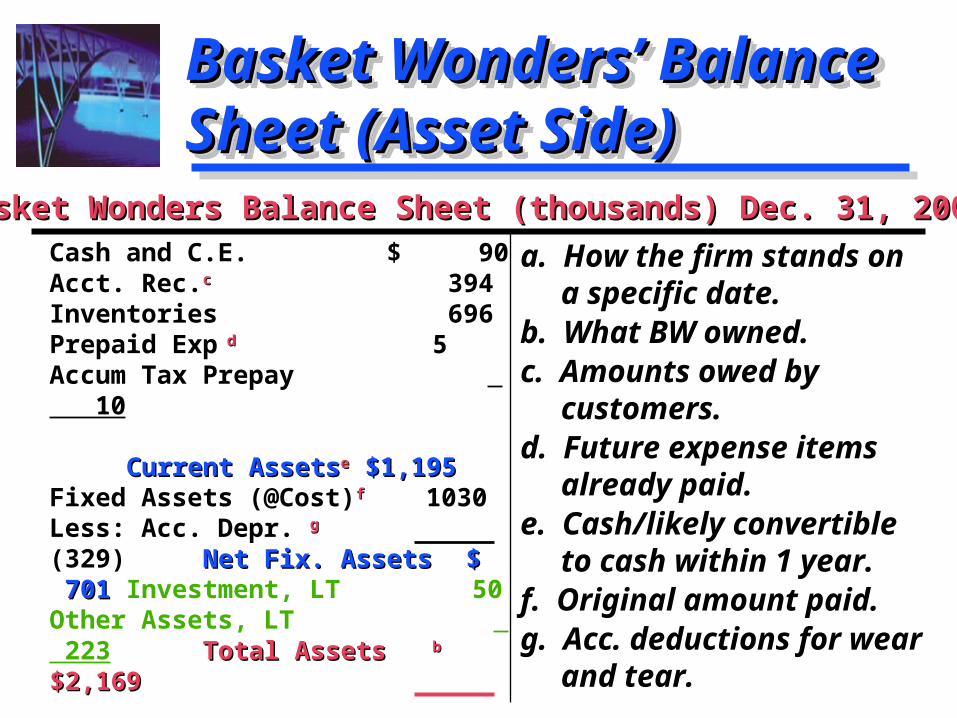
a. How the firm stands on a specific date.
b. What BW owned.c. Amounts owed by
customers.d. Future expense items
already paid.e. Cash/likely convertible
to cash within 1 year.f. Original amount paid.g. Acc. deductions for
wear and tear.
a. How the firm stands on a specific date.
b. What BW owned.c. Amounts owed by
customers.d. Future expense items
already paid.e. Cash/likely convertible
to cash within 1 year.f. Original amount paid.g. Acc. deductions for
wear and tear.
Cash and C.E. $ 90 Acct. Rec.cc 394 Inventories 696 Prepaid Exp dd 5 Accum Tax Prepay 10 Current AssetsCurrent Assetsee $1,195 $1,195 Fixed Assets (@Cost)ff 1030 Less: Acc. Depr. gg (329)
Net Fix. AssetsNet Fix. Assets $ 701 $ 701 Investment, LT 50 Other Assets, LT 223
Total AssetsTotal Assetsbb $2,169 $2,169
Basket Wonders Balance Sheet (thousands) Dec. 31, 2007Basket Wonders Balance Sheet (thousands) Dec. 31, 2007a
Basket Wonders’ Balance Basket Wonders’ Balance Sheet (Liability Side)Sheet (Liability Side)Basket Wonders’ Balance Basket Wonders’ Balance Sheet (Liability Side)Sheet (Liability Side)
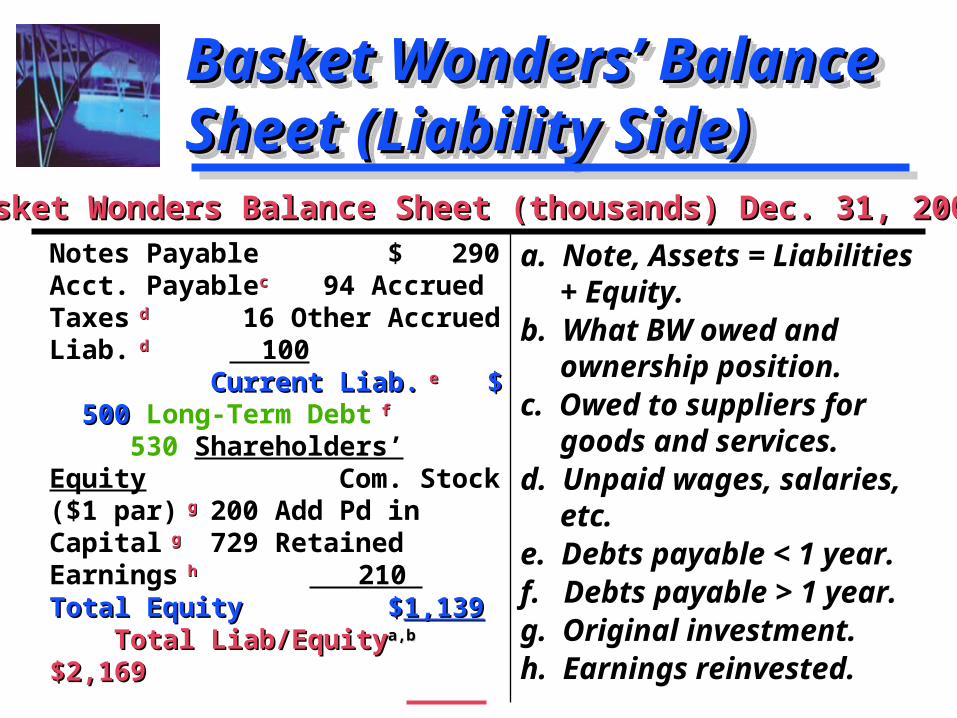
a. Note, Assets = Liabilities + Equity.
b. What BW owed and ownership position.
c. Owed to suppliers for goods and services.
d. Unpaid wages, salaries, etc.
e. Debts payable < 1 year.f. Debts payable > 1 year.g. Original investment. h. Earnings reinvested.
a. Note, Assets = Liabilities + Equity.
b. What BW owed and ownership position.
c. Owed to suppliers for goods and services.
d. Unpaid wages, salaries, etc.
e. Debts payable < 1 year.f. Debts payable > 1 year.g. Original investment. h. Earnings reinvested.
Notes Payable $ 290 Acct. Payablecc 94 Accrued Taxes dd 16 Other Accrued Liab. dd 100 Current Liab.Current Liab. ee $ $ 500 500 Long-Term Debt ff
530 Shareholders’ Equity Com. Stock ($1 par) gg 200 Add Pd in Capital gg
729 Retained Earnings hh 210 Total Total EquityEquity $ $1,1391,139 Total Liab/EquityTotal Liab/Equitya,ba,b $2,169 $2,169
Basket Wonders Balance Sheet (thousands) Dec. 31, 2007Basket Wonders Balance Sheet (thousands) Dec. 31, 2007
Basket Wonders’ Basket Wonders’ Income StatementIncome StatementBasket Wonders’ Basket Wonders’ Income StatementIncome Statement
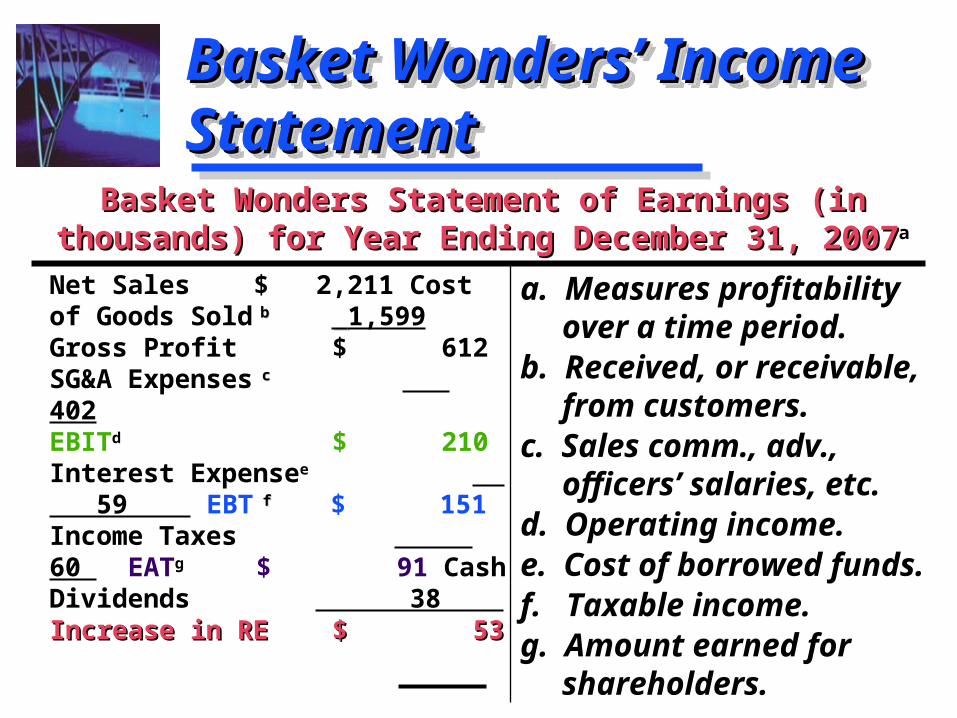
a. Measures profitability over a time period.
b. Received, or receivable, from customers.
c. Sales comm., adv., officers’ salaries, etc.
d. Operating income.e. Cost of borrowed funds.f. Taxable income.g. Amount earned for
shareholders.
a. Measures profitability over a time period.
b. Received, or receivable, from customers.
c. Sales comm., adv., officers’ salaries, etc.
d. Operating income.e. Cost of borrowed funds.f. Taxable income.g. Amount earned for
shareholders.
Net Sales $ 2,211 Cost of Goods Sold bb 1,599
Gross Profit $ 612 SG&A Expenses c c 402 EBITd $ 210 Interest Expensee 59 EBT f f $ 151 Income Taxes 60 EATg $ 91 Cash Dividends 38 Increase in REIncrease in RE $ 53 $ 53
Basket Wonders Statement of Earnings (in thousands) Basket Wonders Statement of Earnings (in thousands) for Year Ending December 31, 2007for Year Ending December 31, 2007a
Use of Financial RatiosUse of Financial RatiosUse of Financial RatiosUse of Financial Ratios
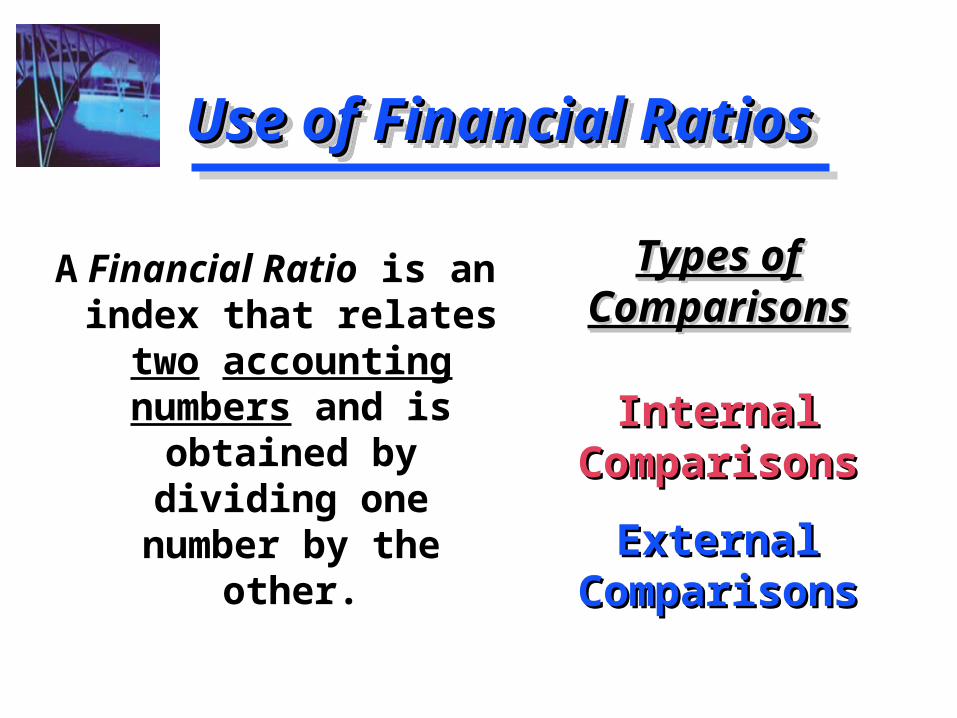
Types of Types of ComparisonsComparisons
Internal Internal ComparisonsComparisons
External External ComparisonsComparisons
Types of Types of ComparisonsComparisons
Internal Internal ComparisonsComparisons
External External ComparisonsComparisons
A Financial Ratio is an index that relates
two accounting numbers and is
obtained by dividing one number by the
other.
External Comparisons and External Comparisons and Sources of Industry RatiosSources of Industry RatiosExternal Comparisons and External Comparisons and Sources of Industry RatiosSources of Industry Ratios
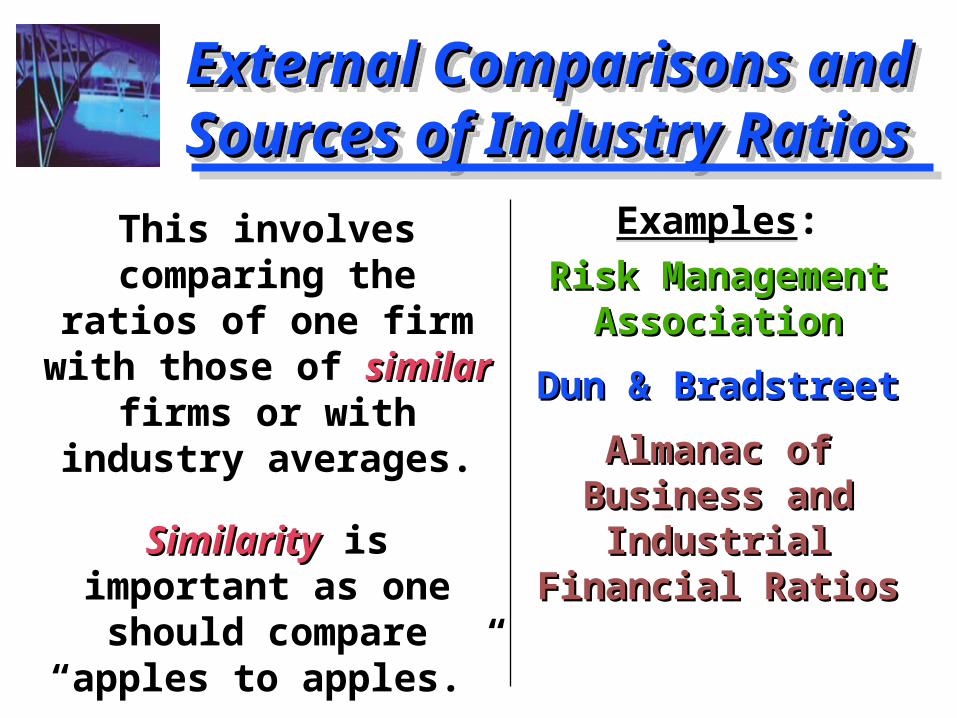
Examples:
Risk Management Risk Management AssociationAssociation
Dun & BradstreetDun & Bradstreet
Almanac of Almanac of Business and Business and
Industrial Industrial Financial RatiosFinancial Ratios
Examples:
Risk Management Risk Management AssociationAssociation
Dun & BradstreetDun & Bradstreet
Almanac of Almanac of Business and Business and
Industrial Industrial Financial RatiosFinancial Ratios
This involves comparing the ratios of one firm with those of similarsimilar firms or with
industry averages.
SimilaritySimilarity is important as one should
compare “apples to apples.”
Liquidity RatiosLiquidity RatiosLiquidity RatiosLiquidity Ratios
CurrentCurrent
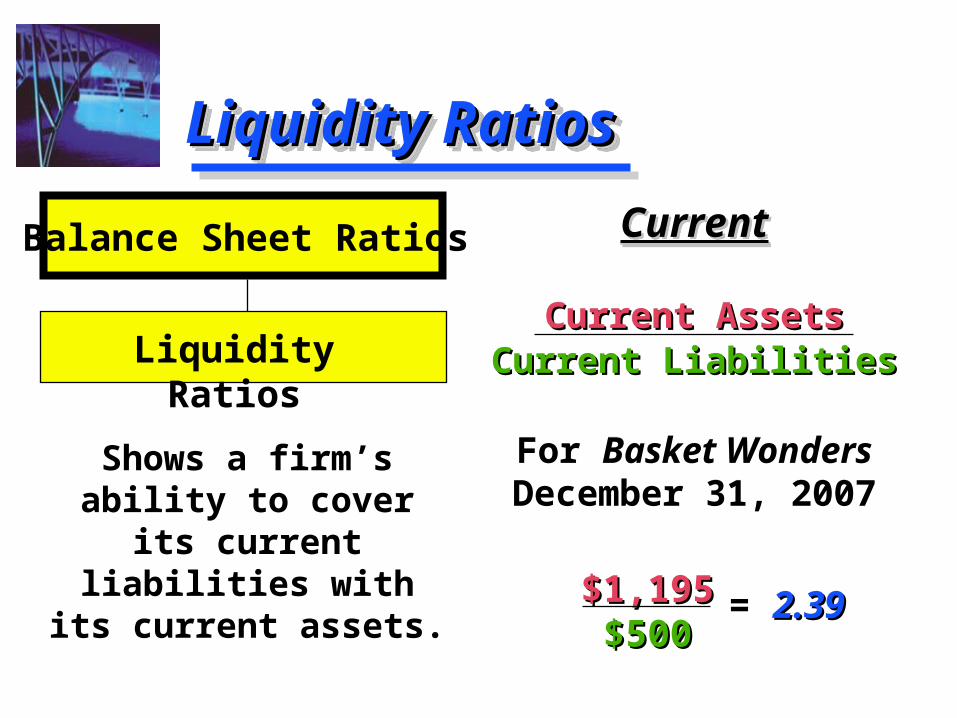
Current AssetsCurrent AssetsCurrent LiabilitiesCurrent Liabilities
For Basket Wonders December 31, 2007
CurrentCurrent
Current AssetsCurrent AssetsCurrent LiabilitiesCurrent Liabilities
For Basket Wonders December 31, 2007
Shows a firm’s ability to cover its current liabilities with its current
assets.
Balance Sheet Ratios
Liquidity Ratios
$1,195$1,195$500$500
= 2.392.39
Liquidity Ratio Liquidity Ratio ComparisonsComparisonsLiquidity Ratio Liquidity Ratio ComparisonsComparisons
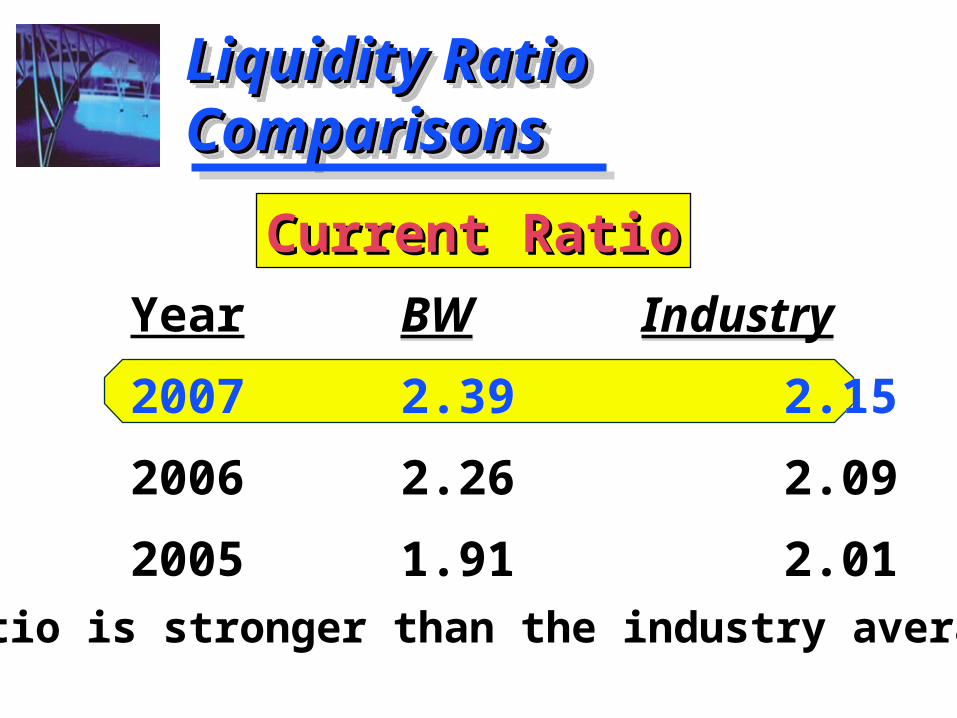
BW Industry
2.39 2.15
2.26 2.09
1.91 2.01
BW Industry
2.39 2.15
2.26 2.09
1.91 2.01
Year
2007
2006
2005
CurrentCurrent RatioRatio
Ratio is stronger than the industry average.
Liquidity RatiosLiquidity RatiosLiquidity RatiosLiquidity Ratios
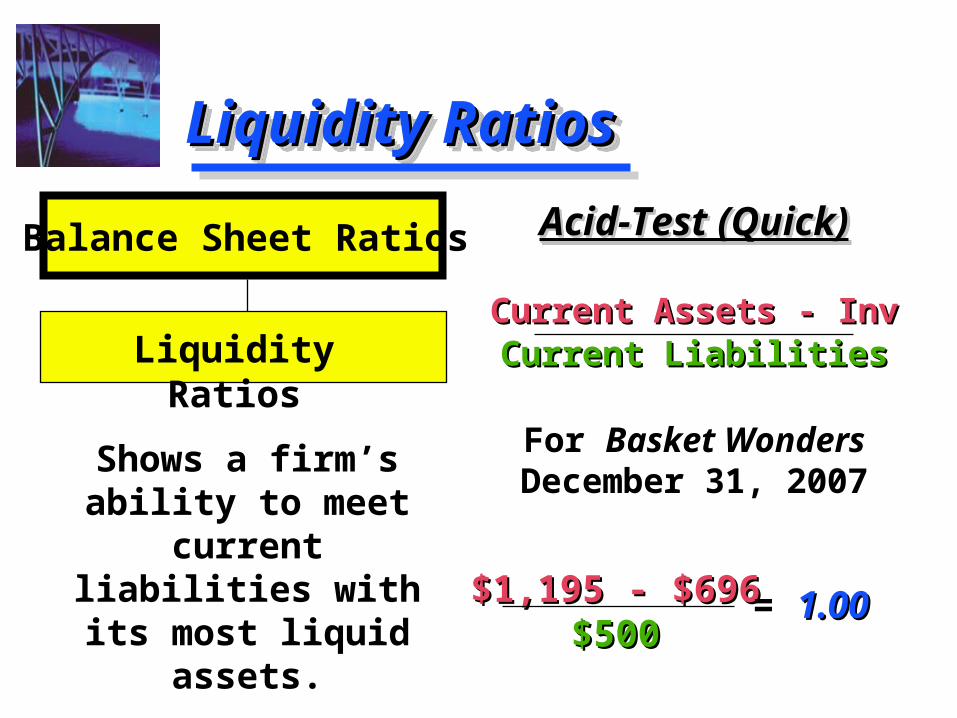
Acid-Test (Quick)Acid-Test (Quick)
Current Assets - InvCurrent Assets - InvCurrent LiabilitiesCurrent Liabilities
For Basket Wonders December 31, 2007
Acid-Test (Quick)Acid-Test (Quick)
Current Assets - InvCurrent Assets - InvCurrent LiabilitiesCurrent Liabilities
For Basket Wonders December 31, 2007
Shows a firm’s ability to meet
current liabilities with its most liquid
assets.
Balance Sheet Ratios
Liquidity Ratios
$1,195 - $696$1,195 - $696$500$500
= 1.001.00
Liquidity Ratio Liquidity Ratio ComparisonsComparisonsLiquidity Ratio Liquidity Ratio ComparisonsComparisons
BW Industry
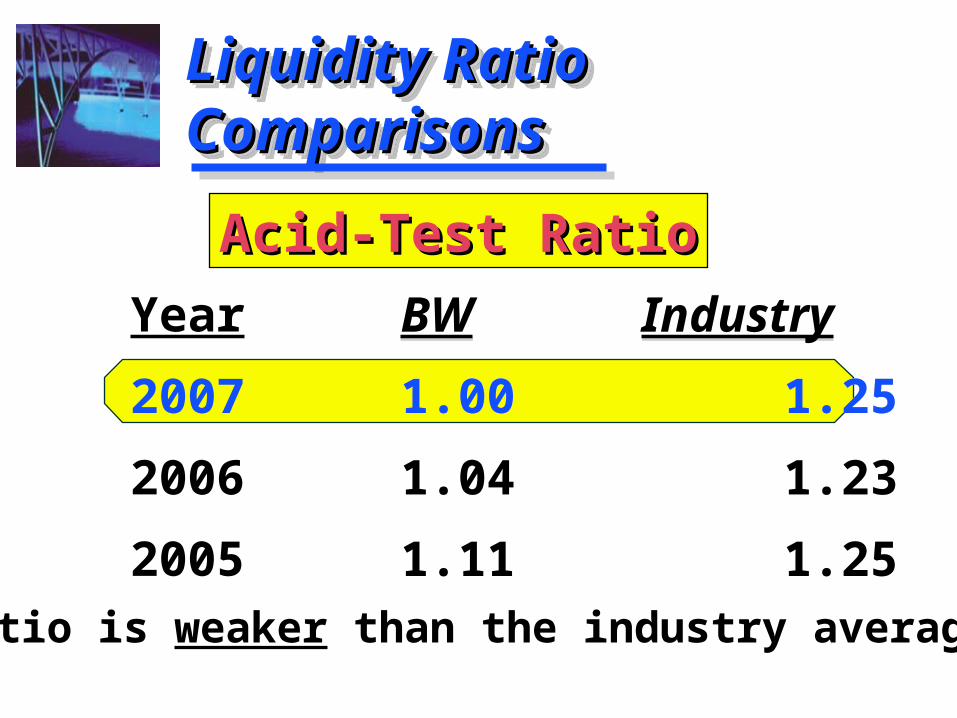
1.00 1.25
1.04 1.23
1.11 1.25
BW Industry
1.00 1.25
1.04 1.23
1.11 1.25
Year
2007
2006
2005
Acid-Test RatioAcid-Test Ratio
Ratio is weaker than the industry average.

Summary of the Liquidity Summary of the Liquidity Ratio ComparisonsRatio ComparisonsSummary of the Liquidity Summary of the Liquidity Ratio ComparisonsRatio Comparisons
Strong current ratio and weak acid-test ratio indicates a potential problem in the inventories account.
Note that this industry has a relatively high level of inventories.
Strong current ratio and weak acid-test ratio indicates a potential problem in the inventories account.
Note that this industry has a relatively high level of inventories.
RatioRatio BWBW IndustryIndustry
Current 2.39 2.15
Acid-Test 1.00 1.25

Current Ratio -- Trend Current Ratio -- Trend Analysis ComparisonAnalysis ComparisonCurrent Ratio -- Trend Current Ratio -- Trend Analysis ComparisonAnalysis Comparison
Trend Analysis of Current Ratio
1.5
1.7
1.9
2.1
2.3
2.5
2005 2006 2007
Analysis Year
Rat
io V
alu
e
BW
Industry
Acid-Test Ratio -- Trend Acid-Test Ratio -- Trend Analysis ComparisonAnalysis ComparisonAcid-Test Ratio -- Trend Acid-Test Ratio -- Trend Analysis ComparisonAnalysis Comparison
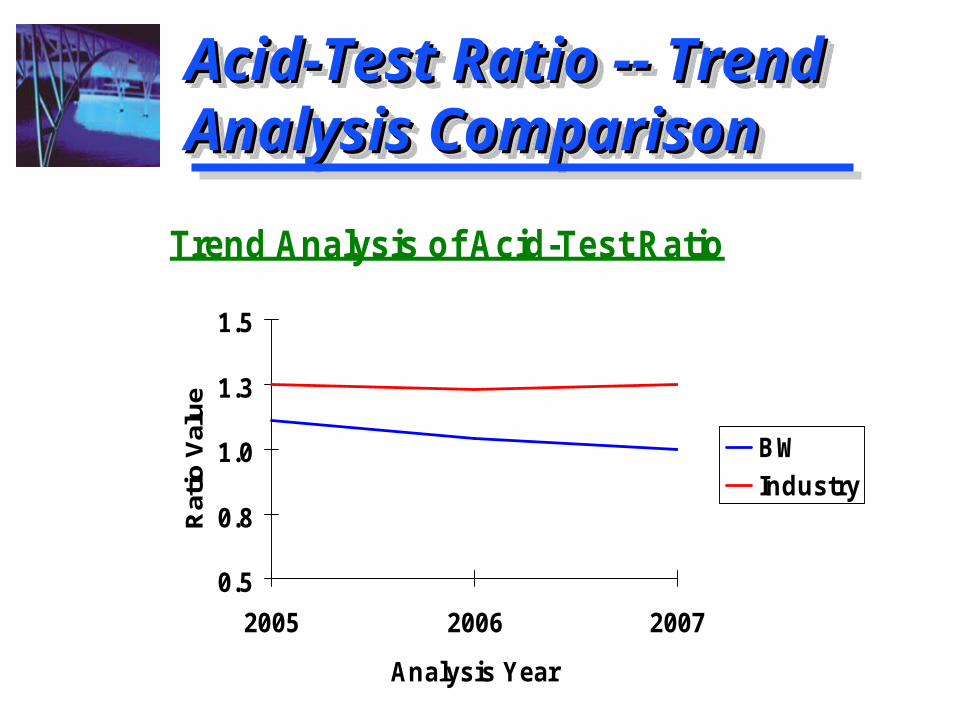
Trend Analysis of Acid-Test Ratio
0.5
0.8
1.0
1.3
1.5
2005 2006 2007
Analysis Year
Rat
io V
alu
e
BW
Industry
Summary of the Liquidity Summary of the Liquidity Trend AnalysesTrend AnalysesSummary of the Liquidity Summary of the Liquidity Trend AnalysesTrend Analyses
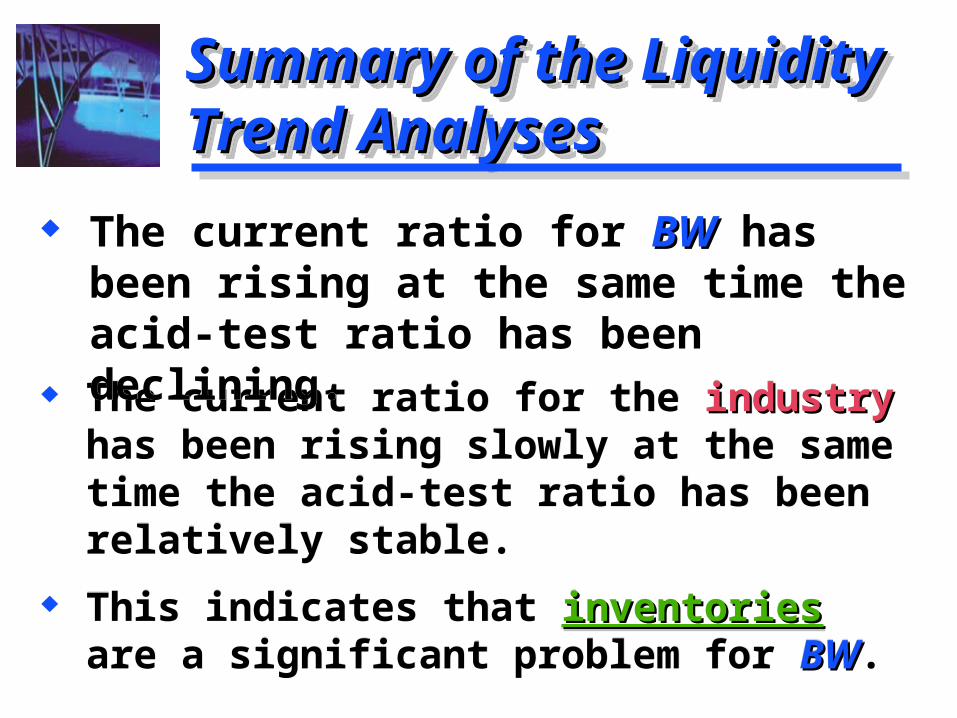
The current ratio for the industryindustry has been rising slowly at the same time the acid-test ratio has been relatively stable.
This indicates that inventoriesinventories are a significant problem for BWBW.
The current ratio for the industryindustry has been rising slowly at the same time the acid-test ratio has been relatively stable.
This indicates that inventoriesinventories are a significant problem for BWBW.
The current ratio for BWBW has been rising at the same time the acid-test ratio has been declining.
The current ratio for BWBW has been rising at the same time the acid-test ratio has been declining.
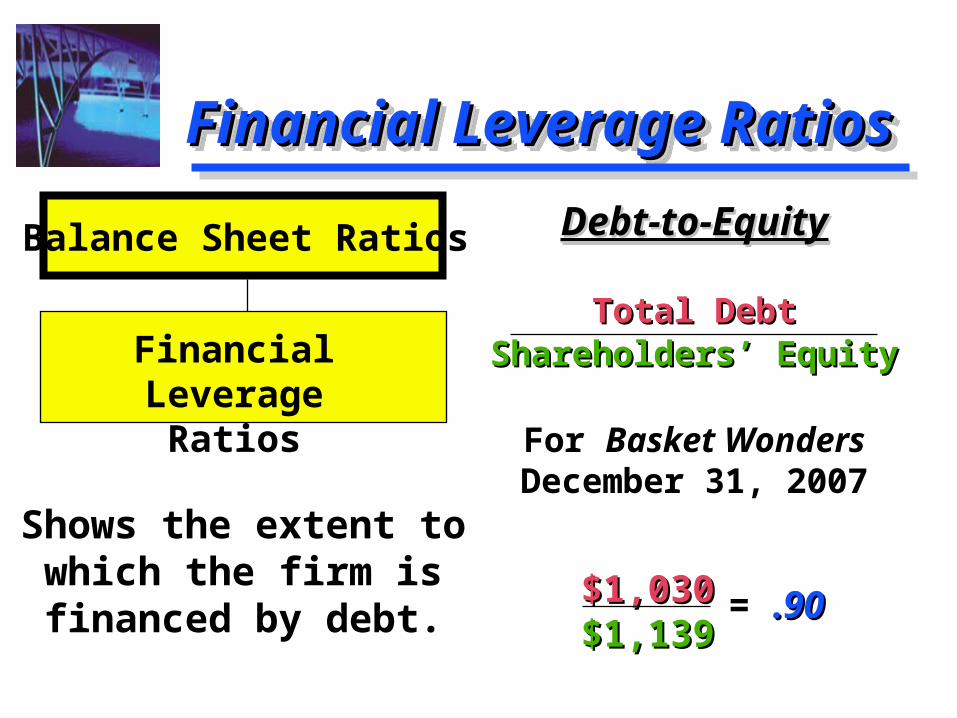
Financial Leverage RatiosFinancial Leverage RatiosFinancial Leverage RatiosFinancial Leverage Ratios
Debt-to-EquityDebt-to-Equity
Total DebtTotal DebtShareholders’ EquityShareholders’ Equity
For Basket Wonders December 31, 2007
Debt-to-EquityDebt-to-Equity
Total DebtTotal DebtShareholders’ EquityShareholders’ Equity
For Basket Wonders December 31, 2007Shows the extent to
which the firm is financed by debt.
Balance Sheet Ratios
Financial LeverageRatios
$1,030$1,030$1,139$1,139
= .90.90
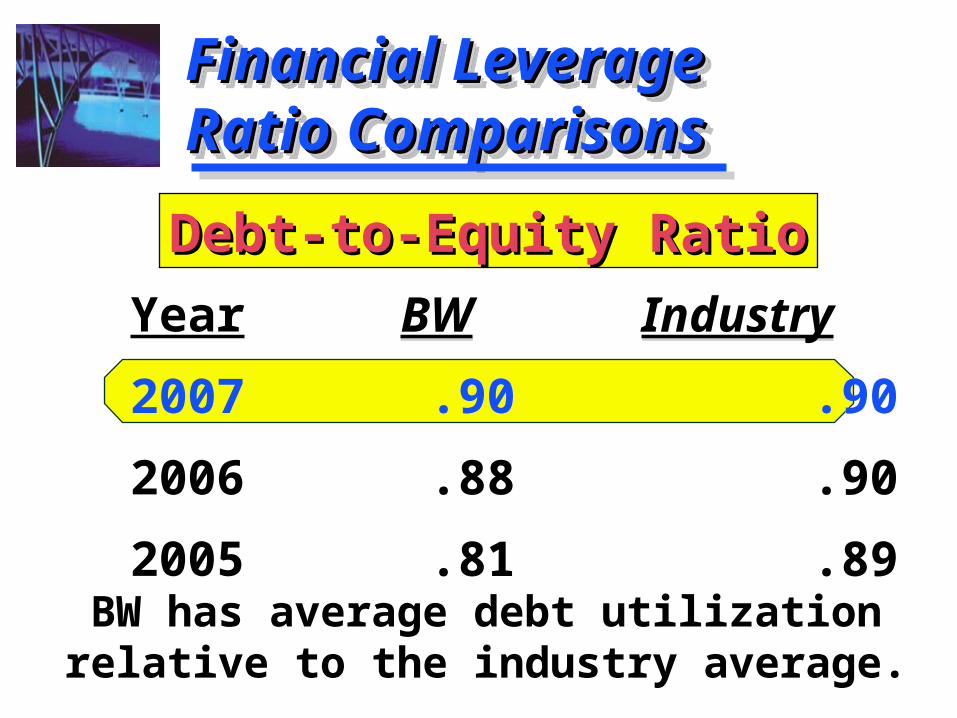
Financial Leverage Financial Leverage Ratio ComparisonsRatio ComparisonsFinancial Leverage Financial Leverage Ratio ComparisonsRatio Comparisons
BW Industry
.90 .90
.88 .90
.81 .89
BW Industry
.90 .90
.88 .90
.81 .89
Year
2007
2006
2005
Debt-to-Equity RatioDebt-to-Equity Ratio
BW has average debt utilizationrelative to the industry average.
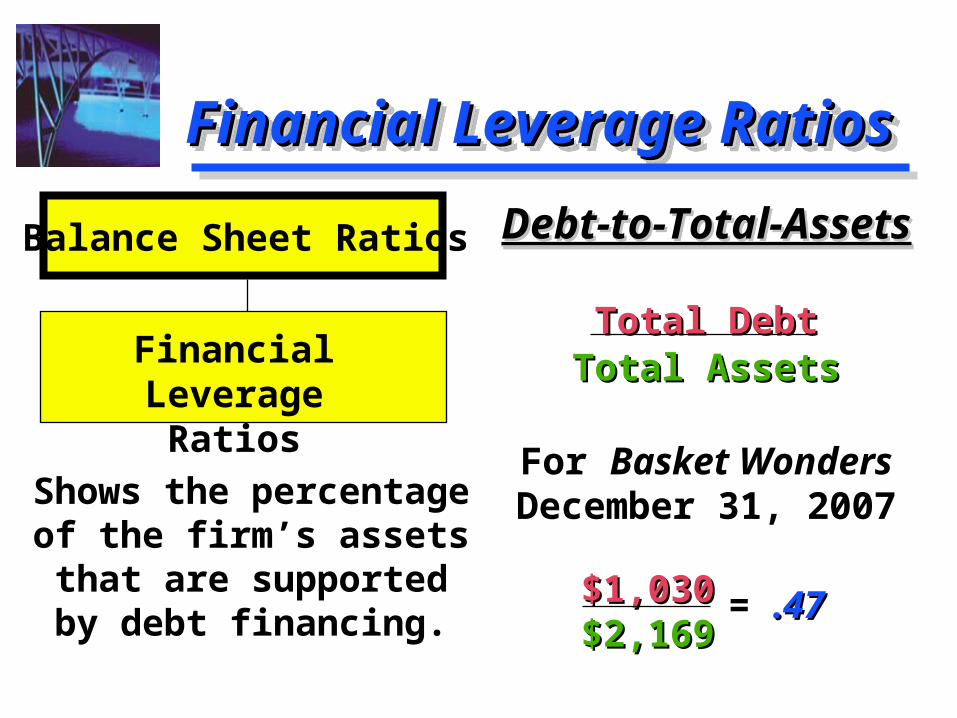
Financial Leverage RatiosFinancial Leverage RatiosFinancial Leverage RatiosFinancial Leverage Ratios
Debt-to-Total-AssetsDebt-to-Total-Assets
Total DebtTotal DebtTotal AssetsTotal Assets
For Basket Wonders December 31, 2007
Debt-to-Total-AssetsDebt-to-Total-Assets
Total DebtTotal DebtTotal AssetsTotal Assets
For Basket Wonders December 31, 2007Shows the percentage
of the firm’s assets that are supported by
debt financing.
Balance Sheet Ratios
Financial LeverageRatios
$1,030$1,030$2,169$2,169
= .47.47
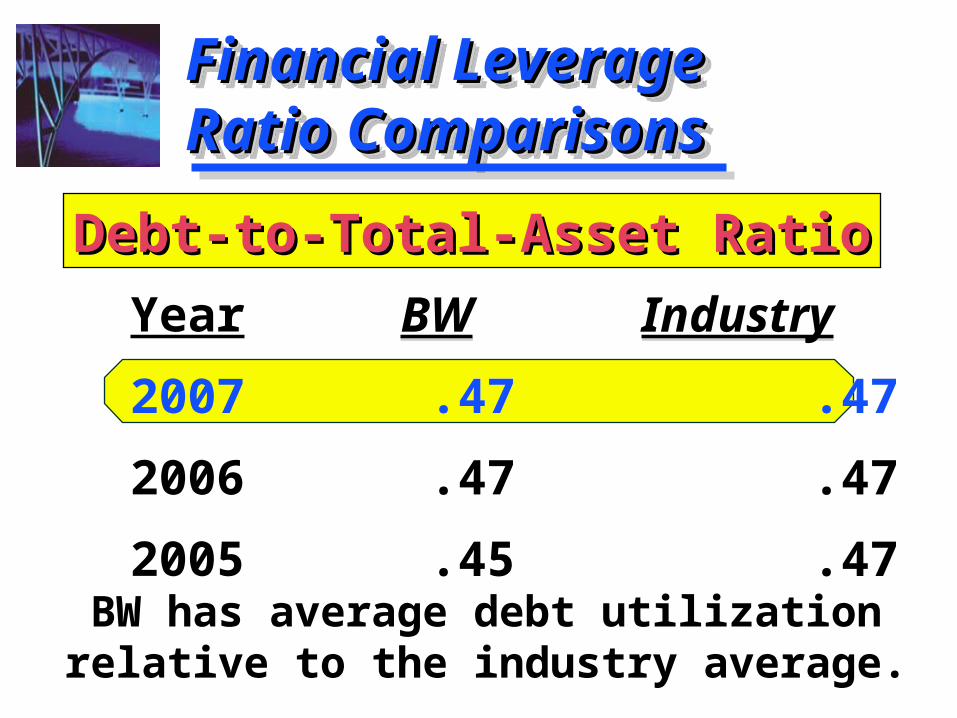
Financial Leverage Financial Leverage Ratio ComparisonsRatio ComparisonsFinancial Leverage Financial Leverage Ratio ComparisonsRatio Comparisons
BW Industry
.47 .47
.47 .47
.45 .47
BW Industry
.47 .47
.47 .47
.45 .47
Year
2007
2006
2005
Debt-to-Total-Asset RatioDebt-to-Total-Asset Ratio
BW has average debt utilizationrelative to the industry average.
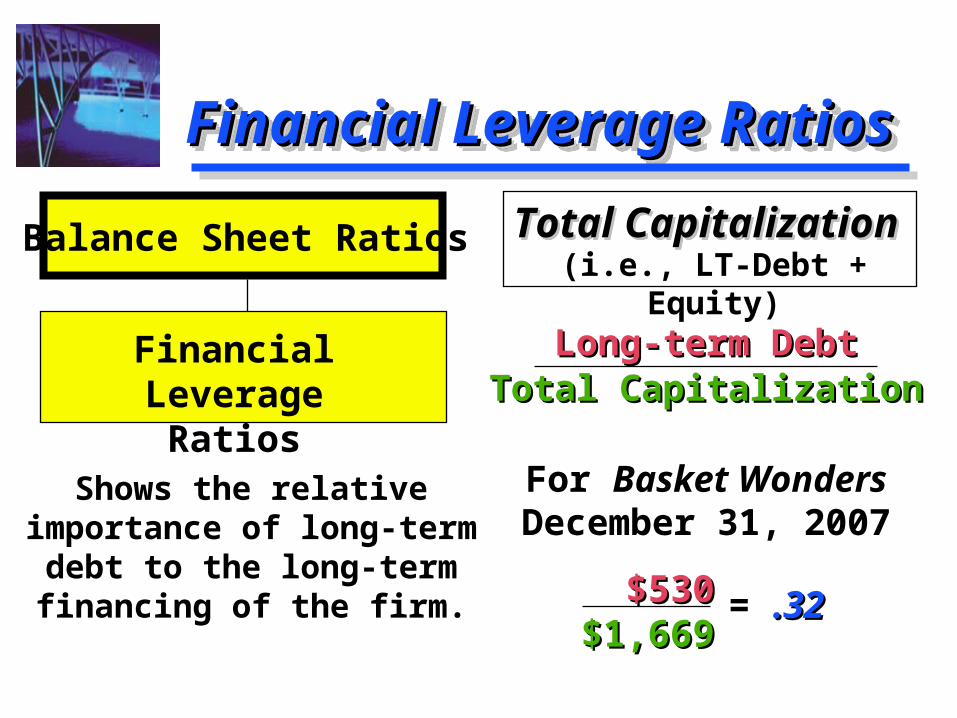
Financial Leverage RatiosFinancial Leverage RatiosFinancial Leverage RatiosFinancial Leverage Ratios
Total CapitalizationTotal Capitalization
Long-term DebtLong-term DebtTotal CapitalizationTotal Capitalization
For Basket Wonders December 31, 2007
Total CapitalizationTotal Capitalization
Long-term DebtLong-term DebtTotal CapitalizationTotal Capitalization
For Basket Wonders December 31, 2007
Shows the relative importance of long-term
debt to the long-term financing of the firm.
Balance Sheet Ratios
Financial LeverageRatios
$530$530$1,669$1,669
= .32.32
(i.e., LT-Debt + Equity)
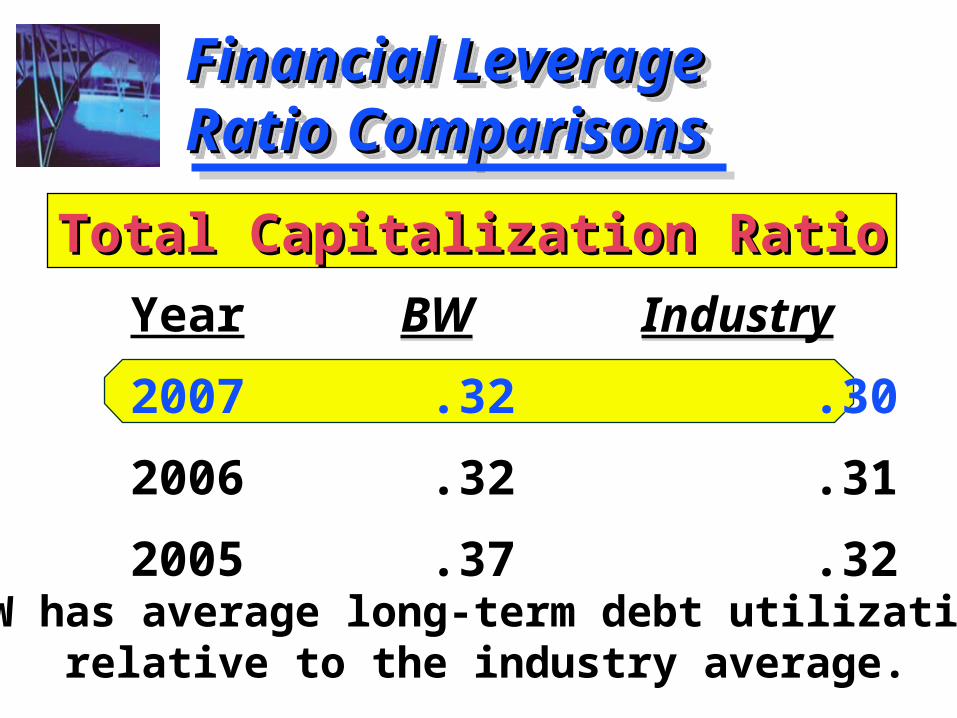
Financial Leverage Financial Leverage Ratio ComparisonsRatio ComparisonsFinancial Leverage Financial Leverage Ratio ComparisonsRatio Comparisons
BW Industry
.32 .30
.32 .31
.37 .32
BW Industry
.32 .30
.32 .31
.37 .32
Year
2007
2006
2005
Total Capitalization RatioTotal Capitalization Ratio
BW has average long-term debt utilizationrelative to the industry average.
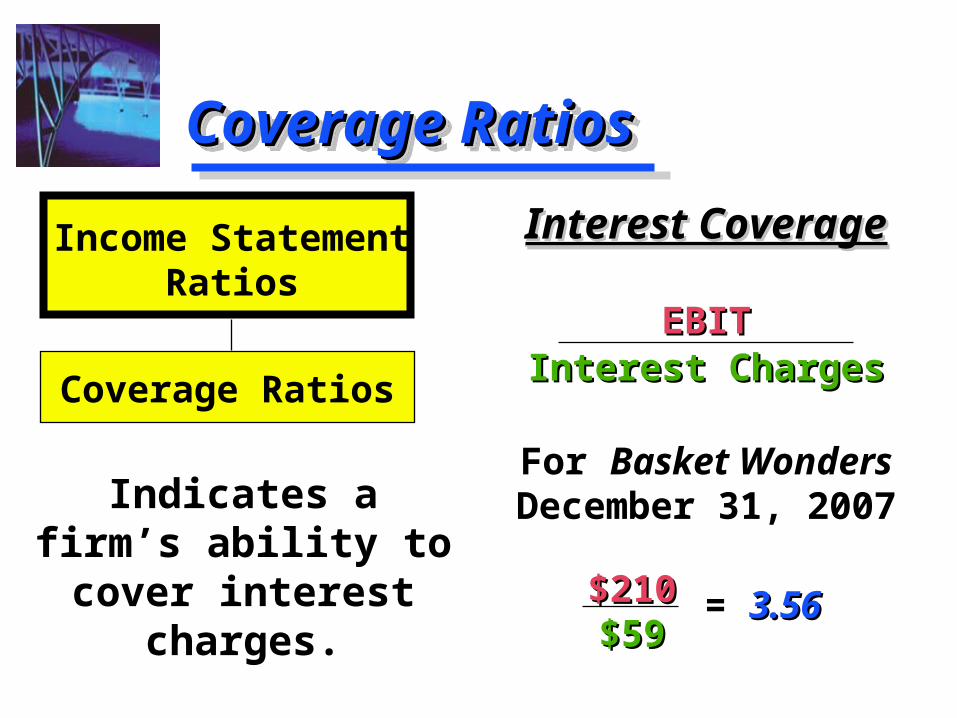
Coverage RatiosCoverage RatiosCoverage RatiosCoverage Ratios
Interest CoverageInterest Coverage
EBITEBITInterest ChargesInterest Charges
For Basket Wonders December 31, 2007
Interest CoverageInterest Coverage
EBITEBITInterest ChargesInterest Charges
For Basket Wonders December 31, 2007Indicates a firm’s
ability to cover interest charges.
Income StatementRatios
Coverage Ratios
$210$210$59$59
= 3.563.56
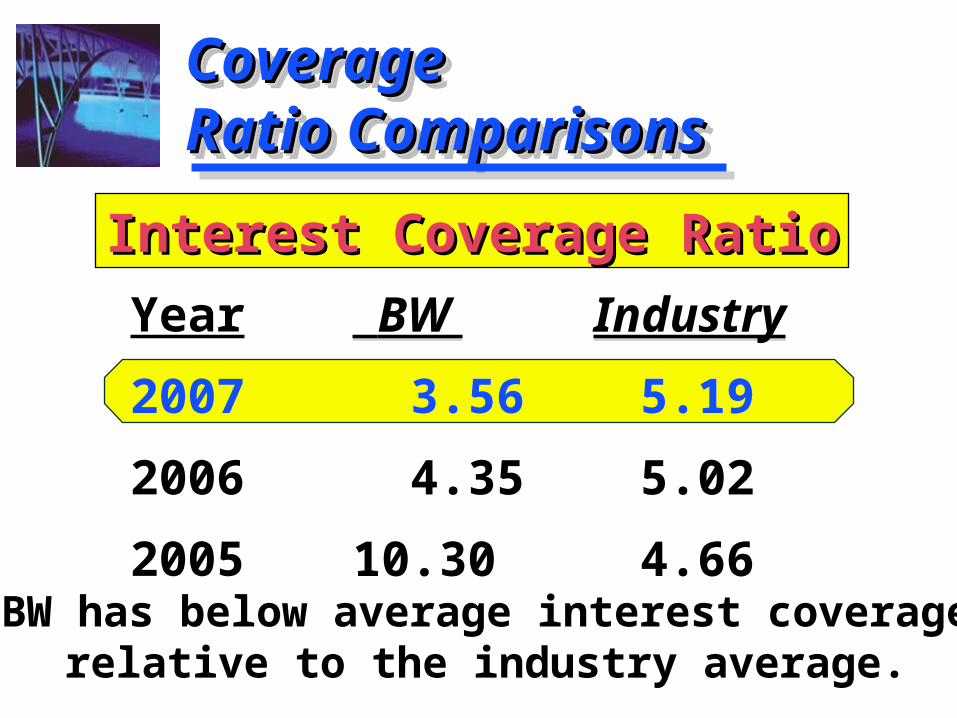
CoverageCoverageRatio ComparisonsRatio ComparisonsCoverageCoverageRatio ComparisonsRatio Comparisons
BW Industry
3.56 5.19
4.35 5.02
10.30 4.66
BW Industry
3.56 5.19
4.35 5.02
10.30 4.66
Year
2007
2006
2005
Interest Coverage RatioInterest Coverage Ratio
BW has below average interest coveragerelative to the industry average.
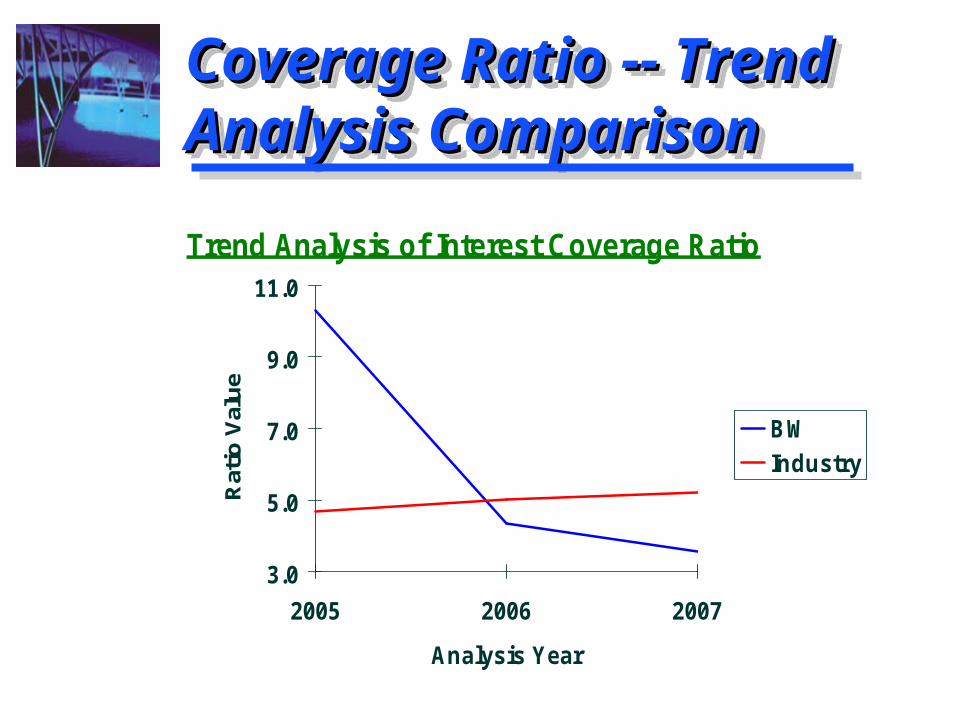
Coverage Ratio -- Trend Coverage Ratio -- Trend Analysis ComparisonAnalysis ComparisonCoverage Ratio -- Trend Coverage Ratio -- Trend Analysis ComparisonAnalysis Comparison
Trend Analysis of Interest Coverage Ratio
3.0
5.0
7.0
9.0
11.0
2005 2006 2007
Analysis Year
Rat
io V
alu
e
BW
Industry
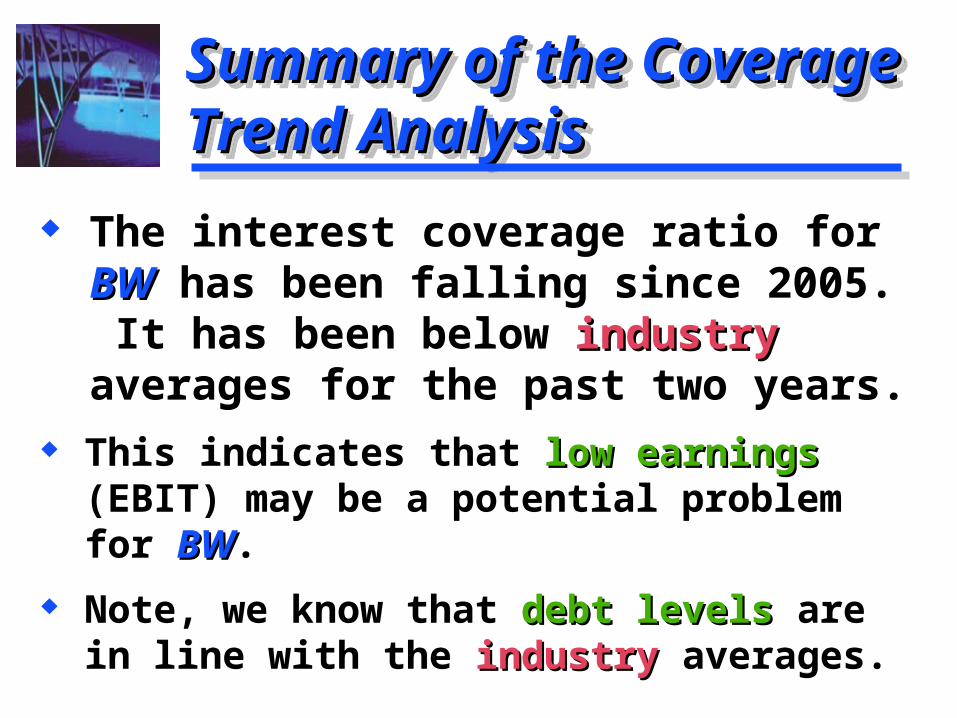
Summary of the Coverage Summary of the Coverage Trend AnalysisTrend AnalysisSummary of the Coverage Summary of the Coverage Trend AnalysisTrend Analysis
This indicates that low earnings low earnings (EBIT) may be a potential problem for BWBW.
Note, we know that debt levels debt levels are in line with the industryindustry averages.
This indicates that low earnings low earnings (EBIT) may be a potential problem for BWBW.
Note, we know that debt levels debt levels are in line with the industryindustry averages.
The interest coverage ratio for BWBW has been falling since 2005. It has been below industryindustry averages for the past two years.
The interest coverage ratio for BWBW has been falling since 2005. It has been below industryindustry averages for the past two years.
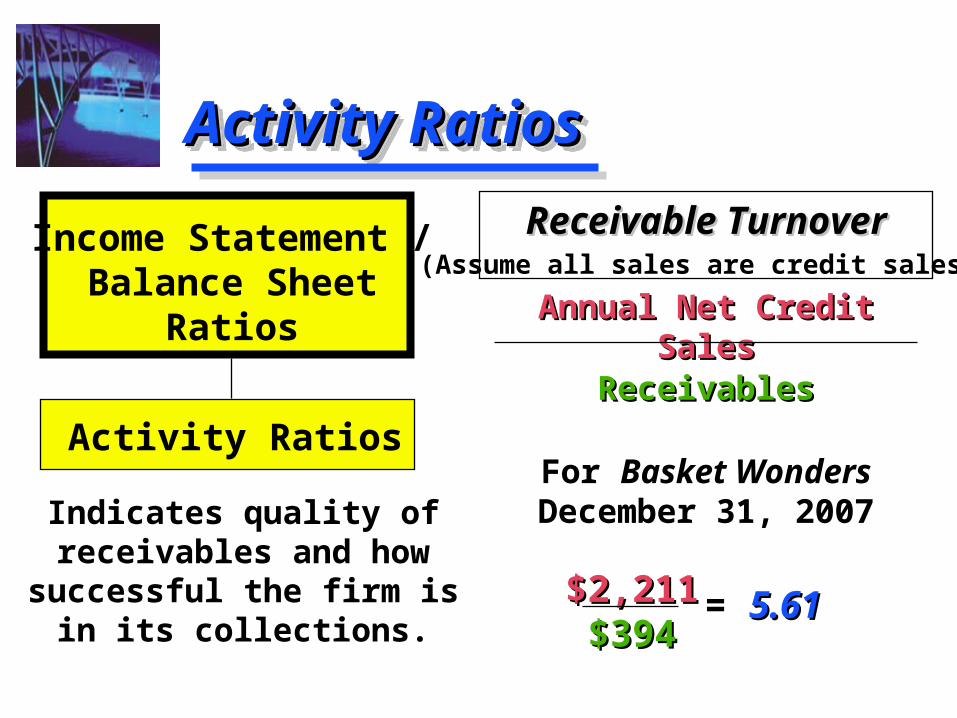
Activity RatiosActivity RatiosActivity RatiosActivity Ratios
Receivable TurnoverReceivable Turnover
Annual Net Credit SalesAnnual Net Credit SalesReceivablesReceivables
For Basket Wonders December 31, 2007
Receivable TurnoverReceivable Turnover
Annual Net Credit SalesAnnual Net Credit SalesReceivablesReceivables
For Basket Wonders December 31, 2007Indicates quality of
receivables and how successful the firm is in
its collections.
Income Statement /Balance Sheet
Ratios
Activity Ratios
$2,211$2,211$394$394
= 5.615.61
(Assume all sales are credit sales.)
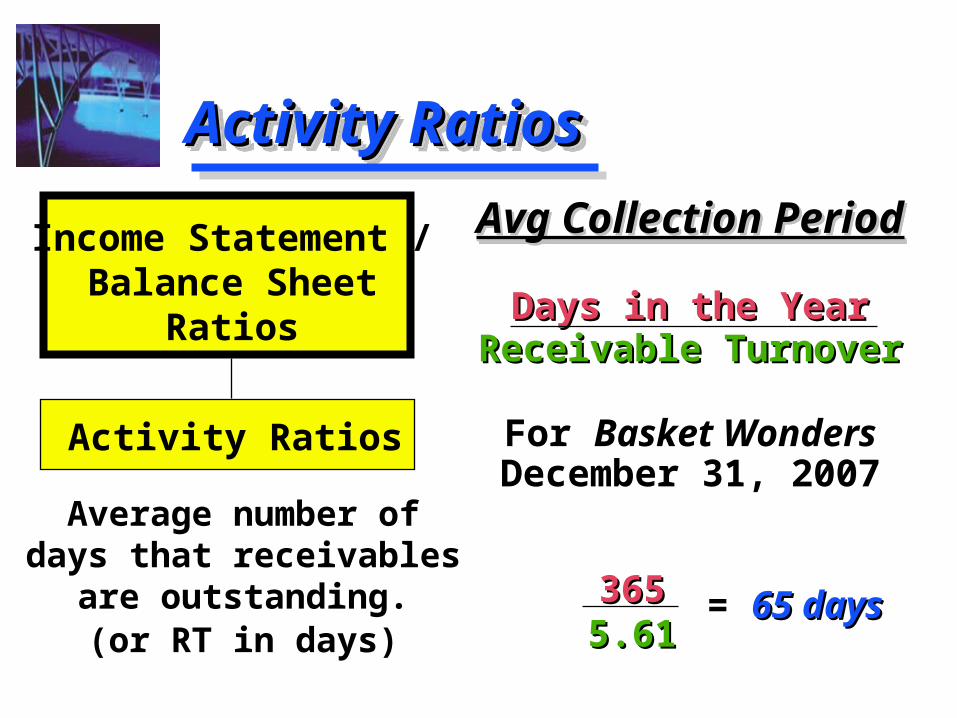
Activity RatiosActivity RatiosActivity RatiosActivity Ratios
Avg Collection PeriodAvg Collection Period
Days in the YearDays in the YearReceivable TurnoverReceivable Turnover
For Basket Wonders December 31, 2007
Avg Collection PeriodAvg Collection Period
Days in the YearDays in the YearReceivable TurnoverReceivable Turnover
For Basket Wonders December 31, 2007
Average number of days that receivables are
outstanding.(or RT in days)
Income Statement /Balance Sheet
Ratios
Activity Ratios
3653655.615.61
= 65 days65 days
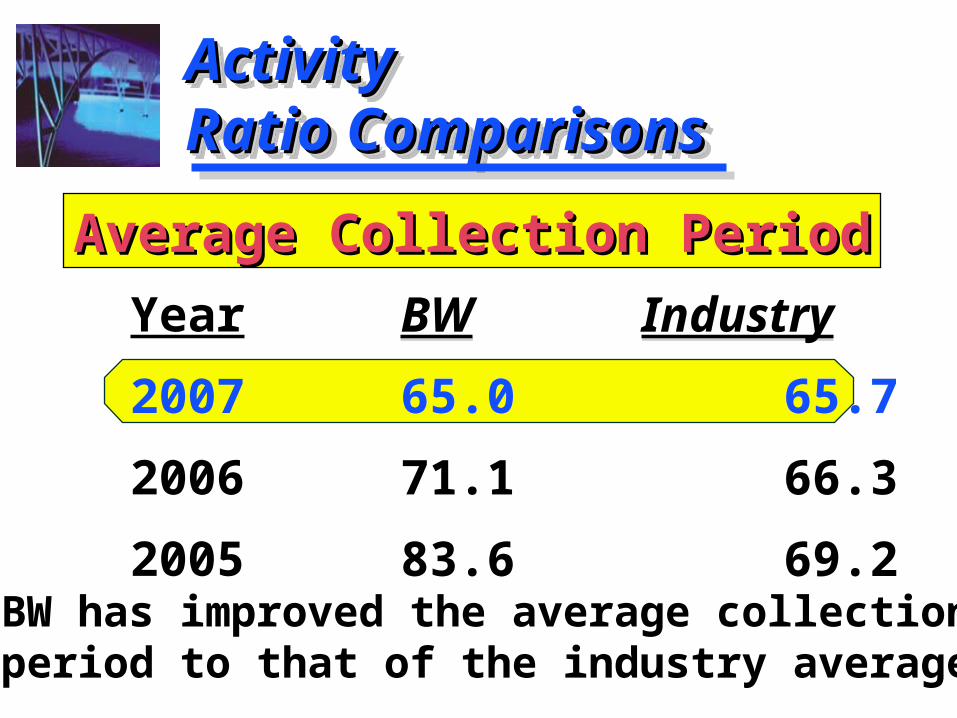
ActivityActivityRatio ComparisonsRatio ComparisonsActivityActivityRatio ComparisonsRatio Comparisons
BW Industry
65.0 65.7
71.1 66.3
83.6 69.2
BW Industry
65.0 65.7
71.1 66.3
83.6 69.2
Year
2007
2006
2005
Average Collection PeriodAverage Collection Period
BW has improved the average collection period to that of the industry average.
Activity RatiosActivity RatiosActivity RatiosActivity Ratios
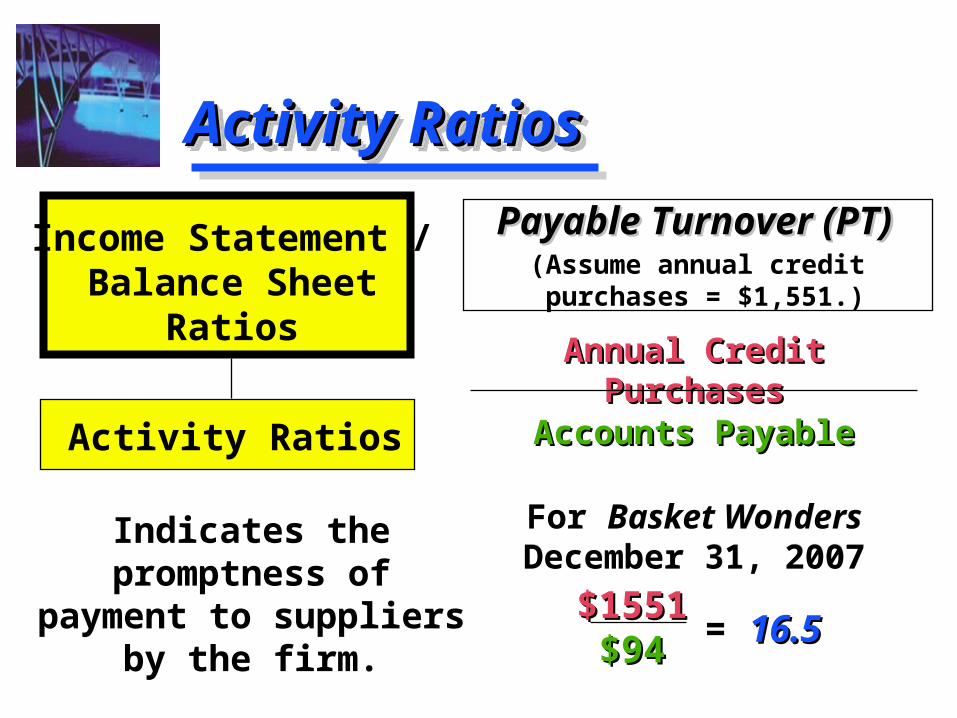
Payable Turnover (PT)Payable Turnover (PT)
Annual Credit PurchasesAnnual Credit PurchasesAccounts PayableAccounts Payable
For Basket Wonders December 31, 2007
Payable Turnover (PT)Payable Turnover (PT)
Annual Credit PurchasesAnnual Credit PurchasesAccounts PayableAccounts Payable
For Basket Wonders December 31, 2007
Indicates the promptness of payment to suppliers by the firm.
Income Statement /Balance Sheet
Ratios
Activity Ratios
$1551$1551$94$94 = 16.516.5
(Assume annual credit purchases = $1,551.)
Activity RatiosActivity RatiosActivity RatiosActivity Ratios
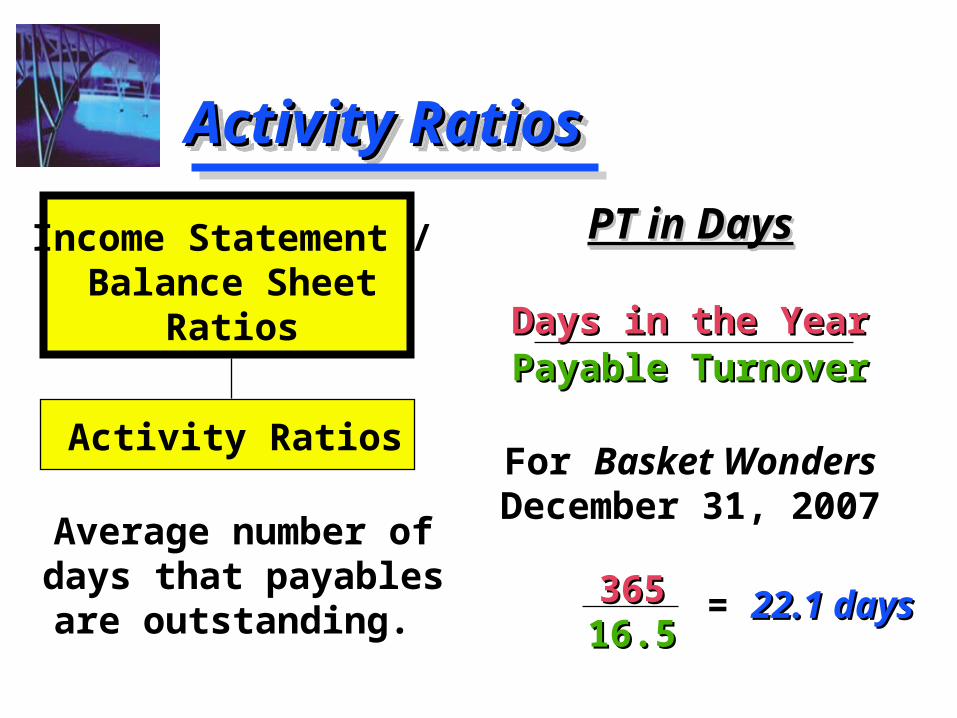
PT in DaysPT in Days
Days in the YearDays in the YearPayable TurnoverPayable Turnover
For Basket Wonders December 31, 2007
PT in DaysPT in Days
Days in the YearDays in the YearPayable TurnoverPayable Turnover
For Basket Wonders December 31, 2007
Average number of days that payables are
outstanding.
Income Statement /Balance Sheet
Ratios
Activity Ratios
36536516.516.5
= 22.1 days22.1 days
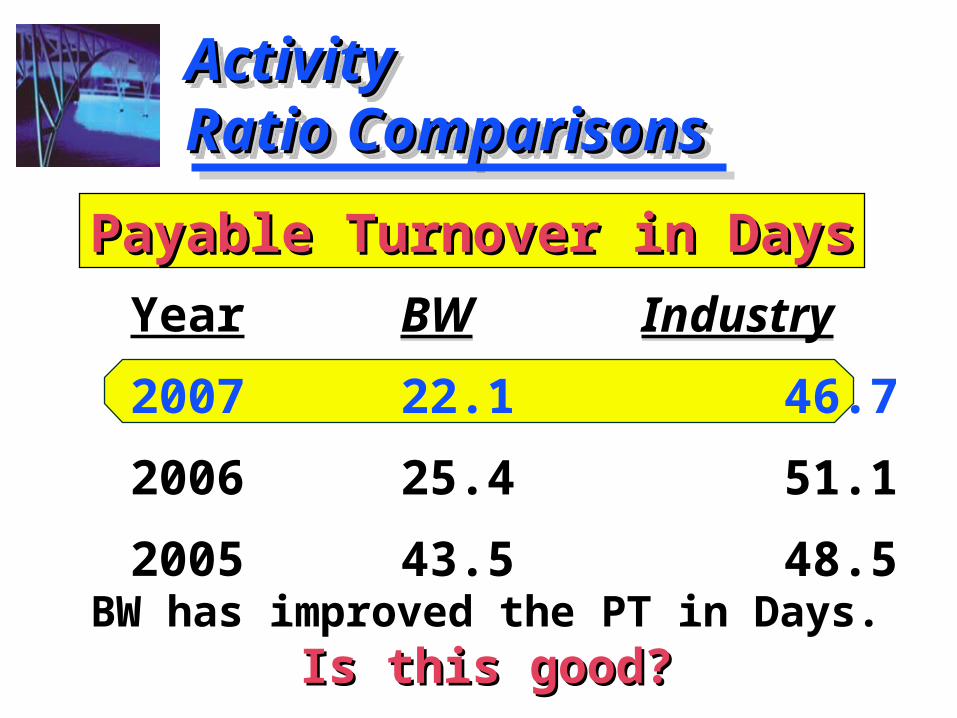
ActivityActivityRatio ComparisonsRatio ComparisonsActivityActivityRatio ComparisonsRatio Comparisons
BW Industry
22.1 46.7
25.4 51.1
43.5 48.5
BW Industry
22.1 46.7
25.4 51.1
43.5 48.5
Year
2007
2006
2005
Payable Turnover in DaysPayable Turnover in Days
BW has improved the PT in Days.Is this good?Is this good?

Activity RatiosActivity RatiosActivity RatiosActivity Ratios
Inventory TurnoverInventory Turnover
Cost of Goods SoldCost of Goods SoldInventoryInventory
For Basket Wonders December 31, 2007
Inventory TurnoverInventory Turnover
Cost of Goods SoldCost of Goods SoldInventoryInventory
For Basket Wonders December 31, 2007
Indicates the effectiveness of the
inventory management practices of the firm.
Income Statement /Balance Sheet
Ratios
Activity Ratios
$1,599$1,599$696$696
= 2.302.30
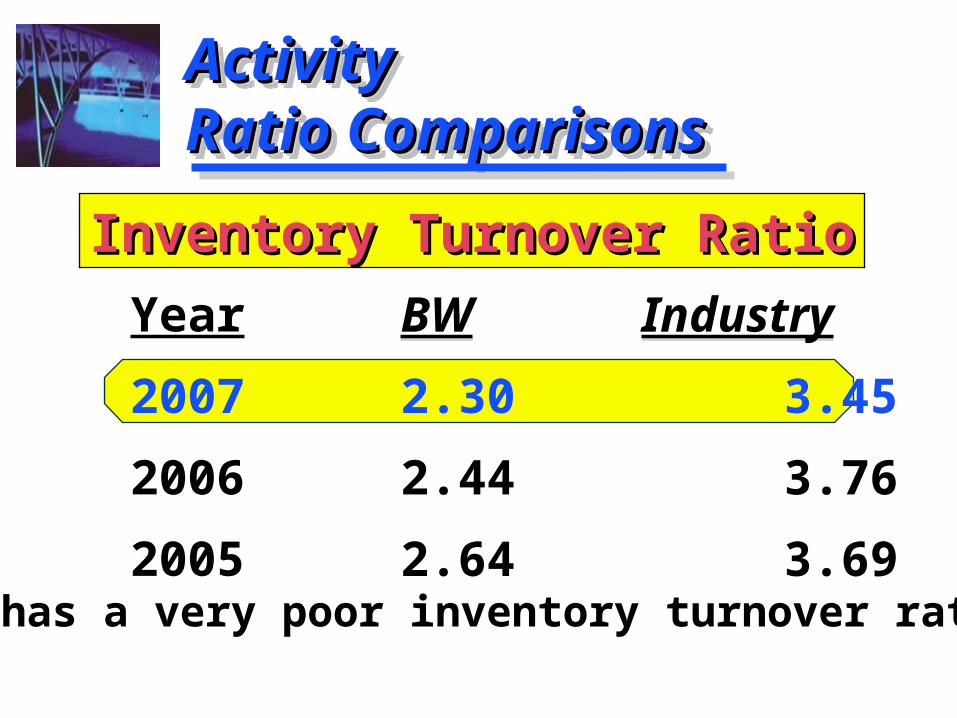
ActivityActivityRatio ComparisonsRatio ComparisonsActivityActivityRatio ComparisonsRatio Comparisons
BW Industry
2.30 3.45
2.44 3.76
2.64 3.69
BW Industry
2.30 3.45
2.44 3.76
2.64 3.69
Year
2007
2006
2005
Inventory Turnover RatioInventory Turnover Ratio
BW has a very poor inventory turnover ratio.
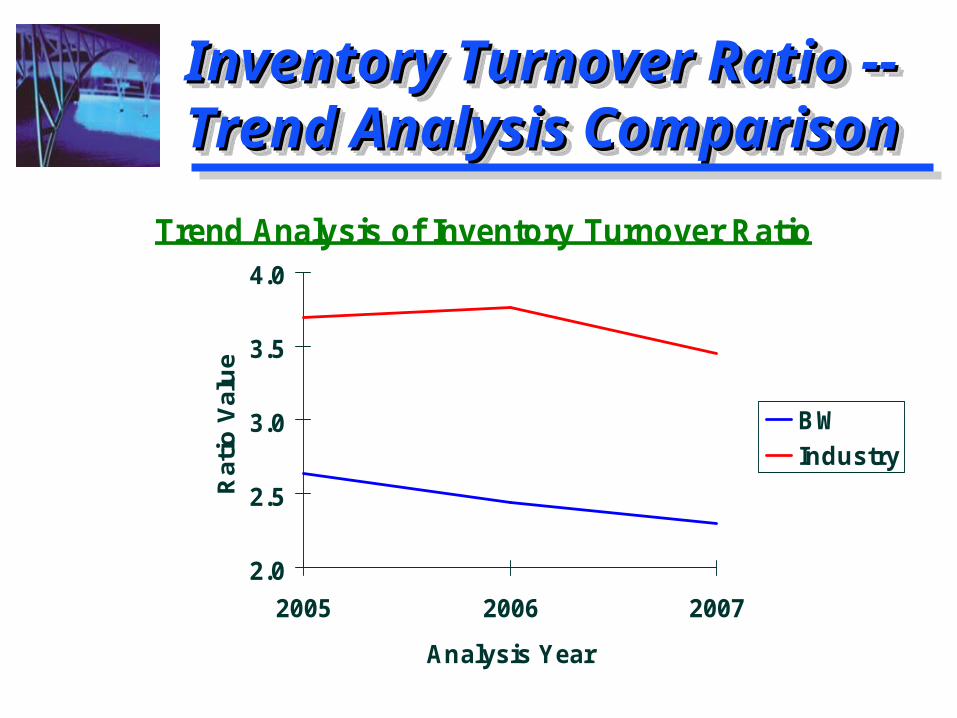
Inventory Turnover Ratio --Inventory Turnover Ratio --Trend Analysis ComparisonTrend Analysis ComparisonInventory Turnover Ratio --Inventory Turnover Ratio --Trend Analysis ComparisonTrend Analysis Comparison
Trend Analysis of Inventory Turnover Ratio
2.0
2.5
3.0
3.5
4.0
2005 2006 2007
Analysis Year
Rat
io V
alu
e
BW
Industry
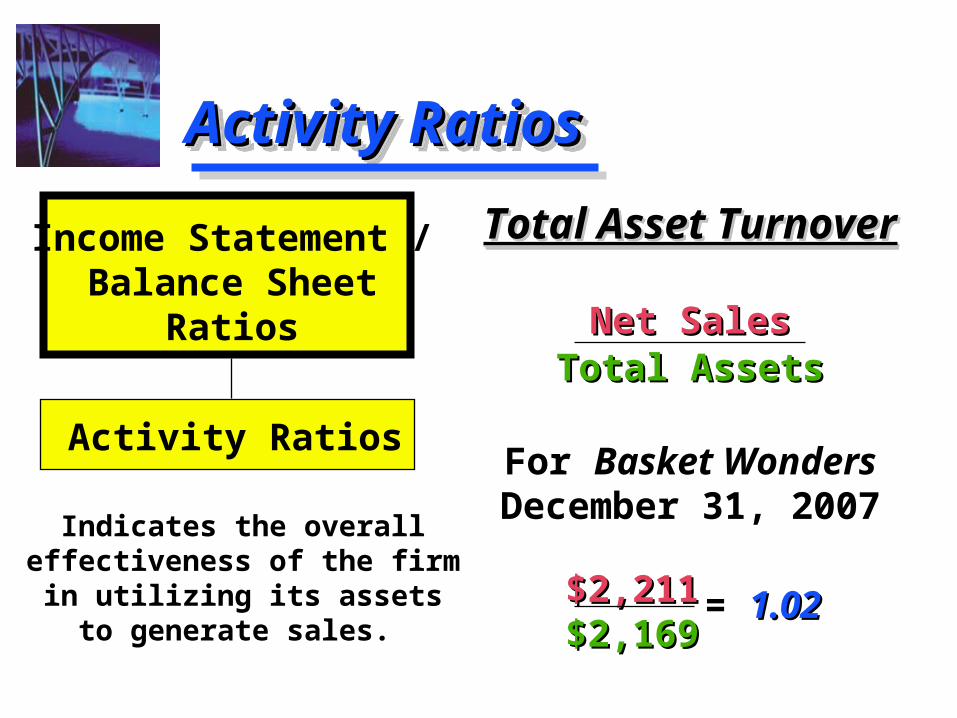
Activity RatiosActivity RatiosActivity RatiosActivity Ratios
Total Asset TurnoverTotal Asset Turnover
Net SalesNet SalesTotal AssetsTotal Assets
For Basket Wonders December 31, 2007
Total Asset TurnoverTotal Asset Turnover
Net SalesNet SalesTotal AssetsTotal Assets
For Basket Wonders December 31, 2007
Indicates the overall effectiveness of the firm in utilizing its assets to
generate sales.
Income Statement /Balance Sheet
Ratios
Activity Ratios
$2,211$2,211$2,169$2,169
= 1.021.02
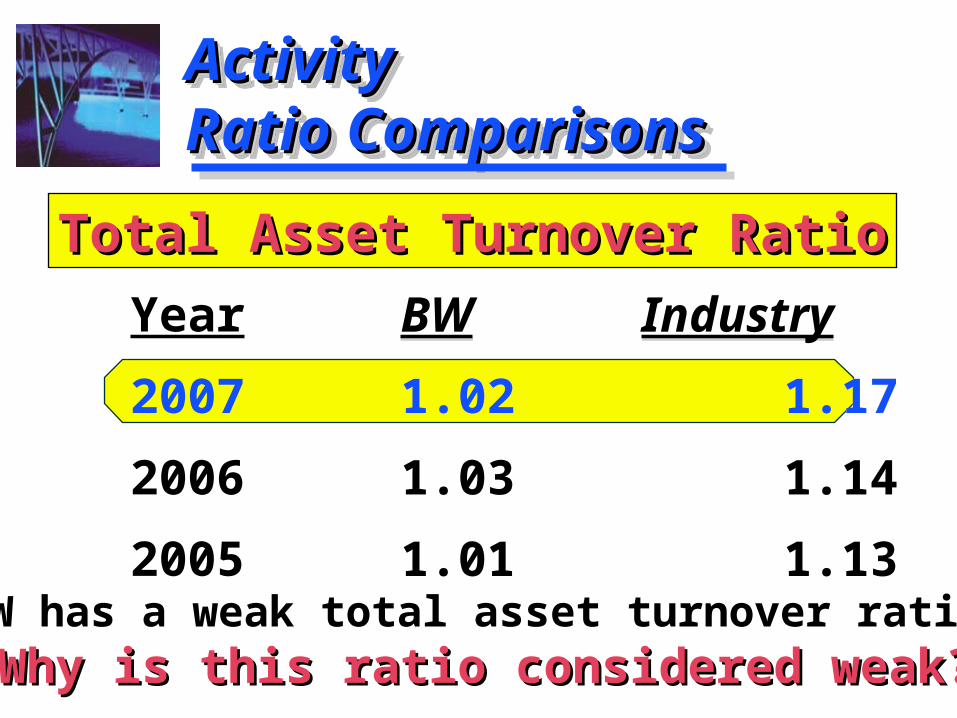
ActivityActivityRatio ComparisonsRatio ComparisonsActivityActivityRatio ComparisonsRatio Comparisons
BW Industry
1.02 1.17
1.03 1.14
1.01 1.13
BW Industry
1.02 1.17
1.03 1.14
1.01 1.13
Year
2007
2006
2005
Total Asset Turnover RatioTotal Asset Turnover Ratio
BW has a weak total asset turnover ratio.Why is this ratio considered weak?Why is this ratio considered weak?
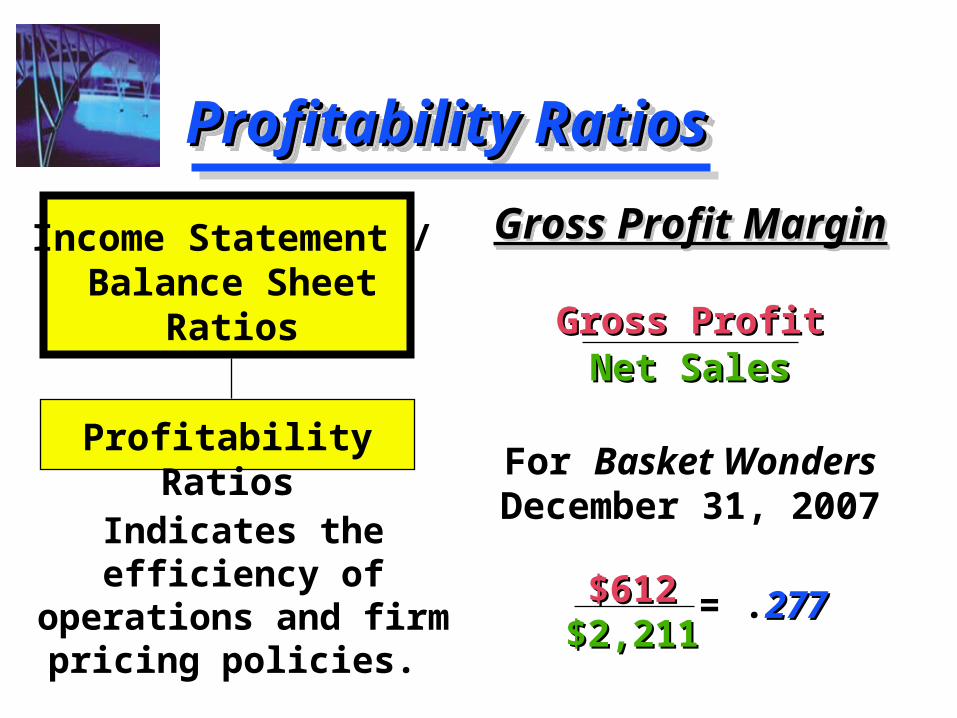
Profitability RatiosProfitability RatiosProfitability RatiosProfitability Ratios
Gross Profit MarginGross Profit Margin
Gross ProfitGross ProfitNet SalesNet Sales
For Basket Wonders December 31, 2007
Gross Profit MarginGross Profit Margin
Gross ProfitGross ProfitNet SalesNet Sales
For Basket Wonders December 31, 2007
Indicates the efficiency of operations and firm
pricing policies.
Income Statement /Balance Sheet
Ratios
Profitability Ratios
$612$612$2,211$2,211
= .277277
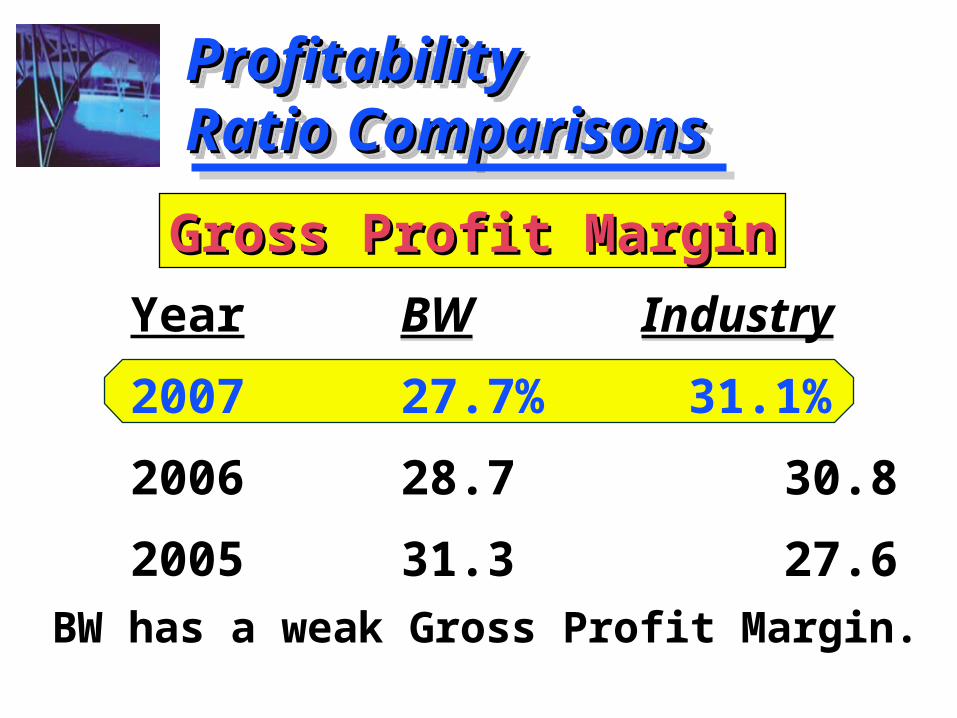
ProfitabilityProfitabilityRatio ComparisonsRatio ComparisonsProfitabilityProfitabilityRatio ComparisonsRatio Comparisons
BW Industry
27.7% 31.1%
28.7 30.8
31.3 27.6
BW Industry
27.7% 31.1%
28.7 30.8
31.3 27.6
Year
2007
2006
2005
Gross Profit MarginGross Profit Margin
BW has a weak Gross Profit Margin.
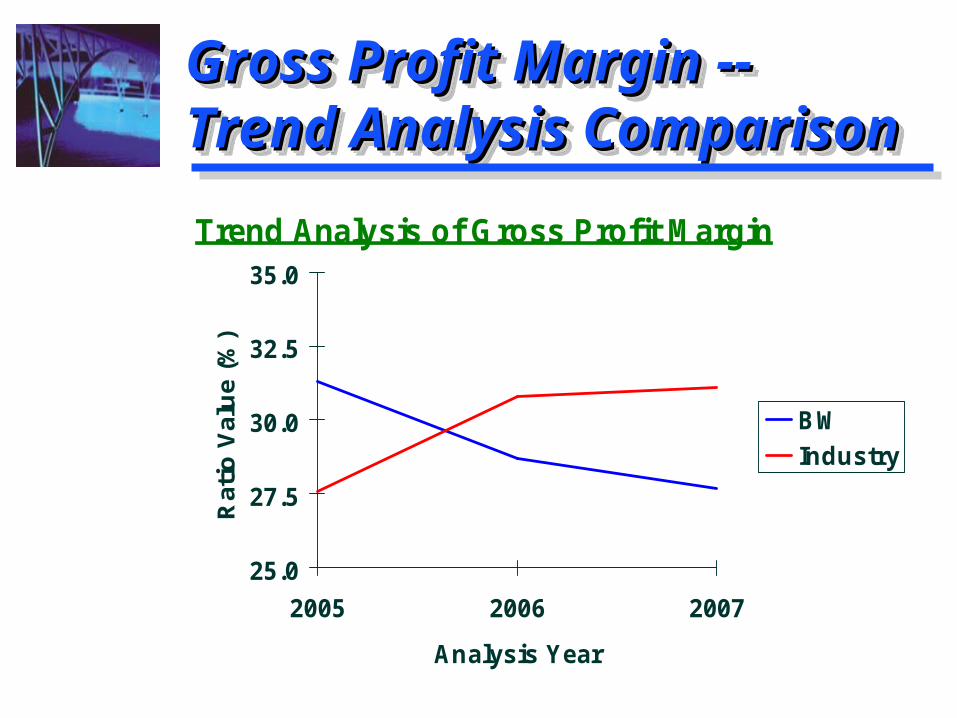
Gross Profit Margin --Gross Profit Margin --Trend Analysis ComparisonTrend Analysis ComparisonGross Profit Margin --Gross Profit Margin --Trend Analysis ComparisonTrend Analysis Comparison
Trend Analysis of Gross Profit Margin
25.0
27.5
30.0
32.5
35.0
2005 2006 2007
Analysis Year
Rat
io V
alu
e (%
)
BW
Industry
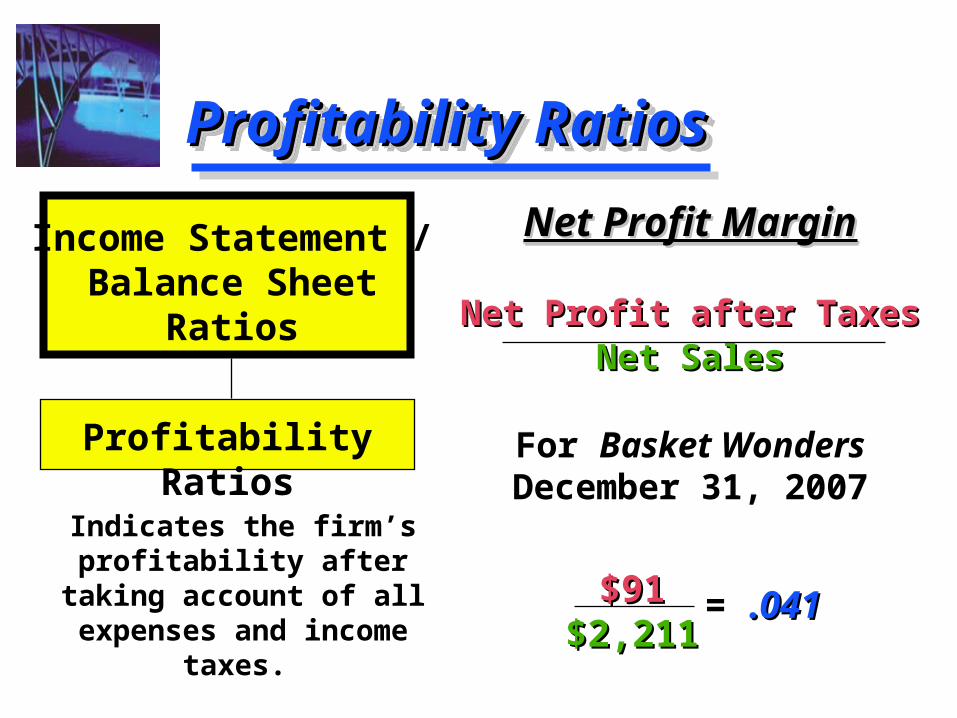
Profitability RatiosProfitability RatiosProfitability RatiosProfitability Ratios
Net Profit MarginNet Profit Margin
Net Profit after TaxesNet Profit after TaxesNet SalesNet Sales
For Basket Wonders December 31, 2007
Net Profit MarginNet Profit Margin
Net Profit after TaxesNet Profit after TaxesNet SalesNet Sales
For Basket Wonders December 31, 2007
Indicates the firm’s profitability after taking account of all expenses
and income taxes.
Income Statement /Balance Sheet
Ratios
Profitability Ratios
$91$91$2,211$2,211
= .041.041
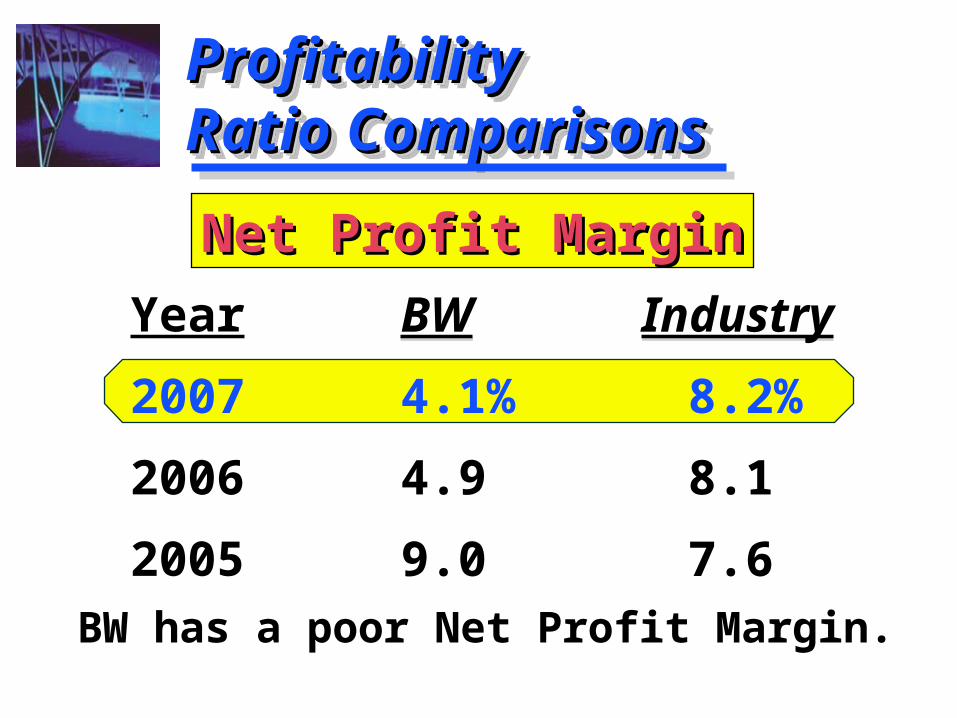
ProfitabilityProfitability Ratio ComparisonsRatio ComparisonsProfitabilityProfitability Ratio ComparisonsRatio Comparisons
BW Industry
4.1% 8.2%
4.9 8.1
9.0 7.6
BW Industry
4.1% 8.2%
4.9 8.1
9.0 7.6
Year
2007
2006
2005
Net Profit MarginNet Profit Margin
BW has a poor Net Profit Margin.
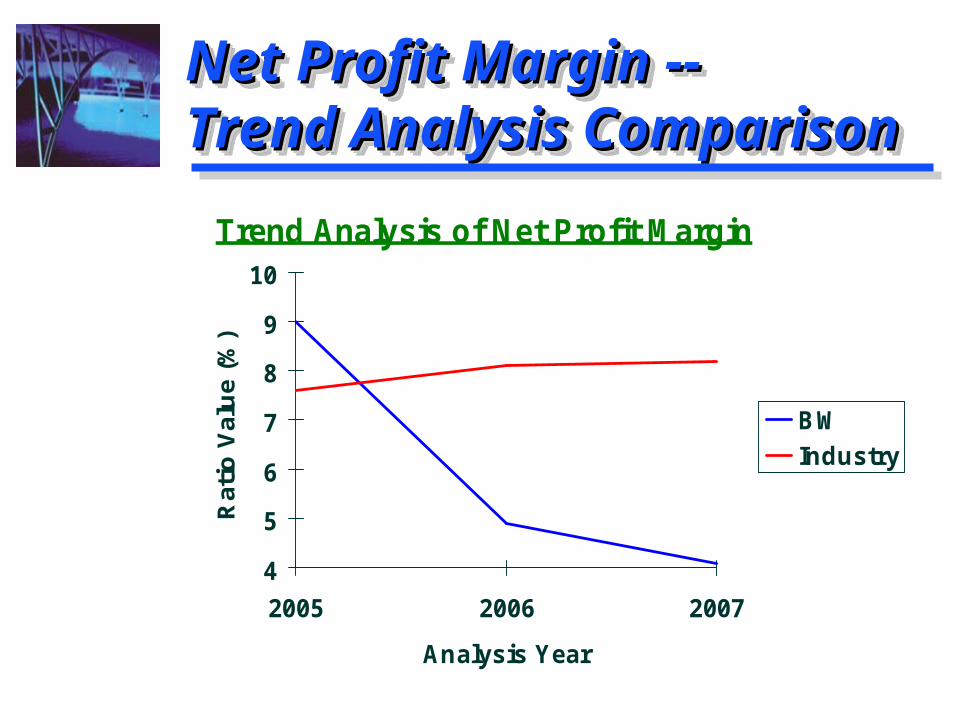
Net Profit Margin --Net Profit Margin --Trend Analysis ComparisonTrend Analysis ComparisonNet Profit Margin --Net Profit Margin --Trend Analysis ComparisonTrend Analysis Comparison
Trend Analysis of Net Profit Margin
4
5
6
7
8
9
10
2005 2006 2007
Analysis Year
Rat
io V
alu
e (%
)
BW
Industry
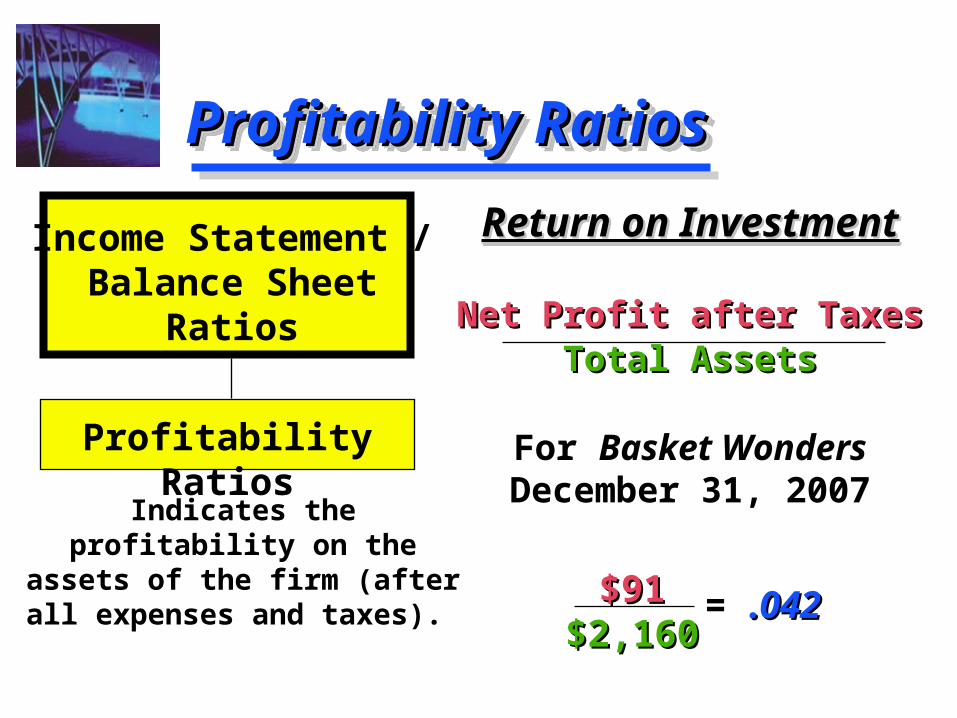
Profitability RatiosProfitability RatiosProfitability RatiosProfitability Ratios
Return on InvestmentReturn on Investment
Net Profit after TaxesNet Profit after TaxesTotal AssetsTotal Assets
For Basket Wonders December 31, 2007
Return on InvestmentReturn on Investment
Net Profit after TaxesNet Profit after TaxesTotal AssetsTotal Assets
For Basket Wonders December 31, 2007Indicates the
profitability on the assets of the firm (after all expenses and taxes).
Income Statement /Balance Sheet
Ratios
Profitability Ratios
$91$91$2,160$2,160
= .042.042
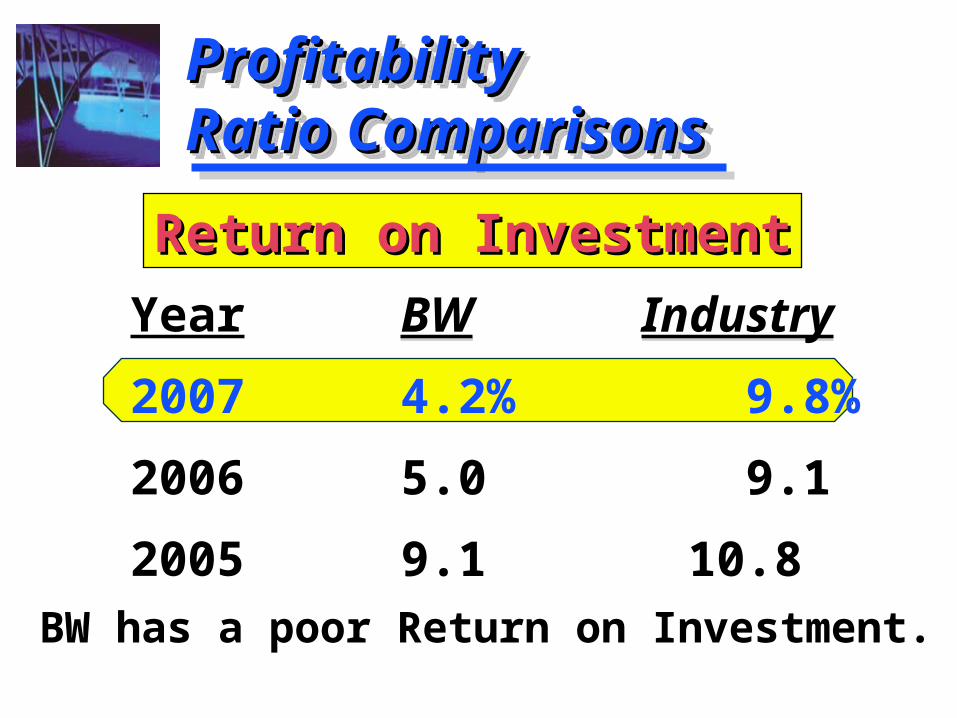
ProfitabilityProfitability Ratio ComparisonsRatio ComparisonsProfitabilityProfitability Ratio ComparisonsRatio Comparisons
BW Industry
4.2% 9.8%
5.0 9.1
9.1 10.8
BW Industry
4.2% 9.8%
5.0 9.1
9.1 10.8
Year
2007
2006
2005
Return on InvestmentReturn on Investment
BW has a poor Return on Investment.
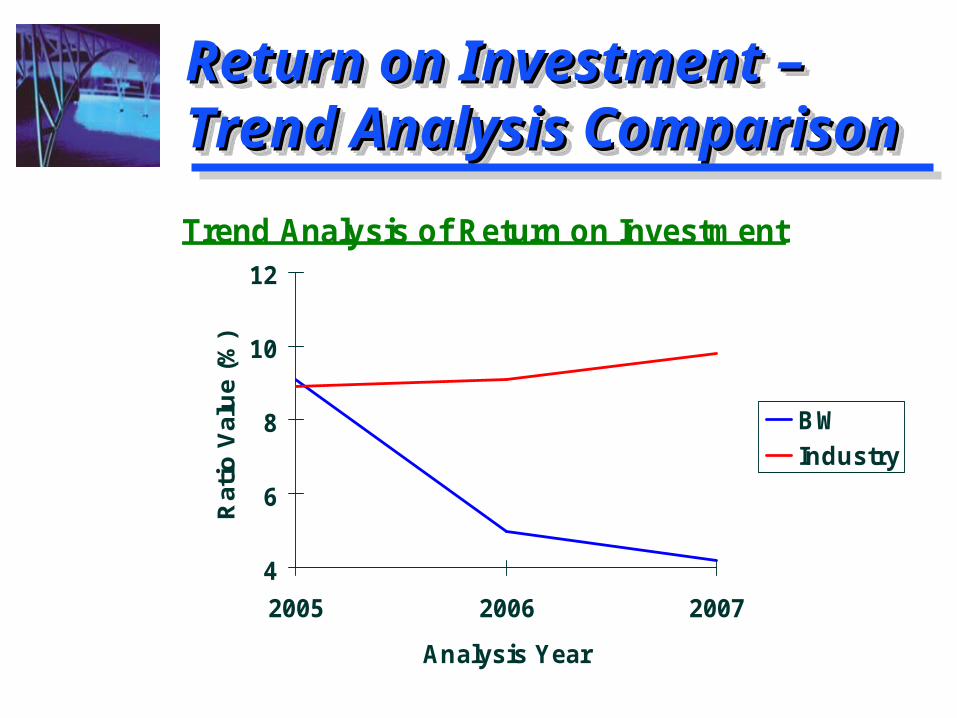
Return on Investment –Return on Investment –Trend Analysis ComparisonTrend Analysis ComparisonReturn on Investment –Return on Investment –Trend Analysis ComparisonTrend Analysis Comparison
Trend Analysis of Return on Investment
4
6
8
10
12
2005 2006 2007
Analysis Year
Rat
io V
alu
e (%
)
BW
Industry
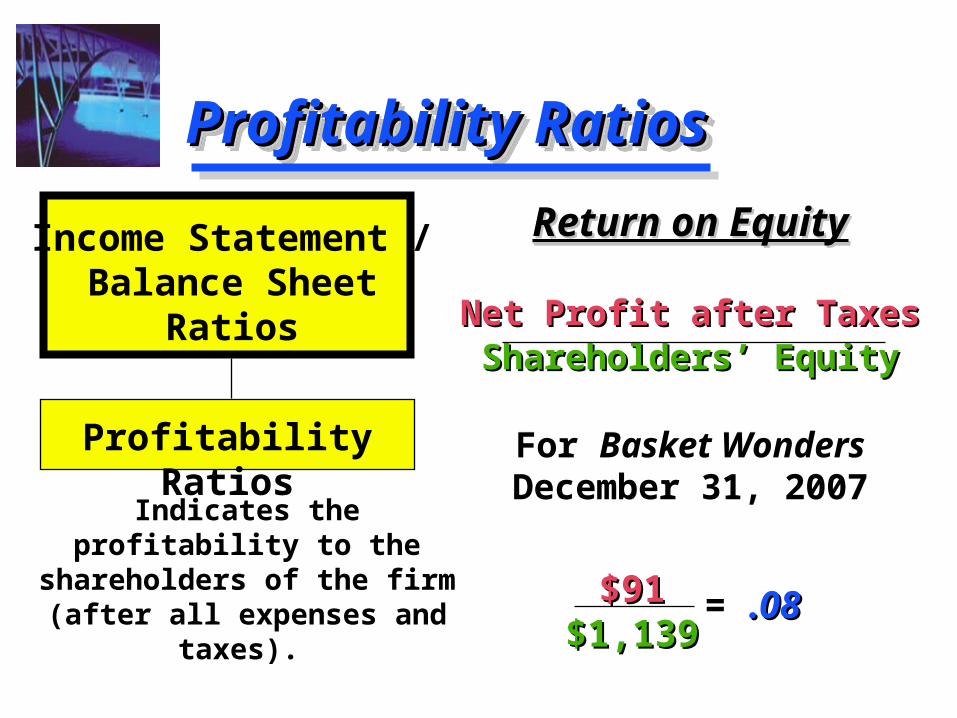
Profitability RatiosProfitability RatiosProfitability RatiosProfitability Ratios
Return on EquityReturn on Equity
Net Profit after TaxesNet Profit after TaxesShareholders’ EquityShareholders’ Equity
For Basket Wonders December 31, 2007
Return on EquityReturn on Equity
Net Profit after TaxesNet Profit after TaxesShareholders’ EquityShareholders’ Equity
For Basket Wonders December 31, 2007Indicates the profitability
to the shareholders of the firm (after all
expenses and taxes).
Income Statement /Balance Sheet
Ratios
Profitability Ratios
$91$91$1,139$1,139
= .08.08
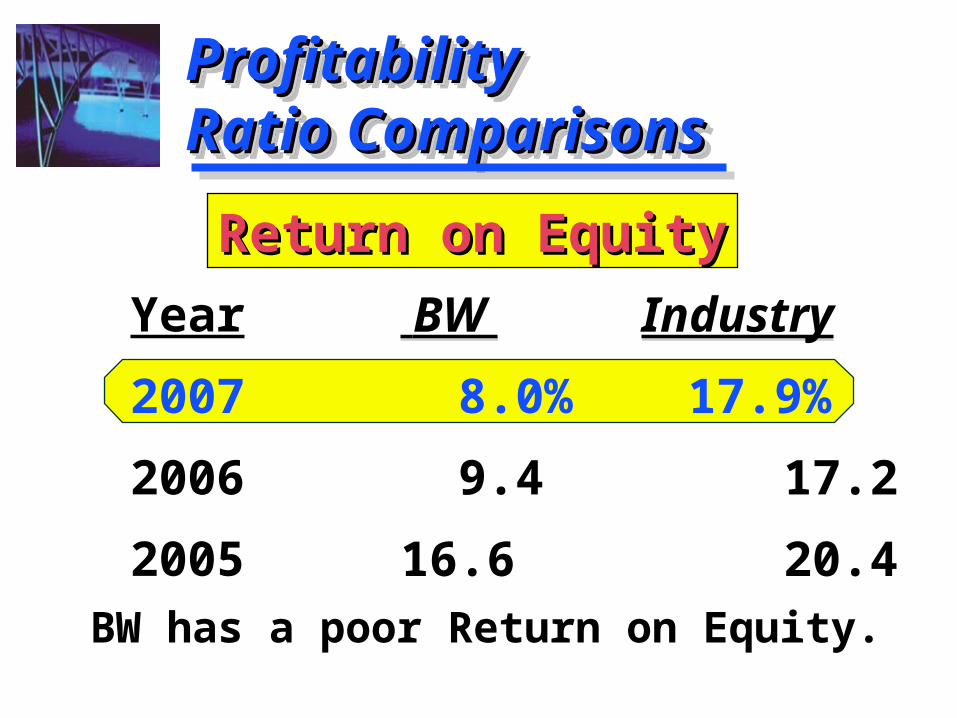
ProfitabilityProfitability Ratio ComparisonsRatio ComparisonsProfitabilityProfitability Ratio ComparisonsRatio Comparisons
BW Industry
8.0% 17.9%
9.4 17.2
16.6 20.4
BW Industry
8.0% 17.9%
9.4 17.2
16.6 20.4
Year
2007
2006
2005
Return on EquityReturn on Equity
BW has a poor Return on Equity.
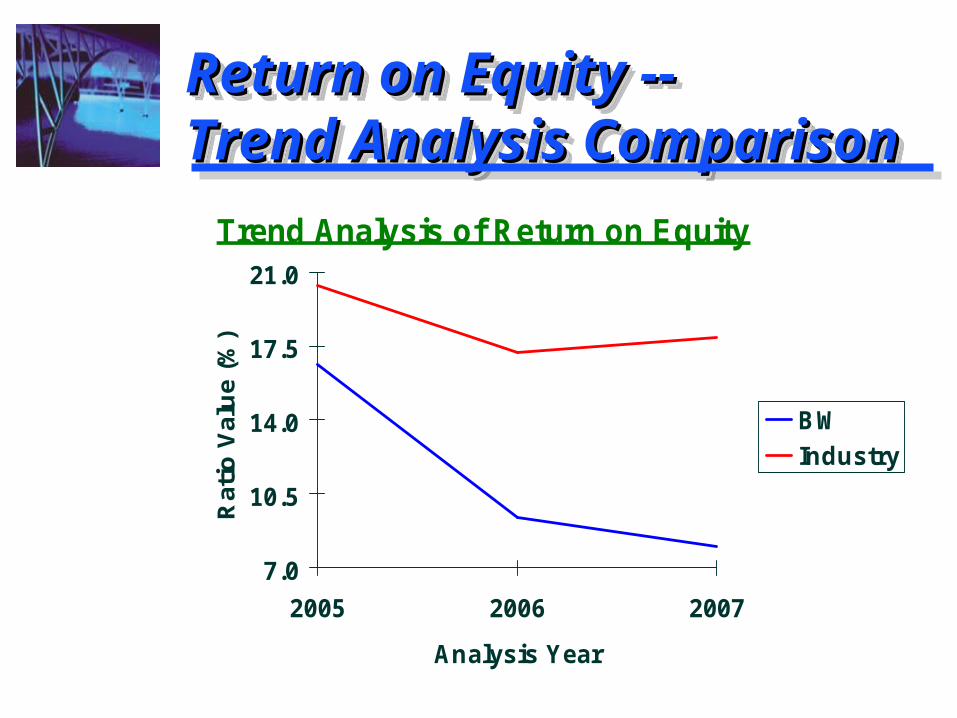
Return on Equity --Return on Equity --Trend Analysis ComparisonTrend Analysis ComparisonReturn on Equity --Return on Equity --Trend Analysis ComparisonTrend Analysis Comparison
Trend Analysis of Return on Equity
7.0
10.5
14.0
17.5
21.0
2005 2006 2007
Analysis Year
Rat
io V
alu
e (%
)
BW
Industry
Summary of the Profitability Summary of the Profitability Trend AnalysesTrend AnalysesSummary of the Profitability Summary of the Profitability Trend AnalysesTrend Analyses
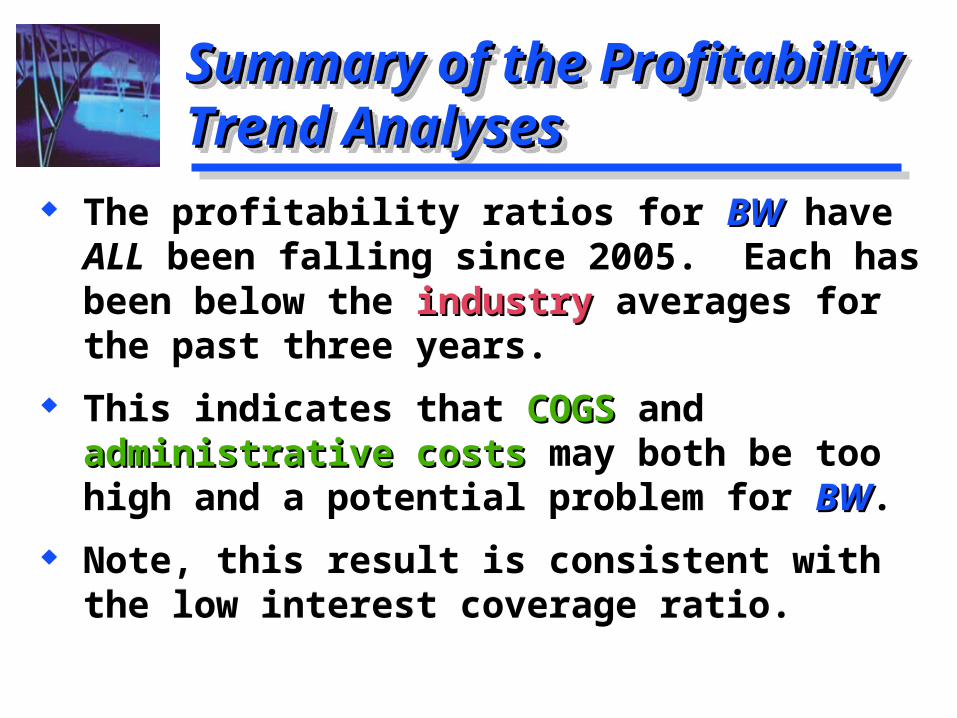
The profitability ratios for BWBW have ALL been falling since 2005. Each has been below the industryindustry averages for the past three years.
This indicates that COGSCOGS and administrative costsadministrative costs may both be too high and a potential problem for BWBW.
Note, this result is consistent with the low interest coverage ratio.
Summary of Ratio AnalysesSummary of Ratio AnalysesSummary of Ratio AnalysesSummary of Ratio Analyses
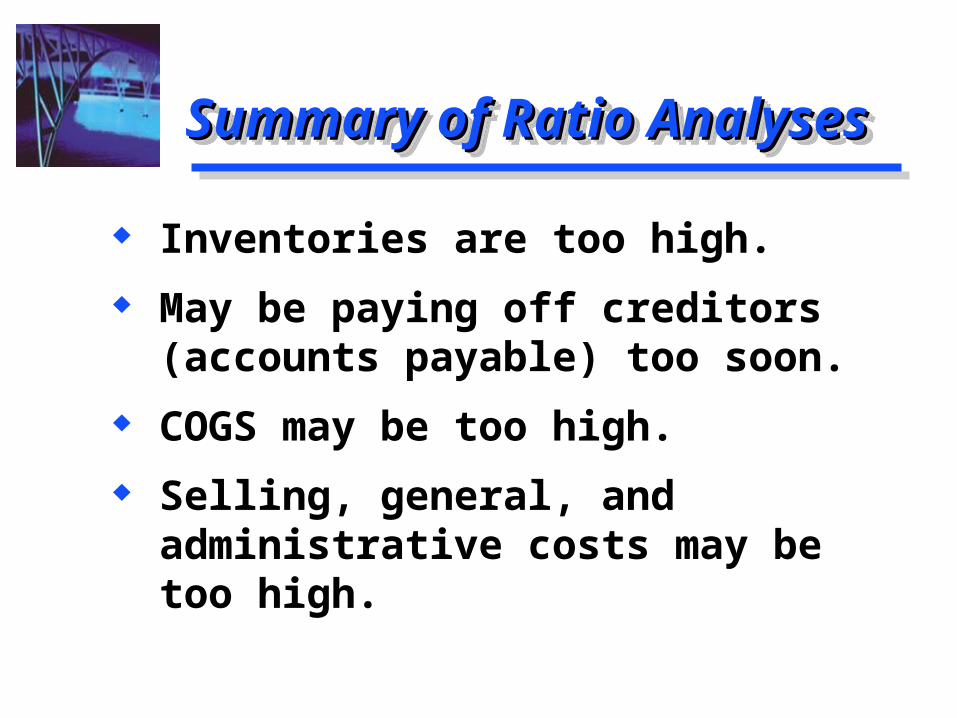
Inventories are too high.
May be paying off creditors (accounts payable) too soon.
COGS may be too high.
Selling, general, and administrative costs may be too high.
Inventories are too high.
May be paying off creditors (accounts payable) too soon.
COGS may be too high.
Selling, general, and administrative costs may be too high.
Common-size AnalysisCommon-size AnalysisCommon-size AnalysisCommon-size Analysis
An analysis of percentage financial statements where all
balance sheet items are divided by total assets and all income statement items are divided by
net sales or revenues.
An analysis of percentage financial statements where all
balance sheet items are divided by total assets and all income statement items are divided by
net sales or revenues.
Basket Wonders’ Common Basket Wonders’ Common Size Balance SheetsSize Balance SheetsBasket Wonders’ Common Basket Wonders’ Common Size Balance SheetsSize Balance Sheets
Regular (thousands of $) Common-Size (%)
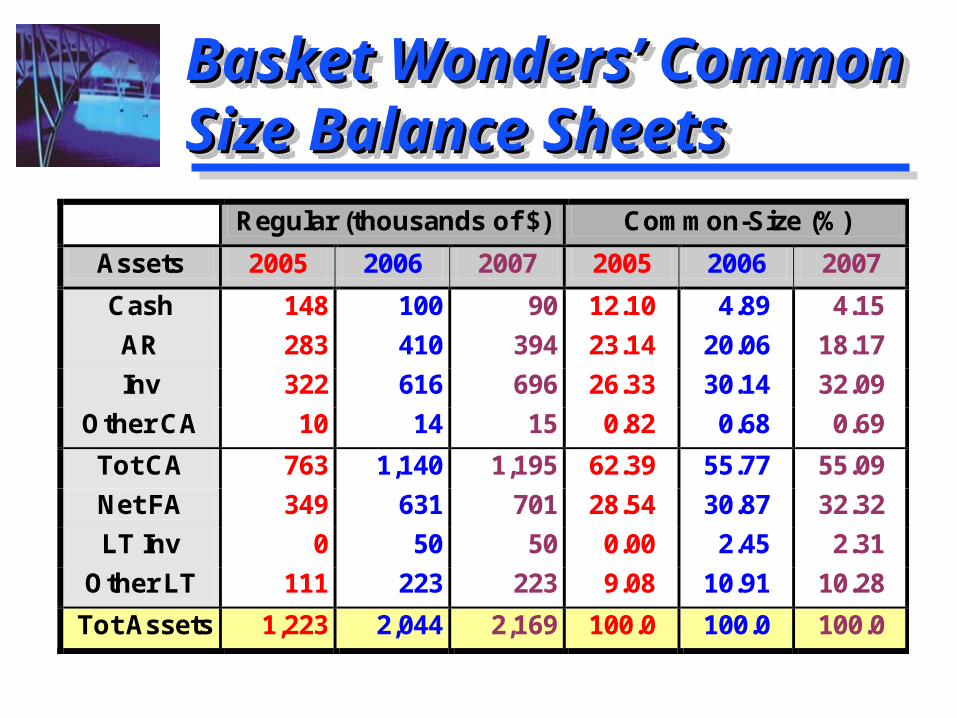
Assets 2005 2006 2007 2005 2006 2007
Cash 148 100 90 12.10 4.89 4.15
AR 283 410 394 23.14 20.06 18.17
Inv 322 616 696 26.33 30.14 32.09
Other CA 10 14 15 0.82 0.68 0.69
Tot CA 763 1,140 1,195 62.39 55.77 55.09
Net FA 349 631 701 28.54 30.87 32.32
LT Inv 0 50 50 0.00 2.45 2.31
Other LT 111 223 223 9.08 10.91 10.28
Tot Assets 1,223 2,044 2,169 100.0 100.0 100.0
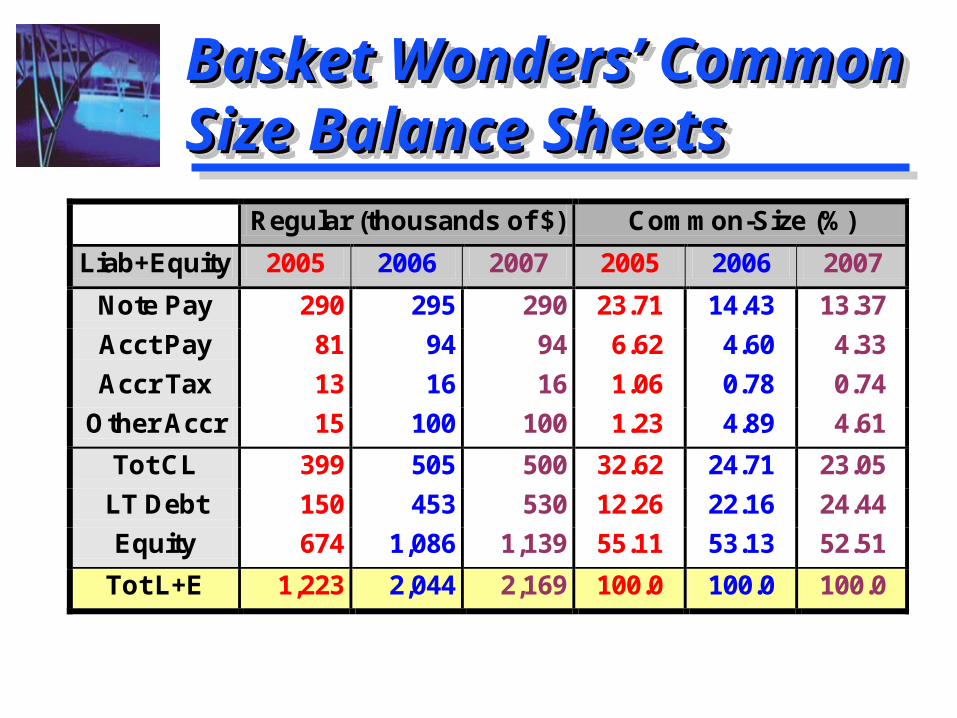
Basket Wonders’ Common Basket Wonders’ Common Size Balance SheetsSize Balance SheetsBasket Wonders’ Common Basket Wonders’ Common Size Balance SheetsSize Balance Sheets
Regular (thousands of $) Common-Size (%)
Liab+Equity 2005 2006 2007 2005 2006 2007
Note Pay 290 295 290 23.71 14.43 13.37
Acct Pay 81 94 94 6.62 4.60 4.33
Accr Tax 13 16 16 1.06 0.78 0.74
Other Accr 15 100 100 1.23 4.89 4.61
Tot CL 399 505 500 32.62 24.71 23.05
LT Debt 150 453 530 12.26 22.16 24.44
Equity 674 1,086 1,139 55.11 53.13 52.51
Tot L+E 1,223 2,044 2,169 100.0 100.0 100.0
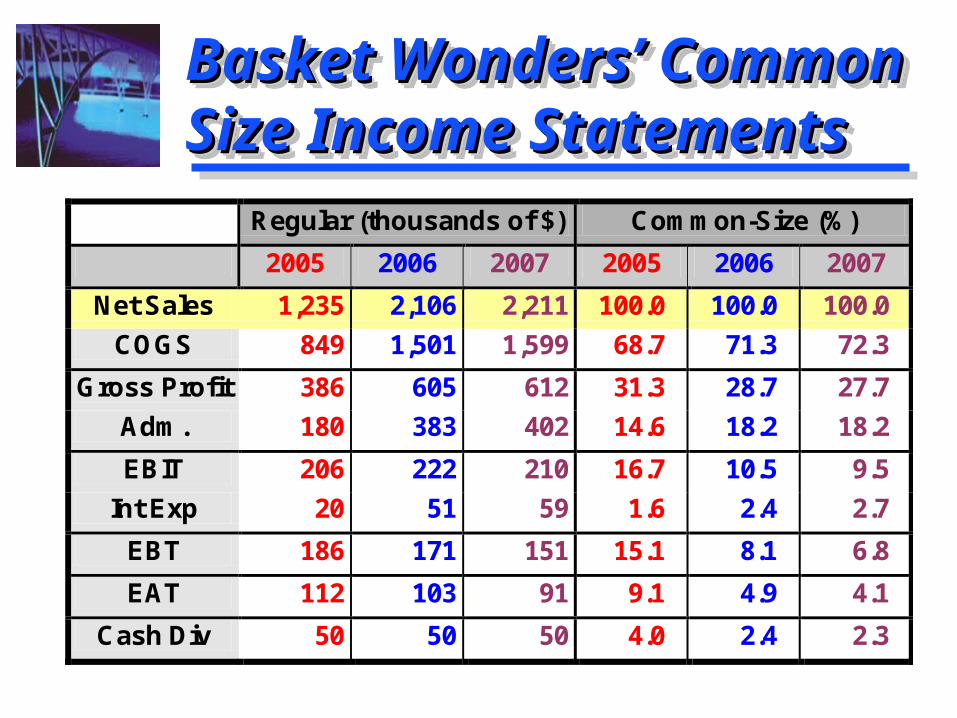
Basket Wonders’ Common Basket Wonders’ Common Size Income StatementsSize Income StatementsBasket Wonders’ Common Basket Wonders’ Common Size Income StatementsSize Income Statements
Regular (thousands of $) Common-Size (%)
2005 2006 2007 2005 2006 2007
Net Sales 1,235 2,106 2,211 100.0 100.0 100.0
COGS 849 1,501 1,599 68.7 71.3 72.3
Gross Profit 386 605 612 31.3 28.7 27.7
Adm. 180 383 402 14.6 18.2 18.2
EBIT 206 222 210 16.7 10.5 9.5
Int Exp 20 51 59 1.6 2.4 2.7
EBT 186 171 151 15.1 8.1 6.8
EAT 112 103 91 9.1 4.9 4.1
Cash Div 50 50 50 4.0 2.4 2.3
Index AnalysesIndex AnalysesIndex AnalysesIndex Analyses
An analysis of percentage financial statements where all balance sheet or income statement figures for a
base year equal 100.0 (percent) and subsequent financial statement
items are expressed as percentages of their values in the base year.
An analysis of percentage financial statements where all balance sheet or income statement figures for a
base year equal 100.0 (percent) and subsequent financial statement
items are expressed as percentages of their values in the base year.
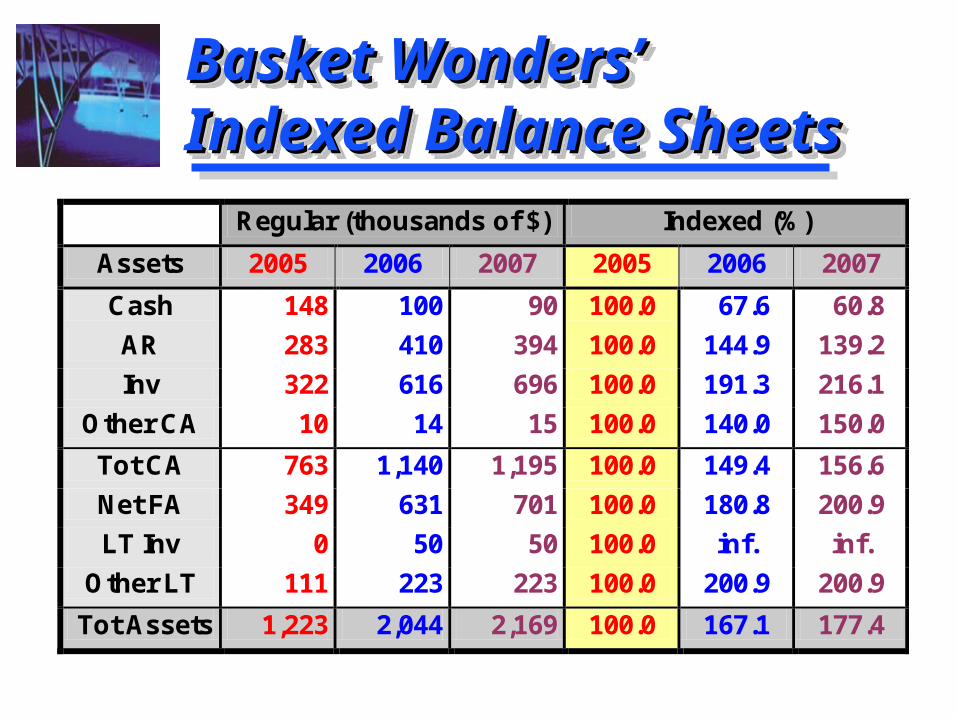
Basket Wonders’ Basket Wonders’ Indexed Balance SheetsIndexed Balance SheetsBasket Wonders’ Basket Wonders’ Indexed Balance SheetsIndexed Balance Sheets
Regular (thousands of $) Indexed (%)
Assets 2005 2006 2007 2005 2006 2007
Cash 148 100 90 100.0 67.6 60.8
AR 283 410 394 100.0 144.9 139.2
Inv 322 616 696 100.0 191.3 216.1
Other CA 10 14 15 100.0 140.0 150.0
Tot CA 763 1,140 1,195 100.0 149.4 156.6
Net FA 349 631 701 100.0 180.8 200.9
LT Inv 0 50 50 100.0 inf. inf.
Other LT 111 223 223 100.0 200.9 200.9
Tot Assets 1,223 2,044 2,169 100.0 167.1 177.4
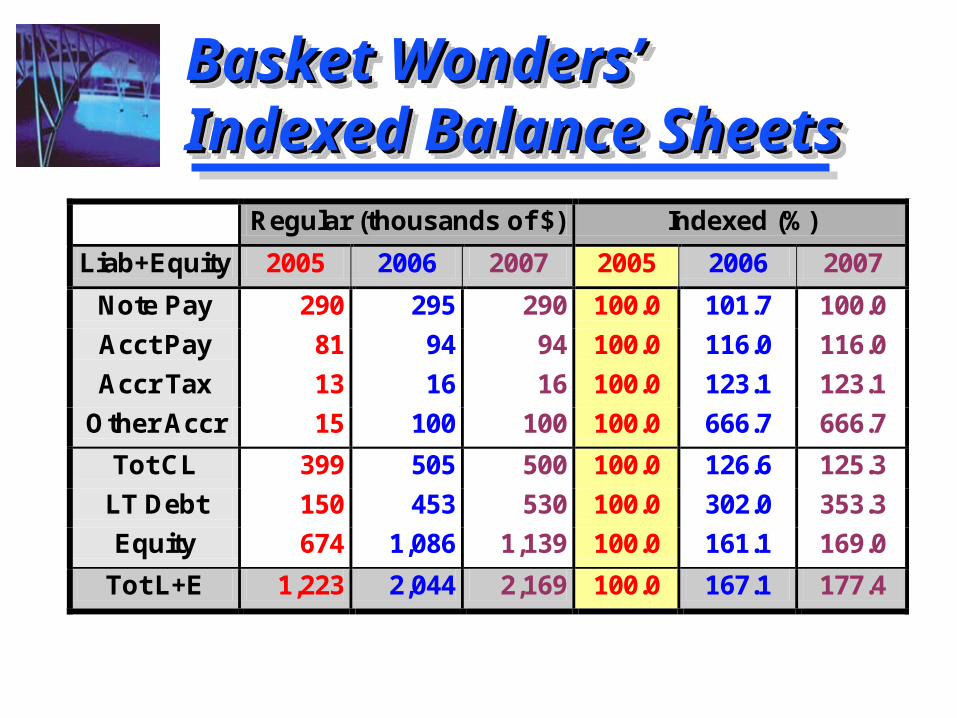
Basket Wonders’ Basket Wonders’ Indexed Balance SheetsIndexed Balance SheetsBasket Wonders’ Basket Wonders’ Indexed Balance SheetsIndexed Balance Sheets
Regular (thousands of $) Indexed (%)
Liab+Equity 2005 2006 2007 2005 2006 2007
Note Pay 290 295 290 100.0 101.7 100.0
Acct Pay 81 94 94 100.0 116.0 116.0
Accr Tax 13 16 16 100.0 123.1 123.1
Other Accr 15 100 100 100.0 666.7 666.7
Tot CL 399 505 500 100.0 126.6 125.3
LT Debt 150 453 530 100.0 302.0 353.3
Equity 674 1,086 1,139 100.0 161.1 169.0
Tot L+E 1,223 2,044 2,169 100.0 167.1 177.4
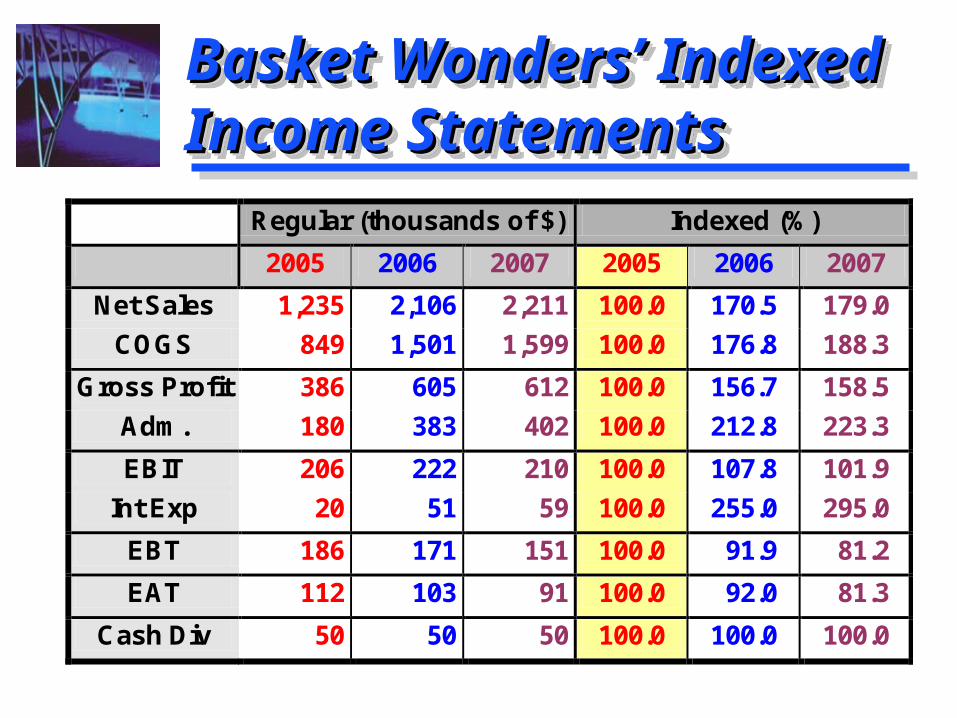
Basket Wonders’ Indexed Basket Wonders’ Indexed Income StatementsIncome StatementsBasket Wonders’ Indexed Basket Wonders’ Indexed Income StatementsIncome Statements
Regular (thousands of $) Indexed (%)
2005 2006 2007 2005 2006 2007
Net Sales 1,235 2,106 2,211 100.0 170.5 179.0
COGS 849 1,501 1,599 100.0 176.8 188.3
Gross Profit 386 605 612 100.0 156.7 158.5
Adm. 180 383 402 100.0 212.8 223.3
EBIT 206 222 210 100.0 107.8 101.9
Int Exp 20 51 59 100.0 255.0 295.0
EBT 186 171 151 100.0 91.9 81.2
EAT 112 103 91 100.0 92.0 81.3
Cash Div 50 50 50 100.0 100.0 100.0
Funds Analysis, Cash-Flow Funds Analysis, Cash-Flow Analysis, and Financial PlanningAnalysis, and Financial PlanningFunds Analysis, Cash-Flow Funds Analysis, Cash-Flow Analysis, and Financial PlanningAnalysis, and Financial Planning
Flow of Funds (Sources and Uses) Statement
Accounting Statement of Cash Flows
Cash-Flow Forecasting
Range of Cash-Flow Estimates
Forecasting Financial Statements
Flow of Funds (Sources and Uses) Statement
Accounting Statement of Cash Flows
Cash-Flow Forecasting
Range of Cash-Flow Estimates
Forecasting Financial Statements
Flow of Funds StatementFlow of Funds StatementFlow of Funds StatementFlow of Funds Statement
Has been replaced by the cash flow cash flow statementstatement (1989) in U.S. audited annual
reports.
Has been replaced by the cash flow cash flow statementstatement (1989) in U.S. audited annual
reports.
A summary of a firm’s changes in financial position from one period to
another; it is also called a sources and uses of funds statement or a statement
of changes in financial position.
A summary of a firm’s changes in financial position from one period to
another; it is also called a sources and uses of funds statement or a statement
of changes in financial position.
Why Examine the Flow Why Examine the Flow of Funds Statementof Funds StatementWhy Examine the Flow Why Examine the Flow of Funds Statementof Funds Statement
QUESTION?QUESTION?
Why should we bother to understand a Flow of Funds Statement that is no longer required to appear in U.S. audited annual reports?
QUESTION?QUESTION?
Why should we bother to understand a Flow of Funds Statement that is no longer required to appear in U.S. audited annual reports?
Why Examine the Flow Why Examine the Flow of Funds Statementof Funds StatementWhy Examine the Flow Why Examine the Flow of Funds Statementof Funds Statement
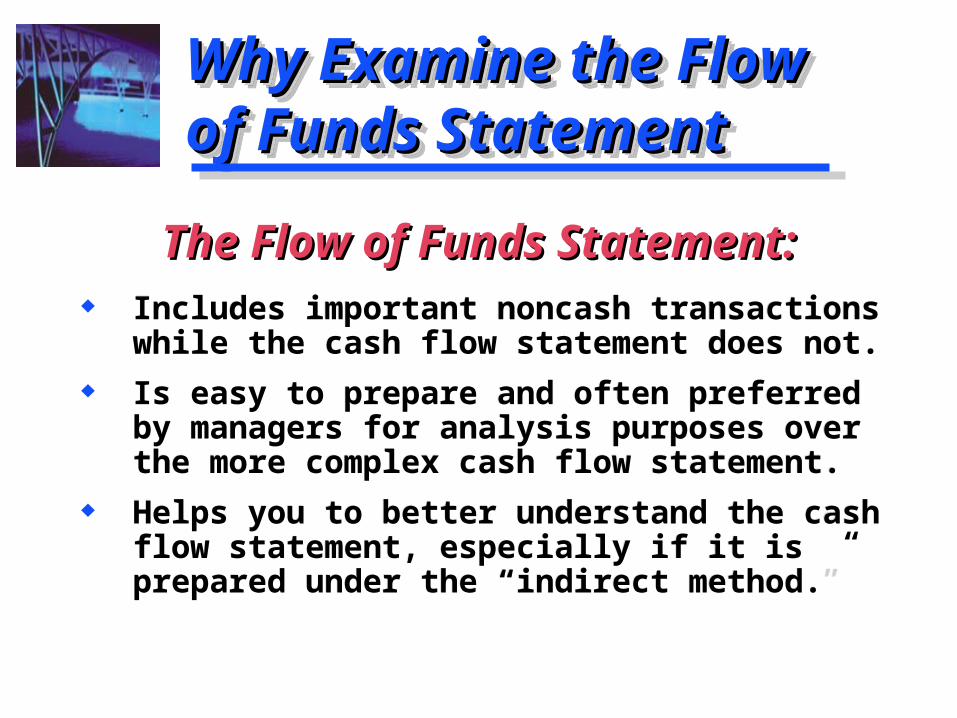
Includes important noncash transactions while the cash flow statement does not.
Is easy to prepare and often preferred by managers for analysis purposes over the more complex cash flow statement.
Helps you to better understand the cash flow statement, especially if it is prepared under the “indirect method.”
The Flow of Funds Statement:The Flow of Funds Statement:
Flow of Funds StatementFlow of Funds StatementFlow of Funds StatementFlow of Funds Statement
All of the firm’s investments and claims against those investments.
Extends beyond just beyond just transactions involving cashcash.
All of the firm’s investments and claims against those investments.
Extends beyond just beyond just transactions involving cashcash.
What are “fundsfunds”?
Sources and Sources and Uses StatementUses StatementSources and Sources and Uses StatementUses Statement
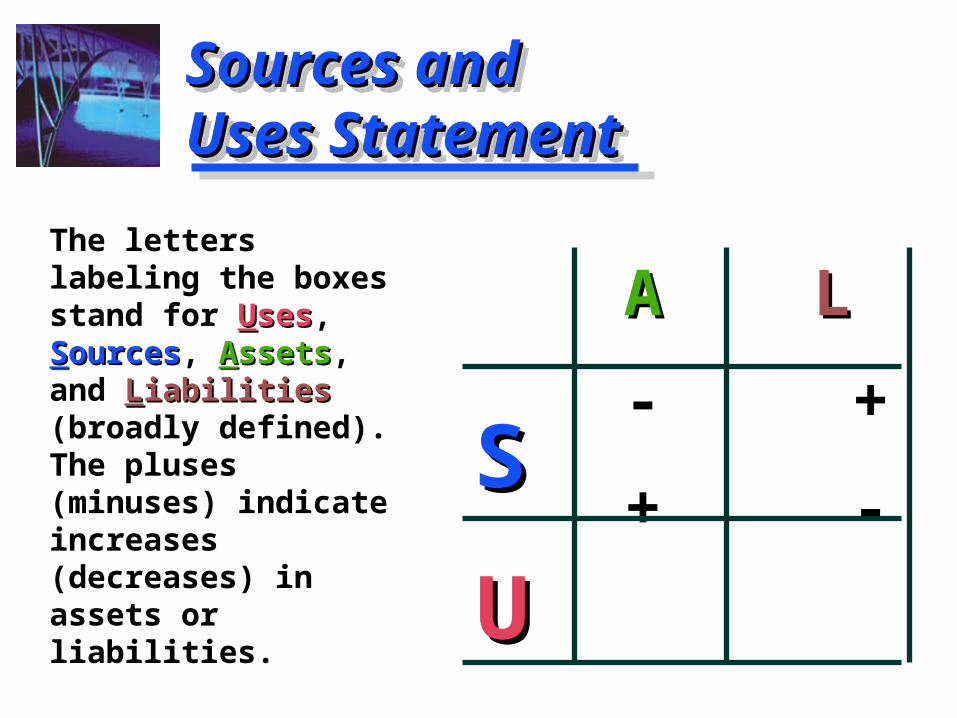
The letters labeling the boxes stand for UUsesses, SSourcesources, AAssetsssets, and LLiabilitiesiabilities (broadly defined). The pluses (minuses) indicate increases (decreases) in assets or liabilities.
The letters labeling the boxes stand for UUsesses, SSourcesources, AAssetsssets, and LLiabilitiesiabilities (broadly defined). The pluses (minuses) indicate increases (decreases) in assets or liabilities.
AA LL
- +
+ -
SS
UU

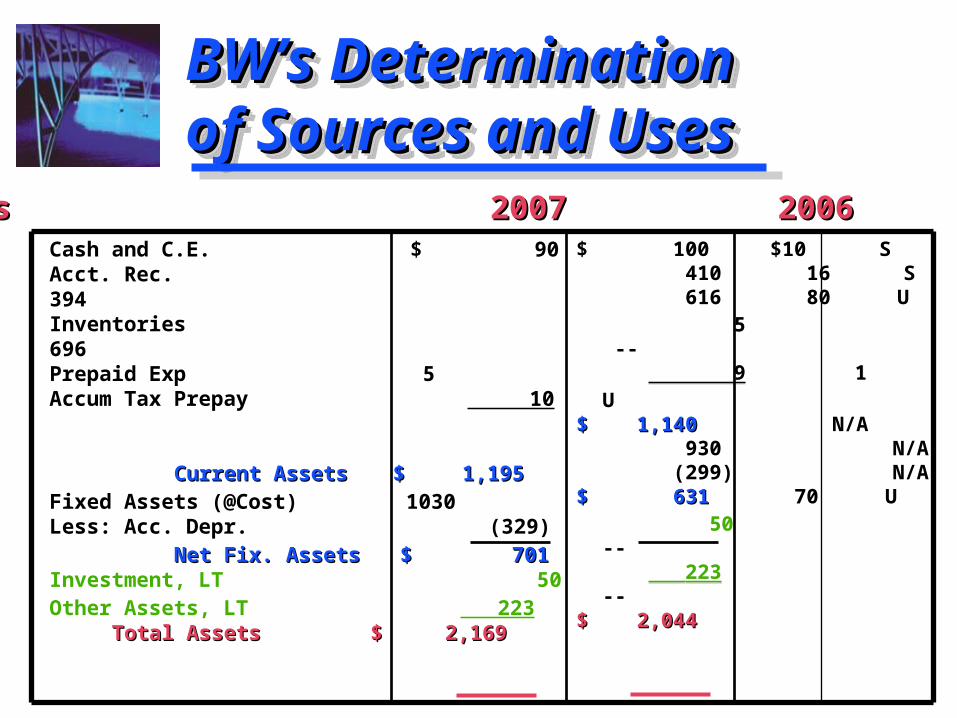
BW’s Determination BW’s Determination of Sources and Usesof Sources and UsesBW’s Determination BW’s Determination of Sources and Usesof Sources and Uses
$ 100 - S 410 - S 616 + U 5 -- 9 + U$ 1,140$ 1,140 N/A 930 N/A (299) N/A$ 631$ 631 + U 50 -- 223 --$ 2,044$ 2,044
$ 100 - S 410 - S 616 + U 5 -- 9 + U$ 1,140$ 1,140 N/A 930 N/A (299) N/A$ 631$ 631 + U 50 -- 223 --$ 2,044$ 2,044
Cash and C.E. $ 90 Acct. Rec. 394 Inventories 696 Prepaid Exp 5 Accum Tax Prepay 10 Current AssetsCurrent Assets $ $ 1,195 1,195 Fixed Assets (@Cost) 1030 Less: Acc. Depr. (329) Net Fix. AssetsNet Fix. Assets $ 701 $ 701 Investment, LT 50 Other Assets, LT 223
Total AssetsTotal Assets $ 2,169$ 2,169
Assets 2007 2006 +/- S/UAssets 2007 2006 +/- S/U
BW’s Determination BW’s Determination of Sources and Usesof Sources and UsesBW’s Determination BW’s Determination of Sources and Usesof Sources and Uses
$ 100 $10 S 410 16 S 616 80 U 5 -- 9 1 U
$ 1,140$ 1,140 N/A 930 N/A (299) N/A$ 631$ 631 70 U 50 -- 223 --$ 2,044$ 2,044
$ 100 $10 S 410 16 S 616 80 U 5 -- 9 1 U
$ 1,140$ 1,140 N/A 930 N/A (299) N/A$ 631$ 631 70 U 50 -- 223 --$ 2,044$ 2,044
Cash and C.E. $ 90 Acct. Rec. 394 Inventories 696 Prepaid Exp 5 Accum Tax Prepay 10 Current AssetsCurrent Assets $ $ 1,195 1,195 Fixed Assets (@Cost) 1030 Less: Acc. Depr. (329) Net Fix. AssetsNet Fix. Assets $ 701 $ 701 Investment, LT 50 Other Assets, LT 223
Total AssetsTotal Assets $ 2,169$ 2,169
Assets 2007 2006 +/- S/UAssets 2007 2006 +/- S/U
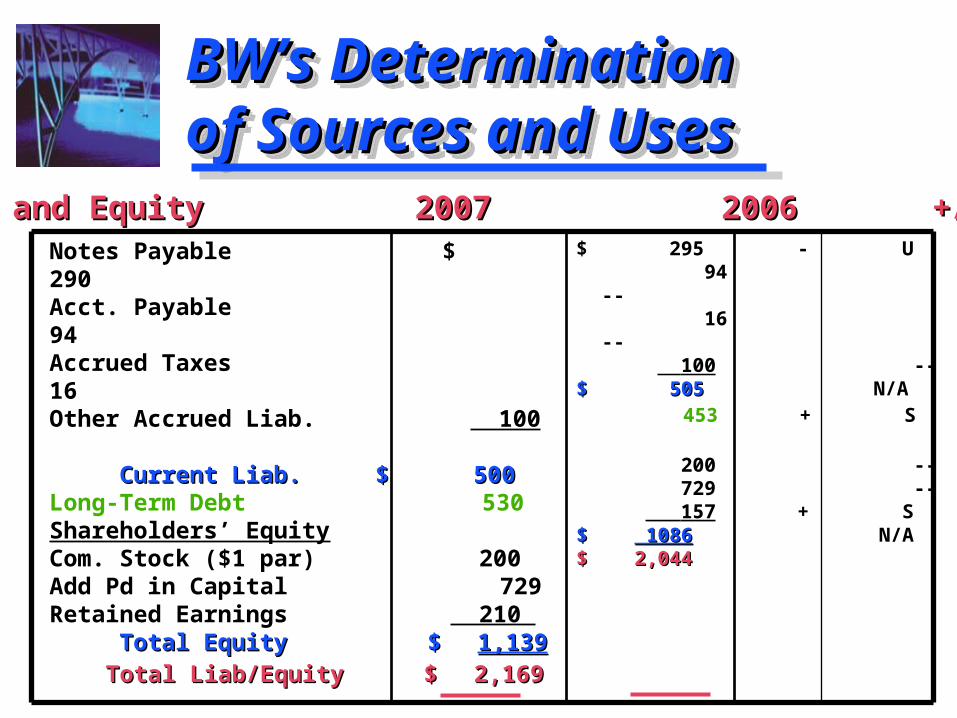
BW’s Determination BW’s Determination of Sources and Usesof Sources and UsesBW’s Determination BW’s Determination of Sources and Usesof Sources and Uses
$ 295 - U 94 -- 16 -- 100 --$$ 505505 N/A
453 + S 200 -- 729 -- 157 + S$ $ 1086 1086 N/A$ 2,044$ 2,044
$ 295 - U 94 -- 16 -- 100 --$$ 505505 N/A
453 + S 200 -- 729 -- 157 + S$ $ 1086 1086 N/A$ 2,044$ 2,044
Notes Payable $ 290 Acct. Payable 94 Accrued Taxes 16 Other Accrued Liab. 100
Current Liab.Current Liab. $ 500 $ 500 Long-Term Debt 530 Shareholders’ Equity Com. Stock ($1 par) 200 Add Pd in Capital 729 Retained Earnings 210
Total EquityTotal Equity $ $ 1,1391,139 Total Liab/EquityTotal Liab/Equity $ $ 2,1692,169
Liabilities and Equity 2007 2006 +/- S/ULiabilities and Equity 2007 2006 +/- S/U

BW’s Determination BW’s Determination of Sources and Usesof Sources and UsesBW’s Determination BW’s Determination of Sources and Usesof Sources and Uses
$ 295 $ 5 U 94 -- 16 -- 100 --$$ 505505 N/A
453 77 S 200 -- 729 -- 157 53 S$ $ 1086 1086 N/A$ 2,044$ 2,044
$ 295 $ 5 U 94 -- 16 -- 100 --$$ 505505 N/A
453 77 S 200 -- 729 -- 157 53 S$ $ 1086 1086 N/A$ 2,044$ 2,044
Notes Payable $ 290 Acct. Payable 94 Accrued Taxes 16 Other Accrued Liab. 100
Current Liab.Current Liab. $ 500 $ 500 Long-Term Debt 530 Shareholders’ Equity Com. Stock ($1 par) 200 Add Pd in Capital 729 Retained Earnings 210
Total EquityTotal Equity $ $ 1,1391,139 Total Liab/EquityTotal Liab/Equity $ $ 2,1692,169
Liabilities and Equity 2007 2006 +/- S/ULiabilities and Equity 2007 2006 +/- S/U

Risk and Risk and ReturnReturn
Risk and Risk and ReturnReturn
© Pearson Education Limited 2004Fundamentals of Financial Management, 12/e
Created by: Gregory A. Kuhlemeyer, Ph.D.Carroll College, Waukesha, WI
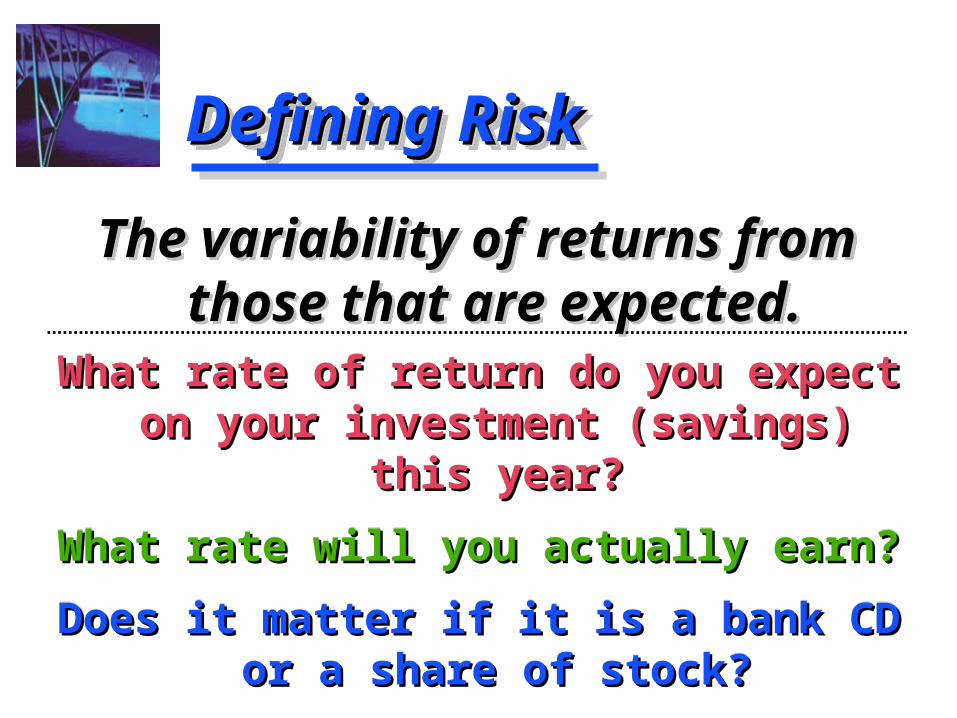
Defining RiskDefining RiskDefining RiskDefining Risk
What rate of return do you expect on your What rate of return do you expect on your investment (savings) this year?investment (savings) this year?
What rate will you actually earn?What rate will you actually earn?
Does it matter if it is a bank CD or a share Does it matter if it is a bank CD or a share of stock?of stock?
The variability of returns from The variability of returns from those that are expected.those that are expected.
The variability of returns from The variability of returns from those that are expected.those that are expected.
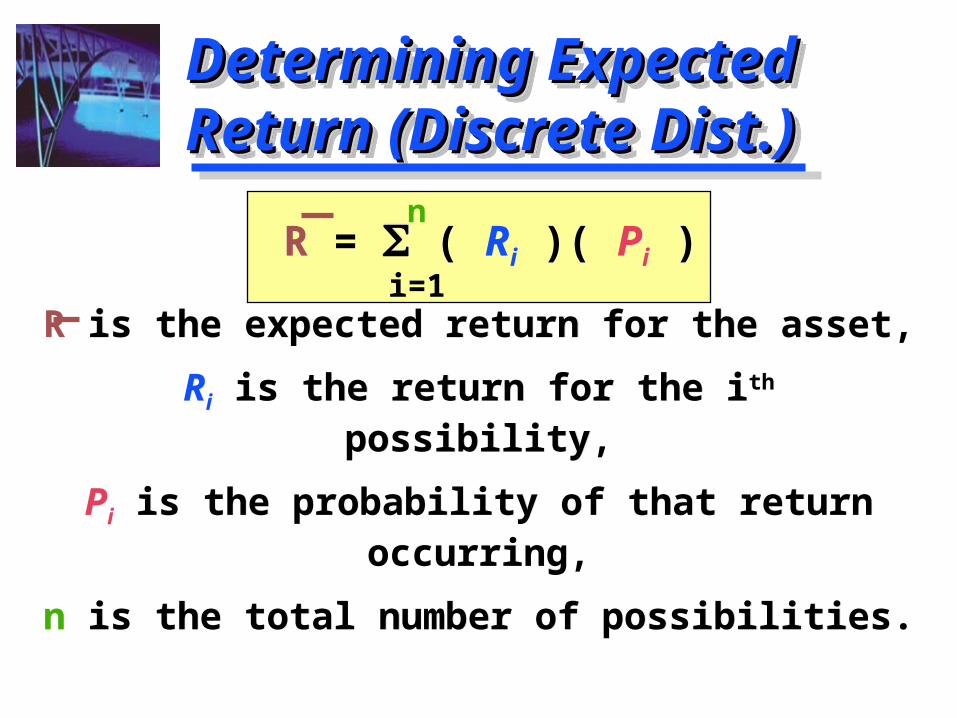
Determining Expected Determining Expected Return (Discrete Dist.)Return (Discrete Dist.)Determining Expected Determining Expected Return (Discrete Dist.)Return (Discrete Dist.)
R = ( Ri )( Pi )
R is the expected return for the asset,
Ri is the return for the ith possibility,
Pi is the probability of that return occurring,
n is the total number of possibilities.
R = ( Ri )( Pi )
R is the expected return for the asset,
Ri is the return for the ith possibility,
Pi is the probability of that return occurring,
n is the total number of possibilities.
n
i=1
How to Determine the Expected How to Determine the Expected Return and Standard DeviationReturn and Standard DeviationHow to Determine the Expected How to Determine the Expected Return and Standard DeviationReturn and Standard Deviation
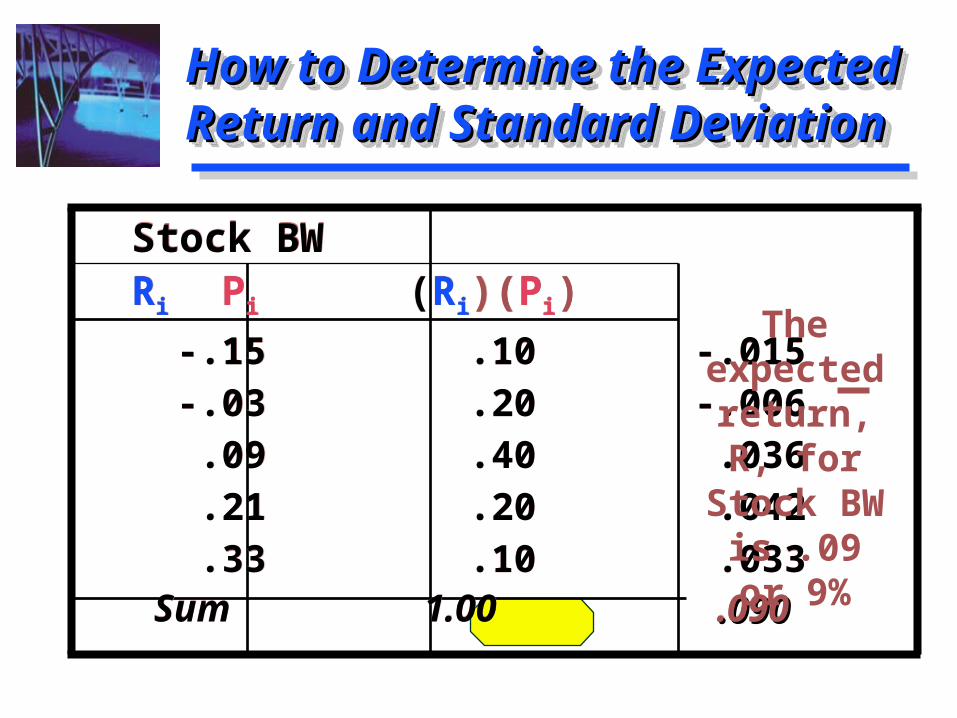
Stock BW Ri Pi (Ri)(Pi)
-.15 .10 -.015 -.03 .20 -.006 .09 .40 .036 .21 .20 .042 .33 .10 .033 Sum 1.00 .090.090
Stock BW Ri Pi (Ri)(Pi)
-.15 .10 -.015 -.03 .20 -.006 .09 .40 .036 .21 .20 .042 .33 .10 .033 Sum 1.00 .090.090
The expected return, R, for Stock BW is .09
or 9%
Determining Standard Determining Standard Deviation (Risk Measure)Deviation (Risk Measure)Determining Standard Determining Standard Deviation (Risk Measure)Deviation (Risk Measure)
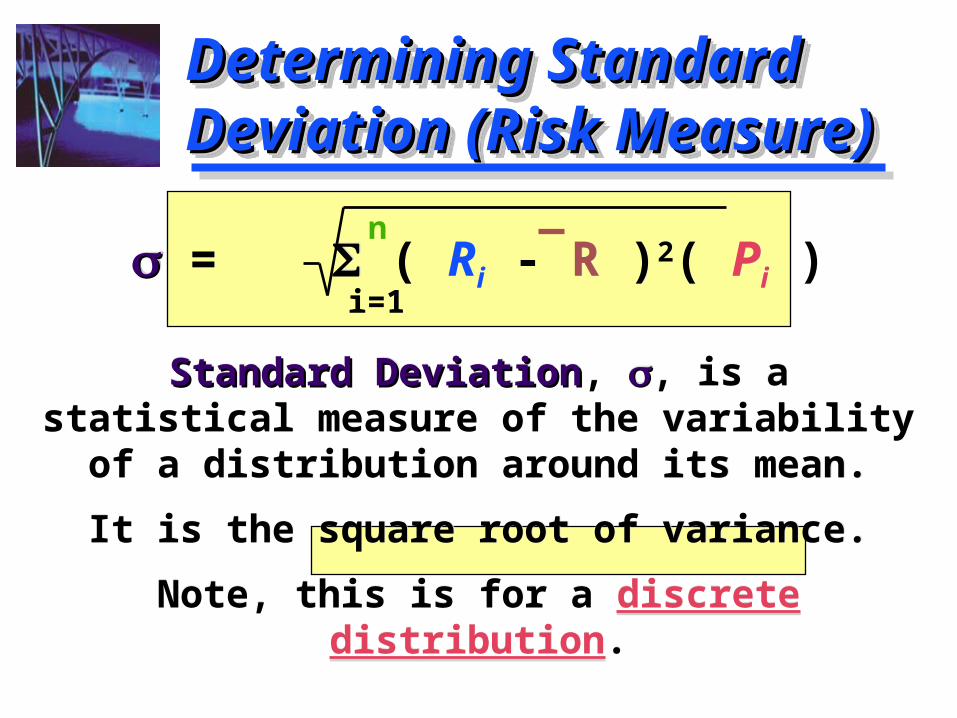
= ( Ri - R )2( Pi )
Standard DeviationStandard Deviation, , is a statistical measure of the variability of a distribution
around its mean.
It is the square root of variance.
Note, this is for a discrete distribution.
= ( Ri - R )2( Pi )
Standard DeviationStandard Deviation, , is a statistical measure of the variability of a distribution
around its mean.
It is the square root of variance.
Note, this is for a discrete distribution.
n
i=1
How to Determine the Expected How to Determine the Expected Return and Standard DeviationReturn and Standard DeviationHow to Determine the Expected How to Determine the Expected Return and Standard DeviationReturn and Standard Deviation
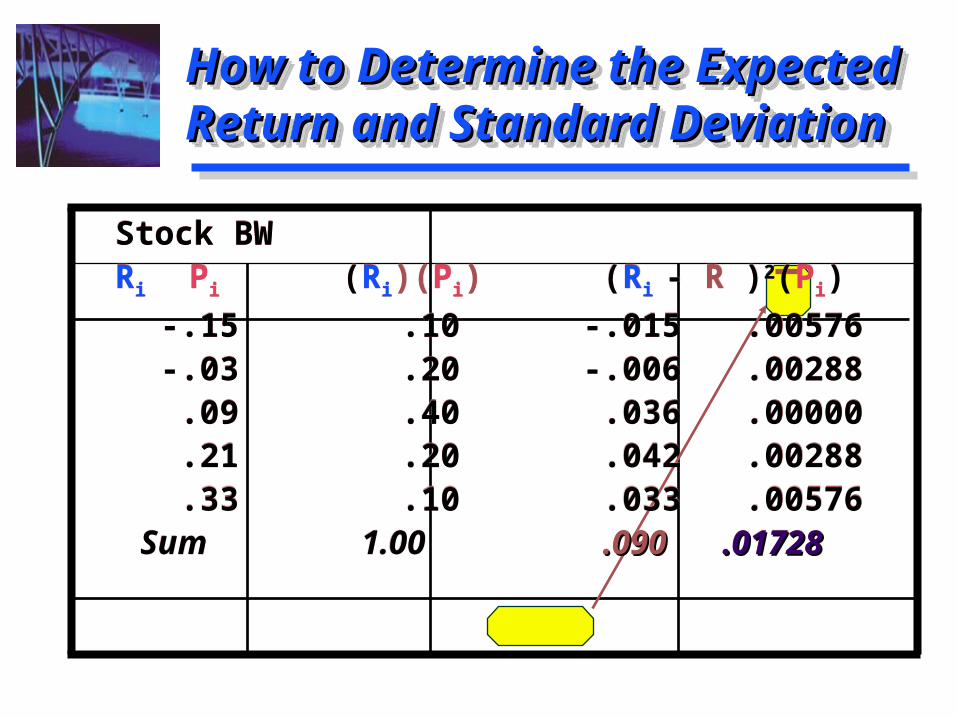
Stock BW Ri Pi (Ri)(Pi) (Ri - R )2(Pi)
-.15 .10 -.015 .00576 -.03 .20 -.006 .00288 .09 .40 .036 .00000 .21 .20 .042 .00288 .33 .10 .033 .00576 Sum 1.00 .090.090 .01728.01728
Stock BW Ri Pi (Ri)(Pi) (Ri - R )2(Pi)
-.15 .10 -.015 .00576 -.03 .20 -.006 .00288 .09 .40 .036 .00000 .21 .20 .042 .00288 .33 .10 .033 .00576 Sum 1.00 .090.090 .01728.01728
Determining Standard Determining Standard Deviation (Risk Measure)Deviation (Risk Measure)Determining Standard Determining Standard Deviation (Risk Measure)Deviation (Risk Measure)
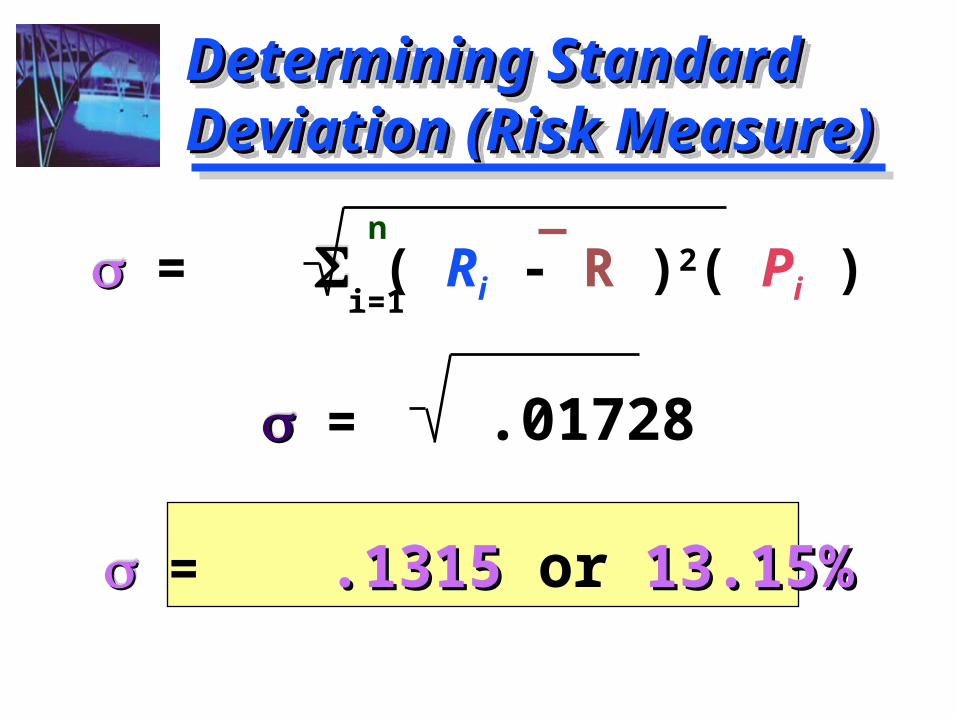
= ( Ri - R )2( Pi )
= .01728
= .1315.1315 or 13.15%13.15%
= ( Ri - R )2( Pi )
= .01728
= .1315.1315 or 13.15%13.15%
n
i=1
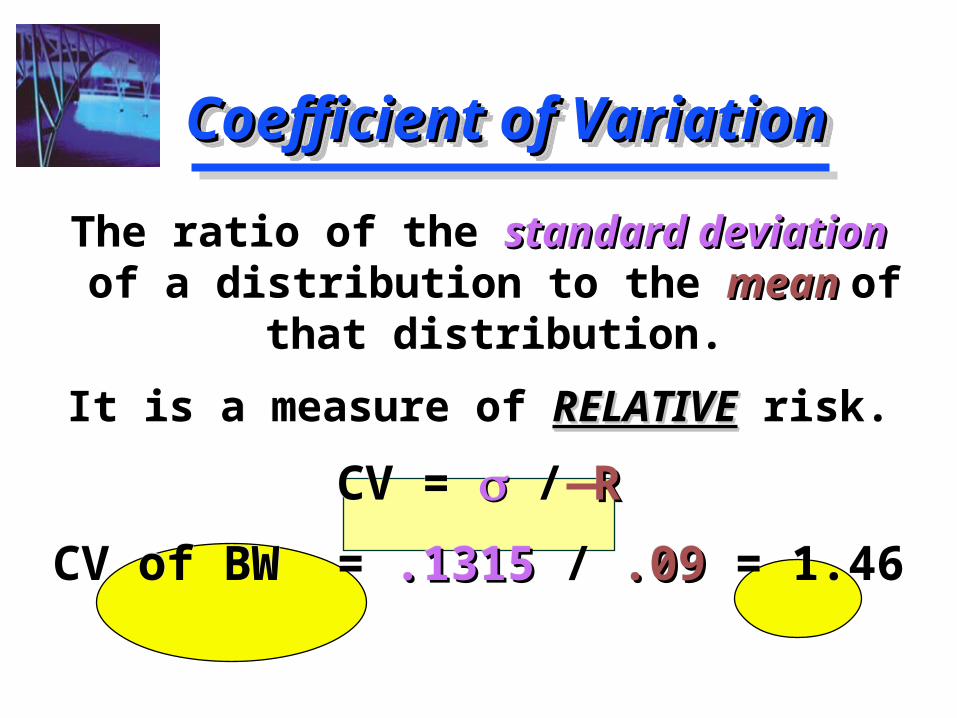
Coefficient of VariationCoefficient of VariationCoefficient of VariationCoefficient of Variation
The ratio of the standard deviation standard deviation of a distribution to the mean mean of that
distribution.
It is a measure of RELATIVERELATIVE risk.
CV = / RR
CV of BW = .1315.1315 / .09.09 = 1.46
The ratio of the standard deviation standard deviation of a distribution to the mean mean of that
distribution.
It is a measure of RELATIVERELATIVE risk.
CV = / RR
CV of BW = .1315.1315 / .09.09 = 1.46
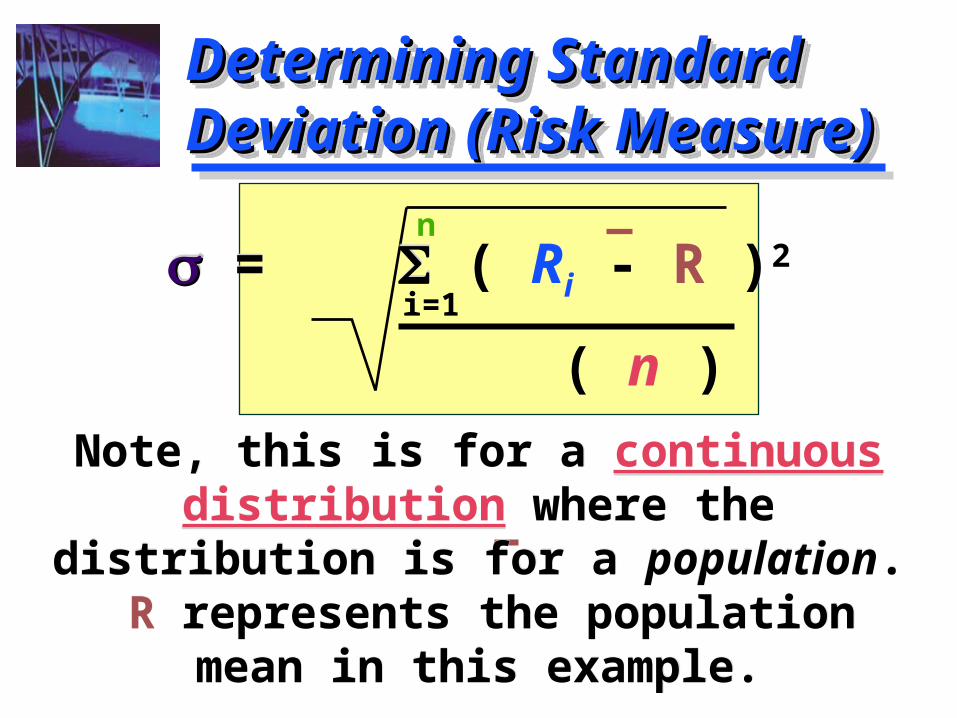
Determining Standard Determining Standard Deviation (Risk Measure)Deviation (Risk Measure)Determining Standard Determining Standard Deviation (Risk Measure)Deviation (Risk Measure)
n
i=1 = ( Ri - R )2
( n )
Note, this is for a continuous distribution where the distribution is for a population. R represents the population mean in this example.
= ( Ri - R )2
( n )
Note, this is for a continuous distribution where the distribution is for a population. R represents the population mean in this example.
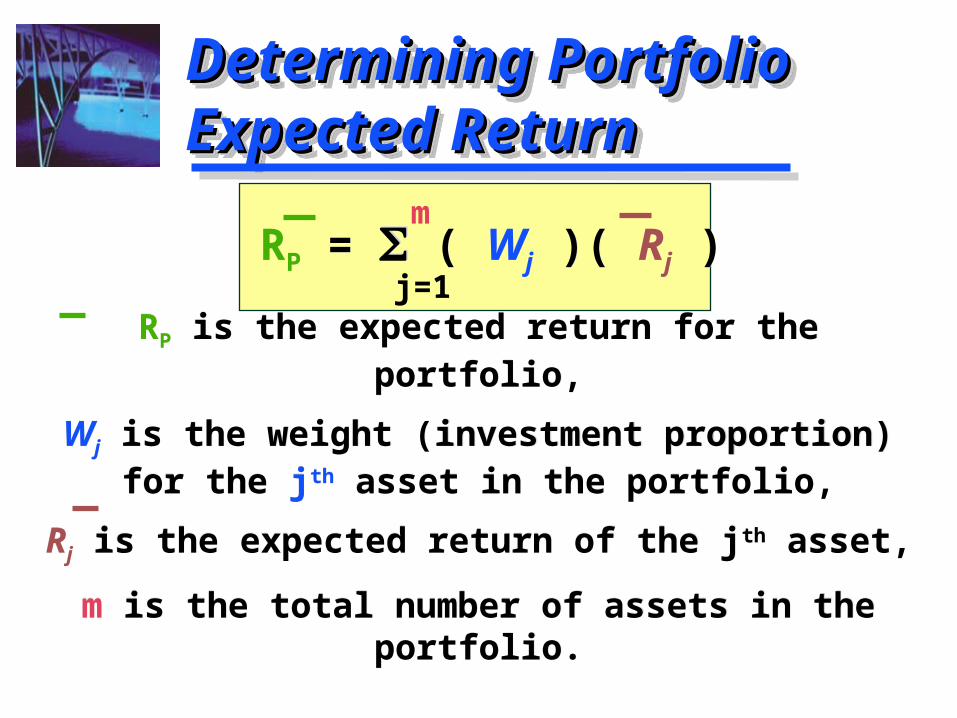
RP = ( Wj )( Rj )
RP is the expected return for the portfolio,
Wj is the weight (investment proportion) for the jth asset in the portfolio,
Rj is the expected return of the jth asset,
m is the total number of assets in the portfolio.
RP = ( Wj )( Rj )
RP is the expected return for the portfolio,
Wj is the weight (investment proportion) for the jth asset in the portfolio,
Rj is the expected return of the jth asset,
m is the total number of assets in the portfolio.
Determining PortfolioDetermining PortfolioExpected ReturnExpected ReturnDetermining PortfolioDetermining PortfolioExpected ReturnExpected Return
m
j=1
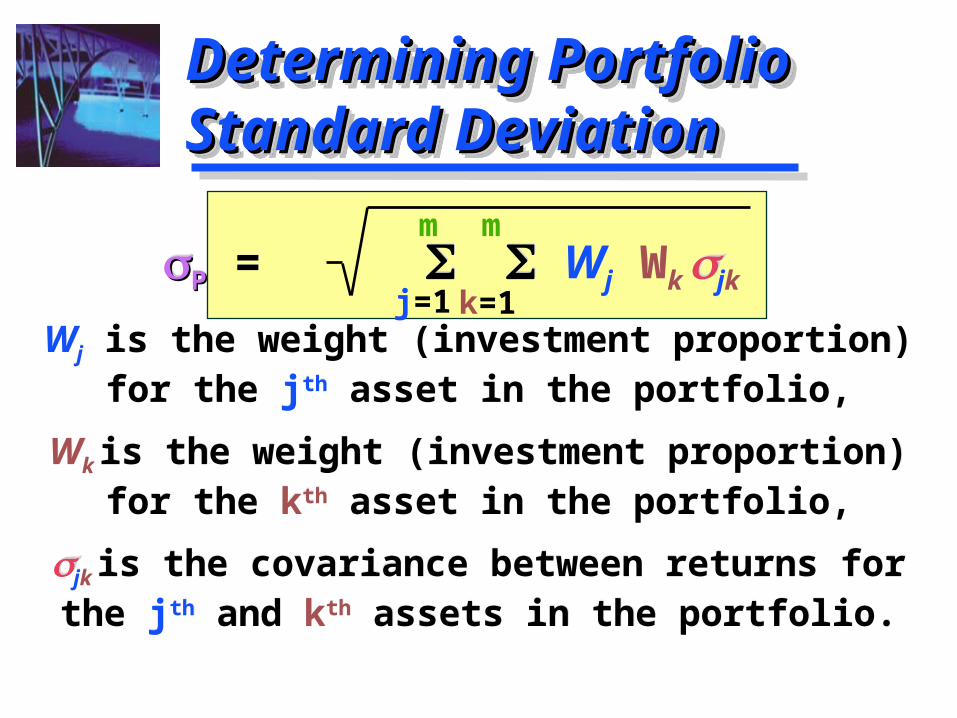
Determining Portfolio Determining Portfolio Standard DeviationStandard DeviationDetermining Portfolio Determining Portfolio Standard DeviationStandard Deviation
m
j=1
m
k=1PP = Wj Wk jk
Wj is the weight (investment proportion) for the jth asset in the portfolio,
Wk is the weight (investment proportion) for the kth asset in the portfolio,
jk is the covariance between returns for the jth and kth assets in the portfolio.
PP = Wj Wk jk
Wj is the weight (investment proportion) for the jth asset in the portfolio,
Wk is the weight (investment proportion) for the kth asset in the portfolio,
jk is the covariance between returns for the jth and kth assets in the portfolio.
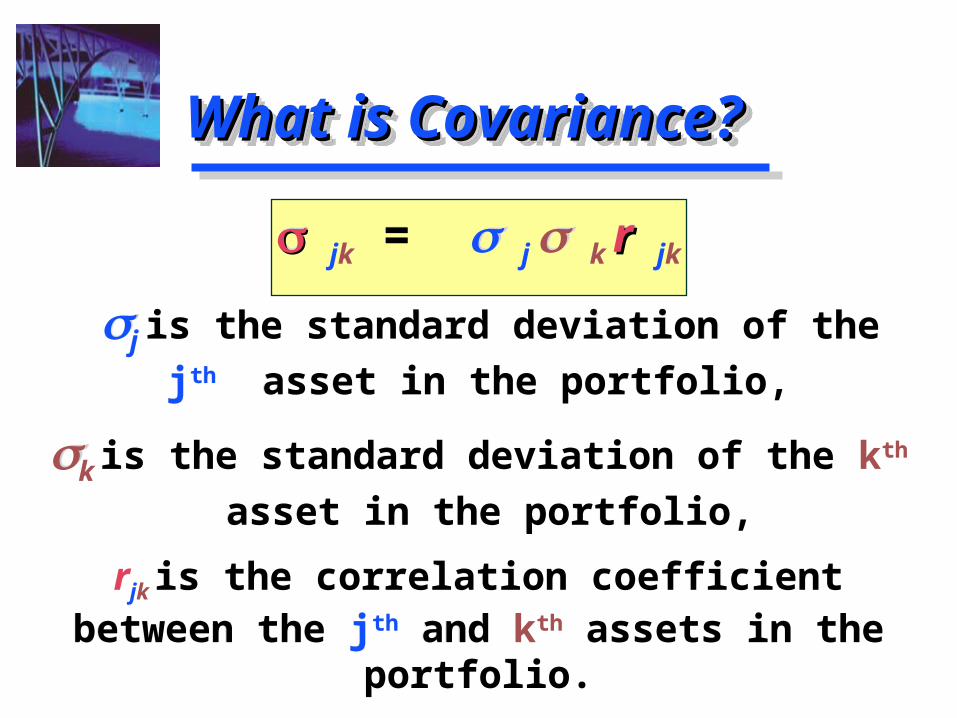
What is Covariance?What is Covariance?What is Covariance?What is Covariance?
jk = j k rrjk
j is the standard deviation of the jth
asset in the portfolio,
k is the standard deviation of the kth
asset in the portfolio,
rjk is the correlation coefficient between the jth and kth assets in the portfolio.
jk = j k rrjk
j is the standard deviation of the jth
asset in the portfolio,
k is the standard deviation of the kth
asset in the portfolio,
rjk is the correlation coefficient between the jth and kth assets in the portfolio.
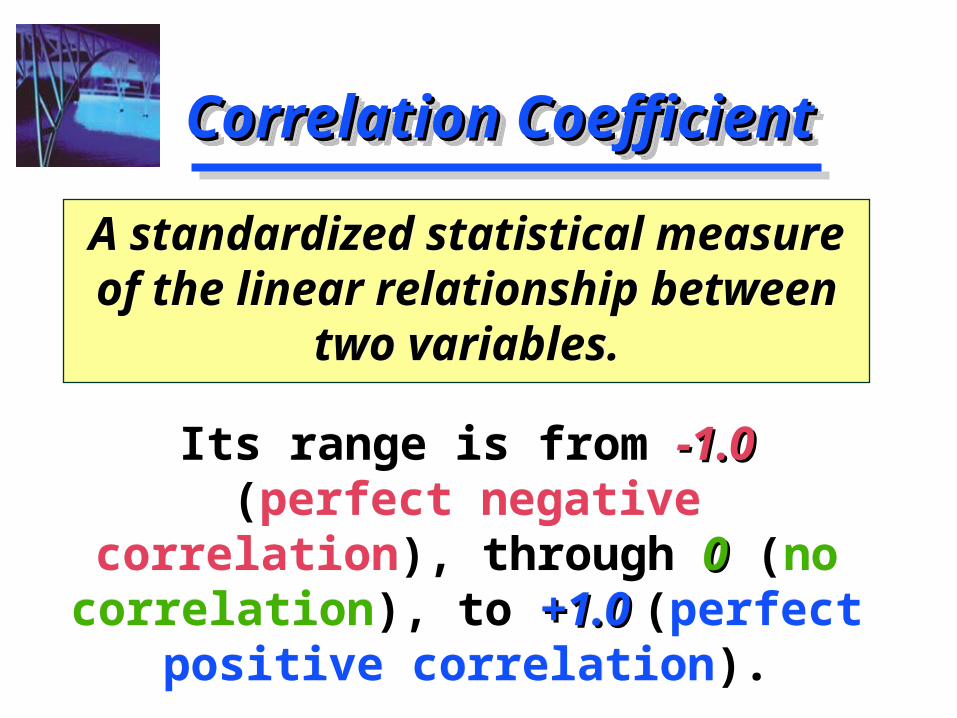
Correlation CoefficientCorrelation CoefficientCorrelation CoefficientCorrelation Coefficient
A standardized statistical measure of the linear relationship between
two variables.
Its range is from -1.0 -1.0 (perfect negative correlation), through 00 (no correlation), to +1.0 +1.0 (perfect
positive correlation).
A standardized statistical measure of the linear relationship between
two variables.
Its range is from -1.0 -1.0 (perfect negative correlation), through 00 (no correlation), to +1.0 +1.0 (perfect
positive correlation).
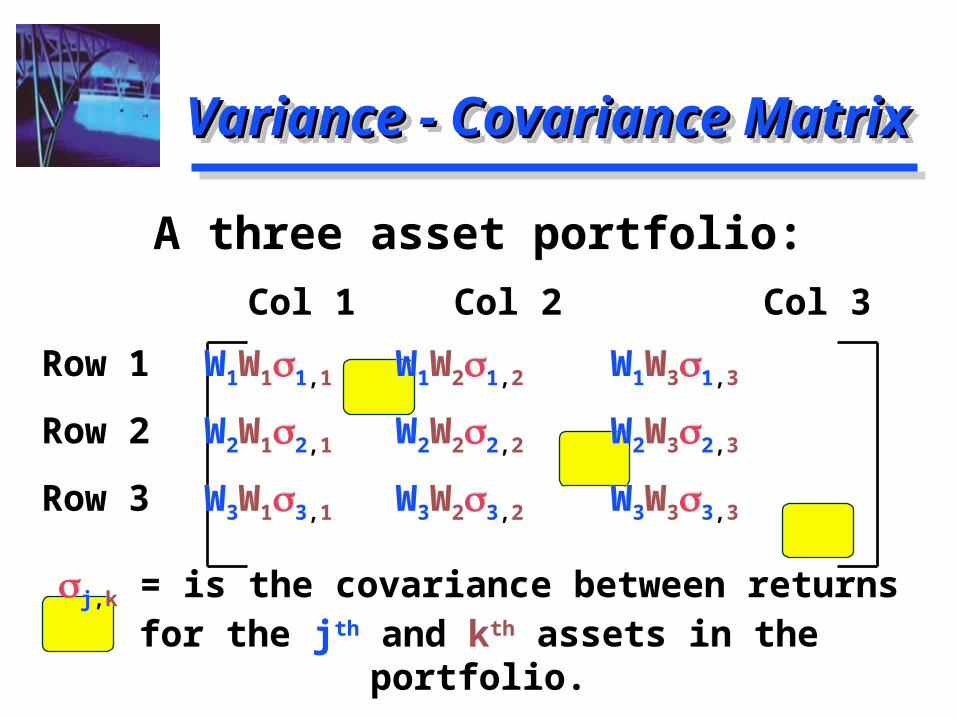
Variance - Covariance MatrixVariance - Covariance MatrixVariance - Covariance MatrixVariance - Covariance Matrix
A three asset portfolio:
Col 1 Col 2 Col 3
Row 1 W1W11,1 W1W21,2 W1W31,3
Row 2 W2W12,1 W2W22,2 W2W32,3
Row 3 W3W13,1 W3W23,2 W3W33,3
j,k = is the covariance between returns for the jth and kth assets in the portfolio.
A three asset portfolio:
Col 1 Col 2 Col 3
Row 1 W1W11,1 W1W21,2 W1W31,3
Row 2 W2W12,1 W2W22,2 W2W32,3
Row 3 W3W13,1 W3W23,2 W3W33,3
j,k = is the covariance between returns for the jth and kth assets in the portfolio.
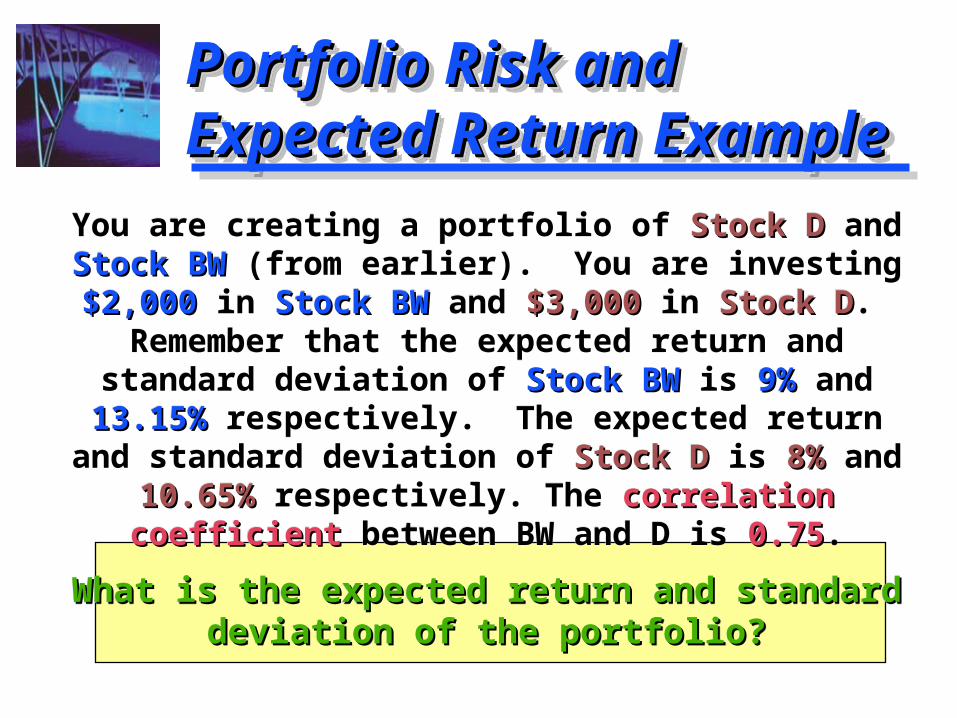
You are creating a portfolio of Stock D Stock D and Stock Stock BW BW (from earlier). You are investing $2,000$2,000 in
Stock BW Stock BW and $3,000$3,000 in Stock DStock D. Remember that the expected return and standard deviation of Stock BWStock BW is 9%9% and 13.15%13.15% respectively. The
expected return and standard deviation of Stock D Stock D is 8%8% and 10.65%10.65% respectively. The correlation correlation
coefficient coefficient between BW and D is 0.750.75.
What is the expected return and standard What is the expected return and standard deviation of the portfolio?deviation of the portfolio?
Portfolio Risk and Portfolio Risk and Expected Return ExampleExpected Return ExamplePortfolio Risk and Portfolio Risk and Expected Return ExampleExpected Return Example

Determining Portfolio Determining Portfolio Expected ReturnExpected ReturnDetermining Portfolio Determining Portfolio Expected ReturnExpected Return
WBW = $2,000 / $5,000 = .4
WWDD = $3,000 / $5,000 = .6 .6
RP = (WBW)(RBW) + (WWDD)(RRDD)
RP = (.4)(9%) + (.6.6)(8%8%)
RP = (3.6%) + (4.8%4.8%) = 8.4%8.4%
WBW = $2,000 / $5,000 = .4
WWDD = $3,000 / $5,000 = .6 .6
RP = (WBW)(RBW) + (WWDD)(RRDD)
RP = (.4)(9%) + (.6.6)(8%8%)
RP = (3.6%) + (4.8%4.8%) = 8.4%8.4%
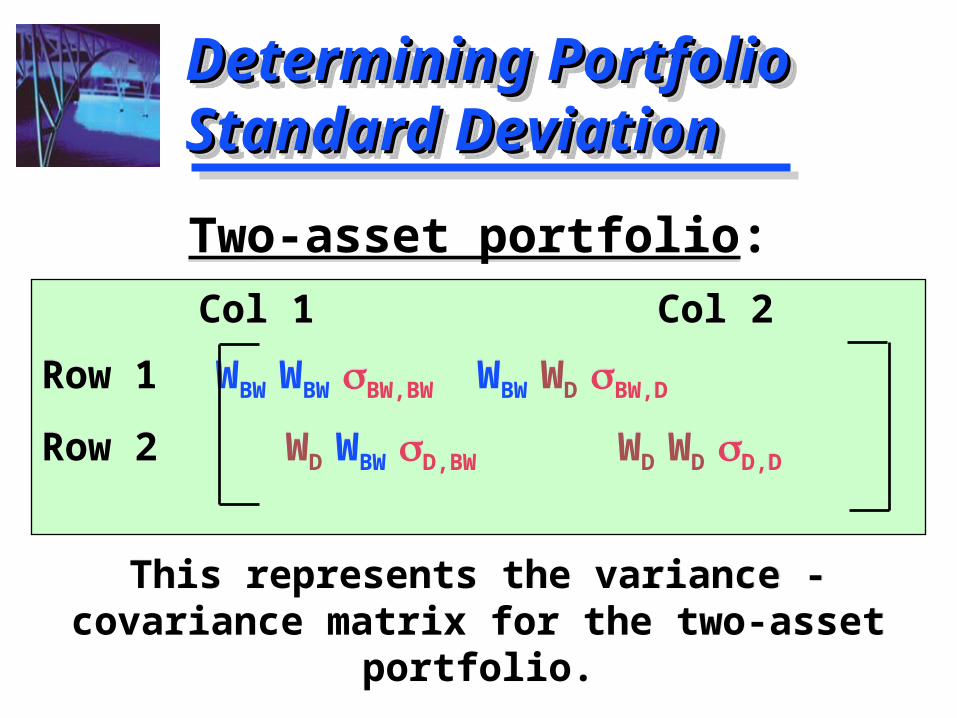
Two-asset portfolio:
Col 1 Col 2
Row 1 WBW WBW BW,BW WBW WD BW,D
Row 2 WD WBW D,BW WD WD D,D
This represents the variance - covariance matrix for the two-asset portfolio.
Two-asset portfolio:
Col 1 Col 2
Row 1 WBW WBW BW,BW WBW WD BW,D
Row 2 WD WBW D,BW WD WD D,D
This represents the variance - covariance matrix for the two-asset portfolio.
Determining Portfolio Determining Portfolio Standard DeviationStandard DeviationDetermining Portfolio Determining Portfolio Standard DeviationStandard Deviation
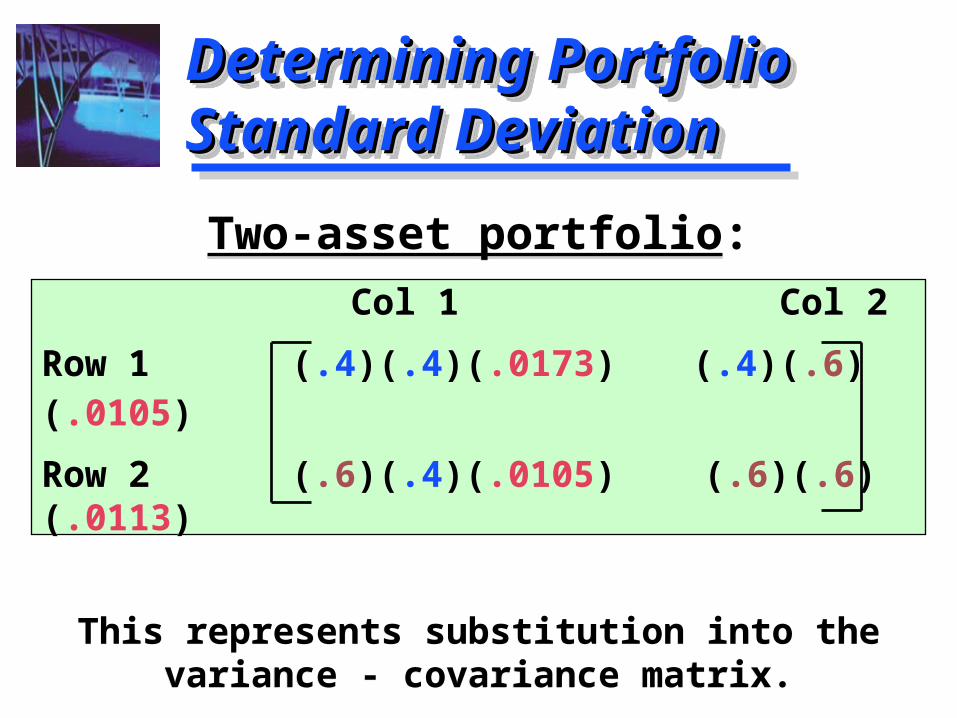
Two-asset portfolio:
Col 1 Col 2
Row 1 (.4)(.4)(.0173) (.4)(.6)(.0105)
Row 2 (.6)(.4)(.0105) (.6)(.6)(.0113)
This represents substitution into the variance - covariance matrix.
Two-asset portfolio:
Col 1 Col 2
Row 1 (.4)(.4)(.0173) (.4)(.6)(.0105)
Row 2 (.6)(.4)(.0105) (.6)(.6)(.0113)
This represents substitution into the variance - covariance matrix.
Determining Portfolio Determining Portfolio Standard DeviationStandard DeviationDetermining Portfolio Determining Portfolio Standard DeviationStandard Deviation
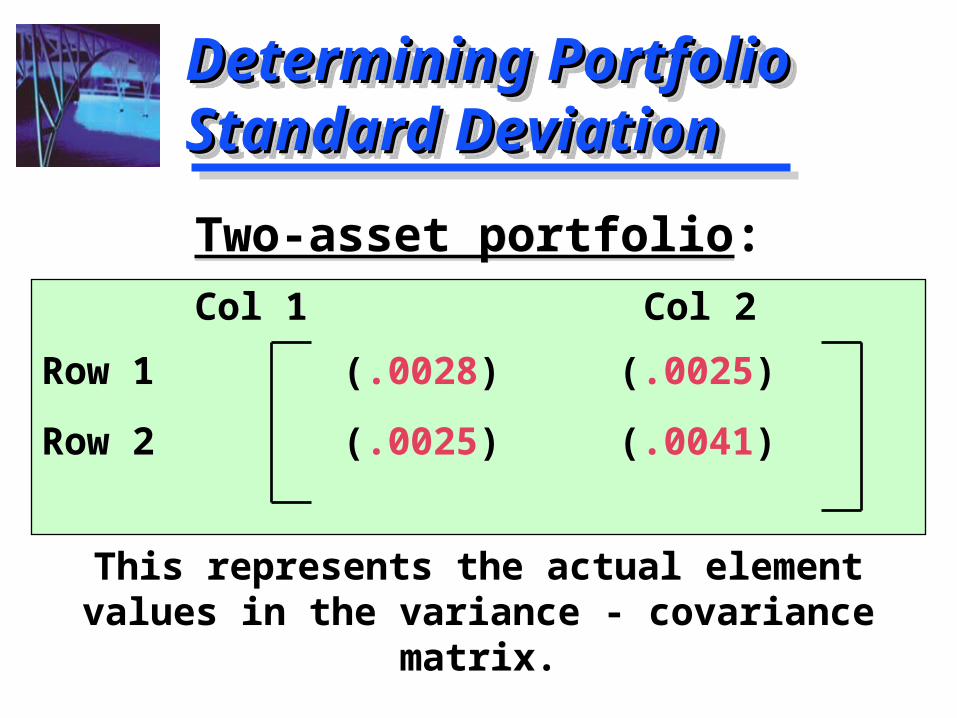
Two-asset portfolio:
Col 1 Col 2
Row 1 (.0028) (.0025)
Row 2 (.0025) (.0041)
This represents the actual element values in the variance - covariance matrix.
Two-asset portfolio:
Col 1 Col 2
Row 1 (.0028) (.0025)
Row 2 (.0025) (.0041)
This represents the actual element values in the variance - covariance matrix.
Determining Portfolio Determining Portfolio Standard DeviationStandard DeviationDetermining Portfolio Determining Portfolio Standard DeviationStandard Deviation

Determining Portfolio Determining Portfolio Standard DeviationStandard DeviationDetermining Portfolio Determining Portfolio Standard DeviationStandard Deviation
P = .0028 + (2)(.0025) + .0041
P = SQRT(.0119)
P = .1091 or 10.91%
A weighted average of the individual standard deviations is INCORRECT.
P = .0028 + (2)(.0025) + .0041
P = SQRT(.0119)
P = .1091 or 10.91%
A weighted average of the individual standard deviations is INCORRECT.
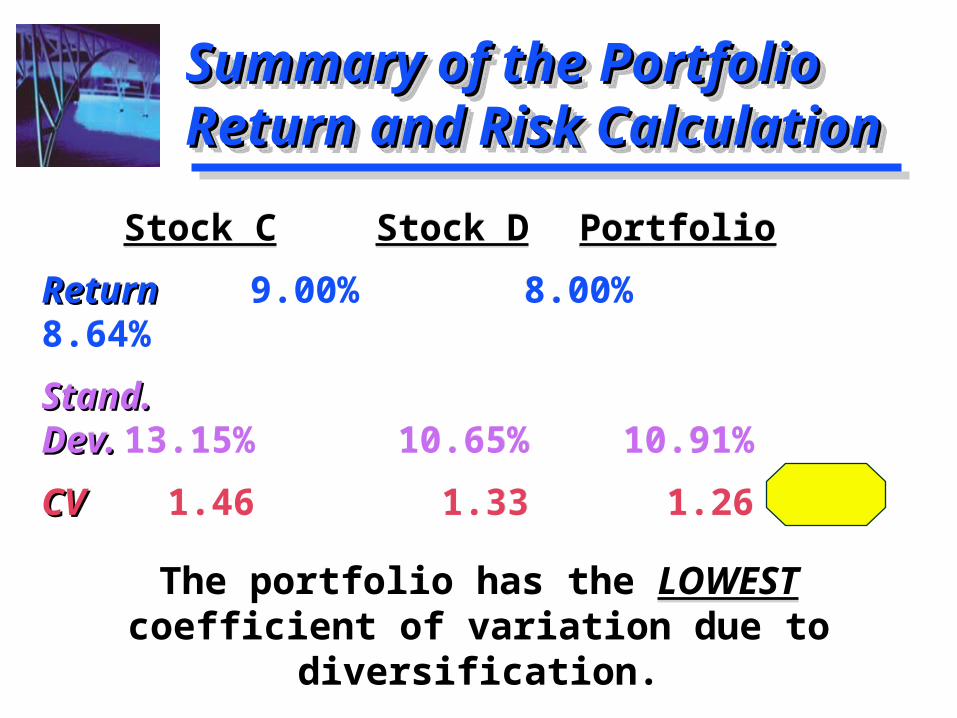
Stock C Stock D Portfolio
ReturnReturn 9.00% 8.00% 8.64%
Stand.Stand.Dev.Dev. 13.15% 10.65% 10.91%
CVCV 1.46 1.33 1.26
The portfolio has the LOWEST coefficient of variation due to diversification.
Stock C Stock D Portfolio
ReturnReturn 9.00% 8.00% 8.64%
Stand.Stand.Dev.Dev. 13.15% 10.65% 10.91%
CVCV 1.46 1.33 1.26
The portfolio has the LOWEST coefficient of variation due to diversification.
Summary of the Portfolio Summary of the Portfolio Return and Risk CalculationReturn and Risk CalculationSummary of the Portfolio Summary of the Portfolio Return and Risk CalculationReturn and Risk Calculation
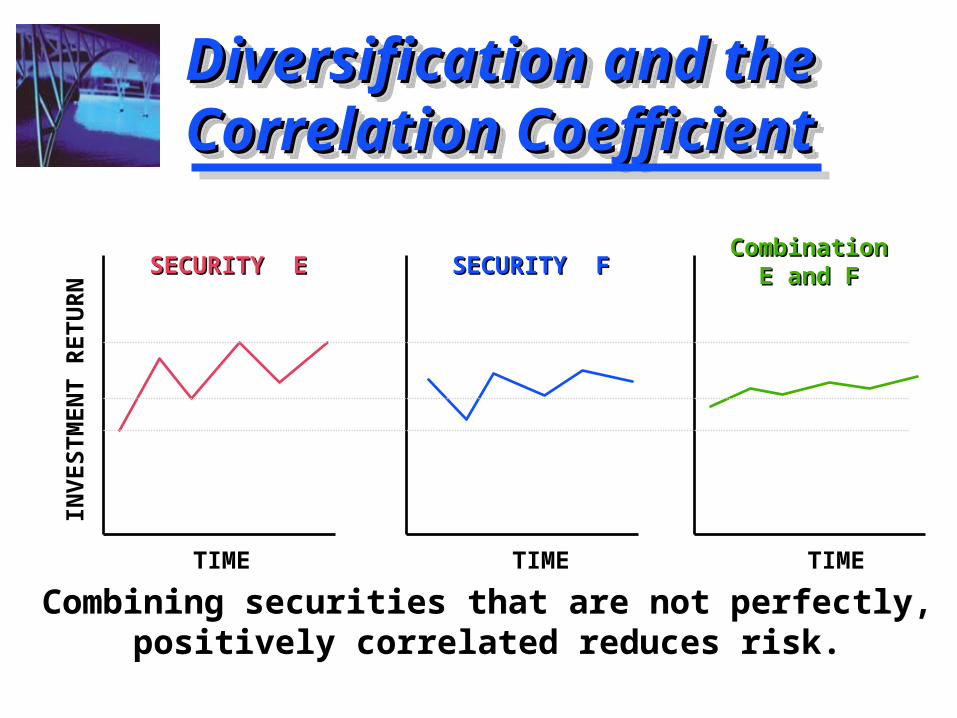
Combining securities that are not perfectly, positively correlated reduces risk.
Combining securities that are not perfectly, positively correlated reduces risk.
Diversification and the Diversification and the Correlation CoefficientCorrelation CoefficientDiversification and the Diversification and the Correlation CoefficientCorrelation CoefficientIN
VE
ST
ME
NT
RE
TU
RN
TIME TIMETIME
SECURITY ESECURITY E SECURITY FSECURITY FCombinationCombination
E and FE and F
Systematic Risk Systematic Risk is the variability of return on stocks or portfolios associated with
changes in return on the market as a whole.
Unsystematic Risk Unsystematic Risk is the variability of return on stocks or portfolios not explained by
general market movements. It is avoidable through diversification.
Total Risk = Systematic Total Risk = Systematic Risk + Unsystematic RiskRisk + Unsystematic RiskTotal Risk = Systematic Total Risk = Systematic Risk + Unsystematic RiskRisk + Unsystematic Risk
Total Risk Total Risk = SystematicSystematic RiskRisk + UnsystematicUnsystematic RiskRisk
Total Risk = Systematic Total Risk = Systematic Risk + Unsystematic RiskRisk + Unsystematic RiskTotal Risk = Systematic Total Risk = Systematic Risk + Unsystematic RiskRisk + Unsystematic Risk
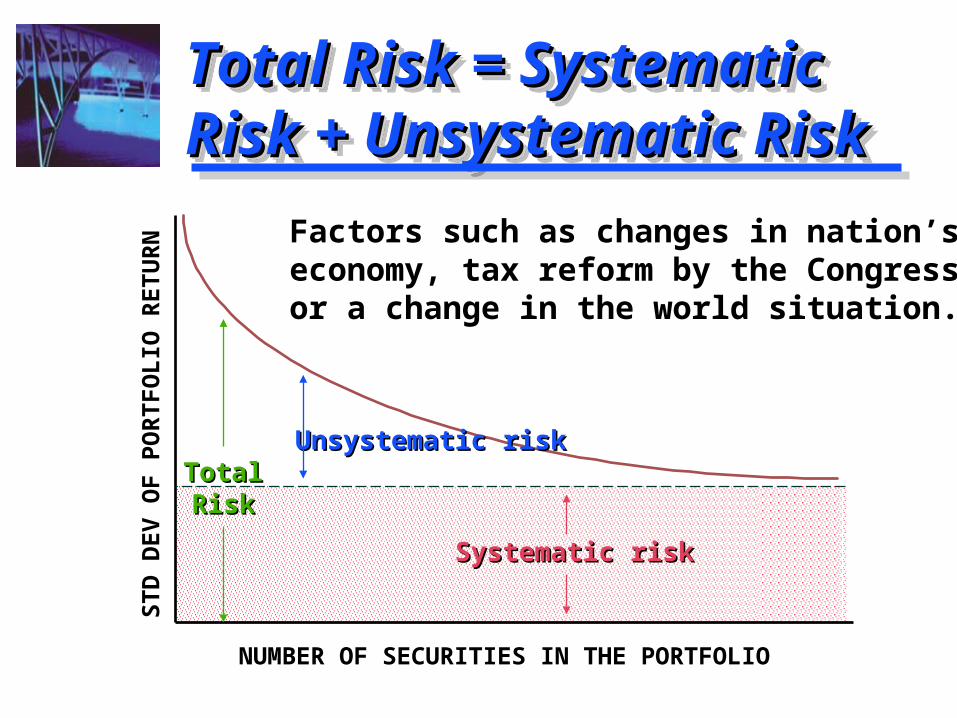
TotalTotalRiskRisk
Unsystematic riskUnsystematic risk
Systematic riskSystematic risk
ST
D D
EV
OF
PO
RT
FO
LIO
RE
TU
RN
NUMBER OF SECURITIES IN THE PORTFOLIO
Factors such as changes in nation’s economy, tax reform by the Congress,or a change in the world situation.
Total Risk = Systematic Total Risk = Systematic Risk + Unsystematic RiskRisk + Unsystematic RiskTotal Risk = Systematic Total Risk = Systematic Risk + Unsystematic RiskRisk + Unsystematic Risk
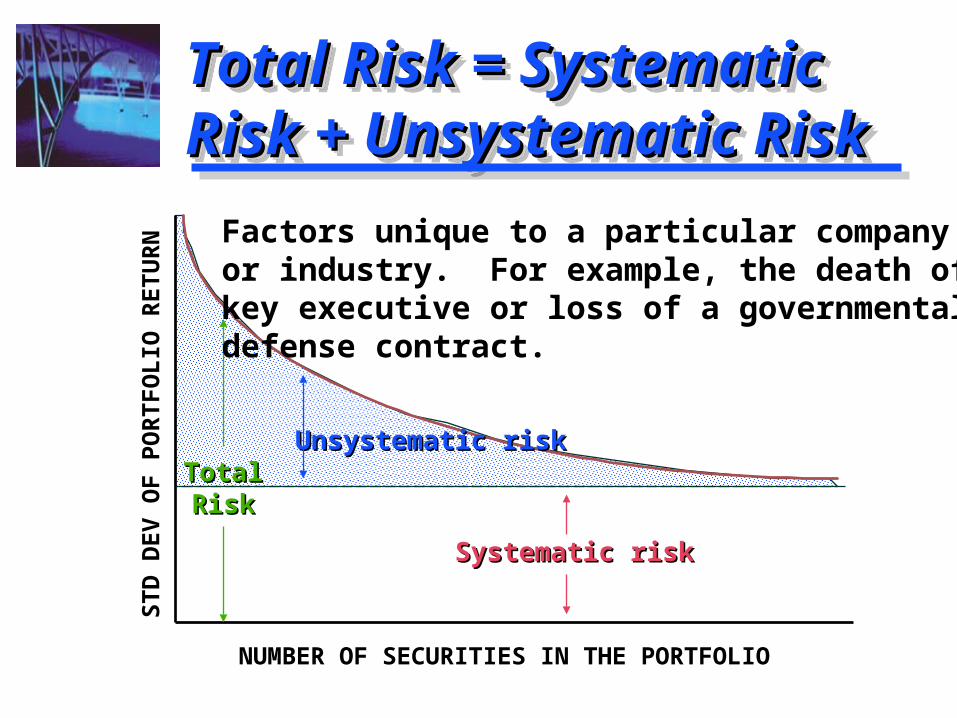
TotalTotalRiskRisk
Unsystematic riskUnsystematic risk
Systematic riskSystematic risk
ST
D D
EV
OF
PO
RT
FO
LIO
RE
TU
RN
NUMBER OF SECURITIES IN THE PORTFOLIO
Factors unique to a particular companyor industry. For example, the death of akey executive or loss of a governmentaldefense contract.
CAPM is a model that describes the relationship between risk and
expected (required) return; in this model, a security’s expected
(required) return is the risk-free rate risk-free rate plus a premium a premium based on the
systematic risk systematic risk of the security.
CAPM is a model that describes the relationship between risk and
expected (required) return; in this model, a security’s expected
(required) return is the risk-free rate risk-free rate plus a premium a premium based on the
systematic risk systematic risk of the security.
Capital Asset Capital Asset Pricing Model (CAPM)Pricing Model (CAPM)Capital Asset Capital Asset Pricing Model (CAPM)Pricing Model (CAPM)
1. Capital markets are efficient.
2. Homogeneous investor expectations over a given period.
3. Risk-freeRisk-free asset return is certain (use short- to intermediate-term Treasuries as a proxy).
4. Market portfolio contains only systematic risk systematic risk (use S&P 500 Indexor similar as a proxy).
CAPM AssumptionsCAPM AssumptionsCAPM AssumptionsCAPM Assumptions
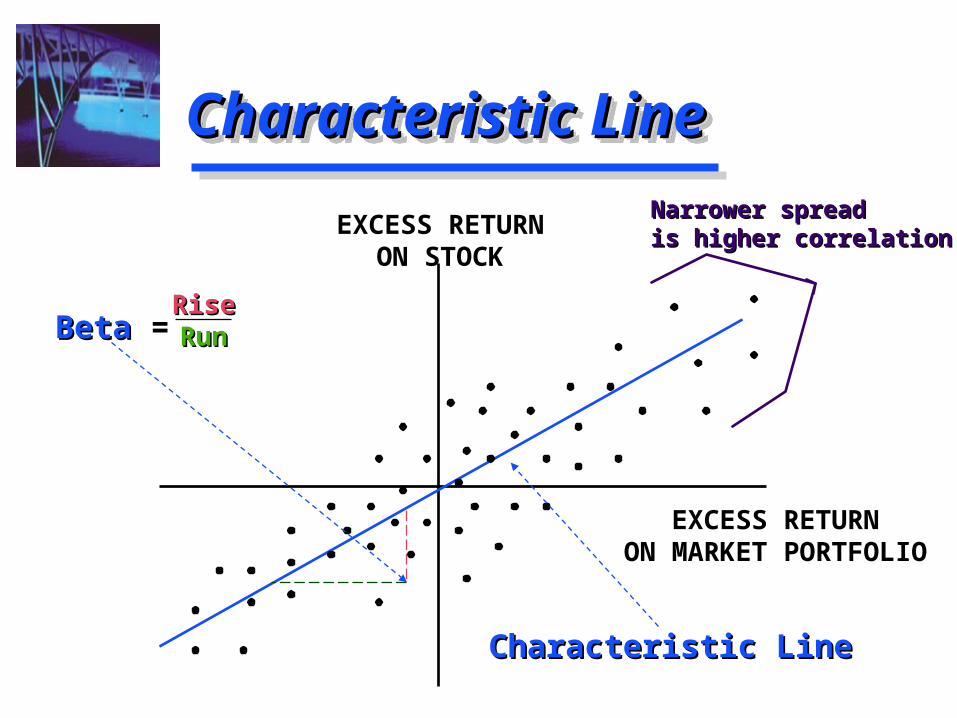
Characteristic LineCharacteristic LineCharacteristic LineCharacteristic Line
EXCESS RETURNON STOCK
EXCESS RETURNON MARKET PORTFOLIO
BetaBeta =RiseRiseRunRun
Narrower spreadNarrower spreadis higher correlationis higher correlation
Characteristic LineCharacteristic Line
An index of systematic risksystematic risk.
It measures the sensitivity of a stock’s returns to changes in
returns on the market portfolio.
The betabeta for a portfolio is simply a weighted average of the individual
stock betas in the portfolio.
An index of systematic risksystematic risk.
It measures the sensitivity of a stock’s returns to changes in
returns on the market portfolio.
The betabeta for a portfolio is simply a weighted average of the individual
stock betas in the portfolio.
What is Beta?What is Beta?What is Beta?What is Beta?
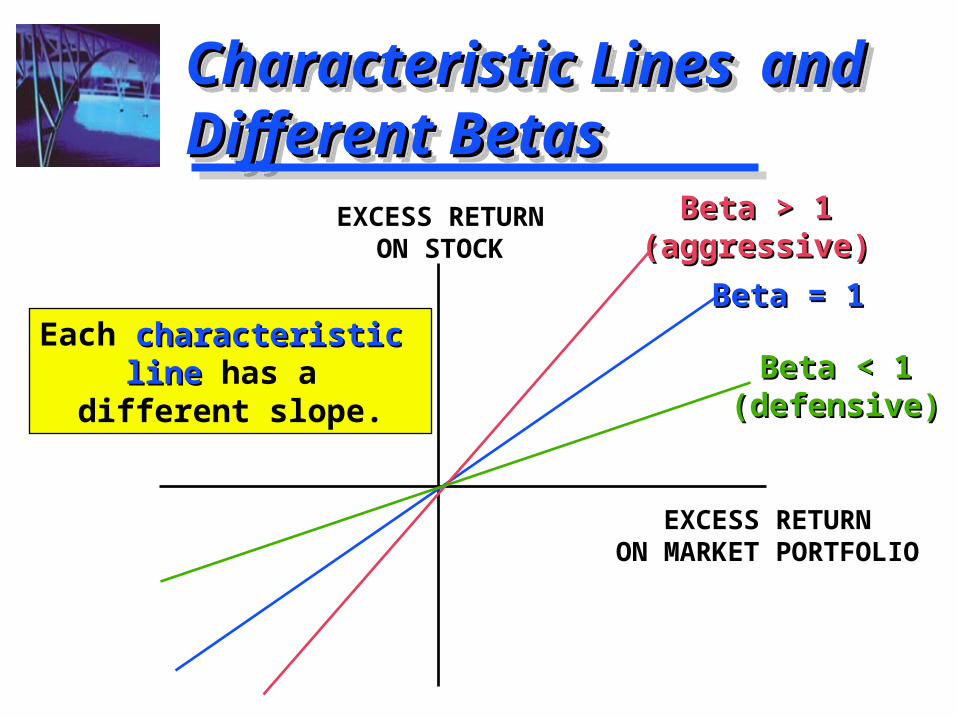
Characteristic Lines Characteristic Lines and Different Betasand Different BetasCharacteristic Lines Characteristic Lines and Different Betasand Different Betas
EXCESS RETURNON STOCK
EXCESS RETURNON MARKET PORTFOLIO
Beta < 1Beta < 1(defensive)(defensive)
Beta = 1Beta = 1
Beta > 1Beta > 1(aggressive)(aggressive)
Each characteristic characteristic line line has a
different slope.
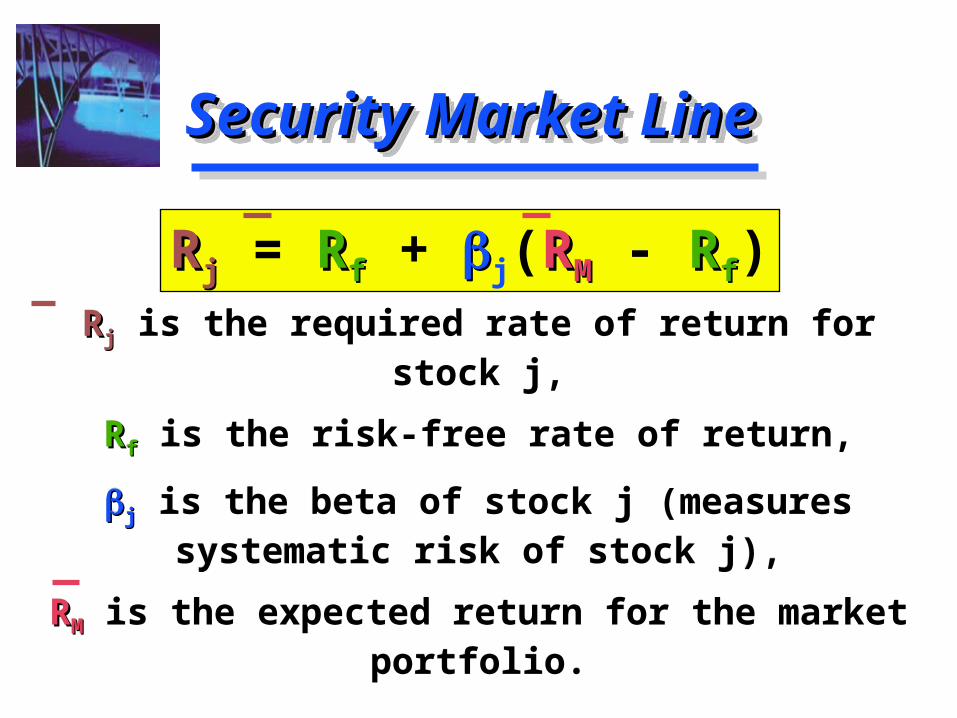
RRjj is the required rate of return for stock j,
RRff is the risk-free rate of return,
jj is the beta of stock j (measures systematic risk of stock j),
RRMM is the expected return for the market portfolio.
RRjj is the required rate of return for stock j,
RRff is the risk-free rate of return,
jj is the beta of stock j (measures systematic risk of stock j),
RRMM is the expected return for the market portfolio.
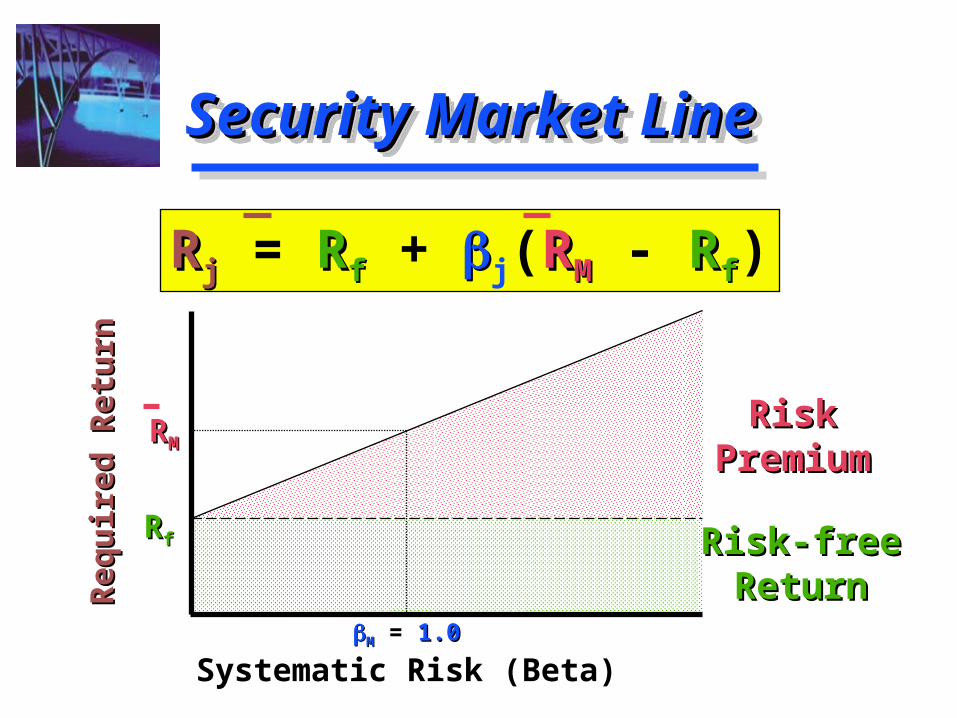
Security Market LineSecurity Market LineSecurity Market LineSecurity Market Line
RRjj = RRff + j(RRMM - RRff)
Security Market LineSecurity Market LineSecurity Market LineSecurity Market Line
RRjj = RRff + j(RRMM - RRff)
MM = 1.01.0
Systematic Risk (Beta)
RRff
RRMM
Req
uir
ed R
etu
rnR
equ
ired
Ret
urn
RiskRiskPremiumPremium
Risk-freeRisk-freeReturnReturn
Security Market LineSecurity Market LineSecurity Market LineSecurity Market Line
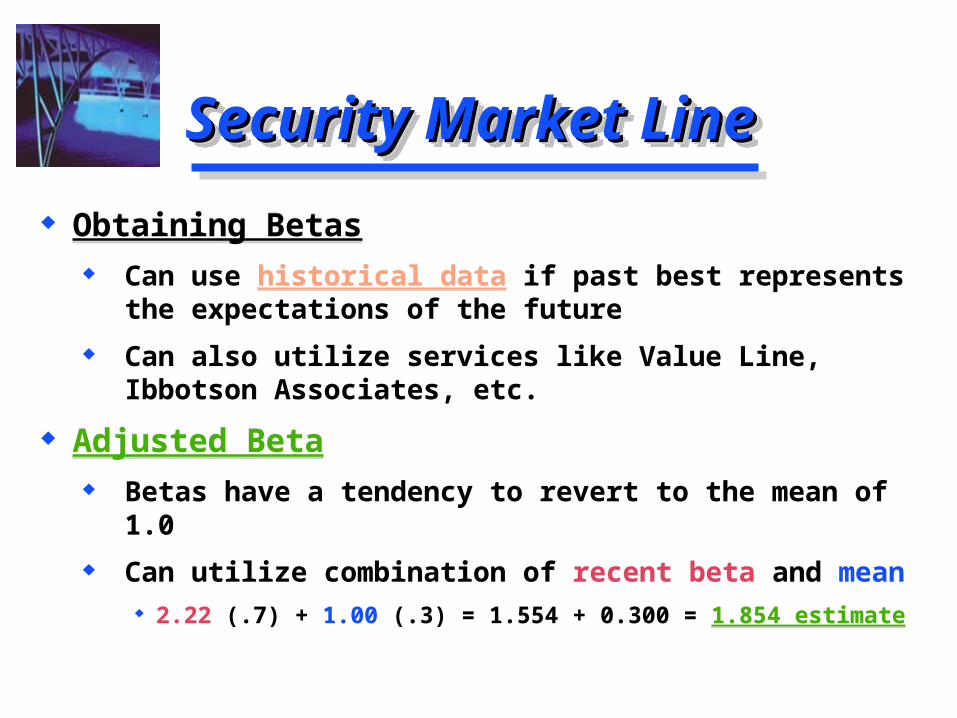
Obtaining Betas Can use historical data if past best represents the
expectations of the future
Can also utilize services like Value Line, Ibbotson Associates, etc.
Adjusted Beta Betas have a tendency to revert to the mean of 1.0
Can utilize combination of recent beta and mean 2.22 (.7) + 1.00 (.3) = 1.554 + 0.300 = 1.854 estimate

Lisa Miller at Basket Wonders is attempting to determine the rate of return required by their stock investors. Lisa is
using a 6% R6% Rff and a long-term market market
expected rate of return expected rate of return of 10%10%. A stock analyst following the firm has calculated
that the firm betabeta is 1.21.2. What is the required rate of returnrequired rate of return on the stock of
Basket Wonders?
Determination of the Determination of the Required Rate of ReturnRequired Rate of ReturnDetermination of the Determination of the Required Rate of ReturnRequired Rate of Return
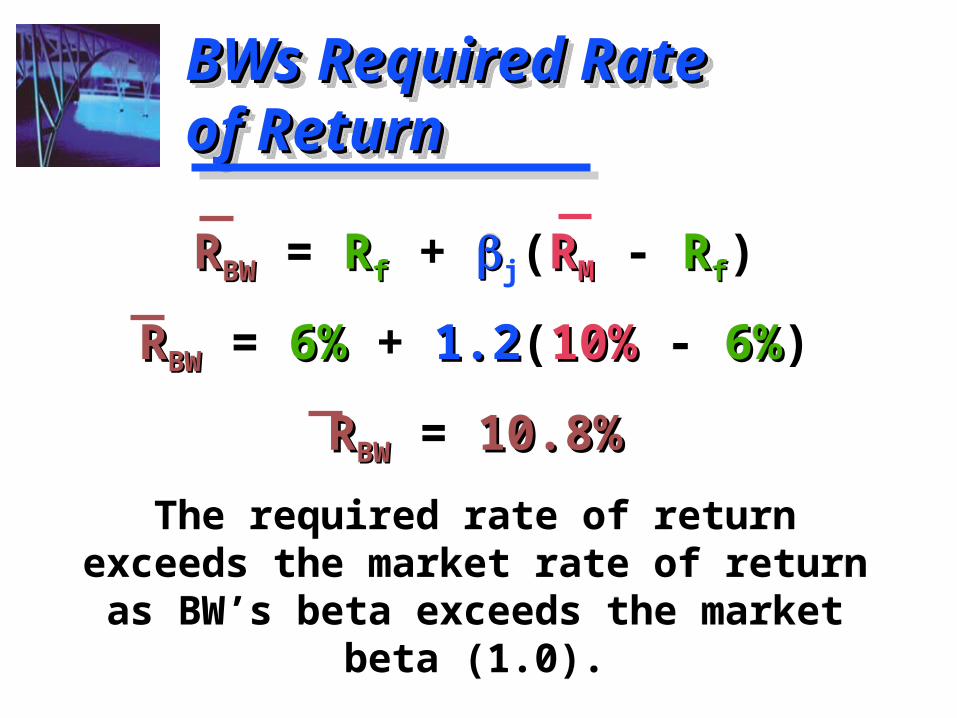
RRBWBW = RRff + j(RRMM - RRff)
RRBWBW = 6%6% + 1.21.2(10%10% - 6%6%)
RRBWBW = 10.8%10.8%
The required rate of return exceeds the market rate of return as BW’s
beta exceeds the market beta (1.0).
RRBWBW = RRff + j(RRMM - RRff)
RRBWBW = 6%6% + 1.21.2(10%10% - 6%6%)
RRBWBW = 10.8%10.8%
The required rate of return exceeds the market rate of return as BW’s
beta exceeds the market beta (1.0).
BWs Required BWs Required Rate of ReturnRate of ReturnBWs Required BWs Required Rate of ReturnRate of Return

Lisa Miller at BW is also attempting to determine the intrinsic value intrinsic value of the stock. She is using the constant growth model.
Lisa estimates that the dividend next period dividend next period will be $0.50$0.50 and that BW will growgrow at a
constant rate of 5.8%5.8%. The stock is currently selling for $15.
What is the intrinsic value intrinsic value of the stock? Is the stock overover or underpricedunderpriced?
Determination of the Determination of the Intrinsic Value of BWIntrinsic Value of BWDetermination of the Determination of the Intrinsic Value of BWIntrinsic Value of BW

The stock is OVERVALUED as the market price ($15) exceeds
the intrinsic value intrinsic value ($10$10).
The stock is OVERVALUED as the market price ($15) exceeds
the intrinsic value intrinsic value ($10$10).
Determination of the Determination of the Intrinsic Value of BWIntrinsic Value of BWDetermination of the Determination of the Intrinsic Value of BWIntrinsic Value of BW
$0.50$0.5010.8%10.8% - 5.8%5.8%
IntrinsicIntrinsicValueValue
=
= $10$10
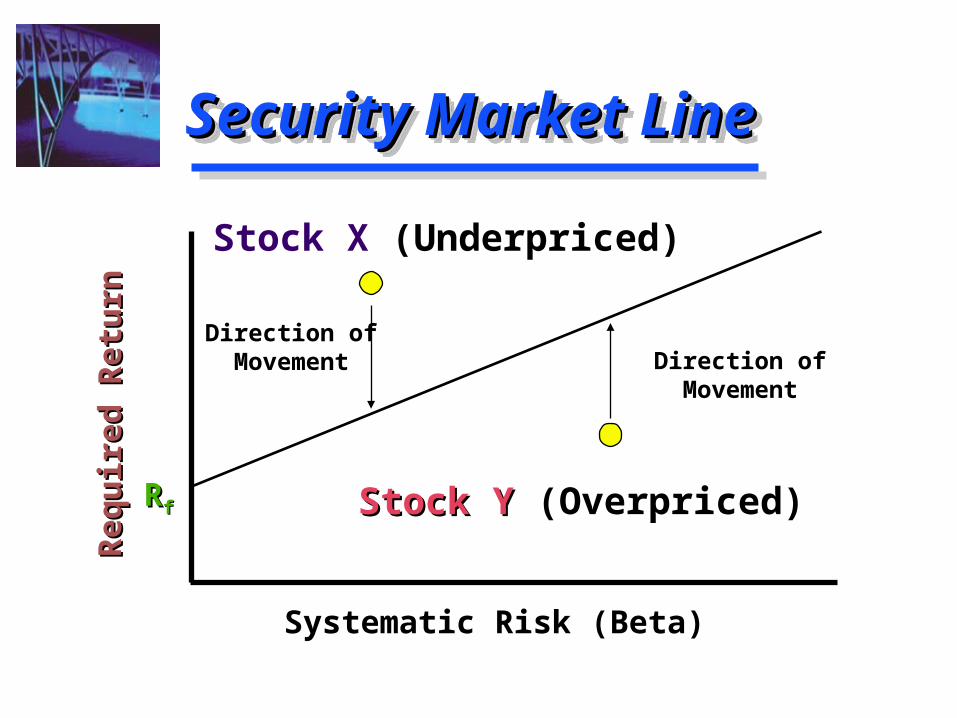
Security Market LineSecurity Market LineSecurity Market LineSecurity Market Line
Systematic Risk (Beta)
RRff
Req
uir
ed R
etu
rnR
equ
ired
Ret
urn
Direction ofMovement
Direction ofMovement
Stock Y Stock Y (Overpriced)
Stock X (Underpriced)