Embed Size (px)
Citation preview

Financial Results for the Second Quarter Ended September 30, 2008October 31, 2008
Company name : Nissan Motor Co., Ltd. <Tokyo Stock Exchange in Japan>
Code no : 7201 (URL http://www.nissan-global.com/EN/IR/)Representative : Carlos Ghosn, PresidentContact person : Joji Tagawa, Corporate Vice President, IR Department
Tel. (03) 3543 - 5523Scheduled date of filing Shihanki-Houkokusho: November 7, 2008Scheduled date of payment of cash dividends: November 28, 2008
(Amounts less than one million yen are rounded)
1. Consolidated Financial Results for the Second Quarter Ended September 30, 2008 (April 1, 2008 through September 30, 2008)<1> Consolidated operating results for six-month period
Net sales Operating income Ordinary income
Millions of yen % Millions of yen % Millions of yen % Millions of yen %
FY2008 2nd quarter 4,869,325 - 191,649 - 202,748 - 126,344 -
FY2007 2nd quarter 5,064,495 11.7 367,146 5.3 360,301 (0.2) 212,419 (22.5)
yen yen
FY2008 2nd quarter 31.02 -
FY2007 2nd quarter 51.77 51.62
Note: Regarding net sales, operating income, ordinary income and net income, percent indication shows percentage of change from corresponding figure for the same period of the prior fiscal year.
<2> Consolidated financial position
Total assets Net assets
Millions of yen Millions of yen % yen
FY2008 2nd quarter 12,034,975 3,868,050 29.2 863.19
FY2007 11,939,482 3,849,443 29.4 860.17
Note: Net assets excluding share subscription rights and minority interests: 3,515,959 million yen as of September 30, 2008, 3,504,964 million yen as of March 31, 2008
2. Dividends
Annual cash dividends per share
at 1st quarter end at 2nd quarter end at 3rd quarter end at fiscal year end Total
Yen Yen Yen Yen YenFY2007 - 20.00 - 20.00 40.00FY2008 - 11.00 - - -FY2008 forecast - - - - -
Note: Changes in dividends forecast for FY2008 as of September 30, 2008: Applicable The year-end dividend for the fiscal year ending March 31, 2009 has not been decided yet.
Net income
Net incomeper share-basic
Net incomeper share-diluted
Net assets excluding sharesubscription rights andminority interests as a
percentage of total assets
Net assets excluding sharesubscription rights and
minority interests per share
- 1 -

Nissan Motor Co., Ltd. (7201)Financial Results for the Second Quarter Ended September 30, 2008
3. Forecast of consolidated operating results for FY2008 (April 1, 2008 through March 31, 2009)
Net sales Operating income Ordinary income
Millions of yen % Millions of yen % Millions of yen % Millions of yen % yenFY2008 9,600,000 (11.3) 270,000 (65.9) 260,000 (66.1) 160,000 (66.8) 39.28
Note1: Regarding net sales, operating income, ordinary income and net income, percent indications show percentage of changes from corresponding figures for the previous period. Note2: Changes in forecast of consolidated operating results for FY2008 as of September 30, 2008: Applicable
4. Others <1> Significant changes in scope of consolidation: None <2> Adoption of simplified and specific accounting policies for quarterly consolidated financial statements: Applicable
Note: See attached page 3 "【Qualitative Information ・ Financial Statements】 4.Others (2)."
<3> Changes in accounting policies
<3>-1 Changes due to changes in accounting standard: Applicable
<3>-2 Other changes: Applicable
Note: See attached page 4 "【Qualitative Information ・ Financial Statements】 4.Others (3)." <4> Number of shares issued <4>-1 Number of shares issued (including treasury stocks): 4,520,715,112 shares as of September 30, 2008, 4,520,715,112 shares as of March 31, 2008 <4>-2 Number of treasury shares: 447,512,422 shares as of September 30, 2008, 445,994,555 shares as of March 31, 2008 <4>-3 The average number of shares issued during the six-month period: 4,073,237,532 shares for the six months ended September 30, 2008, 4,103,506,170 shares for the six months ended September 30, 2007.
※※※※ Explanation regarding the appropriate use of forecasts of business results, and other information With the large revision of the consolidated financial forecast for the fiscal year ending March 31, 2009, the company has resolved to pay 11 yen per share as interim dividend. The year-end dividend for the fiscal year ending March 31, 2009 has not been decided yet. However, the year-end dividend will be provided, based on the shareholders’ approval at the Annual General Shareholders Meeting in June 2009, taking into consideration the business environment of the second-half of the fiscal year ending March 31, 2009. The company will announce the dividends of fiscal years ending March 31, 2010 and 2011 immediately when the trend of the markets is cleared.
The financial forecasts of business results are based on judgments and estimates that have been made using of currently available information. By nature, such financial forecasts are subject to uncertainty and risk. Therefore, you are advised that the final results might be significantly different from the aforementioned forecasts due to changes in economic environments related to our business, market trends and exchange rate, etc. See attached page 3 "【Qualitative Information ・ Financial Statements】 3.FY2008 Financial Forecast."
Effective April 1, 2008, the Company adopted the Accounting Standard for Quarterly Financial Statements (ASBJ Statement No. 12) and the Implementation Guidance for Accounting Standards for Quarterly Financial Statements (ASBJ Guidance No. 14). The consolidated financial statements of the Company are prepared in accordance with “Regulations for the Quarterly Consolidated Financial Statements.”
Net income Net income per share
- 2 -

Nissan Motor Co., Ltd. (7201)Financial Results for the Second Quarter Ended September 30, 2008
【Qualitative Information ・ Financial Statements】
1. Operating Results
2. Financial Position
3. FY2008 Financial Forecast
Net sales 9,600 billion yen (11.3)% vs. FY2007Operating income 270 billion yen (65.9)% vs. FY2007Ordinary income 260 billion yen (66.1)% vs. FY2007Net income 160 billion yen (66.8)% vs. FY2007
Assumption of the foreign exchange rates;YEN / USD YEN / EUR
Second half of the fiscal year 100.0 135.0Full fiscal year 103.1 148.9
※
4. Others
(1) Significant changes in scope of consolidation
There are no significant changes in scope of consolidation for the six months ended September 30, 2008.
(2) Adoption of simplified and specific accounting policies for quarterly consolidated financial statements
Simplified accounting
(Computation method for income taxes, deferred tax assets and deferred tax liabilities)The recoverability of deferred tax assets was assessed based on the projections of future performance and taxplanning that were used in the prior fiscal year but also by taking into account the effects of significant changesif such significant changes were recognized in the business environment or in the circumstances where temporary differences occur during the period from the end of the prior fiscal year to September 30, 2008.
Specific accounting policies adopted in preparing quarterly consolidated financial statements
(Calculation of tax expense)To calculate the tax expense, the effective tax rate after adoption of tax-effect accounting, which is available for thewhole fiscal year ending March 31, 2009, including the six months ended September 30, 2008, is reasonably estimatedagainst income before income taxes and minority interests, and then the income before income tax and minority interestsfor the six months ended September 30, 2008, is multiplied by such an estimated effective tax rate. Income taxes - deferred are included in the income taxes.
For the six months ended September 30, 2008, the Group’s net sales amounted to 4,869.3 billion yen, operating income was 191.6billion yen and operating income as a percentage of net sales was 3.9%, on a consolidated basis.Net non-operating income of 11.1 billion yen was recorded for the six months ended September 30, 2008. This included 24.1 billionyen in equity in earnings of affiliates and a 3.6 billion yen exchange gain. As a result, ordinary income totaled 202.7 billion yen. Netspecial losses were 33.4 billion yen. This included 20.1 billion yen in a special addition to retirement benefits under a voluntarytransition program in the United States of America, a 7.3 billion yen loss on disposal of fixed assets and a 2.5 billion yen loss onimpairment of fixed assets. Income before income taxes and minority interests for the six months ended September 30, 2008,amounted to 169.3 billion yen. As a result, net income for the six months ended September 30, 2008, was 126.3 billion yen afterdeducting 33.8 billion yen in income taxes and 9.2 billion yen in minority interests.
Total assets have increased by 0.8% to 12,035.0 billion yen compared to March 31, 2008. This is mainly due to increase ofInventories by 241.4 billion yen.Total liabilities have increased by 1.0% to 8,166.9 billion yen compared to March 31, 2008. This is mainly due to increase of Long-term borrowings by 292.6 billion yen.Total net assets have increased by 0.5% to 3,868.1 billion yen compared to March 31, 2008. This is mainly due to increase ofRetained earnings by 93.6 billion yen.
The effects of the global financial and economic crisis have created conditions of extreme volatility and uncertainty that are expectedto continue for the remainder of FY2008. Despite the lack of reliable economic and industry forecasts and taking into considerationmost of the factors affecting our activities, the company has revised full year forecast to be as shown below:
The financial forecasts of business results are based on judgments and estimates that have been made using of currently available information.Therefore, we advise against making an investment decision by solely relying on this projection. Please be advised that actual results could differ materiallyfrom the aforementioned forecasts as a result of numerous factors, including general economic conditions in our principal markets and foreign exchange ratesbetween the Japanese yen and the U.S. dollar and other major currencies.
- 3 -

Nissan Motor Co., Ltd. (7201)Financial Results for the Second Quarter Ended September 30, 2008
(3) Changes in accounting policies
No. 12) and the Implementation Guidance for Accounting Standards for Quarterly Financial Statements (ASBJ GuidanceNo. 14). The consolidated financial statements of the Company are prepared in accordance with “Regulations for the Quarterly Consolidated Financial Statements.”
(Application of the "Practical Solution on Unification of Accounting Policies Applied to Foreign Subsidiaries for Consolidated Financial Statements")Effective April 1, 2008, the "Practical Solution on Unification of Accounting Policies Applied to Foreign Subsidiaries for Consolidated Financial Statements" (ASBJ Practical Issues Task Force (PITF) No. 18 issued on May 17, 2006) has beenadopted. The effect of this change was to decrease net sales by 78,004 million yen, and gross profit by 68,522 million yen, but toincrease operating income by 342 million yen, ordinary income by 2,714 million yen, income before income taxes and minority interests by 2,755 million yen and net income by 2,087 million yen for the six months ended September 30, 2008.As a result of this change, as of April 1, 2008, total shareholders' equity increased by 47,114 million yen, total valuation, translation adjustments and others decreased by 87,892 million yen, minority interests decreased by 898 million yen andtotal net assets decreased by 41,676 million yen.The effects on segment information are stated at the respective relevant notes in the segment information section.
(Classification to record sales incentive)Until the year ended March 31, 2008, "sales incentive" was deducted from net sales for the consolidated subsidiaries in the United States and Mexico, whereas it was included in "Selling, general and administrative expenses" for the Company and other consolidated subsidiaries. The treatment of sales incentive for all the overseas consolidated subsidiaries wasunified to the effect that the sales incentive is deducted from net sales pursuant to the adoption of the "Practical Solutionon Unification of Accounting Policies Applied to Foreign Subsidiaries for Consolidated Financial Statements" (ASBJ PITFNo. 18 issued on May 17, 2006). As a result, effective April 1, 2008, the accounting for the sales incentive for the Companyand domestic consolidated subsidiaries has been changed to that in which the sales incentive is deducted from net sales tounify the accounting principle among the consolidated subsidiaries and more appropriately present net sales.As a result of this change, net sales and gross profit for the six months ended September 30, 2008 decreased by 7,524 million yen compared with the corresponding amounts which would have been recorded if the previous method had been applied. However, as selling, general and administrative expenses decreased by the same amount, there was no effect on operating income, ordinary income, income before income taxes and minority interests and net income.The effects on segment information are stated at the respective relevant notes in the segment information section.
Effective April 1, 2008, the Company adopted the Accounting Standard for Quarterly Financial Statements (ASBJ S
- 4 -

Nissan Motor Co., Ltd. (7201)Financial Results for the Second Quarter Ended September 30, 2008
5. Consolidated Financial Statements
(1) Consolidated Balance Sheets (in millions of Yen)
AssetsCurrent assets
Cash on hand and in banks 500,060 570,225Trade notes and accounts receivable 764,364 688,300Sales finance receivables 3,182,626 3,234,433Securities 10,451 24,643Merchandise and Finished goods 921,496 709,798Work in process 141,903 130,406Raw materials and Supplies 183,166 164,961Other 874,580 851,367Allowance for doubtful accounts (84,885) (79,909)Total current assets 6,493,761 6,294,224
Fixed assetsProperty, plant and equipment Buildings and structures, net 711,652 709,149 Machinery, equipment and vehicles, net 2,503,353 2,517,838 Land 705,734 720,370 Construction in progress 140,479 153,909 Other, net 487,375 525,286 Total property, plant and equipment 4,548,593 4,626,552Intangible fixed assets 179,290 186,346Investments and other assets Investment securities 449,113 452,169 Other 369,194 384,984 Allowance for doubtful accounts (4,976) (4,793) Total investments and other assets 813,331 832,360Total fixed assets 5,541,214 5,645,258
Total assets 12,034,975 11,939,482
Current Second Quarter Prior Fiscal Year(As of September 30, 2008) (As of March 31, 2008)
(Condensed)
- 5 -

Nissan Motor Co., Ltd. (7201)Financial Results for the Second Quarter Ended September 30, 2008
(in millions of Yen)
LiabilitiesCurrent liabilities
Trade notes and accounts payable 1,120,064 1,119,430Short-term borrowings 1,042,297 988,342Current portion of long-term borrowings 607,668 666,844Commercial paper 996,292 951,843Current portion of bonds 86,674 149,998Lease obligations 67,462 75,554Accrued expenses 471,604 563,672Accrued warranty costs 92,371 91,151Other 564,837 635,782Total current liabilities 5,049,269 5,242,616
Long-term liabilitiesBonds 814,434 772,725Long-term borrowings 1,343,528 1,050,889Lease obligations 66,141 85,389Accrued warranty costs 104,157 112,522Accrued retirement benefits 184,393 177,485Accrued directors’ retirement benefits 1,911 3,883Other 603,092 644,530Total long-term liabilities 3,117,656 2,847,423
Total liabilities 8,166,925 8,090,039Net assets
Shareholders’ equityCommon stock 605,814 605,814Capital surplus 804,470 804,470Retained earnings 2,820,449 2,726,859Treasury stock (269,570) (269,003)Total shareholders’ equity 3,961,163 3,868,140
Valuation, translation adjustments and othersUnrealized holding gain on securities 4,611 5,750Unrealized loss from hedging instruments (1,209) (8,471)Translation adjustments (435,999) (441,820)Other (12,607) 81,365Total valuation, translation adjustments and others (445,204) (363,176)
Share subscription rights 1,940 1,714Minority interests 350,151 342,765Total net assets 3,868,050 3,849,443
Total liabilities and net assets 12,034,975 11,939,482
Current Second Quarter Prior Fiscal Year(As of September 30, 2008) (As of March 31, 2008)
(Condensed)
- 6 -

Nissan Motor Co., Ltd. (7201)Financial Results for the Second Quarter Ended September 30, 2008
(2) Consolidated Statement of Income
The six-month period ended September 30 (in millions of Yen)
Net sales 4,869,325Cost of sales 3,925,309Gross profit 944,016Selling, general and administrative expenses Advertising expenses 126,802 Provision for warranty costs 47,519 Other selling expenses 147,762 Salaries and wages 196,022 Provision for doubtful accounts 34,551 Other 199,711 Total selling, general and administrative expenses 752,367Operating income 191,649Non-operating income Interest income 12,391 Dividends income 1,731 Equity in earnings of affiliates 24,057 Exchange gain 3,554 Miscellaneous income 5,206 Total non-operating income 46,939Non-operating expenses Interest expense 16,345 Derivative loss 4,453 Miscellaneous expenses 15,042 Total non-operating expenses 35,840Ordinary income 202,748Special gains Gain on sales of fixed assets 2,815 Reversal of allowance for doubtful accounts 477 Other 1,422 Total special gains 4,714Special losses Loss on disposal of fixed assets 7,333 Impairment loss 2,506 Loss from change in measurement date for calculating retirement benefit obligation of subsidiaries in North America Special addition to retirement benefits 20,087 Other 6,257 Total special losses 38,132Income before income taxes and minority interests 169,330Income taxes 33,776Income attributable to minority interests 9,210Net income 126,344
1,949
Six Months Ended September 30, 2008(From April 1, 2008
To September 30, 2008)
- 7 -
Nissan Motor Co., Ltd. (7201)Financial Results for the Second Quarter Ended September 30, 2008
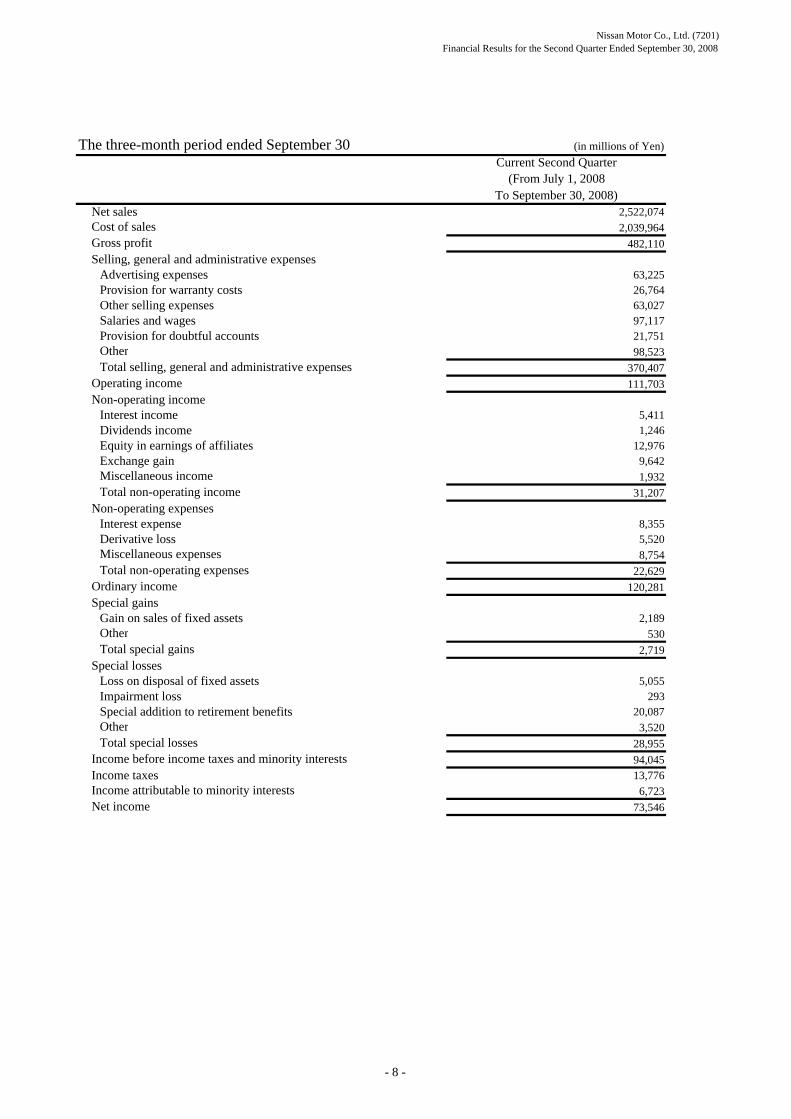
The three-month period ended September 30 (in millions of Yen)
Net sales 2,522,074Cost of sales 2,039,964Gross profit 482,110Selling, general and administrative expenses Advertising expenses 63,225 Provision for warranty costs 26,764 Other selling expenses 63,027 Salaries and wages 97,117 Provision for doubtful accounts 21,751 Other 98,523 Total selling, general and administrative expenses 370,407Operating income 111,703Non-operating income Interest income 5,411 Dividends income 1,246 Equity in earnings of affiliates 12,976 Exchange gain 9,642 Miscellaneous income 1,932 Total non-operating income 31,207Non-operating expenses Interest expense 8,355 Derivative loss 5,520 Miscellaneous expenses 8,754 Total non-operating expenses 22,629Ordinary income 120,281Special gains Gain on sales of fixed assets 2,189 Other 530 Total special gains 2,719Special losses Loss on disposal of fixed assets 5,055 Impairment loss 293 Special addition to retirement benefits 20,087 Other 3,520 Total special losses 28,955Income before income taxes and minority interests 94,045Income taxes 13,776Income attributable to minority interests 6,723Net income 73,546
Current Second Quarter(From July 1, 2008
To September 30, 2008)
- 8 -

Nissan Motor Co., Ltd. (7201)Financial Results for the Second Quarter Ended September 30, 2008
(3) Consolidated Statement of Cash Flows (in millions of Yen)
Cash flows from operating activities
Income before income taxes and minority interests 169,330
Depreciation and amortization (for fixed assets excluding leased vehicles) 225,421
Depreciation and amortization (for other assets) 13,043
Depreciation and amortization (for leased vehicles) 161,986
Impairment loss 2,506
Increase (decrease) in allowance for doubtful receivables 3,468
Unrealized loss on investments 155
Interest and dividend income (14,122)
Interest expense 68,718
Loss (gain) on sales of property, plant and equipment (1,383)
Loss on disposal of fixed assets 7,333
Loss (gain) on sales of investment securities (314)
Decrease (increase) in trade notes and accounts receivable (13,080)
Decrease (increase) in sales finance receivables 104,305
Decrease (increase) in inventories (245,565)
Increase (decrease) in trade notes and accounts payable (74,545)
Amortization of net retirement benefit obligation at transition 5,483
Retirement benefit expenses 26,938
Retirement benefit payments made against related accrual (19,589)
Other (31,379)
Subtotal 388,709
Interest and dividends received 13,876
Interest paid (66,966)
Income taxes paid (69,001)
Net cash provided by operating activities 266,618
Cash flows from investing activities
Net decrease (increase) in short-term investments 5,478
Purchases of fixed assets (223,142)
Proceeds from sales of fixed assets 30,987
Purchase of leased vehicles (424,217)
Proceeds from sales of leased vehicles 218,982
Payments of long-term loans receivable (12,297)
Collection of long-term loans receivable 6,789
Purchase of investment securities (13,280)
Proceeds from sales of investment securities 942
Other (3,634)
Net cash used in investing activities (413,392)
Six Months Ended September 30, 2008(From April 1, 2008
To September 30, 2008)
- 9 -

Nissan Motor Co., Ltd. (7201)Financial Results for the Second Quarter Ended September 30, 2008
(in millions of Yen)
Cash flows from financing activities
Net increase (decrease) in short-term borrowings 25,860
Proceeds from long-term borrowings 615,152
Proceeds from issuance of bonds 73,336
Repayment of long-term borrowings (433,666)
Redemption of bonds (100,010)
Proceeds from minority shareholders 1,160
Purchase of treasury stock (27)
Repayment of lease obligations (43,831)
Cash dividends paid (81,496)
Cash dividends paid to minority shareholders (2,594)
Other 14
Net cash provided by financing activities 53,898
Effects of exchange rate changes on cash and cash equivalents 4,247
Increase (decrease) in cash and cash equivalents (88,629)
Cash and cash equivalents at beginning of the period 584,102
Increase due to inclusion in consolidation 8,441
Cash and cash equivalents at end of the period 503,914
Six Months Ended September 30, 2008(From April 1, 2008
To September 30, 2008)
- 10 -

Nissan Motor Co., Ltd. (7201)Financial Results for the Second Quarter Ended September 30, 2008
(4) Note to going concernNone
(5) Segment information
〔〔〔〔Business segment information〕〕〕〕Six Months Ended September 30, 2008 (From April 1, 2008 To September 30, 2008)FY2008 first quarter (in millions of Yen)
Automobile Sales Financing Total Eliminations Consolidated
(1) Sales to third parties 4,509,209 360,116 4,869,325 - 4,869,325
(2) Inter-group sales 20,770 5,547 26,317 (26,317) -
Total 4,529,979 365,663 4,895,642 (26,317) 4,869,325
139,601 38,480 178,081 13,568 191,649
Current Second Quarter (From July 1, 2008 To September 30, 2008)FY2008 first quarter (in millions of Yen)
Automobile Sales Financing Total Eliminations Consolidated
(1) Sales to third parties 2,338,709 183,365 2,522,074 - 2,522,074
(2) Inter-group sales 11,564 2,488 14,052 (14,052) -
Total 2,350,273 185,853 2,536,126 (14,052) 2,522,074
87,345 17,463 104,808 6,895 111,703
Notes: 1. Businesses are segmented based on their proximity in terms of the type, nature and markets of their products.
2. Main products of each business segment (1) Automobile : passenger cars, trucks, buses, forklifts, manufacturing parts for oversea production, etc. (2) Sales Financing : credit, lease, etc.
3. Changes in significant accounting policies (1) Application of the “Practical Solution on Unification of Accounting Policies Applied to Foreign Subsidiaries for Consolidated Financial Statements” Effective April 1, 2008, the “Practical Solution on Unification of Accounting Policies Applied to Foreign Subsidiaries for Consolidated Financial Statements” (ASBJ Practical Issues Task Force (PITF) No. 18 issued on May 17, 2006) has been adopted. The effect of this change was to decrease net sales for the six months ended September 30, 2008 by 78,004 million yen, but to increase operating income by 342 million yen for the Automobile segment.
(2) Change in presentation of sales incentive As described at “Changes in accounting policies,” effective April 1, 2008, the recording method of the sales incentive for the Company and domestic consolidated subsidiaries has been changed to that in which the sales incentive is deducted from net sales. As a result of this change, net sales for the six months ended September 30, 2008 decreased by 7,524 million yen compared with the previous accounting method.
Operating income
Net sales
Operating income
Effective April 1, 2008, the Company adopted the Accounting Standard for Quarterly Financial Statements (ASBJ Statement No. 12)and the Implementation Guidance for Accounting Standards for Quarterly Financial Statements (ASBJ Guidance No. 14). Theconsolidated financial statements of the Company are prepared in accordance with “Regulations for the Quarterly ConsolidatedFinancial Statements.”
Net sales
- 11 -

Nissan Motor Co., Ltd. (7201)Financial Results for the Second Quarter Ended September 30, 2008〔〔〔〔Consolidated Financial Statements by Business Segment〕〕〕〕
*
*
1) Consolidated Balance sheets by business segment(in millions of Yen)
Automobile & Eliminations Sales financing Consolidated totalas of Sep 30, 2008
as of March 31, 2008
as of Sep 30, 2008
as of March 31, 2008
as of Sep 30, 2008
as of March 31, 2008
Current assets 2,892,874 2,674,578 3,600,887 3,619,646 6,493,761 6,294,224 Cash on hand and in banks 490,395 561,900 9,665 8,325 500,060 570,225 Notes and accounts receivable 764,165 688,104 199 196 764,364 688,300 Sales finance receivables (103,938) (136,871) 3,286,564 3,371,304 3,182,626 3,234,433 Inventories 1,216,567 978,472 29,998 26,693 1,246,565 1,005,165 Other current assets 525,685 582,973 274,461 213,128 800,146 796,101Fixed assets 3,819,810 3,926,906 1,721,404 1,718,352 5,541,214 5,645,258 Property, plant and equipment 2,947,862 3,028,503 1,600,731 1,598,049 4,548,593 4,626,552 Investment securities 447,695 450,776 1,418 1,393 449,113 452,169 Other fixed assets 424,253 447,627 119,255 118,910 543,508 566,537
Total assets 6,712,684 6,601,484 5,322,291 5,337,998 12,034,975 11,939,482Current liabilities 2,143,406 2,162,606 2,905,863 3,080,010 5,049,269 5,242,616 Notes and accounts payable 1,095,442 1,083,524 24,622 35,906 1,120,064 1,119,430 Short-term borrowings 6,796 (170,345) 2,726,135 2,927,372 2,732,931 2,757,027 Lease obligations 67,231 74,827 231 727 67,462 75,554Other current liabilities 973,937 1,174,600 154,875 116,005 1,128,812 1,290,605Long-term liabilities 1,212,735 1,053,753 1,904,921 1,793,670 3,117,656 2,847,423 Bonds 348,216 348,208 466,218 424,517 814,434 772,725 Long-term borrowings 265,934 54,903 1,077,594 995,986 1,343,528 1,050,889 Lease obligations 65,682 85,203 459 186 66,141 85,389Other long-term liabilities 532,903 565,439 360,650 372,981 893,553 938,420
Total liabilities 3,356,141 3,216,359 4,810,784 4,873,680 8,166,925 8,090,039Shareholders' equity 3,434,083 3,368,499 527,080 499,641 3,961,163 3,868,140
Common stock 499,807 511,543 106,007 94,271 605,814 605,814
Capital surplus 773,623 773,623 30,847 30,847 804,470 804,470
Retained earnings 2,430,223 2,352,336 390,226 374,523 2,820,449 2,726,859
Treasury stock (269,570) (269,003) - - (269,570) (269,003)Valuation, translation adjustments and others (422,180) (324,440) (23,024) (38,736) (445,204) (363,176)Translation adjustments (415,951) (412,364) (20,048) (29,456) (435,999) (441,820)Other (6,229) 87,924 (2,976) (9,280) (9,205) 78,644Share subscription rights 1,940 1,714 - - 1,940 1,714Minority interests 342,700 339,352 7,451 3,413 350,151 342,765
Total net assets 3,356,543 3,385,125 511,507 464,318 3,868,050 3,849,443
Total liabilities & net assets 6,712,684 6,601,484 5,322,291 5,337,998 12,034,975 11,939,482
Notes: 1. The sales finance receivables of Automobile & Eliminations represents the amount eliminated for intercompany transactions related to wholesale finance made by the Sales financing segment.
2. The borrowings of Automobile & Eliminations represent the amount after deducting internal loans receivable from the Sales financing segment.
(08/3 900,614 million yen, 08/9 882,716 million yen)
( Interest bearing debt by business segment ) (in millions of Yen)
Automobile & Eliminations Sales financing Consolidated totalas of Sep 30, 2008
as of March 31, 2008
as of Sep 30, 2008
as of March 31, 2008
as of Sep 30, 2008
as of March 31, 2008
811,421 688,152 1,921,510 2,068,875 2,732,931 2,757,027
(804,625) (858,497) 804,625 858,497 - -
6,796 (170,345) 2,726,135 2,927,372 2,732,931 2,757,027
348,216 348,208 466,218 424,517 814,434 772,725
344,025 97,020 999,503 953,869 1,343,528 1,050,889
(78,091) (42,117) 78,091 42,117 - -
265,934 54,903 1,077,594 995,986 1,343,528 1,050,889
132,913 160,030 690 913 133,603 160,943
407 1,935 (407) (1,935) - -
754,266 394,731 4,270,230 4,346,853 5,024,496 4,741,584
488,141 574,963 15,773 9,139 503,914 584,102
266,125 (180,232) 4,254,457 4,337,714 4,520,582 4,157,482
The financial data on Automobile & Eliminations represent the differences between the consolidated figures and those for the Sales financing segment.
Long-term borrowings (per B/S)
Long-term borrowings from Third Parties
The sales financing segment consists of Nissan Financial Services Co., Ltd. (Japan), Nissan Motor Acceptance Corporation (USA), NR Finance Mexico S.A de C.V, SOFOM E.N.R(Mexico) and other 7 companies, totaling 10 companies, and the sales finance operations of Nissan Canada Inc. (Canada).
Short-term borrowings from Third Parties
Internal Loans to Sales Financing
Short-term borrowings (per B/S)
Bonds and debentures
Internal Loans to Sales Financing
Net interest bearing debt
Cash and cash equivalent
Lease obligations
Internal Loans from Sales Financing
Total interest bearing debt
- 12 -

Nissan Motor Co., Ltd. (7201)Financial Results for the Second Quarter Ended September 30, 2008
2) Consolidated Statements of income by business segment(in millions of Yen)
Six Months Ended September 30, 2008
Automobile & Eliminations Sales financing Consolidated total
Net sales 4,503,662 365,663 4,869,325
Cost of sales 3,656,911 268,398 3,925,309Gross profit 846,751 97,265 944,016Operating income as a percentage of net sales 3.4% 10.5% 3.9%
Operating income 153,169 38,480 191,649 Financial income/expenses, net (2,324) 101 (2,223) Other non-operating income and expenses, net 14,314 (992) 13,322
Ordinary income 165,159 37,589 202,748Income before income taxes and minority interests 132,743 36,587 169,330
Net income 106,631 19,713 126,344
3) Consolidated Statements of cash flows by business segment(in millions of Yen)
Six Months Ended September 30, 2008
Automobile & Eliminations Sales financing Consolidated total
Operating activitiesIncome before income taxes and minority interests 132,743 36,587 169,330Depreciation and amortization 229,741 170,709 400,450Decrease (increase) in sales finance receivables (32,931) 137,236 104,305Others (437,008) 29,541 (407,467)
Subtotal (107,455) 374,073 266,618
Investing activitiesProceeds from sales of investment securities 942 - 942Proceeds from sales of fixed assets 30,856 131 30,987Purchases of fixed assets (216,927) (6,215) (223,142)Purchases of leased vehicles (3,263) (420,954) (424,217)Proceeds from sales of leased vehicles 746 218,236 218,982 Others (28,393) 11,449 (16,944)
Subtotal (216,039) (197,353) (413,392)
Financing activitiesNet increase (decrease) in short-term borrowings 207,474 (181,614) 25,860Net changes in long-term borrowings and redemption of bonds 149,610 (68,134) 81,476Proceeds from issuance of bonds - 73,336 73,336Others (127,665) 891 (126,774)
Subtotal 229,419 (175,521) 53,898
Effect of exchange rate changes on cash and cash equivalents 4,866 (619) 4,247
Increase (decrease) in cash and cash equivalents (89,209) 580 (88,629)Cash and cash equivalent at beginning of the period 574,963 9,139 584,102
Increase due to inclusion in consolidation 2,387 6,054 8,441
Cash and cash equivalents at end of the period 488,141 15,773 503,914Notes: 1. The net increase (decrease) in short-term borrowings of Automobile & Eliminations includes the amount of 89,222 million yen eliminated for decrease in internal loans receivable from the Sales financing segment. 2. The net change in long-term borrowings and redemption of bonds of Automobile & Eliminations includes the amount of 45,102 million yen eliminated for increase in internal loans receivable from the Sales financing segment.
(From April 1, 2008 To September 30, 2008)
(From April 1, 2008 To September 30, 2008)
- 13 -

Nissan Motor Co., Ltd. (7201)Financial Results for the Second Quarter Ended September 30, 2008
〔〔〔〔Geographical segment information〕〕〕〕Six Months Ended September 30, 2008 (From April 1, 2008 To September 30, 2008)
(in millions of Yen)
Japan North America Europe Other foreigncountries Total Eliminations Consolidated
(1) Sales to third parties 1,181,084 1,822,367 915,612 950,262 4,869,325 - 4,869,325
(2) Inter-group sales 1,265,219 95,891 79,848 52,957 1,493,915 (1,493,915) -
Total 2,446,303 1,918,258 995,460 1,003,219 6,363,240 (1,493,915) 4,869,325
74,026 19,862 32,198 54,511 180,597 11,052 191,649
Current Second Quarter (From July 1, 2008 To September 30, 2008)(in millions of Yen)
Japan North America Europe Other foreigncountries Total Eliminations Consolidated
(1) Sales to third parties 600,923 962,788 457,503 500,860 2,522,074 - 2,522,074
(2) Inter-group sales 672,151 48,372 37,903 31,813 790,239 (790,239) -
Total 1,273,074 1,011,160 495,406 532,673 3,312,313 (790,239) 2,522,074
45,750 9,764 21,240 31,547 108,301 3,402 111,703
Notes: 1. Countries and areas are segmented based on their geographical proximity and their mutual operational relationship.
2. Major countries and areas which belong to segments other than Japan are as follows: (1) North America : The United States of America, Canada, and Mexico (2) Europe : France, The United Kingdom, Spain and other European countries (3) Other foreign countries : Asia, Oceania, the Middle East, Central and South America excluding Mexico, and South Africa
3. Changes in significant accounting policies (1) Application of the “Practical Solution on Unification of Accounting Policies Applied to Foreign Subsidiaries for Consolidated Financial Statements” Effective April 1, 2008, the “Practical Solution on Unification of Accounting Policies Applied to Foreign Subsidiaries for Consolidated Financial Statements” (ASBJ Practical Issues Task Force (PITF) No. 18 issued on May 17, 2006) has been adopted. The effect of this change was to decrease net sales by 66,581 million yen for Europe and 11,423 million yen for other foreign countries, for the six months ended September 30, 2008. This change also brought increases in operating income of 679 million yen for Europe and 750 million yen for elimination, and decreases in operating income of 618 million yen for North America and 469 million yen for other foreign countries, for the six months ended September 30, 2008.
(2) Change in presentation of sales incentive As described at “Changes in accounting policies,” effective April 1, 2008, the recording method of the sales incentive for the Company and domestic consolidated subsidiaries has been changed to that in which the sales incentive is deducted from net sales. As a result of this change, net sales for Japan for the six months ended September 30, 2008 decreased by 7,524 million yen compared with the previous accounting method.
Net sales
Operating income
Net sales
Operating income
- 14 -

Nissan Motor Co., Ltd. (7201)Financial Results for the Second Quarter Ended September 30, 2008
〔〔〔〔Overseas Net Sales〕〕〕〕Six Months Ended September 30, 2008 (From April 1, 2008 To September 30, 2008)
(in millions of Yen)
North America Europe Other foreigncountries Total
(1) Overseas net sales1,755,983 932,321 1,165,185 3,853,489
(2) Consolidated net sales- - - 4,869,325
36.1 19.1 23.9 79.1
Current Second Quarter (From July 1, 2008 To September 30, 2008)(in millions of Yen)
North America Europe Other foreigncountries Total
(1) Overseas net sales924,490 465,181 615,828 2,005,499
(2) Consolidated net sales- - - 2,522,074
36.7 18.4 24.4 79.5
Notes: 1. Overseas net sales include export sales of the Company and its domestic consolidated subsidiaries and sales (other than exports to Japan) of its foreign consolidated subsidiaries.
2. Countries and areas are segmented based on their geographical proximity and their mutual operational relationship.
3. Major countries and areas which belong to segments other than Japan are as follows: (1) North America : The United States of America, Canada, and Mexico
(2) Europe : France, The United Kingdom, Spain and other European countries (3) Other foreign countries : Asia, Oceania, the Middle East, Central and South America excluding Mexico, and South Africa
4. Change in significant accounting policies Application of the “Practical Solution on Unification of Accounting Policies Applied to Foreign Subsidiaries for Consolidated Financial Statements” Effective April 1, 2008, the “Practical Solution on Unification of Accounting Policies Applied to Foreign Subsidiaries for Consolidated Financial Statements” (ASBJ Practical Issues Task Force (PITF) No. 18 issued on May 17, 2006) has been adopted. The effect of this change was to decrease overseas net sales by 66,581 million yen for Europe and 11,423 million yen for other foreign countries, for the six months ended September 30, 2008.
(6) Note to significant changes in shareholders' equity
None
(3) Overseas net sales as a percentage of consolidated net sales (%)
(3) Overseas net sales as a percentage of consolidated net sales (%)
- 15 -

Nissan Motor Co., Ltd. (7201)Financial Results for the Second Quarter Ended September 30, 2008
(7) Production and sales
1) Consolidated production volumeThe six-month period ended September 30, 2008 (Units)
FY2008Six Months Ended September 30, 2008
(From April 1, 2008 To September 30, 2008)
Japan 649,798
U.S.A. 287,121
Mexico 249,742
U.K. 211,855
Spain 87,571
South Africa 13,848
Indonesia 16,607
Thailand 33,640
China 194,787
Brazil 2,318
Total 1,747,287
The three-month period ended September 30, 2008 (Units)FY2008
Current Second Quarter(From July 1, 2008 To September 30, 2008)
Japan 331,855
U.S.A. 140,953
Mexico 123,570
U.K. 106,922
Spain 36,608
South Africa 7,262
Indonesia 8,950
Thailand 16,106
China 104,211
Brazil 971
Total 877,408
- 16 -

Nissan Motor Co., Ltd. (7201)Financial Results for the Second Quarter Ended September 30, 2008
2) Consolidated sales volume by regionThe six-month period ended September 30, 2008 (Units)
FY2008Six Months Ended September 30, 2008
(From April 1, 2008 To September 30, 2008)
Japan 302,734
North America 609,396
Europe 323,327
Others 536,389
Total 1,771,846
The three-month period ended September 30, 2008 (Units)FY2008
Current Second Quarter(From July 1, 2008 To September 30, 2008)
Japan 156,495
North America 322,863
Europe 161,305
Others 286,257
Total 926,920
- 17 -

Nissan Motor Co., Ltd. (7201)Financial Results for the Second Quarter Ended September 30, 2008
【【【【Reference】】】】
(1) Semi-Annual Consolidated Statements of Income
The six-month period ended September 30, 2007 (in millions of Yen)FY2007First half
(from April 1, 2007 to September 30, 2007)
100%
NET SALES 5,064,495
COST OF SALES 3,917,006
22.7%
Gross profit 1,147,489
SELLING, GENERAL AND ADMINISTRATIVE EXPENSES 780,343
7.2%
Operating income 367,146
NON-OPERATING INCOME 37,306
Interest and dividend income 12,658
Equity in earnings of unconsolidated subsidiaries & affiliates 17,806
Other 6,842
NON-OPERATING EXPENSES 44,151
Interest expense 17,887
Amortization of net retirement benefit obligation at transition 5,448
Foreign exchange loss 7,145
Other 13,671
7.1%
Ordinary income 360,301
SPECIAL GAINS 22,994
SPECIAL LOSSES 42,737
6.7%
Income before income taxes and minority interests 340,558
INCOME TAXES-CURRENT 64,351
INCOME TAXES-DEFERRED
57,905
MINORITY INTERESTS 5,883
4.2%
NET INCOME 212,419
- 18 -

Nissan Motor Co., Ltd. (7201)Financial Results for the Second Quarter Ended September 30, 2008
The three-month period ended September 30, 2007 (in millions of Yen)FY2007
Second quarter(from July 1, 2007 to September 30, 2007)
100%
NET SALES 2,618,009
COST OF SALES 2,002,11823.5%
Gross profit 615,891
SELLING, GENERAL AND ADMINISTRATIVE EXPENSES 397,184
8.4%
Operating income 218,707
NON-OPERATING INCOME 17,526
Interest and dividend income 6,003
Equity in earnings of unconsolidated subsidiaries & affiliates 8,509
Other 3,014
NON-OPERATING EXPENSES 27,215
Interest expense 9,736
Amortization of net retirement benefit obligation at transition 2,723
Foreign exchange loss 5,155
Other 9,601
8.0%
Ordinary income 209,018
SPECIAL GAINS 5,729
SPECIAL LOSSES 22,632
7.3% Income before income taxes and minority interests 192,115
INCOME TAXES 70,327
MINORITY INTERESTS 1,674
4.6% NET INCOME 120,114
- 19 -

Nissan Motor Co., Ltd. (7201)Financial Results for the Second Quarter Ended September 30, 2008
(2) Consolidated Statements of Cash Flows
(in millions of Yen)
FY2007First half
(from April 1, 2007 to September 30, 2007)
Operating activitiesIncome before income taxes and minority interests 340,558 Depreciation and amortization 409,972 Impairment loss 4,100 Reversal of Provision for doubtful receivables (1,410) Unrealized loss on investments 259 Interest and dividend income (12,658) Interest expense 82,692 Gain on sales of property, plant and equipment (16,624) Loss on disposal of fixed assets 7,448 Gain on sales of investment securities (2,505) Increase in trade receivables (95,357) Decrease in finance receivables 87,825 Increase in inventories (118,669) Decrease in trade payables (4,311) Amortization of net retirement benefit obligation at transition 5,448 Retirement benefit expenses 25,766 Payments related to retirement benefits (25,280) Other (18,767)
Sub-total 668,487 Interest and dividends received 12,504 Interest paid (81,315) Income taxes paid (81,649)
Total 518,027
Investing activitiesIncrease in short-term investments (980) Purchases of fixed assets (246,201) Proceeds from sales of property, plant and equipment 41,425 Purchases of leased vehicles (461,310) Proceeds from sales of leased vehicles 215,504 Long-term loans made (6,814) Collection of long-term loans receivable 3,940 Purchases of investment securities (19,077) Proceeds from sales of investment securities 2,118 Proceeds from sales of subsidiaries' shares resulting in changes in scope of consolidation 1,664 Other 13,937
Total (455,794)
Financing activitiesDecrease in short-term borrowings (35,850) Increase in long-term borrowings 382,595 Increase in bonds and debentures 193,535 Repayment of long-term borrowings (474,506) Redemption of bonds and debentures (34,571) Purchases of treasury stock (41,939) Proceeds from sales of treasury stock 12,066 Repayment of lease obligations (30,990) Cash dividends paid (69,921) Cash dividends paid to minority shareholders (3,792) Other 7
Total (103,366) Effect of exchange rate changes on cash and cash equivalents 8,797 Decrease in cash and cash equivalents (32,336) Cash and cash equivalent at beginning of the period 469,388 Increase due to inclusion in consolidation 27 Cash and cash equivalent at end of the period 437,079
- 20 -

Nissan Motor Co., Ltd. (7201)Financial Results for the Second Quarter Ended September 30, 2008
(3) Segment information
〔〔〔〔Business segment information〕〕〕〕
Fiscal year 2007 first half (in millions of Yen)
Automobile Sales Financing Total Eliminations Consolidated
(1) Sales to third parties 4,687,287 377,208 5,064,495 - 5,064,495
(2) Inter-group sales 17,018 4,459 21,477 (21,477) -
Total 4,704,305 381,667 5,085,972 (21,477) 5,064,495
295,660 43,789 339,449 27,697 367,146
The three-month period ended September 30, 2007 (in millions of Yen)
Automobile Sales Financing Total Eliminations Consolidated
(1) Sales to third parties 2,428,245 189,764 2,618,009 - 2,618,009
(2) Inter-group sales 7,397 2,029 9,426 (9,426) -
Total 2,435,642 191,793 2,627,435 (9,426) 2,618,009
181,643 22,447 204,090 14,617 218,707
Note: 1. Businesses are segmented based on their proximity in terms of types, nature and markets of their products2. Major products and services included in each segment are; (1) Automobile : Passenger cars, Light trucks and buses, forklift, parts for production in overseas countries, etc (2) Sales Financing : Credit, lease, etc.
Net sales
Operating income
Net sales
Operating income
- 21 -

Nissan Motor Co., Ltd. (7201)Financial Results for the Second Quarter Ended September 30, 2008
〔〔〔〔Geographical segment information〕〕〕〕
Fiscal year 2007 first half (in millions of Yen)
Japan North America Europe Other foreigncountries Total Eliminations Consolidated
(1) Sales to third parties 1,152,460 2,135,675 973,284 803,076 5,064,495 - 5,064,495
(2) Inter-group sales 1,097,883 104,539 108,517 20,372 1,331,311 (1,331,311) -
Total 2,250,343 2,240,214 1,081,801 823,448 6,395,806 (1,331,311) 5,064,495
121,245 166,130 39,756 38,178 365,309 1,837 367,146
The three-month period ended September 30, 2007 (in millions of Yen)
Japan North America Europe Other foreigncountries Total Eliminations Consolidated
(1) Sales to third parties 612,723 1,083,717 497,349 424,220 2,618,009 - 2,618,009
(2) Inter-group sales 589,425 64,889 53,894 12,353 720,561 (720,561) -
Total 1,202,148 1,148,606 551,243 436,573 3,338,570 (720,561) 2,618,009
72,577 89,401 34,601 21,496 218,075 632 218,707
Note: 1. Countries and areas are segmented based on their geographical proximity and their mutual operational relationship.2. Major countries and areas which belong to segments other than Japan are as follows: (1) North America : U.S.A., Canada and Mexico (2) Europe : France, U.K., Spain and other European countries (3) Others : Asia, Oceania, the Middle East, Central and South America excluding Mexico
and South Africa
Operating income
Net sales
Net sales
Operating income
- 22 -

Nissan Motor Co., Ltd. (7201)Financial Results for the Second Quarter Ended September 30, 2008
〔〔〔〔Overseas Net Sales〕〕〕〕
Fiscal year 2007 first half (in millions of Yen)
North America Europe Other foreigncountries Total
(1) Overseas net sales 2,079,036 974,334 1,005,402 4,058,772
(2) Consolidated net sales - - - 5,064,495
(3) Overseas net sales as a percentage of consolidated net sales (%) 41.1 19.2 19.9 80.1
The three-month period ended September 30, 2007 (in millions of Yen)
North America Europe Other foreigncountries Total
(1) Overseas net sales 1,058,719 496,688 525,454 2,080,861
(2) Consolidated net sales - - - 2,618,009
(3) Overseas net sales as a percentage of consolidated net sales (%) 40.4 19.0 20.1 79.5
Note: 1. Overseas net sales include export sales of the Company and its domestic consolidated subsidiaries and sales
(other than exports to Japan) of its foreign consolidated subsidiaries.
2. Countries and areas are segmented based on their geographical proximity and their mutual operational relationship. 3. Areas which belong to segments other than Japan are as follows: (1) North America : USA, Canada and Mexico (2) Europe : France, U.K., Spain, and other European countries (3) Other foreign countries : Asia, Oceania, the Middle East, Central and South America
excluding Mexico and South Africa
- 23 -

Nissan Motor Co., Ltd. (7201)Financial Results for the Second Quarter Ended September 30, 2008
(4) Consolidated sales volume
Consolidated sales volume by region Fiscal year 2007 first half (Units)
FY2007First half
(from April 1, 2007 to September 30, 2007)
Japan 318,186
North America 622,463
Europe 315,784
Others 421,025
Total 1,677,458
The three-month period ended September 30, 2007 (Units)
FY2007Second quarter
(from July 1, 2007 to September 30, 2007)
Japan 170,833
North America 319,837
Europe 161,093
Others 222,688
Total 874,451
- 24 -