Embed Size (px)
Citation preview

ORIGINAL ARTICLE Open Access
Financial performance of shipping firmsthat increase LNG carriers and the supportof eco-innovationKian-Guan Lim* and Michelle Lim
* Correspondence: [email protected] Kong Chian School of Business,Singapore Management University,50 Stamford Road, Singapore178899, Singapore
Abstract
The technology to liquefy natural gas for transport to countries worldwide and theincreasing use of natural gas as a cleaner fossil fuel for industry and householdmeant that the supply of liquified natural gas (LNG) worldwide is a profitable trend.Shipping companies can strategically choose to diversify into LNG fleet to grasp thistrend. By supplying more LNG shipping capacities, the greater availability of LNGworldwide, as a source of marine fuel and as a source of cleaner energy in replacingcoal and oil, is supporting eco-innovation. In this paper, we investigate threeeconomic and financial benefits to a shipping firm that diversified into liquefiednatural gas (LNG) shipping, namely firm profitability performance, firm efficiency, andstock return performance. We also investigate if there is an early mover advantage indoing so. Our empirical findings indicate that fleet diversification into LNG carriersresulted in higher profitability and better operational efficiency. For the listedshipping firms, their stock returns increased with diversified exposures to the LNGbusiness. There is some evidence of higher profitability in the early mover advantage.Firms that originated in LNG business also benefited when there was diversificationinto the non-LNG business.
Keywords: Liquefied natural gas carriers, Shipping financial performance, Shippingstock performance
IntroductionIn the past, the transport of natural gas was limited to the availability of pipelines. The
lack of available technology allowing its carriage by sea prevented the utilisation of nat-
ural gas in the most diverse consumer and industrial markets. However, when the
technology allowing the liquefaction of the natural gas emerged, the transport of nat-
ural gas became possible by sea, and a new (and specific) shipping sector, similar to
the crude oil tanker market, emerged. Natural gas, or more precisely, liquefied natural
gas (LNG) became an internationally traded commodity.
The demand for LNG has been increasing over the years. In 2019, the global LNG
market demand accounted for 356.06 million tons, and a compound annual growth
rate (CAGR) of 5.8% is expected to occur from 2020 until 2027 (GrandViewResearch
© The Author(s). 2020 Open Access This article is licensed under a Creative Commons Attribution 4.0 International License, whichpermits use, sharing, adaptation, distribution and reproduction in any medium or format, as long as you give appropriate credit to theoriginal author(s) and the source, provide a link to the Creative Commons licence, and indicate if changes were made. The images orother third party material in this article are included in the article's Creative Commons licence, unless indicated otherwise in a creditline to the material. If material is not included in the article's Creative Commons licence and your intended use is not permitted bystatutory regulation or exceeds the permitted use, you will need to obtain permission directly from the copyright holder. To view acopy of this licence, visit http://creativecommons.org/licenses/by/4.0/.
Journal of Shipping and Trade
Lim and Lim Journal of Shipping and Trade (2020) 5:23 https://doi.org/10.1186/s41072-020-00080-0
2019). The new infrastructure and production projects that are expected to be imple-
mented and the LNG market applicability are some of the drivers promoting the
growth mentioned above. Recently, natural gas demand has increased sharply in Asia,
and the output in the United States (US) has soared with the drilling for shale oil and
gas. GrandViewResearch (2019) claims that in 2019, the Asia Pacific region accounted
for the largest revenue share of 41.3%, where Australia plays a vital role as a global
LNG exporter with projects located in Queensland and Western Australia.
LNG is used as a transport fuel, in electricity and power generation, heating, cooking,
mining, as well as in many industrial applications, which means that it can replace
crude oil in several applications. Moreover, LNG is seen as a cleaner source of energy
in replacing or else supplementing coal and oil. Although LNG is extracted in conjunc-
tion with crude oil, it is the least polluting fossil energy and is an energy source that
complements the efforts toward building alternative renewable energies. “Over the past
15 years, power grids in developed economies have become more decarbonised than ever,
replacing ageing facilities’ technologies with ever-more affordable natural gas and re-
newable power generation”, a trend highlighted by Browning (2019). Such a growing
commodity market creates business opportunities that firms want to grasp. However,
how these firms (including shipping companies) enter the market to grasp these oppor-
tunities depends upon their strategic plans and investment portfolio. For instance, Ans-
off (1957) identified 4 possible growth strategies, namely market penetration, product
development, market development and diversification, where the least risky is market
penetration, and the riskiest is diversification.
Diversification has been a strategy adopted by shipping companies, among many
other possible strategies (differentiation, concentration, alliances, specialisation and cost
leadership) as identified by Niamié and Germain (2014). The shipping industry is a
major provider of transport for coal, crude oil, and gas from exporting energy fields
and plants to importing countries and consumers worldwide. All three energy sources
have different demand and supply channels and face different, although correlated mar-
ket and economic factors. Shipping companies have used diversification as a risk man-
agement strategy to smooth out any unsystematic risks that affect a portfolio where the
positive performance investments limit the impact caused by the negative performance
ones. Despite this, Hand (2015) states that diversification is only good “if companies
understand the reasons why they are doing it and the risks involved”.
Diversification can also be seen as an opportunity to support technological change.
Shipping firms, by 1) introducing LNG capacity into their fleets and 2) expanding their
LNG transport capacity in terms of gross tonnages, are strategically reducing their risk
exposures to profit fluctuations in the short-term as well as securing their long-term
viability as the world seeks gas technology amongst the alternative energy sources for a
sustainable future. Diversification by shipping companies into LNG carriers implies that
more LNG would be supplied worldwide. Furthermore, the LNG usage would be
greatly encouraged with increased supply to meet the globally rising demand, and the
greater LNG supply would facilitate its usage as a source of energy for marine trans-
port. Therefore, the worldwide availability of LNG would promote eco-innovation and
technology development in the power, industry, and consumer household sectors. Be-
sides, the wider use of LNG would help reduce carbon emissions due to the burning of
other fossil fuels. In this regard, the Boston Consulting Group Report (2020) presents
Lim and Lim Journal of Shipping and Trade (2020) 5:23 Page 2 of 25
more detailed information about the various eco-innovations, including microgrid and
other distributed energy systems.
Currently, for economic reasons, the majority of the world’s maritime traffic consists
of vessels with diesel engines powered by heavy fuel oil (HFO). The burning process of
marine diesel engines can cause HFO to emit air pollutants. Examples are nitrogen ox-
ides (NOx), sulphur oxides (SOx), carbon monoxide (CO) and carbon dioxide (CO2)
because HFO contains high levels of asphalt, carbon residues, sulphur, and metallic
compounds among other undesirable characteristics. In this regard, George Prokopiou,
cited in Paris (2019), acknowledges that shipping must look at LNG since it will come
up as a solution during a transitional period until cleaner forms of energy are devel-
oped. By using LNG to power ships, instead of HFO or the lighter marine gasoil, the
shipping industry can reduce the level of polluting emissions of nitrogen oxides and
sulphur oxides by 90 to 95%, according to industry estimates (Saul and Chestney 2018).
Its use will support the implementation of the 2020 International Maritime
Organization rules that ban ships from using fuels with a sulfur content above 0.5% un-
less they are equipped with scrubbers. Concerning this issue, Bakkhali and Ziomas
(2019) present the trend of more LNG usages to power ships, including the building of
bunkering facilities for LNG; as a result, the newer LNG carriers will also be powered
by LNG fuel.
Apart from the environmental benefits (Elengy 2013; LNGMasterPlan 2018), LNG
also presents safety and economic benefits. From a safety perspective, gasoline and
diesel can combust in the presence of ignition sources with lower temperatures and be
potentially flammable when concentrations amount up to 60% in the air, while LNG
combustion occurs in the presence of an ignition source above 537,77 °C (LNGMaster-
Plan 2018). From an economic perspective, LNGMasterPlan goes on claiming that the
use of LNG results in substantial economic savings even as new technologies are intro-
duced in the production of LNG. However, these cost savings can also occur with its
use; for instance, when carrying out a power generation study, Tahara et al. (1997)
showed that cost savings occur when more eco-friendly fuels such as natural gas are
used. Furthermore, the use of LNG reduces fleet operational costs (Burel et al. 2013;
Yoo 2017).
Diversification of shipping companies into the LNG shipping market is not new;
some shipping firms have switched to transporting more LNG as they expand or renew
their cargo carriers. Indeed the traditionally strong and experienced Greek and Danish
ship owners in dry bulk and crude oil tanker businesses have diversified and entered
into owning LNG fleet. This is the case of the Marinakis Group, Minerva Maritime,
TMS Cardiff, Alpha Gas, Thenamaris, Capital Maritime & Trading or Celsius Shipping
in partnership with Odfjell Tankers which have diversified into the LNG market. Ship-
ping companies make a capital investment in building or acquiring LNG carriers as an
investment decision, even though they could also add additional tankers to carry crude
oil and dry bulk carriers to their fleet. This economic and financial decision has to do
with short-term expected profitability as well as long-time sustainability of the shipping
profits and businesses. This is highlighted by Ubmemea (2014) who reported that NYK,
in the presence of low rates and high competition in the container shipping market
invested aggressively in LNG carriers and shuttle tankers in order to take advantage
from the stronger markets and stable earnings derived from long term contracts.
Lim and Lim Journal of Shipping and Trade (2020) 5:23 Page 3 of 25
Literature review
Diversification in the shipping industry has been the focus of the research community.
The work performed by Magirou et al. (1997) is one of the earliest studies to empiric-
ally examine the improvement to firm value via portfolio risk reduction of operating di-
verse shipping vessels. Tsolakis (2005) highlighted the shortcoming of using income
correlation as markets may diverge considerably in the short-run and found that risk
reduction benefits in bulk shipping decreased when investment involved more than five
different ship types or sizes. Similarly using freight rates proxying for vessel incomes,
Koseoglu and Karagulle (2013) studied risk reduction in fleet portfolio diversification
over tankers and dry bulkers between 2002 and 2011. Koseoglu and Karagulle found
that companies which focused on up to four vessel types had some success whereas
those that diversified over more vessel types did not achieve risk reduction. Koseoglu
and Karagulle also found that constructing a vessel portfolio that included only dry
bulkers did not lead to any risk reduction benefits. D’agostini et al. (2019) studied di-
versification in the liner shipping sector. As far as we know, all existing econometric
studies of vessel diversification did not include the LNG fleet. Many studies in shipping
finance have focused on dry bulk carriers, oil tanker fleets, and liners, as well as other
issues in shipping derivatives (Alexandridis et al. 2018; Kavussanos and Visvikis 2016).
The growing importance of LNG shipping in the last decade or more is a long-term
strategic imperative for most ship owners (Schaefer 2012). The increase in the fleet ton-
nages of LNG carriers relative to heavy fuel tanker ships is an environmentally positive
move supporting eco-innovation, even though at the end of 2019, the LNG fleet con-
sisted of 541 active vessels only, out of which 92% of the LNG carriers use boil-off gas
as fuel (International Gas Union 2020). The increasing number of LNG carriers to
enter the market is expected to contribute to higher usages of LNG or liquid gas for
marine propulsion systems. Diversifying into new businesses taking into account eco-
innovation philosophies is a crucial subject confronting decision-making by chief ex-
ecutive officers (CEOs) of shipping firms in charting the strategic direction of their
shipping business given the nature of the investments being performed.
In this paper, we analyse the outcomes of diversification of shipping firms into the
LNG market. We also study the comparative performance of shipping firms that origi-
nated in the LNG business and might have either stayed focused in LNG business or
have diversified away into non-LNG tanker fleet since this is a financial market issue
on the diversification outcomes. Thus, this paper on LNG diversification should make
an interesting contribution to the body of literature. The paper is organised as follows.
In Section The concept of eco-innovation, we present the concept of eco-innovation as
a driver for diversification. In Section Research hypotheses, we discuss the 3 hypoth-
eses. Section Data elaborates on the data employed in this study. Section Methods and
empirical results contains a discussion of the methodology and reports the empirical
results and Section Conclusions concludes.
The concept of eco-innovationEco-innovation is about new products and processes which benefit the environment
and contribute to environmental sustainability (Rennings and Zwick 2002). Investment
in eco-innovation activities tends to improve the use of resources, leading to cost sav-
ings for firms (Triguero et al. 2013). The introduction of LNG carriers may more
Lim and Lim Journal of Shipping and Trade (2020) 5:23 Page 4 of 25
readily help shipowners to comply with the new International Maritime Organisation
(IMO) environmental regulations on emissions, and may also improve the financial
performance of the firms. A key deciding factor for the adoption of such investments
on innovation or to support innovation is often its impact on the financial profitability
of a firm (Fokkema et al. 2017). Hence we study the impact of acquiring LNG carriers
on shipping firm profitability.
Eco-innovation distinguishes itself from generic innovation based on its two attri-
butes. Firstly, it considers any innovation that focuses on reducing environmental im-
pact, regardless of the motivation underlying such an outcome. Secondly, eco-
innovation in large part has to do with environmental issues and sustainability. In tack-
ling grave environment problems, fundament shifts on how society functions are re-
quired and these involve also innovations in social and institutional structures as
indicated in the OECD (2009) study. There is extant literature on the drivers of eco-
innovation such as environmental regulation, organisational capabilities and customer
requirements (Horbach 2008; Kesidou and Demirel 2012; and Cai and Zhou 2014). For
instance, Horbach et al. (2012) investigated the determinants of different environmental
innovations of various technological fields. They found a strong relationship between
environmental regulation and eco-innovation aimed at reducing air, water and noise
emissions. However, the eco-innovation literature has placed much emphasis on identi-
fying the drivers of eco-innovation by firms; in contrast, little attention has been given
to the effect of eco-innovation on the financial performance of firms (Marin 2014).
Horbach (2008) used German data sources to show that technological capabilities by
research and development (R&D) triggered eco-innovation, which has been encouraged
by environmental regulation. Kesidou and Demirel (2012) performed an empirical ana-
lysis of British firms and found that the stringency of environmental regulation affected
eco-innovation. The study by Marin (2014) using Italian manufacturing firms went be-
yond the evaluation of drivers to focus on productivity issues.
Kesidou and Demirel (2012) showed that the focus of environmental economics re-
search has shifted from the effectiveness of policy measures to the role that environ-
mental regulation plays in encouraging eco-innovation. The authors added that more
stringent environmental regulation stimulates eco-innovation, which is the case of the
shipping industry. The IMO has imposed ever stricter emission regulations to reduce
sulphur and nitrogen oxides emitted by vessels in recent years. The IMO uses the
MARPOL (International Convention for the Prevention of Pollution from Ships) frame-
work to introduce limits on NOx and SOx emissions both in international waters and
emission control areas (ECA), where emission limits are more stringent. For example,
MARPOL initiates ship emissions standards that reduce both sulphur and nitrogen
emissions rates by approximately 80% globally, and greater than 90% in ECA along the
US and European coasts (Thomson et al. 2015).
In light of the above paragraphs, and as discussed earlier, diversification can be seen
as an opportunity to support technological change. Just as environmental regulations
are drivers for eco-innovations, eco-innovation is a driver for strategic diversification by
shipping firms into expanding LNG shipping capacities. By studying the financial and
operational performances of shipping firms that diversify to LNG and expand their
LNG fleet and capacities, this study can inform not only about the outcomes of fleet di-
versification into the LNG shipping business but also if eco-innovation philosophies
Lim and Lim Journal of Shipping and Trade (2020) 5:23 Page 5 of 25
that have been reported as crucial to strategic investments of shipping firms are indeed
valuable to the firms.
Research hypothesesGenerally, the literature relevant to the economic assessment of LNG has either fo-
cused on a specific ship type or analysed fuel costs outside the context of firm-level
and firm performance data. In practice, firms may own various types of vessels; most
shipping companies carry coal in dry bulk carriers, crude oil in oil tankers, and LNG in
LNG carriers all at the same time in their business. Considering the fleet composition
is imperative because for a firm to embark on an eco-innovation strategy, there is an
atypically switch from an existing pool of heavy liquid-fuel powered carriers and oil
tankers to one that includes newer LNG powered engines and LNG carriers. Our ap-
proach in this investigation draws upon a wide range of literature by using insights
from the eco-innovation literature on firm capabilities, the ecological economics litera-
ture on environmental regulation, the energy literature on marine fuel, the transporta-
tion literature on LNG, the strategic management literature on corporate social
responsibility (CSR), as well as the financial management literature on socially respon-
sible investing (SRI).
Therefore, the paper considers four benefits that potentially arise from eco-
innovation: (1) firm performance, (2) firm efficiency, (3) stock performance and (4)
early mover advantage, where (3) is closely related to (1) and (2). Concerning firm per-
formance, firm efficiency and stock performance, we study the relationship between the
support of eco-innovation and potential benefit by performing fixed-effects panel data
regressions on profitability, efficiency and stock returns. Concerning the early adoption
of the switch to LNG carriers by shipping firms, we performed regressions to test the
effect of the time span of the adoption on profitability and efficiency. The current sec-
tion presents the four research hypotheses employed in this study.
Firm profitability performance
After having reached an average of $155,000/day in 2012, the LNG freight rates fell
dramatically until January 2015 ($24,500/day), and increased significantly from 2015
onwards to late 2018 reaching a freight above $160,000/day, due to increased demand
for LNG in Asia and also due to the lower vessel availability. These changes in freight
rates are reported in sources such as S&P Global Platts LNG Special Report ( 2018).
However, as the LNG fleet order book and future delivery will increase capacity, the fu-
ture rates are expected to be volatile depending upon how the equation of demand and
supply is behaving when the new capacity is added to the existing fleet. At the same
time, in 2012, after reaching an average of $25,000/day, crude oil tanker freight rates
took a hit in 2016 (around $48,000/day) and dived low during the low oil price slump
period of 2016 until the end of 2018 (Sand 2018). An insight into the freight rates gath-
ered shows that both markets are cyclical. The data indicate that, especially between
2015 and 2018, there are periods where LNG and crude oil tanker freight rates are
negatively correlated (i.e. the business cycles differ). The same data also suggest, that
during such periods, shipping firms might have benefitted from a diversified fleet with
both LNG and dirty tankers to reduce the risks of low profits or even losses due to
Lim and Lim Journal of Shipping and Trade (2020) 5:23 Page 6 of 25
poor take-up rate in their fleet usages, even though this risk reduction might depend
on the actual composition of the fleet, i.e. ratio of tankers relative to LNG carriers, at
each step of the cycle.
Therefore, based on rational decision-making, even with deterrence by entrenched in-
cumbent LNG firms, firms making strategic diversification into LNG fleet may perform
better in terms of profitability because of the level of volatility in the freight rates expe-
rienced during the period. This rationale is supported by Porter (1991), who suggested
a novel and positive relation between environmental regulation and firm performance,
which was further postulated by Porter and van der Linde (1995). Porter and van der
Linde theorised that environmental regulation might trigger innovation in firms offset-
ting the costs of compliance and leading to reduced pollution and increased profits, im-
plying that firms are unlikely to innovate in the absence of regulation. Innovations
could also provide profitable opportunities for exposing firms to new markets. Conse-
quently, the strategic diversification into LNG carriers is not just a generic risk-
reduction strategy, but one that supports eco-innovation in terms of providing greater
worldwide use of natural gas.
Consequently, the firm profitability concept is intimately related to the firm decision
to diversify into LNG business that supports eco-innovation following the global trend.
In this study, profitability is defined as the return on total asset and the return on total
equity. Our study also enhances the knowledge of policymakers, regulators, ship owners
and ship managers concerning the thrust of global eco-innovation and related firm
performances.
Consequently, we state Hypothesis 1 as follows:
Hypothesis 1: Increased investment in LNG carriers (supporting Eco-innovation) has a
positive effect on the shipping firm profitability.
Firm efficiency
Diversifying into new activities requires the acquisition of new competencies which in-
crease further if new technologies are incorporated into the diversification processes.
Theoretical insights from the eco-innovation literature underscore the vital role of or-
ganisational capabilities. As ship diversification into modern LNG transport involved
technologies and capabilities related to eco-innovation in the use and bunkering of
LNG, firm capabilities are important factors in the shipping firms’ success (Kemp et al.
1992). Kesidou and Demirel (2012) found that the presence of environmental manage-
ment systems (EMS) and cost reduction played significant roles in increasing eco-
innovation and its related activities; this is particularly critical for companies diversify-
ing their operations. Eco-innovation activities tended to improve the utilisation of ma-
terials and energy, resulting in cost savings for firms (Triguero et al. 2013). Specifically,
firms that develop organisational capabilities and practices such as source reduction,
pollution prevention and green product design are more likely to invest in eco-
innovation (Georg et al. 1992; Winn and Roome 1993).
Cost reduction is a significant issue (Rhodes and Soccoli 2013) in shipping firms par-
ticularly in weak market conditions where low freight rates prevail, and where the earn-
ings made are not sufficient to cover the capital and the running costs of vessels.
Lim and Lim Journal of Shipping and Trade (2020) 5:23 Page 7 of 25
Voyage costs also have an impact on ships earning capacity. Under the umbrella of voy-
age costs, the costs incurred with marine fuel costs are critical since they make up from
33% to 54% of a ship’s operating costs depending on ship type (OECD Report; 2016:
Table 4). Fuel prices drastically affect fuel and operational costs in shipping (Holmgren
et al. 2014). During periods in which the price of oil increases substantially, the costs of
marine fuel become prohibitive, leading shipping companies to adopt operating strat-
egies such as slow steaming. Furthermore, shipping companies efficiency can be af-
fected by the duration of the shipping cycle where the time-lag can exacerbate the
length of the cycle it takes for ship orders to lead into actual ship deliveries before ship-
ping capacity can be enlarged. Excessive supply of ships quite often leads to prolonged
shipping over-capacity and freight downturn before demand catches up. For a compre-
hensive discussion on shipping cycles, see Stopford (2009).
Based on the above, operating a fleet of LNG and other vessels requires managing
each item of the shipping costs very carefully, for instance, crew wages, repair and
maintenance costs, besides fuel costs. In what concerns the fuel costs, further attention
is needed since, as from 1 January 2020, fuel has to meet specific international emis-
sions standards. Moreover, the operation of the new large LNG ships requires bunker-
ing facilities which have to be carefully planned as shown by Zacharioudakis et al.
(2011), even though their study concerns the liner shipping cycle. With expanding
LNG capacity or transition into the LNG shipping business, the impact on a shipping
firm’s financial efficiency is an important matter to be investigated. On balance, we ex-
pect that investing and taking delivery of LNG carriers would improve operational effi-
ciency. We formulate and will test the following Hypothesis 2.
Hypothesis 2: Increased investment in LNG carriers (supporting Eco-innovation) has a
positive effect on the shipping firm efficiency.
Stock performance
The innovation literature emphasises the importance of demand-pull factors for inno-
vations. The innovation process is shaped not only by the producers but also by com-
petitors, consumers, universities, as well as private and public institutes (Edquist 2005).
Correspondingly, demand factors play a pivotal role in eco-innovation. Wagner (2007)
found that environmentally concerned stakeholders influence the creation of eco-
innovative products. Furthermore, Kesidou and Demirel (2012) showed that societal
and market requirements affect the decision of a firm to conduct eco-innovation.
Hence, societal expectations and corporate social responsibility (CSR) are likely to drive
corporate social performance that may affect financial performance.
The relationship between socially beneficial behaviours of a firm and its financial
performance has been the concern of many studies. Critics of CSR argue that the
costs and administrative burdens of undertaking CSR practices diminish the finan-
cial performance of a firm and put a socially responsible firm at an economic dis-
advantage in a competitive marketplace (e.g. Mcwilliams and Siegel 1997; Jensen
2002). On the other hand, proponents of CSR reason that heightened social per-
formance may attract resources, market a firm’s products and services, as well as
create unexpected opportunities (e.g. Waddock and Graves 1997; Fombrun 1996;
Lim and Lim Journal of Shipping and Trade (2020) 5:23 Page 8 of 25
Fombrun et al. 2000). Thus, the relation between social and financial performance
has been a long-standing but unresolved debate (Margolis and Walsh 2003).
Unlike general stock market research, as evidenced in voluminous studies led for ex-
ample, by Fama and French (1992, 1993), stock research on shipping firms has its own
specialization (see Alexandridis et al. 2018). One reason is the uniqueness of the ship-
ping industry that faces different risk factors and where shipping firms hold quite dis-
tinct characteristics. El-Masry et al. (2010) found that shipping firm stocks are not
sensitive to typical macroeconomic factors such as exchange rate and interest rates.
Shipping stocks, in general, have not been attractive due to the lacklustre performance.
However, many reasons, including corporate control and bringing about strategic
change, may influence investing in its stocks. Thus, it is crucial to study how the chan-
ging portfolio due to diversification into LNG vessels could have any impact on affected
stock returns. We posit here that investment in newer technology LNG carriers is so-
cially in support of efforts on eco-innovation and Hypothesis 3 is as follows:
Hypothesis 3 Increased investment in LNG carriers (supporting Eco-innovation) has a
positive effect on the shipping firm’s stock returns.
Early mover advantage
Environmentally benign processes are related positively to the image and reputation
of a firm (Rennings and Zwick 2002). The literature on strategic management reit-
erates the role of a good corporate reputation in the creation of sustainable super-
ior firm performance (Roberts and Dowling 2002). Hence, the institution of
processes that directly reduce or else support the reduction of pollution and other
environmental harms may benefit the financial performance of firms. Many such
innovation processes result in improvements that would happen regardless of
whether the process happened sooner or later. Barnett (2007) showed that both
early and late movers could enhance firm performance through better utilisation of
resources or reduction of wastage.
However, Porter and van der Linde (1995) argued for the relevance of timing
that an early mover can capitalise on an enviroprenuerial opportunity before it is
adopted by rivals and thus may gain greater benefit. Besides, enviropreneurial ini-
tiatives may result in inimitable eco-innovations and provide firms with sustainable
competitive advantages (Stafford et al. 2000). Barnett (2007) even suggested that
societal expectations increase as a particular type of CSR becomes common. Firms
that fail to meet the increased expectations may suffer in performance. Therefore,
a firm that waits to engage in a CSR practice may benefit lesser than a competitor
that acts earlier.
Gkonis and Psaraftis (2009) adopted a game-theoretic approach to analyse competi-
tion in LNG shipping and found that an early mover may gain more profits than a late
mover because the early mover was able to pre-commit to a higher level of supply.
These findings suggest that the early mover advantage may exist in the context of low-
emission shipping. Therefore, we contribute to the empirical analysis by considering
the length of time a firm uses LNG carriers among oil tankers, and infer the potential
benefits of earlier adoption. We position Hypothesis 4 as follows:
Lim and Lim Journal of Shipping and Trade (2020) 5:23 Page 9 of 25
Hypothesis 4: Longer experience in managing LNG ships (supporting Eco-innovation)
has positive effects on firm performance and shipping firm efficiency.
DataFor carrying out the analysis, we need specific data. For studying (1) firm profitability
performance and (2) firm efficiency, we employ annual shipping firm accounting data
together with relevant macro-variables that affect shipping firm performances systemat-
ically. For studying issue (3) stock return performance, we employ firms’ monthly stock
return data and firm characteristics affecting returns.
Accounting financial ratios are utilised as they are good indicators of a firm’s finan-
cial and business performances (Barnes 1987). Hagel et al. (2010) reported that return
on assets (ROA) is a good measure of financial performance as it determines whether a
firm can generate an adequate return on asset-heavy firms to support the business.
Shipping firms are indeed heavy on assets. Besides, Cowen (1982) showed the useful-
ness of financial ratios in evaluating firm performances within a single homogeneous
industry, which applies to the shipping industry. Accounting data have also been used
in evaluating the general economic performance of international shipping firms in Kang
et al. (2016). Lin and Liu (2005) studied shipping performance efficiency using shipping
firm accounting ratios and indicated that such financial indicators are more reliable as
they are audited. Stock returns of international shipping firms are also analysed in
Grammenos and Marcoulis (1996), and El-Masry et al. (2010), amongst others.
Annual and monthly time series data are used, and the raw data that are used are
transformed into stationary variables as much as it is meaningfully possible. Sometimes
natural logarithms are used while other times ratios are used. When first-differencing
led to too much loss of information or where the differencing does not yield station-
arity, co-integration tests are employed to ensure there are suitable co-integrating vec-
tors to perform linear regressions. The data being used to produce the empirical results
in Section Methods and empirical results, viz. Tables 1, 2, 3, 4, 5, 6, 7 and Fig. 1a and
b, are described as follows according to the order of the Tables and Figures in order to
facilitate easier reading.
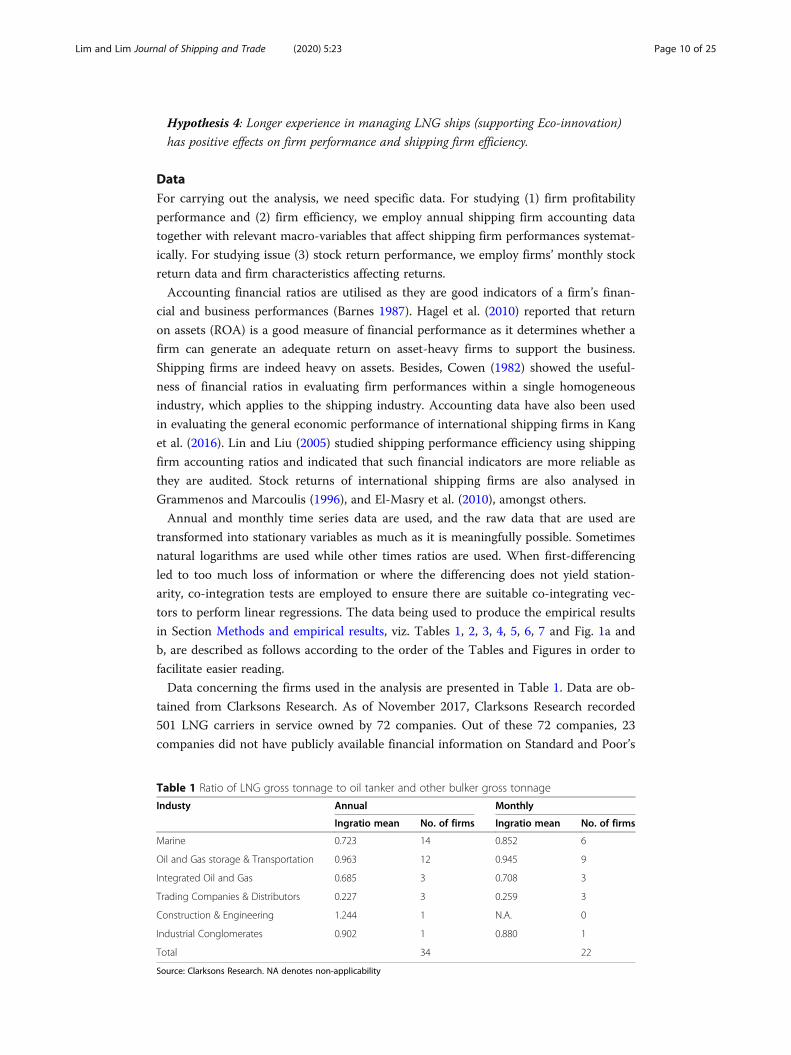
Data concerning the firms used in the analysis are presented in Table 1. Data are ob-
tained from Clarksons Research. As of November 2017, Clarksons Research recorded
501 LNG carriers in service owned by 72 companies. Out of these 72 companies, 23
companies did not have publicly available financial information on Standard and Poor’s
Table 1 Ratio of LNG gross tonnage to oil tanker and other bulker gross tonnage
Industy Annual Monthly
Ingratio mean No. of firms Ingratio mean No. of firms
Marine 0.723 14 0.852 6
Oil and Gas storage & Transportation 0.963 12 0.945 9
Integrated Oil and Gas 0.685 3 0.708 3
Trading Companies & Distributors 0.227 3 0.259 3
Construction & Engineering 1.244 1 N.A. 0
Industrial Conglomerates 0.902 1 0.880 1
Total 34 22
Source: Clarksons Research. NA denotes non-applicability
Lim and Lim Journal of Shipping and Trade (2020) 5:23 Page 10 of 25
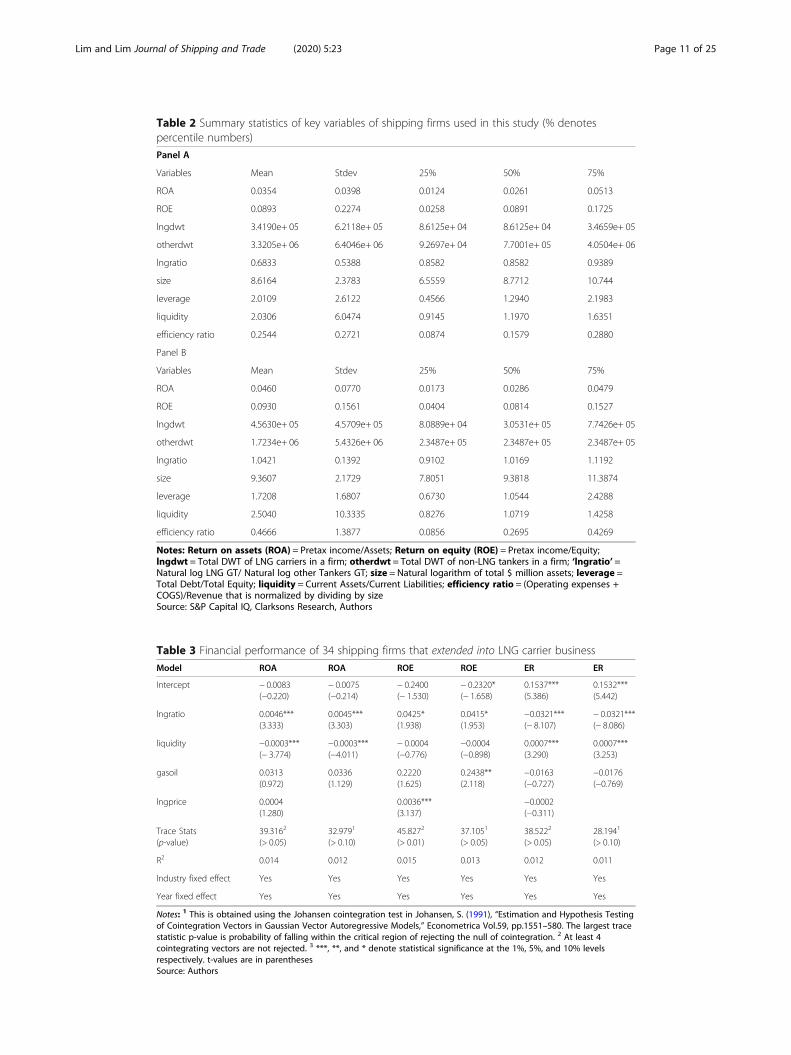
Table 2 Summary statistics of key variables of shipping firms used in this study (% denotespercentile numbers)
Panel A
Variables Mean Stdev 25% 50% 75%
ROA 0.0354 0.0398 0.0124 0.0261 0.0513
ROE 0.0893 0.2274 0.0258 0.0891 0.1725
lngdwt 3.4190e+ 05 6.2118e+ 05 8.6125e+ 04 8.6125e+ 04 3.4659e+ 05
otherdwt 3.3205e+ 06 6.4046e+ 06 9.2697e+ 04 7.7001e+ 05 4.0504e+ 06
lngratio 0.6833 0.5388 0.8582 0.8582 0.9389
size 8.6164 2.3783 6.5559 8.7712 10.744
leverage 2.0109 2.6122 0.4566 1.2940 2.1983
liquidity 2.0306 6.0474 0.9145 1.1970 1.6351
efficiency ratio 0.2544 0.2721 0.0874 0.1579 0.2880
Panel B
Variables Mean Stdev 25% 50% 75%
ROA 0.0460 0.0770 0.0173 0.0286 0.0479
ROE 0.0930 0.1561 0.0404 0.0814 0.1527
lngdwt 4.5630e+ 05 4.5709e+ 05 8.0889e+ 04 3.0531e+ 05 7.7426e+ 05
otherdwt 1.7234e+ 06 5.4326e+ 06 2.3487e+ 05 2.3487e+ 05 2.3487e+ 05
lngratio 1.0421 0.1392 0.9102 1.0169 1.1192
size 9.3607 2.1729 7.8051 9.3818 11.3874
leverage 1.7208 1.6807 0.6730 1.0544 2.4288
liquidity 2.5040 10.3335 0.8276 1.0719 1.4258
efficiency ratio 0.4666 1.3877 0.0856 0.2695 0.4269
Notes: Return on assets (ROA) = Pretax income/Assets; Return on equity (ROE) = Pretax income/Equity;lngdwt = Total DWT of LNG carriers in a firm; otherdwt = Total DWT of non-LNG tankers in a firm; ‘lngratio’ =Natural log LNG GT/ Natural log other Tankers GT; size = Natural logarithm of total $ million assets; leverage =Total Debt/Total Equity; liquidity = Current Assets/Current Liabilities; efficiency ratio = (Operating expenses +COGS)/Revenue that is normalized by dividing by sizeSource: S&P Capital IQ, Clarksons Research, Authors
Table 3 Financial performance of 34 shipping firms that extended into LNG carrier business
Model ROA ROA ROE ROE ER ER
Intercept − 0.0083(−0.220)
− 0.0075(−0.214)
− 0.2400(− 1.530)
− 0.2320*(− 1.658)
0.1537***(5.386)
0.1532***(5.442)
lngratio 0.0046***(3.333)
0.0045***(3.303)
0.0425*(1.938)
0.0415*(1.953)
−0.0321***(− 8.107)
− 0.0321***(− 8.086)
liquidity −0.0003***(− 3.774)
−0.0003***(−4.011)
− 0.0004(−0.776)
−0.0004(−0.898)
0.0007***(3.290)
0.0007***(3.253)
gasoil 0.0313(0.972)
0.0336(1.129)
0.2220(1.625)
0.2438**(2.118)
−0.0163(−0.727)
−0.0176(−0.769)
lngprice 0.0004(1.280)
0.0036***(3.137)
−0.0002(−0.311)
Trace Stats(p-value)
39.3162
(> 0.05)32.9791
(> 0.10)45.8272
(> 0.01)37.1051
(> 0.05)38.5222
(> 0.05)28.1941
(> 0.10)
R2 0.014 0.012 0.015 0.013 0.012 0.011
Industry fixed effect Yes Yes Yes Yes Yes Yes
Year fixed effect Yes Yes Yes Yes Yes Yes
Notes: 1 This is obtained using the Johansen cointegration test in Johansen, S. (1991), “Estimation and Hypothesis Testingof Cointegration Vectors in Gaussian Vector Autoregressive Models,” Econometrica Vol.59, pp.1551–580. The largest tracestatistic p-value is probability of falling within the critical region of rejecting the null of cointegration. 2 At least 4cointegrating vectors are not rejected. 3 ***, **, and * denote statistical significance at the 1%, 5%, and 10% levelsrespectively. t-values are in parenthesesSource: Authors
Lim and Lim Journal of Shipping and Trade (2020) 5:23 Page 11 of 25

Table 4 Financial performance of 15 shipping firms that originated in LNG carrier business
Model ROA ROA ROE ROE ER ER
Intercept 0.3844**(2.248)
0.1453(1.265)
0.5885**(2.548)
0.326***(2.725)
0.0543**(2.397)
0.0245***(2.750)
lngratio −0.5236***(−3.495)
−0.2423***(−3.365)
−0.3717*(−1.995)
− 0.2414**(−2.258)
−0.0615***(− 2.758)
− 0.0235**(− 2.325)
liquidity 0.0250***(3.742)
0.0280***(3.835)
0.0042(1.647)
0.0060**(2.390)
−0.0014**(−2.326)
−0.0010**(− 2.575)
gasoil 0.1834(1.608)
0.1138(1.208)
−0.0239(−0.170)
0.0281(0.275)
0.0198*(2.202)
0.0107(1.503)
lngprice −0.0032(−1.458)
−0.0062(−1.560)
− 0.0001(−0.685)
Trace Stats(p-value)
11.3862
(> 0.05)32.9791
(> 0.05)25.8671
(> 0.01)19.6201
(> 0.10)10.8242
(> 0.05)29.1211
(> 0.01)
R2 0.742 0.704 0.093 0.090 0.172 0.092
Industry fixed effect Yes Yes Yes Yes Yes Yes
Year fixed effect Yes Yes Yes Yes No3 No3
Notes: 1 This is obtained using the Johansen cointegration test in Johansen, S. (1991), “Estimation and Hypothesis Testingof Cointegration Vectors in Gaussian Vector Autoregressive Models,” Econometrica Vol.59, pp.1551–580. The trace statisticp-value is probability of falling within the critical region of rejecting the null of cointegration. At least 3 cointegratingvectors are not rejected. 2 At least 2 cointegrating vectors are not rejected. 3 Due to smaller sample size, the additionalfixed effect reduces the R2 significantly. Only the industry fixed effect is imposed here. 4 ***, **, and * denote statisticalsignificance at the 1%, 5%, and 10% levels respectively. t-values are in parenthesesSource: Authors
Table 5 Stock return performance of 22 listed shipping firms that extended into LNG carrierbusiness
Model Returns Returns
Intercept 0.0616**(2.516)
0.0444***(5.170)
lngratio 0.0015***(3.446)
0.0037***(2.762)
liquidity 0.0024**(2.059)
0.0024*(1.777)
leverage 0.0010***(3.707)
0.0010***(7.847)
size −0.0003(−0.333)
efficiency ratio −0.0149(−1.305)
VIX −0.0028***(−4.782)
− 0.0028***(−4.847)
Trace Stats 25.6681
(> 0.01)7.1432
(> 0.10)
R2 0.040 0.035
Industry fixed effect Yes Yes
Year fixed effect Yes Yes
Notes: 1 This is obtained using the Johansen cointegration test in Johansen, S. (1991), “Estimation and Hypothesis Testingof Cointegration Vectors in Gaussian Vector Autoregressive Models,” Econometrica Vol.59, pp.1551–580. At least 3cointegrating vectors are not rejected. 2 At least 2 cointegrating vectors are not rejected. 3 ***, **, and * denote statisticalsignificance at the 1%, 5%, and 10% levels respectively. t-values are in parenthesesSource: Authors
Lim and Lim Journal of Shipping and Trade (2020) 5:23 Page 12 of 25
(S&P) Capital IQ. Of the remaining 49 companies, 15 firms originated their shipping
businesses with all LNG carriers. The other 34 firms started their shipping businesses
with all or majority tonnages in non-LNG ships such as crude oil tankers and dry bulk
carriers. As we are primarily studying the financial and economic impact on shipping
firms that diversified significantly into LNG carriers, we focus on the remaining 34
firms.
The sample period of the Clarksons Research fleet data set ranges from 1986 to 2017.
We use the fleet information of each of the 34 firms to calculate the tonnage break-
down at each period. For each year, ‘lngratio’, the ratio of the log of total gross tonnage
(GT) of LNG carriers to the log of total GT of other tankers of each firm is calculated.
This variable is transformed to ensure it is relatively stationary compared with other
transformations. GT is a volumetric measurement of the enclosed space in a ship and
is different from deadweight tonnage (DWT), which is the weight of the cargo plus the
weights of the crew, fuel, consumables, and other variables on board. We also used
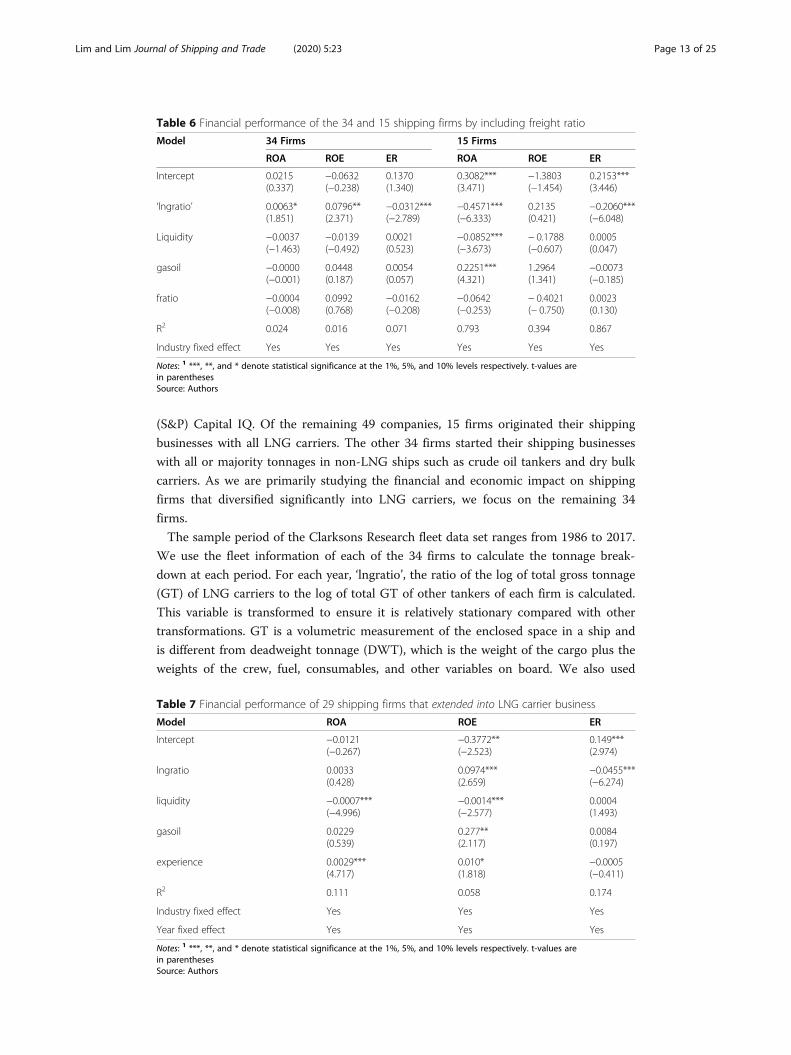
Table 6 Financial performance of the 34 and 15 shipping firms by including freight ratio
Model 34 Firms 15 Firms
ROA ROE ER ROA ROE ER
Intercept 0.0215(0.337)
−0.0632(−0.238)
0.1370(1.340)
0.3082***(3.471)
−1.3803(−1.454)
0.2153***(3.446)
‘lngratio’ 0.0063*(1.851)
0.0796**(2.371)
−0.0312***(−2.789)
−0.4571***(−6.333)
0.2135(0.421)
−0.2060***(−6.048)
Liquidity −0.0037(−1.463)
−0.0139(−0.492)
0.0021(0.523)
−0.0852***(−3.673)
− 0.1788(−0.607)
0.0005(0.047)
gasoil −0.0000(−0.001)
0.0448(0.187)
0.0054(0.057)
0.2251***(4.321)
1.2964(1.341)
−0.0073(−0.185)
fratio −0.0004(−0.008)
0.0992(0.768)
−0.0162(−0.208)
−0.0642(−0.253)
− 0.4021(− 0.750)
0.0023(0.130)
R2 0.024 0.016 0.071 0.793 0.394 0.867
Industry fixed effect Yes Yes Yes Yes Yes Yes
Notes: 1 ***, **, and * denote statistical significance at the 1%, 5%, and 10% levels respectively. t-values arein parenthesesSource: Authors
Table 7 Financial performance of 29 shipping firms that extended into LNG carrier business
Model ROA ROE ER
Intercept −0.0121(−0.267)
−0.3772**(−2.523)
0.149***(2.974)
lngratio 0.0033(0.428)
0.0974***(2.659)
−0.0455***(−6.274)
liquidity −0.0007***(−4.996)
−0.0014***(−2.577)
0.0004(1.493)
gasoil 0.0229(0.539)
0.277**(2.117)
0.0084(0.197)
experience 0.0029***(4.717)
0.010*(1.818)
−0.0005(−0.411)
R2 0.111 0.058 0.174
Industry fixed effect Yes Yes Yes
Year fixed effect Yes Yes Yes
Notes: 1 ***, **, and * denote statistical significance at the 1%, 5%, and 10% levels respectively. t-values arein parenthesesSource: Authors
Lim and Lim Journal of Shipping and Trade (2020) 5:23 Page 13 of 25

other data such as the annual total DWT of LNG carriers and the total DWT of oil
tankers and others for each firm. However, their inclusions do not show any significant
findings in the rest of the paper. In years in which a firm has not yet acquired LNG car-
rier, this ratio is not applicable.
Out of the sample of 34 ship owners, we identified 22 listed companies for which we
can acquire monthly Clarksons Research fleet data. We retrieved the month in which a
firm commenced operation of LNG carrier and computed the monthly ‘lngratio’ ratio
as log of GT of LNG carriers to log of total GT of other tankers. Table 1 shows the
breakdown of the data of 34 firms into the various industry classifications; moreover, it
reports the mean of the ‘lngratio’ measures for firms within the same industry and the
number of firms in each industry.
Table 2 deals with the performance of firms under study. According to Slade (2003),
there is a tradition in industrial economics that substantiates the use of profitability as
a key measure of firm performance. In this paper, we focus on the profitability ratio
Fig. 1 a Plot of Average Return on Assets versus Average Composition of the fleet (‘lngratio’) across 34firms in panel A for each year from 1986 until 2017. Source: Authors based on data gathered from S&PCapital IQ, Clarksons Research. b Plot of Average Return on Assets versus Average Composition of fleet(‘lngratio’) across 15 firms in panel B for each year from 1986 until 2017. Source: Authors based on datagathered from S&P Capital IQ, Clarksons Research
Lim and Lim Journal of Shipping and Trade (2020) 5:23 Page 14 of 25
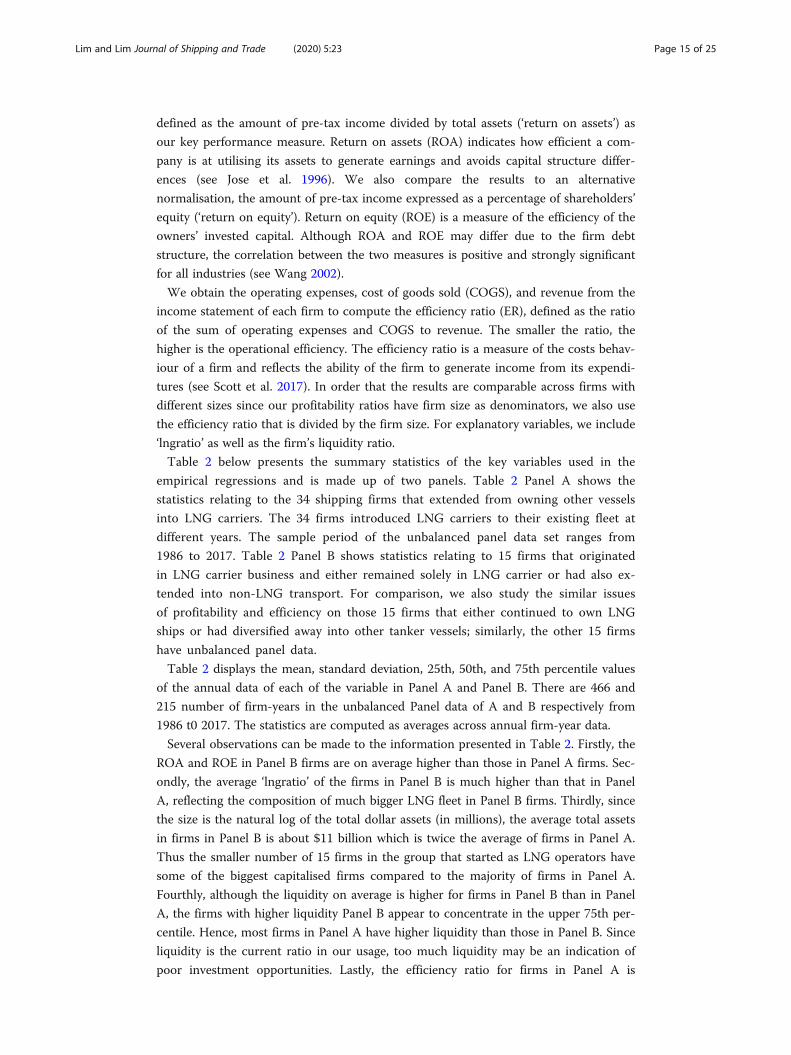
defined as the amount of pre-tax income divided by total assets (‘return on assets’) as
our key performance measure. Return on assets (ROA) indicates how efficient a com-
pany is at utilising its assets to generate earnings and avoids capital structure differ-
ences (see Jose et al. 1996). We also compare the results to an alternative
normalisation, the amount of pre-tax income expressed as a percentage of shareholders’
equity (‘return on equity’). Return on equity (ROE) is a measure of the efficiency of the
owners’ invested capital. Although ROA and ROE may differ due to the firm debt
structure, the correlation between the two measures is positive and strongly significant
for all industries (see Wang 2002).
We obtain the operating expenses, cost of goods sold (COGS), and revenue from the
income statement of each firm to compute the efficiency ratio (ER), defined as the ratio
of the sum of operating expenses and COGS to revenue. The smaller the ratio, the
higher is the operational efficiency. The efficiency ratio is a measure of the costs behav-
iour of a firm and reflects the ability of the firm to generate income from its expendi-
tures (see Scott et al. 2017). In order that the results are comparable across firms with
different sizes since our profitability ratios have firm size as denominators, we also use
the efficiency ratio that is divided by the firm size. For explanatory variables, we include
‘lngratio’ as well as the firm’s liquidity ratio.
Table 2 below presents the summary statistics of the key variables used in the
empirical regressions and is made up of two panels. Table 2 Panel A shows the
statistics relating to the 34 shipping firms that extended from owning other vessels
into LNG carriers. The 34 firms introduced LNG carriers to their existing fleet at
different years. The sample period of the unbalanced panel data set ranges from
1986 to 2017. Table 2 Panel B shows statistics relating to 15 firms that originated
in LNG carrier business and either remained solely in LNG carrier or had also ex-
tended into non-LNG transport. For comparison, we also study the similar issues
of profitability and efficiency on those 15 firms that either continued to own LNG
ships or had diversified away into other tanker vessels; similarly, the other 15 firms
have unbalanced panel data.
Table 2 displays the mean, standard deviation, 25th, 50th, and 75th percentile values
of the annual data of each of the variable in Panel A and Panel B. There are 466 and
215 number of firm-years in the unbalanced Panel data of A and B respectively from
1986 t0 2017. The statistics are computed as averages across annual firm-year data.
Several observations can be made to the information presented in Table 2. Firstly, the
ROA and ROE in Panel B firms are on average higher than those in Panel A firms. Sec-
ondly, the average ‘lngratio’ of the firms in Panel B is much higher than that in Panel
A, reflecting the composition of much bigger LNG fleet in Panel B firms. Thirdly, since
the size is the natural log of the total dollar assets (in millions), the average total assets
in firms in Panel B is about $11 billion which is twice the average of firms in Panel A.
Thus the smaller number of 15 firms in the group that started as LNG operators have
some of the biggest capitalised firms compared to the majority of firms in Panel A.
Fourthly, although the liquidity on average is higher for firms in Panel B than in Panel
A, the firms with higher liquidity Panel B appear to concentrate in the upper 75th per-
centile. Hence, most firms in Panel A have higher liquidity than those in Panel B. Since
liquidity is the current ratio in our usage, too much liquidity may be an indication of
poor investment opportunities. Lastly, the efficiency ratio for firms in Panel A is
Lim and Lim Journal of Shipping and Trade (2020) 5:23 Page 15 of 25

generally lower than those in Panel B, indicating that firms in Panel A tended to make
more revenues per dollar spent in cost of goods and operations.
Tables 3 and 4 also use the annual financial statements of the firms sourced from
S&P Capital IQ and the fleet information of each firm is integrated with the informa-
tion sourced from S&P Capital IQ. Besides, Tables 3 and 4 also include the LNG price
obtained from Federal Reserve Economic Data (FRED) of St. Louis, and data used to
construct another explanatory variable, ‘gasoil’. ‘Gasoil’ variable is constructed as fol-
lows: 1) the annual LNG trade volumes in million metric tons per year (MTPA) are ob-
tained from publications published by the International Gas Union and the
International Energy Agency (IHS Markit); 2) the annual crude oil seaborne trade vol-
umes in million metric tons are obtained from UNCTAD statistical publications; 3) the
annual LNG tanker fleet capacities in million cubic metres (cm) are obtained from S&P
Global Platts; 4) the oil tanker capacities in million DWT are obtained from Statista Re-
search and cross-checked with data from some shipbroking publications; the data in 1)
is divided by that in 3) to obtain the LNG gas trade per available LNG tanker capacity;
the data in 2) is divided by that in 4) to obtain the crude oil trade per available oil
tanker capacity. The ratio of LNG gas trade per available LNG tanker capacity to crude
oil trade per available oil tanker capacity is treated as the ‘gasoil’ variable. This ‘gasoil’
variable reflects the relative LNG gas trade versus crude oil trade normalized by their
shipping capacities. This ratio constitutes a stationary variable that is meaningful in
comparing relative activities of LNG gas trading to crude oil trading. It serves as a con-
trol variable to possibly explain higher profitability and efficiency in firms diversifying
into LNG ships if the ratio is higher. We also used other data such as gross domestic
product (GDP), crude oil prices, and Baltic Dry Index. The GDP retrieved from FRED
is a measure of US output, which is closely correlated to world output (see Arora and
Vamvakidis 2004). However, their inclusions do not show any significant findings.
For Table 5, we use the monthly stock return rates of the 22 listed shipping firms.
For explanatory variables explaining the dependent variable of monthly returns, we em-
ploy the firm’s accounting variables such as liquidity, leverage, size, efficiency ratio, as
well as ‘lngratio’. Daily stock prices and quarterly financial statements are sourced from
S&P Capital IQ. The former is converted to monthly logarithmic returns while the lat-
ter is changed to monthly financial data using cubic spline interpolation. To control for
market-wide economic conditions that potentially influence firms’ performance, we use
market estimates of volatility that are often used as a barometer for the vulnerability of
financial markets and the economy (Poon and Granger 2003). Market volatility and in-
vestor sentiment are represented by the Chicago Board Options Exchange (CBOE)
Volatility Index (VIX). The daily frequency of VIX obtained from the CBOE website is
transformed into a monthly average. We also tried other data such as monthly total
DWT of LNG carriers and the monthly total DWT of oil tankers, interpolated quarterly
GDP, monthly WTI and LNG price from FRED, and monthly Baltic dry index from the
Baltic Exchange database. Likewise, their inclusions do not show any significant
findings.
Table 6 extends the results found in Tables 3 and 4 by including a minimal data set
of the effect of freight rates. Proxies for both LNG fleet freight rates and crude oil
tanker freight rates are obtained. For crude oil tanker freight rates, we use the Baltic
Dirty Tanker Index. This is an assessment index published by the Baltic Exchange of
Lim and Lim Journal of Shipping and Trade (2020) 5:23 Page 16 of 25

crude oil tanker freight rates from 12 Baltic international routes. We could obtain only
monthly spot charter rate assessments on LNG carriers starting January 2014 from
published data by Proten & Partners. We could not obtain time charter or any other
LNG freight rates, which explains why the study considered spot charter rates which
include voyage risk premia and are approximations to the freight cost. According to
Offshore Energy (2018), The Baltic Exchange had just selected liquefied natural gas
(LNG) carrier to be used as a benchmark to perform a public trial of its index starting
on 10 July, the reason why the benchmark LNG rates were not easily available during
our study period.
We construct a ratio of the LNG rates in US$ per day relative to the tanker index. In-
creasing ratio implies that LNG rate is rising faster relative to tanker rate. This may
affect decisions to diversify into more LNG fleet. However, since the gasoil ratio reflects
supply and this freight price ratio reflects price, they are highly correlated; this reflects
a possible endogeneity issue. To avoid biased regression results, we project the freight
ratio on gasoil and obtain the residual as a cleaner proxy for freight effect. This latter
variable is the freight ratio. Table 7 uses a subset of the data utilised in Table 3.
Methods and empirical resultsOne of the major findings we seek is to investigate the relationship between profitabil-
ity and the fleet composition ratio represented by ‘lngratio’. This ratio could also indi-
cate whether diversification into more LNG tonnages in the fleet improves profitability
or not. Figure 1a and b below show the scatterplot of the average ROA across firms in
Panels A and B, respectively, against their average ‘lngratio’ ratios.
In Fig. 1a, we plot the average ROA versus average ‘lngratio’ of the 34 shipping firms
for each year in 1986 to 2017. These 34 firms extended from owning other vessels into
LNG carriers. The firms introduced LNG carriers to their fleet in different years. Fig-
ure 1a shows that the firms on average have less LNG GT than GT in other vessels
since the ‘lngratio’ is less than 1. ROA is seen to increase with ‘lngratio’ generally.
In Fig. 1b, we plot the average ROA versus average ‘lngratio’ of the 15 shipping firms
for each year in 1986 to 2017. These 15 shipping firms originated in LNG Carrier Busi-
ness, and either remained totally in LNG business or extended fleet to non-LNG
tankers. For these 15 firms in Panel B, Fig. 1b shows that most firms have more GT in
LNG than in other vessels. The scatterplot appears to suggest that for firms that held a
larger share (relative to the others in the same group) of other vessel tonnages, ROA
generally increases. This could be an indication that diversification benefits happened
both ways – for firms in panel A that diversify into LNG fleet and for firms in panel B
that diversify away from pure LNG business into other marine transport segments.
Next, we introduce linear panel regressions to test the hypotheses. However, before
any regression is applied, we check for the unit-roots of each variable. As several vari-
ables are on the borderline when using the augmented Dickey-Fuller test, and the first
differencing produces weak results, we employ co-integration tests to check that the
final regressions are acceptable given the presence of co-integrating vectors. This ap-
proach ensures that the optimal least squares estimates are meaningful and do not suf-
fer from spurious biases. Explanatory variables are checked to guarantee that their
correlations do not exceed 0.7 to avoid the problem of multi-collinearity that can cause
Lim and Lim Journal of Shipping and Trade (2020) 5:23 Page 17 of 25
substantial estimation errors. Minimal (less variables added) models are checked to
make sure the estimates are stable.
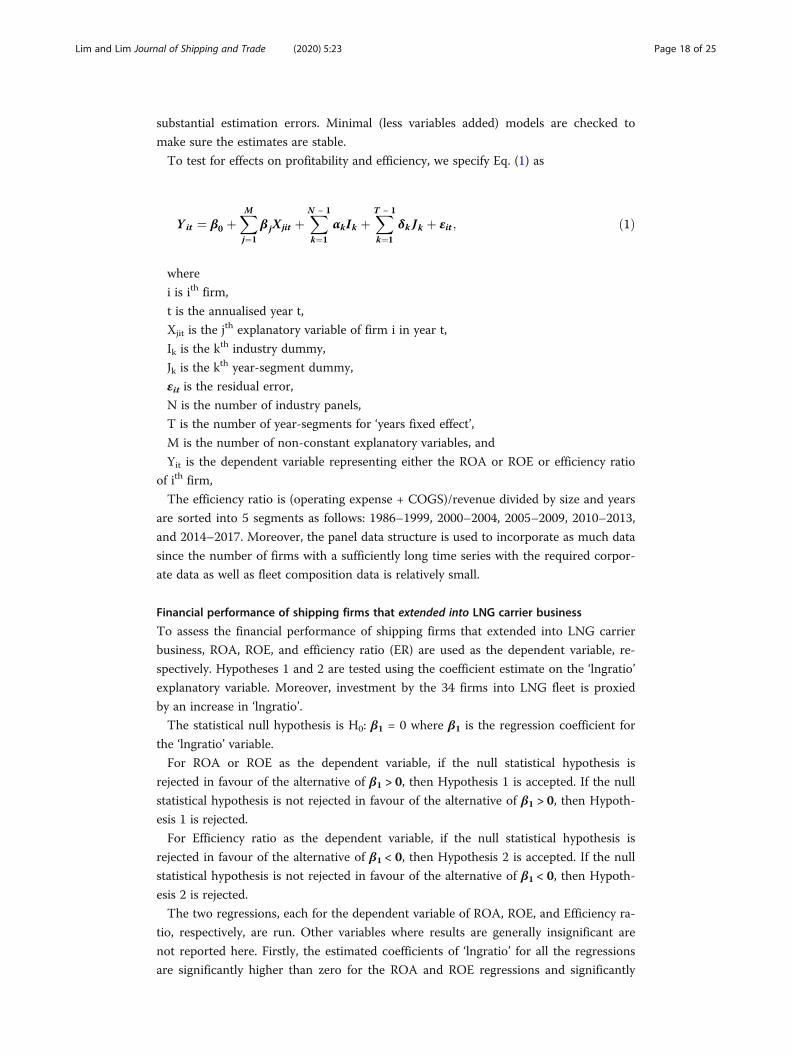
To test for effects on profitability and efficiency, we specify Eq. (1) as
Y it ¼ β0 þXM
j¼1
β jXjit þXN − 1
k¼1
αkIk þXT − 1
k¼1
δk Jk þ εit ; ð1Þ
where
i is ith firm,
t is the annualised year t,
Xjit is the jth explanatory variable of firm i in year t,
Ik is the kth industry dummy,
Jk is the kth year-segment dummy,
εit is the residual error,
N is the number of industry panels,
T is the number of year-segments for ‘years fixed effect’,
M is the number of non-constant explanatory variables, and
Yit is the dependent variable representing either the ROA or ROE or efficiency ratio
of ith firm,
The efficiency ratio is (operating expense + COGS)/revenue divided by size and years
are sorted into 5 segments as follows: 1986–1999, 2000–2004, 2005–2009, 2010–2013,
and 2014–2017. Moreover, the panel data structure is used to incorporate as much data
since the number of firms with a sufficiently long time series with the required corpor-
ate data as well as fleet composition data is relatively small.
Financial performance of shipping firms that extended into LNG carrier business
To assess the financial performance of shipping firms that extended into LNG carrier
business, ROA, ROE, and efficiency ratio (ER) are used as the dependent variable, re-
spectively. Hypotheses 1 and 2 are tested using the coefficient estimate on the ‘lngratio’
explanatory variable. Moreover, investment by the 34 firms into LNG fleet is proxied
by an increase in ‘lngratio’.
The statistical null hypothesis is H0: β1 = 0 where β1 is the regression coefficient for
the ‘lngratio’ variable.
For ROA or ROE as the dependent variable, if the null statistical hypothesis is
rejected in favour of the alternative of β1 > 0, then Hypothesis 1 is accepted. If the null
statistical hypothesis is not rejected in favour of the alternative of β1 > 0, then Hypoth-
esis 1 is rejected.
For Efficiency ratio as the dependent variable, if the null statistical hypothesis is
rejected in favour of the alternative of β1 < 0, then Hypothesis 2 is accepted. If the null
statistical hypothesis is not rejected in favour of the alternative of β1 < 0, then Hypoth-
esis 2 is rejected.
The two regressions, each for the dependent variable of ROA, ROE, and Efficiency ra-
tio, respectively, are run. Other variables where results are generally insignificant are
not reported here. Firstly, the estimated coefficients of ‘lngratio’ for all the regressions
are significantly higher than zero for the ROA and ROE regressions and significantly
Lim and Lim Journal of Shipping and Trade (2020) 5:23 Page 18 of 25
lesser than zero for the efficiency ratio regression. In the cases for ROA and Efficiency
ratio, the significance is at the 1% level. Hence the Hypotheses 1 and 2 are acceptable –
which means that increased investing in LNG ships or increase in its composition in a
fleet portfolio increased profitability as well as efficiency.
Secondly, more liquidity decreases profitability measured by ROA and decreases the
operational efficiency of firms. The liquidity effect on ROE is also negative but is not
significant. As suggested in our observations in Table 2, most firms in Panel A have
higher liquidity than those in Panel B. One explanation for this negative liquidity effect
on profitability is that too much liquidity may be an indication of poor investment op-
portunities which lead to lower profits. Similarly, this could be showing up less effi-
ciency because the higher liquidity generates not enough revenue in the form of more
current assets. In some specific situations, more current assets in the form of receiv-
ables may reflect weak receivable collection.
Thirdly, the outcome shows that the Johansen (1991) trace statistics tests (reported at
the lower row of Table 3) indicate that the co-integration of the regression variables
cannot be rejected at variously 10%, 5% and 1% levels. Table 3 reports the results for
the panel regressions of Eq. (1) when investigating the financial performance of the 34
shipping firms that extended into LNG Carrier Business.
‘Gasoil’ as a macro control variable has a positive impact on profitability and negative
impact on ER. This shows that the firms’ fleet portfolio has been adequately diversified
into LNG business relative to other businesses, including crude oil business. Thus,
when gas trade volume per unit market capacity increases relative to similar per unit
crude oil trade volume, the portfolio can benefit from increased trades in LNG. The co-
efficient on lngprice is generally not significant although it is significantly positive at
1% level for ROE. In the shipping business on commodities including oil and gas as
commodities, higher commodity values typically indicate heightened worldwide de-
mand and thus augurs well for freight transport businesses (Tsiournas and Papadimi-
triou 2016; UNCTAD Technical Report 2010).
Financial performance of 15 shipping firms that originated in LNG carrier business
We also study the comparative performance of the other 15 shipping firms in our sam-
ple that originated in the LNG business and might have either stayed focused in LNG
business or have diversified away into non-LNG tanker fleet. We employ the same re-
gression models as in Table 3. The results for this group of 15 firms are reported in
Table 4.
Two regressions each for the dependent variable of ROA, ROE, and ER, respectively,
are run. Firstly, the estimated coefficients of ‘lngratio’ for all the regressions are signifi-
cantly lesser than zero for the ROA and ROE regressions and significantly lesser than
zero for the ER regression. While the result is similar to that of the 34 firms for ER, the
effect of ‘lngratio’ is reversed for these 15 firms.
One plausible explanation is that the diversification benefits work both ways. The 34
firms that diversify into LNG fleet benefited in terms of higher profitability due to bet-
ter risk-return payoffs in a diversified portfolio framework. Similarly, the pure LNG
firms by diversifying into another non-LNG fleet also displayed increasing profitability
due to the same benefits of diversification.
Lim and Lim Journal of Shipping and Trade (2020) 5:23 Page 19 of 25
Liquidity effect also appears to be reversed relative to the results in Table 3. From ob-
servations in Table 2, we note that most of the panel B firms have lower liquidity than
those in panel A firms. Below a certain possible threshold, increasing liquidity in the
form of a stronger current assets position, that can be more easily liquefied into cash,
has a generally positive impact on profitability. We also note that the effect of macro-
control variable ‘gasoil’ is broadly like those in the group of 34 firms, though the esti-
mated coefficients are generally not significant.
Thirdly, the Johansen (1991) trace statistics tests are also reported at the lower row
to indicate co-integration of the regression variables cannot be rejected at variously
10%, 5% and 1% levels. The outcome of this analysis is presented in Table 4.
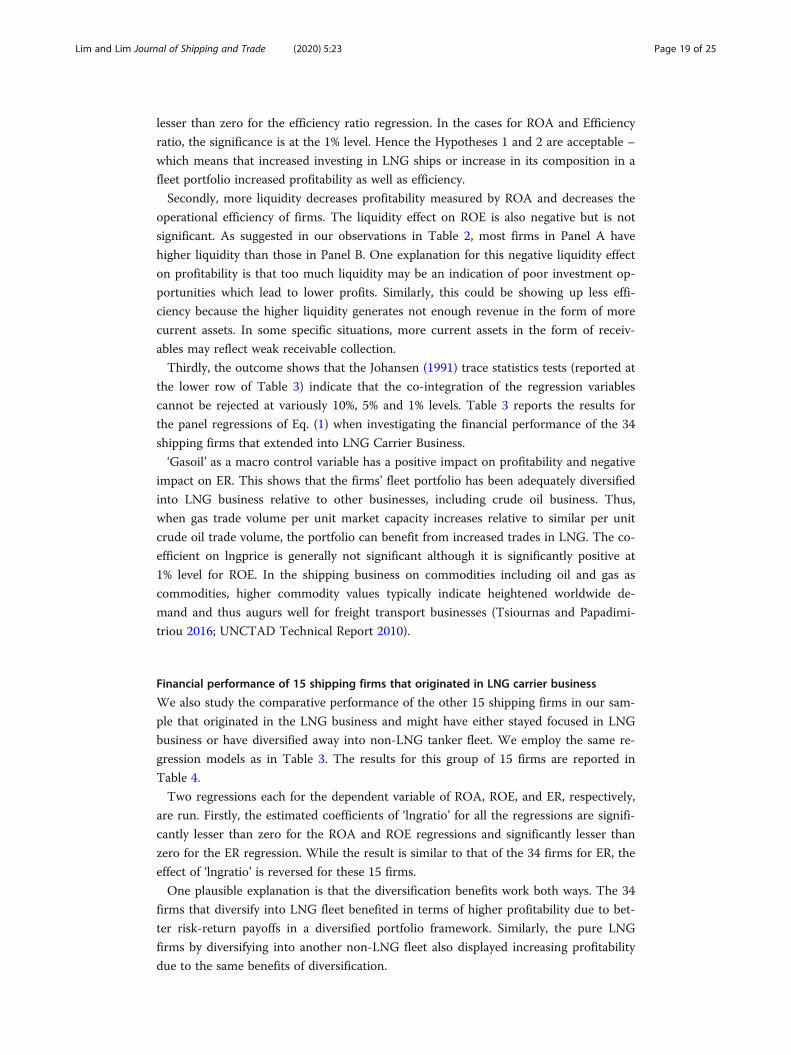
Stock return performance of 22 listed shipping firms that extended into LNG carrier
business
To test for positive effects on stock returns of increasing LNG fleet of the firm as in
Hypothesis 3, we specify the following panel regression:
Rit ¼ β0 þXM
j¼1
β jXjit þXN − 1
k¼1
αkIk þXT − 1
k¼1
δk Jk þ εit ; ð2Þ
where Rit is the continuously compounded monthly stock return of the ith firm in
month t. The stocks are those that are listed within the group of 34 firms. In Eq. (2),
i is the ith firm,
t is the month t,
Xjit is the jth explanatory variable of the ith firm in month t,
Ik is the kth industry dummy,
Jk is the kth year-segment dummy,
εit is the residual error,
N is number of industry panels,
T is the number of year-segments for ‘years fixed effect’, and
M is the number of non-constant explanatory variables.
Similar to Eq. (1) the years are sorted into 5 segments as follows: 1986–1999, 2000–
2004, 2005–2009, 2010–2013, and 2014–2017. The total number of firms is 22, which
are those with listed stocks within the group of 34 firms.
Table 5 reports the results for the panel regressions of Eq. (2) using monthly stock
returns as the dependent variable. Hypothesis 3 is tested using the coefficient estimate
on the ‘lngratio’ explanatory variable. More investment by the 22 firms into LNG fleet
is proxied by an increase in ‘lngratio’. The statistical null hypothesis is H0: β1 = 0 where
β1 is the regression coefficient for the ‘lngratio’ variable. If the null statistical hypothesis
is rejected in favour of the alternative of β1 > 0, then Hypothesis 3 is accepted. If the
null statistical hypothesis is not rejected in favour of the alternative of β1 > 0, then Hy-
pothesis 3 is rejected.
Firstly, the estimated coefficients of ‘lngratio’ for both the regressions are significantly
higher than zero at the 1% significance level. Hence the Hypothesis 3 is acceptable –
which means that increased investing in LNG ships or increase in its composition in a
fleet portfolio has a positive effect on shipping firm’s stock returns.
Lim and Lim Journal of Shipping and Trade (2020) 5:23 Page 20 of 25
The coefficient of liquidity is positive and significant, implying an increase in the
returns given a rise in liquidity. This result concurs with the findings of Redding
(1997), who suggested that large investors prefer companies with high liquidity. The co-
efficient of leverage is also significantly positive. Furthermore, this accords with finance
asset pricing theory that suggested higher leverage is costly and increases default risk.
Thus investors would require compensation in the form of higher stock returns.
The coefficient of VIX is negative and significant, indicating that fear gauge would
dampen stock returns (See also Black 1976; Duffee 1995; Fleming et al. 1995). The co-
efficient of size is negative though not statistically significant. The negative effect of size
on returns is well documented elsewhere as small vs. large effect (Fama and French
1995). Finally, decreased efficiency ratio or better cost management leads to higher
returns.
In the regression of Eq. (1), an additional explanatory control variable could be the
freight ratio (‘fratio’). We perform panel regressions on the dependent variables ROA,
ROE, and ER for both the 34 as well as the 15 firms. We use the yearly average of the
freight ratio in the regression with annual firm-year data. Table 6 reports the results
where the sample period is only from 2014 to 2017.
Given the limitation in the data and the very short available time series from 2014 to
2017, we could use only industry fixed effect as otherwise there would be too many pa-
rameters to estimate. Table 6 shows that Hypotheses 1, 2, and 3 are supported when
freight rates are introduced. In particular, increasing ‘lngratio’ increases ROA, ROE and
decreases the efficiency ratio. However, many of the estimates are not significantly dif-
ferent from zero because of the large sampling errors due to the small sample size.1
To test Hypothesis 4 on early mover advantage, we use 29 of the 34 firms that have
no more than 10 years of experience with LNG fleet at the start of our data sample
period. We define ‘experience’ as the number of years the firm has owned and managed
LNG ships in a particular year. We use Eq. (1) but include ‘experience’ as an explana-
tory variable in the panel regressions. The panel regression results are shown in
Table 7.
In Table 7, the estimated coefficient of ‘experience’ is positive and statistically signifi-
cant for both ROA and ROE. Hence early diversification and entry into LNG business
for the shipping firms that started without LNG fleet is shown to provide for higher
profitability as their experiences would be more compared to firms that entered later.
Thus there is evidence of early mover advantage. For the regression with ER as the
dependent variable, the estimated ‘experience’ coefficient has the correct negative sign
indicating that more experience would lead to higher operational efficiency, although
the estimate is not statistically significant. The estimated coefficients of the other ex-
planatory variables are generally significant and of the correct sign as in Table 3. We
exclude variable ‘lngprice’ as it is insignificant. Hence we support Hypothesis 4 that
longer experience in managing LNG ships (supporting Eco-innovation) has positive
1We do not report returns regression using freight rates as most estimated coefficients are not significant dueto the small sample size and the large volatility in return rates. Moreover, the volatile freight rates seen inshipping may not be effective in explaining short-term stock return movements. See Helenic Shipping News2020: “The rise in LNG transport prices continues, but is not followed by the share prices of LNG transportcompanies. The UP World LNG Shipping Index peaked in mid-August, reaching its June high. A formationcalled Double Top was formed on the chart. Thus, despite signs of a recovery in demand for LNG, stockprices continue to move sideways.”
Lim and Lim Journal of Shipping and Trade (2020) 5:23 Page 21 of 25
effects on firm performance. We have weaker evidence that longer LNG experience
also increased overall shipping firm efficiency.
ConclusionsNatural gas demand has increased globally and particularly sharply in Asia. Output has
also increased sharply in the US with the drilling for shale oil and gas. The technology
to liquefy natural gas for transport to countries worldwide and the increasing use of
natural gas as a cleaner fossil fuel for industry and household meant that the supply of
LNG worldwide is a profitable trend. Shipping companies can strategically choose to
diversify into LNG fleet to grasp this trend. Diversification of ship fleet, in this case, is
not just about reducing freight price risks. Diversification may be considered a driver to
support eco-innovation in the gas and clean fuel technologies. It may not be the case
that ship owners choose to diversify in order to eco innovate their firms. However, de
facto, by supplying more LNG shipping capacities, the greater availability of LNG
worldwide as a source of marine fuel and as a cleaner source of energy in replacing coal
and oil is supporting eco-innovation.
The economic and financial decision to diversify of course has to do with short-term
expected profitability as well as long-time sustainability of the shipping profits and
businesses. By studying the financial and operational performances of shipping firms
that diversify and expand LNG fleet and capacities, this study would be able not only to
inform about the outcomes of fleet diversification into LNG shipping business, but also
if eco-innovation philosophies that have been reported as crucial to strategic invest-
ments of shipping firms are indeed valuable to the firms.
Our study considers benefits that potentially arise from diversification and the sup-
port of eco-innovation: firm performance, firm efficiency, and stock performance. We
also examine the possibility of early mover advantage when shipping firms made earlier
decisions to diversify into LNG fleet. In our empirical modelling, we employ fixed-
effects panel data regressions on profitability, efficiency and stock returns. The empir-
ical results in this paper indicate that the introduction of LNG carriers to a firm’s fleet
improves the profitability and efficiency of the shipping firms. The return to assets and
return to equity of shipping firms that diversify into LNG fleet improved over time.
Moreover, for listed shipping firms, their stock returns increased with diversified expo-
sures to the LNG business. We find that early entry into LNG fleet business that pro-
vides a quicker buildup of experience relative to other shipping firms with later entry
indicates higher profitability.
The empirical results also show that firms that began as LNG firms could also benefit
in terms of profitability and efficiency by diversifying into the non-LNG business. Di-
versifying into LNG fleet is a crucial subject confronting decision-making by CEOs of
shipping firms in charting the strategic direction of their shipping business. The results
should be useful to guide such decision-making and to inform potential stockholders in
understanding how the fleet composition could be an important business model affect-
ing their stock value.
AcknowledgementsThe article process charges of this work is supported by China Merchants Energy Shipping.
Authors’ contributionsConceptualization: KGL, ML; Data: ML; Analyses: KGL; Writing: KGL, ML. All authors approved the final manuscript.
Lim and Lim Journal of Shipping and Trade (2020) 5:23 Page 22 of 25
FundingNot applicable
Availability of data and materialsThe data used in the study are from subscription databases paid for by the Singapore Management University. This isnot publicly available. However, the FRED database is a public source database available from the web.
Competing interestsThe authors declare they have no competing interests.
Received: 28 December 2019 Accepted: 4 November 2020
ReferencesAlexandridis G, Kavussanos MG, Kim CY, Tsouknidis DA (2018) A survey of shipping finance research: setting the future
research agenda. Transport Res Part E Logistics Transport Rev:164–212. https://doi.org/10.1016/j.tre.2018.04.001Ansoff I (1957) Strategies for diversification. Harv Bus Rev 35(5):113–124Arora, Vivek B., and A. Vamvakidis (2004) How much do trading partners matter for economic growth? IMF Working Paper
No. 04/26.Bakkhali N., and L. Ziomas (2019) Forced boil-off gas: the future of LNG as a fuel for LNG carriers. McKinsey & Company 17
July, 2019.Barnes P (1987) The analysis and use of financial ratios: a review article, journal of business finance and accounting. Winter
14(4):449–461Barnett ML (2007) Stakeholder influence capacity and the variability of financial returns to corporate social responsibility.
Acad Manag Rev 32(3):794–816. https://doi.org/10.5465/AMR.2007.25275520Black F (1976) Studies of stock price volatility changes, Proceedings of the 1976 Meetings of the American Statistical
Association, Business and Economics Section, pp 177–181Boston Consulting Group Report (2020) Gas technology and innovation for a sustainable future, published by international
gas union, p 92Browning P (2019) The energy industry’s new focus on LNG, hydrogen and renewable technology is already enabling a
change in power ForbesBurel F, Taccani R, Zuliani N (2013) Improving sustainability of maritime transport through utilization of liquefied natural gas
(LNG) for propulsion. Energy 57:412–420 https://doi.org/10.1016/j.energy.2013.05.002Cai Wu_Gan, Zhou X-L (2014) On the drivers of eco-innovation: empirical evidence from China. J Clean Prod 79:239–248
https://doi.org/10.1016/j.jclepro.2014.05.035Cowen SS (1982) Usefulness of financial ratios in a single industry. J Bus Res 10(1):103–118D’agostini, Enrico, H.S. Nam, and S.H. Kang (2019) Gaining competitive advantage at sea: an overview of shipping lines’
strategic decisions. Int J Transport Eng Technol. 5(4), 74–81. https://doi.org/10.11648/j.ijtet.20190504.12Duffee GR (1995) Stock returns and volatility a firm-level analysis. J Financ Econ 37(3):399–420 https://doi.org/10.1016/0304-
405X(94)00801-7Edquist C (2005) Systems of innovation. Routledge, AbingdonElengy (2013) LNG: an energy of the future, elengy. https://www.elengy.com/en/lng/lng-an-energy-of-the-future.html.
Accessed 29 Sept 2020El-Masry, Olugbode M, Pointon J (2010) The exposure of shipping firms’ stock returns to financial risks and oil prices: a global
perspective. Marit Policy Manag 37(5):453–473Fama E, French KR (1992) The cross-section of expected stock returns. J Financ 47:427–465Fama E, French KR (1993) Common risk factors in the returns on stocks and bonds. J Financ Econ 33:3–56Fama E, French K (1995) Size and book to market factors in earnings and returns. J Financ 50:131–155Fleming J, Ostdiek B, Whaley RE (1995) Predicting stock market volatility: a new measure. J Futur Mark 15(3):265–302Fokkema JE, Buijs P, Vis IFA (2017) An investment appraisal method to compare LNG-fueled and conventional vessels.
Transport Res Part D Transport Environ 56:229–240 https://doi.org/10.1016/j.trd.2017.07.021Fombrun CJ (1996) Reputation: realizing value from the corporate image. Harvard Business School Press, BostonFombrun CJ, Gardberg NA, Barnett ML (2000) Opportunity platforms and safety nets: corporate citizenship and reputational
risk. Bus Soc Rev 105(1):85–106 https://doi.org/10.1111/0045-3609.00066Georg S, Røpke I, Jørgensen U (1992) Clean technology — innovation and environmental regulation. Environ Resour Econ
2(6):533–550 https://doi.org/10.1007/BF00330282Gkonis KG, Psaraftis HN (2009) The LNG market: A game theoretic approach to competition in LNG shipping. Marit Econ
Logistics 11(2):227–246 https://doi.org/10.1057/mel.2009.2Grammenos CT, Marcoulis SN (1996) A cross-section analysis of stock returns: the case of shipping firms. Marit Policy Manag
23(1):67–80GrandViewResearch (2019) Liquefied natural gas market size, share & trends analysis report by application (transportation fuel,
power generation), by region (North America, Europe, APAC, Central & South America, MEA), and segment forecasts,2020–2027. https://www.grandviewresearch.com/industry-analysis/liquefied-natural-gas-lng-market
Hagel JIII, Brown JS, Davison L (2010) The best way to measure company performance, Harvard Business Review, MarchHand, M. (2015) Diversification is good, but shipowners also need to understand the risks, Seatrade Maritime News, 2 June,
2015. https://www.seatrade-maritime.com/asia/diversification-good-shipowners-also-need-understand-risks. Accessed 29Sept 2020
Helenic Shipping News (2020) 1 SeptemberHolmgren J, Nikopoulou Z, Ramstedt L, Woxenius J (2014) Modelling modal choice effects of regulation on low-sulphur
marine fuels in Northern Europe. Transport Res Part D Transport Environ 28:62–73 https://doi.org/10.1016/j.trd.2013.12.009
Lim and Lim Journal of Shipping and Trade (2020) 5:23 Page 23 of 25

Horbach J (2008) Determinants of environmental innovation – new evidence from German panel data sources. Res Policy37(1):163–173 https://doi.org/10.1016/j.respol.2007.08.006
Horbach J, Rammer C, Rennings K (2012) Determinants of eco-innovations by type of environmental impact – the role ofregulatory push/pull, technology push and market pull. Ecol Econ 78:112–122 https://doi.org/10.1016/j.ecolecon.2012.04.005
International Gas Union (2020) 2020 world LNG report. https://www.igu.org/resources/2020-world-lng-report/. Accessed 29Sept 2020
Jensen MC (2002) Value maximization, stakeholder theory, and the corporate objective function. Bus Ethics Q 12(2):235–256https://doi.org/10.2307/3857812
Johansen S (1991) Estimation and Hypothesis Testing of Cointegration Vectors in Gaussian Vector Autoregressive Models.Econometrica 59(6):1551–1580.
Jose ML, Lancaster C, Stevens JL (1996) Corporate returns and cash conversion cycles. J Econ Financ 20(1) https://doi.org/10.1007/BF02920497
Kang H-W, Wang GWY, Bang HS, Woo S-H (2016) Economic performance and corporate financial management of shippingfirms. Marit Econ Logistics 18:317–330
Kavussanos MG, Visvikis ID (2016) The international handbook of shipping finance: theory and practice. Palgrave MacmillanPublishers, London
Kemp R’e, Olsthoorn X, Oosterhuis F, Verbruggen H (1992) Supply and demand factors of cleaner technologies: Someempirical evidence. Environ Resour Econ 2(6):615–634 https://doi.org/10.1007/BF00330287
Kesidou E, Demirel P (2012) On the drivers of eco-innovations: Empirical evidence from the UK. Res Policy 41(5):862–870https://doi.org/10.1016/j.respol.2012.01.005
Koseoglu SD, Karagulle AO (2013) Portfolio diversification benefits in shipping industry: a co-integration approach. RevFinance Bank 5(2):117–128
Lin W-C, Liu C-F (2005) Performance efficiency evaluation of the Taiwan’s shipping industry: an application of dataenvelopment analysis. Proc Eastern Asia Soc Transport Stud 5:467–476
LNGMasterplan (2018) What are the benefits of LNG? http://www.lngmasterplan.eu/lng/benefits-of-lng.html. Accessed 29Sept 2020
Magirou EF, Psaraftis HN, Babilis L, Denissis A (1997) Positioning and diversification in shipping, research center - AthensUniversity of Economics and Business, Report no. E194, March
Margolis JD, Walsh JP (2003) Misery loves companies: Rethinking social initiatives by business. Adm Sci Q 48(2):268–305https://doi.org/10.2307/3556659
Marin G (2014) Do eco-innovations harm productivity growth through crowding out? results of an extended CDM model forItaly. Res Policy 43(2):301–317 https://doi.org/10.1016/j.respol.2013.10.015
Mcwilliams A, Siegel D (1997) The role of money managers in assessing corporate social responsibility research. J Invest 6(4):98–107 https://doi.org/10.3905/joi.1997.408440
Niamié O, Germain, O. (2014), Strategies in shipping industry a review of “strategic management” papers in AcademicJournals. http://www.sefacil.com/sites/sefacil.com/files/Review%20Stra-tegies%20Shipping.pdf. Accessed 29 Sept 2020
OECD Report (2009) Sustainable manufacturing and eco-innovation: Framework, practices and measurement. OECD Report(2016) Reducing sulphur emissions from ships: The impact of international regulation
Offshore Energy newsletter (2018) Baltic exchange puts its LNG index on trial, 11 June 2018. https://www.offshore-energy.biz/baltic-exchange-puts-its-lng-index-on-trial/. Accessed 29 Sept 2020
Paris, Costas (2019) Shipping companies banking on gas carriers as LNG demand grows, The Wall Street Journal, 14 March,2019. https://www.wsj.com/articles/shipping-companies-banking-on-gas-carriers-as-lng-demand-grows-11552555800.Accessed 29 Sept 2020
Poon S-H, Granger CWJ (2003) Forecasting volatility in financial markets: a review. J Econ Lit 41(2):478–539Porter ME (1991) America’s green strategy. Sci Am 264(4):168 https://doi.org/10.1038/scientificamerican0491-168Porter ME, van der Linde C (1995) Toward a new conception of the environment competitiveness relationship. J Econ
Perspect 9(4):97–118Redding LS (1997) Firm size and dividend payouts. J Financ Intermed 6(3):224–248 https://doi.org/10.1006/jfin.1997.0221Rennings K, Zwick T (2002) Employment impact of cleaner production on the firm level: Empirical evidence from a survey in
five European countries. Int J Innov Manag 6(3):319–342 https://doi.org/10.1142/S136391960200060Rhodes, Jim, and Frank Soccoli (2013) Tips on reducing ship operating costs, in Marine Link, 16 SeptemberRoberts PW, Dowling GR (2002) Corporate reputation and sustained superior financial performance. Strateg Manag J 23(12):
1077–1093. https://doi.org/10.1002/smj.274Sand P (2018) Tanker shipping: a record poor tanker market with a growing fleet is prolonging the crisis, BIMCO News and
Trends, 30 AugustSaul J, Chestney N (2018) New fuel rules push shipowners to go green with LNG, Reuters News, 15 AugustSchaefer, K. (2012) The global shipping industry’s most profitable sector: LNG shipping, oil and gas investments bulletin,
OilPricecom 3 March. https://oilprice.com/Energy/Natural-Gas/The-Global-Shipping-Industrys-Most-Profitable-Sector-LNG-Shipping.html. Accessed 29 Sept 2020
Scott SV, Van Reenen J, Zachariadis M (2017) The long-term effect of digital innovation on bank performance: An empiricalstudy of swift adoption in financial services. Res Policy 46(5):984–1004 https://doi.org/10.1016/j.respol.2017.03.010
Slade ME (2003) Competing models of firm profitability. Int J Ind Organ 22(3):289–308 https://doi.org/10.1016/j.ijindorg.2003.12.001
S&P Global Platts (2018) Supercooled: the evolving LNG fleet driving the global gas boom, LNG Special Report, OctoberStafford ER, Polonsky M, Hartman CL (2000) Environmental NGO-business collaboration and strategic bridging: a case analysis
of the Greenpeace-Foron Alliance. Bus Strateg Environ 9(2):122–135Stopford M (2009) Martime Economics, 3rd edn. Routledge PublicationsTahara K, Kojima T, Inaba A (1997) Evaluation of CO2 payback time of power plants by LCA. Energy Convers Manag 38:615–
620
Lim and Lim Journal of Shipping and Trade (2020) 5:23 Page 24 of 25
Thomson H, Corbett JJ, Winebrake JJ (2015) Natural gas as a marine fuel. Energy Policy 87:153–167 https://doi.org/10.1016/j.enpol.2015.08.027
Triguero A, Moreno-Mondéjar L, Davia MA (2013) Drivers of different types of eco-innovation in European SMEs. Ecol Econ92:25–33. https://doi.org/10.1016/j.ecolecon.2013.04.009
Tsiournas V, Papadimitriou S (2016) The dynamic relationship between freight markets and commodity prices revealed. MaritEcon Logistics 20:267–279
Tsolakis, S. (2005) Econometric modelling of bulk shipping markets: implications for investment strategies and financialdecision making’. Unpublished PhD Thesis, Erasmus University Rotterdam. Available from: http://repub.eur.nl/publications/dissertations/em_diss/ese_diss/928072811/.
Ubmemea (2014) LNG, offshore top NYK president’s new year’s honours list, Seatrade Maritime News. https://www.seatrade-maritime.com/asia/lng-offshore-top-nyk-president-s-new-year-s-honours-list. Accessed 29 Sept 2020
UNCTAD Technical Report (2010) Oil prices and maritime freight rates: an empirical investigation, UNCTAD/DTL/TLB/2009/2 1April.
Waddock SA, Graves SB (1997) The corporate social performance-financial performance link. Strateg Perform J 18(4):303–319.https://doi.org/10.1002/(SICI)1097-0266(199704)18:4h303::AID-SMJ869i3.0.CO;2-G
Wagner M (2007) Empirical influence of environmental management on innovation: Evidence from Europe. Ecol Econ 66(2–3):392–402. https://doi.org/10.1016/j.ecole-con.2007.10.001
Wang Y-J (2002, 12) Liquidity management, operating performance, and corporate value: evidence from Japan and Taiwan. JMultinational Financ Manag (2):159–169. https://doi.org/10.1016/S1042-444X(01)00047-0
Winn S, Roome N (1993) R&D management responses to the environment: current theory and implications to practice andresearch. R&D Manag 23(2):147–160. https://doi.org/10.1111/j.1467-9310.1993.tb00082.x
Yoo B-Y (2017) Economic assessment of liquefied natural gas (LNG) as a marine fuel for CO2 carriers compared to marine gasoil (MGO). Energy 121:772–780. https://doi.org/10.1016/j.energy.2017.01.061
Zacharioudakis PG, Stylianos I, Dimitrios VL, Psaraftis HN (2011) Liner shipping cycle cost modelling, fleet deploymentoptimisation and what-if analysis. Marit Econ Logistics 13:278–297
Publisher’s NoteSpringer Nature remains neutral with regard to jurisdictional claims in published maps and institutional affiliations.
Lim and Lim Journal of Shipping and Trade (2020) 5:23 Page 25 of 25