Embed Size (px)
Citation preview
Market shifts shaping LNG shippingAnita Odedra, Director - LNG Supply & Commercial Operations Association of Ship Brokers & Agents (U.S.A.), Inc.
28 – 30 September 2011
Legal disclaimer
The following presentation contains forward-looking statements concerning BG Group plc strategy,operations, financial performance or condition, outlook, growth opportunities or circumstances in thecountries, sectors or markets in which BG Group plc operates. By their nature, forward-lookingstatements involve uncertainty because they depend on future circumstances and relate to eventsthat cannot always be controlled or predicted. Although the Company believes that the expectationsreflected in such forward-looking statements are reasonable, no assurance can be given that suchexpectations will prove to have been correct. Actual results could differ materially from the guidancegiven in this presentation for a number of reasons. For a detailed analysis of the factors that mayaffect our business, financial performance or results of operations, we urge you to look at the“Principle risks and uncertainties” included in the BG Group plc Annual Report & Accounts 2010.Nothing in this presentation should be construed as a profit forecast and no part of this presentationconstitutes, or shall be taken to constitute, an invitation or inducement to invest in BG Group plc orany other entity, and must not be relied upon in any way in connection with any investment decision.BG Group plc undertakes no obligation to update any forward-looking statements.
No representation or warranty, express or implied, is or will be made in relation to the accuracy orcompleteness of the information in this presentation and no responsibility or liability is or will beaccepted by BG Group plc or any of its respective subsidiaries, affiliates and associated companies(or by any of their respective officers, employees or agents) in relation to it.
2
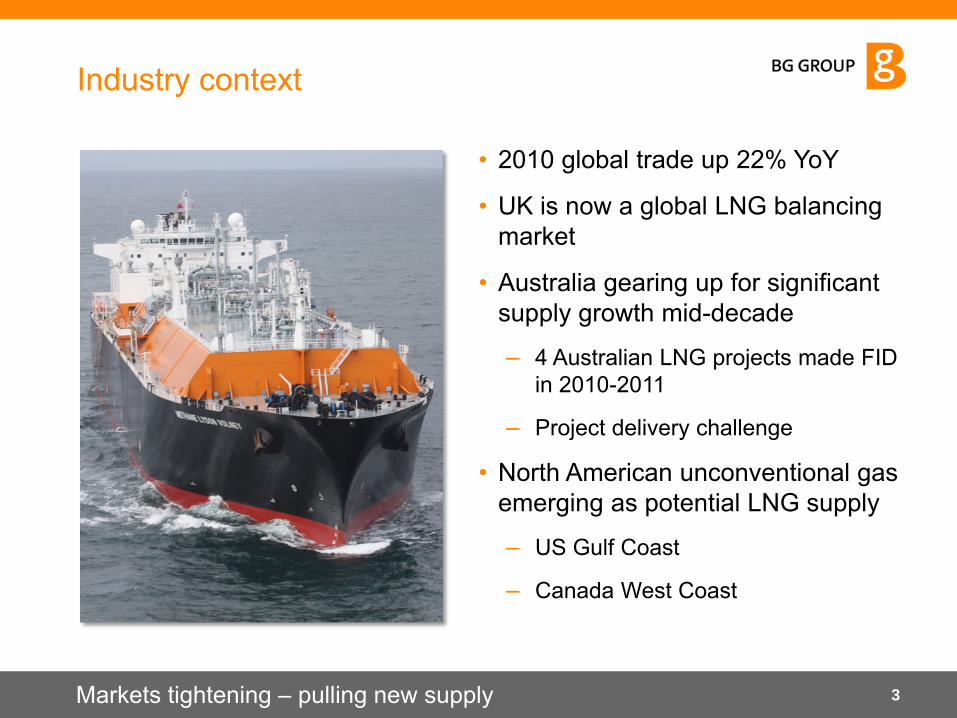
Industry context
• 2010 global trade up 22% YoY
• UK is now a global LNG balancing market
• Australia gearing up for significant supply growth mid-decade
– 4 Australian LNG projects made FID in 2010-2011
– Project delivery challenge
• North American unconventional gas emerging as potential LNG supply
– US Gulf Coast
– Canada West Coast
3Markets tightening – pulling new supply
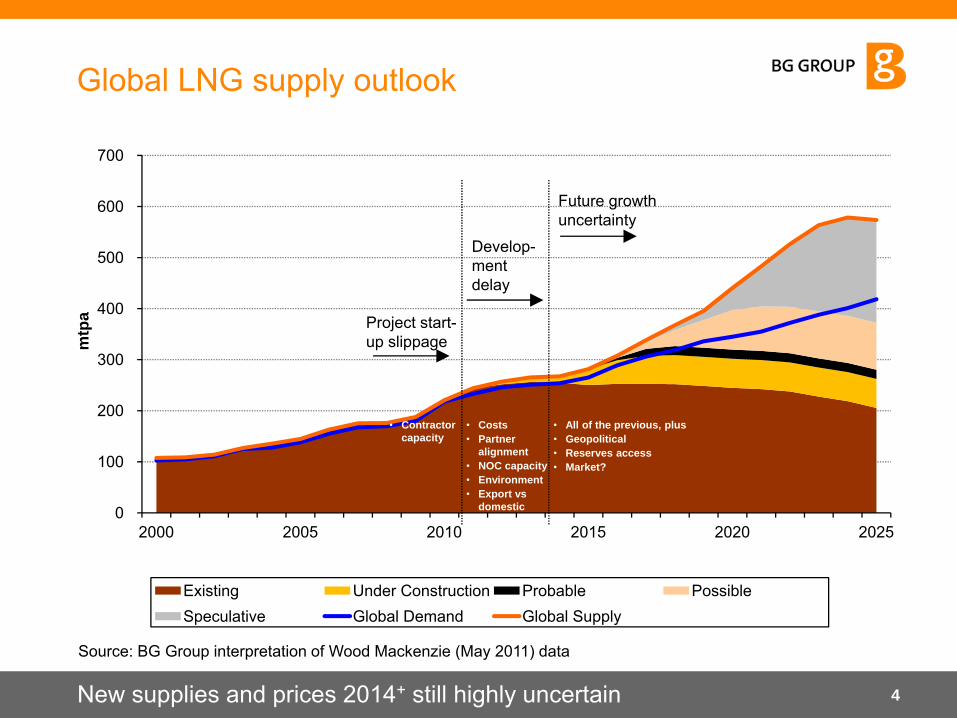
Global LNG supply outlook
4New supplies and prices 2014+ still highly uncertain
0
100
200
300
400
500
600
700
2000 2005 2010 2015 2020 2025
mtp
a
Existing Under Construction Probable PossibleSpeculative Global Demand Global Supply
Develop-mentdelay
Future growth uncertainty
Project start-up slippage
• Contractor capacity
• Costs• Partner
alignment• NOC capacity• Environment• Export vs
domestic
• All of the previous, plus• Geopolitical• Reserves access• Market?
Source: BG Group interpretation of Wood Mackenzie (May 2011) data
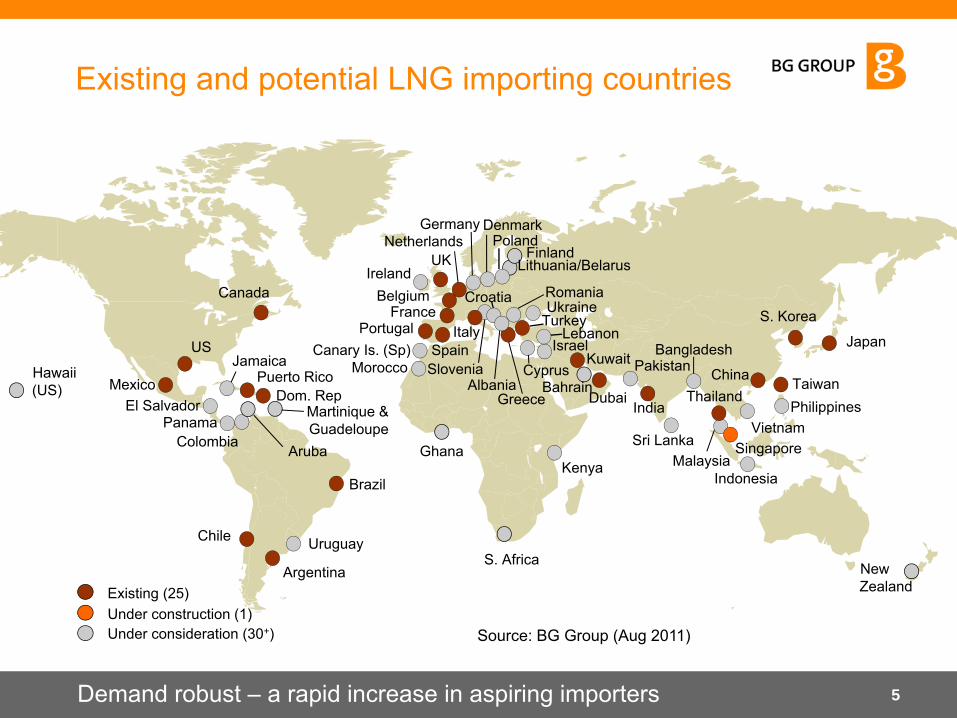
Existing and potential LNG importing countries
Demand robust – a rapid increase in aspiring importers
Existing (25)
Under consideration (30+)Under construction (1)
Uruguay
Jamaica
El Salvador
Hawaii (US) Mexico
US
Dom. Rep
Chile
Canada
Canary Is. (Sp)
Argentina
Source: BG Group (Aug 2011)
Panama
New Zealand
Brazil
S. Africa
Kenya
Japan
S. Korea
Indonesia
Philippines
SingaporeSri Lanka
Pakistan
Vietnam
Bangladesh
TaiwanMorocco
Belgium
NetherlandsDenmark
China
India
Portugal
PolandGermany
Ireland
France
Thailand
UkraineTurkey
Greece
Romania
Lebanon
CyprusKuwaitSpain
DubaiBahrain
UK
ItalyIsrael
Albania
Croatia
Colombia
FinlandLithuania/Belarus
Slovenia
Malaysia
Martinique & Guadeloupe
Aruba
Puerto Rico
5
Ghana
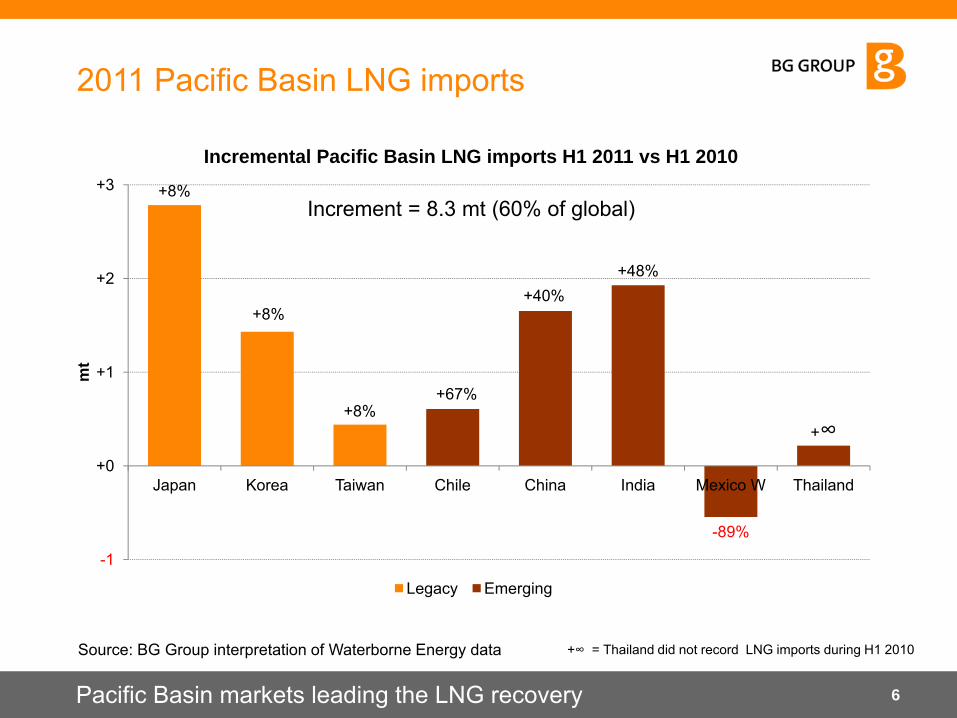
+8%
+8%
+8%+67%
+40%+48%
-89%
+∞
-1
+0
+1
+2
+3
Japan Korea Taiwan Chile China India Mexico W Thailand
mt
Incremental Pacific Basin LNG imports H1 2011 vs H1 2010
Legacy Emerging
Pacific Basin markets leading the LNG recovery
2011 Pacific Basin LNG imports
6
Increment = 8.3 mt (60% of global)
Source: BG Group interpretation of Waterborne Energy data +∞ = Thailand did not record LNG imports during H1 2010
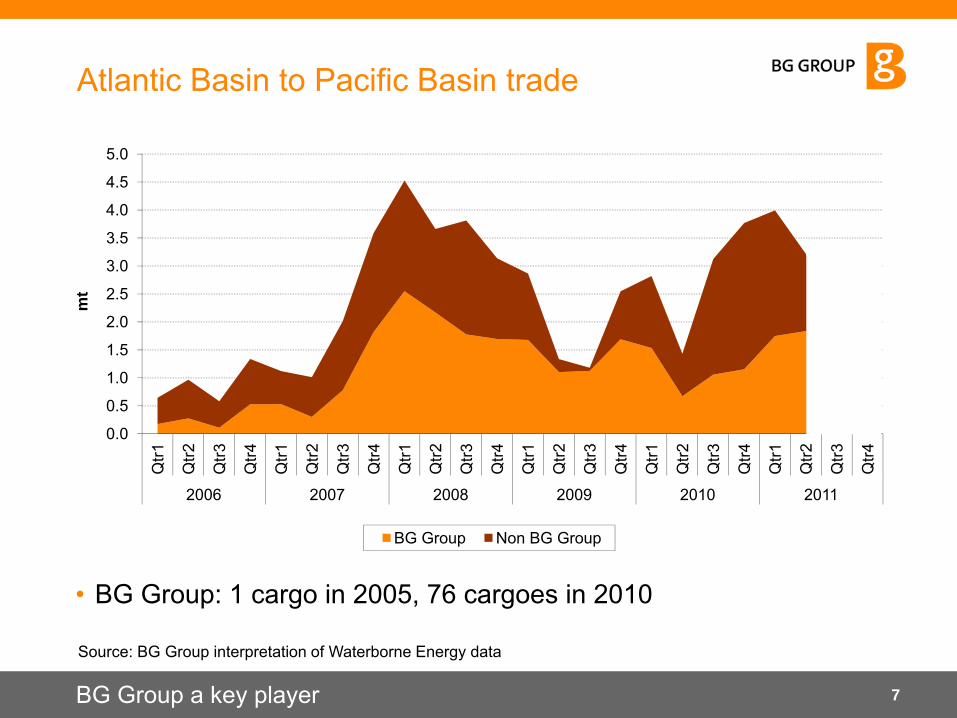
Atlantic Basin to Pacific Basin trade
• BG Group: 1 cargo in 2005, 76 cargoes in 2010
7
0.0
0.5
1.0
1.5
2.0
2.5
3.0
3.5
4.0
4.5
5.0Q
tr1
Qtr2
Qtr3
Qtr4
Qtr1
Qtr2
Qtr3
Qtr4
Qtr1
Qtr2
Qtr3
Qtr4
Qtr1
Qtr2
Qtr3
Qtr4
Qtr1
Qtr2
Qtr3
Qtr4
Qtr1
Qtr2
Qtr3
Qtr4
2006 2007 2008 2009 2010 2011
mt
BG Group Non BG Group
Source: BG Group interpretation of Waterborne Energy data
BG Group a key player
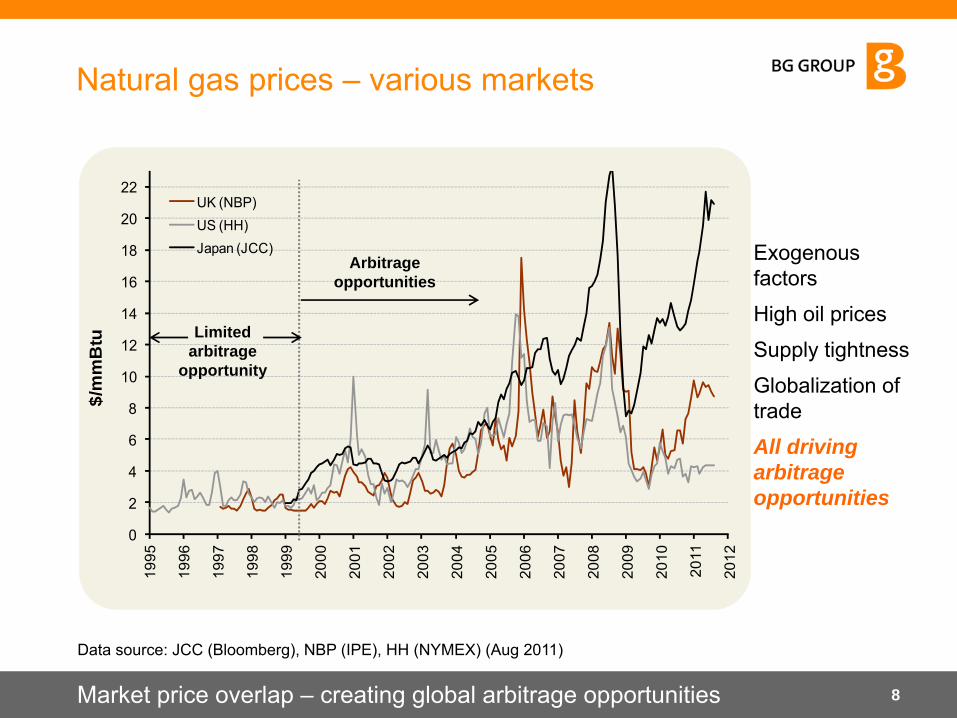
• Exogenous factors
• High oil prices
• Supply tightness
• Globalization of trade
All driving arbitrage opportunities
Natural gas prices – various markets
Market price overlap – creating global arbitrage opportunities
Data source: JCC (Bloomberg), NBP (IPE), HH (NYMEX) (Aug 2011)
8
0
2
4
6
8
10
12
14
16
18
20
22
1995
1996
1997
1998
1999
2000
2001
2002
2003
2004
2005
2006
2007
2008
2009
2010
2011
2012
$/m
mB
tu
UK (NBP)US (HH) Japan (JCC)
Limited arbitrage
opportunity
Arbitrage opportunities
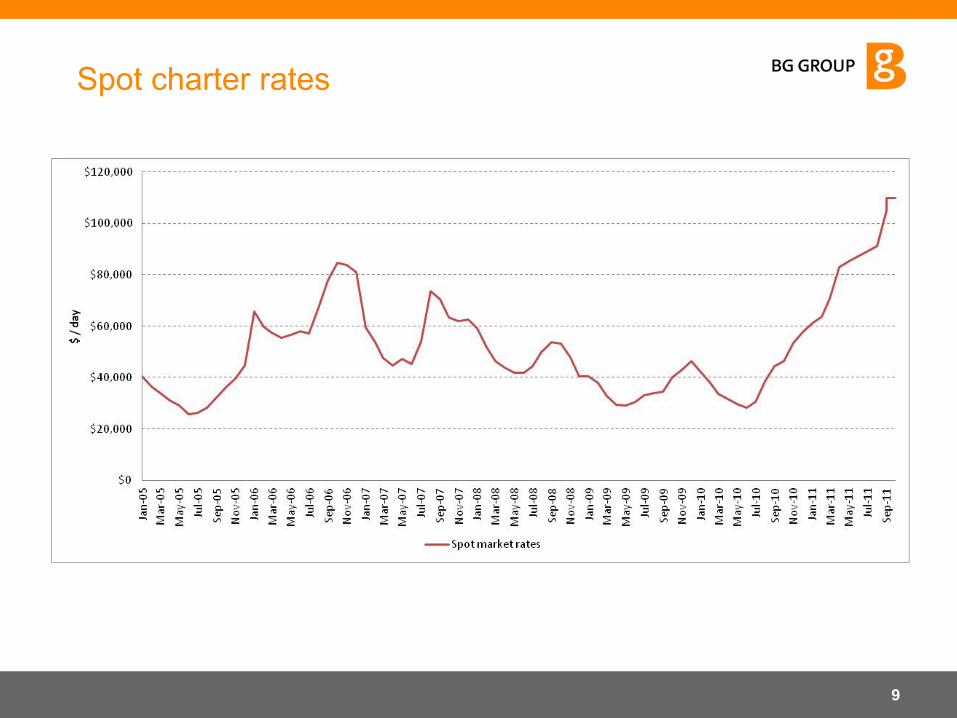
Spot charter rates
9
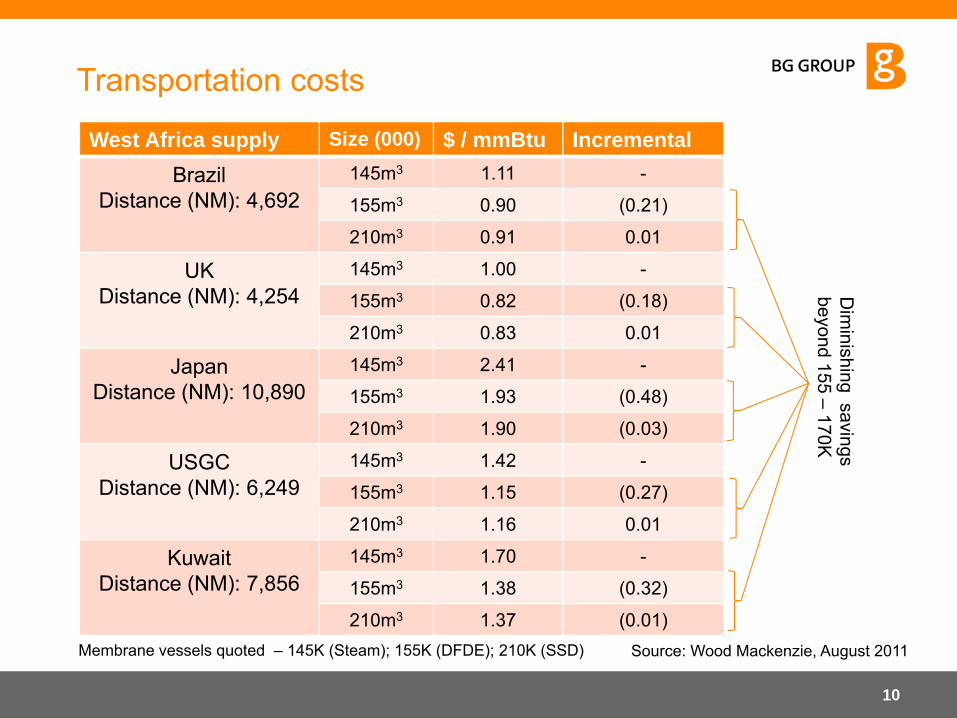
Transportation costs
West Africa supply Size (000) $ / mmBtu IncrementalBrazil
Distance (NM): 4,692145m3 1.11 -
155m3 0.90 (0.21)
210m3 0.91 0.01
UKDistance (NM): 4,254
145m3 1.00 -
155m3 0.82 (0.18)
210m3 0.83 0.01
JapanDistance (NM): 10,890
145m3 2.41 -
155m3 1.93 (0.48)
210m3 1.90 (0.03)
USGCDistance (NM): 6,249
145m3 1.42 -
155m3 1.15 (0.27)
210m3 1.16 0.01
KuwaitDistance (NM): 7,856
145m3 1.70 -
155m3 1.38 (0.32)
210m3 1.37 (0.01)
10
Dim
inishing savings beyond 155 –
170K
Source: Wood Mackenzie, August 2011Membrane vessels quoted – 145K (Steam); 155K (DFDE); 210K (SSD)
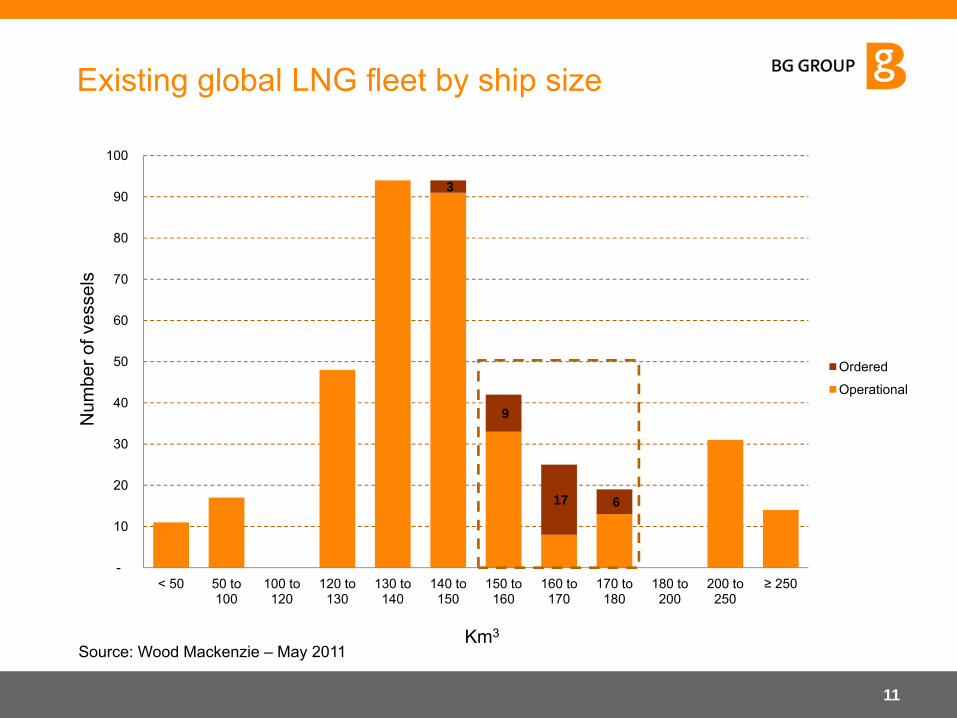
Existing global LNG fleet by ship size
11
3
9
17 6
-
10
20
30
40
50
60
70
80
90
100
< 50 50 to 100
100 to 120
120 to 130
130 to 140
140 to 150
150 to 160
160 to 170
170 to 180
180 to 200
200 to 250
≥ 250
Ordered
Operational
Source: Wood Mackenzie – May 2011
Num
ber o
f ves
sels
Km3
Challenges
• Low sulfur fuel requirements
• New entrants
• Crewing
• Low liquidity and volatility
• Cost management
12

Thank you