Embed Size (px)
Citation preview
NBER WORKING PAPER SERIES
FINANCIAL DEVELOPMENT AND OUTPUT GROWTH IN DEVELOPING ASIA AND LATIN AMERICA:A COMPARATIVE SECTORAL ANALYSIS
Joshua AizenmanYothin JinjarakDonghyun Park
Working Paper 20917http://www.nber.org/papers/w20917
NATIONAL BUREAU OF ECONOMIC RESEARCH1050 Massachusetts Avenue
Cambridge, MA 02138January 2015
Useful comments by Marcus Noland, Shang-Jin Wei, and other participants at a workshop at AsianDevelopment Bank in Manila, Philippines, on 4 November 2014 seminar are gratefully acknowledged.The views expressed herein are those of the authors and do not necessarily reflect the views of theNational Bureau of Economic Research.
At least one co-author has disclosed a financial relationship of potential relevance for this research.Further information is available online at http://www.nber.org/papers/w20917.ack
NBER working papers are circulated for discussion and comment purposes. They have not been peer-reviewed or been subject to the review by the NBER Board of Directors that accompanies officialNBER publications.
© 2015 by Joshua Aizenman, Yothin Jinjarak, and Donghyun Park. All rights reserved. Short sectionsof text, not to exceed two paragraphs, may be quoted without explicit permission provided that fullcredit, including © notice, is given to the source.
Financial Development and Output Growth in Developing Asia and Latin America: A ComparativeSectoral AnalysisJoshua Aizenman, Yothin Jinjarak, and Donghyun ParkNBER Working Paper No. 20917January 2015JEL No. G20,G30,O40,O47,O57
ABSTRACT
We use data from the Groningen Growth and Development Centre (GGDC) database to perform preliminaryempirical analysis of the interplay between quality and quantity of finance in accounting for the outputgrowth of ten sectors. We review the existing literature and some salient open questions pertainingto the relationship between financial depth and output growth. Our analysis looks at the finance-growthnexus in 41 economies, including 11 East Asian and 9 Latin American economies for a comparisonbetween two regions which are at similar income levels. We document large differences between thetwo regions in terms of the impact of financial depth on sectoral growth, and validate the negativeimpact of financial deepening on output growth in several sectors. Our results suggest that the impactof financial development on growth may be non-linear – i.e. it may promote growth only up to a point.
Joshua AizenmanEconomics and SIRUSCUniversity ParkLos Angeles, CA 90089-0043and [email protected]
Yothin JinjarakSchool of Economics and Finance Victoria University of Wellington PO Box 600 23 Lambton Quay, WellingtonNew Zealand 6140 [email protected]
Donghyun ParkEconomics and Research DepartmentAsian Development BankManila, [email protected]
2
1 Introduction
A lingering challenge in applied economics is measuring and controlling the quality
of services – e.g. health care, education, and finance. Since services are measured at
cost, their GDP share is correlated with per capita GDP. But short of controlling for the
quality of services, it is not clear if the growing share of services in the GDP adds to
welfare. To illustrate, in in 2012, the GDP share of medical services was 17.9% in the US,
10.9% in Canada, 11.7% in France 11.7%, and 9.4% in the UK. Yet there is no evidence
that the US health services deliver on average better quality of outcome. To the contrary,
for most conventional measures of average quality of health, life expectancy at birth and
the like, the US lags many other OECD countries by wide margins [OECD (2013)].1
Similar observations apply to education and other services. Even after adjusting for PPP,
the links between expenditure on services and the quality of these services in the OECD
countries remain tenuous at best.
For financial services, the global financial crisis (GFC) underlines the relevance of
such concerns. GFC paralyzed global financial systems and almost brought the world
economy to its knees. According to conventional wisdom, financial depth contributes to
the growth of the real sector, but the evidence remains mixed at best. The GFC put to the
fore the possibility that the relationship between financial depth and output growth may
be non-linear and unstable overtime. That is, the development of the financial sector may
benefit the real sector, but only up to a point. Beyond that point, further financial
development may have no effect or even a negative effect on growth. For example, the
1 The share data taken from the World Bank, http://data.worldbank.org/indicator/SH.XPD.TOTL.ZS (accessed September 10, 2104).
3
GFC was preceded by a wave of financial innovation which produced many complex high-
tech financial products but entailed little obvious benefit for growth. Excessive financial
innovation that overwhelms the regulatory capacity of regulatory authorities can culminate
in financial crisis which sets back growth for some time.
Concerns about too much finance are more relevant for advanced economies that
already have mature, sophisticated financial sectors with a good mix of banks and capital
markets than for developing economies with backward financial sectors. Diminishing
marginal returns to financial development are more likely at higher levels of financial
development. However, there are fundamental measurement issues that affect both
advanced and developing economies. The crux of the problem is that the standard
measures of financial development are quantitative measures such as the ratio of private
credit to GDP. Quantitative measures are highly imperfect measures of financial
development, which refers to the quality of the financial system, or its ability to allocate
resources to the most productive uses. For example, it is conceivable that even as the
financial system expands in size, its capacity to channel resources efficiently stagnates
or even recedes. Perhaps no country epitomizes such risks better than today’s China.
East Asian countries generally have large financial sectors relative to their income
levels. Yet they remain well inside the global finance frontier, as evident in their recycling
of much of their abundant savings through the financial markets of the advanced
economies. Even within the context of East Asia, China has an exceptionally large
financial sector, yet few would mistake the large size as evidence of financial
development. To the contrary, there are widespread concerns that an unsustainable
expansion of credit – i.e. unsustainable expansion of financial sector – is jeopardizing
4
financial stability and eroding the quality of investments. A specific major concern is that
state-owned banks may be channeling credit to state-owned firms at the expense of credit
to the dynamic private sector. Latin America and East Asia are at similar income levels
but one key difference is the relative abundance of savings in the latter. As such, a
comparative analysis of the finance-growth nexus in the two regions is worthwhile.
This paper marks a preliminary attempt to explore some of the above issues by
delving into the relationship between financial depth and sectoral output growth. The
sectoral data encompass 10 sectors - agriculture, mining, manufacturing, construction,
public utilities, retail and wholesale trade, transport and communication, finance and
business services, other market services, and government services. Our analysis covers
41 economies, including 11 East Asian and 9 Latin American economies which we
compare.2 We use data from international financial institutions for measures of financial
depth, financial spreads, and several proxies for quality and availability of finance. While
the financial data are far from satisfactory, our paper provides preliminary insights about
the key issues at hand and raises some questions that need further investigation. We
review the literature, describe the data and empirical framework, report and discuss the
preliminary results, and conclude with some final observations.
2 It gives sectoral detail to the historical macro data in Maddison (2003) from 1950 onwards. The data for Asia and Latin-America are based on Marcel P. Timmer and Gaaitzen J. de Vries (2007), 'A Cross-Country Database For Sectoral Employment And Productivity In Asia And Latin America, 1950-2005', GGDC Research memorandum GD-98, Groningen Growth and Development Centre, August 2007. Data for Europe and the US is based on an update of Bart van Ark (1996), Sectoral Growth Accounting and Structural Change in Post-War Europe, in B. van Ark and N.F.R. Crafts, eds., Quantitative Aspects of Post-War European Economic Growth, CEPR/Cambridge University Press, pp. 84-164See http://www.rug.nl/research/ggdc/data/10-sector-database.
5
2 Literature Review
The importance of the quality of financial intermediation has been well recognized
in the literature, though identifying its effect remains a work in progress [see Levine (2005)
for a comprehensive review]. Boyd and Smith (1992) show that the quality of financial
intermediation has first order effects on capital flows and economic growth. In a model
with adverse selection and costly state verification in which both debt contracts and credit
rationing are observed, capital may flow from capital scarce countries to capital abundant
countries if the capital abundant countries have financial intermediaries that are
sufficiently more effective at exerting corporate control than the capital scarce countries.
This insightful paper provides a nice interpretation to the Lucas paradox (1992) of capital
flowing uphill, a topic that gained even more attention in the context of the global
imbalances in the 2000s [see Laura et al. (2003), Ju and Wei (2011) and the references
therein]. Thus, even though the physical marginal product of capital is higher in capital
scarce countries, investors recognize that their expected returns depend on the
monitoring quality of financial intermediaries.
Follow-up papers showed that the quality of financial intermediation is impacted by
factors beyond the cost of monitoring. Boyd, Levine and Smith (2001) showed that the
quality of financial intermediation is hampered by inflation. For economies with inflation
rates exceeding 15 percent, there is a discrete drop in financial sector performance. La
Porta et al. (2000) highlighted the role of a well-functioning legal system in facilitating
efficient financial intermediaries – greater protection of creditors’ rights and more efficient
courts enable more efficient intermediation. The degree of competition and market
contestability also matter. The relaxation of states’ regulations on interstate branching in
6
the US during the 1970 provided ‘a natural experiment’ used to uncover the gains of
quantity versus quality of finance. Jayaratne and Strahan (1996) found that branch reform
boosted bank lending quality and accelerated real per capita growth rates. The channels
at work were mostly the quality, and not the quantity of finance. Dehejia and Lleras-Muney
(2003) finds that branch reform accelerated economic growth by improving the quality of
bank loans and the efficiency of capital allocation, with little evidence that branch reform
boosted quantity of lending.
The importance of financial dependence heterogeneity across sectors has been
highlighted by the pioneering study of Rajan and Zingales (1998). Since lower costs of
external finance facilitate firm growth and new firm formation, industries that are heavier
users of external finance should benefit disproportionately from financial development.
Their study validated this conjecture, finding that financial development has a bigger
effect on the growth of industries which are more dependent on external finance, both
through the expansion of existing firms and through the formation of new firms. Extending
Rajan and Zingales (1998), Claessens and Laeven (2003) find evidence that better
property rights promotes higher growth through improved asset allocation. Quantitatively,
this growth effect is as large as that of improved access to financing due to financial
development.
The GFC renewed attention on the interplay between the quantity and quality of
finance. Cecchetti and Kharroubi (2012) studies how financial development affects growth
at both the country and industry level. Based on a sample of developed and emerging
economies, they find the level of financial development is good only up to a point, after
which it becomes a drag on growth. For private sector credit extended by banks, the
7
turning point is close to 90% of GDP. For advanced economies, they show that a fast-
growing financial sector can be detrimental to aggregate productivity growth. Looking at
industry-level data, they find that financial sector growth disproportionately harms
industries that are either financially dependent or R&D-intensive. Arcand, Berkes, and
Panizza (2012) report similar findings. Finance starts having a negative effect on output
growth when credit to the private sector reaches 100% of GDP. Intriguingly, these results
are not driven by output volatility, banking crises, low institutional quality, or by differences
in bank regulation and supervision. Instead, they appear to be in line with Rousseau and
Wachtel (2011)’s "vanishing effect" – i.e. credit has no statistically significant impact on
GDP growth over the 1965-2004 period. Looking at the more recent data, Philippon and
Reshef (2013) concluded that at the very high end of financial development, rapidly
diminishing social returns may have set in.
Aizenman, Pinto and Sushko (2013) examine how financial cycles affect the
broader economy through their impact on real economic sectors during 1960–2005.
Periods of accelerated growth of the financial sector are more likely to be followed by
abrupt financial contractions than are periods of slower financial sector growth. While the
majority of real sectors are adversely affected by financial contractions, they are not
helped by expansions. Though these studies do not identify the mechanisms associated
with the “vanishing effect” of finance, they are consistent with Minsky (1974)’s hypothesis
over time that financial deepening may eventually divert financial resources from
financing real activities into speculative and ultimately destabilizing risky and bubbly yield-
seeking financial investments. Rajan (2005)’s seminal paper outlined the ways in which
8
deregulation and distorted incentives induce financial managers to overlook tail risks,
causing financial deepening to culminate in larger financial crises.
The recent empirical literature validated the key role of credit cycles. Schularick
and Taylor (2009) presents long-run historical data showing that financial instability was
often the result of "credit booms gone wrong". Their analysis lends support to the Minsky-
Kindleberger view of financial crises (Eichengreen and Mitchener, 2003). The credit
system seems all too capable of creating its very own shocks, judging by how well past
credit growth predicts future financial crises. The dynamic role of credit overhang is
further validated by Òscar, Schularick, and Taylor (2011). Analyzing over 200 recessions
in 14 advanced countries between 1870 and 2008, they find that financial crisis
recessions are more costly than normal recessions in terms of lost output. For both types
of recessions, credit-intensive expansions tend to be followed by deeper recessions and
slower recoveries. Credit growth also affects the behavior of other key macroeconomic
variables such as investment, lending, interest rates, and inflation.
Taking stock of the literature, one may conjecture that credit boom and bust cycles
associated with financial deepening would disproportionately affect activities and sectors
that rely on stable external finance and are subject to larger sunk costs. The tenuous link
between financial depth and growth may reflect a host of factors, including the damaging
and uneven effects of credit cycles, as well the rent seeking associated with distorted
incentives in the financial sector, where excessive risk taking and financial innovation may
precipitate instability that penalizes credit dependent sectors. This is all the more likely if
the greater short and medium run profits associated with financial innovations divert credit
from the real economy to further deepening of speculative financial intermediation.
9
3 Data
Data are derived from several sources subject to data availability. Sectoral Value-
Added per Worker, which is used to calculate Sectoral Output Growth (%) for 1996-2011,
are from Groningen Growth and Development Centre (GGDC) 10-Sector Database.
Controls for quality of financial intermediation are available at various years and more
recently. Bank Private Credit to GDP (%) and Lending-Deposit Interest Spread (%) for
1996-2011 are from Global Financial Development Database (2013 version); Getting
Credit Index and Resolving Insolvency Index for 2005-2011 are from Doing Business
Database; Depositors with Commercial Bank per 1,000 Adults and SME Loans from
Commercial Banks (% GDP) for 2005-2011 are from Financial Access Survey Database.
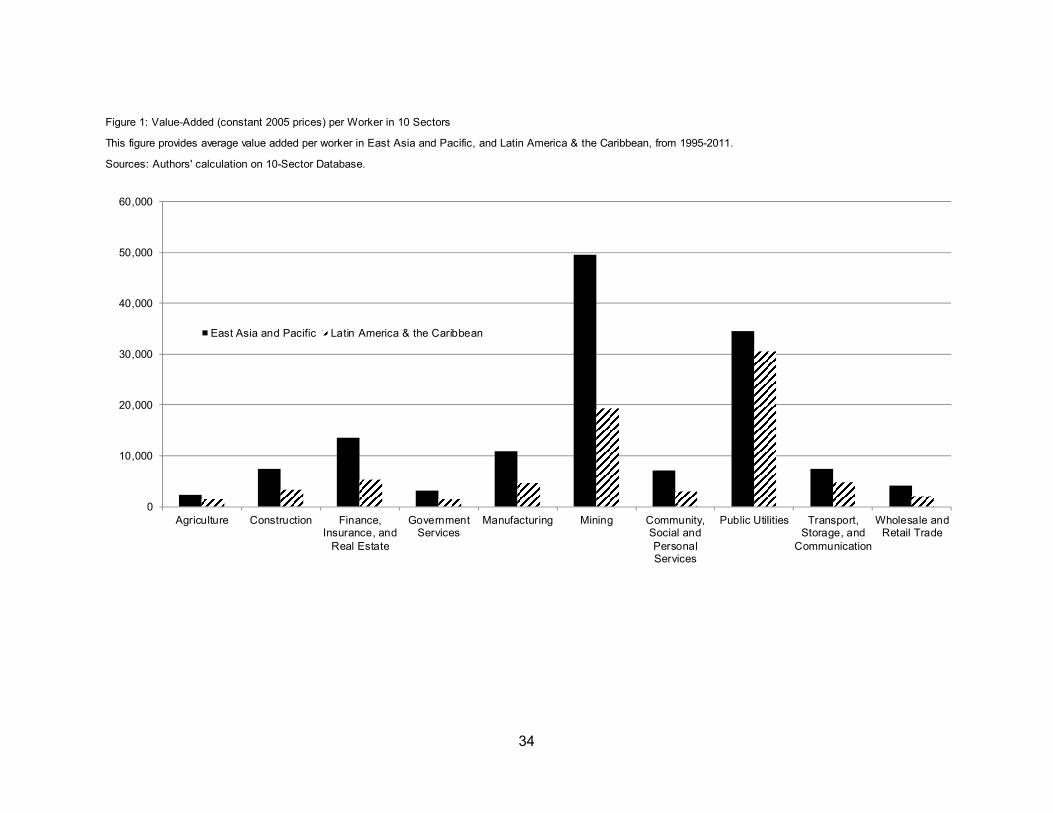
Figure 1 plots average value-added per worker for 1996-2011. Across the ten
sectors the level of value-added per worker in East Asia and Pacific is higher than the
level in Latin America & the Caribbean. The differences can be quite large, ranging from
1.1 times in public utilities sector, 2.3 times in manufacturing sector, all the way to 2.6
times in financial and business services sector. In the following we examine to what
extent these differences could be attributable to quality of financial intermediation
between the two regions.
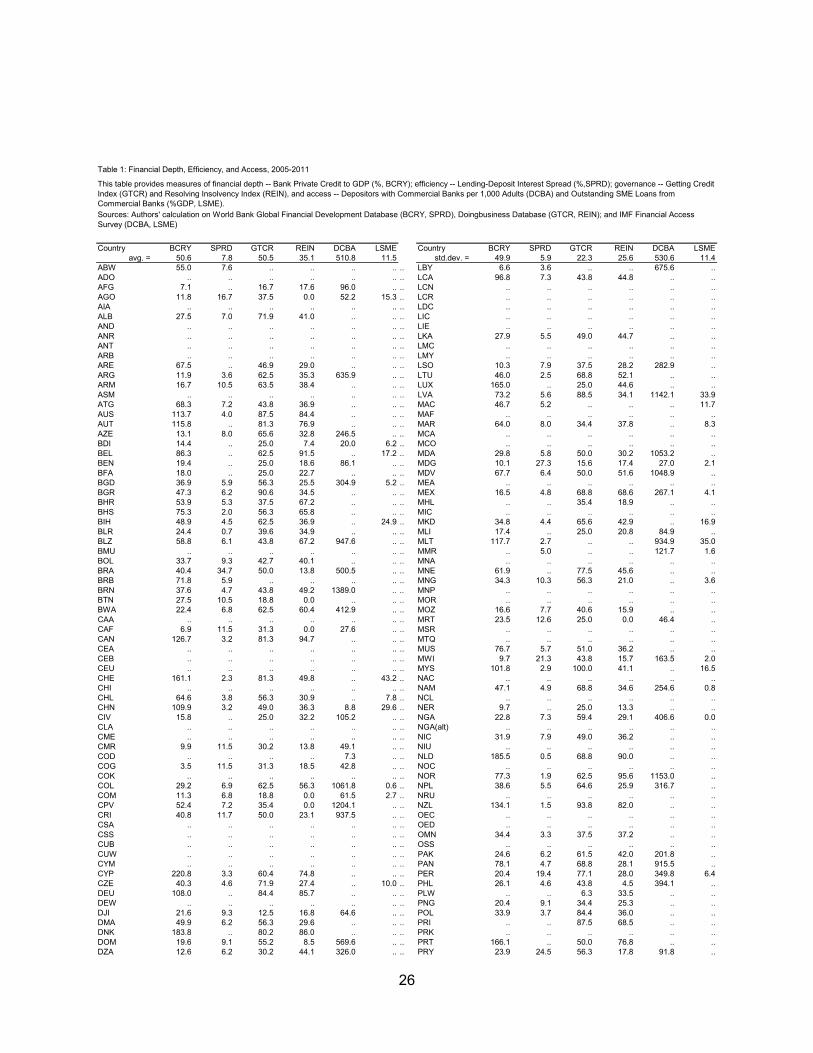
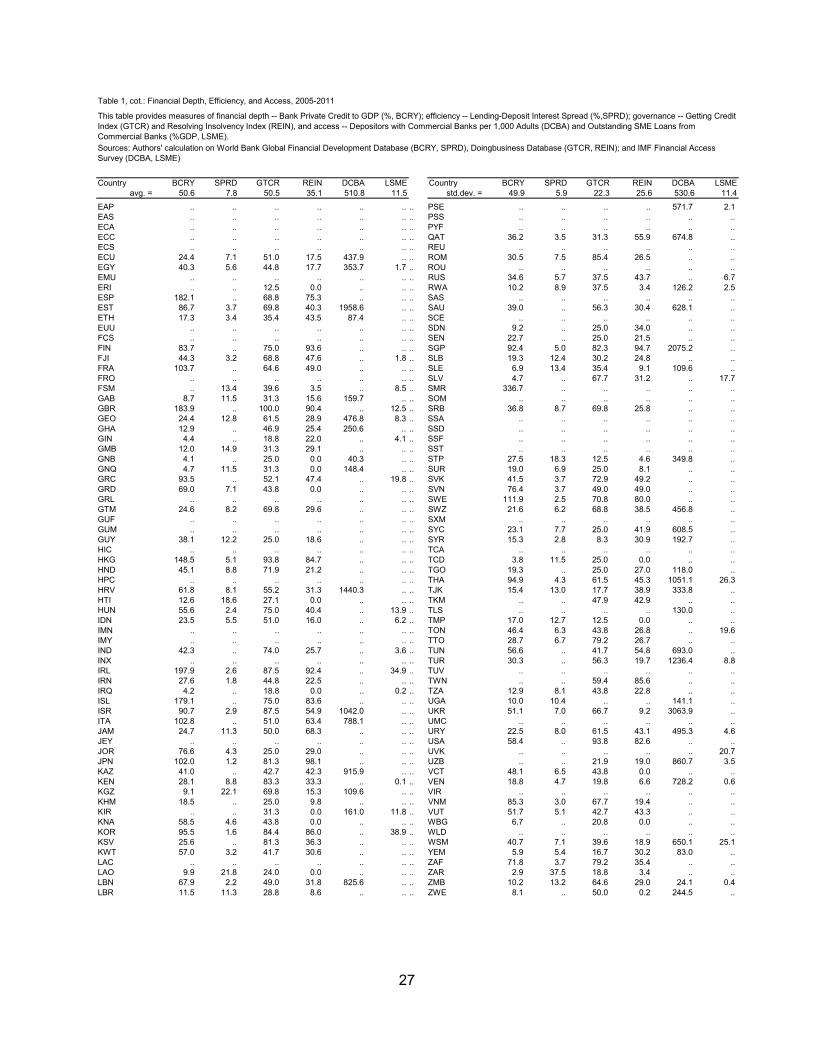
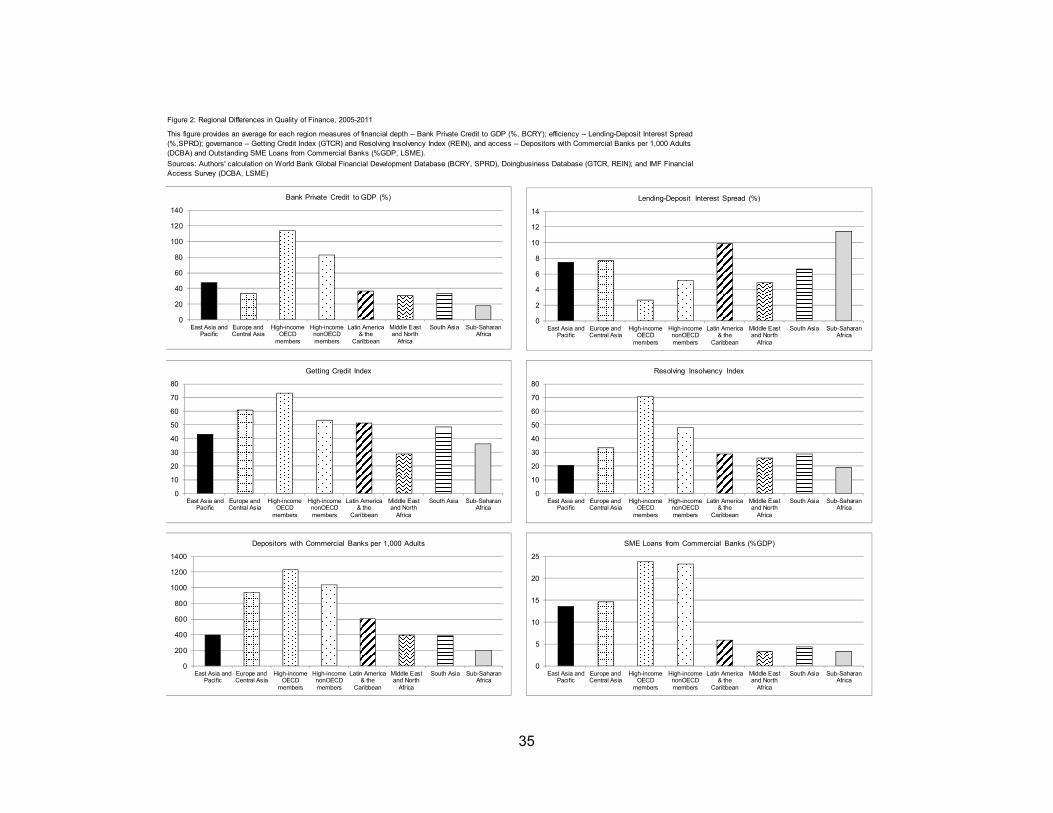
Table 1 provides the 2005-2011 average quality of financial intermediation for all
the 280 countries for which data are available. Figure 2 then summarizes regional
differences in the quality of financial intermediation. Note that only countries in East Asia
and Pacific, Latin America & the Caribbean, and a few other areas have sectoral output
data from GGDC, while measures of quality of financial intermediation are missing
10
altogether for some countries. Data are available for sectoral output growth, financial
depth (bank private credit to GDP), and financial efficiency (lending-deposit interest
spread) for 1996-2004, and for all other measures of the quality of finance for 2005-2013.
As a result, we perform descriptive data analysis for 2005-2011 and more formal empirical
analysis for 1996-2011 on selected variables subject to data availability.
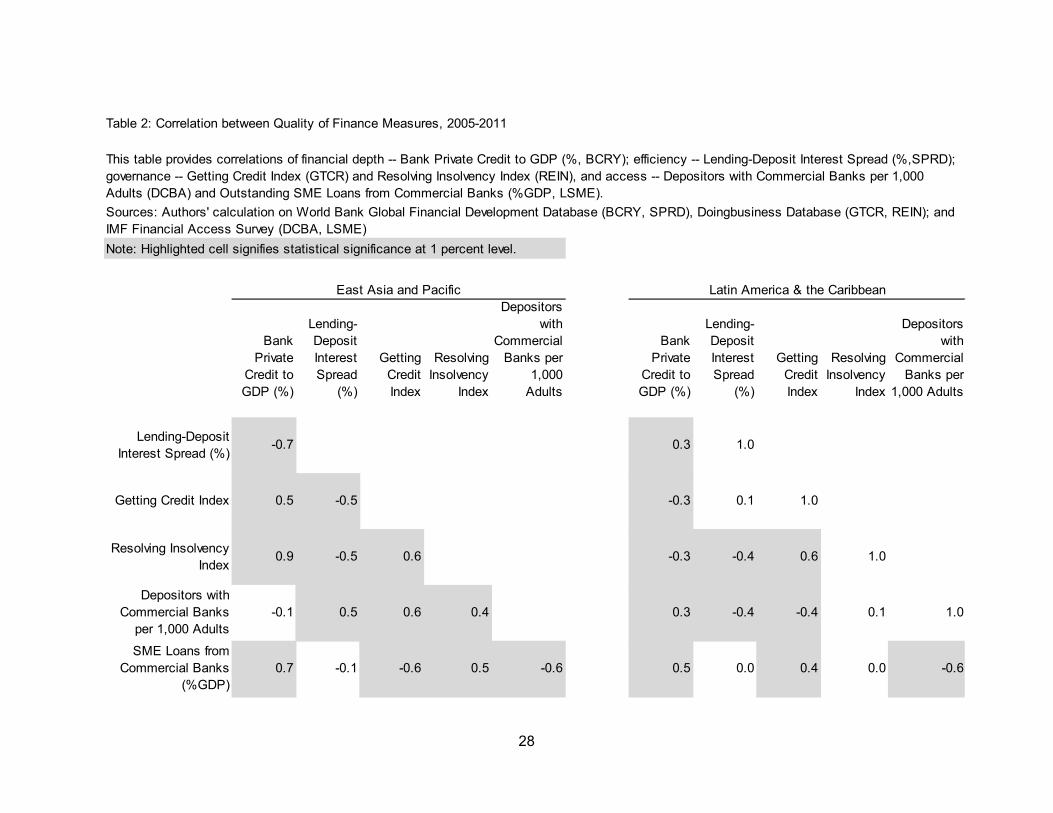
Table 2 reports the correlation among financial variables in East Asia and Pacific
vis-à-vis Latin America & the Caribbean. The level of financial depth as measured by bank
private credit to GDP is correlated with the level of de facto financial efficiency as
measured by lending-deposit interest spread in both regions, though with the opposite
signs. This spread reflects the complex interaction of many factors, including the
competitiveness of the banking industry, the riskiness of banks’ portfolio, macro policies
[higher inflation and higher reserve ratios are positively associated with the spreads], the
efficiency of the judicial system, and the protection of creditors’ rights. The data further
indicates that lending-deposit interest spread is negatively correlated with resolving
insolvency index. In East Asia, bank private credit to GDP is also positively correlated
with getting credit index, resolving insolvency index, and SME loans from commercial
banks as percentage of GDP. In Latin America, the number of depositors with commercial
banks per 1,000 adults is positively correlated with financial depth but negatively with
financial efficiency.
4 Empirical Framework and Results
To estimate the association between sectoral output growth and quality of financial
intermediation, the benchmark regression is specified as the following:
(1) Sectoral Output Growth =
11
α + λ(Lagged Sectoral Output Growth) + β(Bank Private Credit / GDP) +
γ(Lending-Deposit Interest Spread) + ε
using annual data from 1996-2011 for East Asia and Pacific, and Latin America & the
Caribbean.
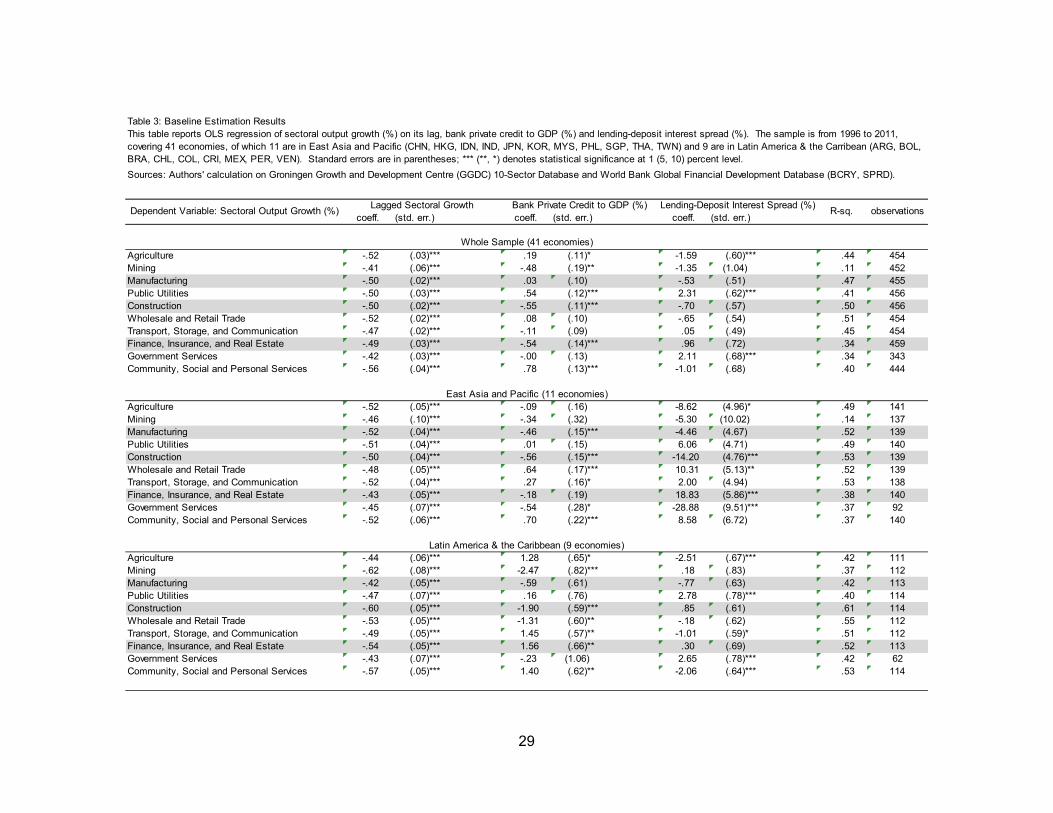
Table 3 report estimation results based on OLS regressions, done over the whole
sample of 41 economies, and sub-samples of 11 East Asian economies and 9 Latin
American economies. Overall, the estimation explains about half of variation in the
sectoral output growth data. Coefficient estimates on lagged sectoral output growth are
negative and statistically significant, suggesting mean reversion in the output growth
across sectors.
In the whole sample and both sub-samples, it is found that bank private credit to
GDP (financial depth) is negatively associated with the growth of construction sector.
Bank private credit growth is also negatively associated with the growth of manufacturing
sector in East Asia, whereas it is positively associated with the growth of finance,
insurance, and real estate sector in Latin America.
For the East Asian economies, it is found that lending-deposit interest spread
(financial efficiency) is positively associated with the growth of finance, insurance, and
real estate sector. The growth of construction sector is negatively associated with lending-
deposit interest spread in East Asia, whereas it has a positive association in Latin
America. The growth of wholesale and retail trade sector is positively associated with
financial efficiency in East Asia, whereas the association is negative in Latin America.
The results seem to suggest garden variety associations between finance and sectoral
growth.
12
While the baseline results suggest that higher bank private credit to GDP tends to
reduce sectoral growth of construction and manufacturing, the results also suggest the
need to experiment with non-linear specification of bank private credit to GDP, and also
to possibly control for lagged bank private credit to GDP, to verify whether higher bank
private credit to GDP reduces construction and manufacturing. As the recent literature
suggests, there is a possibility that bank private credit has a positive effect on GDP growth
up to a point, but too much of it would lead road to a financial crisis or declining
productivity, possibly due to lower quality of debt, and thus harm growth.
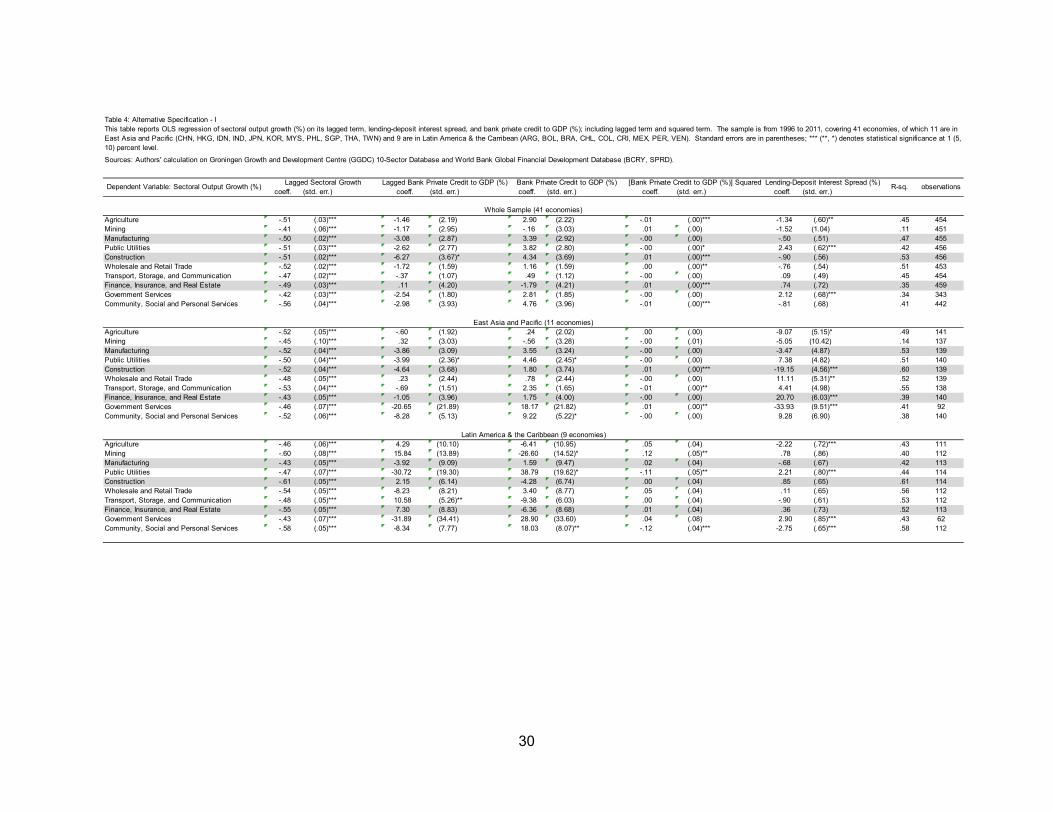
Table 4 provides an alternative specification using the following equation:
(2) Sectoral Output Growth =
α + λ(Lagged Sectoral Output Growth) + β1(Lagged Bank Private Credit /
GDP) + β2(Bank Private Credit / GDP) + β3(Bank Private Credit / GDP)2 +
γ(Lending-Deposit Interest Spread) + ε
The additional estimation results do not suggest non-linear effects of bank private
credit on output growth across all sectors. The coefficient estimates of the non-linear term
– i.e. square of bank private credit to GDP – on sectoral growth are not statistically
significant for manufacturing and finance in East Asia and Latin America. The coefficients
on bank private credit to GDP, both lagged and current, are mostly insignificant,
suggesting that the estimation of the financial depth-sectoral growth link is not robust. On
the other hand, the association between interest spread and sectoral growth are
consistent with the baseline specification.
13
5 Some Further Empirical Analysis
The preliminary results reported above should be taken with a grain of salt – more
data and work is needed to control better for the quality of credit, and other macro controls
reflecting the stage of the business and the credit cycles. Yet our results are consistent
with the conjectures outlined in the literature review. Financial deepening may lead to
uneven growth patterns, where sectors more dependent on stable external finance and
with limited collateral may be adversely affected by financial deepening associated with
credit reallocations and instability of credit conditions.
Our empirical analysis uses data on sectoral composition of the economy with
controls for the quality of financial intermediation. The quality of financial intermediation
is impacted by prices [i.e. financial intermediation spreads] and quantities [e.g. financial
depth, SMEs’ ease of getting credit]. Financial spreads are, in turn, affected by access to
credit, and quality of institutions [e.g. rights of creditors and efficacy of the judicial system],
and the risk level of loans.
Figure 3 provides the economic significance of the controls. The economic
significance of bank private credit to GDP for East Asia is a product of its coefficient
estimates (including lagged, current, and squared terms) for East Asia from the
regression in Table 4 multiplied by its standard deviation for East Asia. The calculation
for Latin America and for lending-deposit interest spread is done similarly.
Intriguingly, for several sectors the control variables for our proxy of de facto quality
of financial intermediation tend to have levels of economic significance that are larger in
Latin America and the Caribbean than they are in East Asia and Pacific. The economic
significance tends to be larger for non-tradable sectors, i.e. public utilities, wholesale and
14
retail trade, community and social services, and finance, insurance, and real estate, than
for other sectors. In addition, bank private credit to GDP tends to have smaller economic
significance than lending-deposit interest spread. The results may reflect the greater
scarcity of finance in Latin America, and possibly the smaller share of state-owned firms
enjoying preferential access to credit. Since credit may be scarcer in Latin America, the
marginal importance of the quantity of finance is larger than in East Asia. The larger credit
base of East Asia implies that region has reached the stage where quality may be at least
as important as the quantity.
Figure 4 plots the average and variation of bank private credit to GDP, comparing
East Asia and Pacific vis-à-vis Latin America & the Caribbean. Over the past two decades,
the level of financial depth has always been larger in East Asia. Prior to the Asian financial
crisis, bank private credit to GDP was 10% higher in East Asia than in Latin America.
From 1999-2003, the difference fell to about 5%, but has rebounded to 10% recently.
East Asia also hosts several financial centers – Tokyo, Hong Kong, and Singapore –
which may improve the overall quality and quantity of financial intermediation, although
identifying the impact of financial centers remains a challenge.
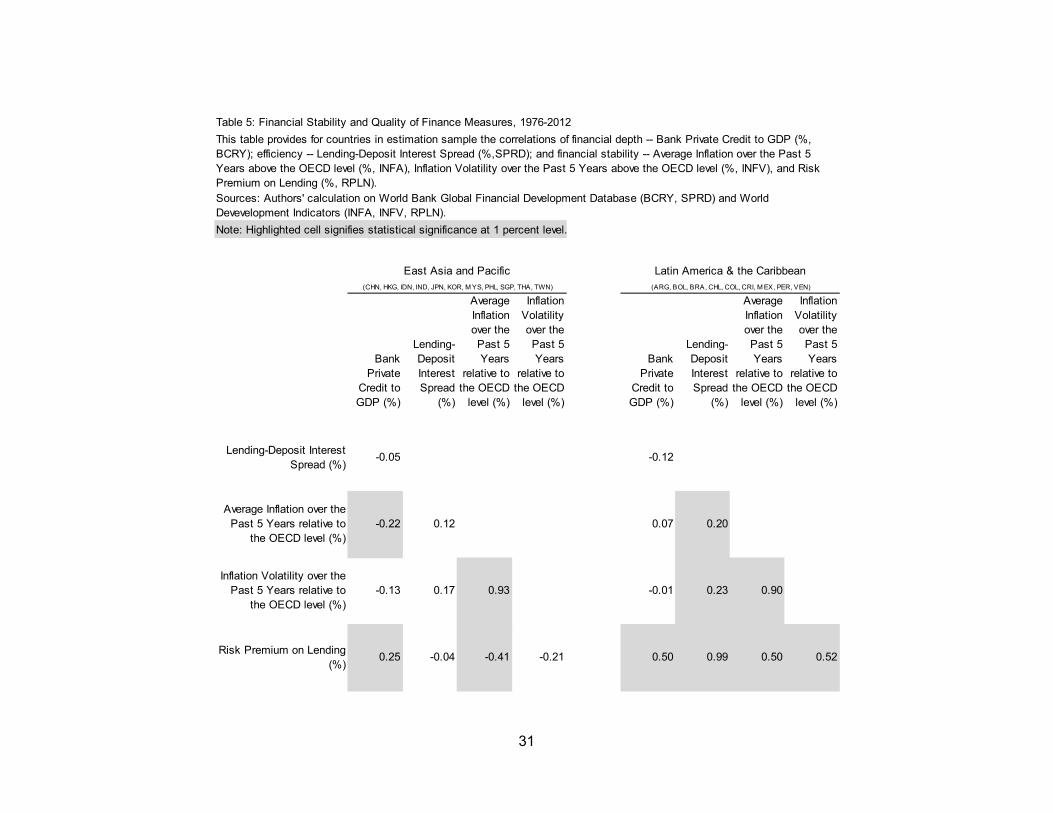
Over the long run, the quality of financial intermediation should be positively
correlated with the quality of macroeconomic policies and quality of institutions. We
measure the quality of macroeconomic policies by the average inflation and volatility of
inflation in the past 5 years. For 1976-2012, Table 5 provides the correlation between
quality of macroeconomic policies and quality of financial intermediation.
For East Asia, bank private credit to GDP is negatively correlated with average
inflation, but positively correlated with risk premium on lending (measured as lending rate
15
minus Treasury bill rate). Average inflation is highly correlated with inflation volatility. For
Latin America, the lending-deposit interest spread is correlated with average and volatility
of inflation, as well as risk premium on lending. The volatility of inflation is also highly
correlated with risk premium on lending. We have yet to formally confirm via regression
analysis the association of sectoral output growth, quality of macroeconomic policies, and
their interaction with the quality of financial intermediation and institutions. Furthermore,
some of the financial quality measures are highly correlated with each other, potentially
posing multicolinearity issues. However, based on the correlation analysis, it is highly
plausible that over the long run, sectoral output growth rates are driven by financial quality
factors.
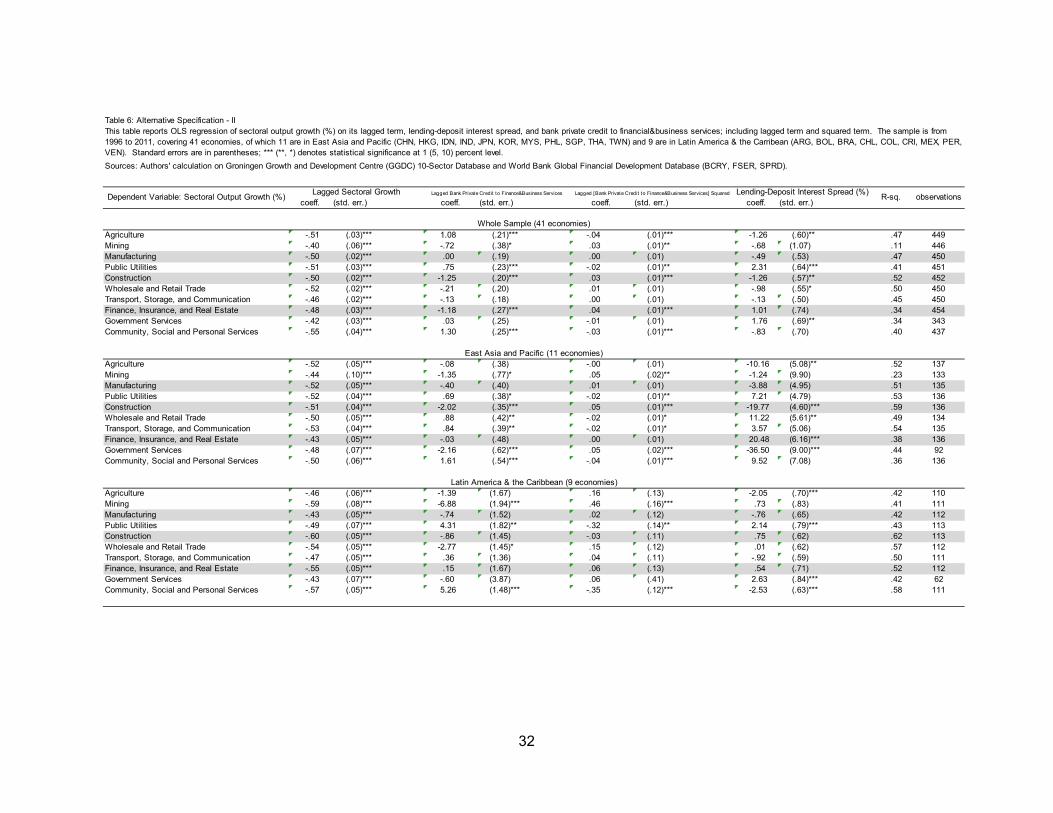
In order to capture the role of service flows of the financial sector on sectoral
growth, we provide additional estimation results in Table 6. Instead of bank private
credit/GDP, we use bank private credit/financial&business services value added (%), in
level and non-linear squared term, as alternative proxy for quality of finance. This new
variable is constructed from bank private credit/GDP and financial&business services
value added/GDP, both of which are available from the World Development Indicators.
Consistent with our conjecture, there is some evidence, notably for public utilities sector
and for community and social services sector, in both the whole sample and sub-samples,
that the effect of service flow of financial sector to sector growth is non-linear. The
coefficient estimate of lagged bank private credit/financial&business services is positive,
while the estimate of lagged [bank private credit/financial&business services]2 is negative
in manufacturing and financial sectors.

16
The evidence suggests that the level of service flow of financial sector is good only
up to a point, after which it becomes a drag on sectoral growth in the sample countries.
However, we also found an opposite pattern, namely the coefficient estimate of lagged
bank private credit/financial&business services is negative, while the estimate of lagged
[bank private credit/financial&business services]2 is positive in construction and mining.
The association of interest spread and sectoral growth remains largely the same.
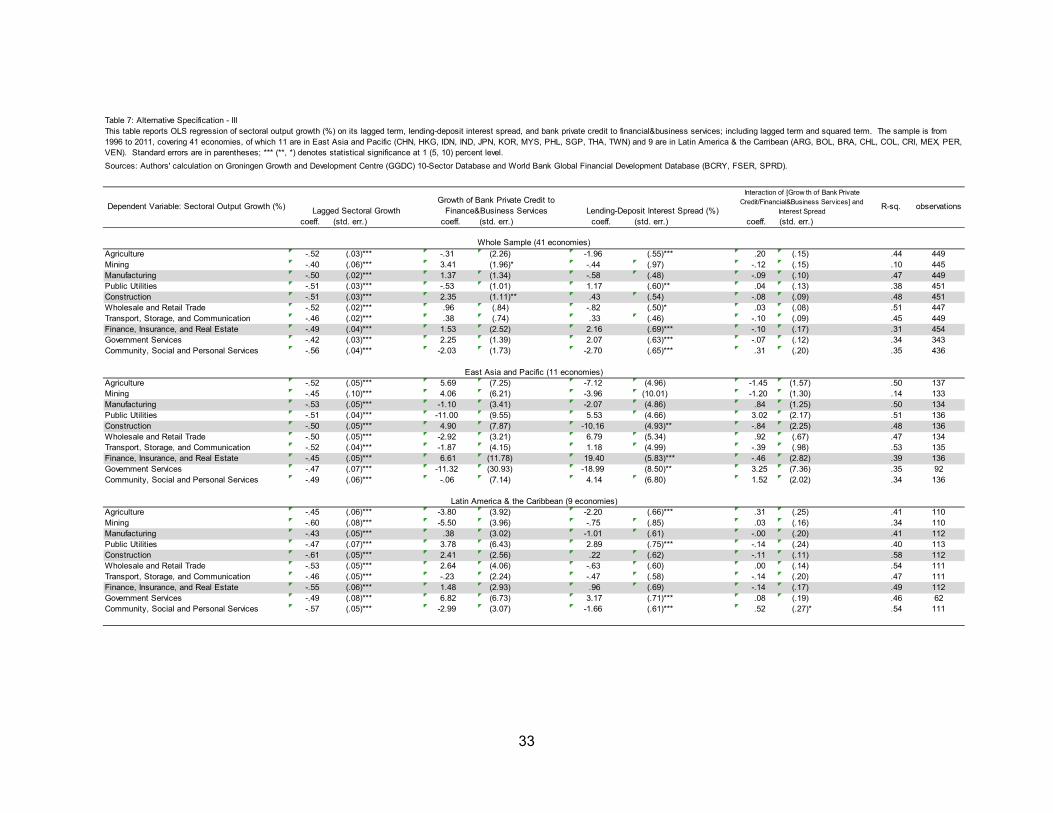
Finally, we offer another alternative specification in Table 7. To verify the possibility
of “financial Dutch disease” – i.e. booming financial service flows reduces the supply of
long term funding to manufacturing and other sectors that rely on stable external finance
– we add a lagged growth of finance and business services, and control for the interest
spread as well as its interaction with the growth of finance and business services. We find
some support of this hypothesis in the whole sample since the coefficient estimate on the
interaction term is negative and statistically significant for the growth of manufacturing
sector.
6 Concluding Observations
At a broader level, our paper was motivated by the observation that what matters
for economic growth is the quality of finance rather than the quantity of finance. Yet
standard measures of financial development are quantitative measures of size rather than
measures of financial efficiency that measure the capacity of a financial system to allocate
financial resources to their most productive uses. The global financial crisis that wrought
havoc on the financial systems of the US and EU underlines the possibility that expansion
of the financial sector may be beneficial for growth but only up to a point. Even in
developing countries, quantity of finance may be a poor measure of quality of finance.
17
For example, in China, the relentless expansion of credit in recent years, much of it to
state-owned firms, has given rise to concerns about deterioration in the quality of
investment. A key dimension of financial efficiency is the extent to which the financial
system channels resources to productive sectors of the real economy.
Overall, our evidence is consistent with the hypotheses we set forth at the outset,
in particular the non-linear effect of financial development on growth and its uneven effect
across sectors. For one measure of the quality of finance, we find that the level has a
positive, significant effect but the squared term has a negative, significant effect for a few
sectors. Therefore, our evidence lends some support to the conjecture that financial
development has a non-linear effect on output growth. In addition, we find that the effect
of financial depth on output growth varies across sectors. More specifically, we find that
financial depth has a negative effect on manufacturing in East Asia and a positive effect
on finance, insurance, and real estate sector in Latin America. Financial efficiency, as
measured by lending-deposit interest spread, is positively associated with the growth of
finance, insurance, and real estate sector. Construction sector growth is negatively
associated with the spread in East Asia, but positively in Latin America.
More generally, several of the differences between the regions may reflect the
greater scarcity of finance in Latin America in comparison to East Asia. This may explain
why the marginal importance of the quantity of finance is higher in Latin America than in
East Asia. It may be that the expansion of East Asia’s financial sector has reached the
stage where the quality of finance may be at least as important as its quantity. We also
find some evidence of a financial Dutch disease. More specifically, the faster the growth
of financial services and the larger the lending-deposit interest spread, the slower the
18
growth of the manufacturing sector. It should be emphasized that our empirical analysis
is preliminary and marks a first step toward more in-depth analysis of an important issue.
Future research would benefit greatly from, subject to data availability, better
measurement of the quality of finance by controlling for, for example, the degree of
financial repression and the role of directed credit and state-owned banks.
19
Data Appendix
Variable Source and Definition
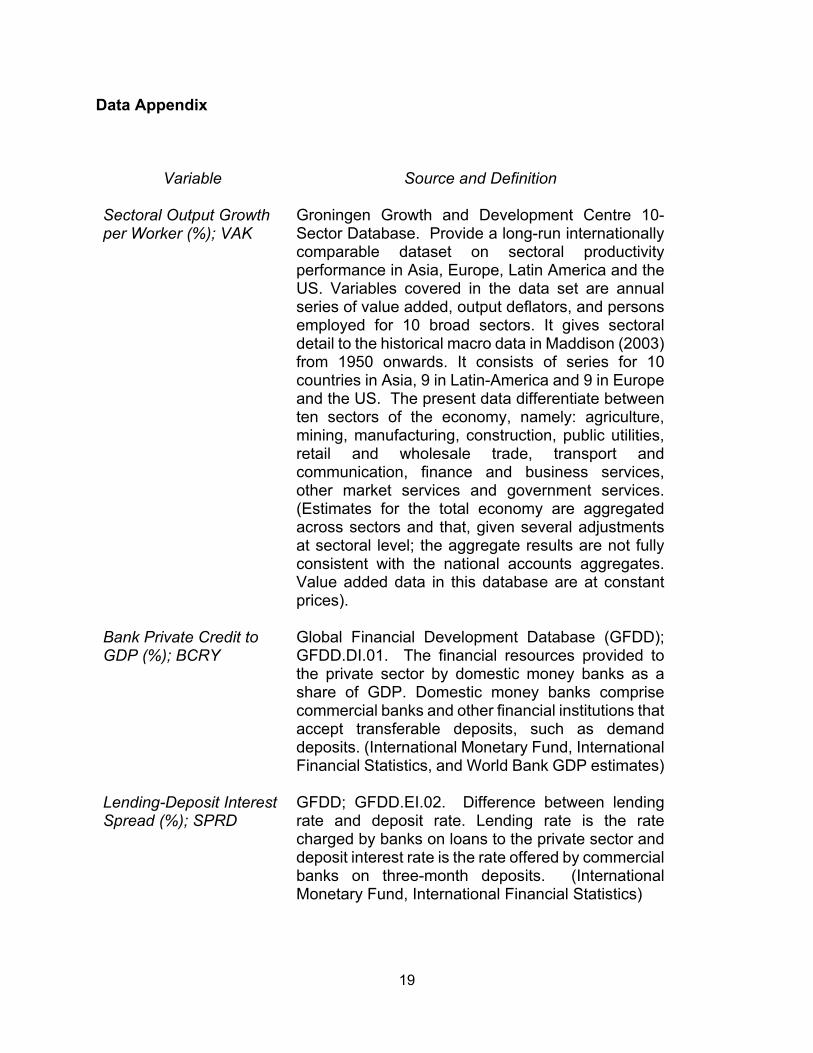
Sectoral Output Growth per Worker (%); VAK
Groningen Growth and Development Centre 10-Sector Database. Provide a long-run internationally comparable dataset on sectoral productivity performance in Asia, Europe, Latin America and the US. Variables covered in the data set are annual series of value added, output deflators, and persons employed for 10 broad sectors. It gives sectoral detail to the historical macro data in Maddison (2003) from 1950 onwards. It consists of series for 10 countries in Asia, 9 in Latin-America and 9 in Europe and the US. The present data differentiate between ten sectors of the economy, namely: agriculture, mining, manufacturing, construction, public utilities, retail and wholesale trade, transport and communication, finance and business services, other market services and government services. (Estimates for the total economy are aggregated across sectors and that, given several adjustments at sectoral level; the aggregate results are not fully consistent with the national accounts aggregates. Value added data in this database are at constant prices).
Bank Private Credit to GDP (%); BCRY
Global Financial Development Database (GFDD); GFDD.DI.01. The financial resources provided to the private sector by domestic money banks as a share of GDP. Domestic money banks comprise commercial banks and other financial institutions that accept transferable deposits, such as demand deposits. (International Monetary Fund, International Financial Statistics, and World Bank GDP estimates)
Lending-Deposit Interest Spread (%); SPRD
GFDD; GFDD.EI.02. Difference between lending rate and deposit rate. Lending rate is the rate charged by banks on loans to the private sector and deposit interest rate is the rate offered by commercial banks on three-month deposits. (International Monetary Fund, International Financial Statistics)
20
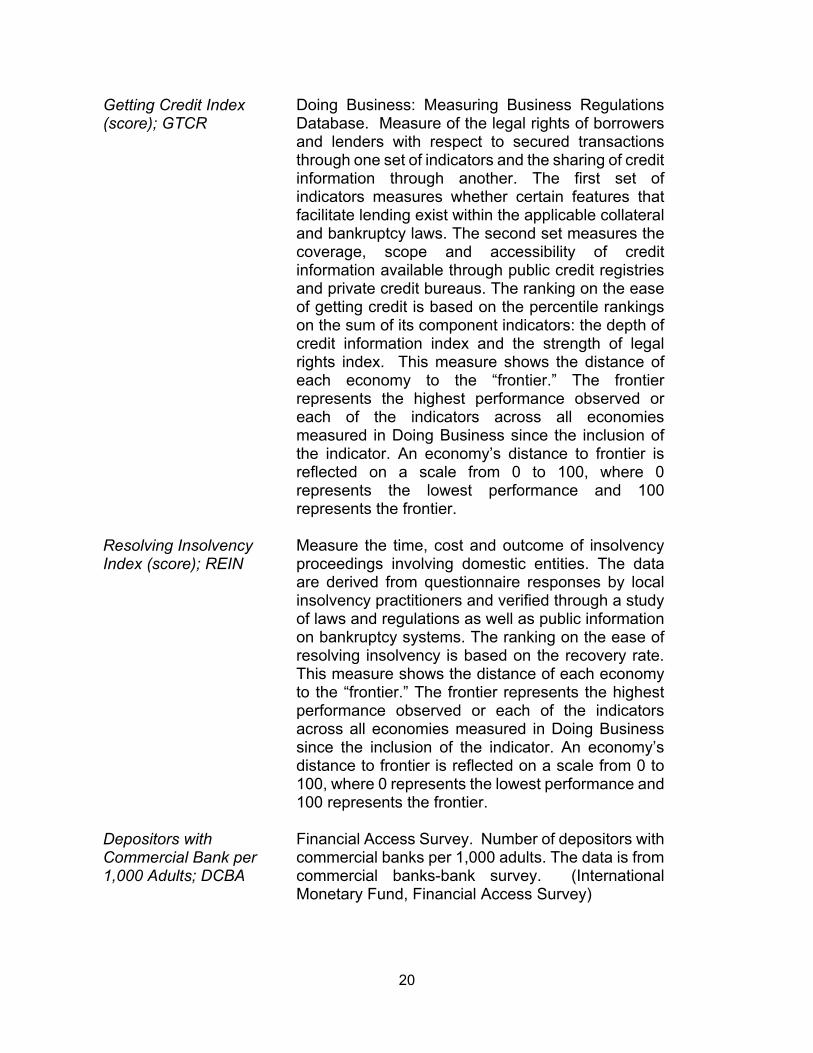
Getting Credit Index (score); GTCR
Doing Business: Measuring Business Regulations Database. Measure of the legal rights of borrowers and lenders with respect to secured transactions through one set of indicators and the sharing of credit information through another. The first set of indicators measures whether certain features that facilitate lending exist within the applicable collateral and bankruptcy laws. The second set measures the coverage, scope and accessibility of credit information available through public credit registries and private credit bureaus. The ranking on the ease of getting credit is based on the percentile rankings on the sum of its component indicators: the depth of credit information index and the strength of legal rights index. This measure shows the distance of each economy to the “frontier.” The frontier represents the highest performance observed or each of the indicators across all economies measured in Doing Business since the inclusion of the indicator. An economy’s distance to frontier is reflected on a scale from 0 to 100, where 0 represents the lowest performance and 100 represents the frontier.
Resolving Insolvency Index (score); REIN
Measure the time, cost and outcome of insolvency proceedings involving domestic entities. The data are derived from questionnaire responses by local insolvency practitioners and verified through a study of laws and regulations as well as public information on bankruptcy systems. The ranking on the ease of resolving insolvency is based on the recovery rate. This measure shows the distance of each economy to the “frontier.” The frontier represents the highest performance observed or each of the indicators across all economies measured in Doing Business since the inclusion of the indicator. An economy’s distance to frontier is reflected on a scale from 0 to 100, where 0 represents the lowest performance and 100 represents the frontier.
Depositors with Commercial Bank per 1,000 Adults; DCBA
Financial Access Survey. Number of depositors with commercial banks per 1,000 adults. The data is from commercial banks-bank survey. (International Monetary Fund, Financial Access Survey)
21
SME Loans from Commercial Banks (% GDP); LSME
Financial Access Survey. Outstanding SME loans from commercial banks relative to the size of GDP.
Inflation (%); INF
World Development Indicators. (FP.CPI.TOTL.ZG) Inflation, consumer prices (annual %), as measured by the consumer price index reflects the annual percentage change in the cost to the average consumer of acquiring a basket of goods and services that may be fixed or changed at specified intervals, such as yearly. The Laspeyres formula is generally used. Data for Argentina are from Economist Intelligence Unit, of which prior to 2007, data are from the Instituto Nacional de Estadística y Censos; from 2007 the source for consumer price inflation data is PriceStats.
Risk Premium on Lending (%); RPLN
World Development Indicators. (FR.INR.RISK) Risk premium on lending (lending rate minus treasury bill rate, %). Risk premium on lending is the interest rate charged by banks on loans to private sector customers minus the "risk free" treasury bill interest rate at which short-term government securities are issued or traded in the market. In some countries this spread may be negative, indicating that the market considers its best corporate clients to be lower risk than the government. The terms and conditions attached to lending rates differ by country, however, limiting their comparability.
Bank Private Credit / Financial&Business Services (%); FSER
World Development Indicators. Bank Private Credit/GDP divided by Financial&Business Services/GDP. Financial&Business Services/GDP (NV.SRV.TETC.ZS) corresponds to ISIC divisions 50-99 and include value added in financial professional services, wholesale and retail trade (including hotels and restaurants), transport, and government, and personal services such as education, health care, and real estate services. Also included are imputed bank service charges.
22
Countries and Regions Note: * included in the estimation sample in East Asia and Pacific; ** in Latin America & the Caribbean; *** economies in other regions included in the estimation.
East Asia and Pacific Cambodia (KHM), People Republic of China (CHN), Fiji (FJI), Indonesia (IDN)*, Kiribati (KIR), Korea, Dem. Rep. (PRK), Lao PDR (LAO), Malaysia (MYS)*, Marshall Islands (MHL), Micronesia, Fed. Sts. (FSM), Mongolia (MNG), Myanmar (MMR), Palau (PLW), Papua New Guinea (PNG), Philippines (PHL)*, Samoa (WSM), Solomon Islands (SLB), St. Kitts and Nevis (KNA), Thailand (THA)*, Timor-Leste (TMP), Tonga (TON), Tuvalu (TUV), Vanuatu (VUT), Vietnam (VNM) Latin America & the Caribbean Antigua and Barbuda (ATG), Argentina (ARG)**, Belize (BLZ), Bolivia (BOL)**, Brazil (BRA)**, Chile (CHL), Colombia (COL)**, Costa Rica (CRI)**, Cuba (CUB), Dominica (DMA), Dominican Republic (DOM), Ecuador (ECU), El Salvador (SLV), Grenada (GRD), Guatemala (GTM), Guyana (GUY), Haiti (HTI), Honduras (HND), Jamaica (JAM), Mexico (MEX)**, Nicaragua (NIC), Panama (PAN), Paraguay (PRY), Peru (PER)**, St. Lucia (LCA), St. Vincent and the Grenadines (VCT), Suriname (SUR), Uruguay (URY), Venezuela, RB (VEN) Europe and Central Asia Albania (ALB), Armenia (ARM), Azerbaijan (AZE), Belarus (BLR), Bosnia and Herzegovina (BIH), Bulgaria (BGR), Georgia (GEO), Kazakhstan (KAZ), Kosovo (KSV), Kyrgyz Republic (KGZ), Latvia (LVA), Lithuania (LTU), Macedonia, FYR (MKD), Moldova (MDA), Montenegro (MNE), Romania (ROM), Russian Federation (RUS), Serbia (SRB), Tajikistan (TJK), Turkey (TUR), Turkmenistan (TKM), Ukraine (UKR), Uzbekistan (UZB) High-income OECD members Australia (AUS), Austria (AUT), Belgium (BEL), Canada (CAN), Czech Republic (CZE), Denmark (DNK)***, Estonia (EST), Finland (FIN), France (FRA)***, Germany (DEU), Greece (GRC), Hungary (HUN), Iceland (ISL), Ireland (IRL), Israel (ISR), Italy (ITA)***, Japan (JPN), Korea, Rep. (KOR)*, Luxembourg (LUX), Netherlands (NLD)***, New Zealand (NZL), Norway (NOR), Poland (POL), Portugal (PRT), Slovak Republic (SVK), Slovenia (SVN), Spain (ESP)***, Sweden (SWE)***, Switzerland (CHE), United Kingdom (GBR)***, United States (USA)***
23
High-income non-OECD members Andorra (ADO), Aruba (ABW), Bahamas, The (BHS), Bahrain (BHR), Barbados (BRB), Bermuda (BMU), Brunei Darussalam (BRN), Cayman Islands (CYM), Croatia (HRV), Cyprus (CYP), Equatorial Guinea (GNQ), Faeroe Islands (FRO), French Polynesia (PYF), Hong Kong SAR, China (HKG)*, Isle of Man (IMY), Kuwait (KWT), Liechtenstein (LIE), Macao SAR, China (MAC), Malta (MLT), Monaco (MCO), New Caledonia (NCL), Oman (OMN), Qatar (QAT), San Marino (SMR), Saudi Arabia (SAU), Singapore (SGP), Trinidad and Tobago (TTO), United Arab Emirates (ARE), Virgin Islands (U.S.) (VIR) Middle East and North Africa Algeria (DZA), Djibouti (DJI), Egypt, Arab Rep. (EGY)***, Iran, Islamic Rep. (IRN), Iraq (IRQ), Jordan (JOR), Lebanon (LBN), Libya (LBY), Morocco (MAR), Syrian Arab Republic (SYR), Tunisia (TUN), West Bank and Gaza (WBG), Yemen, Rep. (YEM) South Asia Afghanistan (AFG), Bangladesh (BGD), Bhutan (BTN), India (IND), Maldives (MDV), Nepal (NPL), Pakistan (PAK), Sri Lanka (LKA) Sub-Saharan Africa Angola (AGO), Benin (BEN), Botswana (BWA)***, Burkina Faso (BFA), Burundi (BDI), Cameroon (CMR), Cape Verde (CPV), Central African Republic (CAF), Chad (TCD), Comoros (COM), Congo, Dem. Rep. (ZAR), Congo, Rep. (COG), Cote d'Ivoire (CIV), Eritrea (ERI), Ethiopia (ETH)***, Gabon (GAB), Gambia, The (GMB), Ghana (GHA), Guinea (GIN), Guinea-Bissau (GNB), Kenya (KEN)***, Lesotho (LSO), Liberia (LBR), Madagascar (MDG), Malawi (MWI)***, Mali (MLI), Mauritania (MRT), Mauritius (MUS)***, Mozambique (MOZ), Namibia (NAM), Niger (NER), Nigeria (NGA)***, Rwanda (RWA), Sao Tome and Principe (STP), Senegal (SEN), Seychelles (SYC), Sierra Leone (SLE), Somalia (SOM), South Africa (ZAF), Sudan (SDN), Swaziland (SWZ), Tanzania (TZA)***, Togo (TGO), Uganda (UGA), Zambia (ZMB)***, Zimbabwe (ZWE)***
24
References
Aizenman J., B. Pinto and Vl. Sushko (2013) “Financial sector ups and downs and the real sector in the open economy: Up by the stairs, down by the parachute,” Emerging Markets Review, 16 (2013) 1–30.
Alfaro, Laura, Sebnem Kalemli-Ozcan and Vadym Volosovych (2003) “Why doesn’t
Capital Flow from Rich to Poor Countries? An Empirical Investigation” University of Houston, December.
Arcand, Jean-Louis, Enrico Berkes, and Ugo Panizza. 2012. "Too Much Finance?" IMF
Working Paper No. 12/161. Boyd, J.H., Smith, B.D. (1992). “Intermediation and the equilibrium allocation of
investment capital: Implications for economic development”. Journal of Monetary Economics 30, 409–432.
Boyd, J.H., Levine, R., Smith, B.D. (2001). “The impact of inflation on financial sector
performance”. Journal of Monetary Economics 47, 221–248. Cecchetti and Kharroubi (2012) ‘Reassessing the impact of finance on growth,’ in
proceedings of the Second International Research Conference of the Reserve Bank of India, forthcoming.
Claessens, S., Laeven, L. (2003). “Financial development, property rights, and growth”.
Journal of Finance 58, 2401–2436. Dehejia, R., Lleras-Muney, A. (2003). “Why does financial development matter? The
United States from 1900 to 1940”. Working Paper No. 9551. National Bureau of Economic Research.
Eichengreen, Barry, and Kris J. Mitchener (2003), “The Great Depression as a Credit
Boom Gone Wrong”, BIS Working Paper No. 137, September. Jayaratne, J., Strahan, P.E. (1996). “The finance-growth nexus: Evidence from bank
branch deregulation”. Quarterly Journal of Economics 111, 639–670. Jordà, Òscar, Moritz Schularick, and Alan Taylor (2011) “When Credit Bites Back:
Leverage, Business Cycles, and Crises,” NBER Working Paper No. 17621
25
Ju Jiandong and Shang-Jin Wei (2011) “When Is Quality of Financial System a Source of Comparative Advantage?” Journal of International Economics, 84(2), pages 178-187.
La Porta, R., Lopez-de-Silanes, F., Shleifer, A., Vishny, R. (2000). “Investor protection
and corporate governance”. Journal of Financial Economics 58, 3–27. Lawa, Siong Hook and Nirvikar Singh (2014) “Does too much finance harm economic
growth?” Journal of Banking & Finance 41, 36–44 Lucas, Robert (1990). "Why doesn't Capital Flow from Rich to Poor Countries?", The
American Economic Review 80 (2): 92–96. Minsky, H. P. (1974), "The modeling of financial instability: An introduction," in Modelling
and Simulation, Vol. 5, Proceedings of the Fifth Annual Pittsburgh Conference, Instruments Society of America, pp. 267.72.
OECD (2013), “Health at a Glance 2013 OECD INDICATORS”
http://www.oecd.org/els/health-systems/Health-at-a-Glance-2013.pdf Philippon, Thomas, and Ariell Reshef.(2013) "An international look at the growth of
modern finance." The Journal of Economic Perspectives 27 (2): 73-96. Rajan, R.G., Zingales, L. (1998). “Financial dependence and growth”. American
Economic Review 88, 559–586. Rajan, R. G. (2005), "Has financial development made the world riskier?" Proceedings of
the 2005 Jackson Hole Conference organized by the Kansas City Fed. Rousseau, P., and Wachtel, P., (2011), "What is Happening to The Impact of Financial
Deepening on Economic Growth?" Economic Inquiry, 49, 276-288.
Schularick, Moritz, and Alan M. Taylor (2009), “Credit Booms Gone Bust: Monetary Policy, Leverage Cycles and Financial Crises, 1870–2008”, NBER Working Paper 15512.
26
Table 1: Financial Depth, Efficiency, and Access, 2005-2011
Country BCRY SPRD GTCR REIN DCBA LSME Country BCRY SPRD GTCR REIN DCBA LSMEavg. = 50.6 7.8 50.5 35.1 510.8 11.5 std.dev. = 49.9 5.9 22.3 25.6 530.6 11.4
ABW 55.0 7.6 .. .. .. .. .. LBY 6.6 3.6 .. .. 675.6 ..ADO .. .. .. .. .. .. .. LCA 96.8 7.3 43.8 44.8 .. ..AFG 7.1 .. 16.7 17.6 96.0 .. .. LCN .. .. .. .. .. ..AGO 11.8 16.7 37.5 0.0 52.2 15.3 .. LCR .. .. .. .. .. ..AIA .. .. .. .. .. .. .. LDC .. .. .. .. .. ..ALB 27.5 7.0 71.9 41.0 .. .. .. LIC .. .. .. .. .. ..AND .. .. .. .. .. .. .. LIE .. .. .. .. .. ..ANR .. .. .. .. .. .. .. LKA 27.9 5.5 49.0 44.7 .. ..ANT .. .. .. .. .. .. .. LMC .. .. .. .. .. ..ARB .. .. .. .. .. .. .. LMY .. .. .. .. .. ..ARE 67.5 .. 46.9 29.0 .. .. .. LSO 10.3 7.9 37.5 28.2 282.9 ..ARG 11.9 3.6 62.5 35.3 635.9 .. .. LTU 46.0 2.5 68.8 52.1 .. ..ARM 16.7 10.5 63.5 38.4 .. .. .. LUX 165.0 .. 25.0 44.6 .. ..ASM .. .. .. .. .. .. .. LVA 73.2 5.6 88.5 34.1 1142.1 33.9ATG 68.3 7.2 43.8 36.9 .. .. .. MAC 46.7 5.2 .. .. .. 11.7AUS 113.7 4.0 87.5 84.4 .. .. .. MAF .. .. .. .. .. ..AUT 115.8 .. 81.3 76.9 .. .. .. MAR 64.0 8.0 34.4 37.8 .. 8.3AZE 13.1 8.0 65.6 32.8 246.5 .. .. MCA .. .. .. .. .. ..BDI 14.4 .. 25.0 7.4 20.0 6.2 .. MCO .. .. .. .. .. ..BEL 86.3 .. 62.5 91.5 .. 17.2 .. MDA 29.8 5.8 50.0 30.2 1053.2 ..BEN 19.4 .. 25.0 18.6 86.1 .. .. MDG 10.1 27.3 15.6 17.4 27.0 2.1BFA 18.0 .. 25.0 22.7 .. .. .. MDV 67.7 6.4 50.0 51.6 1048.9 ..BGD 36.9 5.9 56.3 25.5 304.9 5.2 .. MEA .. .. .. .. .. ..BGR 47.3 6.2 90.6 34.5 .. .. .. MEX 16.5 4.8 68.8 68.6 267.1 4.1BHR 53.9 5.3 37.5 67.2 .. .. .. MHL .. .. 35.4 18.9 .. ..BHS 75.3 2.0 56.3 65.8 .. .. .. MIC .. .. .. .. .. ..BIH 48.9 4.5 62.5 36.9 .. 24.9 .. MKD 34.8 4.4 65.6 42.9 .. 16.9BLR 24.4 0.7 39.6 34.9 .. .. .. MLI 17.4 .. 25.0 20.8 84.9 ..BLZ 58.8 6.1 43.8 67.2 947.6 .. .. MLT 117.7 2.7 .. .. 934.9 35.0BMU .. .. .. .. .. .. .. MMR .. 5.0 .. .. 121.7 1.6BOL 33.7 9.3 42.7 40.1 .. .. .. MNA .. .. .. .. .. ..BRA 40.4 34.7 50.0 13.8 500.5 .. .. MNE 61.9 .. 77.5 45.6 .. ..BRB 71.8 5.9 .. .. .. .. .. MNG 34.3 10.3 56.3 21.0 .. 3.6BRN 37.6 4.7 43.8 49.2 1389.0 .. .. MNP .. .. .. .. .. ..BTN 27.5 10.5 18.8 0.0 .. .. .. MOR .. .. .. .. .. ..BWA 22.4 6.8 62.5 60.4 412.9 .. .. MOZ 16.6 7.7 40.6 15.9 .. ..CAA .. .. .. .. .. .. .. MRT 23.5 12.6 25.0 0.0 46.4 ..CAF 6.9 11.5 31.3 0.0 27.6 .. .. MSR .. .. .. .. .. ..CAN 126.7 3.2 81.3 94.7 .. .. .. MTQ .. .. .. .. .. ..CEA .. .. .. .. .. .. .. MUS 76.7 5.7 51.0 36.2 .. ..CEB .. .. .. .. .. .. .. MWI 9.7 21.3 43.8 15.7 163.5 2.0CEU .. .. .. .. .. .. .. MYS 101.8 2.9 100.0 41.1 .. 16.5CHE 161.1 2.3 81.3 49.8 .. 43.2 .. NAC .. .. .. .. .. ..CHI .. .. .. .. .. .. .. NAM 47.1 4.9 68.8 34.6 254.6 0.8CHL 64.6 3.8 56.3 30.9 .. 7.8 .. NCL .. .. .. .. .. ..CHN 109.9 3.2 49.0 36.3 8.8 29.6 .. NER 9.7 .. 25.0 13.3 .. ..CIV 15.8 .. 25.0 32.2 105.2 .. .. NGA 22.8 7.3 59.4 29.1 406.6 0.0CLA .. .. .. .. .. .. .. NGA(alt) .. .. .. .. .. ..CME .. .. .. .. .. .. .. NIC 31.9 7.9 49.0 36.2 .. ..CMR 9.9 11.5 30.2 13.8 49.1 .. .. NIU .. .. .. .. .. ..COD .. .. .. .. 7.3 .. .. NLD 185.5 0.5 68.8 90.0 .. ..COG 3.5 11.5 31.3 18.5 42.8 .. .. NOC .. .. .. .. .. ..COK .. .. .. .. .. .. .. NOR 77.3 1.9 62.5 95.6 1153.0 ..COL 29.2 6.9 62.5 56.3 1061.8 0.6 .. NPL 38.6 5.5 64.6 25.9 316.7 ..COM 11.3 6.8 18.8 0.0 61.5 2.7 .. NRU .. .. .. .. .. ..CPV 52.4 7.2 35.4 0.0 1204.1 .. .. NZL 134.1 1.5 93.8 82.0 .. ..CRI 40.8 11.7 50.0 23.1 937.5 .. .. OEC .. .. .. .. .. ..CSA .. .. .. .. .. .. .. OED .. .. .. .. .. ..CSS .. .. .. .. .. .. .. OMN 34.4 3.3 37.5 37.2 .. ..CUB .. .. .. .. .. .. .. OSS .. .. .. .. .. ..CUW .. .. .. .. .. .. .. PAK 24.6 6.2 61.5 42.0 201.8 ..CYM .. .. .. .. .. .. .. PAN 78.1 4.7 68.8 28.1 915.5 ..CYP 220.8 3.3 60.4 74.8 .. .. .. PER 20.4 19.4 77.1 28.0 349.8 6.4CZE 40.3 4.6 71.9 27.4 .. 10.0 .. PHL 26.1 4.6 43.8 4.5 394.1 ..DEU 108.0 .. 84.4 85.7 .. .. .. PLW .. .. 6.3 33.5 .. ..DEW .. .. .. .. .. .. .. PNG 20.4 9.1 34.4 25.3 .. ..DJI 21.6 9.3 12.5 16.8 64.6 .. .. POL 33.9 3.7 84.4 36.0 .. ..DMA 49.9 6.2 56.3 29.6 .. .. .. PRI .. .. 87.5 68.5 .. ..DNK 183.8 .. 80.2 86.0 .. .. .. PRK .. .. .. .. .. ..DOM 19.6 9.1 55.2 8.5 569.6 .. .. PRT 166.1 .. 50.0 76.8 .. ..DZA 12.6 6.2 30.2 44.1 326.0 .. .. PRY 23.9 24.5 56.3 17.8 91.8 ..
This table provides measures of financial depth -- Bank Private Credit to GDP (%, BCRY); efficiency -- Lending-Deposit Interest Spread (%,SPRD); governance -- Getting Credit Index (GTCR) and Resolving Insolvency Index (REIN), and access -- Depositors with Commercial Banks per 1,000 Adults (DCBA) and Outstanding SME Loans from Commercial Banks (%GDP, LSME).Sources: Authors' calculation on World Bank Global Financial Development Database (BCRY, SPRD), Doingbusiness Database (GTCR, REIN); and IMF Financial Access Survey (DCBA, LSME)
27
Table 1, cot.: Financial Depth, Efficiency, and Access, 2005-2011
Country BCRY SPRD GTCR REIN DCBA LSME Country BCRY SPRD GTCR REIN DCBA LSMEavg. = 50.6 7.8 50.5 35.1 510.8 11.5 std.dev. = 49.9 5.9 22.3 25.6 530.6 11.4
This table provides measures of financial depth -- Bank Private Credit to GDP (%, BCRY); efficiency -- Lending-Deposit Interest Spread (%,SPRD); governance -- Getting Credit Index (GTCR) and Resolving Insolvency Index (REIN), and access -- Depositors with Commercial Banks per 1,000 Adults (DCBA) and Outstanding SME Loans from Commercial Banks (%GDP, LSME).Sources: Authors' calculation on World Bank Global Financial Development Database (BCRY, SPRD), Doingbusiness Database (GTCR, REIN); and IMF Financial Access Survey (DCBA, LSME)
EAP .. .. .. .. .. .. .. PSE .. .. .. .. 571.7 2.1EAS .. .. .. .. .. .. .. PSS .. .. .. .. .. ..ECA .. .. .. .. .. .. .. PYF .. .. .. .. .. ..ECC .. .. .. .. .. .. .. QAT 36.2 3.5 31.3 55.9 674.8 ..ECS .. .. .. .. .. .. .. REU .. .. .. .. .. ..ECU 24.4 7.1 51.0 17.5 437.9 .. .. ROM 30.5 7.5 85.4 26.5 .. ..EGY 40.3 5.6 44.8 17.7 353.7 1.7 .. ROU .. .. .. .. .. ..EMU .. .. .. .. .. .. .. RUS 34.6 5.7 37.5 43.7 .. 6.7ERI .. .. 12.5 0.0 .. .. .. RWA 10.2 8.9 37.5 3.4 126.2 2.5ESP 182.1 .. 68.8 75.3 .. .. .. SAS .. .. .. .. .. ..EST 86.7 3.7 69.8 40.3 1958.6 .. .. SAU 39.0 .. 56.3 30.4 628.1 ..ETH 17.3 3.4 35.4 43.5 87.4 .. .. SCE .. .. .. .. .. ..EUU .. .. .. .. .. .. .. SDN 9.2 .. 25.0 34.0 .. ..FCS .. .. .. .. .. .. .. SEN 22.7 .. 25.0 21.5 .. ..FIN 83.7 .. 75.0 93.6 .. .. .. SGP 92.4 5.0 82.3 94.7 2075.2 ..FJI 44.3 3.2 68.8 47.6 .. 1.8 .. SLB 19.3 12.4 30.2 24.8 .. ..FRA 103.7 .. 64.6 49.0 .. .. .. SLE 6.9 13.4 35.4 9.1 109.6 ..FRO .. .. .. .. .. .. .. SLV 4.7 .. 67.7 31.2 .. 17.7FSM .. 13.4 39.6 3.5 .. 8.5 .. SMR 336.7 .. .. .. .. ..GAB 8.7 11.5 31.3 15.6 159.7 .. .. SOM .. .. .. .. .. ..GBR 183.9 .. 100.0 90.4 .. 12.5 .. SRB 36.8 8.7 69.8 25.8 .. ..GEO 24.4 12.8 61.5 28.9 476.8 8.3 .. SSA .. .. .. .. .. ..GHA 12.9 .. 46.9 25.4 250.6 .. .. SSD .. .. .. .. .. ..GIN 4.4 .. 18.8 22.0 .. 4.1 .. SSF .. .. .. .. .. ..GMB 12.0 14.9 31.3 29.1 .. .. .. SST .. .. .. .. .. ..GNB 4.1 .. 25.0 0.0 40.3 .. .. STP 27.5 18.3 12.5 4.6 349.8 ..GNQ 4.7 11.5 31.3 0.0 148.4 .. .. SUR 19.0 6.9 25.0 8.1 .. ..GRC 93.5 .. 52.1 47.4 .. 19.8 .. SVK 41.5 3.7 72.9 49.2 .. ..GRD 69.0 7.1 43.8 0.0 .. .. .. SVN 76.4 3.7 49.0 49.0 .. ..GRL .. .. .. .. .. .. .. SWE 111.9 2.5 70.8 80.0 .. ..GTM 24.6 8.2 69.8 29.6 .. .. .. SWZ 21.6 6.2 68.8 38.5 456.8 ..GUF .. .. .. .. .. .. .. SXM .. .. .. .. .. ..GUM .. .. .. .. .. .. .. SYC 23.1 7.7 25.0 41.9 608.5 ..GUY 38.1 12.2 25.0 18.6 .. .. .. SYR 15.3 2.8 8.3 30.9 192.7 ..HIC .. .. .. .. .. .. .. TCA .. .. .. .. .. ..HKG 148.5 5.1 93.8 84.7 .. .. .. TCD 3.8 11.5 25.0 0.0 .. ..HND 45.1 8.8 71.9 21.2 .. .. .. TGO 19.3 .. 25.0 27.0 118.0 ..HPC .. .. .. .. .. .. .. THA 94.9 4.3 61.5 45.3 1051.1 26.3HRV 61.8 8.1 55.2 31.3 1440.3 .. .. TJK 15.4 13.0 17.7 38.9 333.8 ..HTI 12.6 18.6 27.1 0.0 .. .. .. TKM .. .. 47.9 42.9 .. ..HUN 55.6 2.4 75.0 40.4 .. 13.9 .. TLS .. .. .. .. 130.0 ..IDN 23.5 5.5 51.0 16.0 .. 6.2 .. TMP 17.0 12.7 12.5 0.0 .. ..IMN .. .. .. .. .. .. .. TON 46.4 6.3 43.8 26.8 .. 19.6IMY .. .. .. .. .. .. .. TTO 28.7 6.7 79.2 26.7 .. ..IND 42.3 .. 74.0 25.7 .. 3.6 .. TUN 56.6 .. 41.7 54.8 693.0 ..INX .. .. .. .. .. .. .. TUR 30.3 .. 56.3 19.7 1236.4 8.8IRL 197.9 2.6 87.5 92.4 .. 34.9 .. TUV .. .. .. .. .. ..IRN 27.6 1.8 44.8 22.5 .. .. .. TWN .. .. 59.4 85.6 .. ..IRQ 4.2 .. 18.8 0.0 .. 0.2 .. TZA 12.9 8.1 43.8 22.8 .. ..ISL 179.1 .. 75.0 83.6 .. .. .. UGA 10.0 10.4 .. .. 141.1 ..ISR 90.7 2.9 87.5 54.9 1042.0 .. .. UKR 51.1 7.0 66.7 9.2 3063.9 ..ITA 102.8 .. 51.0 63.4 788.1 .. .. UMC .. .. .. .. .. ..JAM 24.7 11.3 50.0 68.3 .. .. .. URY 22.5 8.0 61.5 43.1 495.3 4.6JEY .. .. .. .. .. .. .. USA 58.4 .. 93.8 82.6 .. ..JOR 76.6 4.3 25.0 29.0 .. .. .. UVK .. .. .. .. .. 20.7JPN 102.0 1.2 81.3 98.1 .. .. .. UZB .. .. 21.9 19.0 860.7 3.5KAZ 41.0 .. 42.7 42.3 915.9 .. .. VCT 48.1 6.5 43.8 0.0 .. ..KEN 28.1 8.8 83.3 33.3 .. 0.1 .. VEN 18.8 4.7 19.8 6.6 728.2 0.6KGZ 9.1 22.1 69.8 15.3 109.6 .. .. VIR .. .. .. .. .. ..KHM 18.5 .. 25.0 9.8 .. .. .. VNM 85.3 3.0 67.7 19.4 .. ..KIR .. .. 31.3 0.0 161.0 11.8 .. VUT 51.7 5.1 42.7 43.3 .. ..KNA 58.5 4.6 43.8 0.0 .. .. .. WBG 6.7 .. 20.8 0.0 .. ..KOR 95.5 1.6 84.4 86.0 .. 38.9 .. WLD .. .. .. .. .. ..KSV 25.6 .. 81.3 36.3 .. .. .. WSM 40.7 7.1 39.6 18.9 650.1 25.1KWT 57.0 3.2 41.7 30.6 .. .. .. YEM 5.9 5.4 16.7 30.2 83.0 ..LAC .. .. .. .. .. .. .. ZAF 71.8 3.7 79.2 35.4 .. ..LAO 9.9 21.8 24.0 0.0 .. .. .. ZAR 2.9 37.5 18.8 3.4 .. ..LBN 67.9 2.2 49.0 31.8 825.6 .. .. ZMB 10.2 13.2 64.6 29.0 24.1 0.4LBR 11.5 11.3 28.8 8.6 .. .. .. ZWE 8.1 .. 50.0 0.2 244.5 ..
28
Table 2: Correlation between Quality of Finance Measures, 2005-2011
Bank Private
Credit to GDP (%)
Lending-Deposit Interest Spread
(%)
Getting Credit Index
Resolving Insolvency
Index
Depositors with
Commercial Banks per
1,000 Adults
Bank Private
Credit to GDP (%)
Lending-Deposit Interest Spread
(%)
Getting Credit Index
Resolving Insolvency
Index
Depositors with
Commercial Banks per
1,000 Adults
Lending-Deposit Interest Spread (%)
-0.7 0.3 1.0
Getting Credit Index 0.5 -0.5 -0.3 0.1 1.0
Resolving Insolvency Index
0.9 -0.5 0.6 -0.3 -0.4 0.6 1.0
Depositors with Commercial Banks
per 1,000 Adults-0.1 0.5 0.6 0.4 0.3 -0.4 -0.4 0.1 1.0
SME Loans from Commercial Banks
(%GDP)0.7 -0.1 -0.6 0.5 -0.6 0.5 0.0 0.4 0.0 -0.6
This table provides correlations of financial depth -- Bank Private Credit to GDP (%, BCRY); efficiency -- Lending-Deposit Interest Spread (%,SPRD); governance -- Getting Credit Index (GTCR) and Resolving Insolvency Index (REIN), and access -- Depositors with Commercial Banks per 1,000 Adults (DCBA) and Outstanding SME Loans from Commercial Banks (%GDP, LSME).
Sources: Authors' calculation on World Bank Global Financial Development Database (BCRY, SPRD), Doingbusiness Database (GTCR, REIN); and IMF Financial Access Survey (DCBA, LSME)
East Asia and Pacific Latin America & the Caribbean
Note: Highlighted cell signifies statistical significance at 1 percent level.
29
Table 3: Baseline Estimation Results
coeff. (std. err.) coeff. (std. err.) coeff. (std. err.)
Agriculture -.52 (.03)*** .19 (.11)* -1.59 (.60)*** .44 454 Mining -.41 (.06)*** -.48 (.19)** -1.35 (1.04) .11 452 Manufacturing -.50 (.02)*** .03 (.10) -.53 (.51) .47 455 Public Utilities -.50 (.03)*** .54 (.12)*** 2.31 (.62)*** .41 456 Construction -.50 (.02)*** -.55 (.11)*** -.70 (.57) .50 456 Wholesale and Retail Trade -.52 (.02)*** .08 (.10) -.65 (.54) .51 454 Transport, Storage, and Communication -.47 (.02)*** -.11 (.09) .05 (.49) .45 454 Finance, Insurance, and Real Estate -.49 (.03)*** -.54 (.14)*** .96 (.72) .34 459 Government Services -.42 (.03)*** -.00 (.13) 2.11 (.68)*** .34 343 Community, Social and Personal Services -.56 (.04)*** .78 (.13)*** -1.01 (.68) .40 444
Agriculture -.52 (.05)*** -.09 (.16) -8.62 (4.96)* .49 141 Mining -.46 (.10)*** -.34 (.32) -5.30 (10.02) .14 137 Manufacturing -.52 (.04)*** -.46 (.15)*** -4.46 (4.67) .52 139 Public Utilities -.51 (.04)*** .01 (.15) 6.06 (4.71) .49 140 Construction -.50 (.04)*** -.56 (.15)*** -14.20 (4.76)*** .53 139 Wholesale and Retail Trade -.48 (.05)*** .64 (.17)*** 10.31 (5.13)** .52 139 Transport, Storage, and Communication -.52 (.04)*** .27 (.16)* 2.00 (4.94) .53 138 Finance, Insurance, and Real Estate -.43 (.05)*** -.18 (.19) 18.83 (5.86)*** .38 140 Government Services -.45 (.07)*** -.54 (.28)* -28.88 (9.51)*** .37 92 Community, Social and Personal Services -.52 (.06)*** .70 (.22)*** 8.58 (6.72) .37 140
Agriculture -.44 (.06)*** 1.28 (.65)* -2.51 (.67)*** .42 111 Mining -.62 (.08)*** -2.47 (.82)*** .18 (.83) .37 112 Manufacturing -.42 (.05)*** -.59 (.61) -.77 (.63) .42 113 Public Utilities -.47 (.07)*** .16 (.76) 2.78 (.78)*** .40 114 Construction -.60 (.05)*** -1.90 (.59)*** .85 (.61) .61 114 Wholesale and Retail Trade -.53 (.05)*** -1.31 (.60)** -.18 (.62) .55 112 Transport, Storage, and Communication -.49 (.05)*** 1.45 (.57)** -1.01 (.59)* .51 112 Finance, Insurance, and Real Estate -.54 (.05)*** 1.56 (.66)** .30 (.69) .52 113 Government Services -.43 (.07)*** -.23 (1.06) 2.65 (.78)*** .42 62 Community, Social and Personal Services -.57 (.05)*** 1.40 (.62)** -2.06 (.64)*** .53 114
East Asia and Pacific (11 economies)
Latin America & the Caribbean (9 economies)
This table reports OLS regression of sectoral output growth (%) on its lag, bank private credit to GDP (%) and lending-deposit interest spread (%). The sample is from 1996 to 2011, covering 41 economies, of which 11 are in East Asia and Pacific (CHN, HKG, IDN, IND, JPN, KOR, MYS, PHL, SGP, THA, TWN) and 9 are in Latin America & the Carribean (ARG, BOL, BRA, CHL, COL, CRI, MEX, PER, VEN). Standard errors are in parentheses; *** (**, *) denotes statistical significance at 1 (5, 10) percent level.
Whole Sample (41 economies)
R-sq. observations
Sources: Authors' calculation on Groningen Growth and Development Centre (GGDC) 10-Sector Database and World Bank Global Financial Development Database (BCRY, SPRD).
Lagged Sectoral Growth Bank Private Credit to GDP (%) Lending-Deposit Interest Spread (%)Dependent Variable: Sectoral Output Growth (%)
30
Table 4: Alternative Specification - I
coeff. (std. err.) coeff. (std. err.) coeff. (std. err.) coeff. (std. err.) coeff. (std. err.)
Agriculture -.51 (.03)*** -1.46 (2.19) 2.90 (2.22) -.01 (.00)*** -1.34 (.60)** .45 454 Mining -.41 (.06)*** -1.17 (2.95) -.16 (3.03) .01 (.00) -1.52 (1.04) .11 451 Manufacturing -.50 (.02)*** -3.08 (2.87) 3.39 (2.92) -.00 (.00) -.50 (.51) .47 455 Public Utilities -.51 (.03)*** -2.62 (2.77) 3.82 (2.80) -.00 (.00)* 2.43 (.62)*** .42 456 Construction -.51 (.02)*** -6.27 (3.67)* 4.34 (3.69) .01 (.00)*** -.90 (.56) .53 456 Wholesale and Retail Trade -.52 (.02)*** -1.72 (1.59) 1.16 (1.59) .00 (.00)** -.76 (.54) .51 453 Transport, Storage, and Communication -.47 (.02)*** -.37 (1.07) .49 (1.12) -.00 (.00) .09 (.49) .45 454 Finance, Insurance, and Real Estate -.49 (.03)*** .11 (4.20) -1.79 (4.21) .01 (.00)*** .74 (.72) .35 459 Government Services -.42 (.03)*** -2.54 (1.80) 2.81 (1.85) -.00 (.00) 2.12 (.68)*** .34 343 Community, Social and Personal Services -.56 (.04)*** -2.98 (3.93) 4.76 (3.96) -.01 (.00)*** -.81 (.68) .41 442
Agriculture -.52 (.05)*** -.60 (1.92) .24 (2.02) .00 (.00) -9.07 (5.15)* .49 141 Mining -.45 (.10)*** .32 (3.03) -.56 (3.28) -.00 (.01) -5.05 (10.42) .14 137 Manufacturing -.52 (.04)*** -3.86 (3.09) 3.55 (3.24) -.00 (.00) -3.47 (4.87) .53 139 Public Utilities -.50 (.04)*** -3.99 (2.36)* 4.46 (2.45)* -.00 (.00) 7.38 (4.82) .51 140 Construction -.52 (.04)*** -4.64 (3.68) 1.80 (3.74) .01 (.00)*** -19.15 (4.56)*** .60 139 Wholesale and Retail Trade -.48 (.05)*** .23 (2.44) .78 (2.44) -.00 (.00) 11.11 (5.31)** .52 139 Transport, Storage, and Communication -.53 (.04)*** -.69 (1.51) 2.35 (1.65) -.01 (.00)** 4.41 (4.98) .55 138 Finance, Insurance, and Real Estate -.43 (.05)*** -1.05 (3.96) 1.75 (4.00) -.00 (.00) 20.70 (6.03)*** .39 140 Government Services -.46 (.07)*** -20.65 (21.89) 18.17 (21.82) .01 (.00)** -33.93 (9.51)*** .41 92 Community, Social and Personal Services -.52 (.06)*** -8.28 (5.13) 9.22 (5.22)* -.00 (.00) 9.28 (6.90) .38 140
Agriculture -.46 (.06)*** 4.29 (10.10) -6.41 (10.95) .05 (.04) -2.22 (.72)*** .43 111 Mining -.60 (.08)*** 15.84 (13.89) -26.60 (14.52)* .12 (.05)** .78 (.86) .40 112 Manufacturing -.43 (.05)*** -3.92 (9.09) 1.59 (9.47) .02 (.04) -.68 (.67) .42 113 Public Utilities -.47 (.07)*** -30.72 (19.30) 38.79 (19.62)* -.11 (.05)** 2.21 (.80)*** .44 114 Construction -.61 (.05)*** 2.15 (6.14) -4.28 (6.74) .00 (.04) .85 (.65) .61 114 Wholesale and Retail Trade -.54 (.05)*** -8.23 (8.21) 3.40 (8.77) .05 (.04) .11 (.65) .56 112 Transport, Storage, and Communication -.48 (.05)*** 10.58 (5.26)** -9.38 (6.03) .00 (.04) -.90 (.61) .53 112 Finance, Insurance, and Real Estate -.55 (.05)*** 7.30 (8.83) -6.36 (8.68) .01 (.04) .36 (.73) .52 113 Government Services -.43 (.07)*** -31.89 (34.41) 28.90 (33.60) .04 (.08) 2.90 (.85)*** .43 62 Community, Social and Personal Services -.58 (.05)*** -8.34 (7.77) 18.03 (8.07)** -.12 (.04)*** -2.75 (.65)*** .58 112
This table reports OLS regression of sectoral output growth (%) on its lagged term, lending-deposit interest spread, and bank private credit to GDP (%); including lagged term and squared term. The sample is from 1996 to 2011, covering 41 economies, of which 11 are in East Asia and Pacific (CHN, HKG, IDN, IND, JPN, KOR, MYS, PHL, SGP, THA, TWN) and 9 are in Latin America & the Carribean (ARG, BOL, BRA, CHL, COL, CRI, MEX, PER, VEN). Standard errors are in parentheses; *** (**, *) denotes statistical significance at 1 (5, 10) percent level.
Sources: Authors' calculation on Groningen Growth and Development Centre (GGDC) 10-Sector Database and World Bank Global Financial Development Database (BCRY, SPRD).
Dependent Variable: Sectoral Output Growth (%)Lagged Sectoral Growth Lagged Bank Private Credit to GDP (%) Lending-Deposit Interest Spread (%)
R-sq. observations
Whole Sample (41 economies)
East Asia and Pacific (11 economies)
Latin America & the Caribbean (9 economies)
Bank Private Credit to GDP (%) [Bank Private Credit to GDP (%)] Squared
31
Table 5: Financial Stability and Quality of Finance Measures, 1976-2012
Note: Highlighted cell signifies statistical significance at 1 percent level.
Bank Private
Credit to GDP (%)
Lending-Deposit Interest Spread
(%)
Average Inflation over the Past 5 Years
relative to the OECD
level (%)
Inflation Volatility over the Past 5 Years
relative to the OECD
level (%)
Bank Private
Credit to GDP (%)
Lending-Deposit Interest Spread
(%)
Average Inflation over the Past 5 Years
relative to the OECD
level (%)
Inflation Volatility over the Past 5 Years
relative to the OECD
level (%)
Lending-Deposit Interest Spread (%)
-0.05 -0.12
Average Inflation over the Past 5 Years relative to
the OECD level (%)-0.22 0.12 0.07 0.20
Inflation Volatility over the Past 5 Years relative to
the OECD level (%)-0.13 0.17 0.93 -0.01 0.23 0.90
Risk Premium on Lending (%)
0.25 -0.04 -0.41 -0.21 0.50 0.99 0.50 0.52
This table provides for countries in estimation sample the correlations of financial depth -- Bank Private Credit to GDP (%, BCRY); efficiency -- Lending-Deposit Interest Spread (%,SPRD); and financial stability -- Average Inflation over the Past 5 Years above the OECD level (%, INFA), Inflation Volatility over the Past 5 Years above the OECD level (%, INFV), and Risk Premium on Lending (%, RPLN).Sources: Authors' calculation on World Bank Global Financial Development Database (BCRY, SPRD) and World Devevelopment Indicators (INFA, INFV, RPLN).
(CHN, HKG, IDN, IND, JPN, KOR, M YS, PHL, SGP, THA, TWN) (ARG, BOL, BRA, CHL, COL, CRI, M EX, PER, VEN)
East Asia and Pacific Latin America & the Caribbean
32
Table 6: Alternative Specification - II
coeff. (std. err.) coeff. (std. err.) coeff. (std. err.) coeff. (std. err.)
Agriculture -.51 (.03)*** 1.08 (.21)*** -.04 (.01)*** -1.26 (.60)** .47 449 Mining -.40 (.06)*** -.72 (.38)* .03 (.01)** -.68 (1.07) .11 446 Manufacturing -.50 (.02)*** .00 (.19) .00 (.01) -.49 (.53) .47 450 Public Utilities -.51 (.03)*** .75 (.23)*** -.02 (.01)** 2.31 (.64)*** .41 451 Construction -.50 (.02)*** -1.25 (.20)*** .03 (.01)*** -1.26 (.57)** .52 452 Wholesale and Retail Trade -.52 (.02)*** -.21 (.20) .01 (.01) -.98 (.55)* .50 450 Transport, Storage, and Communication -.46 (.02)*** -.13 (.18) .00 (.01) -.13 (.50) .45 450 Finance, Insurance, and Real Estate -.48 (.03)*** -1.18 (.27)*** .04 (.01)*** 1.01 (.74) .34 454 Government Services -.42 (.03)*** .03 (.25) -.01 (.01) 1.76 (.69)** .34 343 Community, Social and Personal Services -.55 (.04)*** 1.30 (.25)*** -.03 (.01)*** -.83 (.70) .40 437
Agriculture -.52 (.05)*** -.08 (.38) -.00 (.01) -10.16 (5.08)** .52 137 Mining -.44 (.10)*** -1.35 (.77)* .05 (.02)** -1.24 (9.90) .23 133 Manufacturing -.52 (.05)*** -.40 (.40) .01 (.01) -3.88 (4.95) .51 135 Public Utilities -.52 (.04)*** .69 (.38)* -.02 (.01)** 7.21 (4.79) .53 136 Construction -.51 (.04)*** -2.02 (.35)*** .05 (.01)*** -19.77 (4.60)*** .59 136 Wholesale and Retail Trade -.50 (.05)*** .88 (.42)** -.02 (.01)* 11.22 (5.61)** .49 134 Transport, Storage, and Communication -.53 (.04)*** .84 (.39)** -.02 (.01)* 3.57 (5.06) .54 135 Finance, Insurance, and Real Estate -.43 (.05)*** -.03 (.48) .00 (.01) 20.48 (6.16)*** .38 136 Government Services -.48 (.07)*** -2.16 (.62)*** .05 (.02)*** -36.50 (9.00)*** .44 92 Community, Social and Personal Services -.50 (.06)*** 1.61 (.54)*** -.04 (.01)*** 9.52 (7.08) .36 136
Agriculture -.46 (.06)*** -1.39 (1.67) .16 (.13) -2.05 (.70)*** .42 110 Mining -.59 (.08)*** -6.88 (1.94)*** .46 (.16)*** .73 (.83) .41 111 Manufacturing -.43 (.05)*** -.74 (1.52) .02 (.12) -.76 (.65) .42 112 Public Utilities -.49 (.07)*** 4.31 (1.82)** -.32 (.14)** 2.14 (.79)*** .43 113 Construction -.60 (.05)*** -.86 (1.45) -.03 (.11) .75 (.62) .62 113 Wholesale and Retail Trade -.54 (.05)*** -2.77 (1.45)* .15 (.12) .01 (.62) .57 112 Transport, Storage, and Communication -.47 (.05)*** .36 (1.36) .04 (.11) -.92 (.59) .50 111 Finance, Insurance, and Real Estate -.55 (.05)*** .15 (1.67) .06 (.13) .54 (.71) .52 112 Government Services -.43 (.07)*** -.60 (3.87) .06 (.41) 2.63 (.84)*** .42 62 Community, Social and Personal Services -.57 (.05)*** 5.26 (1.48)*** -.35 (.12)*** -2.53 (.63)*** .58 111
Whole Sample (41 economies)
East Asia and Pacific (11 economies)
Latin America & the Caribbean (9 economies)
This table reports OLS regression of sectoral output growth (%) on its lagged term, lending-deposit interest spread, and bank private credit to financial&business services; including lagged term and squared term. The sample is from 1996 to 2011, covering 41 economies, of which 11 are in East Asia and Pacific (CHN, HKG, IDN, IND, JPN, KOR, MYS, PHL, SGP, THA, TWN) and 9 are in Latin America & the Carribean (ARG, BOL, BRA, CHL, COL, CRI, MEX, PER, VEN). Standard errors are in parentheses; *** (**, *) denotes statistical significance at 1 (5, 10) percent level.
Sources: Authors' calculation on Groningen Growth and Development Centre (GGDC) 10-Sector Database and World Bank Global Financial Development Database (BCRY, FSER, SPRD).
Dependent Variable: Sectoral Output Growth (%)Lagged Sectoral Growth Lagged Bank Private Credit to Finance&Business Services Lagged [Bank Private Credit to Finance&Business Services] Squared Lending-Deposit Interest Spread (%)
R-sq. observations
33
Table 7: Alternative Specification - III
coeff. (std. err.) coeff. (std. err.) coeff. (std. err.) coeff. (std. err.)
Agriculture -.52 (.03)*** -.31 (2.26) -1.96 (.55)*** .20 (.15) .44 449 Mining -.40 (.06)*** 3.41 (1.96)* -.44 (.97) -.12 (.15) .10 445 Manufacturing -.50 (.02)*** 1.37 (1.34) -.58 (.48) -.09 (.10) .47 449 Public Utilities -.51 (.03)*** -.53 (1.01) 1.17 (.60)** .04 (.13) .38 451 Construction -.51 (.03)*** 2.35 (1.11)** .43 (.54) -.08 (.09) .48 451 Wholesale and Retail Trade -.52 (.02)*** .96 (.84) -.82 (.50)* .03 (.08) .51 447 Transport, Storage, and Communication -.46 (.02)*** .38 (.74) .33 (.46) -.10 (.09) .45 449 Finance, Insurance, and Real Estate -.49 (.04)*** 1.53 (2.52) 2.16 (.69)*** -.10 (.17) .31 454 Government Services -.42 (.03)*** 2.25 (1.39) 2.07 (.63)*** -.07 (.12) .34 343 Community, Social and Personal Services -.56 (.04)*** -2.03 (1.73) -2.70 (.65)*** .31 (.20) .35 436
Agriculture -.52 (.05)*** 5.69 (7.25) -7.12 (4.96) -1.45 (1.57) .50 137 Mining -.45 (.10)*** 4.06 (6.21) -3.96 (10.01) -1.20 (1.30) .14 133 Manufacturing -.53 (.05)*** -1.10 (3.41) -2.07 (4.86) .84 (1.25) .50 134 Public Utilities -.51 (.04)*** -11.00 (9.55) 5.53 (4.66) 3.02 (2.17) .51 136 Construction -.50 (.05)*** 4.90 (7.87) -10.16 (4.93)** -.84 (2.25) .48 136 Wholesale and Retail Trade -.50 (.05)*** -2.92 (3.21) 6.79 (5.34) .92 (.67) .47 134 Transport, Storage, and Communication -.52 (.04)*** -1.87 (4.15) 1.18 (4.99) -.39 (.98) .53 135 Finance, Insurance, and Real Estate -.45 (.05)*** 6.61 (11.78) 19.40 (5.83)*** -.46 (2.82) .39 136 Government Services -.47 (.07)*** -11.32 (30.93) -18.99 (8.50)** 3.25 (7.36) .35 92 Community, Social and Personal Services -.49 (.06)*** -.06 (7.14) 4.14 (6.80) 1.52 (2.02) .34 136
Agriculture -.45 (.06)*** -3.80 (3.92) -2.20 (.66)*** .31 (.25) .41 110 Mining -.60 (.08)*** -5.50 (3.96) -.75 (.85) .03 (.16) .34 110 Manufacturing -.43 (.05)*** .38 (3.02) -1.01 (.61) -.00 (.20) .41 112 Public Utilities -.47 (.07)*** 3.78 (6.43) 2.89 (.75)*** -.14 (.24) .40 113 Construction -.61 (.05)*** 2.41 (2.56) .22 (.62) -.11 (.11) .58 112 Wholesale and Retail Trade -.53 (.05)*** 2.64 (4.06) -.63 (.60) .00 (.14) .54 111 Transport, Storage, and Communication -.46 (.05)*** -.23 (2.24) -.47 (.58) -.14 (.20) .47 111 Finance, Insurance, and Real Estate -.55 (.06)*** 1.48 (2.93) .96 (.69) -.14 (.17) .49 112 Government Services -.49 (.08)*** 6.82 (6.73) 3.17 (.71)*** .08 (.19) .46 62 Community, Social and Personal Services -.57 (.05)*** -2.99 (3.07) -1.66 (.61)*** .52 (.27)* .54 111
Whole Sample (41 economies)
East Asia and Pacific (11 economies)
Latin America & the Caribbean (9 economies)
This table reports OLS regression of sectoral output growth (%) on its lagged term, lending-deposit interest spread, and bank private credit to financial&business services; including lagged term and squared term. The sample is from 1996 to 2011, covering 41 economies, of which 11 are in East Asia and Pacific (CHN, HKG, IDN, IND, JPN, KOR, MYS, PHL, SGP, THA, TWN) and 9 are in Latin America & the Carribean (ARG, BOL, BRA, CHL, COL, CRI, MEX, PER, VEN). Standard errors are in parentheses; *** (**, *) denotes statistical significance at 1 (5, 10) percent level.
Sources: Authors' calculation on Groningen Growth and Development Centre (GGDC) 10-Sector Database and World Bank Global Financial Development Database (BCRY, FSER, SPRD).
Dependent Variable: Sectoral Output Growth (%) Lagged Sectoral GrowthGrowth of Bank Private Credit to
Finance&Business Services Lending-Deposit Interest Spread (%)
Interaction of [Grow th of Bank Private Credit/Financial&Business Services] and
Interest SpreadR-sq. observations
34
Figure 1: Value-Added (constant 2005 prices) per Worker in 10 Sectors
This figure provides average value added per worker in East Asia and Pacific, and Latin America & the Caribbean, from 1995-2011.
Sources: Authors' calculation on 10-Sector Database.
0
10,000
20,000
30,000
40,000
50,000
60,000
Agriculture Construction Finance,Insurance, and
Real Estate
GovernmentServices
Manufacturing Mining Community,Social andPersonalServices
Public Utilities Transport,Storage, and
Communication
Wholesale andRetail Trade
East Asia and Pacific Latin America & the Caribbean
35
Figure 2: Regional Differences in Quality of Finance, 2005-2011
This figure provides an average for each region measures of financial depth -- Bank Private Credit to GDP (%, BCRY); efficiency -- Lending-Deposit Interest Spread (%,SPRD); governance -- Getting Credit Index (GTCR) and Resolving Insolvency Index (REIN), and access -- Depositors with Commercial Banks per 1,000 Adults (DCBA) and Outstanding SME Loans from Commercial Banks (%GDP, LSME).
Sources: Authors' calculation on World Bank Global Financial Development Database (BCRY, SPRD), Doingbusiness Database (GTCR, REIN); and IMF Financial Access Survey (DCBA, LSME)
0
20
40
60
80
100
120
140
East Asia andPacific
Europe andCentral Asia
High-incomeOECD
members
High-incomenonOECDmembers
Latin America& the
Caribbean
Middle Eastand North
Africa
South Asia Sub-SaharanAfrica
Bank Private Credit to GDP (%)
0
10
20
30
40
50
60
70
80
East Asia andPacific
Europe andCentral Asia
High-incomeOECD
members
High-incomenonOECDmembers
Latin America& the
Caribbean
Middle Eastand North
Africa
South Asia Sub-SaharanAfrica
Getting Credit Index
0
2
4
6
8
10
12
14
East Asia andPacific
Europe andCentral Asia
High-incomeOECD
members
High-incomenonOECDmembers
Latin America& the
Caribbean
Middle Eastand North
Africa
South Asia Sub-SaharanAfrica
Lending-Deposit Interest Spread (%)
0
10
20
30
40
50
60
70
80
East Asia andPacific
Europe andCentral Asia
High-incomeOECD
members
High-incomenonOECDmembers
Latin America& the
Caribbean
Middle Eastand North
Africa
South Asia Sub-SaharanAfrica
Resolving Insolvency Index
0
200
400
600
800
1000
1200
1400
East Asia andPacific
Europe andCentral Asia
High-incomeOECD
members
High-incomenonOECDmembers
Latin America& the
Caribbean
Middle Eastand North
Africa
South Asia Sub-SaharanAfrica
Depositors with Commercial Banks per 1,000 Adults
0
5
10
15
20
25
East Asia andPacific
Europe andCentral Asia
High-incomeOECD
members
High-incomenonOECDmembers
Latin America& the
Caribbean
Middle Eastand North
Africa
South Asia Sub-SaharanAfrica
SME Loans from Commercial Banks (%GDP)
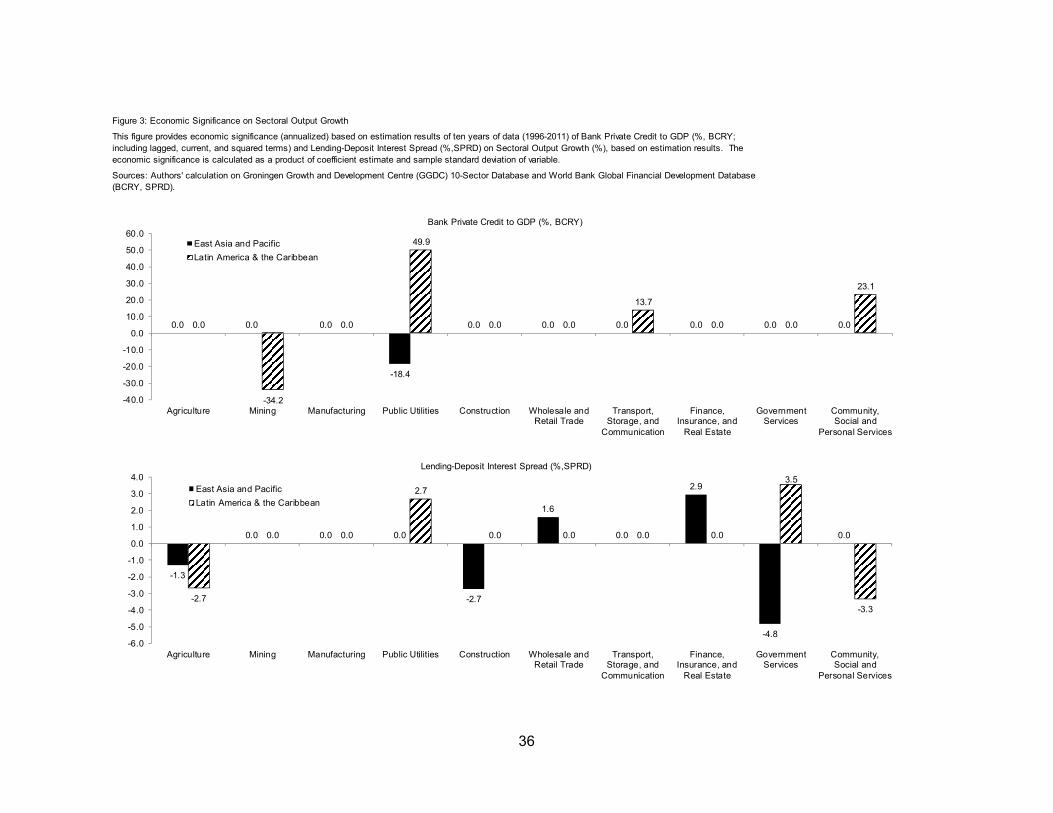
36
Figure 3: Economic Significance on Sectoral Output Growth
This figure provides economic significance (annualized) based on estimation results of ten years of data (1996-2011) of Bank Private Credit to GDP (%, BCRY; including lagged, current, and squared terms) and Lending-Deposit Interest Spread (%,SPRD) on Sectoral Output Growth (%), based on estimation results. The economic significance is calculated as a product of coefficient estimate and sample standard deviation of variable.
Sources: Authors' calculation on Groningen Growth and Development Centre (GGDC) 10-Sector Database and World Bank Global Financial Development Database (BCRY, SPRD).
Bank Private Credit to GDP (%, BCRY)
Lending-Deposit Interest Spread (%,SPRD)
0.0 0.0 0.0
-18.4
0.0 0.0 0.0 0.0 0.0 0.0 0.0
-34.2
0.0
49.9
0.0 0.0
13.7
0.0 0.0
23.1
-40.0
-30.0
-20.0
-10.0
0.0
10.0
20.0
30.0
40.0
50.0
60.0
Agriculture Mining Manufacturing Public Utilities Construction Wholesale andRetail Trade
Transport,Storage, and
Communication
Finance,Insurance, and
Real Estate
GovernmentServices
Community,Social and
Personal Services
East Asia and Pacific
Latin America & the Caribbean
-1.3
0.0 0.0 0.0
-2.7
1.6
0.0
2.9
-4.8
0.0
-2.7
0.0 0.0
2.7
0.0 0.0 0.0 0.0
3.5
-3.3
-6.0
-5.0
-4.0
-3.0
-2.0
-1.0
0.0
1.0
2.0
3.0
4.0
Agriculture Mining Manufacturing Public Utilities Construction Wholesale andRetail Trade
Transport,Storage, and
Communication
Finance,Insurance, and
Real Estate
GovernmentServices
Community,Social and
Personal Services
East Asia and Pacific
Latin America & the Caribbean
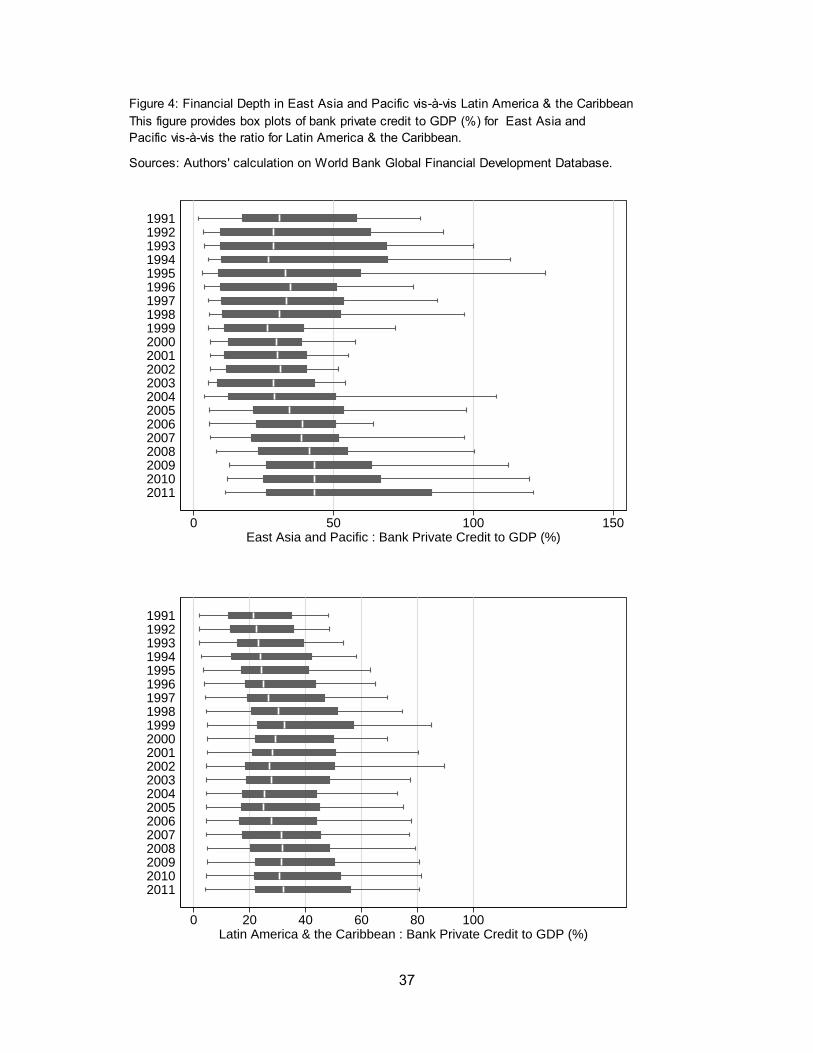
37
Figure 4: Financial Depth in East Asia and Pacific vis-à-vis Latin America & the CaribbeanThis figure provides box plots of bank private credit to GDP (%) for East Asia and Pacific vis-à-vis the ratio for Latin America & the Caribbean.
Sources: Authors' calculation on World Bank Global Financial Development Database.
0 50 100 150East Asia and Pacific : Bank Private Credit to GDP (%)
201120102009200820072006200520042003200220012000199919981997199619951994199319921991
0 20 40 60 80 100Latin America & the Caribbean : Bank Private Credit to GDP (%)
201120102009200820072006200520042003200220012000199919981997199619951994199319921991