Embed Size (px)
Citation preview
DEVELOPING INFRASTRUCTURE IN CENTRAL ASIAImpacts and Financing Mechanisms
ASIAN DEVELOPMENT BANK INSTITUTE
Edited by Naoyuki Yoshino, Bihong Huang, Dina Azhgaliyeva, and Qaisar Abbas
ASIAN DEVELOPMENT BANK INSTITUTE
Developing Infrastructure in Central Asia:Impacts and Financing Mechanisms
Edited by
Naoyuki Yoshino, Bihong Huang, Dina Azhgaliyeva, and Qaisar Abbas
© 2021 Asian Development Bank Institute
All rights reserved.
ISBN 978-4-89974-231-9 (Print) ISBN 978-4-89974-232-6 (PDF)
The views in this publication do not necessarily reflect the views and policies of the Asian Development Bank Institute (ADBI), its Advisory Council, ADB’s Board or Governors, or the governments of ADB members.
ADBI does not guarantee the accuracy of the data included in this publication and accepts no responsibility for any consequence of their use. ADBI uses proper ADB member names and abbreviations throughout and any variation or inaccuracy, including in citations and references, should be read as referring to the correct name.
By making any designation of or reference to a particular territory or geographic area, or by using the term “recognize,” “country,” or other geographical names in this publication, ADBI does not intend to make any judgments as to the legal or other status of any territory or area.
Users are restricted from reselling, redistributing, or creating derivative works without the express, written consent of ADBI.
ADB recognizes “China” as the People’s Republic of China; “Korea” as the Republic of Korea; “Kyrgyzstan” as the Kyrgyz Republic; and “Vietnam” as Viet Nam.
Note: In this publication, “$” refers to US dollars.
Asian Development Bank Institute Kasumigaseki Building 8F 3-2-5, Kasumigaseki, Chiyoda-ku Tokyo 100-6008, Japan www.adbi.org
iii
Contents
Tables and Figures ivAbbreviations ixContributors x
Introduction 1 Naoyuki Yoshino, Bihong Huang, Dina Azhgaliyeva,
and Qaisar Abbas
1. Infrastructure in Central Asia and the Caucasus 5 Ghulam Samad and Qaisar Abbas
2. Measuring the Impact of Road Infrastructure on Household Well-Being: Evidence from Azerbaijan 29
Nurmukhammad Yusupov
3. Managing the Risks of Public Infrastructure Financing: Toward Sustainability 57
Quanhou Zhao, Licheng Zhang, Beilin Feng, Wei Liu, Xiaoyan Long, Jiaxi Sun, Xu Chen, and Qiongqi Xiao
4. Public–Private Partnerships in Georgia and Impact Assessment of Infrastructure 90
Nestan Devidze
5. Measuring Impacts and Financing Infrastructure in Kazakhstan 131
Bibigul Aidarkhanova
6. Measuring the Impact and Financing of Infrastructure in the Kyrgyz Republic 168
Kamalbek Karymshakov and Burulcha Sulaimanova
7. Infrastructure Development and Public–Private Partnerships: Measuring Impacts of Urban Transport Infrastructure in Pakistan 198
Muhammad Ayub Mehar
8. Are Public–Private Partnerships a Solution to the Lagging Infrastructure of Tajikistan? 231
Ziyodullo Parpiev
iv
Tables and Figures
Tables1.1 Road Infrastructure in Selected
Central Asian and the Caucasus Countries, 2018 121.2 Railways for Goods and Passenger Transport
in Central Asia and Caucasus, 2007–2017 141.3 Air Transport Infrastructure, Transport,
and Service Quality in Selected Central Asian and Caucasus Countries 16
1.4 Water Infrastructure Indicators in Selected Central Asian and Caucasus Countries, 2018–2019 18
1.5 Electricity Production, Source, and Access in Central Asia, 2015 21
1.6 Electricity Infrastructure, Rate, and Quality in Selected Central Asian and Caucasus Countries, 2019 22
1.7 Central Asia Regional Economic Cooperation Corridors 232.1 Foreign Direct Investment in Azerbaijan, 2014–2016 382.2 Descriptive Statistics 462.3 Characteristics of Treatment vs. Control Districts 472.4 Perceived Market Value of Housing – OLS Estimations 482.5 Subjective Household Wealth Relative to
Others in the Society – OLS Estimations 512.6 Subjective Household Wealth Relative to
Others in the Society – Ordered Logit Estimations 533.1 Issuing of Local Government Bonds vs.
Issuing of Corporate Bonds 784.1 Descriptive Statistics for the Dependent and
Control Variables in Our Modified DiD Model 1014.2 Hausman Test Results 1034.3 Results of the DiD Estimations 1044.4 List of Active PPP Projects in Georgia 1114.5 Summary of Indicators for Georgia against the
Benchmarked Practices in the Preparation Phase of PPPs 1164.6 Summary of Indicators for Georgia against the
Benchmarked Practices in the Procurement Phase of PPPs 1184.7 Summary of Indicators for Georgia against the Benchmarked
Practices in the Contract Management Phase of PPPs 1204.8 Summary of Indicators for Georgia against the Benchmarked
Practices in the Management of Unsolicited Proposals 1215.1 Financial Account Balance in Kazakhstan, 2015–2017 138
Tables and Figures v
5.2 Treated and Control Group in the Subregional Model Using the DiD Method 148
5.3 Summary Statistics of Dependent and Independent Variables by Subregion 149
5.4 Treated and Control Group in the Regional Model Using the DiD Method 150
5.5 Summary Statistics of Dependent and Independent Variables by Region 151
5.6 Evaluation of Impact on Treated Subregions in Subregional Model Using the DiD Method 156
5.7 Evaluation of Impact on Treated Region in Regional Model Using the DiD Method 159
6.1 Macroeconomic Indicators for the Kyrgyz Republic, 2001–2016 170
6.2 Road Construction Projects in the Kyrgyz Republic 1756.3 Description of Treatment, Control Groups, and Variables 1766.4 Summary of Statistics for Control and Treated Regions
(regional-level data) 1786.5 Summary of Statistics for Control and Treated Regions
(district-level data) 1796.6 DiD Estimators for Regional Level Analysis 1806.7 DiD Estimators for District-Level Analysis 1826.8 Financing Public Investment Program in
the Kyrgyz Republic, 2015–2017 183A6.1 Difference-in-Differences Estimation Results
for Regional Level Analysis 196A6.2 Difference-in-Differences Estimation Results
for Kara-Suu, Alai, and Chon-Alai Treated Districts 196A6.3 Difference-in-Differences Estimation Results for Alai
and Chon-Alai Treated Districts 197A6.4 Difference-in-Differences Estimation Results
for Alai Treated District 1977.1 Pakistan’s Global Ranking in Infrastructure 2027.2 Structural Changes in 1993:
Patterns of Development Financing 2057.3 Approval Process of a Project 2067.4 The Largest Public–Private Partnership Programs in Pakistan 2087.5 List of Urban Transit Systems in Pakistan (since 2013) 2097.6 Descriptive Statistics (Region and Year Wise) –
Household Survey 2117.7 Descriptive Statistics (Overall) – Household Survey 2127.8 Average Household Real Incomes for 2005–2012 and 2014 2167.9 Average Household Real Incomes for 2005–2012
and 2014–2016 216
vi Tables and Figures
7.10a Impact of Infrastructure on Household Income (All Regions) – Dependent Variable: Real Household Income at Constant Prices of 2005 220
7.10b Impact of Infrastructure on Household Income (Urban Regions) – Dependent Variable: Real Household Income at Constant Prices of 2005 221
A7 Government Capability to Prepare, Procure, and Manage PPP Projects 228
8.1 Tajikistan’s Recent Performance in Global Rankings 2378.2 Comparative Analysis of the Pamir Energy
and Dushanbe-Chanak Road Projects 2488.3 Characteristics of the Four Regions of Tajikistan Used
in This Study 2528.4 Descriptive Statistics of Regional Data for Tajikistan 2528.5 Results of Difference-in-Differences Regressions 255
Figures1.1 Gross Domestic Product Per Capita Growth
in Panama, 1960–2014 61.2 Gross Domestic Product Per Capita Growth
in Egypt, 1916–2015 71.3 Country Population Shares in Central Asia
and the Caucasus, 2018 91.4 Gross Domestic Product Growth Rate at Constant Prices
in Central Asia and the Caucasus, 2014–2020 101.5 Infrastructure Global Competitiveness Index in Selected
Central Asian and Caucasus Countries, 2007–2018 111.6 Railway Length in Central Asia and the Caucasus, 1995–2017 131.7 Number of Passengers Traveling by Air Transport in
Central Asia and the Caucasus, 1996–2018 151.8 Quality of Port Infrastructure in Selected Central Asian
and Caucasus Countries 171.9 Ranking of Quality of Port Infrastructure in Selected
Central Asian and Caucasus Countries, 2018 and 2019 171.10 Freshwater Withdrawal for Agriculture, Industry, and
Domestic in Selected Central Asian and Caucasus Countries 191.11 Fixed Telephone and Broadband Subscriptions
(per 100 People) in Central Asia and the Caucasus, 2019 201.12 Number of Mobile Phone Users (per 100 People)
in Central and the Caucasus Asia, 1995–2017 201.13 Rail Corridors, Central Asia and the Caucasus 241.14 Total Infrastructure Investments by Region, 1990–2019 251.15 Infrastructure Investments as a Share of GDP, 2011 26
Tables and Figures vii
1.16 Regulatory Environment in Selected Central Asian and Caucasus Countries, 2018 26
2.1 Azerbaijan’s Recent Economic Growth, 2012–2018 362.2 End Use of Azerbaijan’s GDP (2017 Estimates) 382.3 Investment Spending from State Budget in Azerbaijan,
2008–2016 403.1 Four Models of Financing for Public Infrastructure, 1998–2014 593.2 Tax Revenue and Revenue from Extra-Budgetary
Charges in the PRC, 1987–1996 663.3 State-Owned Land Sale Revenue and Urban Public
Infrastructure Investment, 2000–2017 693.4 2017 Financing Structure of a Sample Financing
Platform Company 703.5 Evolution of Maturities of Bonds Issued
by Local Governments 723.6 Process for Preparation and Review of Government’s
Public Investment Budget Items 743.7 Amount of Bonds Issued by Local Governments,
2009–2018 763.8 Monthly Changes in the Number of Projects
in the Management Library at Each Stage 773.9 Trends in the PRC’s Infrastructure Investment, 1995–2017 843.10 Changes in Railway Network Length in Operation
in the PRC, 1949–2016 843.11 Changes in Road Network Length in Operation in the PRC,
1949–2016 853.12 Urbanization Rate and Urban Municipal Infrastructure
Investment in the PRC, 1950–2016 853.13 Sources of Funding for the PRC’s Infrastructure Investment,
2004–2016 863.14 Fiscal Expenditure for Capital Construction in the PRC,
1950–2004 864.1 Number of Flights Kutaisi International Airport
Has Hosted, 2012–2017 944.2 Number of Passengers Kutaisi International Airport
Has Served, 2012–2017 944.3 Value Added for the Hospitality Sector in Imereti, 2010–2016 954.4 Total Taxes for the Observed Regions, 2009–2017 974.5 Business Taxes for the Observed Regions, 2009–2017 984.6 Property Taxes for the Observed Regions, 2010–2017 984.7 Phases for the DiD Analysis 994.8 External Public Debt Statistics by the Lenders’
Share in the Total Debt 106
viii Tables and Figures
4.9 State Budget Outlays by Purpose 1074.10 Global Ranking of Doing Business in Georgia 1094.11 Breakdown of the Total Value of Ongoing
PPP Projects by Sector 1124.12 Recent Developments of the PPP Policy of Georgia 1135.1 GDP of Kazakhstan, 2012–2018 1345.2 Foreign Trade of Kazakhstan, 2015–2017 1355.3 Commodity Structure of Exports and Imports
of Kazakhstan, 2018 1365.4 Gross Inflows of Foreign Direct Investment
to Kazakhstan, 2005–2018 1375.5 Total Gross Inflows of Foreign Direct Investment to
Kazakhstan in 2005–2017 by Type of Economic Activities 1375.6 Structure of Investments in Fixed Capital by Sources
of Financing, 2018 1395.7 Impact of the Project on Sectors of the Real Economy
in the Treated Subregion 1585.8 Impact of the Khorgos–Zhetygen Railway on
Regional GDP and Tax Revenues in the Treated Region 1615.9 Impact of the Project on Economic Indicators
in the Treated Group according to the Time Period 1626.1 Structure of Foreign Investments in
the Kyrgyz Republic, 2004–2016 1716.2 Foreign Investment Inflow to the Kyrgyz Republic
by Country, 2008 and 2016 1726.3 Foreign Investment Inflow by Sector, 2008 and 2016 1736.4 Foreign Development Assistance to
the Kyrgyz Republic, 1992–2017 1846.5 Top Funding Groups for Foreign Development Assistance 1846.6 Top Sectors Receiving Foreign Development Assistance 1857.1 Household Income in Study Areas in Pakistan, 2005–2016 2138.1 Gross Domestic Product per Capita Growth
in Tajikistan, 2000–2018 2328.2 Inflow of Remittances and National Poverty Rate
in Tajikistan, 2000–2018 2338.3 Overall and Extreme Poverty by Region, 2017 2348.4 Gross Domestic Product per Capita in Tajikistan,
1990–2018 2358.5 Institutional Structure of PPPs in Tajikistan 2438.6 Interest and Principal Repayment Schedule
for the PRC Loan for the Reconstruction of the Dushanbe-Chanak Road 247
8.7 Unemployment Rate by Region of Tajikistan, 2000–2019 253
ix
Abbreviations
ADB Asian Development BankBCP border-crossing pointBOT build–operate–transferCAREC Central Asia Regional Economic Cooperation DFI development finance institutionDiD difference in differencesEBRD European Bank for Reconstruction and DevelopmentEEU Eurasian Economic UnionFDA foreign development assistanceFDI foreign direct investmentGDP gross domestic productGRP gross regional productHIES Household Income and Expenditure Surveykm kilometerLITS Life in Transition SurveyNDS National Development StrategyNPL nonperforming loanOLS ordinary least squaresPPP public–private partnership PRC People’s Republic of ChinaPSU primary sampling unitRNDP Road Network Development Program
x
Contributors
Qaisar Abbas is chief of the Research Division at the Central Asia Regional Economic Cooperation (CAREC) Institute, Urumqi, People's Republic of China (PRC).
Bibigul Aidarkhanova is a senior lecturer at the Economics Department of the Kazakh University of Economics, Finance and International Trade, Nur-Sultan, Kazakhstan.
Dina Azhgaliyeva is a research fellow at the Asian Development Bank Institute, Tokyo, Japan.
Xu Chen is an assistant researcher at the Finance Research Center of the Chinese Academy of Fiscal Science (CAFS), Beijing, the PRC.
Nestan Devidze is an impact investments manager for South Asia and Southeast Asia based in Bangkok, Thailand.
Beilin Feng is a deputy director at the Finance Research Center of CAFS, Beijing, the PRC.
Bihong Huang is an economist at the Monetary and Capital Markets Department of the International Monetary Fund. She was formerly a research fellow at ADBI, Tokyo, Japan, where she carried out the work for this publication.
Kamalbek Karymshakov is an economist at the CAREC Institute, Urumqi, the PRC.
Wei Liu is an associate researcher at the Finance Research Center of CAFS, Beijing, the PRC.
Xiaoyan Long is an associate researcher at the Finance Research Center of CAFS, Beijing, the PRC.
Muhammad Ayub Mehar is a professor at Iqra University Karachi, Pakistan.
Contributors xi
Ziyodullo Parpiev is a senior lecturer at the Economics Department of Westminster International University in Tashkent, Uzbekistan, and a visiting lecturer at the Economics Department of the National University of Uzbekistan.
Ghulam Samad is a senior research specialist at the CAREC Institute, Urumqi, the PRC.
Burulcha Sulaimanova is an assistant professor at the Economics Department of the Kyrgyz-Turkish Manas University, Bishkek, the Kyrgyz Republic.
Jiaxi Sun is an assistant researcher at the Finance Research Center of CAFS, Beijing, the PRC.
Qiongqi Xiao is an assistant researcher at the Finance Research Center of CAFS, Beijing, the PRC.
Naoyuki Yoshino is a professor emeritus at Keio University and former dean of the Asian Development Bank Institute, Tokyo, Japan.
Nurmukhammad Yusupov is an assistant professor of Finance at the SolBridge International School of Business, Daejeon, Republic of Korea.
Licheng Zhang is a deputy director at the Finance Research Center of CAFS, Beijing, the PRC.
Quanhou Zhao is director of the Finance Research Center of CAFS, Beijing, the PRC.

xii
Acknowledgments
The editors would like to express their gratitude to Peter Morgan, Senior Consulting Economist and Vice Chair of Research of the Asian Development Bank Institute (ADBI), for his generous support and guidance during the entire process; Iskandar Abdullaev, Deputy Director of the CAREC Institute, and Ghulam Samad, Senior Researcher Specialist of the Research Division of the CAREC Institute, for their excellent support; David Hendrickson and Adam Majoe for coordinating the editing and production process; Ian Youngs for the design of the book cover; Kae Sugawara, Tuesday Soriano, and Ainslie Smith for their diligent editing and proofreading; and Aileen Magparangalan for typesetting the book. We also wish to thank Yan Zhang, Senior Economist of the Bank of China (Tokyo), and former ADBI staff Masae Ikeda for their excellent support.
1
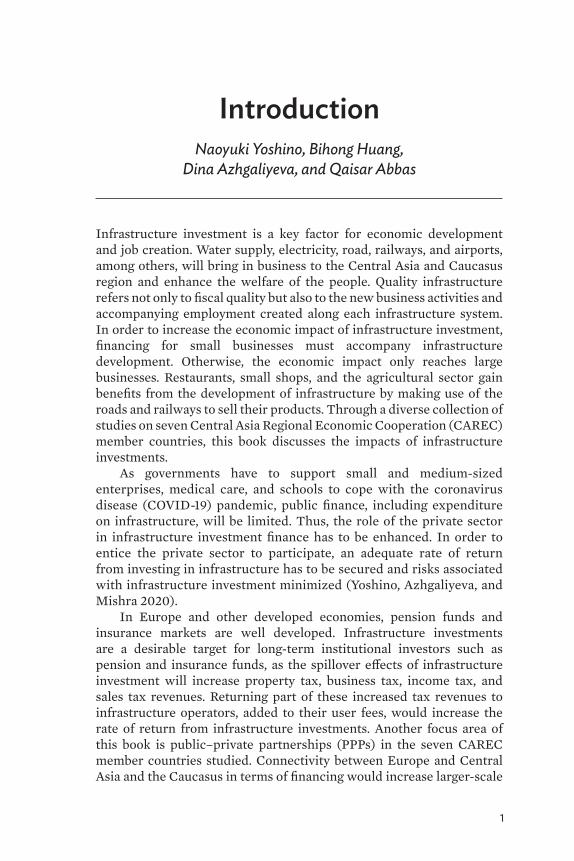
IntroductionNaoyuki Yoshino, Bihong Huang,
Dina Azhgaliyeva, and Qaisar Abbas
Infrastructure investment is a key factor for economic development and job creation. Water supply, electricity, road, railways, and airports, among others, will bring in business to the Central Asia and Caucasus region and enhance the welfare of the people. Quality infrastructure refers not only to fiscal quality but also to the new business activities and accompanying employment created along each infrastructure system. In order to increase the economic impact of infrastructure investment, financing for small businesses must accompany infrastructure development. Otherwise, the economic impact only reaches large businesses. Restaurants, small shops, and the agricultural sector gain benefits from the development of infrastructure by making use of the roads and railways to sell their products. Through a diverse collection of studies on seven Central Asia Regional Economic Cooperation (CAREC) member countries, this book discusses the impacts of infrastructure investments.
As governments have to support small and medium-sized enterprises, medical care, and schools to cope with the coronavirus disease (COVID-19) pandemic, public finance, including expenditure on infrastructure, will be limited. Thus, the role of the private sector in infrastructure investment finance has to be enhanced. In order to entice the private sector to participate, an adequate rate of return from investing in infrastructure has to be secured and risks associated with infrastructure investment minimized (Yoshino, Azhgaliyeva, and Mishra 2020).
In Europe and other developed economies, pension funds and insurance markets are well developed. Infrastructure investments are a desirable target for long-term institutional investors such as pension and insurance funds, as the spillover effects of infrastructure investment will increase property tax, business tax, income tax, and sales tax revenues. Returning part of these increased tax revenues to infrastructure operators, added to their user fees, would increase the rate of return from infrastructure investments. Another focus area of this book is public–private partnerships (PPPs) in the seven CAREC member countries studied. Connectivity between Europe and Central Asia and the Caucasus in terms of financing would increase larger-scale
2 Developing Infrastructure in Central Asia: Impacts and Financing Mechanisms
infrastructure projects, which will bring about a stable rate of return to private investors by returning part of the spillover tax revenues.
The book is organized as follows.Chapter 1 by Ghulam Samad and Qaisar Abbas first plots the
landscape of various infrastructure systems in the region, including roads, railways, air transportation, ports, water and sanitation, telecommunications, and energy. The authors give an overview of the infrastructure connectivity situation in Central Asia and the Caucasus, discuss the investments needed to fill the infrastructure gap, and propose strategies to address the challenges facing the region.
Chapter 2 by Nurmukhammad Yusupov takes a look at the impact of road construction on household financial wealth in target communities in Azerbaijan. To that end, the author constructs a two-wave dataset with regional data and household characteristics, spanning the course of 8 years, and estimates the differentials created by regional-level access to national roads. The study finds that gaining access to roads improves financial wealth in some contexts, indicating the need for policy makers to spatially sequence infrastructure improvement efforts.
Chapter 3 by Quanhou Zhao, Licheng Zhang, Beilin Feng, Wei Liu, Xiaoyan Long, Jiaxi Sun, Xu Chen, and Qiongqi Xiao comprehensively reviews the evolution of financing models for infrastructure projects in the People’s Republic China since 1978. The authors identify the potential risks of different financing models and highlight the importance of risk management for the sustainable development of infrastructure construction.
Chapter 4 by Nestan Devidze assesses the impact of infrastructure provision on public tax revenues by presenting the case study of Kutaisi International Airport in Georgia. The difference-in-differences analysis used suggests that the reconstruction of the airport had a positive impact on the tax revenues of the state, implying that the government can use the incremental tax revenues to fill the viability gap for infrastructure projects by increasing the rate of return for the private investors. The author further discusses the current state of infrastructure financing in Georgia and outlines the importance of greater involvement of the private sector in infrastructure financing through PPPs.
Chapter 5 by Bibigul Aidarkhanova studies the impacts of the Khorgos–Zhetygen railway infrastructure construction project in Kazakhstan. The railway line is located in the Almaty region in the southeast of the country on the border with the People’s Republic of China. The project aims to facilitate cross-border trade between the two countries and to increase the transit potential of both countries. Using region- and subregion-level panel data over the period 2000–2017, the author shows that the construction of the railway increased
Introduction 3
construction sector production in the region in the short term (2009–2012) and industrial production in the medium term (2013–2017). The railway construction project also increased real gross regional product in the medium term, as well as tax revenues in the short and medium terms.
Chapter 6 by Kamalbek Karymshakov and Burulcha Sulaimanova measures the impact of two road construction projects in the Kyrgyz Republic: Osh–Sarytash–Irkeshtam and Sarytash–Karamyk. Using region- and subregion-level panel data over the period 2005–2017, the authors provide empirical evidence that the road construction projects had a positive effect on poverty alleviation in the long term and on retail trade in the short term. They conclude with policy recommendations on how to increase the economic benefits of road construction.
Chapter 7 by Muhammad Ayub Mehar estimates the economic impact of improving and modernizing transport infrastructure, a rapid transit system in Punjab Province of Pakistan. Using a large sample of household data over the period 2005–2016, the author provides empirical evidence that improvement and modernization of transport infrastructure in urban areas of Punjab Province increased household income by more than 14% of the mean income compounded annually.
Chapter 8 by Ziyodullo Parpiev calculates the impact of the Dushanbe–Chanak toll road project in Tajikistan that was undertaken through a PPP. The toll road links the capital of the country and Khujand, located in Sughd and Districts of Republican Subordination (DRS), and was opened in 2010. Using data from four regions (Sughd, Khatlon, Gorno-Badakhshan Autonomous Oblast, and DRS) over the period 2000–2017, the author provides empirical evidence that, following the opening of the toll road, real gross regional product increased by 26%, regional public revenues by 29%, and regional public expenditures by 42% in the Sughd and DRS regions.

4 Developing Infrastructure in Central Asia: Impacts and Financing Mechanisms
ReferenceYoshino, N., D. Azhgaliyeva, and R. Mishra. 2020. Financing
Infrastructure Using Floating-Interest-Rate Infrastructure Bond. Journal of Infrastructure, Policy and Development. 4 (2). pp. 306–15.

5
1Infrastructure in Central Asia
and the CaucasusGhulam Samad and Qaisar Abbas1
1.1 IntroductionThe role of infrastructure in the development and growth of an economy is paramount. Not only does infrastructure have a significant impact on economic development, but infrastructure development also eventually supports economic growth, trade, and investment. Conversely, a deficiency in infrastructure creates bottlenecks to economic development, growth, trade, and investment. However, physical (or hard) infrastructure2 alone cannot contribute to the economic development of an economy, unless accompanied by so-called soft infrastructure.3
“History offers much evidence of the impacts of transformational infrastructure successes and failures” (McCartney 2018). Three examples from outside Central Asia and the Caucasus region, which is dominated by landlocked economies, demonstrate the importance of soft infrastructure along with physical infrastructure to achieve a sustained growth pattern. First, the Panama Canal connects the Atlantic and Pacific oceans, not only reducing the travel time between these two oceans from 25 hours to 12–15 hours but also avoiding 8,000 miles of
1 We appreciate the research inputs in data collection, tabulations, and figure formulations of Ghulam Nabi, Research Coordinator, PIDE, Islamabad. We are also thankful for the support and research inputs of Yao Tong and Ziyi Xiao (Research Officers at the CAREC Institute). We appreciate the valuable comments and continued support of the CAREC Institute management, namely, Syed Shakeel Shah, Ziqian Liang, Iskandar Abdullaev, and Tamar Berdzenishvili. Valuable inputs by Bihong Huang and Dina Azhgaliyeva (ADBI) are highly appreciated.
2 Roads, railways, energy, water and sanitation, seaports and airports, and telecommunication.
3 Rules and regulations that support the facilitation of trade and overall economic development.
6 Developing Infrastructure in Central Asia: Impacts and Financing Mechanisms
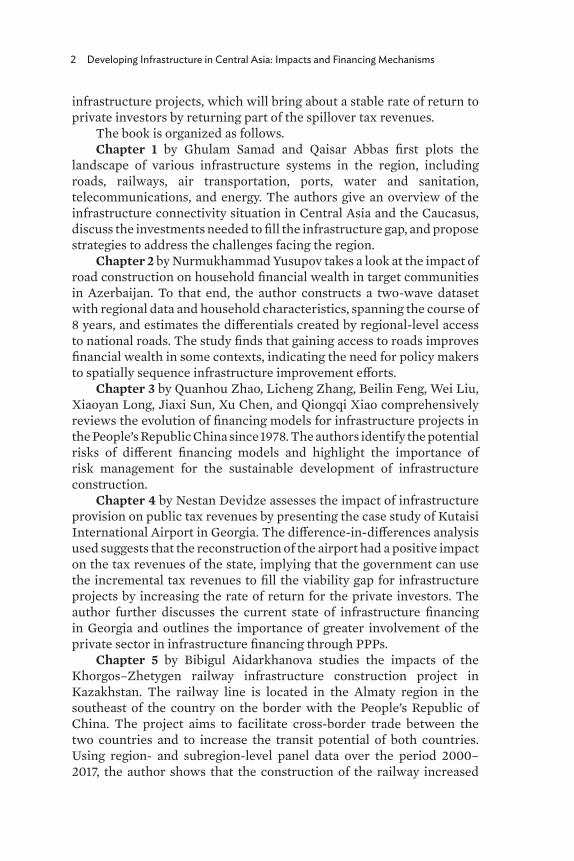
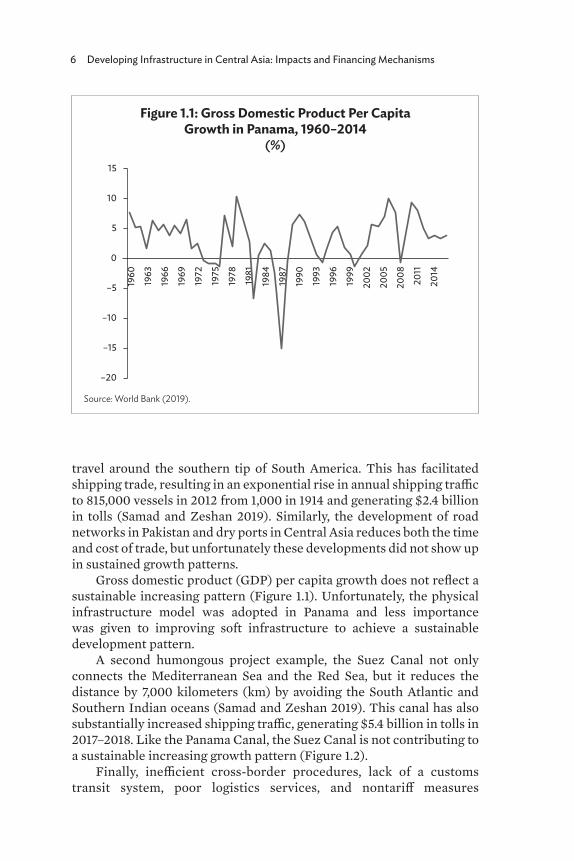
travel around the southern tip of South America. This has facilitated shipping trade, resulting in an exponential rise in annual shipping traffic to 815,000 vessels in 2012 from 1,000 in 1914 and generating $2.4 billion in tolls (Samad and Zeshan 2019). Similarly, the development of road networks in Pakistan and dry ports in Central Asia reduces both the time and cost of trade, but unfortunately these developments did not show up in sustained growth patterns.
Gross domestic product (GDP) per capita growth does not reflect a sustainable increasing pattern (Figure 1.1). Unfortunately, the physical infrastructure model was adopted in Panama and less importance was given to improving soft infrastructure to achieve a sustainable development pattern.
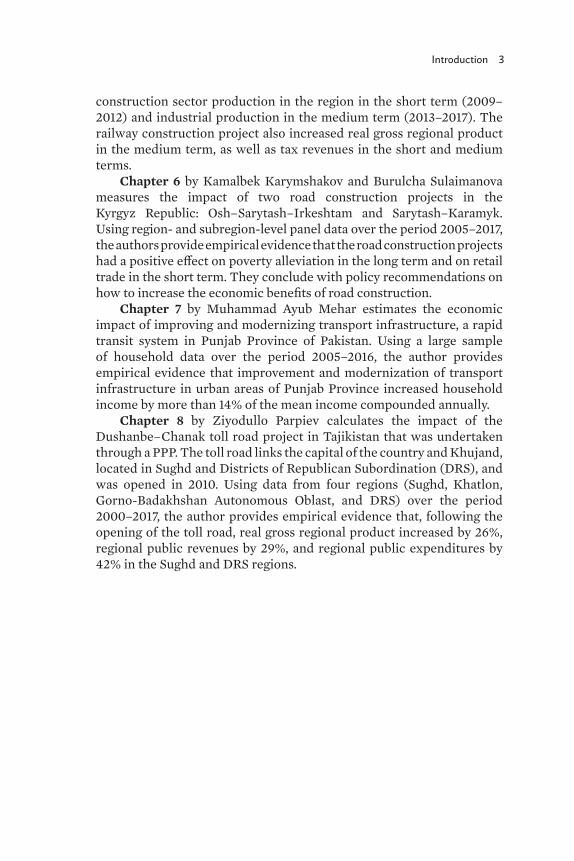
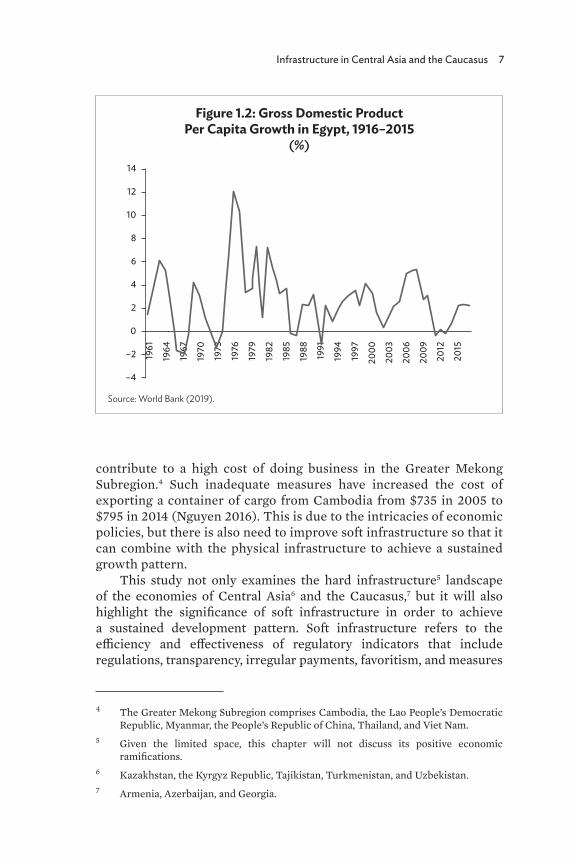
A second humongous project example, the Suez Canal not only connects the Mediterranean Sea and the Red Sea, but it reduces the distance by 7,000 kilometers (km) by avoiding the South Atlantic and Southern Indian oceans (Samad and Zeshan 2019). This canal has also substantially increased shipping traffic, generating $5.4 billion in tolls in 2017–2018. Like the Panama Canal, the Suez Canal is not contributing to a sustainable increasing growth pattern (Figure 1.2).
Finally, inefficient cross-border procedures, lack of a customs transit system, poor logistics services, and nontariff measures
Figure 1.1: Gross Domestic Product Per Capita Growth in Panama, 1960–2014
(%)
Source: World Bank (2019).
15
10
5
0
–5
–10
–15
–20
1960
1963
1966
1969
1972
1975
1978
1981
1984
1987
1990
1993
1996
1999
2002
2005
2008
2011
2014
Infrastructure in Central Asia and the Caucasus 7
contribute to a high cost of doing business in the Greater Mekong Subregion.4 Such inadequate measures have increased the cost of exporting a container of cargo from Cambodia from $735 in 2005 to $795 in 2014 (Nguyen 2016). This is due to the intricacies of economic policies, but there is also need to improve soft infrastructure so that it can combine with the physical infrastructure to achieve a sustained growth pattern.
This study not only examines the hard infrastructure5 landscape of the economies of Central Asia6 and the Caucasus,7 but it will also highlight the significance of soft infrastructure in order to achieve a sustained development pattern. Soft infrastructure refers to the efficiency and effectiveness of regulatory indicators that include regulations, transparency, irregular payments, favoritism, and measures
4 The Greater Mekong Subregion comprises Cambodia, the Lao People’s Democratic Republic, Myanmar, the People’s Republic of China, Thailand, and Viet Nam.
5 Given the limited space, this chapter will not discuss its positive economic ramifications.
6 Kazakhstan, the Kyrgyz Republic, Tajikistan, Turkmenistan, and Uzbekistan.7 Armenia, Azerbaijan, and Georgia.
Figure 1.2: Gross Domestic Product Per Capita Growth in Egypt, 1916–2015
(%)
Source: World Bank (2019).
14
10
12
8
6
2
4
0
–2
–4
1961
1964
1967
1970
1973
1976
1979
1982
1985
1988
1991
1994
1997
2000
2003
2006
2009
2012
2015
8 Developing Infrastructure in Central Asia: Impacts and Financing Mechanisms
to combat corruption (Ismail and Mahyideen 2015).8 Improved soft infrastructure brings efficiency to economic activities, and efficient infrastructure provides enormous opportunities for any country to boost its economic activities. It increases production capacity and reduces the cost of production. It also improves transport connectivity through efficient transport networks and telecommunications. Infrastructure development expands market connectivity and creates efficient markets (reducing time and price divergence), which eventually generates more jobs. To achieve optimal impact, both soft and hard infrastructure are equally important (Kingcombe 2014).
1.2 Population and Economic Profiles of Central Asia and the Caucasus
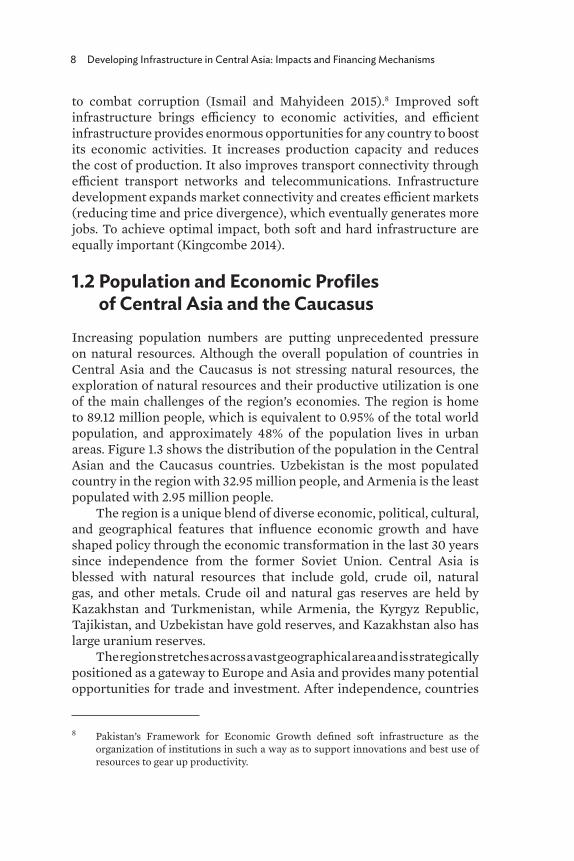
Increasing population numbers are putting unprecedented pressure on natural resources. Although the overall population of countries in Central Asia and the Caucasus is not stressing natural resources, the exploration of natural resources and their productive utilization is one of the main challenges of the region’s economies. The region is home to 89.12 million people, which is equivalent to 0.95% of the total world population, and approximately 48% of the population lives in urban areas. Figure 1.3 shows the distribution of the population in the Central Asian and the Caucasus countries. Uzbekistan is the most populated country in the region with 32.95 million people, and Armenia is the least populated with 2.95 million people.
The region is a unique blend of diverse economic, political, cultural, and geographical features that influence economic growth and have shaped policy through the economic transformation in the last 30 years since independence from the former Soviet Union. Central Asia is blessed with natural resources that include gold, crude oil, natural gas, and other metals. Crude oil and natural gas reserves are held by Kazakhstan and Turkmenistan, while Armenia, the Kyrgyz Republic, Tajikistan, and Uzbekistan have gold reserves, and Kazakhstan also has large uranium reserves.
The region stretches across a vast geographical area and is strategically positioned as a gateway to Europe and Asia and provides many potential opportunities for trade and investment. After independence, countries
8 Pakistan’s Framework for Economic Growth defined soft infrastructure as the organization of institutions in such a way as to support innovations and best use of resources to gear up productivity.
Infrastructure in Central Asia and the Caucasus 9
in Central Asia and the Caucasus transformed from state-controlled economies to market economies. The economies have embarked on market-oriented reforms that emphasize macroeconomic stabilization, trade openness, and private sector development. The governments in the region are implementing structural reforms to improve competition in the markets; raising the living standard of their people; adopting industrialization; and improving services via public policies and other measures that increase opportunities for the people in the region.
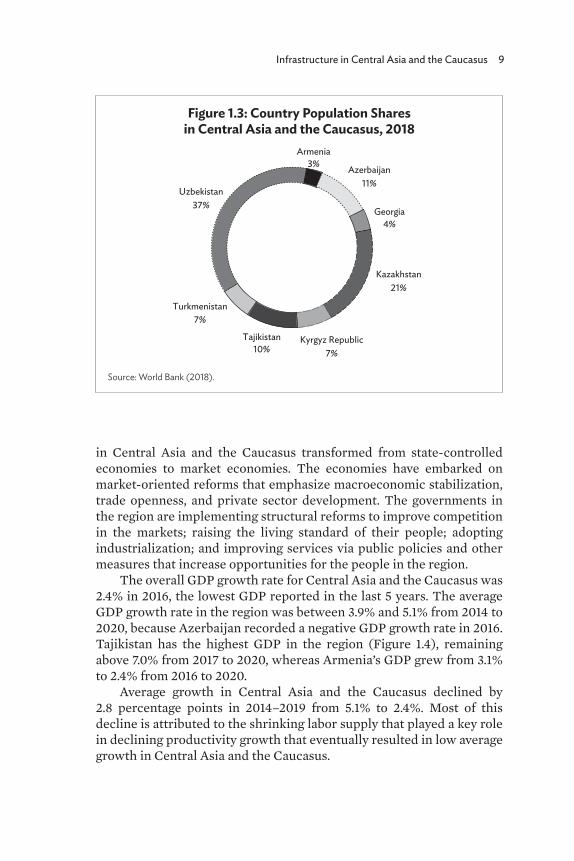
The overall GDP growth rate for Central Asia and the Caucasus was 2.4% in 2016, the lowest GDP reported in the last 5 years. The average GDP growth rate in the region was between 3.9% and 5.1% from 2014 to 2020, because Azerbaijan recorded a negative GDP growth rate in 2016. Tajikistan has the highest GDP in the region (Figure 1.4), remaining above 7.0% from 2017 to 2020, whereas Armenia’s GDP grew from 3.1% to 2.4% from 2016 to 2020.
Average growth in Central Asia and the Caucasus declined by 2.8 percentage points in 2014–2019 from 5.1% to 2.4%. Most of this decline is attributed to the shrinking labor supply that played a key role in declining productivity growth that eventually resulted in low average growth in Central Asia and the Caucasus.
Figure 1.3: Country Population Shares in Central Asia and the Caucasus, 2018
Source: World Bank (2018).
Armenia3% Azerbaijan
11%
Georgia4%
Kazakhstan21%
Kyrgyz Republic7%
Tajikistan10%
Turkmenistan7%
Uzbekistan37%
10 Developing Infrastructure in Central Asia: Impacts and Financing Mechanisms
1.3 Infrastructure Landscape in Central Asia and the Caucasus
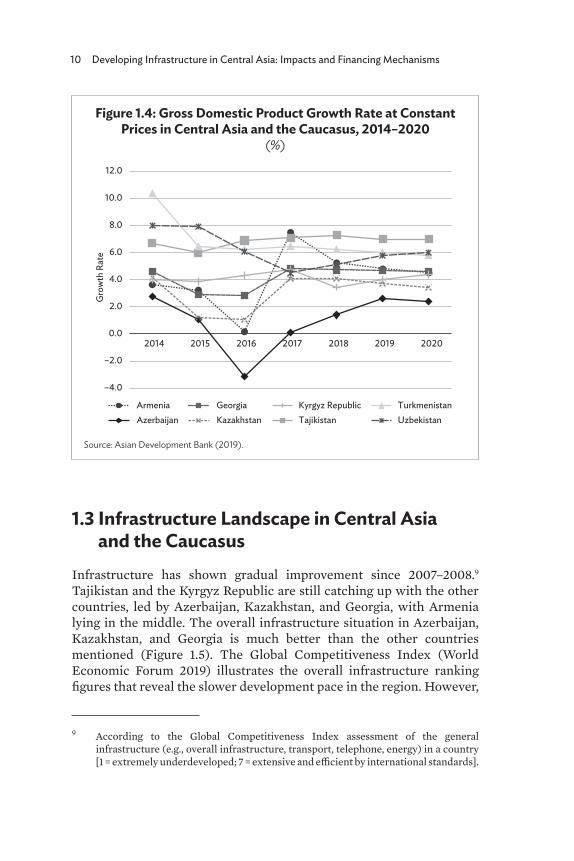
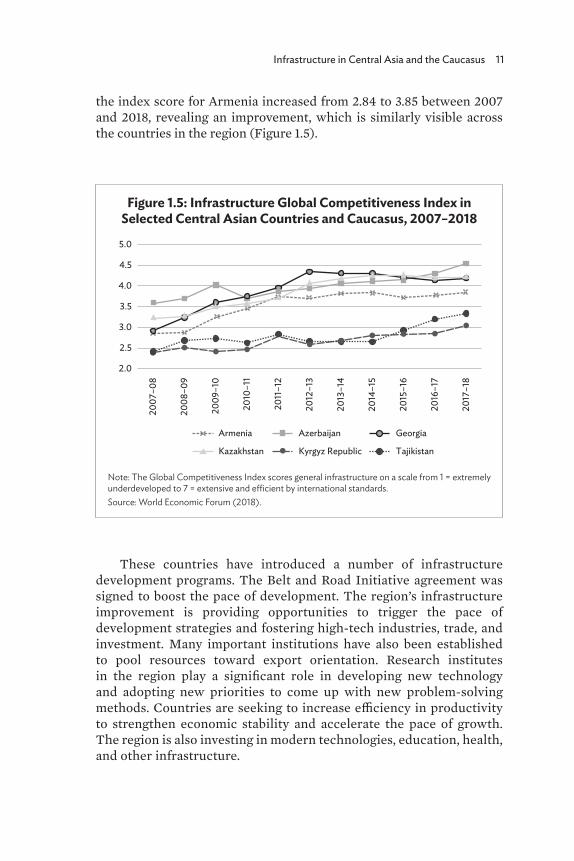
Infrastructure has shown gradual improvement since 2007–2008.9 Tajikistan and the Kyrgyz Republic are still catching up with the other countries, led by Azerbaijan, Kazakhstan, and Georgia, with Armenia lying in the middle. The overall infrastructure situation in Azerbaijan, Kazakhstan, and Georgia is much better than the other countries mentioned (Figure 1.5). The Global Competitiveness Index (World Economic Forum 2019) illustrates the overall infrastructure ranking figures that reveal the slower development pace in the region. However,
9 According to the Global Competitiveness Index assessment of the general infrastructure (e.g., overall infrastructure, transport, telephone, energy) in a country [1 = extremely underdeveloped; 7 = extensive and efficient by international standards].
Figure 1.4: Gross Domestic Product Growth Rate at Constant Prices in Central Asia and the Caucasus, 2014–2020
(%)
Source: Asian Development Bank (2019).
–4.0
–2.0
0.0
2.0
4.0
6.0
8.0
10.0
12.0
2014 2015 2016 2017 2018 2019 2020
Gro
wth
Rat
e
ArmeniaAzerbaijan
GeorgiaKazakhstan
Kyrgyz RepublicTajikistan
TurkmenistanUzbekistan
Infrastructure in Central Asia and the Caucasus 11
the index score for Armenia increased from 2.84 to 3.85 between 2007 and 2018, revealing an improvement, which is similarly visible across the countries in the region (Figure 1.5).
These countries have introduced a number of infrastructure development programs. The Belt and Road Initiative agreement was signed to boost the pace of development. The region’s infrastructure improvement is providing opportunities to trigger the pace of development strategies and fostering high-tech industries, trade, and investment. Many important institutions have also been established to pool resources toward export orientation. Research institutes in the region play a significant role in developing new technology and adopting new priorities to come up with new problem-solving methods. Countries are seeking to increase efficiency in productivity to strengthen economic stability and accelerate the pace of growth. The region is also investing in modern technologies, education, health, and other infrastructure.
Figure 1.5: Infrastructure Global Competitiveness Index in Selected Central Asian Countries and Caucasus, 2007–2018
Note: The Global Competitiveness Index scores general infrastructure on a scale from 1 = extremely underdeveloped to 7 = extensive and efficient by international standards.Source: World Economic Forum (2018).
2.0
2.5
3.0
3.5
4.0
4.5
5.0
Armenia Azerbaijan Georgia
Kazakhstan Kyrgyz Republic Tajikistan
2007
–08
2008
–09
2009
–10
2010
–11
2011
–12
2012
–13
2013
–14
2014
–15
2015
–16
2016
–17
2017
–18
12 Developing Infrastructure in Central Asia: Impacts and Financing Mechanisms
Transport InfrastructureWith the exception of Georgia, which has a coastline on the Black Sea, the rest of the Central Asia and Caucasus region is landlocked. Therefore, transport in the region mainly occurs by road and rail.
1.3.1 Road Infrastructure
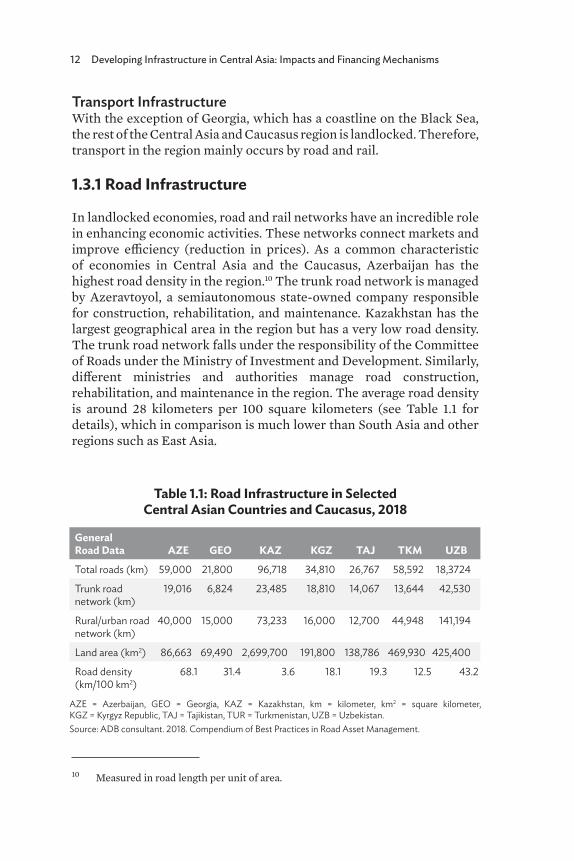
In landlocked economies, road and rail networks have an incredible role in enhancing economic activities. These networks connect markets and improve efficiency (reduction in prices). As a common characteristic of economies in Central Asia and the Caucasus, Azerbaijan has the highest road density in the region.10 The trunk road network is managed by Azeravtoyol, a semiautonomous state-owned company responsible for construction, rehabilitation, and maintenance. Kazakhstan has the largest geographical area in the region but has a very low road density. The trunk road network falls under the responsibility of the Committee of Roads under the Ministry of Investment and Development. Similarly, different ministries and authorities manage road construction, rehabilitation, and maintenance in the region. The average road density is around 28 kilometers per 100 square kilometers (see Table 1.1 for details), which in comparison is much lower than South Asia and other regions such as East Asia.
10 Measured in road length per unit of area.
Table 1.1: Road Infrastructure in Selected Central Asian Countries and Caucasus, 2018
General Road Data AZE GEO KAZ KGZ TAJ TKM UZBTotal roads (km) 59,000 21,800 96,718 34,810 26,767 58,592 18,3724
Trunk road network (km)
19,016 6,824 23,485 18,810 14,067 13,644 42,530
Rural/urban road network (km)
40,000 15,000 73,233 16,000 12,700 44,948 141,194
Land area (km2) 86,663 69,490 2,699,700 191,800 138,786 469,930 425,400
Road density (km/100 km2)
68.1 31.4 3.6 18.1 19.3 12.5 43.2
AZE = Azerbaijan, GEO = Georgia, KAZ = Kazakhstan, km = kilometer, km2 = square kilometer, KGZ = Kyrgyz Republic, TAJ = Tajikistan, TUR = Turkmenistan, UZB = Uzbekistan. Source: ADB consultant. 2018. Compendium of Best Practices in Road Asset Management.

Infrastructure in Central Asia and the Caucasus 13
1.3.2 Rail Infrastructure
The rail networks are the backbone of any economy, used for the distribution of goods from one place to another and also for passenger travel. The extensive rail network in Central Asia connects Kazakhstan, Uzbekistan, and Turkmenistan with links to the Kyrgyz Republic and Tajikistan. The rail network also connects seaports on the Persian Gulf, the Mediterranean Sea, and the Black Sea. Also, the rail network provides potential transit to East Asia, as well as Southern and Central Europe. In addition, the rail network connects the industrial sector of northern Kazakhstan with the northern border of the region. This mainline provides a junction between Kazakhstan, the European portion of the Russian Federation, and the People’s Republic of China (PRC) to the northeast of Kazakhstan.
Figure 1.6 shows the extent of the Kazakhstan railway network that connects the PRC in East Asia, the European portion of the Russian Federation to the north of Kazakhstan, and the Kyrgyz Republic to the south of Kazakhstan. The total length of the Kazakhstan railways was 16,040.3 kilometers in 2017, it grew 12.9% over a decade. The Kyrgyz Republic has a limited rail network, but it is important due to its
Figure 1.6: Railway Length in Central Asia and the Caucasus, 1995–2017
Source: World Bank (2018).
Kilo
met
ers (
hund
reds
)
0102030405060708090
100110120130140150160170
1995
1996
1997
1998
1999
2000
2001
2002
2003
2004
2005
2006
2007
2008
2009
2010
2011
2012
2013
2014
2015
2016
2017
2018
Armenia Azerbaijan GeorgiaKazakhstan Kyrgyz Republic TajikistanUzbekistan Turkmenistan
14 Developing Infrastructure in Central Asia: Impacts and Financing Mechanisms
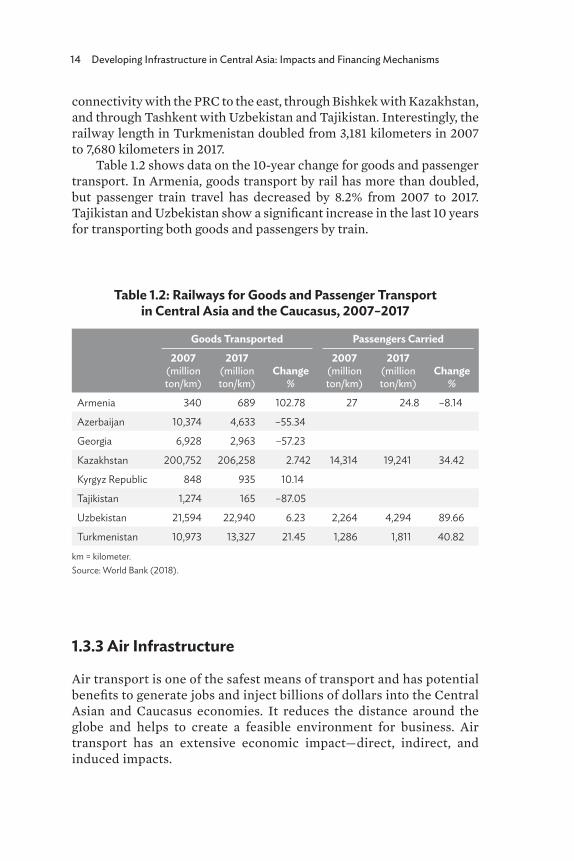
connectivity with the PRC to the east, through Bishkek with Kazakhstan, and through Tashkent with Uzbekistan and Tajikistan. Interestingly, the railway length in Turkmenistan doubled from 3,181 kilometers in 2007 to 7,680 kilometers in 2017.
Table 1.2 shows data on the 10-year change for goods and passenger transport. In Armenia, goods transport by rail has more than doubled, but passenger train travel has decreased by 8.2% from 2007 to 2017. Tajikistan and Uzbekistan show a significant increase in the last 10 years for transporting both goods and passengers by train.
1.3.3 Air Infrastructure
Air transport is one of the safest means of transport and has potential benefits to generate jobs and inject billions of dollars into the Central Asian and Caucasus economies. It reduces the distance around the globe and helps to create a feasible environment for business. Air transport has an extensive economic impact—direct, indirect, and induced impacts.
Table 1.2: Railways for Goods and Passenger Transport in Central Asia and the Caucasus, 2007–2017
Goods Transported Passengers Carried2007
(million ton/km)
2017 (million ton/km)
Change%
2007 (million ton/km)
2017(million ton/km)
Change%
Armenia 340 689 102.78 27 24.8 –8.14
Azerbaijan 10,374 4,633 –55.34
Georgia 6,928 2,963 –57.23
Kazakhstan 200,752 206,258 2.742 14,314 19,241 34.42
Kyrgyz Republic 848 935 10.14
Tajikistan 1,274 165 –87.05
Uzbekistan 21,594 22,940 6.23 2,264 4,294 89.66
Turkmenistan 10,973 13,327 21.45 1,286 1,811 40.82
km = kilometer.Source: World Bank (2018).
Infrastructure in Central Asia and the Caucasus 15
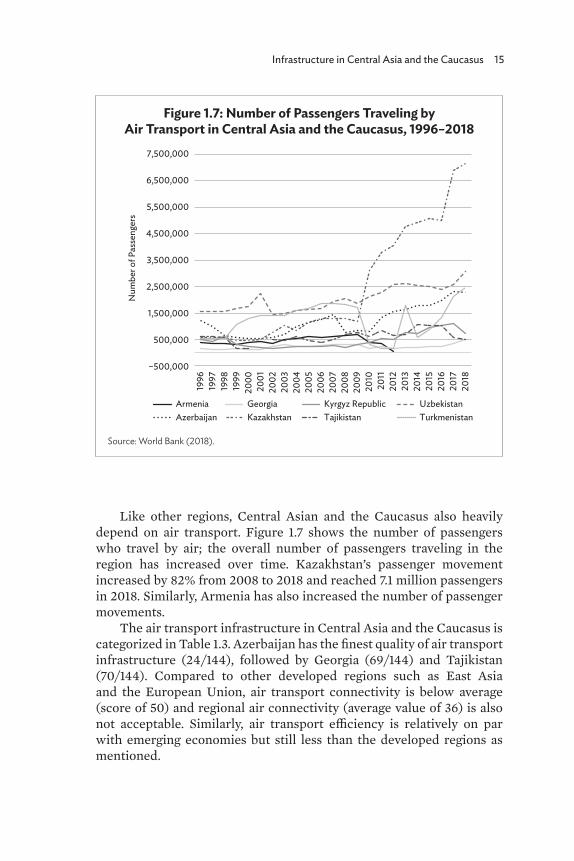
Figure 1.7: Number of Passengers Traveling by Air Transport in Central Asia and the Caucasus, 1996–2018
Source: World Bank (2018).
–500,000
500,000
1,500,000
2,500,000
3,500,000
4,500,000
5,500,000
6,500,000
7,500,000
1996
1997
1998
1999
2000
2001
2002
2003
2004
2005
2006
2007
2008
2009
2010
2011
2012
2013
2014
2015
2016
2017
2018
Num
ber o
f Pas
seng
ers
ArmeniaAzerbaijan
GeorgiaKazakhstan
Kyrgyz RepublicTajikistan
UzbekistanTurkmenistan
Like other regions, Central Asian and the Caucasus also heavily depend on air transport. Figure 1.7 shows the number of passengers who travel by air; the overall number of passengers traveling in the region has increased over time. Kazakhstan’s passenger movement increased by 82% from 2008 to 2018 and reached 7.1 million passengers in 2018. Similarly, Armenia has also increased the number of passenger movements.
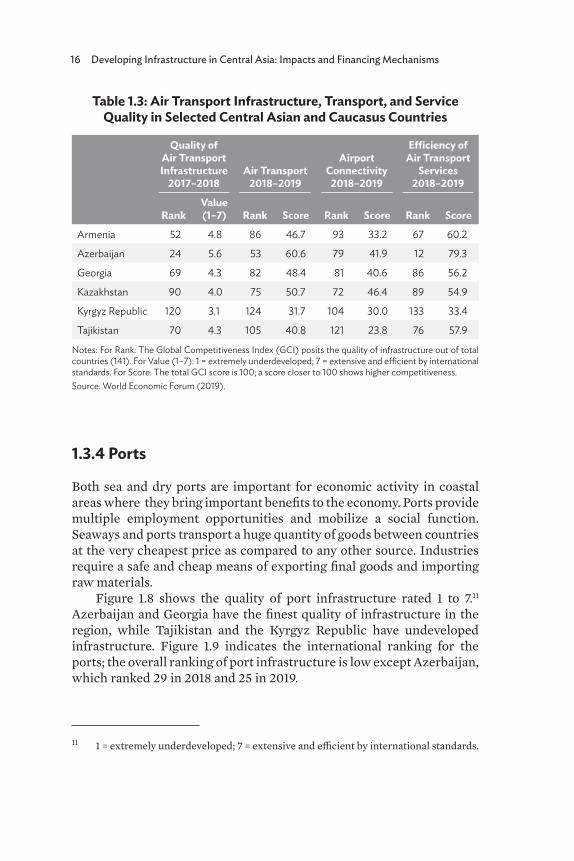
The air transport infrastructure in Central Asia and the Caucasus is categorized in Table 1.3. Azerbaijan has the finest quality of air transport infrastructure (24/144), followed by Georgia (69/144) and Tajikistan (70/144). Compared to other developed regions such as East Asia and the European Union, air transport connectivity is below average (score of 50) and regional air connectivity (average value of 36) is also not acceptable. Similarly, air transport efficiency is relatively on par with emerging economies but still less than the developed regions as mentioned.
16 Developing Infrastructure in Central Asia: Impacts and Financing Mechanisms
Table 1.3: Air Transport Infrastructure, Transport, and Service Quality in Selected Central Asian and Caucasus Countries
Quality of Air Transport Infrastructure
2017–2018Air Transport
2018–2019
Airport Connectivity
2018–2019
Efficiency of Air Transport
Services2018–2019
RankValue (1–7) Rank Score Rank Score Rank Score
Armenia 52 4.8 86 46.7 93 33.2 67 60.2
Azerbaijan 24 5.6 53 60.6 79 41.9 12 79.3
Georgia 69 4.3 82 48.4 81 40.6 86 56.2
Kazakhstan 90 4.0 75 50.7 72 46.4 89 54.9
Kyrgyz Republic 120 3.1 124 31.7 104 30.0 133 33.4
Tajikistan 70 4.3 105 40.8 121 23.8 76 57.9
Notes: For Rank: The Global Competitiveness Index (GCI) posits the quality of infrastructure out of total countries (141). For Value (1–7): 1 = extremely underdeveloped; 7 = extensive and efficient by international standards. For Score: The total GCI score is 100; a score closer to 100 shows higher competitiveness.Source: World Economic Forum (2019).
1.3.4 Ports
Both sea and dry ports are important for economic activity in coastal areas where they bring important benefits to the economy. Ports provide multiple employment opportunities and mobilize a social function. Seaways and ports transport a huge quantity of goods between countries at the very cheapest price as compared to any other source. Industries require a safe and cheap means of exporting final goods and importing raw materials.
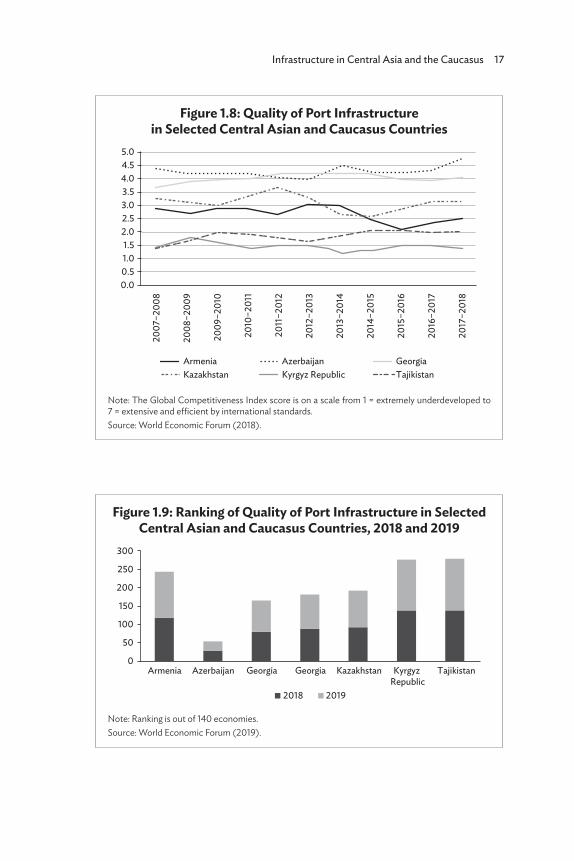
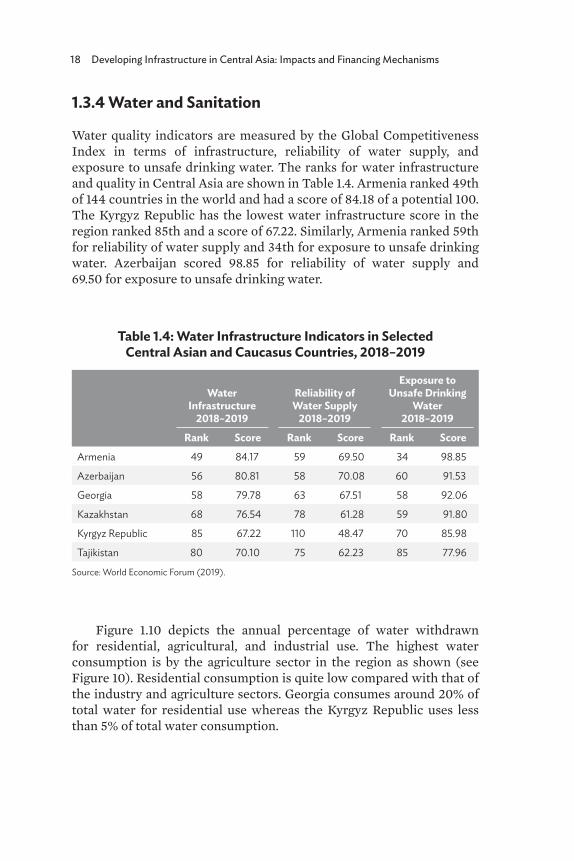
Figure 1.8 shows the quality of port infrastructure rated 1 to 7.11 Azerbaijan and Georgia have the finest quality of infrastructure in the region, while Tajikistan and the Kyrgyz Republic have undeveloped infrastructure. Figure 1.9 indicates the international ranking for the ports; the overall ranking of port infrastructure is low except Azerbaijan, which ranked 29 in 2018 and 25 in 2019.
11 1 = extremely underdeveloped; 7 = extensive and efficient by international standards.
Infrastructure in Central Asia and the Caucasus 17
Figure 1.8: Quality of Port Infrastructure in Selected Central Asian and Caucasus Countries
Note: The Global Competitiveness Index score is on a scale from 1 = extremely underdeveloped to 7 = extensive and efficient by international standards. Source: World Economic Forum (2018).
5.04.54.03.53.02.52.01.5
0.51.0
0.0
2007
–200
8
2008
–200
9
2009
–201
0
2010
–201
1
2011
–201
2
2012
–201
3
2013
–201
4
2014
–201
5
2015
–201
6
2016
–201
7
2017
–201
8
Armenia Azerbaijan GeorgiaKazakhstan Kyrgyz Republic Tajikistan
Figure 1.9: Ranking of Quality of Port Infrastructure in Selected Central Asian and Caucasus Countries, 2018 and 2019
Note: Ranking is out of 140 economies. Source: World Economic Forum (2019).
Armenia Azerbaijan Georgia Georgia
2018 2019
Kazakhstan Kyrgyz Republic
Tajikistan
300
250
200
150
100
50
0
18 Developing Infrastructure in Central Asia: Impacts and Financing Mechanisms
Table 1.4: Water Infrastructure Indicators in Selected Central Asian and Caucasus Countries, 2018–2019
Water Infrastructure
2018–2019
Reliability of Water Supply
2018–2019
Exposure to Unsafe Drinking
Water2018–2019
Rank Score Rank Score Rank ScoreArmenia 49 84.17 59 69.50 34 98.85
Azerbaijan 56 80.81 58 70.08 60 91.53
Georgia 58 79.78 63 67.51 58 92.06
Kazakhstan 68 76.54 78 61.28 59 91.80
Kyrgyz Republic 85 67.22 110 48.47 70 85.98
Tajikistan 80 70.10 75 62.23 85 77.96
Source: World Economic Forum (2019).
1.3.4 Water and Sanitation
Water quality indicators are measured by the Global Competitiveness Index in terms of infrastructure, reliability of water supply, and exposure to unsafe drinking water. The ranks for water infrastructure and quality in Central Asia are shown in Table 1.4. Armenia ranked 49th of 144 countries in the world and had a score of 84.18 of a potential 100. The Kyrgyz Republic has the lowest water infrastructure score in the region ranked 85th and a score of 67.22. Similarly, Armenia ranked 59th for reliability of water supply and 34th for exposure to unsafe drinking water. Azerbaijan scored 98.85 for reliability of water supply and 69.50 for exposure to unsafe drinking water.
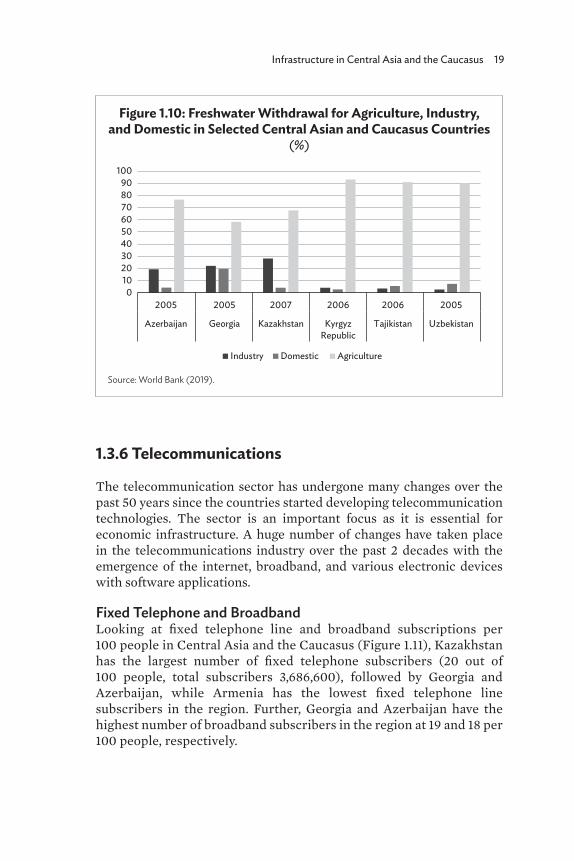
Figure 1.10 depicts the annual percentage of water withdrawn for residential, agricultural, and industrial use. The highest water consumption is by the agriculture sector in the region as shown (see Figure 10). Residential consumption is quite low compared with that of the industry and agriculture sectors. Georgia consumes around 20% of total water for residential use whereas the Kyrgyz Republic uses less than 5% of total water consumption.
Infrastructure in Central Asia and the Caucasus 19
1.3.6 Telecommunications
The telecommunication sector has undergone many changes over the past 50 years since the countries started developing telecommunication technologies. The sector is an important focus as it is essential for economic infrastructure. A huge number of changes have taken place in the telecommunications industry over the past 2 decades with the emergence of the internet, broadband, and various electronic devices with software applications.
Fixed Telephone and BroadbandLooking at fixed telephone line and broadband subscriptions per 100 people in Central Asia and the Caucasus (Figure 1.11), Kazakhstan has the largest number of fixed telephone subscribers (20 out of 100 people, total subscribers 3,686,600), followed by Georgia and Azerbaijan, while Armenia has the lowest fixed telephone line subscribers in the region. Further, Georgia and Azerbaijan have the highest number of broadband subscribers in the region at 19 and 18 per 100 people, respectively.
Figure 1.10: Freshwater Withdrawal for Agriculture, Industry, and Domestic in Selected Central Asian and Caucasus Countries
(%)
Source: World Bank (2019).
0102030405060708090
100
2005 2005 2007 2006 2006 2005
Azerbaijan Georgia Kazakhstan KyrgyzRepublic
Tajikistan Uzbekistan
Industry Domestic Agriculture
20 Developing Infrastructure in Central Asia: Impacts and Financing Mechanisms
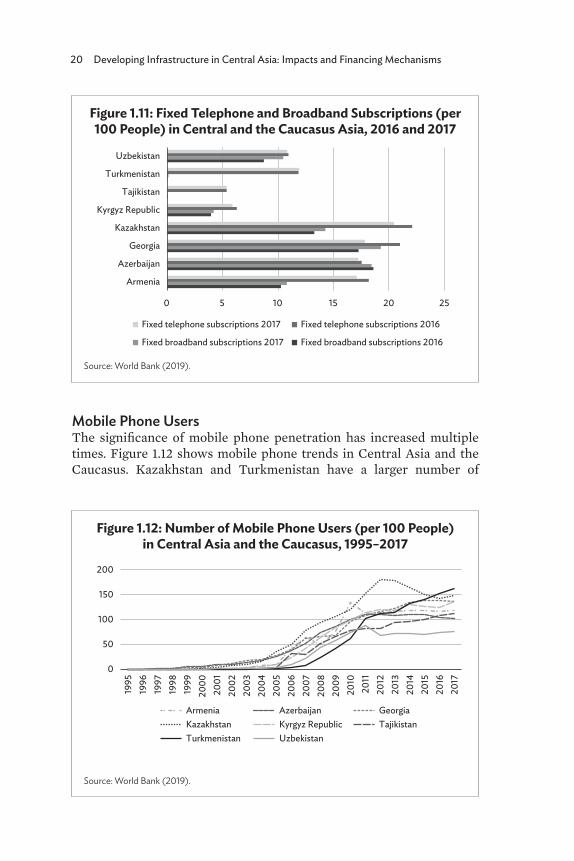
Mobile Phone UsersThe significance of mobile phone penetration has increased multiple times. Figure 1.12 shows mobile phone trends in Central Asia and the Caucasus. Kazakhstan and Turkmenistan have a larger number of
Figure 1.12: Number of Mobile Phone Users (per 100 People) in Central Asia and the Caucasus, 1995–2017
Source: World Bank (2019).
0
50
100
150
200
1995
1996
1997
1998
1999
2000
2001
2002
2003
2004
2005
2006
2007
2008
2009
2010
2011
2012
2013
2014
2015
2016
2017
Armenia Azerbaijan GeorgiaKazakhstan Kyrgyz Republic TajikistanTurkmenistan Uzbekistan
Figure 1.11: Fixed Telephone and Broadband Subscriptions (per 100 People) in Central and the Caucasus Asia, 2016 and 2017
Source: World Bank (2019).
0 5 10 15 20 25
Armenia
Azerbaijan
Georgia
Kazakhstan
Kyrgyz Republic
Tajikistan
Turkmenistan
Uzbekistan
Fixed telephone subscriptions 2017 Fixed telephone subscriptions 2016
Fixed broadband subscriptions 2017 Fixed broadband subscriptions 2016
Infrastructure in Central Asia and the Caucasus 21
mobile phone users, while the Kyrgyz Republic has the lowest number of users in the region.
1.3.7 Energy
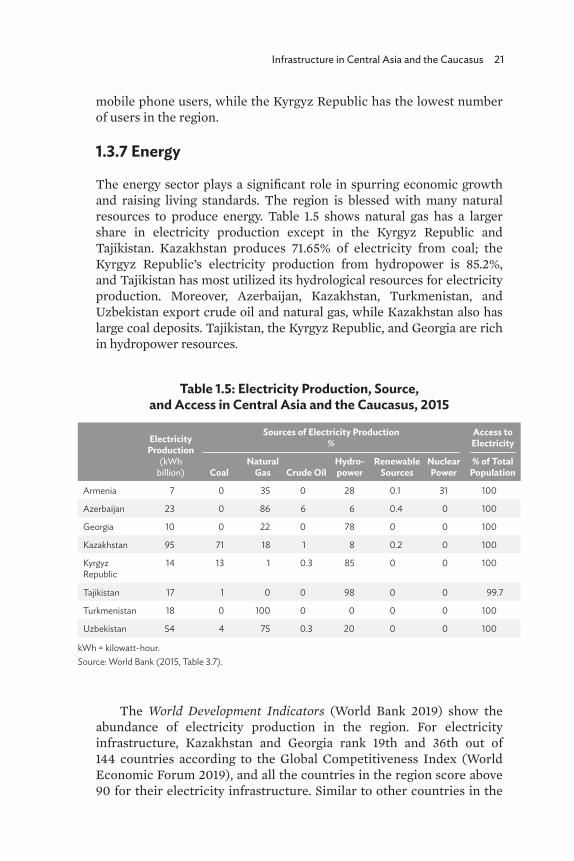
The energy sector plays a significant role in spurring economic growth and raising living standards. The region is blessed with many natural resources to produce energy. Table 1.5 shows natural gas has a larger share in electricity production except in the Kyrgyz Republic and Tajikistan. Kazakhstan produces 71.65% of electricity from coal; the Kyrgyz Republic’s electricity production from hydropower is 85.2%, and Tajikistan has most utilized its hydrological resources for electricity production. Moreover, Azerbaijan, Kazakhstan, Turkmenistan, and Uzbekistan export crude oil and natural gas, while Kazakhstan also has large coal deposits. Tajikistan, the Kyrgyz Republic, and Georgia are rich in hydropower resources.
The World Development Indicators (World Bank 2019) show the abundance of electricity production in the region. For electricity infrastructure, Kazakhstan and Georgia rank 19th and 36th out of 144 countries according to the Global Competitiveness Index (World Economic Forum 2019), and all the countries in the region score above 90 for their electricity infrastructure. Similar to other countries in the
Table 1.5: Electricity Production, Source, and Access in Central Asia and the Caucasus, 2015
Electricity Production
(kWh billion)
Sources of Electricity Production %
Access to Electricity
CoalNatural
Gas Crude OilHydro-power
Renewable Sources
Nuclear Power
% of Total Population
Armenia 7 0 35 0 28 0.1 31 100
Azerbaijan 23 0 86 6 6 0.4 0 100
Georgia 10 0 22 0 78 0 0 100
Kazakhstan 95 71 18 1 8 0.2 0 100
Kyrgyz Republic
14 13 1 0.3 85 0 0 100
Tajikistan 17 1 0 0 98 0 0 99.7
Turkmenistan 18 0 100 0 0 0 0 100
Uzbekistan 54 4 75 0.3 20 0 0 100
kWh = kilowatt-hour.Source: World Bank (2015, Table 3.7).
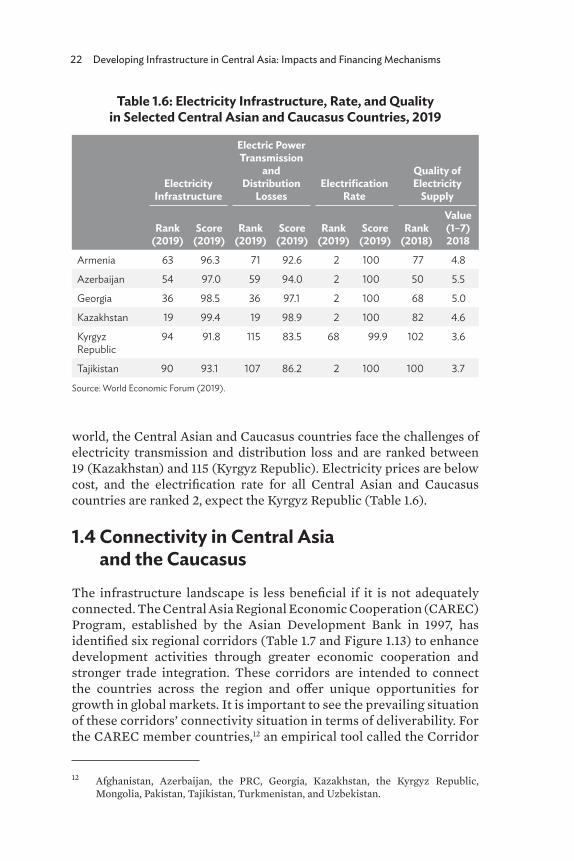
22 Developing Infrastructure in Central Asia: Impacts and Financing Mechanisms
world, the Central Asian and Caucasus countries face the challenges of electricity transmission and distribution loss and are ranked between 19 (Kazakhstan) and 115 (Kyrgyz Republic). Electricity prices are below cost, and the electrification rate for all Central Asian and Caucasus countries are ranked 2, expect the Kyrgyz Republic (Table 1.6).
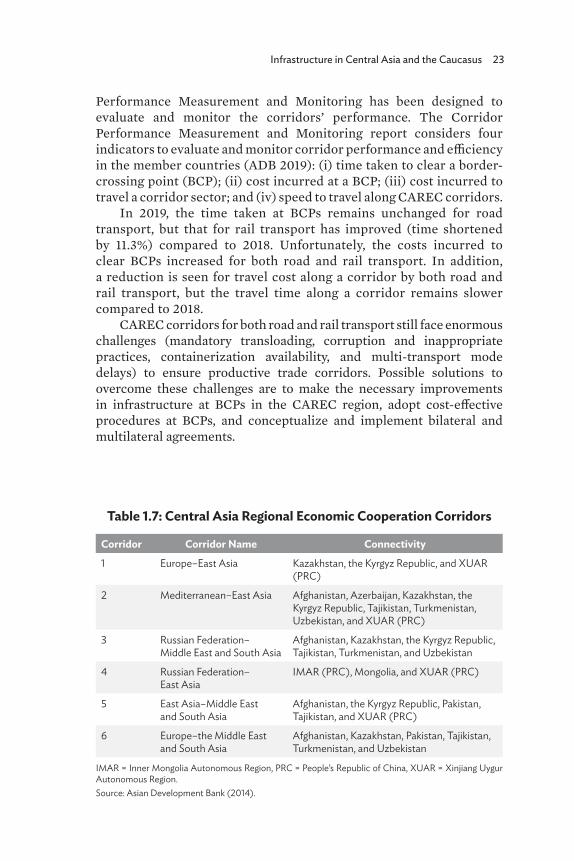
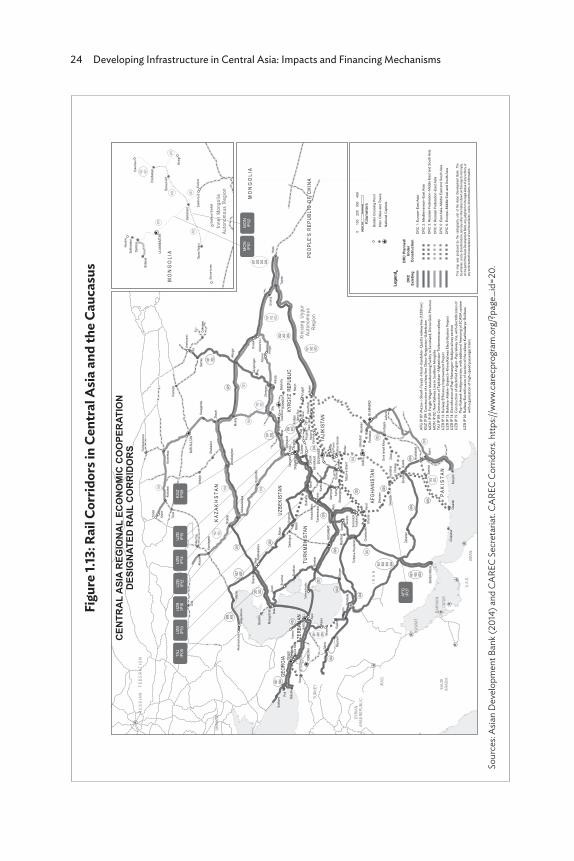
1.4 Connectivity in Central Asia and the Caucasus
The infrastructure landscape is less beneficial if it is not adequately connected. The Central Asia Regional Economic Cooperation (CAREC) Program, established by the Asian Development Bank in 1997, has identified six regional corridors (Table 1.7 and Figure 1.13) to enhance development activities through greater economic cooperation and stronger trade integration. These corridors are intended to connect the countries across the region and offer unique opportunities for growth in global markets. It is important to see the prevailing situation of these corridors’ connectivity situation in terms of deliverability. For the CAREC member countries,12 an empirical tool called the Corridor
12 Afghanistan, Azerbaijan, the PRC, Georgia, Kazakhstan, the Kyrgyz Republic, Mongolia, Pakistan, Tajikistan, Turkmenistan, and Uzbekistan.
Table 1.6: Electricity Infrastructure, Rate, and Quality in Selected Central Asian and Caucasus Countries, 2019
Electricity Infrastructure
Electric Power Transmission
and Distribution
LossesElectrification
Rate
Quality of Electricity
Supply
Rank (2019)
Score (2019)
Rank (2019)
Score (2019)
Rank (2019)
Score (2019)
Rank (2018)
Value (1–7) 2018
Armenia 63 96.3 71 92.6 2 100 77 4.8
Azerbaijan 54 97.0 59 94.0 2 100 50 5.5
Georgia 36 98.5 36 97.1 2 100 68 5.0
Kazakhstan 19 99.4 19 98.9 2 100 82 4.6
Kyrgyz Republic
94 91.8 115 83.5 68 99.9 102 3.6
Tajikistan 90 93.1 107 86.2 2 100 100 3.7
Source: World Economic Forum (2019).
Infrastructure in Central Asia and the Caucasus 23
Performance Measurement and Monitoring has been designed to evaluate and monitor the corridors’ performance. The Corridor Performance Measurement and Monitoring report considers four indicators to evaluate and monitor corridor performance and efficiency in the member countries (ADB 2019): (i) time taken to clear a border-crossing point (BCP); (ii) cost incurred at a BCP; (iii) cost incurred to travel a corridor sector; and (iv) speed to travel along CAREC corridors.
In 2019, the time taken at BCPs remains unchanged for road transport, but that for rail transport has improved (time shortened by 11.3%) compared to 2018. Unfortunately, the costs incurred to clear BCPs increased for both road and rail transport. In addition, a reduction is seen for travel cost along a corridor by both road and rail transport, but the travel time along a corridor remains slower compared to 2018.
CAREC corridors for both road and rail transport still face enormous challenges (mandatory transloading, corruption and inappropriate practices, containerization availability, and multi-transport mode delays) to ensure productive trade corridors. Possible solutions to overcome these challenges are to make the necessary improvements in infrastructure at BCPs in the CAREC region, adopt cost-effective procedures at BCPs, and conceptualize and implement bilateral and multilateral agreements.
Table 1.7: Central Asia Regional Economic Cooperation Corridors
Corridor Corridor Name Connectivity1 Europe–East Asia Kazakhstan, the Kyrgyz Republic, and XUAR
(PRC)
2 Mediterranean–East Asia Afghanistan, Azerbaijan, Kazakhstan, the Kyrgyz Republic, Tajikistan, Turkmenistan, Uzbekistan, and XUAR (PRC)
3 Russian Federation– Middle East and South Asia
Afghanistan, Kazakhstan, the Kyrgyz Republic, Tajikistan, Turkmenistan, and Uzbekistan
4 Russian Federation– East Asia
IMAR (PRC), Mongolia, and XUAR (PRC)
5 East Asia–Middle East and South Asia
Afghanistan, the Kyrgyz Republic, Pakistan, Tajikistan, and XUAR (PRC)
6 Europe–the Middle East and South Asia
Afghanistan, Kazakhstan, Pakistan, Tajikistan, Turkmenistan, and Uzbekistan
IMAR = Inner Mongolia Autonomous Region, PRC = People’s Republic of China, XUAR = Xinjiang Uygur Autonomous Region. Source: Asian Development Bank (2014).
24 Developing Infrastructure in Central Asia: Impacts and Financing Mechanisms
Figu
re 1.
13: R
ail C
orrid
ors i
n Ce
ntra
l Asia
and
the C
auca
sus
Sour
ces:
Asian
Dev
elop
men
t Ban
k (20
14) a
nd C
AREC
Sec
reta
riat.
CARE
C Co
rrido
rs. h
ttps:/
/www
.care
cpro
gram
.org
/?pa
ge_i
d=20
.
602
601 604
601 602 603
603 605603 605
603605
605
604604
605
601 602 603 604
501502 503
501 502 503
502
503
301
302
301
301 302
301 302
201
202
201 202
202 203
201
204203
204
204
202 203 204
201 202 203 204
201 202 203
102 103103 102
103101
102 103
101
101 102 103
Chais
horkh
Ghurian
TorbateHe
ydarieh
Mashh
adNukus
Urgench
Bukha
ra
Shym
kent
ASGH
ABAT
Mary
Sama
rkand
Kyzyl
orda
Pavlo
dar
Karag
anda
NURS
ULTAN
Oskem
enAktob
e
Petropavlo
vsk
Koksh
etau
Kosta
nai
Taldyk
organ
Herat
Atyrau
Mangysh
lak
Kunduz
KABU
L
DUSH
ANBE
Naryn
BISHK
EK
Almaty
TASH
KENT
ISLAM
ABAD
Kandahar
Oral
BAKU
Shalk
ar
Seme
y Aktog
ai
Urumq
iZhety
gen
Arkaly
k
Shubark
ol
Zhezk
azghan
Saksa
ulskay
a
Taraz
Gulist
anPa
pAn
dijan Irk
eshtam
SaryTas
hFerga
naOs
h
Bokht
arTer
mez
Sheberg
han
Delaram
Geres
hk
Gorga
n
Berek
et
Buzkh
un
Uzen
Beyne
u
YERE
VAN
TBILISI
Kars
Bautin
o Qazvi
nMiy
aneh
Tabriz
TEHR
AN
Karac
hiGw
adar
Chabahar
Bandar Ab
bas
Kashi
Torugart
Lahore
Quetta
Turkm
enabat
Djizza
kNa
voi
Karsh
i
Atamy
rat
Dasho
guz
Zahedan
Pesha
war
Jalala
bad
Kandagash
Nikel’t
au
Tobol
Mazar
eSh
arif
Rasht
Balyk
chy
Zhary
k
Turpa
n
Shu
Mointy
Bosta
n
Zhob
Kotlaj
amDe
ra Ism
ail Kh
an
Basim
a
Jacobabad
Havel
ian
Rohri
Hami
Poti
Sukhu
mi Batum
iAn
gren
Miskin
Lugovay
a
Yalam
a
Astara
Astara
Aksar
ayskay
aGa
nyushk
ino Aktau
Troitsk
Kairak
Vesel
oyarsk
Aul
Alasha
nkou
Horgo
s
Turgh
undy
Serhe
tabat
Sarah
s Sarak
hsKhodzhi
davle
t
Shirkh
an Ba
ndar
Panji
Poyon
Keles
Saryg
ash
Savai
Kara
Suu
Karam
ykKa
ramyk
Garda
bani
Beyuk
Kesik
Hairatan
Karak
alpaki
ya
Farap
Oasis
Alyat
Aqina
Altynk
ol
Dosty
k
Bolac
hak
Cham
an
Turkm
enbashy
Chald
ovar
SAUD
I AR
ABIA
OMAN
U.A.E.
QATA
RBA
HRAIN
KUWA
IT
IRAQ
TURK
EY
SYRIA
N AR
AB RE
PUBL
IC
UKRA
INE
R U S
S I A N
F E
D E R
A T I O
N
I R A N
R U S
S I A N
F E
D E R
A T I O
N
GEOR
GIA
ARME
NIA
UZBE
KIST
AN
AZER
BAIJA
N
AFGH
ANISTA
N
P A K
I S T A
N
TURK
MENIST
AN
TAJIK
ISTA
N
M O N
G O L
I A
KYRG
YZ R
EPUB
LIC
PEOP
LE'S
REP
UBLIC
OF C
HINA
K A Z A K
H S T
A N
Xinjia
ng U
ygur
Auton
omou
sRe
gion
Borde
r Cros
sing P
oint
Main
Citie
s and
Town
sNa
tiona
l Cap
itals
DRC
1: Eu
rope–
East As
iaDR
C 2:
Medit
erran
ean–
East As
iaDR
C 3:
Russian
Fede
ration
–Midd
le Ea
st an
d Sou
th As
iaDR
C 4:
Russian
Fede
ration
–Eas
t Asia
DRC
5: Ea
st As
ia–Mi
ddle
East
and S
outh
Asia
DRC
6: Eu
rope–
Midd
le Ea
st an
d Sou
th As
ia
Lege
nd
DRC
Exist
ingDR
C Plan
ned/
Unde
rCo
nstru
ction
CENT
RAL A
SIA RE
GION
AL ECO
NOMI
C CO
OPER
ATIO
NDE
SIGN
ATED
RAI
L COR
RIDO
RS
193001g AV
010
020
030
040
0
Kilom
eters
Source
: CAR
EC Sec
retar
iat
This
map w
as pro
duced
by th
e cartograp
hy unit o
f the A
sian D
evelop
ment
Bank.
The
boundaries, c
olors, de
nomin
ations,
and a
ny oth
er info
rmatio
n shown
on thi
s map do
not im
ply,
on the
part o
f the A
sian D
evelop
ment B
ank, a
ny jud
gment on
the leg
al status
of any
territo
ry, or
any e
ndors
ement or
accep
tance
of such
boundaries, c
olors, de
nomin
ations,
or info
rmatio
n.
402
402 403
403
401402
401UL
AANB
AATAR
Tavan To
lgoi
Sains
hand
Choib
alsan
Darkh
anSu
khbaatar
Baruu
nUrt
Erdenet
Shive
ehure
n
Erenhot
Zamii
nUud
Bichig
t
Naush
ki
Ereentsa
v
Gashu
un Su
khait
M O N
G O L
I A
Inner
Mon
golia
Auton
omou
s Reg
ion
AFG
IP ��
� Maz
ar-i-S
harif
�Fary
a���
erat�
Kand
ahar�
��ett
a rail
way l
ine ��
��� k
m�
KGZ I
P ���
Cons
tr�cti
on of
a rai
lway
line C
hina�
Kyrgy
zstan
�Uz�
ekist
anMO
N IP
��� F
reigh
t �ag
on M
an�fa
ct�rin
g Fac
ility i
n Sain
shan
d, Do
rno G
o�i P
ro�inc
e MO
N IP
��� N
ew �a
ilway
�ine
in So
�thern
Mon
golia
TA
� IP �
�� Co
nstr�
ction
of Ta
jikist
an�A
fghan
istan
�T�rk
menis
tan ra
ilway
UZB I
P ���
�ailw
ay �f
ficien
cy Im
pro�e
ment
Projec
tUZ
B IP �
�� B�
khara
�Misk
in�Ur
genc
h�Kh
i�a �a
ilway
�lec
trific
ation
Proje
ctUZ
B IP �
�� �le
ctrific
ation
of Pa
p�Na
mang
an�A
ndija
n rail
way s
ectio
nUZ
B IP �
�� Co
nstr�
ction
of el
ectri
fied A
ngren
-Pap
railw
ay lin
e, wi
th ele
ctrific
ation
of
P
ap-K
okan
d-An
dijan
secti
on, w
ith ad
dition
al fin
ancin
g of S
CADA
syste
mUZ
B IP �
�� �a
ilway
�lec
trific
ation
of se
ction
of th
e rail
way K
ashka
darya
�B�k
hara
with
orga
nizati
on of
high
-spee
d pass
enge
r trai
ns
TAJ
IP
UZB
IP
UZB
IP
UZB
IP
UZB
IP
KGZ
IP
UZB
IP
MON
IP
MON
IP
AFG
IP
Infrastructure in Central Asia and the Caucasus 25
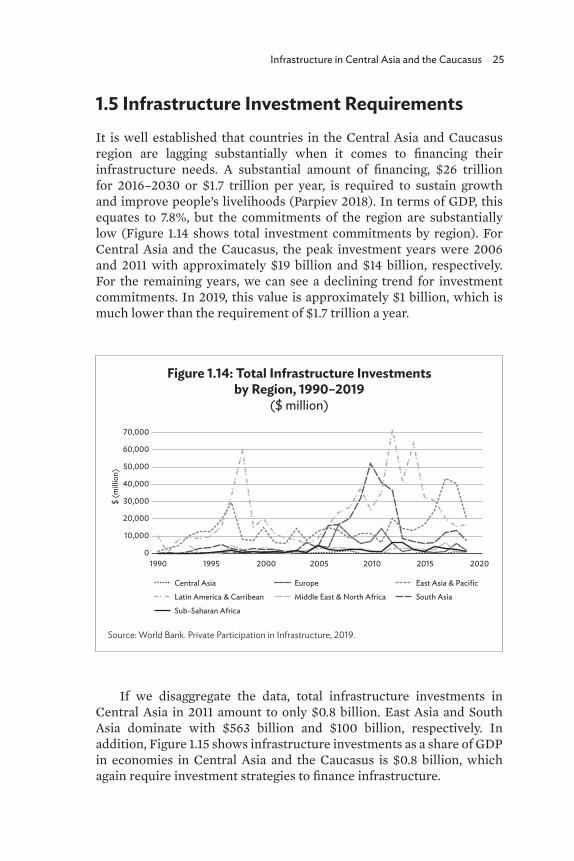
1.5 Infrastructure Investment RequirementsIt is well established that countries in the Central Asia and Caucasus region are lagging substantially when it comes to financing their infrastructure needs. A substantial amount of financing, $26 trillion for 2016–2030 or $1.7 trillion per year, is required to sustain growth and improve people’s livelihoods (Parpiev 2018). In terms of GDP, this equates to 7.8%, but the commitments of the region are substantially low (Figure 1.14 shows total investment commitments by region). For Central Asia and the Caucasus, the peak investment years were 2006 and 2011 with approximately $19 billion and $14 billion, respectively. For the remaining years, we can see a declining trend for investment commitments. In 2019, this value is approximately $1 billion, which is much lower than the requirement of $1.7 trillion a year.
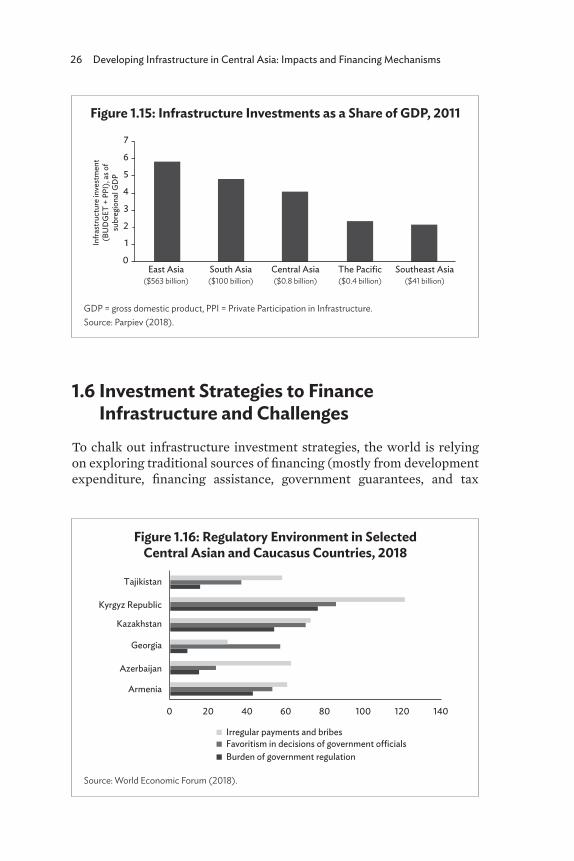
If we disaggregate the data, total infrastructure investments in Central Asia in 2011 amount to only $0.8 billion. East Asia and South Asia dominate with $563 billion and $100 billion, respectively. In addition, Figure 1.15 shows infrastructure investments as a share of GDP in economies in Central Asia and the Caucasus is $0.8 billion, which again require investment strategies to finance infrastructure.
Figure 1.14: Total Infrastructure Investments by Region, 1990–2019
($ million)
Source: World Bank. Private Participation in Infrastructure, 2019.
0
10,000
20,000
30,000
40,000
50,000
60,000
70,000
1990 1995 2000 2005 2010 2015 2020
Central Asia
$ (m
illio
n)
Europe East Asia & Pacific
Latin America & Carribean Middle East & North Africa South Asia
Sub-Saharan Africa
26 Developing Infrastructure in Central Asia: Impacts and Financing Mechanisms
1.6 Investment Strategies to Finance Infrastructure and Challenges
To chalk out infrastructure investment strategies, the world is relying on exploring traditional sources of financing (mostly from development expenditure, financing assistance, government guarantees, and tax
Figure 1.15: Infrastructure Investments as a Share of GDP, 2011
GDP = gross domestic product, PPI = Private Participation in Infrastructure. Source: Parpiev (2018).
East Asia($563 billion)
South Asia($100 billion)
Central Asia($0.8 billion)
The Pacific($0.4 billion)
Southeast Asia($41 billion)
6
7
5
4
3
2
1
0
Infra
stru
ctur
e in
vest
men
t(B
UD
GET
+ P
PI),
as o
fsu
breg
iona
l GD
P
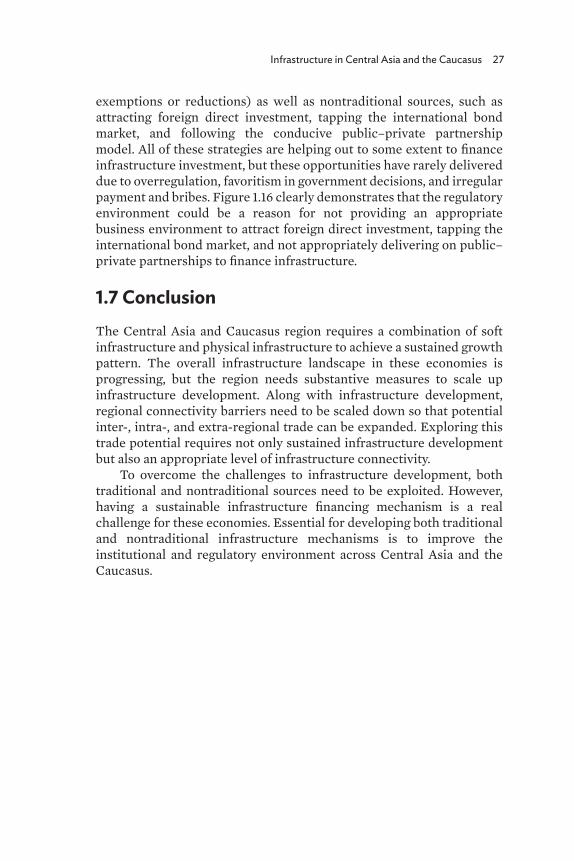
Figure 1.16: Regulatory Environment in Selected Central Asian and Caucasus Countries, 2018
Source: World Economic Forum (2018).
0 20 40 60 80 100 120 140
Armenia
Azerbaijan
Georgia
Kazakhstan
Kyrgyz Republic
Tajikistan
Irregular payments and bribesFavoritism in decisions of government o cialsBurden of government regulation
Infrastructure in Central Asia and the Caucasus 27
exemptions or reductions) as well as nontraditional sources, such as attracting foreign direct investment, tapping the international bond market, and following the conducive public–private partnership model. All of these strategies are helping out to some extent to finance infrastructure investment, but these opportunities have rarely delivered due to overregulation, favoritism in government decisions, and irregular payment and bribes. Figure 1.16 clearly demonstrates that the regulatory environment could be a reason for not providing an appropriate business environment to attract foreign direct investment, tapping the international bond market, and not appropriately delivering on public–private partnerships to finance infrastructure.
1.7 ConclusionThe Central Asia and Caucasus region requires a combination of soft infrastructure and physical infrastructure to achieve a sustained growth pattern. The overall infrastructure landscape in these economies is progressing, but the region needs substantive measures to scale up infrastructure development. Along with infrastructure development, regional connectivity barriers need to be scaled down so that potential inter-, intra-, and extra-regional trade can be expanded. Exploring this trade potential requires not only sustained infrastructure development but also an appropriate level of infrastructure connectivity.
To overcome the challenges to infrastructure development, both traditional and nontraditional sources need to be exploited. However, having a sustainable infrastructure financing mechanism is a real challenge for these economies. Essential for developing both traditional and nontraditional infrastructure mechanisms is to improve the institutional and regulatory environment across Central Asia and the Caucasus.
28 Developing Infrastructure in Central Asia: Impacts and Financing Mechanisms
ReferencesAsian Development Bank (ADB). 2014. CAREC Transport and Trade
Facilitation Strategy 2020. Manila: ADB. ____. 2019. CAREC Corridor Performance Measurement and Monitoring:
Annual Report 2019. Manila: ADB. https://www.carecprogram.org /uploads/carec-cpmm-annual-report-2019.pdf.
Ismail, N.W., and J.M. Mahyideen. 2015. The Impact of Infrastructure on Trade and Economic Growth in Selected Economies in Asia. ADBI Working Paper 553. Tokyo: Asian Development Bank Institute.
Kingcombe, C. 2014. Hard and Soft Infrastructure Development in Africa. Multi-year Expert Meeting on Transport, Trade Logistics and Trade Facilitation. Geneva, 1–3 July. https://unctad.org /system/files/non-official-document/TLB_TF_2014MYEM_D2 _P2_ChristianKingombe2.pdf (accessed 12 March 2019).
Nguyen, C.M. 2016. 6 Challenges to Advancing GMS Economic Corridors. Asian Development Blog, 15 August.
McCartney, M. 2018. The China–Pakistan Economic Corridor (CPEC): Considering Contemporary Pakistan through Old-Fashioned Economics and Historical Case Studies. The Lahore Journal of Economics. 23 (2). pp. 19–48.
Parpiev, Z. 2018. Presentation at the joint CAREC Institute, Beijing National Accounting Institute, and ADB Institute Research Inception Conference. Beijing, People’s Republic of China. 21–22 June.
Samad, G., and M. Zeshan. 2019. Would CPEC Spur Economic Growth? PIDE Research Brief No. 01:2019. https://www.pide.org.pk/pdf /PIDE-Research-Brief-2019.pdf.
World Bank. 2015. World Development Indicators 2015. Washington, DC: World Bank. http://wdi.worldbank.org/table/3.7.
____. 2019. World Development Indicators 2019. Washington, DC.World Economic Forum. 2018. The Global Competitiveness Report 2018.
Geneva: World Economic Forum.____. 2019. The Global Competitiveness Report 2019. Geneva: World
Economic Forum.
29
2Measuring the Impact of Road Infrastructure
on Household Well-Being: Evidence from Azerbaijan
Nurmukhammad Yusupov
2.1 IntroductionRoads are arteries of economic activity. Indeed, roads link economic agents and markets—producers with consumers, workers with employers, students with schools—and therefore play an essential role in any development agenda.1 Thus, expansion of road infrastructure in the form of highways promises to increase wealth and create new opportunities for local businesses and households. Ultimately, it is to generate spillover effects through relocation of businesses, higher incomes of households, and increases in tax revenues for governments, as well as boosting overall economic activity in the affected localities.
Thus, the economic impact of infrastructure is a multidimensional and complex construct. Understanding how the development of transportation infrastructure affects economic development in general has substantial policy implications as such understanding can inform policy making. Capital constraints for infrastructure initiatives are particularly hard for developing economies with thin domestic financial markets. This is especially relevant for transition economies such as Azerbaijan, for which, following the collapse of the Soviet Union, infrastructure development became a pressing issue. In the case of
1 The World Bank, one of the key development agencies in the international arena, lends more for roads than for education, health, and social services combined (Berg, Deichmann, and Selod 2015).
30 Developing Infrastructure in Central Asia: Impacts and Financing Mechanisms
Azerbaijan, about three-quarters of the country’s entire road network was in poor condition in the early years of independence.
In this chapter, we aim to measure the economic impact of road infrastructure in Azerbaijan, particularly in the context of labor market outcomes. To that end, we build a two-wave data set of household and community data based on publicly available official statistical data for the years 2010–2016. Overall results suggest that gaining access to national roads in Azerbaijan has a positive effect on wealth as opposed to the less developed communities excluded from access to national roads.
2.2 Literature Review
2.2.1 Infrastructure and Economic Development
In theory, road improvements, by lowering transportation costs and enhancing mobility, offer a variety of benefits to businesses, including logistical benefits, easier business travel, and organizational improvements, which can be instrumental in boosting productivity. Such improvements in doing business might alter firms’ input choices if transportation is a factor of production (Holl 2006). Higher productivity can, in turn, lead to increases in wages if productivity is capitalized, or decreases in wages if they depend on commuting costs (Gibbons and Machin 2006). Real estate values and landownership are also likely to be affected in response to changes in location-specific advantages. Subsequently, such dynamics in income levels and real estate prices can alter the use of production inputs such as labor. Lower input costs can translate into lower output prices and therefore higher demand. While such effects can be offset—at least partially—by capitalization in commercial rents, overall, they can drive changes in employment levels and labor productivity.
The literature also stipulates a set of “wider economic benefits” of road infrastructure improvements, including the total factor productivity effects stemming from agglomeration economies (Graham 2007). Such effects are rooted in resource sharing, worker–employer matching, and learning through knowledge exchange (Duranton and Puga 2004). Despite being usually linked to spatial effects, such as urbanization or industrial clusters, these impacts can simply be due to higher travel efficiencies in linkages between workers and firms. According to Gibbons and Overman (2009), agglomeration benefits can be seen as shifts in production function reflecting higher amounts produced with a given set of inputs.
Improved transportation capabilities can also impact the spatial allocation of businesses via selection and sorting mechanisms (Baldwin
Measuring the Impact of Road Infrastructure on Household Well-Being: Evidence from Azerbaijan 31
and Okubo 2006). Better road infrastructure may make it easier to start businesses and increase their chances of survival by decreasing operating costs, or enabling increasing returns to scale. At the same time, infrastructure improvements can push low-productivity projects out of business if they had previously been protected from competition by high transportation costs. In the long run, such push factors will also result in aggregate productivity gains (Melitz 2003) and consumer surpluses. Although, in some literature, the role of transportation infrastructure factors into spatial analysis,2 robust theoretical models projecting transportation infrastructure onto spatial economic outcomes are scarce.
The extant theory does not define approaches on how to measure the effects of infrastructure improvements on businesses, in terms of specific metrics as well as causality chains between the dimensions of such metrics, especially in the context of imperfectly competitive markets. The same can be said about the theoretical underpinnings of transportation infrastructure improvement effects on local economic outcomes. The traditional approach to these issues assumes a perfectly competitive world with all economic effects being attributable to travel time savings and induced demand (Small 2007). More recent literature, however, recognizes the incompleteness of such a depiction of reality, both from the academic point of view (Gibbons and Machin 2006; Gibbons and Overman 2009; Venables 2007) and from the perspective of the policy-related community (Eddington 2006). By and large, given the theoretical challenges, the magnitude and direction of the impact that infrastructure improvements have on the economic lives of households and businesses remain mostly an empirical research question (Gibbons and Machin 2006).
Although the body of empirical research on the socioeconomic impact of infrastructure interventions is growing, the literature on specific microeconomic effects remains somewhat thin. Most studies seem to focus on macroeconomic outcomes of transport and infrastructure improvement policies. Straub (2011) provides a well-cited overview of the relevant research literature. Most of these papers use aggregated Cobb-Douglas production functions with infrastructure investments entering the function as a production factor (Garcia-Mila, McGuire, and Porter 1996). Unfortunately, these investigations fail to properly resolve the issues of endogeneity and networks. For the most part, empirical results in these papers seem to be mixed. Focusing on Japan and Thailand, Yoshino and Nakahigashi (2000) used a production
2 See, for example, Combes and Lafoucarde (2001), Puga (2002), Behrens et al. (2004), and Venables (2007).
32 Developing Infrastructure in Central Asia: Impacts and Financing Mechanisms
function approach to estimate the productivity effect of infrastructure development. In their paper, the effect turns out to be greater in tertiary industry than in primary and secondary. The information and telecommunications sectors and the environment sectors produced the largest impact. In line with our previous discussion, the regions with large urban concentrations seem to generate the strongest levels of infrastructure impact.
Nevertheless, recent papers have employed identification strategies to successfully estimate the impact of roads on a set of economic indicators: urban development (Duranton and Turner 2012), suburbanization (Baum-Snow 2007), dynamics of trade (Duranton, Morrow, and Turner 2012), automotive traffic (Duranton and Turner 2011), patterns of commuting (Baum-Snow 2010), and demand for skilled labor (Michaels 2008). Normally, these studies estimate the impact of transport through network links or spatial density indicators. Identification is based on instrumental variables for historical characteristics of networks or strategic development plans, whether those plans are confirmed (Eisner 1994) or contradicted (Harmatuck 1996; Hulten and Schwab 1991). Due to the availability of high-quality data, most of the studies seem to focus on high-income countries, where the issue of infrastructure investments comes up quite regularly in political debates, partly motivated by the case of the United States (Arslanalp et al. 2010).
The body of literature on middle-income countries has grown in recent years; however, the former Soviet countries seem to have avoided research attention, possibly because of the lack of reliable data. There is now growing interest in those economies coupled with their successful growth performance and improved data availability. Literature on the economies in the Central Asia and Caucasus region, however, remains thin.
2.4 Financing through Public–Private Partnerships
One popular approach to financing and implementing infrastructure projects has been through public–private partnerships (PPP). The term was reportedly first used in the United States, in the context of educational programs and utilities sector projects. Toward the end of the 20th century, the PPP approach became popular in the European Union, starting with the United Kingdom (Iossa and Martimort 2015). Under a PPP arrangement, the government typically contracts a private sector partner to develop the project as well as to operate and service it afterward. The partner may have to take on substantial risk and even conduct fundraising from private sources of capital. Its revenue is generated by a combination of payments from the government and end-user fees. In
Measuring the Impact of Road Infrastructure on Household Well-Being: Evidence from Azerbaijan 33
some instances, a PPP contract may entail significant upgrading of the preexisting infrastructure rather than a brand-new construction from scratch. However, acquisition or management of preexisting public infrastructure units by a private sector agent without any significant new capital injections or upgrading would not be considered a PPP. In a similar fashion, the provision of soft infrastructure capabilities by private agents, which involves no major investment in fixed assets (and thus has no private sector capital requirements), would likely be classified as “outsourcing” instead of a PPP. Nevertheless, the boundary between the two lacks precision, as soft services often require hard infrastructure to implement them. Finally, a PPP is not a simple joint-venture project coinvested in by the public and private sectors.
However, the advantages and disadvantages of PPPs remain a complex issue. The main reason for the recent growth of PPPs is rooted in the flexibility they offer in financing without requiring immediate public sector funding, instead allowing the costs to be spread out over a project’s lifetime (Maskin and Tirole 2008). A PPP approach thus enables public sector agencies to resolve their budget constraints on public infrastructure investments stemming from insufficient tax revenues and limited availability of public sector borrowing opportunities. If seed investment in a PPP project is not possible from public funds, this arrangement enables the public agencies to implement investment projects in infrastructure that otherwise would not have been supported at all or could have been delayed. Thus, a typical trade-off for a public sector agent operating with strict budget constraints is between a PPP and no investment at all, not between a PPP and public sector procurement.
Theoretical economists, in opposing the PPP approach, may argue that if public investment increases, private investment gets “crowded out,” and so the net result is the same whether investment is public or private. However, the existing limited evidence fails to provide robust support for that conjecture. Importantly, in general, PPP forms are chosen as supplementary to other forms of investment by the public sector, not as substitutes for them. A range of contractual arrangements can qualify as PPPs, so some types of infrastructure projects are more suitable for a specific type of PPP, while others are not. Some infrastructure projects, such as roads, would not be generally considered for privatization. Thus, the only way of bringing in private sector resources would be via a PPP scheme. For other infrastructure needs, such as water, the literature offers contrasting takes on whether a PPP or a conventional privatization approach is better. In other cases, such as creating mobile phone networks, the conventional view is that licensing to private firms in a competitive way is more appropriate.
34 Developing Infrastructure in Central Asia: Impacts and Financing Mechanisms
On the other hand, financing through private capital for a PPP clearly costs more than public sector finance, as the government creditors are not assuming any significant risk on their loans. However, simply because the funding is coming from the public sector does not mean that the project’s risks are no longer there. Therefore, the public sector agency has to take on risks that constitute a hidden cost, which, along with the lower cost of public capital, makes the overall costs comparable with the costs of PPP financing. At the same time, the public sector can spread out the risks more efficiently than private firms, and so the real cost of public sector funding of a project, even with all risks taken into consideration, is actually lower than the capital and management costs if the project is funded and run by a private sector agent. But quantifying the risk transfer to a PPP is a challenge.
Because a PPP can help accelerate public investments in infrastructure projects, economies of scale can be reached in some cases. In construction, for example, there can be savings in capital cost, or speeding up construction may prevent construction cost inflation. Conversely, a large increase in demand for PPP-based construction works can trigger capacity problems in the local construction sector, and drive up prices, thereby offsetting other benefits that might be obtained from the PPP scheme. For example, schools and hospitals in the United Kingdom, as well as roads in Portugal, both of which have taken on large-scale PPP arrangements, have witnessed a significant growth in construction costs. At the same time, the size and complexity of projects structured in the form of PPPs provide disincentives for bidding from smaller contractors, thus hurting competition, which may negatively affect the economy as a whole. Another economic cost of PPPs comes in the form of asymmetry of information, enabling potential excess profits for a private sector agent supplying inputs, but the long-term nature of a PPP scheme implies that such asymmetries have more time to develop.
Very often, under a PPP scheme the public agency acts as a regulator, and thus concentrates on service planning and performance monitoring. Doing so allows it to avoid overstretching itself by getting involved in the day-to-day operations for service delivery. However, the loss of continuous management control over public facilities gives rise to a set of its own problems. A given sector with a small number of PPP-based projects may create a benchmark against which costs and service delivery for other public sector-run projects in the same industry can be compared. Doing so leads to improvements in services and procurement by the public sector as well. In fact, a few countries (e.g., Norway) have launched PPP initiatives specifically in order to test PPPs against conventional procurement by the public sector rather than for budgetary reasons.
Measuring the Impact of Road Infrastructure on Household Well-Being: Evidence from Azerbaijan 35
On the other hand, a PPP approach may become more complex than a normal public procurement scheme. This complexity entails a longer procurement period, jeopardizing some of the abovementioned advantages. Indeed, costs of procurement via PPP can be as high as 5%–10% of the capital cost for a large project, and may not be lower for smaller projects. Hence, PPPs are not necessarily cost-effective if applied to very small-scale projects, but should be more appropriate for bigger ones, i.e., stable longer-term projects. For example, construction of roads and other transport infrastructure is a good match with the PPP approach. Conversely, projects where the public agency cannot make a credible long-term commitment, or which are dependent on rapidly changing technology solutions, are not the most suitable for PPPs.
Given the focus of PPPs on otherwise publicly delivered services, they often end up as the object of heavy political debate. Absent political stability or commitment or changing political winds, the process is likely to become derailed and jeopardize a PPP’s chances of success. One reason for this is that PPPs may be viewed as a form of privatization, which may give rise to corruption and political opposition. This is especially important if the public finds out that private sector investors are making “windfall” profits, possibly through high initial rates of return on investment, debt refinancing, or sale of their equity holdings. In such circumstances, increasing transparency to avoid political opposition can backfire. For example, the cost of procurement through a PPP, including long-term operation, may be incorrectly disputed by the public in light of the lower initial capital cost for public sector procurement only. Similarly, offering greater transparency of PPPs can make mistakes more obvious. In contrast, claims of substantial cost savings compared to conventional public procurement, often made by the participating public agency, cannot be proved objectively and can be used to score quick political points. It is thus difficult to ensure a balanced and depoliticized debate.
Given the novel nature of PPP arrangements among various agents, the existence of firm legal foundations is important for successful implementation of the projects. Some countries (e.g., Mongolia) are known for quick development of one of the world’s most widely praised legislative frameworks.
2.3 Country Context
2.3.1 Basic Information about Azerbaijan’s Economy
Azerbaijan, which gained its independence from the Soviet Union in August 1991, lies in the eastern South Caucasus region, bordering the Caspian Sea from Grozny to Baku. The economy performed impressively
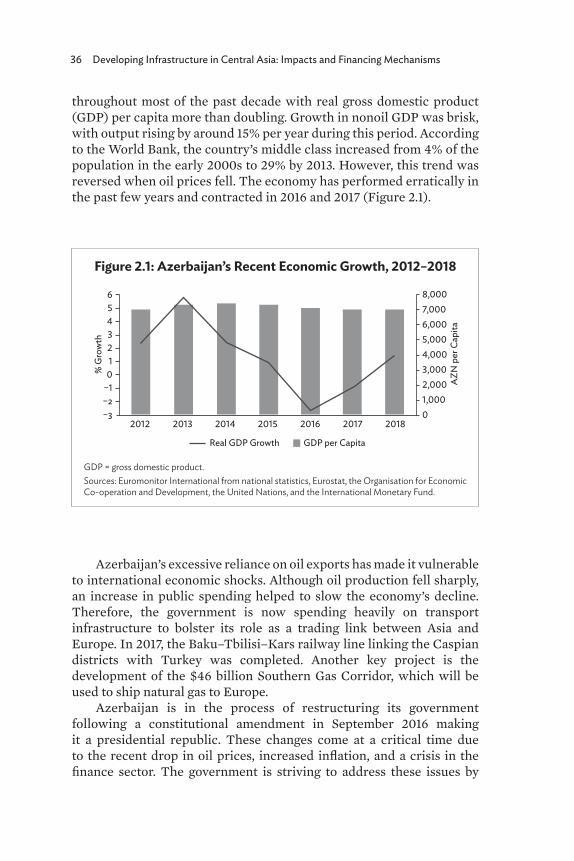
36 Developing Infrastructure in Central Asia: Impacts and Financing Mechanisms
throughout most of the past decade with real gross domestic product (GDP) per capita more than doubling. Growth in nonoil GDP was brisk, with output rising by around 15% per year during this period. According to the World Bank, the country’s middle class increased from 4% of the population in the early 2000s to 29% by 2013. However, this trend was reversed when oil prices fell. The economy has performed erratically in the past few years and contracted in 2016 and 2017 (Figure 2.1).
Azerbaijan’s excessive reliance on oil exports has made it vulnerable to international economic shocks. Although oil production fell sharply, an increase in public spending helped to slow the economy’s decline. Therefore, the government is now spending heavily on transport infrastructure to bolster its role as a trading link between Asia and Europe. In 2017, the Baku–Tbilisi–Kars railway line linking the Caspian districts with Turkey was completed. Another key project is the development of the $46 billion Southern Gas Corridor, which will be used to ship natural gas to Europe.
Azerbaijan is in the process of restructuring its government following a constitutional amendment in September 2016 making it a presidential republic. These changes come at a critical time due to the recent drop in oil prices, increased inflation, and a crisis in the finance sector. The government is striving to address these issues by
Figure 2.1: Azerbaijan’s Recent Economic Growth, 2012–2018
GDP = gross domestic product. Sources: Euromonitor International from national statistics, Eurostat, the Organisation for Economic Co-operation and Development, the United Nations, and the International Monetary Fund.
% G
row
th
AZN
per
Cap
itaGDP per CapitaReal GDP Growth
2012 2013 2014 2015 2016 2017 2018
654321
0–1–2–3
6,0007,0008,000
5,0004,0003,0002,0001,0000
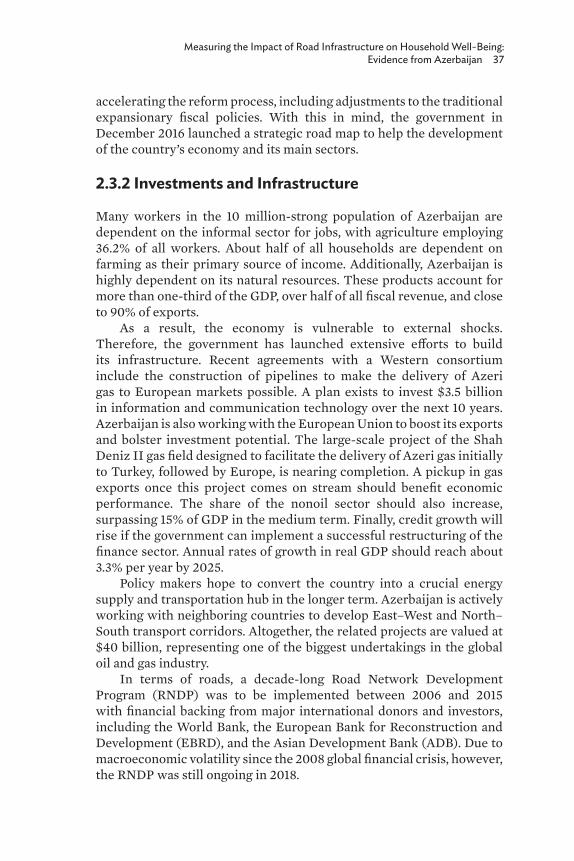
Measuring the Impact of Road Infrastructure on Household Well-Being: Evidence from Azerbaijan 37
accelerating the reform process, including adjustments to the traditional expansionary fiscal policies. With this in mind, the government in December 2016 launched a strategic road map to help the development of the country’s economy and its main sectors.
2.3.2 Investments and Infrastructure
Many workers in the 10 million-strong population of Azerbaijan are dependent on the informal sector for jobs, with agriculture employing 36.2% of all workers. About half of all households are dependent on farming as their primary source of income. Additionally, Azerbaijan is highly dependent on its natural resources. These products account for more than one-third of the GDP, over half of all fiscal revenue, and close to 90% of exports.
As a result, the economy is vulnerable to external shocks. Therefore, the government has launched extensive efforts to build its infrastructure. Recent agreements with a Western consortium include the construction of pipelines to make the delivery of Azeri gas to European markets possible. A plan exists to invest $3.5 billion in information and communication technology over the next 10 years. Azerbaijan is also working with the European Union to boost its exports and bolster investment potential. The large-scale project of the Shah Deniz II gas field designed to facilitate the delivery of Azeri gas initially to Turkey, followed by Europe, is nearing completion. A pickup in gas exports once this project comes on stream should benefit economic performance. The share of the nonoil sector should also increase, surpassing 15% of GDP in the medium term. Finally, credit growth will rise if the government can implement a successful restructuring of the finance sector. Annual rates of growth in real GDP should reach about 3.3% per year by 2025.
Policy makers hope to convert the country into a crucial energy supply and transportation hub in the longer term. Azerbaijan is actively working with neighboring countries to develop East–West and North–South transport corridors. Altogether, the related projects are valued at $40 billion, representing one of the biggest undertakings in the global oil and gas industry.
In terms of roads, a decade-long Road Network Development Program (RNDP) was to be implemented between 2006 and 2015 with financial backing from major international donors and investors, including the World Bank, the European Bank for Reconstruction and Development (EBRD), and the Asian Development Bank (ADB). Due to macroeconomic volatility since the 2008 global financial crisis, however, the RNDP was still ongoing in 2018.
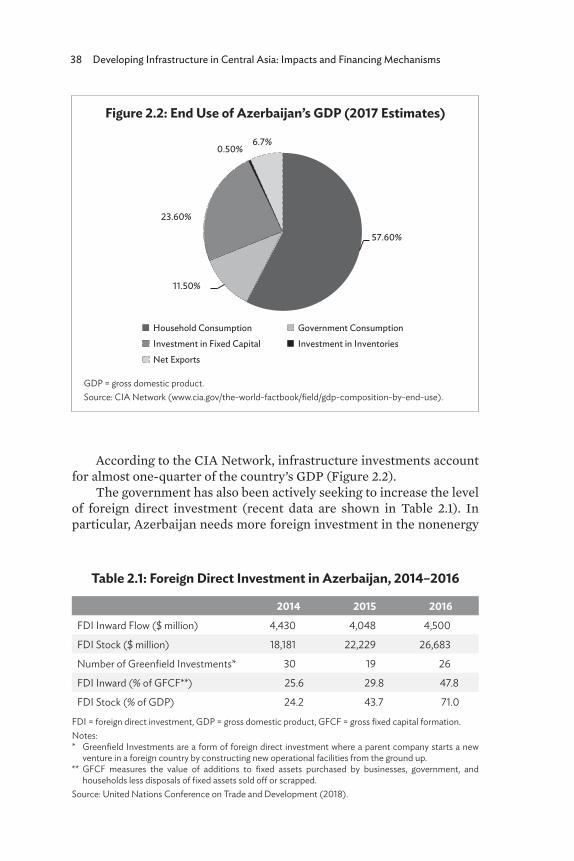
38 Developing Infrastructure in Central Asia: Impacts and Financing Mechanisms
According to the CIA Network, infrastructure investments account for almost one-quarter of the country’s GDP (Figure 2.2).
The government has also been actively seeking to increase the level of foreign direct investment (recent data are shown in Table 2.1). In particular, Azerbaijan needs more foreign investment in the nonenergy
Figure 2.2: End Use of Azerbaijan’s GDP (2017 Estimates)
GDP = gross domestic product. Source: CIA Network (www.cia.gov/the-world-factbook/field/gdp-composition-by-end-use).
57.60%
11.50%
23.60%
0.50%6.7%
Household Consumption Government ConsumptionInvestment in Fixed Capital Investment in InventoriesNet Exports
Table 2.1: Foreign Direct Investment in Azerbaijan, 2014–2016
2014 2015 2016FDI Inward Flow ($ million) 4,430 4,048 4,500
FDI Stock ($ million) 18,181 22,229 26,683
Number of Greenfield Investments* 30 19 26
FDI Inward (% of GFCF**) 25.6 29.8 47.8
FDI Stock (% of GDP) 24.2 43.7 71.0
FDI = foreign direct investment, GDP = gross domestic product, GFCF = gross fixed capital formation. Notes: * Greenfield Investments are a form of foreign direct investment where a parent company starts a new
venture in a foreign country by constructing new operational facilities from the ground up. ** GFCF measures the value of additions to fixed assets purchased by businesses, government, and
households less disposals of fixed assets sold off or scrapped.Source: United Nations Conference on Trade and Development (2018).
Measuring the Impact of Road Infrastructure on Household Well-Being: Evidence from Azerbaijan 39
sector. The country is seeking access to new markets for exports other than oil and gas, mainly for its agricultural producers. For example, some of their efforts have resulted in agreements with Gulf Cooperation Council member countries, the United States, and others. Azerbaijan is also investing in improvements to Baku airport as well as to the Caspian Sea port of Alat, which will be used as a regional logistics and transportation hub. In October 2017, the long-awaited Baku–Tbilisi–Kars railway, connecting the Azerbaijani capital to Kars in northeastern Turkey, began operating on a limited scale.
There is no clear-cut definition of a PPP, although a conventional approach is to define it as a business venture that is operated and financed by a partnership between a private company and a government agency. This arrangement does not fit the traditional public investment model, where the government designs and finances an asset, while construction is outsourced to a private sector agent. Under a PPP, the common forms of contractual agreements include the following:
• Build–operate–transfer (BOT): The private firm builds the infrastructure or facility, operates it during the contractual term, generating revenue and recovering investment costs, and eventually transfers the project to the public agency.
• Design–build: The private firm both designs and builds the infrastructure or facility.
• Design–build–finance–maintain–operate: The private firm is tasked with designing, building, financing, and operating an asset, eventually leasing it (for a long term) back to the government.
2.3.3 Government Spending on Infrastructure between 2008 and 2016
Spending on investments from the state budget in 2008–2016, the period covered by this study, was volatile, largely due to price fluctuations in the oil and/or energy out of the State Oil Fund markets (Figure 2.3). In 2016, an additional AZN3,021.3 million was projected to be spent on infrastructure projects.
Up to 2016, there had been no legal foundations for the growth of PPP operations to support any PPP-based development. The first domestic legislation specifically governing the legal aspects of project financing seems to be the 2016 law on BOT projects (Niftaliyev 2019). According to the law, the BOT model allows recovery of an investor’s costs through the sale of goods and services by the investor to customers and designated executive bodies. Nevertheless, a PPP model could bring a lot of benefits to infrastructure development, and projects with PPP-like features had been governed by more generic legislation such as the
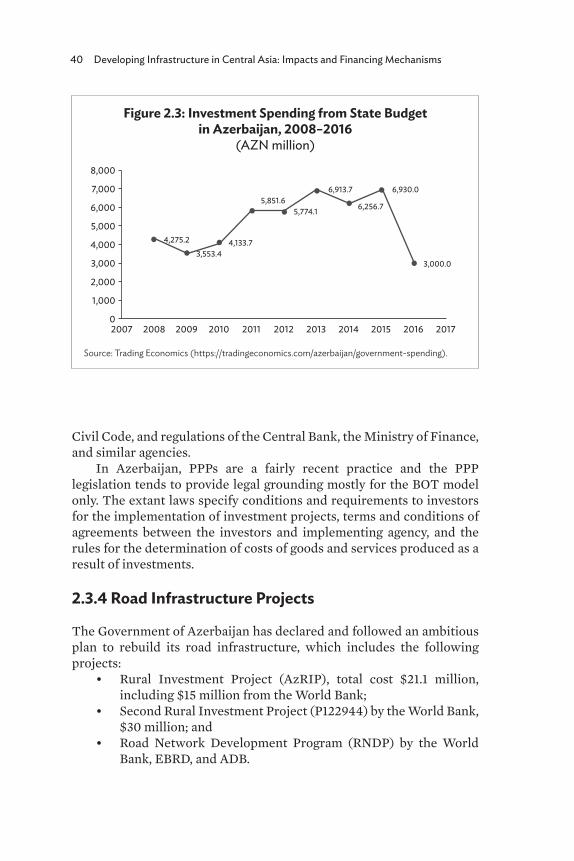
40 Developing Infrastructure in Central Asia: Impacts and Financing Mechanisms
Civil Code, and regulations of the Central Bank, the Ministry of Finance, and similar agencies.
In Azerbaijan, PPPs are a fairly recent practice and the PPP legislation tends to provide legal grounding mostly for the BOT model only. The extant laws specify conditions and requirements to investors for the implementation of investment projects, terms and conditions of agreements between the investors and implementing agency, and the rules for the determination of costs of goods and services produced as a result of investments.
2.3.4 Road Infrastructure Projects
The Government of Azerbaijan has declared and followed an ambitious plan to rebuild its road infrastructure, which includes the following projects:
• Rural Investment Project (AzRIP), total cost $21.1 million, including $15 million from the World Bank;
• Second Rural Investment Project (P122944) by the World Bank, $30 million; and
• Road Network Development Program (RNDP) by the World Bank, EBRD, and ADB.
Figure 2.3: Investment Spending from State Budget in Azerbaijan, 2008–2016
(AZN million)
Source: Trading Economics (https://tradingeconomics.com/azerbaijan/government-spending).
2007
4,275.2
3,553.44,133.7
5,851.65,774.1 6,256.7
6,913.7 6,930.0
3,000.0
2008 2009 2010 2011 2012 2013 2014 2015 2016 2017
6,000
7,000
8,000
5,000
4,000
3,000
2,000
1,000
0

Measuring the Impact of Road Infrastructure on Household Well-Being: Evidence from Azerbaijan 41
The centerpiece of Azerbaijan’s road network is two major highways, both about 500 kilometers (km) in length, originally built during the time of the Soviet Union but significantly improved and upgraded since then, including with the financial support of international development banks:
(1) East–West highway, connecting the capital, Baku, with the Georgian border; and
(2) North–South highway running from the Russian Federation border to the Iranian border via Baku.
The total length of public roads in Azerbaijan, including secondary and local roads, is about 25,000 km, with a road density of about 288 km per 1,000 square kilometers. The road network provides connection to all the administrative centers and transportation hubs (airports, seaports, railway stations, etc.).
The transport industry constitutes a significant share of the economy, accounting for 6% of the GDP. Roads are the dominant mode of freight and passenger transport, with services being offered by private operators only.3 Azerbaijan’s transport sector contributes heavily to regional trade, owing to the country’s important geographical position with roads connecting the Black and Caspian seas, linking the Russian Federation to Georgia, Turkey, and Iran.
The development of transport infrastructure is one of the government’s key tasks in order to sustain GDP growth and promote trade with neighboring countries. The poor condition of the national road network poses a challenge. Some 56% of the main road network is in poor condition and urgently needs repair. The East–West corridor (Baku–Ganja–Georgian border through Alyat and a more direct route through Shamakhi) and the North–South corridor (Russian Federation border–Baku–Alyat–Iranian border) are crucial to addressing the transport barriers to national development and poverty reduction.
In this context, the government has been actively pursuing infrastructure projects with significant road infrastructure improvement components:
• Rural Investment Project (AzRIP) This project was designed as an investment project to support
community-based infrastructure development in the country’s five economic regions, with a view to improving the living
3 That includes individuals, or sole entrepreneurs, offering transportation services.
42 Developing Infrastructure in Central Asia: Impacts and Financing Mechanisms
standards in the target communities by expanding their access to infrastructure services. One of its three components is building and/or repairing roads, footbridges, health clinics, electrical resources, schools, potable water resources, and drainage and irrigation systems. This project was launched in January 2005. About 70% of its $47.1 million cost was allocated to the infrastructure component.
• Second Rural Investment Project (AzRIP-2) The objective of this project, launched in early 2013, was to
improve the accessibility and usability of community-driven rural infrastructure initiatives and foster economic activities for households in rural areas. Two of its three components were focused on rural infrastructure, either by funding local infrastructure projects or through technical assistance. Examples of basic public infrastructure supported by the projects included rural roads, potable water, drainage and tertiary irrigation, etc. The cost of the project was $30 million.
• Road Network Development Program (RNDP) Originally intended to be implemented between 2006 and
2015, with an overall budget of $3.4 billion, this initiative was aimed at upgrading and rehabilitating the road system as well as reforming the road management and operation methods. The ultimate goal is to create a modern road network that can facilitate safe, efficient, and sustainable transportation services, leading to more general economic and social development.
• Azerbaijan Highway 3 Additional Financing (AF) The objective of the AF for Highway 3 was “to contribute to a
more efficient and safer Baku–Shamakhi road and higher-quality road services as part of the upgrading to motorway standards, and to improve the management of the nascent motorway network.” This project, with a total budget of $155.5 million, was to be implemented between 2016 and 2019. The AF will also support the modernization of motorway management and maintenance through financing technical assistance and one-time capital investment for the establishment of regional motorway maintenance units.
Measuring the Impact of Road Infrastructure on Household Well-Being: Evidence from Azerbaijan 43
2.4 Empirical Analysis
2.4.1 Choice of Infrastructure Project and Available Data
In this chapter, we will focus on road construction projects. Azerbaijan’s road network includes, in addition to local as well as secondary roads, two main highways: (i) the East–West highway connecting the capital city of Baku to the Georgian border; and (ii) the North–South highway providing connection between the Russian Federation border and the Iranian border via the city of Baku. The roughly 500 km long East–West highway is one of Azerbaijan’s main transport links to the western region and for external trade. The network was developed primarily before the country gained independence, when the traffic volume was much higher. The shortage of resources needed for maintenance and vehicle axle overloading put about 75% of the entire network of Azerbaijan’s roads in poor condition. Although changes in macroeconomic environments leading to unprecedented increases in prices for fuel, key road construction materials, and utilities significantly increased the construction costs, the RNDP was still ongoing in 2018, while a number of important road construction projects have already been implemented. For example, most of the East–West highway, linking Azerbaijan with the Georgian border, has been improved.
This chapter aims to assess the impact of the completed road construction projects on labor market opportunities (i.e., job creation) in Azerbaijan over the decade spanning from 2006 to 2016, as well as to assess the implication for public financing.
However, access to reliable data seems to be an issue in modern Azerbaijan. Specifically, we used public online sources to put together a database for our empirical analysis. Unfortunately, as will be seen, the resulting estimations fail to produce statistical significance, while where the results are significant, they suggest an opposite effect to what is expected.
2.4.2 Methods and Data
To estimate the effects of road infrastructure on perceived household wealth, we shall use the Life in Transition Survey (LITS) between 2006 and 2016 across about 30 transition countries, including Azerbaijan. A benefit of LITS is that it covers a nationally representative sample of households within each country. Specifically, we are interested in the effect of gained access to national roads on income and/or wealth proxies. For the latter, we shall resort to two metrics: perceptions of the rental value of housing and the relative wealth of the household.
44 Developing Infrastructure in Central Asia: Impacts and Financing Mechanisms
LITS is a combined household and attitudinal survey, focusing on transition countries, that collects information on the socioeconomic status of respondents and includes perception-based questions on economic, political, and social topics. The first round of LITS (LITS I) was conducted in 27 countries in 2006, the second round (LITS II) in 35 countries in 2010, and the third round (LITS III) between the end of 2015 and the beginning of 2016 in 34 countries. The second and third waves also included developed comparator countries. All three rounds were implemented by the EBRD in collaboration with the World Bank. The third wave also received collaboration from Transparency International. The first two waves included 1,000 households, while the third wave targeted 1,500 households per country.
The number of households with successfully completed interviews and respondents differs by country. In Azerbaijan, the number of observations in the third wave was 1,510, with a male-to-female ratio of 40:60, and almost 80% of the respondents were aged 25 to 64 years. The interviews were conducted with the household head or a knowledgeable member to glean information on household roster, members’ gender, age, and relationship to the head, as well as questions on assets, incomes, and expenses. Parts of the survey are administered to the adult member of the household with the most recent birthday. Collected information covers a range of topics, including employment history, type of establishment where they work, duration of their employment, current occupation, etc. Overall, the data generated by LITS are of high quality and have been used in numerous academic papers.
Data on road infrastructure projects are available in public sources, such as the website of the Central Asia Regional Economic Cooperation (CAREC) program.4 Such data normally enable identification of communities, districts (rayons), or municipalities (bələdiyyəsi)5 that gained access to roads, and hence qualify as treatment communities, and those that did not gain access, and are hence viewed as control communities. We have collected such data and merged them with LITS. However, due to inconsistency in spelling as well as the sampling choice of localities, our approach yields a very small number of communities in the first round of LITS that match the publicly available data. Therefore, all of our analysis is based on the two final waves of LITS coupled with official district-level data from the Azerbaijan Statistical Agency.
4 See CAREC Projects Lists webpage at https://www.carecprogram.org/?page _id=1726.
5 Azerbaijan has 10 regions, including an autonomous republic, and 59 districts, which contain municipalities as smaller administrative units.
Measuring the Impact of Road Infrastructure on Household Well-Being: Evidence from Azerbaijan 45
The data on access to roads, our treatment variable, were created by visually overlapping the map of roads from the RNDP with the administrative map of Azerbaijan. The data we have collected allow us to estimate the effect of the treatment via new roads using an approach similar to the difference-in-differences estimation employed by Yoshino and Abidhadjaev (2017). However, our data set is not longitudinal because LITS is not a panel survey. One way to build a panel would be to aggregate household-level responses at the community level, but that would lead to a very small sample size. Therefore, we continue our analysis with a repeated cross-section. To estimate the effects of road construction projects, we set out to exploit the close proximity of respondents’ locality to the roads for impact assessment.
For an empirical estimation, we employ the following strategy, which is a popular approach for causality detection in social sciences. Specifically, we estimate a model with the following form:
𝑦𝑦𝑗𝑗𝑗𝑗 = 𝛽𝛽0 + 𝛽𝛽1 ∗ 𝑆𝑆𝑗𝑗 + 𝛽𝛽2 ∗ 𝑟𝑟𝑖𝑖 + 𝛽𝛽3 ∗ 𝑆𝑆𝑗𝑗 ∗ 𝑟𝑟𝑖𝑖 + ∑𝛾𝛾𝑚𝑚 ∗ 𝑥𝑥𝑖𝑖𝑗𝑗 + ∑𝛿𝛿𝑚𝑚 ∗ 𝑧𝑧𝑗𝑗𝑗𝑗 + 𝜀𝜀𝑗𝑗𝑗𝑗.
The treatment effect in such a model can be captured via st
*rt, an interaction term between time, st, and treatment group, ri, dummy variables in a regression model. Here subscript i denotes community i’s aggregate respondent information and j implies household j. Newly gained access to roads between the two waves (the treatment variable) in community i is given by ri. The set of controls pertaining to community i at time t is given by xit, and zjt is the vector household-level characteristics. Since we are only using two waves, time or survey wave t denotes fixed effects represented by a binary variable. Descriptive statistics of the sample are given in Table 2.2.
Whether a respondent has been exposed to the road proximity, r, amounts to an indicator of whether or not a road has been built to his or her community. All such communities in our data turn out to be located in the central northern part of the country.6 Therefore, to avoid possible contamination of our data by outlier communities, we exclude the districts of Lenkeran, Yardimli, Masalli, Bilesuvar, and Balaken from our data. The first four are the southernmost areas covered by our data set, and the last is the northernmost district, located at the end of the peninsula-like extension separated by two other districts from the main core of the country’s territory.
6 One possible explanation we have for this is that LITS, from which we obtain the household-level characteristics, was not administered equally throughout the country.
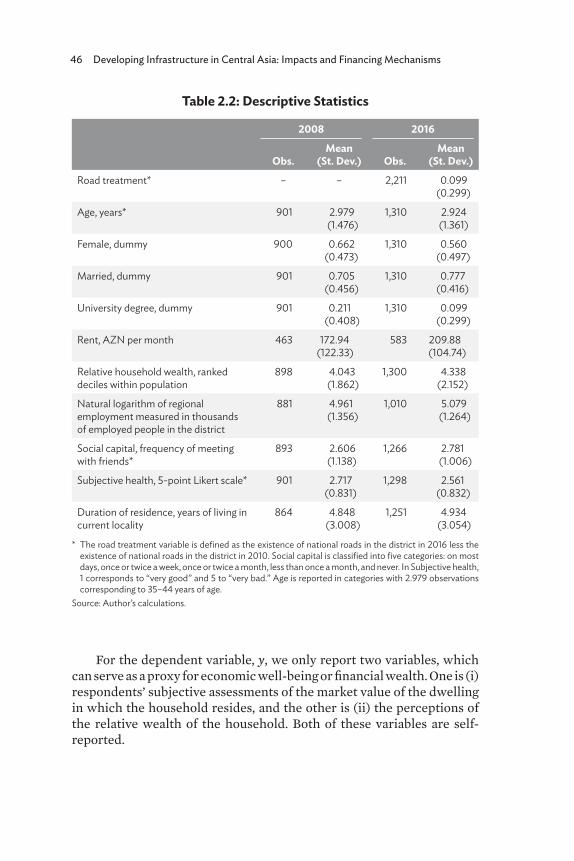
46 Developing Infrastructure in Central Asia: Impacts and Financing Mechanisms
For the dependent variable, y, we only report two variables, which can serve as a proxy for economic well-being or financial wealth. One is (i) respondents’ subjective assessments of the market value of the dwelling in which the household resides, and the other is (ii) the perceptions of the relative wealth of the household. Both of these variables are self-reported.
Table 2.2: Descriptive Statistics
2008 2016
Obs.Mean
(St. Dev.) Obs.Mean
(St. Dev.)Road treatment* – – 2,211 0.099
(0.299)
Age, years* 901 2.979(1.476)
1,310 2.924(1.361)
Female, dummy 900 0.662(0.473)
1,310 0.560(0.497)
Married, dummy 901 0.705(0.456)
1,310 0.777(0.416)
University degree, dummy 901 0.211(0.408)
1,310 0.099(0.299)
Rent, AZN per month 463 172.94(122.33)
583 209.88(104.74)
Relative household wealth, ranked deciles within population
898 4.043(1.862)
1,300 4.338(2.152)
Natural logarithm of regional employment measured in thousands of employed people in the district
881 4.961(1.356)
1,010 5.079(1.264)
Social capital, frequency of meeting with friends*
893 2.606(1.138)
1,266 2.781(1.006)
Subjective health, 5-point Likert scale* 901 2.717(0.831)
1,298 2.561(0.832)
Duration of residence, years of living in current locality
864 4.848(3.008)
1,251 4.934(3.054)
* The road treatment variable is defined as the existence of national roads in the district in 2016 less the existence of national roads in the district in 2010. Social capital is classified into five categories: on most days, once or twice a week, once or twice a month, less than once a month, and never. In Subjective health, 1 corresponds to “very good” and 5 to “very bad.” Age is reported in categories with 2.979 observations corresponding to 35–44 years of age.
Source: Author’s calculations.
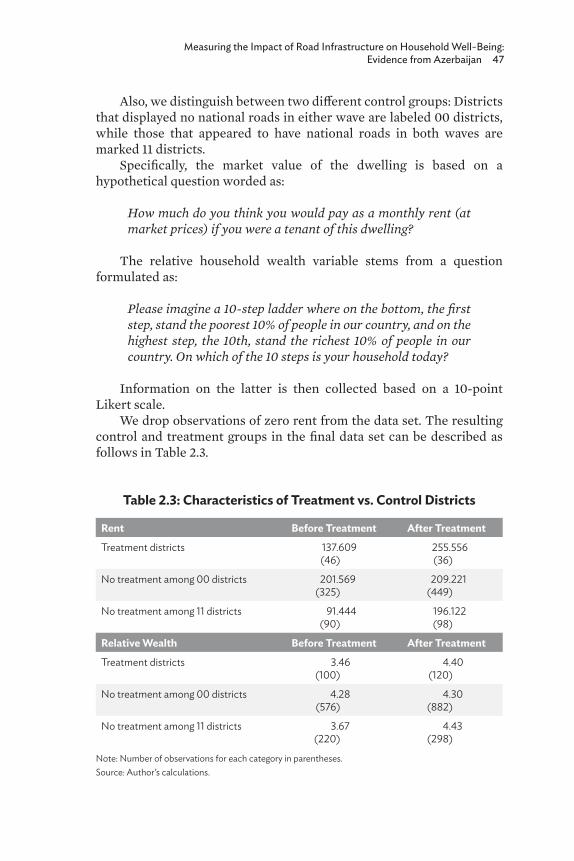
Measuring the Impact of Road Infrastructure on Household Well-Being: Evidence from Azerbaijan 47
Also, we distinguish between two different control groups: Districts that displayed no national roads in either wave are labeled 00 districts, while those that appeared to have national roads in both waves are marked 11 districts.
Specifically, the market value of the dwelling is based on a hypothetical question worded as:
How much do you think you would pay as a monthly rent (at market prices) if you were a tenant of this dwelling?
The relative household wealth variable stems from a question formulated as:
Please imagine a 10-step ladder where on the bottom, the first step, stand the poorest 10% of people in our country, and on the highest step, the 10th, stand the richest 10% of people in our country. On which of the 10 steps is your household today?
Information on the latter is then collected based on a 10-point Likert scale.
We drop observations of zero rent from the data set. The resulting control and treatment groups in the final data set can be described as follows in Table 2.3.
Table 2.3: Characteristics of Treatment vs. Control Districts
Rent Before Treatment After TreatmentTreatment districts 137.609
(46)255.556(36)
No treatment among 00 districts 201.569(325)
209.221(449)
No treatment among 11 districts 91.444(90)
196.122(98)
Relative Wealth Before Treatment After TreatmentTreatment districts 3.46
(100)4.40
(120)
No treatment among 00 districts 4.28(576)
4.30(882)
No treatment among 11 districts 3.67(220)
4.43(298)
Note: Number of observations for each category in parentheses.Source: Author’s calculations.
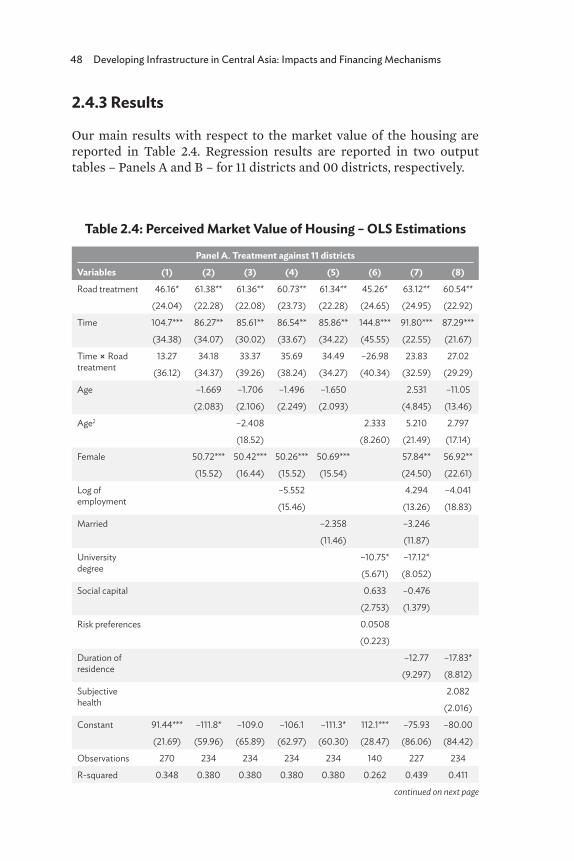
48 Developing Infrastructure in Central Asia: Impacts and Financing Mechanisms
2.4.3 Results
Our main results with respect to the market value of the housing are reported in Table 2.4. Regression results are reported in two output tables – Panels A and B – for 11 districts and 00 districts, respectively.
Table 2.4: Perceived Market Value of Housing – OLS Estimations
Panel A. Treatment against 11 districtsVariables (1) (2) (3) (4) (5) (6) (7) (8)Road treatment 46.16* 61.38** 61.36** 60.73** 61.34** 45.26* 63.12** 60.54**
(24.04) (22.28) (22.08) (23.73) (22.28) (24.65) (24.95) (22.92)
Time 104.7*** 86.27** 85.61** 86.54** 85.86** 144.8*** 91.80*** 87.29***
(34.38) (34.07) (30.02) (33.67) (34.22) (45.55) (22.55) (21.67)
Time ⨯ Road treatment
13.27 34.18 33.37 35.69 34.49 –26.98 23.83 27.02
(36.12) (34.37) (39.26) (38.24) (34.27) (40.34) (32.59) (29.29)
Age –1.669 –1.706 –1.496 –1.650 2.531 –11.05
(2.083) (2.106) (2.249) (2.093) (4.845) (13.46)
Age2 –2.408 2.333 5.210 2.797
(18.52) (8.260) (21.49) (17.14)
Female 50.72*** 50.42*** 50.26*** 50.69*** 57.84** 56.92**
(15.52) (16.44) (15.52) (15.54) (24.50) (22.61)
Log of employment
–5.552 4.294 –4.041
(15.46) (13.26) (18.83)
Married –2.358 –3.246
(11.46) (11.87)
University degree
–10.75* –17.12*
(5.671) (8.052)
Social capital 0.633 –0.476
(2.753) (1.379)
Risk preferences 0.0508
(0.223)
Duration of residence
–12.77 –17.83*
(9.297) (8.812)
Subjective health
2.082
(2.016)
Constant 91.44*** –111.8* –109.0 –106.1 –111.3* 112.1*** –75.93 –80.00
(21.69) (59.96) (65.89) (62.97) (60.30) (28.47) (86.06) (84.42)
Observations 270 234 234 234 234 140 227 234
R-squared 0.348 0.380 0.380 0.380 0.380 0.262 0.439 0.411
continued on next page
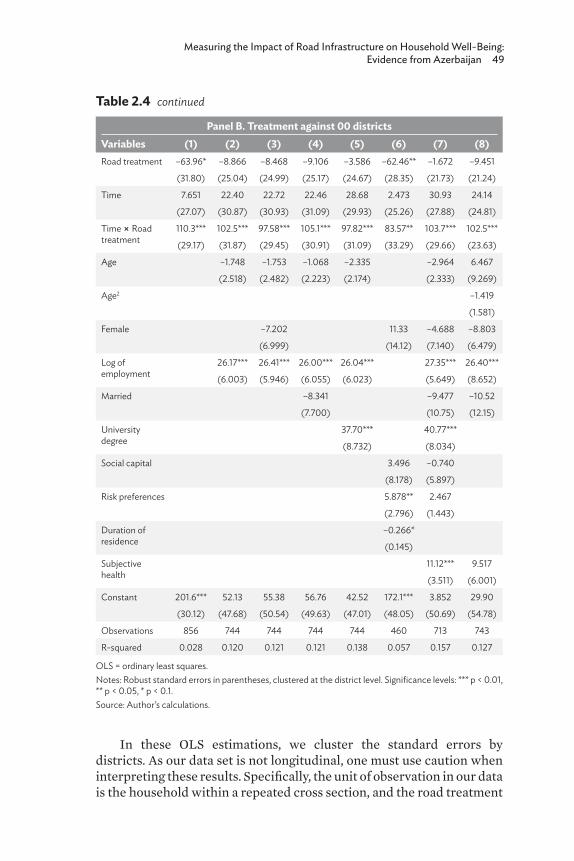
Measuring the Impact of Road Infrastructure on Household Well-Being: Evidence from Azerbaijan 49
Panel B. Treatment against 00 districtsVariables (1) (2) (3) (4) (5) (6) (7) (8)Road treatment –63.96* –8.866 –8.468 –9.106 –3.586 –62.46** –1.672 –9.451
(31.80) (25.04) (24.99) (25.17) (24.67) (28.35) (21.73) (21.24)
Time 7.651 22.40 22.72 22.46 28.68 2.473 30.93 24.14
(27.07) (30.87) (30.93) (31.09) (29.93) (25.26) (27.88) (24.81)
Time ⨯ Road treatment
110.3*** 102.5*** 97.58*** 105.1*** 97.82*** 83.57** 103.7*** 102.5***
(29.17) (31.87) (29.45) (30.91) (31.09) (33.29) (29.66) (23.63)
Age –1.748 –1.753 –1.068 –2.335 –2.964 6.467
(2.518) (2.482) (2.223) (2.174) (2.333) (9.269)
Age2 –1.419
(1.581)
Female –7.202 11.33 –4.688 –8.803
(6.999) (14.12) (7.140) (6.479)
Log of employment
26.17*** 26.41*** 26.00*** 26.04*** 27.35*** 26.40***
(6.003) (5.946) (6.055) (6.023) (5.649) (8.652)
Married –8.341 –9.477 –10.52
(7.700) (10.75) (12.15)
University degree
37.70*** 40.77***
(8.732) (8.034)
Social capital 3.496 –0.740
(8.178) (5.897)
Risk preferences 5.878** 2.467
(2.796) (1.443)
Duration of residence
–0.266*
(0.145)
Subjective health
11.12*** 9.517
(3.511) (6.001)
Constant 201.6*** 52.13 55.38 56.76 42.52 172.1*** 3.852 29.90
(30.12) (47.68) (50.54) (49.63) (47.01) (48.05) (50.69) (54.78)
Observations 856 744 744 744 744 460 713 743
R-squared 0.028 0.120 0.121 0.121 0.138 0.057 0.157 0.127
OLS = ordinary least squares. Notes: Robust standard errors in parentheses, clustered at the district level. Significance levels: *** p < 0.01, ** p < 0.05, * p < 0.1.Source: Author’s calculations.
Table 2.4 continued
In these OLS estimations, we cluster the standard errors by districts. As our data set is not longitudinal, one must use caution when interpreting these results. Specifically, the unit of observation in our data is the household within a repeated cross section, and the road treatment
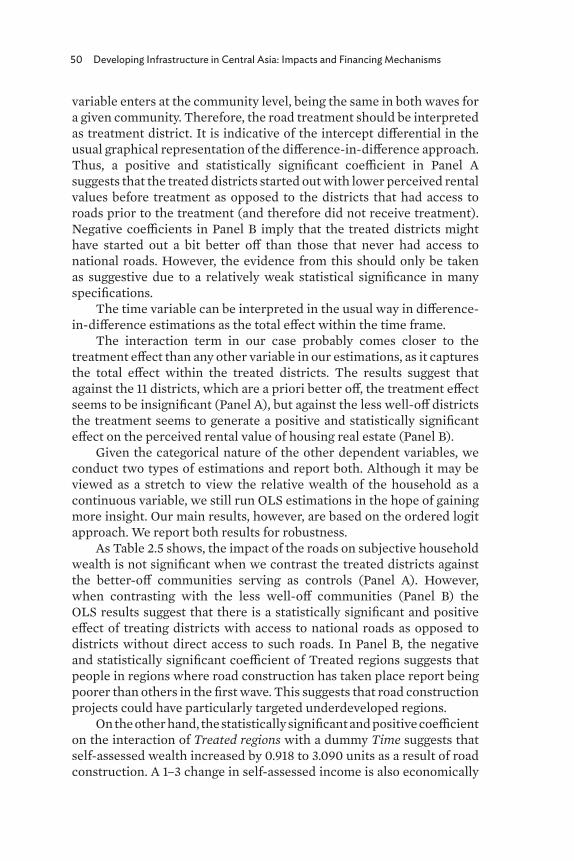
50 Developing Infrastructure in Central Asia: Impacts and Financing Mechanisms
variable enters at the community level, being the same in both waves for a given community. Therefore, the road treatment should be interpreted as treatment district. It is indicative of the intercept differential in the usual graphical representation of the difference-in-difference approach. Thus, a positive and statistically significant coefficient in Panel A suggests that the treated districts started out with lower perceived rental values before treatment as opposed to the districts that had access to roads prior to the treatment (and therefore did not receive treatment). Negative coefficients in Panel B imply that the treated districts might have started out a bit better off than those that never had access to national roads. However, the evidence from this should only be taken as suggestive due to a relatively weak statistical significance in many specifications.
The time variable can be interpreted in the usual way in difference-in-difference estimations as the total effect within the time frame.
The interaction term in our case probably comes closer to the treatment effect than any other variable in our estimations, as it captures the total effect within the treated districts. The results suggest that against the 11 districts, which are a priori better off, the treatment effect seems to be insignificant (Panel A), but against the less well-off districts the treatment seems to generate a positive and statistically significant effect on the perceived rental value of housing real estate (Panel B).
Given the categorical nature of the other dependent variables, we conduct two types of estimations and report both. Although it may be viewed as a stretch to view the relative wealth of the household as a continuous variable, we still run OLS estimations in the hope of gaining more insight. Our main results, however, are based on the ordered logit approach. We report both results for robustness.
As Table 2.5 shows, the impact of the roads on subjective household wealth is not significant when we contrast the treated districts against the better-off communities serving as controls (Panel A). However, when contrasting with the less well-off communities (Panel B) the OLS results suggest that there is a statistically significant and positive effect of treating districts with access to national roads as opposed to districts without direct access to such roads. In Panel B, the negative and statistically significant coefficient of Treated regions suggests that people in regions where road construction has taken place report being poorer than others in the first wave. This suggests that road construction projects could have particularly targeted underdeveloped regions.
On the other hand, the statistically significant and positive coefficient on the interaction of Treated regions with a dummy Time suggests that self-assessed wealth increased by 0.918 to 3.090 units as a result of road construction. A 1–3 change in self-assessed income is also economically
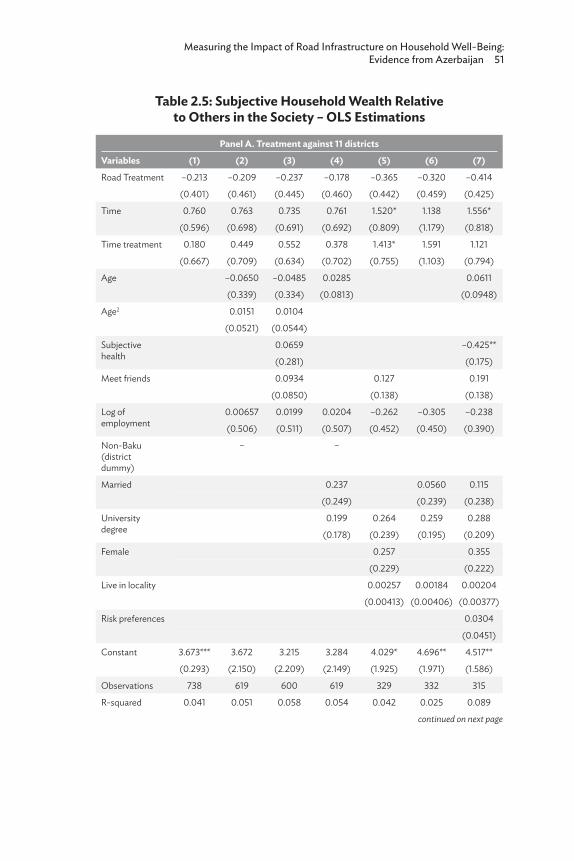
Measuring the Impact of Road Infrastructure on Household Well-Being: Evidence from Azerbaijan 51
continued on next page
Table 2.5: Subjective Household Wealth Relative to Others in the Society – OLS Estimations
Panel A. Treatment against 11 districtsVariables (1) (2) (3) (4) (5) (6) (7)Road Treatment –0.213 –0.209 –0.237 –0.178 –0.365 –0.320 –0.414
(0.401) (0.461) (0.445) (0.460) (0.442) (0.459) (0.425)
Time 0.760 0.763 0.735 0.761 1.520* 1.138 1.556*
(0.596) (0.698) (0.691) (0.692) (0.809) (1.179) (0.818)
Time treatment 0.180 0.449 0.552 0.378 1.413* 1.591 1.121
(0.667) (0.709) (0.634) (0.702) (0.755) (1.103) (0.794)
Age –0.0650 –0.0485 0.0285 0.0611
(0.339) (0.334) (0.0813) (0.0948)
Age2 0.0151 0.0104
(0.0521) (0.0544)
Subjective health
0.0659 –0.425**
(0.281) (0.175)
Meet friends 0.0934 0.127 0.191
(0.0850) (0.138) (0.138)
Log of employment
0.00657 0.0199 0.0204 –0.262 –0.305 –0.238
(0.506) (0.511) (0.507) (0.452) (0.450) (0.390)
Non-Baku (district dummy)
– –
Married 0.237 0.0560 0.115
(0.249) (0.239) (0.238)
University degree
0.199 0.264 0.259 0.288
(0.178) (0.239) (0.195) (0.209)
Female 0.257 0.355
(0.229) (0.222)
Live in locality 0.00257 0.00184 0.00204
(0.00413) (0.00406) (0.00377)
Risk preferences 0.0304
(0.0451)
Constant 3.673*** 3.672 3.215 3.284 4.029* 4.696** 4.517**
(0.293) (2.150) (2.209) (2.149) (1.925) (1.971) (1.586)
Observations 738 619 600 619 329 332 315
R-squared 0.041 0.051 0.058 0.054 0.042 0.025 0.089
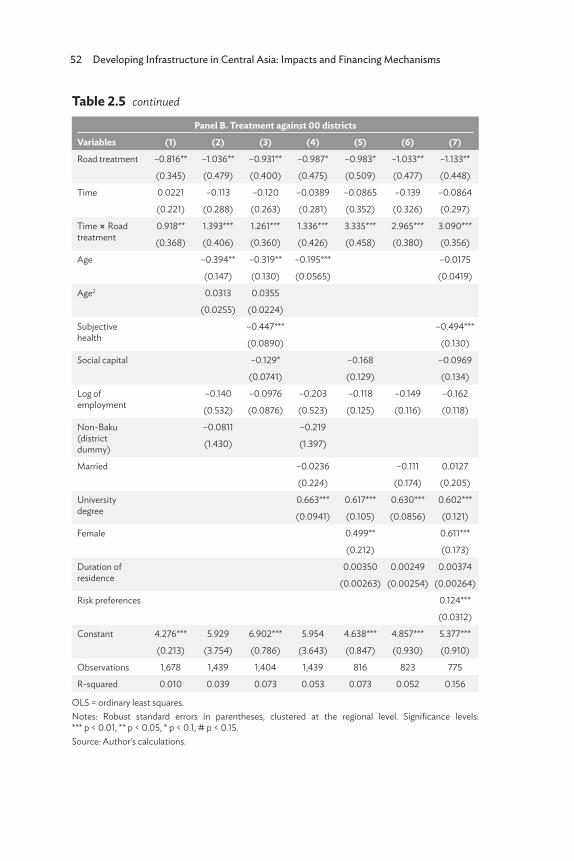
52 Developing Infrastructure in Central Asia: Impacts and Financing Mechanisms
Panel B. Treatment against 00 districtsVariables (1) (2) (3) (4) (5) (6) (7)Road treatment –0.816** –1.036** –0.931** –0.987* –0.983* –1.033** –1.133**
(0.345) (0.479) (0.400) (0.475) (0.509) (0.477) (0.448)
Time 0.0221 –0.113 –0.120 –0.0389 –0.0865 –0.139 –0.0864
(0.221) (0.288) (0.263) (0.281) (0.352) (0.326) (0.297)
Time ⨯ Road treatment
0.918** 1.393*** 1.261*** 1.336*** 3.335*** 2.965*** 3.090***
(0.368) (0.406) (0.360) (0.426) (0.458) (0.380) (0.356)
Age –0.394** –0.319** –0.195*** –0.0175
(0.147) (0.130) (0.0565) (0.0419)
Age2 0.0313 0.0355
(0.0255) (0.0224)
Subjective health
–0.447*** –0.494***
(0.0890) (0.130)
Social capital –0.129* –0.168 –0.0969
(0.0741) (0.129) (0.134)
Log of employment
–0.140 –0.0976 –0.203 –0.118 –0.149 –0.162
(0.532) (0.0876) (0.523) (0.125) (0.116) (0.118)
Non-Baku (district dummy)
–0.0811 –0.219
(1.430) (1.397)
Married –0.0236 –0.111 0.0127
(0.224) (0.174) (0.205)
University degree
0.663*** 0.617*** 0.630*** 0.602***
(0.0941) (0.105) (0.0856) (0.121)
Female 0.499** 0.611***
(0.212) (0.173)
Duration of residence
0.00350 0.00249 0.00374
(0.00263) (0.00254) (0.00264)
Risk preferences 0.124***
(0.0312)
Constant 4.276*** 5.929 6.902*** 5.954 4.638*** 4.857*** 5.377***
(0.213) (3.754) (0.786) (3.643) (0.847) (0.930) (0.910)
Observations 1,678 1,439 1,404 1,439 816 823 775
R-squared 0.010 0.039 0.073 0.053 0.073 0.052 0.156
OLS = ordinary least squares. Notes: Robust standard errors in parentheses, clustered at the regional level. Significance levels: *** p < 0.01, ** p < 0.05, * p < 0.1, # p < 0.15.Source: Author’s calculations.
Table 2.5 continued
Measuring the Impact of Road Infrastructure on Household Well-Being: Evidence from Azerbaijan 53
significant given that the dependent variable on the self-assessed wealth varies between 1 and 10, each representing a hypothetical income ladder. Note, however, that in Panel A none of these coefficients are statistically significant, suggesting that changes in relative self-assessed wealth in the treated regions relative to the areas with the existing road infrastructure are negligible. This is likely to be due to a possible spillover effect of the road construction project on regions with existing road infrastructure due to improved connectivity.
In Table 2.6, we report the results of ordered logit estimations, which suggest that the relationship between treatment with access to roads relative to household wealth is positive and significant in general (Column 1) if the less well-off districts are chosen as controls (Column 2). This relationship does not find statistical support if the better-off districts are used as control communities (Column 3). We run this regression to test the robustness of our estimates for an alternative estimation method. Coefficients here stand for the log-odds ratio of the probability of a higher-category response. The estimated coefficients, by and large, confirm our conclusions from Table 2.5.
Table 2.6: Subjective Household Wealth Relative to Others in the Society – Ordered Logit Estimations
(1) (2) (3)
Variables PooledAgainst 00
districtsAgainst 11
districtsRoad treatment –0.474*** –0.632*** –0.0836
(0.180) (0.185) (0.206)
Time 0.198** 0.0248 0.694***
(0.0807) (0.0944) (0.160)
Time ⨯ Road treatment 0.550** 0.732*** 0.0841
(0.242) (0.248) (0.280)
Observations 2,196 1,678 738
Notes: Standard errors in parentheses. Significance levels: *** p < 0.01, ** p < 0.05, * p < 0.1, # p < 0.15.Source: Author’s calculations.
54 Developing Infrastructure in Central Asia: Impacts and Financing Mechanisms
2.5 Concluding RemarksThis chapter has examined the impact of access to national roads in Azerbaijan to provide an empirical estimation of the impact on household wealth, proxied by real estate prices and self-reported perceptions of relative household wealth. The results suggest a significant positive effect at the district level.
To that end, we constructed two waves of data that include household-level information as well as district-level characteristics in Azerbaijan. We then ran estimations similar to a difference-in-difference approach. However, our data are a repeated cross-section at the household level, not longitudinal. Therefore, our estimations concern the differences between households in treated vs. control districts. Overall, the results provide empirical support for our conjecture that gaining access to national roads has a positive impact on the well-being of the households located in such communities. Specifically, we find that monthly rent grew by AZN83–AZN110 per month, which is 50%–60% of the mean monthly rent. On the other hand, self-assessed wealth increased as a result of road construction.
These results have important policy implications in providing empirical support for the impact of expansion of road infrastructure. However, our study has its own limitations. For example, the data for the dependent variables are in the form of stated information. Therefore, it may suffer from some subjective biases, e.g., hindsight bias. In addition, we only have two waves of nonlongitudinal data. For a robust estimation of impacts, one would prefer a well-balanced panel with multiple waves.
Measuring the Impact of Road Infrastructure on Household Well-Being: Evidence from Azerbaijan 55
ReferencesArslanalp, S., F. Barnharst, S. Gupta, and E. Sze. 2010. Public Capital and
Growth. Working Paper No. 175. International Monetary Fund.Baldwin, R., and T. Okubo. 2006. Heterogeneous Firms, Agglomeration
and Economic Geography: Spatial Selection and Sorting. Journal of Economic Geography. 6 (3). pp. 323–46.
Baum-Snow, N. 2007. Did Highways Cause Suburbanization? Quarterly Journal of Economics. 122 (2). pp. 775–805.
____. 2010. Changes in Transportation Infrastructure and Commuting Patterns in US Metropolitan Areas, 1960–2000. American Economic Review. 100 (2). pp. 378–82.
Behrens, K., A. Lamorgese, G. Ottaviano, and T. Tabuchi. 2004. Testing the Home Market Effect in a Multi-Country World: The Theory. CEPR Discussion Paper No. 4468.
Berg, C., U. Deichmann, and H. Selod. 2015. How Roads Support Development. Let’s Talk Development, The World Bank Blogs. 8 December. https://blogs.worldbank.org/developmenttalk/how -roads-support-development.
Combes, P., and M. Lafourcade. 2001. Transport Cost Decline and Regional Inequalities: Evidence from France. CEPR Discussion Paper No. 2894.
Duranton, G., P. Morrow, and M. Turner. 2012. Roads and Trade: Evidence from the US. Mimeograph, University of Toronto.
Duranton, G., and D. Puga. 2004. Micro-Foundations of Urban Agglomeration Economies. Handbook of Regional and Urban Economics. 4. pp. 2063–117.
Duranton, G., And M. Turner. 2011. The Fundamental Law of Road Congestion: Evidence from the US. American Economic Review. 101 (6). pp. 2616–52.
____. 2012. Urban Growth and Transportation. Review of Economic Studies. 79 (4). pp. 1407–40.
Eddington, R. 2006. The Case for Action: Sir Rod Eddington’s Advice to Government. London: HMSO.
Eisner, R. 1994. Real Government Saving and the Future. Journal of Economic Behavior and Organization. 23. pp. 111–26.
Garcia-Mila, T., T. McGuire, and R. Porter. 1996. The Effect of Public Capital in State Level Production Functions Reconsidered. The Review of Economics and Statistics. 78 (1). pp. 177–80.
Gibbons, S., and S. Machin. 2006. Transport and Labour Market Linkages: Empirical Evidence, Implications for Policy and Scope for Further UK Research. Report. London: Department of Transport.
Gibbons, S., and H. Overman. 2009. Productivity in Transport Evaluation Studies. Report. London: Department of Transport.
56 Developing Infrastructure in Central Asia: Impacts and Financing Mechanisms
Graham, D. 2007. Agglomeration, Productivity and Transport Investment. Journal of Transport Economics and Policy. 41 (3). pp. 317–43.
Harmatuck, D. 1996. The Influence of Transportation Infrastructure on Economic Development. Logistics and Transportation Review. 32 (1). pp. 76–92.
Holl, A. 2006. A Review of the Firm-Level Role of Transport Infrastructure with Implications for Transport Project Evaluation. Journal of Planning Literature. 21 (1). pp. 3–14.
Hulten, C., and R. Schwab. 1991. Public Capital Formation and the Growth of Regional Manufacturing Industries. National Tax Journal. 64 (4). pp. 121–34.
Iossa, E., and D. Martimort. 2015. The Simple Microeconomics of Public–Private Partnerships. Journal of Public Economic Theory. 17 (1). pp. 4–48.
Maskin, E., and J. Tirole. 2008. Public–Private Partnerships and Government Spending Limits. International Journal of Industrial Organization. 26 (2). pp. 412–20.
Melitz, M. 2003. The Impact of Trade on Intra-Industry Reallocations and Aggregate Industry Productivity. Econometrica. 71. pp. 1695–725.
Michaels, G. 2008. The Effect of Trade on the Demand for Skill: Evidence from the Interstate Highway System. Review of Economics and Statistics. 90 (4). pp. 683–701.
Niftaliyev, S. 2019. Public–Private Partnership: Alternative Way of Attracting Private Sector to Infrastructure Projects in Azerbaijan. KMPG Azerbaijan.
Puga D. 2002. European Regional Policies in Light of Recent Location Theories. Journal of Economic Geography. 2 (4). pp. 373–406.
Small, K. 2007. The Economics of Urban Transportation. Routledge.Straub S. 2011. Infrastructure and Development: A Critical Appraisal of
the Macro-Level Literature. The Journal of Development Studies. 47 (5). pp. 683–708.
United Nations Conference on Trade and Development, 2018. World Investment Report 2018: Investment and New Industrial Policies. Geneva: United Nations.
Venables, A. 2007. Evaluating Urban Transport Improvements: Cost-Benefit Analysis in the Presence of Agglomeration and Income Taxation. Journal of Transport Economics and Policy. 41 (2). pp. 173–88.
Yoshino, N., and U. Abidhadjaev. 2017. An Impact Evaluation of Investment in Infrastructure: The Case of a Railway Connection in Uzbekistan. Journal of Asian Economics. 49. pp. 1–11.
Yoshino, N., and M. Nakahigashi. 2000. Economic Effects of Infrastructure: Japan’s Experience after World War II. JBIC Review. 3. pp. 3–19.
57
3Managing the Risks of Public
Infrastructure Financing: Toward Sustainability
Quanhou Zhao, Licheng Zhang, Beilin Feng, Wei Liu, Xiaoyan Long, Jiaxi Sun, Xu Chen, and Qiongqi Xiao
3.1 Methods and Risk Management Practices of Financing for Public Infrastructure in the People’s Republic of China since Reform and Opening Up
Public infrastructure investment in the People’s Republic of China (PRC) has made significant progress at a superfast pace since the introduction of the reform and opening-up policy, resulting in not only a rapid increase in traditional infrastructure sectors (e.g., railways, roads, and airports) but also a quick improvement in urban infrastructure. The infrastructure investment, at CNY411.8 billion in 1995, had skyrocketed by nearly 27 times to CNY11.27 trillion in 2014. Increasingly better infrastructure in the country goes in parallel with the growth of investment. The railway network length extended from 51,700 kilometers (km) in 1978 to 111,800 km in 2014. In particular, the construction of a high-speed rail network commenced in 2009 and soon reported 16,500 km of high-speed track in operation in 2014. Moreover, the road network length increased from 890,000 km in 1978 to 4,460,000 km in 2014. Investment in urban municipal public infrastructure has taken a high-speed growth track in the 21st century, soaring from CNY312.3 billion in 2002 to CNY1.6 trillion in 2014. The PRC’s impressive infrastructure provides a hardware foundation for its rapid economic growth (Liu and Hu 2010; Zhang, Gao, and Fu 2007).
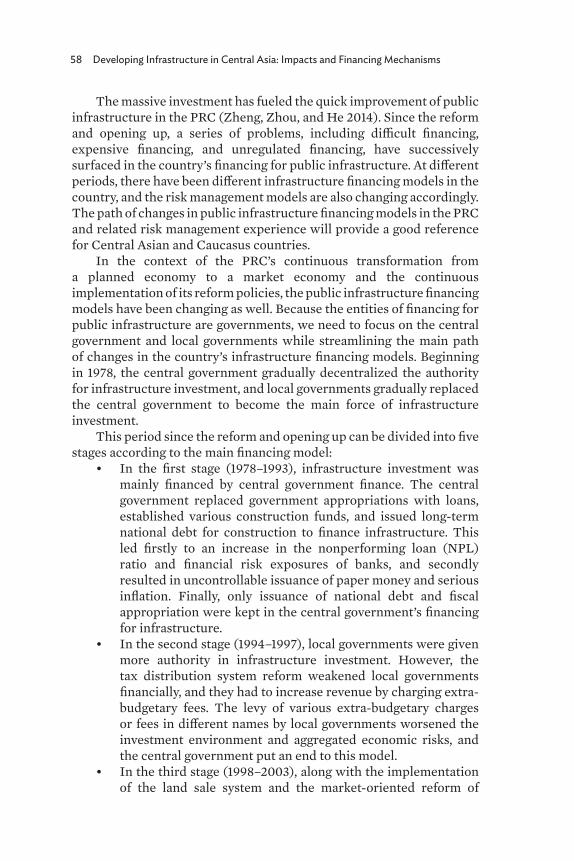
58 Developing Infrastructure in Central Asia: Impacts and Financing Mechanisms
The massive investment has fueled the quick improvement of public infrastructure in the PRC (Zheng, Zhou, and He 2014). Since the reform and opening up, a series of problems, including difficult financing, expensive financing, and unregulated financing, have successively surfaced in the country’s financing for public infrastructure. At different periods, there have been different infrastructure financing models in the country, and the risk management models are also changing accordingly. The path of changes in public infrastructure financing models in the PRC and related risk management experience will provide a good reference for Central Asian and Caucasus countries.
In the context of the PRC’s continuous transformation from a planned economy to a market economy and the continuous implementation of its reform policies, the public infrastructure financing models have been changing as well. Because the entities of financing for public infrastructure are governments, we need to focus on the central government and local governments while streamlining the main path of changes in the country’s infrastructure financing models. Beginning in 1978, the central government gradually decentralized the authority for infrastructure investment, and local governments gradually replaced the central government to become the main force of infrastructure investment.
This period since the reform and opening up can be divided into five stages according to the main financing model:
• In the first stage (1978–1993), infrastructure investment was mainly financed by central government finance. The central government replaced government appropriations with loans, established various construction funds, and issued long-term national debt for construction to finance infrastructure. This led firstly to an increase in the nonperforming loan (NPL) ratio and financial risk exposures of banks, and secondly resulted in uncontrollable issuance of paper money and serious inflation. Finally, only issuance of national debt and fiscal appropriation were kept in the central government’s financing for infrastructure.
• In the second stage (1994–1997), local governments were given more authority in infrastructure investment. However, the tax distribution system reform weakened local governments financially, and they had to increase revenue by charging extra-budgetary fees. The levy of various extra-budgetary charges or fees in different names by local governments worsened the investment environment and aggregated economic risks, and the central government put an end to this model.
• In the third stage (1998–2003), along with the implementation of the land sale system and the market-oriented reform of
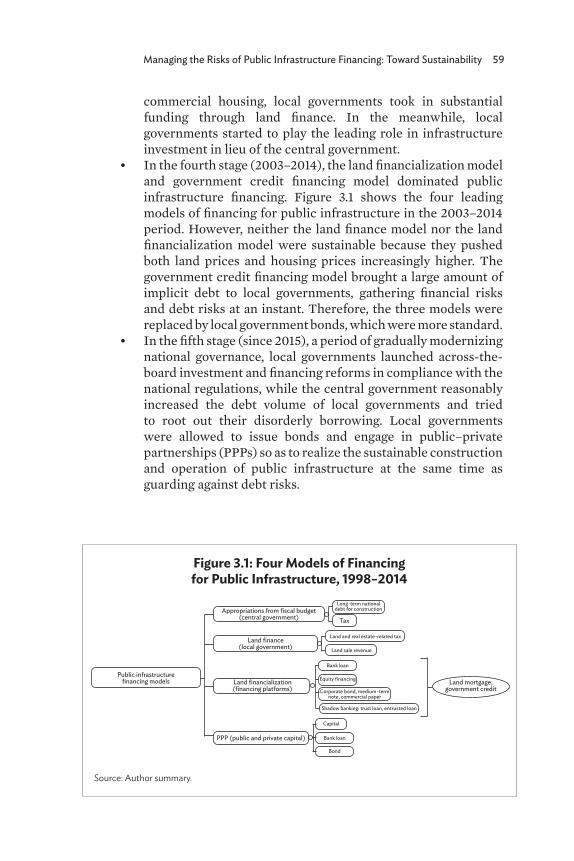
Managing the Risks of Public Infrastructure Financing: Toward Sustainability 59
commercial housing, local governments took in substantial funding through land finance. In the meanwhile, local governments started to play the leading role in infrastructure investment in lieu of the central government.
• In the fourth stage (2003–2014), the land financialization model and government credit financing model dominated public infrastructure financing. Figure 3.1 shows the four leading models of financing for public infrastructure in the 2003–2014 period. However, neither the land finance model nor the land financialization model were sustainable because they pushed both land prices and housing prices increasingly higher. The government credit financing model brought a large amount of implicit debt to local governments, gathering financial risks and debt risks at an instant. Therefore, the three models were replaced by local government bonds, which were more standard.
• In the fifth stage (since 2015), a period of gradually modernizing national governance, local governments launched across-the-board investment and financing reforms in compliance with the national regulations, while the central government reasonably increased the debt volume of local governments and tried to root out their disorderly borrowing. Local governments were allowed to issue bonds and engage in public–private partnerships (PPPs) so as to realize the sustainable construction and operation of public infrastructure at the same time as guarding against debt risks.
Figure 3.1: Four Models of Financing for Public Infrastructure, 1998–2014
Source: Author summary.
Appropriations from fiscal budget(central government)
Land finance(local government)
Long-term nationaldebt for construction
Corporate bond, medium-termnote, commercial paper
Land and real estate-related tax
Shadow banking: trust loan, entrusted loan
Land sale revenue
Bank loan
Bank loan
Bond
Capital
Equity financing
Tax
Land financialization(financing platforms)
PPP (public and private capital)
Land mortgage,government credit
Public infrastructure financing models
60 Developing Infrastructure in Central Asia: Impacts and Financing Mechanisms
3.1.1 Replacement of Government Appropriations with Loans, Central Construction Funds, and National Debt Issuance (1978–1993)
Before the reform and opening up, the PRC had adopted a planned economic system. Investment in public infrastructure construction was subject to arrangements by the National Planning Commission (predecessor of the National Development and Reform Commission), and the financing was provided by a single channel, i.e., fiscal funds in which the central government dominated. During the fourth 5-year planning period (1971–1975) and the fifth 5-year planning period (1976–1980), central government funds comprised as much as 82.5% and 72.4% of capital construction investment, respectively. The funds for the national finance for capital construction always took the form of fiscal appropriations, and the construction units could use them for free, which corresponded to the planned economic system and the fiscal system of unified collection and allocation of funds by the state. However, free allocation exposed more drawbacks with the expansion of the investment scale. The absence of constraints on the use of investment capital by enterprises and local governments, and blind and inefficient investments in particular, led to a grievous waste and inefficiency of national funding.
In the early days of reform and opening up, the central government remained a dominant investor in public infrastructure, and the construction investment authority had not been delegated to local governments yet. In order to improve investment efficiency, the PRC launched reforms of the state budgetary capital construction investment management system. However, the financial resources of the central government and the related investment efficiency were dwarfed by the gigantic infrastructure investment demands. In response, the central government raised money for public infrastructure through the establishment of various construction funds, the replacement of government appropriations with loans, and the issuance of national debt.
Inception of Construction Fund, Central Capital Construction Funds, and Budget Regulation FundIn 1982, the Central Committee of the Communist Party and the State Council issued the Circular on Collecting the Fund for Important Construction of State’s Energy and Transportation, and the State Council issued the Measures for Collecting the Fund for Important Construction of State’s Energy and Transportation, deciding to collect the fund for the PRC’s key energy and transportation construction projects. The
Managing the Risks of Public Infrastructure Financing: Toward Sustainability 61
fund mainly levied a percentage of 15% on the extra-budgetary funds and funds not included in the budget management, and this was shared among the central and local governments at an approximate ratio of 7:3. From coming into existence in 1983 to retirement in 1993, the fund accumulated a total of CNY181.089 billion, which solved the urgent need for investment in the development of electricity, coal, transportation, and communications.
With the delegation of government power and constant development of the PRC economy, investments in the country were diversified. However, there were two ensuing problems. First, no synergy was created in the use of funds, leading to the repetition of general construction despite attempts by the government to stamp out the practice; second, limited by its financial strength, the central government could only arrange a small and unstable amount of budgetary funds for capital construction each year. The Central Investment Fund emerged in response to the above two problems by ensuring the funding was in place for key construction projects in the PRC and realizing the guidance on local and extra-budgetary investments. In 1988, the State Council issued the Circular on Printing and Distributing the Scheme on Recent Reform of Investment Management Mechanism and the Measures for Administration of National Capital Construction Fund, deciding to adopt the system of “Central Capital Construction Funds” for investment within the central budget in capital construction projects. These funds came from five sources: (1) the portion of the fund collections on the fund for important construction of state’s energy and transportation for the central government to use; (2) the portion of the levied construction tax revenues for the central government to use; (3) the portion of the Ministry of Railway’s lump-sum revenues for budgetary capital construction; (4) the principal and interest collections from the budgetary investments under replacement of government appropriations with loans; and (5) fixed-amount fiscal appropriations.
The PRC government established six specialized investment companies to manage the funds: the National Energy Investment Corporation, the National Transportation Investment Corporation, the National Raw Material Investment Corporation, the National Electromechanical and Textile Investment Corporation, the National Agricultural Investment Corporation, and the National Forestry Investment Corporation. The investment corporations performed the function of share-controlled companies so that the value of the funds could be maintained and increased, and they also assumed the function of making national policy-oriented investments. After the implementation of the fund system, although the country was financially strained, the annual national budget had retained the fund base as much as possible,
62 Developing Infrastructure in Central Asia: Impacts and Financing Mechanisms
so that key construction projects such as energy, transportation, and raw materials had stable funding sources. From 1989 to 1994, outstanding loans of central operating funds exceeded CNY100 billion, supporting a number of key projects. With the deepening of economic system reforms, such as changes in the objective economic conditions, the number and structure of the five funds changed, and the Fund on Key Energy and Transportation Construction Projects was gradually reduced. In 1994, the State Council merged these six state-owned specialized investment corporations into the China Development Bank. As a policy-related financial institution, the bank used state credit to issue policy-based financial bonds and was tasked with investing in, and financing, key infrastructure construction projects entrusted by the government. For example, it provided a loan of CNY3.0 billion each year to the Three Gorges Project from 1994 to 2003, totaling CNY30 billion for a term of 15 years (Hu 2006).
In addition, in order to enhance macro control, the government set up a national budget regulation fund to address the excessive growth and improper use of extra-budgetary funds. In 1989, the State Council released the Measures for Collecting the National Budget Regulation Fund, deciding to levy a national budget regulation fund on state-owned enterprises and private enterprises at a rate of 10%, which would be shared among the central and local governments. From 1989 to 1996, CNY68.597 billion of the National Budget Regulation Fund was collected to strengthen the country’s macro control, ease the country’s financial difficulties, regulate the flow of extra-budgetary funds, and finance key energy and transportation construction projects.
The centralization of funds to strengthen key energy and transportation construction projects was proven very effective. From 1983 to 1993, the PRC’s energy product output increased rapidly, with raw coal output rising by 60.8%, crude oil output by 36.9%, and power generation by 138.9%; transportation capacity was boosted rapidly, with the length of roads and that of civil air routes increasing by 18.4% and 319.4%, respectively. The improvement of transportation and energy conditions provided a good foundation for the healthy and rapid development of the entire national economy.
Reform of the Replacement of Government Appropriations with Loans and the Project Capital SystemIn addition to the establishment of various construction funds, the central government started to reform the Replacement of Government Appropriations with Loans in 1979. The replacement of appropriations for budgetary investment in capital construction with loans refers to replacing free-of-charge fiscal appropriations with paid use of bank
Managing the Risks of Public Infrastructure Financing: Toward Sustainability 63
loans in order to strengthen the economic liability of the users of capital construction funds. In August 1978, the State Council forwarded the Report on the Measures for Granting Bank Loans for Investment in Capital Construction and the Trial Regulation on Basic Construction Loans, co-released by the National Planning Commission, the National Construction Commission, and the Ministry of Finance, rolling out the pilot program of changing fiscal appropriations for infrastructure construction to bank loans granted by the China Construction Bank. In December 1984, the National Planning Commission, the Ministry of Finance, and the China Construction Bank co-released the Interim Regulation on Changing All the Investments in Capital Construction in the National Budget from Appropriations Wholly to Loans, marking the policy of “replacing government appropriations with loans” being put implemented across the board. In consideration of the fact that some projects were for public welfare by nature and they were insolvent, the PRC introduced a “dual-track” system by allowing appropriation and investment to coexist in 1986.
The system of “replacing government appropriations with loans” helped to strengthen the responsibility of fiscal fund users, imposed constraints, caused the project-supervising departments to attach importance to benefits and loan repayments, and was conducive to raising the investment efficiency. Against the shortage of fiscal funds, banks acted as project managers and collectors of project earnings, which changed the characteristic of fiscal funds “getting no return from investment” and strengthened the capability of collecting investment capital and increasing income. Generally speaking, the policy of “replacing government appropriations with loans” had greater advantages over the appropriation granting policy. Subject to the constraint of paying the loan principal and interest, local governments and enterprises gave up the practice of “eating from the same big pot”—racing to apply for funding from the fiscal authority and making irresponsible investments. The efforts paid off in effectively saving money, controlling the size of infrastructure construction, and raising the investment return.
Nonetheless, the policy of “replacing government appropriations with loans” increased the PRC’s overall financial risks at a fast speed. Since investment in infrastructure had basically no cash flows or debt-servicing ability, NPLs piled up. At the end of the 1990s, the PRC government had to strip nonperforming assets of CNY1.4 trillion from the Bank of China, the Agricultural Bank of China, the Industrial and Commercial Bank of China, and the China Construction Bank (the “big four” state-owned banks).
The concentrated outbreak of financial and fiscal risks in the late 1980s put an end to the policy of replacing government appropriations
64 Developing Infrastructure in Central Asia: Impacts and Financing Mechanisms
with loans for infrastructure construction. The PRC carried out financial system reform in 1993. According to the Decision of the State Council on Financial System Reform (G.F. [1993] No. 91), banks were divided into policy banks and commercial banks, thereby cutting off the direct relationship between policy loan and monetary base. Policy banks, including the China Development Bank, were established, while state-owned specialized banks such as the big four turned to commercial banking and began to engage in commercial business.
Moreover, to mitigate the risks from the practice of replacing government appropriations with loans for infrastructure financing, the State Council of China released the Circular on Piloting the Capital System of Fixed Asset Investment Projects (G.F. [1996] No. 35) on 23 August 1996, and required implementation of the project capital system, a kind of project management system whereby the total investment in a project would be approved only when there was a certain proportion of capital beyond the legal person’s debt fund. Project capital must be nondebt, while the investors were entitled to the owner’s equity in proportion to their contributions, and they were allowed to transfer but not withdraw their investments, in order to prevent and control risks since the practice of replacing government appropriations with loans could easily give rise to extremely big project risks.
Issuing National Debt for Construction and Running Fiscal Deficit by the Central BankAfter the Third Plenary Session of the 11th Central Committee of the Communist Party, the PRC unleashed a new wave of massive construction of key projects. In order to navigate through fiscal difficulties, raise funds, and prevent inflation, the State Council issued treasury bills in 1981 to make up for the central fiscal deficit, ending the history of the PRC having neither internal debt nor external debt since 1959. Issuance of medium- and long-term national debt for construction was gradually used in lieu of other financing models and became an important source of budgetary funds for the central government’s infrastructure investment.
Between 1981 and 1992, the PRC government issued a total of CNY119.943 billion in national debt. The national debt issued in 1981 was mainly used to make up for the fiscal deficit, and that issued in other years was mainly used to increase investment in key energy and transportation construction projects. Since 1998, the PRC has practiced an expansionary fiscal policy. In the 5 years from 1998 to 2002, CNY660 billion of special national debt was issued in total for investment in basic industries and infrastructure, mainly infrastructure projects in agriculture, water conservancy, transportation and communications,
Managing the Risks of Public Infrastructure Financing: Toward Sustainability 65
urban infrastructure, urban and rural power grid transformation, and central reserve grain depots. Further, interest-subsidized funds for technological improvement were spent on some technological transformation projects in basic industries.
In order to make up for the funding gap, the central government directly created overdrafts from commercial banks in addition to issuing national debt for construction, forming a large-scale “soft deficit.” Finally, the deficit could only be compensated for by increasing the money supply, resulting in serious inflation. Serious inflation forced the government to strictly separate the funding relationship between the finance and the central bank through reform. According to the Law of the People’s Republic of China on the People’s Bank of China adopted in 1995, the latter should not overdraw the government finance or directly subscribe to or underwrite national debt and other government bonds. Since then, the central government’s financing for making up the fiscal deficit and major public infrastructure has mainly taken the form of expanding the issuance of national debt.
This also shows that the central government-led infrastructure financing has basically adopted a standardized and transparent method of issuing national debt since 1995, and deficit monetization has been prohibited by law. This method is still used by the central government as a leading approach of financing for infrastructure, and there is a relatively sound early warning and risk prevention system. At the end of 2017, the balance of central government bonds accounted for about 16.3% of gross domestic product.
3.1.2 Extra-budgetary Charges of Local Governments (1994–1997)
In the early 1990s, the changes in the authority of office and the authority of finance of the central and local governments in investment and financing resulted in a significant shift of the models of financing for public infrastructure. First, the central government went into streamlining government and delegating authority, and started delegating the investment authority to local governments. The Decision of the Communist Party of China Central Committee on Some Issues Concerning the Establishment of a Socialist Market Economic System (1993) proposed deepening the reform of the investment system and defined local governments’ responsibility for local infrastructure construction. Second, the tax distribution system reform reduced the proportion of budgetary fiscal revenue of local governments. Third, the central government’s models of financing for infrastructure were standardized, and the financing channels were not diverse, with the
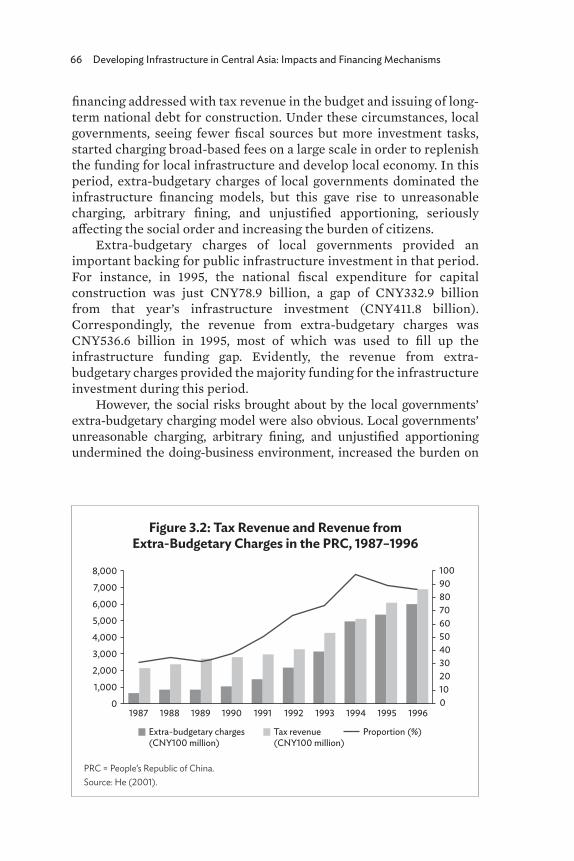
66 Developing Infrastructure in Central Asia: Impacts and Financing Mechanisms
financing addressed with tax revenue in the budget and issuing of long-term national debt for construction. Under these circumstances, local governments, seeing fewer fiscal sources but more investment tasks, started charging broad-based fees on a large scale in order to replenish the funding for local infrastructure and develop local economy. In this period, extra-budgetary charges of local governments dominated the infrastructure financing models, but this gave rise to unreasonable charging, arbitrary fining, and unjustified apportioning, seriously affecting the social order and increasing the burden of citizens.
Extra-budgetary charges of local governments provided an important backing for public infrastructure investment in that period. For instance, in 1995, the national fiscal expenditure for capital construction was just CNY78.9 billion, a gap of CNY332.9 billion from that year’s infrastructure investment (CNY411.8 billion). Correspondingly, the revenue from extra-budgetary charges was CNY536.6 billion in 1995, most of which was used to fill up the infrastructure funding gap. Evidently, the revenue from extra-budgetary charges provided the majority funding for the infrastructure investment during this period.
However, the social risks brought about by the local governments’ extra-budgetary charging model were also obvious. Local governments’ unreasonable charging, arbitrary fining, and unjustified apportioning undermined the doing-business environment, increased the burden on
Figure 3.2: Tax Revenue and Revenue from Extra-Budgetary Charges in the PRC, 1987–1996
PRC = People’s Republic of China. Source: He (2001).
Extra-budgetary charges(CNY100 million)
Proportion (%)
1987 1988 1989 1990 1991 1992 1993 1994 1995 1996
6,000
7,000
8,000
5,000
4,000
3,000
2,000
1,000
0
1009080706050403020100
Tax revenue(CNY100 million)
Managing the Risks of Public Infrastructure Financing: Toward Sustainability 67
the market players, and disrupted the market economic order. This was not in line with the direction of the PRC’s transformation toward a market economy. Therefore, in 1996, the central government began to regulate the fee-charging practice, inspect extra-budgetary funds, and cancel unreasonable charges. It was not until 2004 that unreasonable charging, arbitrary fining, and unjustified apportioning were basically eliminated. At the same time, the fee-charging model for infrastructure investment also disappeared, and local governments had to look for alternatives.
3.1.3 Financing Model of Land Finance (1998–2003)
After 1998, the investment authority was further delegated to local governments with even greater force, and local governments played a more important role in infrastructure investment, while the central government was responsible for a small number of significant construction projects only.
During this period, the central government still seized the funding sources of finance, while local finance remained a payroll finance. On the one hand, according to the 1994 Budget Law, local governments were not allowed to issue bonds, the central government issued long-term construction debt and then granted the loan to local governments; on the other hand, after the tax distribution system reform, the proportion of local governments’ budgetary revenue declined, and most local government finance became payroll finance without enough tax to arrange for infrastructure investment. Local governments could only rely on a portion of the transfer payments made by the central government for infrastructure investment. In 2002, the central government’s capital construction expenditure was CNY125.3 billion, and that of local governments was CNY189 billion, combining to account for 31% of the total infrastructure investment in the year.
In addition, when the central government adopted an expansionary fiscal policy and increased investment in public infrastructure, it was necessary for local governments to make supporting investments. For example, in response to the global financial crisis in 2008, the central government increased public investment by CNY1.18 trillion,1 which required local governments to make a total investment of CNY2.82 trillion accordingly.
1 Including an increase in investment of CNY104 billion after October 2008, an increase of CNY487.5 billion in 2009, and an estimated increase of CNY588.5 billion in 2010.
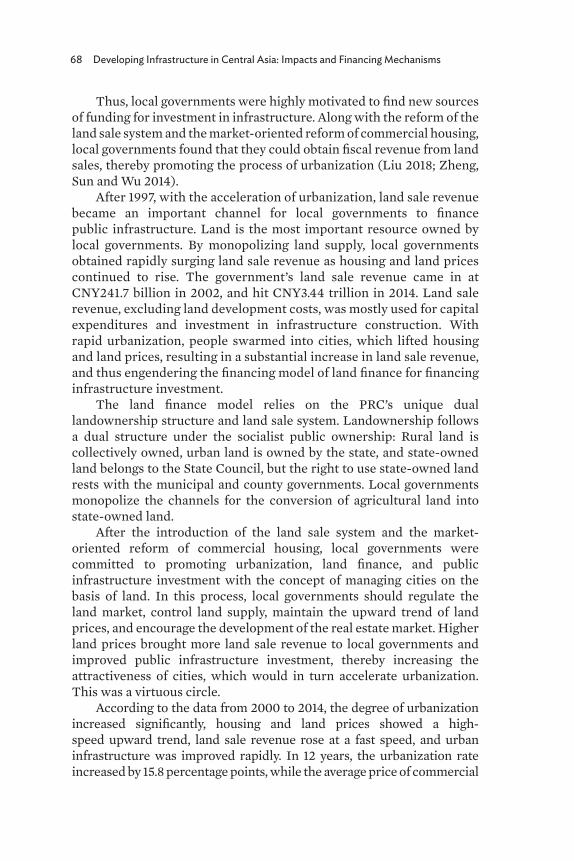
68 Developing Infrastructure in Central Asia: Impacts and Financing Mechanisms
Thus, local governments were highly motivated to find new sources of funding for investment in infrastructure. Along with the reform of the land sale system and the market-oriented reform of commercial housing, local governments found that they could obtain fiscal revenue from land sales, thereby promoting the process of urbanization (Liu 2018; Zheng, Sun and Wu 2014).
After 1997, with the acceleration of urbanization, land sale revenue became an important channel for local governments to finance public infrastructure. Land is the most important resource owned by local governments. By monopolizing land supply, local governments obtained rapidly surging land sale revenue as housing and land prices continued to rise. The government’s land sale revenue came in at CNY241.7 billion in 2002, and hit CNY3.44 trillion in 2014. Land sale revenue, excluding land development costs, was mostly used for capital expenditures and investment in infrastructure construction. With rapid urbanization, people swarmed into cities, which lifted housing and land prices, resulting in a substantial increase in land sale revenue, and thus engendering the financing model of land finance for financing infrastructure investment.
The land finance model relies on the PRC’s unique dual landownership structure and land sale system. Landownership follows a dual structure under the socialist public ownership: Rural land is collectively owned, urban land is owned by the state, and state-owned land belongs to the State Council, but the right to use state-owned land rests with the municipal and county governments. Local governments monopolize the channels for the conversion of agricultural land into state-owned land.
After the introduction of the land sale system and the market-oriented reform of commercial housing, local governments were committed to promoting urbanization, land finance, and public infrastructure investment with the concept of managing cities on the basis of land. In this process, local governments should regulate the land market, control land supply, maintain the upward trend of land prices, and encourage the development of the real estate market. Higher land prices brought more land sale revenue to local governments and improved public infrastructure investment, thereby increasing the attractiveness of cities, which would in turn accelerate urbanization. This was a virtuous circle.
According to the data from 2000 to 2014, the degree of urbanization increased significantly, housing and land prices showed a high-speed upward trend, land sale revenue rose at a fast speed, and urban infrastructure was improved rapidly. In 12 years, the urbanization rate increased by 15.8 percentage points, while the average price of commercial
Managing the Risks of Public Infrastructure Financing: Toward Sustainability 69
housing and land grew from CNY2,250 and CNY998 in 2002 to CNY6,324 and CNY5,216.5 in 2014, respectively, with land price growth outpacing that of housing. At the same time, local governments saw their state-owned land sale revenue increase by nearly 14 times from CNY241.679 billion in 2002 to CNY3.44 trillion in 2014. During this period, urban infrastructure investment also increased by leaps and bounds, from CNY312.3 billion in 2002 to CNY1.6 trillion in 2014. Local governments spent most of the land sale revenue on urban infrastructure construction, thereby improving urban competitiveness and attracting population inflows (Figure 3.3).
In addition, the development of the real estate market and the rise of land prices also helped local governments increase their budgetary fiscal revenue, thereby providing a funding basis for public infrastructure investment. After the tax distribution system reform, taxes and nontaxes related to land and real estate became the backbone of local taxation (Liu, Zhang, and Fang 2015).
3.1.4 Land Financial and Government Credit Financing Model (2003–2014)
In 2003, the China Development Bank commenced the third round of lending. It granted credit to financing platforms across the board, and the financing platforms obtained loans with land as collateral. In this
Figure 3.3: State-Owned Land Sale Revenue and Urban Public Infrastructure Investment, 2000–2017
Source: Wind Economic Database.
State-owned land sale revenue (left, CNY100 million)
2000
2001
2002
2003
2004
2005
2006
2007
2008
2009
2010
2011
2012
2013
2014
2015
2016
2017
60,000
50,000
40,000
30,000
20,000
10,000
0
20,00018,00016,00014,00012,00010,0008,0006,0004,0002,0000
Investment in urban public infrastructure (right, CNY100 million)
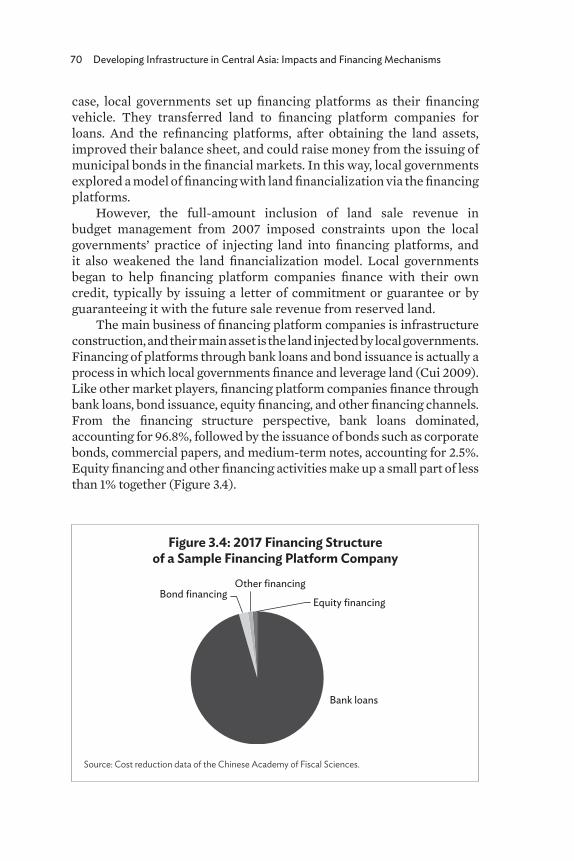
70 Developing Infrastructure in Central Asia: Impacts and Financing Mechanisms
case, local governments set up financing platforms as their financing vehicle. They transferred land to financing platform companies for loans. And the refinancing platforms, after obtaining the land assets, improved their balance sheet, and could raise money from the issuing of municipal bonds in the financial markets. In this way, local governments explored a model of financing with land financialization via the financing platforms.
However, the full-amount inclusion of land sale revenue in budget management from 2007 imposed constraints upon the local governments’ practice of injecting land into financing platforms, and it also weakened the land financialization model. Local governments began to help financing platform companies finance with their own credit, typically by issuing a letter of commitment or guarantee or by guaranteeing it with the future sale revenue from reserved land.
The main business of financing platform companies is infrastructure construction, and their main asset is the land injected by local governments. Financing of platforms through bank loans and bond issuance is actually a process in which local governments finance and leverage land (Cui 2009). Like other market players, financing platform companies finance through bank loans, bond issuance, equity financing, and other financing channels. From the financing structure perspective, bank loans dominated, accounting for 96.8%, followed by the issuance of bonds such as corporate bonds, commercial papers, and medium-term notes, accounting for 2.5%. Equity financing and other financing activities make up a small part of less than 1% together (Figure 3.4).
Figure 3.4: 2017 Financing Structure of a Sample Financing Platform Company
Source: Cost reduction data of the Chinese Academy of Fiscal Sciences.
Bond financingOther financing
Equity financing
Bank loans
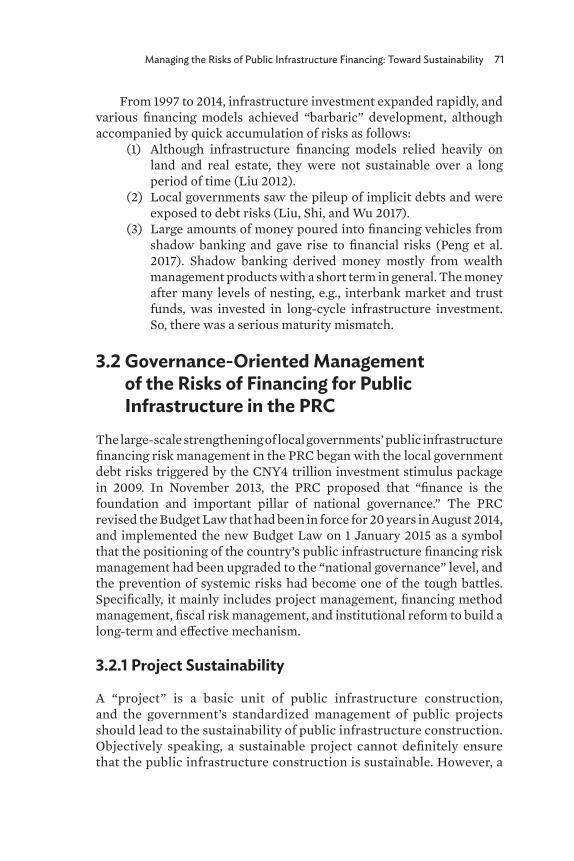
Managing the Risks of Public Infrastructure Financing: Toward Sustainability 71
From 1997 to 2014, infrastructure investment expanded rapidly, and various financing models achieved “barbaric” development, although accompanied by quick accumulation of risks as follows:
(1) Although infrastructure financing models relied heavily on land and real estate, they were not sustainable over a long period of time (Liu 2012).
(2) Local governments saw the pileup of implicit debts and were exposed to debt risks (Liu, Shi, and Wu 2017).
(3) Large amounts of money poured into financing vehicles from shadow banking and gave rise to financial risks (Peng et al. 2017). Shadow banking derived money mostly from wealth management products with a short term in general. The money after many levels of nesting, e.g., interbank market and trust funds, was invested in long-cycle infrastructure investment. So, there was a serious maturity mismatch.
3.2 Governance-Oriented Management of the Risks of Financing for Public Infrastructure in the PRC
The large-scale strengthening of local governments’ public infrastructure financing risk management in the PRC began with the local government debt risks triggered by the CNY4 trillion investment stimulus package in 2009. In November 2013, the PRC proposed that “finance is the foundation and important pillar of national governance.” The PRC revised the Budget Law that had been in force for 20 years in August 2014, and implemented the new Budget Law on 1 January 2015 as a symbol that the positioning of the country’s public infrastructure financing risk management had been upgraded to the “national governance” level, and the prevention of systemic risks had become one of the tough battles. Specifically, it mainly includes project management, financing method management, fiscal risk management, and institutional reform to build a long-term and effective mechanism.
3.2.1 Project Sustainability
A “project” is a basic unit of public infrastructure construction, and the government’s standardized management of public projects should lead to the sustainability of public infrastructure construction. Objectively speaking, a sustainable project cannot definitely ensure that the public infrastructure construction is sustainable. However, a
72 Developing Infrastructure in Central Asia: Impacts and Financing Mechanisms
lack of support at the project level will make it impossible to sustain as a whole. The government has strengthened the standardized management of public infrastructure projects in the following four aspects since 2015.
Control of Project Implementation CyclePublic infrastructure construction and operation involves a long cycle. The long time span will inevitably lead to greater uncertainty in financing management. Therefore, the government strictly controls the project implementation cycle in terms of preventing financing risks. At the central level, the Circular on Strengthening and Improving the Budget Management of Central Departments’ Project Expenditures issued by the Ministry of Finance in 2015 makes it clear that if the project expenditures are arranged by the central departments, the project implementation cycle should not exceed 5 years generally, except those whose implementation cycle has been clearly approved by the competent business departments. In the case of continuing to arrange expenditure after expiration of a project, project re-establishment should be gone through according to the procedures. The project cycle, once determined, should not be adjusted in principle. At the local level, it was defined in 2015 that when local governments finance public investment projects through the issuing of government bonds, the bond terms should be generally 1, 3, 5, 7, and 10 years, while special bonds should mature in 1, 2, 3, 5, 7, and 10 years (Figure 3.5). Although the bond terms have been lengthening since the issuing of local government bonds in 2009, and the 10-year bond product was offered for the first
Figure 3.5: Evolution of Maturities of Bonds Issued by Local Governments
Source: Compiled by authors.
2009 2012 2015
2010
3yr 3yr, 5yr, 7yr
3yr, 5yr
1yr, 2yr, 3yr, 5yr, 7yr, 10yr
3yr, 5yr, 7yr, 10yr 1yr, 2yr, 3yr, 5yr, 7yr, 10yr, 15yr, 20yr
2014 2018
Managing the Risks of Public Infrastructure Financing: Toward Sustainability 73
time in 2014, it was made clear in 2015 that the issuance of single-term local government bonds should not exceed 30% of the general bonds issued in that year.2
Delicacy Management of ProjectsIn the planned economy period, the government’s funds for public infrastructure project construction basically came from finance, and project management was basically a matter within the government. In the process of marketization, urbanization, and industrialization, public investment project financing gradually expanded to social capital, government debt, and other channels. The closed and extensive management of public investment projects within the government was not conducive to external financing of the projects. The government gradually walked onto the track of delicacy management of public investment projects after 2015, shifting from the “packaging and bundling” of projects in the past to “decomposition and separate establishment” of projects, and breaking the responsibilities for financing risks of public investment into specific projects.
Project Library BuildingSince 2015, governments at all levels have strengthened the building of public investment project libraries, and put them under tier-by-tier establishment, separate maintenance, and hierarchical management. With a three-tier architecture, the project libraries contain the project library of the fiscal department (consisting of the projects filed by the same-level government department), the project library of the government department (consisting of the projects filed by the same-level department and the subordinate units), and the project library of the grassroots unit (consisting of the projects initiated and implemented by this grassroots unit). All tiers of public investment project libraries are subject to open management (Figure 3.6). The management unit of the project library department can set up secondary projects as per working needs, file them in real time or on a regular basis, and report the summary to the fiscal department as alternative projects for the department’s public infrastructure budget. Full-cycle rolling management of public infrastructure investment projects is performed with the project libraries as the carrier, with the project implementation department organizing the normative documentation of the projects in the libraries, including the basis of project initiation, implementer, range of expenditure, implementation cycle, budget demand, feasibility study,
2 In 2018, local government bonds introduced the 15-year and 20-year products on the original basis.
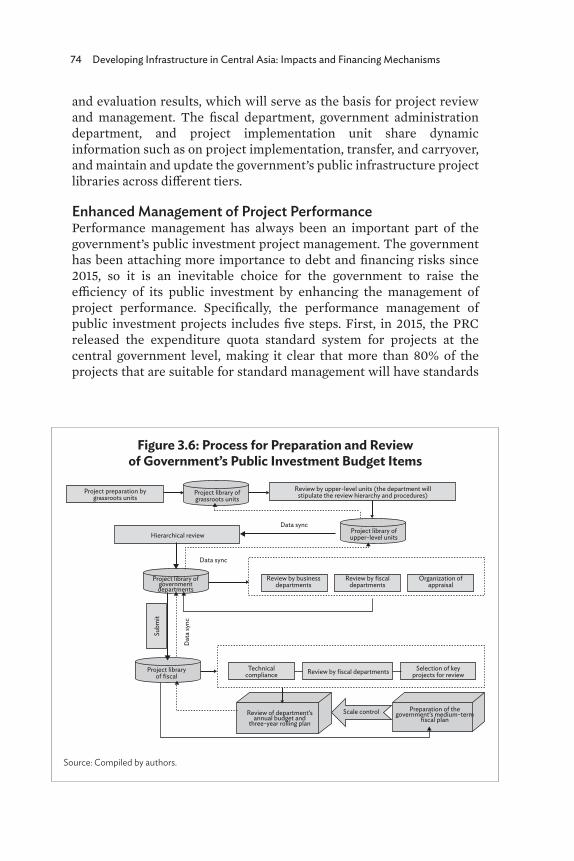
74 Developing Infrastructure in Central Asia: Impacts and Financing Mechanisms
and evaluation results, which will serve as the basis for project review and management. The fiscal department, government administration department, and project implementation unit share dynamic information such as on project implementation, transfer, and carryover, and maintain and update the government’s public infrastructure project libraries across different tiers.
Enhanced Management of Project PerformancePerformance management has always been an important part of the government’s public investment project management. The government has been attaching more importance to debt and financing risks since 2015, so it is an inevitable choice for the government to raise the efficiency of its public investment by enhancing the management of project performance. Specifically, the performance management of public investment projects includes five steps. First, in 2015, the PRC released the expenditure quota standard system for projects at the central government level, making it clear that more than 80% of the projects that are suitable for standard management will have standards
Figure 3.6: Process for Preparation and Review of Government’s Public Investment Budget Items
Source: Compiled by authors.
Data syncHierarchical review
Review by fiscal departments
Scale control
Data sync
Dat
a sy
nc
Subm
it
Project preparation bygrassroots units
Project library ofgrassroots units
Project library ofupper-level units
Project library of fiscal
Project library ofgovernment departments
Review of department’sannual budget and
three-year rolling plan
Preparation of thegovernment’s medium-term
fiscal plan
Organization of appraisal
Review by fiscaldepartments
Review by businessdepartments
Technicalcompliance
Selection of keyprojects for review
Review by upper-level units (the department will stipulate the review hierarchy and procedures)
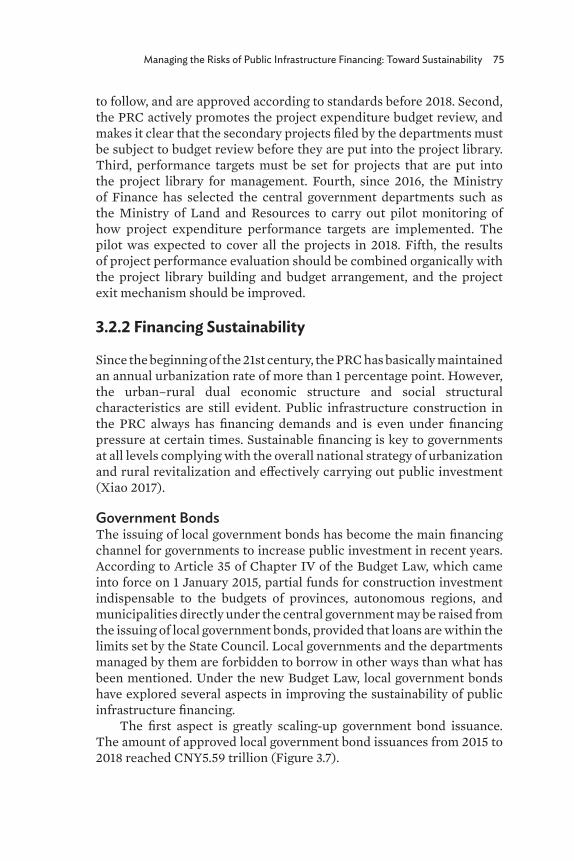
Managing the Risks of Public Infrastructure Financing: Toward Sustainability 75
to follow, and are approved according to standards before 2018. Second, the PRC actively promotes the project expenditure budget review, and makes it clear that the secondary projects filed by the departments must be subject to budget review before they are put into the project library. Third, performance targets must be set for projects that are put into the project library for management. Fourth, since 2016, the Ministry of Finance has selected the central government departments such as the Ministry of Land and Resources to carry out pilot monitoring of how project expenditure performance targets are implemented. The pilot was expected to cover all the projects in 2018. Fifth, the results of project performance evaluation should be combined organically with the project library building and budget arrangement, and the project exit mechanism should be improved.
3.2.2 Financing Sustainability
Since the beginning of the 21st century, the PRC has basically maintained an annual urbanization rate of more than 1 percentage point. However, the urban–rural dual economic structure and social structural characteristics are still evident. Public infrastructure construction in the PRC always has financing demands and is even under financing pressure at certain times. Sustainable financing is key to governments at all levels complying with the overall national strategy of urbanization and rural revitalization and effectively carrying out public investment (Xiao 2017).
Government BondsThe issuing of local government bonds has become the main financing channel for governments to increase public investment in recent years. According to Article 35 of Chapter IV of the Budget Law, which came into force on 1 January 2015, partial funds for construction investment indispensable to the budgets of provinces, autonomous regions, and municipalities directly under the central government may be raised from the issuing of local government bonds, provided that loans are within the limits set by the State Council. Local governments and the departments managed by them are forbidden to borrow in other ways than what has been mentioned. Under the new Budget Law, local government bonds have explored several aspects in improving the sustainability of public infrastructure financing.
The first aspect is greatly scaling-up government bond issuance. The amount of approved local government bond issuances from 2015 to 2018 reached CNY5.59 trillion (Figure 3.7).
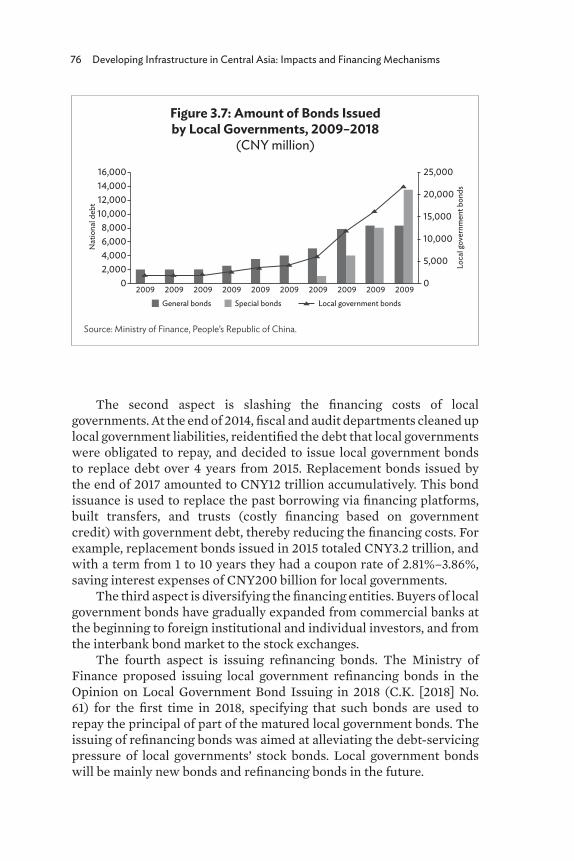
76 Developing Infrastructure in Central Asia: Impacts and Financing Mechanisms
The second aspect is slashing the financing costs of local governments. At the end of 2014, fiscal and audit departments cleaned up local government liabilities, reidentified the debt that local governments were obligated to repay, and decided to issue local government bonds to replace debt over 4 years from 2015. Replacement bonds issued by the end of 2017 amounted to CNY12 trillion accumulatively. This bond issuance is used to replace the past borrowing via financing platforms, built transfers, and trusts (costly financing based on government credit) with government debt, thereby reducing the financing costs. For example, replacement bonds issued in 2015 totaled CNY3.2 trillion, and with a term from 1 to 10 years they had a coupon rate of 2.81%–3.86%, saving interest expenses of CNY200 billion for local governments.
The third aspect is diversifying the financing entities. Buyers of local government bonds have gradually expanded from commercial banks at the beginning to foreign institutional and individual investors, and from the interbank bond market to the stock exchanges.
The fourth aspect is issuing refinancing bonds. The Ministry of Finance proposed issuing local government refinancing bonds in the Opinion on Local Government Bond Issuing in 2018 (C.K. [2018] No. 61) for the first time in 2018, specifying that such bonds are used to repay the principal of part of the matured local government bonds. The issuing of refinancing bonds was aimed at alleviating the debt-servicing pressure of local governments’ stock bonds. Local government bonds will be mainly new bonds and refinancing bonds in the future.
Figure 3.7: Amount of Bonds Issued by Local Governments, 2009–2018
(CNY million)
Source: Ministry of Finance, People’s Republic of China.
Nat
iona
l deb
t
Loca
l gov
ernm
ent b
onds
Special bonds Local government bondsGeneral bonds
2009 2009 2009 2009 2009 2009 2009 2009 2009 2009
12,00014,00016,000
10,0008,0006,0004,0002,000
0
5,000
10,000
15,000
20,000
25,000
0
Managing the Risks of Public Infrastructure Financing: Toward Sustainability 77
Public–Private Partnerships Since the introduction of the PPP model in 2014, social capital has played an active role in investment in public infrastructure and public services. However, under the constraints of strict supervision of local government financing risks, some local PPP projects went for large scale and fast speed, and sought quick success and instant benefits, and some PPP projects became a disguised method of financing by local governments. Consequently, fiscal risks, financial risks, and project risks were interwoven, typically manifested as PPP financing risks. In July 2017, the Ministry of Finance proposed the following “four don’ts” in the development of a PPP: do not solidify expenditure obligations, do not blur the utmost tolerance of finance, do not dilute the operational content, and do not generalize the scope of application. In November 2017, the Ministry of Finance issued the Circular on Regulating the Management of the Project Library of the PPP Integrated Information Platform, starting the campaign of cleaning up PPP projects (Figure 3.8). First, rigorous standards were being formulated for putting new projects into the library, prudently carrying out government-paid projects, and strictly controlling the three types of projects, i.e., projects that are not suitable for adopting the PPP model, projects whose preparatory work in the early stage is not in place, and projects whose effective payment mechanism has not been established. Second, the projects already in the library were being cleaned up, comprehensively verifying the information on the projects in the library, their implementation plan, value-for-money evaluation report, financial tolerance justification
Figure 3.8: Monthly Changes in the Number of Projects in the Management Library at Each Stage
Source: Quarterly Update on the Project Management Library of the PPP Integrated Information Platform, Issue 2 in 2018.
2017
–1
2017
–2
2017
–3
2017
–4
2017
–5
2017
–6
2017
–7
2017
–8
2017
–9
2017
–10
2017
–11
2017
–12
2018
–1
2018
–2
2018
–3
2018
–4
2018
–5
2018
–6
Procurement stagePreparation stage
12,00014,00016,000
10,0008,0006,0004,0002,000
4,479
1,4601,0082,013
4,605
1,5221,0472,036
5,008
1,7291,1292,150
5,390
1,8451,1962,349
5,667
1,9281,2792,460
5,916
2,0211,3482,550
6,138
2,1111,489
2,538
6,636
2,268
2,130
2,240
6,778
2,388
2,203
2,187
6,806
2,438
2,202
2,166
6,874
2,587
2,114
2,173
7,137
2,729
2,292
2,116
7,446
2,921
2,451
2,074
7,591
2,991
2,505
2,094
7,421
3,325
2,298
1,803
7,246
3,442
2,222
1,582
7,660
3,597
2,319
1,744
7,749
3,668
2,348
1,7330
Handover stageImplementation stage
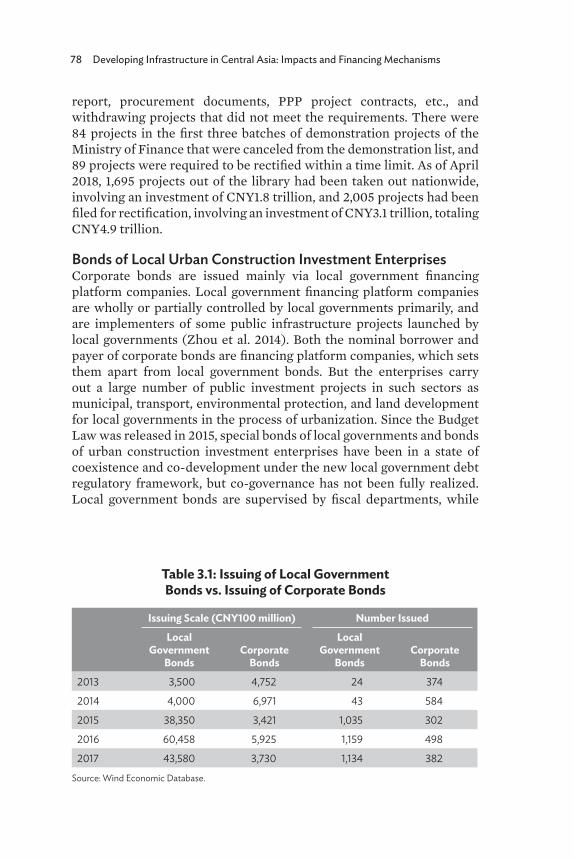
78 Developing Infrastructure in Central Asia: Impacts and Financing Mechanisms
report, procurement documents, PPP project contracts, etc., and withdrawing projects that did not meet the requirements. There were 84 projects in the first three batches of demonstration projects of the Ministry of Finance that were canceled from the demonstration list, and 89 projects were required to be rectified within a time limit. As of April 2018, 1,695 projects out of the library had been taken out nationwide, involving an investment of CNY1.8 trillion, and 2,005 projects had been filed for rectification, involving an investment of CNY3.1 trillion, totaling CNY4.9 trillion.
Bonds of Local Urban Construction Investment EnterprisesCorporate bonds are issued mainly via local government financing platform companies. Local government financing platform companies are wholly or partially controlled by local governments primarily, and are implementers of some public infrastructure projects launched by local governments (Zhou et al. 2014). Both the nominal borrower and payer of corporate bonds are financing platform companies, which sets them apart from local government bonds. But the enterprises carry out a large number of public investment projects in such sectors as municipal, transport, environmental protection, and land development for local governments in the process of urbanization. Since the Budget Law was released in 2015, special bonds of local governments and bonds of urban construction investment enterprises have been in a state of coexistence and co-development under the new local government debt regulatory framework, but co-governance has not been fully realized. Local government bonds are supervised by fiscal departments, while
Table 3.1: Issuing of Local Government Bonds vs. Issuing of Corporate Bonds
Issuing Scale (CNY100 million) Number IssuedLocal
Government Bonds
Corporate Bonds
Local Government
BondsCorporate
Bonds2013 3,500 4,752 24 374
2014 4,000 6,971 43 584
2015 38,350 3,421 1,035 302
2016 60,458 5,925 1,159 498
2017 43,580 3,730 1,134 382
Source: Wind Economic Database.
Managing the Risks of Public Infrastructure Financing: Toward Sustainability 79
corporate bonds are supervised by the National Development and Reform Commission. Before 2015, local government bonds and corporate bonds each raised similar amounts of money, but after 2015, the issuing scale of local government bonds outstripped that of corporate bonds (Table 3.1). This reflects the fact that after the new Budget Law became effective, the channel whereby local governments issued bonds via financing platform companies was tightened by the regulator, and the financing of local governments for public infrastructure gradually returned to the fiscal channel.
3.2.3 Fiscal Sustainability
The discussion on fiscal sustainability highlights a comprehensive review of fiscal operation stability from the medium- and long-term perspective instead of focusing on the impact of “revenue in a given fiscal year coming below expenditure.” Since 2015, regulatory constraints have been heightened upon local government debt at the core, propelling the sustained, stable, and healthy operation of public finance.
Bringing Government’s Explicit Debt Financing into BudgetThe government’s budget management has experienced three expansions of budgetary revenue and expenditure, including the inclusion of extra-budgetary revenue and expenditure, land sale revenue, and government financing into budget. The third expansion that took place in 2015 was different from the prior two expansions in that it was based on legal constraints. Prior to 2015, local governments could launch debt financing through multiple channels and in various forms. In 2015, the revised Budget Law was implemented. Accordingly, a local government’s explicit debt is strictly defined as a local government bond, and the income from this local government bond should be included in the general public budget and the government fund budget. This change is of epoch-making significance, which means that local governments’ explicit debt financing has taken a solid step toward openness and transparency in terms of both stock and increment, and the debt repayment plan and the source of repayment funds under budget management have become more clear and pragmatic.
Defining the Reflection of Debt Interest Expenses in Budget Line ItemsWhen all explicit debt of local governments was included in the budget in 2015, the central finance department released a specific policy to urge that the central government and local governments would seek a common ground in preventing debt risks, including defining that the
80 Developing Infrastructure in Central Asia: Impacts and Financing Mechanisms
debt’s interest expenses should be reflected in the budget line items. In contrast to the repayment of bond principal, interest payments must be recognized as expenses in the budget line items. In doing so, the government must arrange the funding for interest payment in the budget beforehand instead of paying the interest via “refinancing.” Thus, local governments must make arrangements in advance for paying interest expenses just like for spending on education, medical care, agriculture, and administration in their budget.
Changing Main Funding Source of Debt Repayment from Tax Revenue to Project IncomeAfter 2015, the issuing structure of local government bonds changed significantly, with the issuing amount of local governments’ special bonds climbing from zero in 2014 to CNY1.35 trillion in 2018, accounting for 61.93% of the amount of new bonds in the year. The amount of new bond issuance by local governments in 2018 outnumbered that in 2014 by CNY1.78 trillion or 545%, of which the contribution rate of special bond growth was as high as 75.8%. The sharp increase in the proportion of special bonds has shifted local governments’ reliance for debt repayment from tax revenue in the general public budget to the operating income of projects. In 2017, the Ministry of Finance introduced project income bonds into the series of local government special bonds, guiding public infrastructure financing, operating costs, and project income to achieve self-balance within the projects and reduce reliance on repayment with budgetary funds. After the launch of project income bonds, the number of issued products grew rapidly from three in 2017 to more than 20 in 2018, making it the most promising bond variety among new local government bonds.
Making Clear Fiscal Expenditure ResponsibilitiesFiscal expenditure responsibility refers to fiscal commitment to future expenditure. Under the traditional budget management system, the government budget is mainly prepared on an annual basis. The fiscal expenditure responsibility is more reflected in legally linking the key spending on education, science and technology, agriculture, culture, etc. with fiscal revenue and expenditure, or the scale of gross domestic product, thereby forming a rigid segmentation of budget expenditure in the future. In recent years, with the introduction of PPPs, government investment funds, and other public infrastructure investment and financing models, fiscal expenditure responsibilities have seen the addition of expenditure commitment for cross-year public investment projects. From a regulatory perspective, although the expenditure committed under a PPP or the loss arising from external investment is unequal to government debt, the
Managing the Risks of Public Infrastructure Financing: Toward Sustainability 81
rapid expansion of fiscal expenditure responsibilities will undoubtedly increase the government’s payment pressure, and eventually lead to the government’s default or indebtedness, making the government’s public infrastructure investment unsustainable. This is the internal logic that regulators have paid close attention to government’s expenditure responsibility in recent years.
3.2.4 Institutional Sustainability
The risk factors affecting the government’s public infrastructure financing are multidimensional. Policies and institutions can be leveraged to manage the risks of financing, with the former often focusing on resolving specific issues and their effects more directly and concretely, and the latter often emphasizing resolving fundamental issues, with their influence being more substantial and far-reaching. Over the past few years, the PRC has adopted a “two-pronged” approach to risk management of public infrastructure financing: firstly, releasing risk prevention and control policies to address outstanding and emerging issues; and secondly, streamlining deep-seated institutional and mechanical issues on the basis of such outstanding and emerging issues, and exploring the top-level designs of some basic institutions in a top–down manner in order to enhance the capability of preventing public investment and financing risks.
Reforming Fiscal SystemAs shown from the early and middle stage of the government’s management of public infrastructure financing risks, public infrastructure construction demand drove government financing, and under financing pressure local governments had to try every means possible to finance. Consequently, frequent problems were seen in government financing, and almost all financing tools had their weaknesses. As a Chinese saying goes: “solve one problem only to find another cropping up.” Under such circumstances, the government has to solve the deep-seated problems. Talking about risk management of financing is too narrow, but the fiscal system reform marks a breakthrough in the attempt to resolve relevant problems. In 2016, the State Council issued the Guiding Opinions on Advancing the Reform of the Division of Financial Powers and Expenditure Responsibilities between the Central and the Local Governments, deciding to first launch such a division in national defense and foreign affairs fields in 2016, to break the ground in basic public service fields such as education, health care, environmental protection, and transportation in 2017–2018, and to basically complete such a division in major fields, streamline the
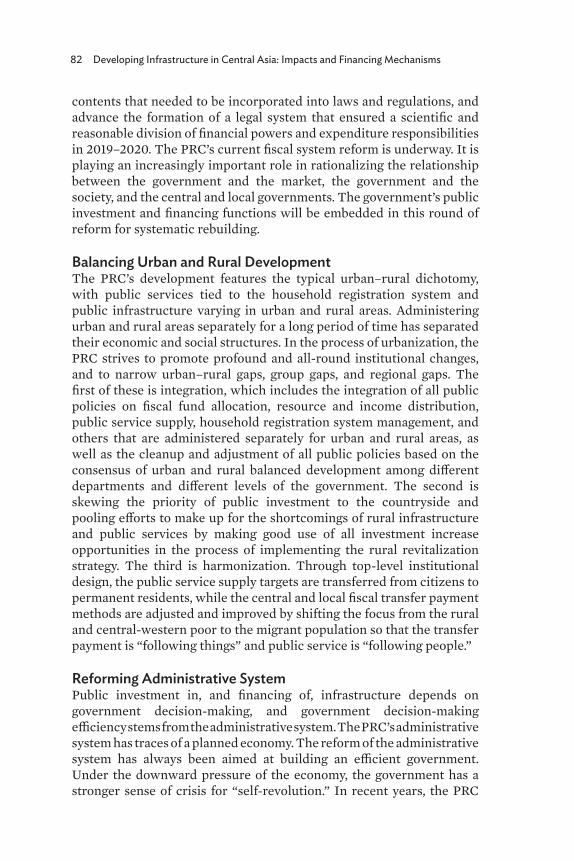
82 Developing Infrastructure in Central Asia: Impacts and Financing Mechanisms
contents that needed to be incorporated into laws and regulations, and advance the formation of a legal system that ensured a scientific and reasonable division of financial powers and expenditure responsibilities in 2019–2020. The PRC’s current fiscal system reform is underway. It is playing an increasingly important role in rationalizing the relationship between the government and the market, the government and the society, and the central and local governments. The government’s public investment and financing functions will be embedded in this round of reform for systematic rebuilding.
Balancing Urban and Rural Development The PRC’s development features the typical urban–rural dichotomy, with public services tied to the household registration system and public infrastructure varying in urban and rural areas. Administering urban and rural areas separately for a long period of time has separated their economic and social structures. In the process of urbanization, the PRC strives to promote profound and all-round institutional changes, and to narrow urban–rural gaps, group gaps, and regional gaps. The first of these is integration, which includes the integration of all public policies on fiscal fund allocation, resource and income distribution, public service supply, household registration system management, and others that are administered separately for urban and rural areas, as well as the cleanup and adjustment of all public policies based on the consensus of urban and rural balanced development among different departments and different levels of the government. The second is skewing the priority of public investment to the countryside and pooling efforts to make up for the shortcomings of rural infrastructure and public services by making good use of all investment increase opportunities in the process of implementing the rural revitalization strategy. The third is harmonization. Through top-level institutional design, the public service supply targets are transferred from citizens to permanent residents, while the central and local fiscal transfer payment methods are adjusted and improved by shifting the focus from the rural and central-western poor to the migrant population so that the transfer payment is “following things” and public service is “following people.”
Reforming Administrative SystemPublic investment in, and financing of, infrastructure depends on government decision-making, and government decision-making efficiency stems from the administrative system. The PRC’s administrative system has traces of a planned economy. The reform of the administrative system has always been aimed at building an efficient government. Under the downward pressure of the economy, the government has a stronger sense of crisis for “self-revolution.” In recent years, the PRC
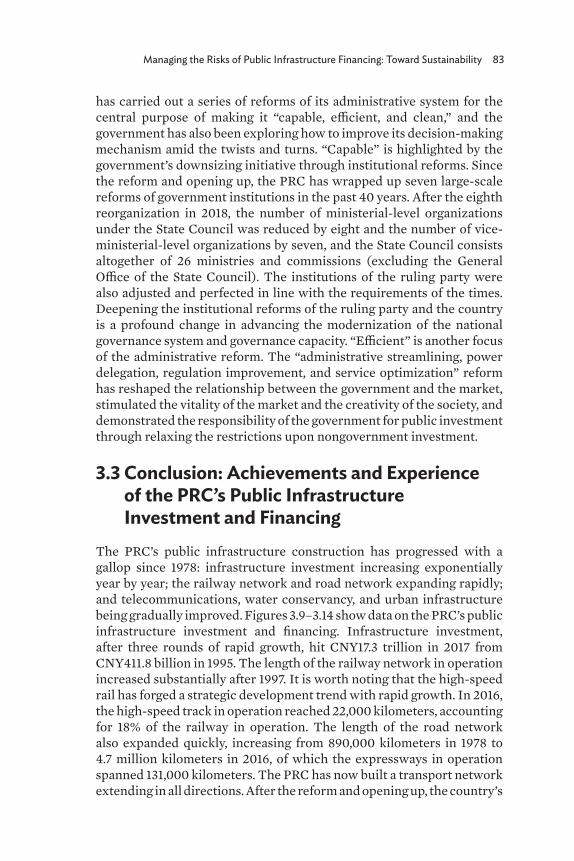
Managing the Risks of Public Infrastructure Financing: Toward Sustainability 83
has carried out a series of reforms of its administrative system for the central purpose of making it “capable, efficient, and clean,” and the government has also been exploring how to improve its decision-making mechanism amid the twists and turns. “Capable” is highlighted by the government’s downsizing initiative through institutional reforms. Since the reform and opening up, the PRC has wrapped up seven large-scale reforms of government institutions in the past 40 years. After the eighth reorganization in 2018, the number of ministerial-level organizations under the State Council was reduced by eight and the number of vice-ministerial-level organizations by seven, and the State Council consists altogether of 26 ministries and commissions (excluding the General Office of the State Council). The institutions of the ruling party were also adjusted and perfected in line with the requirements of the times. Deepening the institutional reforms of the ruling party and the country is a profound change in advancing the modernization of the national governance system and governance capacity. “Efficient” is another focus of the administrative reform. The “administrative streamlining, power delegation, regulation improvement, and service optimization” reform has reshaped the relationship between the government and the market, stimulated the vitality of the market and the creativity of the society, and demonstrated the responsibility of the government for public investment through relaxing the restrictions upon nongovernment investment.
3.3 Conclusion: Achievements and Experience of the PRC’s Public Infrastructure Investment and Financing
The PRC’s public infrastructure construction has progressed with a gallop since 1978: infrastructure investment increasing exponentially year by year; the railway network and road network expanding rapidly; and telecommunications, water conservancy, and urban infrastructure being gradually improved. Figures 3.9–3.14 show data on the PRC’s public infrastructure investment and financing. Infrastructure investment, after three rounds of rapid growth, hit CNY17.3 trillion in 2017 from CNY411.8 billion in 1995. The length of the railway network in operation increased substantially after 1997. It is worth noting that the high-speed rail has forged a strategic development trend with rapid growth. In 2016, the high-speed track in operation reached 22,000 kilometers, accounting for 18% of the railway in operation. The length of the road network also expanded quickly, increasing from 890,000 kilometers in 1978 to 4.7 million kilometers in 2016, of which the expressways in operation spanned 131,000 kilometers. The PRC has now built a transport network extending in all directions. After the reform and opening up, the country’s
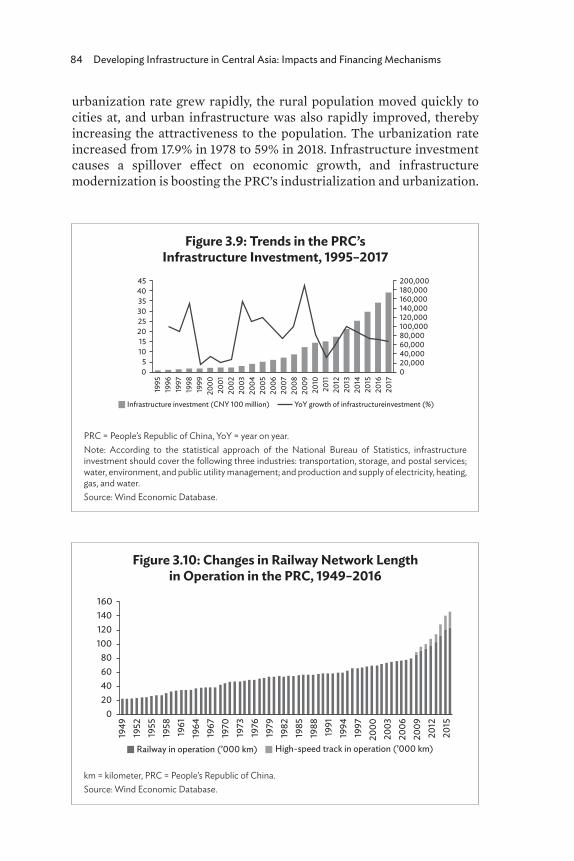
84 Developing Infrastructure in Central Asia: Impacts and Financing Mechanisms
urbanization rate grew rapidly, the rural population moved quickly to cities at, and urban infrastructure was also rapidly improved, thereby increasing the attractiveness to the population. The urbanization rate increased from 17.9% in 1978 to 59% in 2018. Infrastructure investment causes a spillover effect on economic growth, and infrastructure modernization is boosting the PRC’s industrialization and urbanization.
Figure 3.9: Trends in the PRC’s Infrastructure Investment, 1995–2017
PRC = People’s Republic of China, YoY = year on year. Note: According to the statistical approach of the National Bureau of Statistics, infrastructure investment should cover the following three industries: transportation, storage, and postal services; water, environment, and public utility management; and production and supply of electricity, heating, gas, and water.Source: Wind Economic Database.
1995
1996
1997
1998
1999
2000
2001
2002
2003
2004
2005
2006
2007
2008
2009
2010
2011
2012
2013
2014
2015
2016
2017
YoY growth of infrastructureinvestment (%)Infrastructure investment (CNY 100 million)
30354045
25201510
50
160,000180,000200,000
140,000120,000100,00080,00060,00040,00020,0000
Figure 3.10: Changes in Railway Network Length in Operation in the PRC, 1949–2016
km = kilometer, PRC = People’s Republic of China.Source: Wind Economic Database.
1949
1952
1955
1958
1961
1964
1967
1970
1973
1976
1979
1982
1985
1988
1991
1994
1997
2000
2003
2006
2009
2012
2015
120140160
10080604020
0
Railway in operation (’000 km) High-speed track in operation (’000 km)
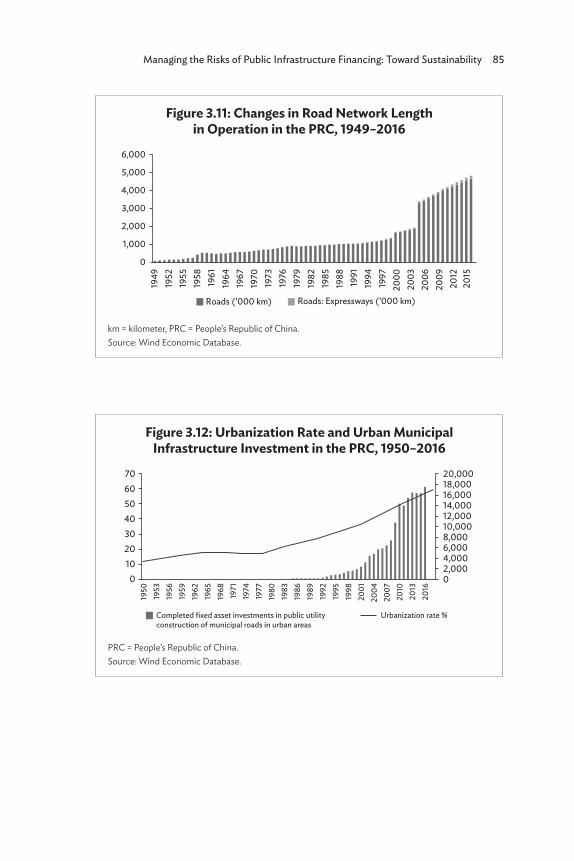
Managing the Risks of Public Infrastructure Financing: Toward Sustainability 85
Figure 3.11: Changes in Road Network Length in Operation in the PRC, 1949–2016
km = kilometer, PRC = People’s Republic of China.Source: Wind Economic Database.
1949
1952
1955
1958
1961
1964
1967
1970
1973
1976
1979
1982
1985
1988
1991
1994
1997
2000
2003
2006
2009
2012
2015
6,000
5,000
4,000
3,000
2,000
1,000
0
Roads (’000 km) Roads: Expressways (’000 km)
Figure 3.12: Urbanization Rate and Urban Municipal Infrastructure Investment in the PRC, 1950–2016
PRC = People’s Republic of China.Source: Wind Economic Database.
Urbanization rate %Completed fixed asset investments in public utilityconstruction of municipal roads in urban areas
1950
1953
1956
1959
1962
1965
1968
1971
1974
1977
1980
1983
1986
1989
1992
1995
1998
2001
2004
2007
2010
2013
2016
6070
50403020100
2,0004,0006,0008,00010,00012,000
16,00014,000
18,00020,000
0
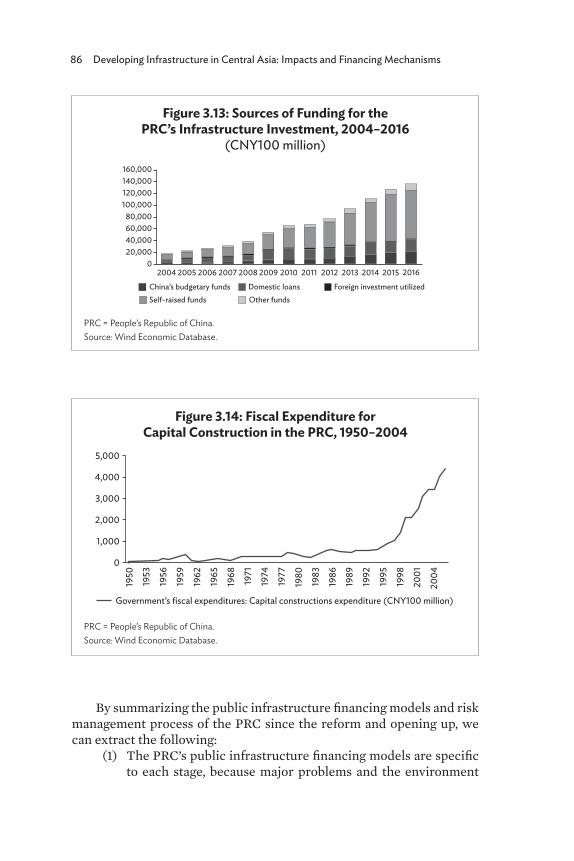
86 Developing Infrastructure in Central Asia: Impacts and Financing Mechanisms
Figure 3.13: Sources of Funding for the PRC’s Infrastructure Investment, 2004–2016
(CNY100 million)
PRC = People’s Republic of China.Source: Wind Economic Database.
Self-raised fundsChina’s budgetary funds
120,000140,000160,000
100,00080,00060,00040,00020,000
2004 2005 2006 2007 2008 2009 2010 2011 2012 2013 2014 2015 20160
Other fundsDomestic loans Foreign investment utilized
Figure 3.14: Fiscal Expenditure for Capital Construction in the PRC, 1950–2004
PRC = People’s Republic of China.Source: Wind Economic Database.
Government’s fiscal expenditures: Capital constructions expenditure (CNY100 million)
1950
1953
1956
1959
1962
1965
1968
1971
1974
1977
1980
1983
1986
1989
1992
1995
1998
2001
2004
5,000
4,000
3,000
2,000
1,000
0
By summarizing the public infrastructure financing models and risk management process of the PRC since the reform and opening up, we can extract the following:
(1) The PRC’s public infrastructure financing models are specific to each stage, because major problems and the environment
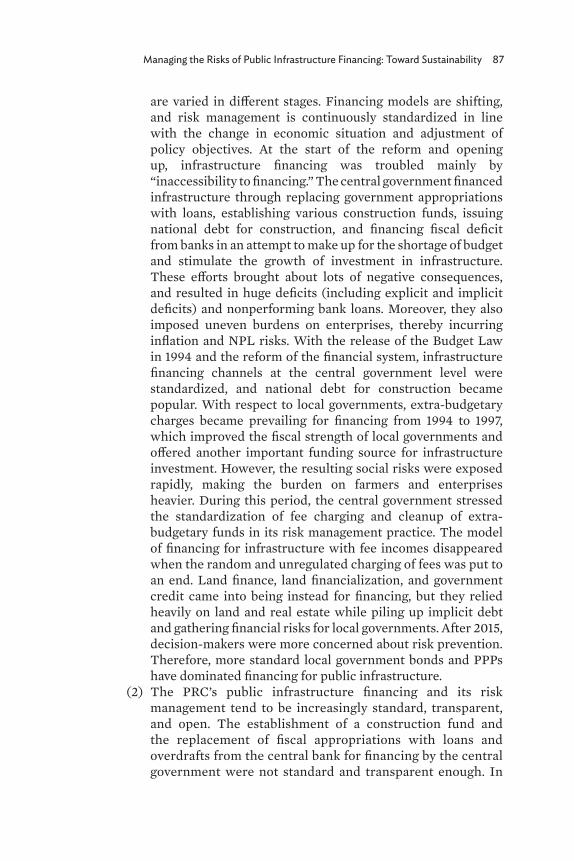
Managing the Risks of Public Infrastructure Financing: Toward Sustainability 87
are varied in different stages. Financing models are shifting, and risk management is continuously standardized in line with the change in economic situation and adjustment of policy objectives. At the start of the reform and opening up, infrastructure financing was troubled mainly by “inaccessibility to financing.” The central government financed infrastructure through replacing government appropriations with loans, establishing various construction funds, issuing national debt for construction, and financing fiscal deficit from banks in an attempt to make up for the shortage of budget and stimulate the growth of investment in infrastructure. These efforts brought about lots of negative consequences, and resulted in huge deficits (including explicit and implicit deficits) and nonperforming bank loans. Moreover, they also imposed uneven burdens on enterprises, thereby incurring inflation and NPL risks. With the release of the Budget Law in 1994 and the reform of the financial system, infrastructure financing channels at the central government level were standardized, and national debt for construction became popular. With respect to local governments, extra-budgetary charges became prevailing for financing from 1994 to 1997, which improved the fiscal strength of local governments and offered another important funding source for infrastructure investment. However, the resulting social risks were exposed rapidly, making the burden on farmers and enterprises heavier. During this period, the central government stressed the standardization of fee charging and cleanup of extra-budgetary funds in its risk management practice. The model of financing for infrastructure with fee incomes disappeared when the random and unregulated charging of fees was put to an end. Land finance, land financialization, and government credit came into being instead for financing, but they relied heavily on land and real estate while piling up implicit debt and gathering financial risks for local governments. After 2015, decision-makers were more concerned about risk prevention. Therefore, more standard local government bonds and PPPs have dominated financing for public infrastructure.
(2) The PRC’s public infrastructure financing and its risk management tend to be increasingly standard, transparent, and open. The establishment of a construction fund and the replacement of fiscal appropriations with loans and overdrafts from the central bank for financing by the central government were not standard and transparent enough. In
88 Developing Infrastructure in Central Asia: Impacts and Financing Mechanisms
spite of the big leeway in the financial policy, the central government was incapable of identifying, controlling, and managing risks. Issuing long-term national debt for construction as a financing alternative involved standard and open operating procedures, thereby significantly increasing the financing transparency and rapidly enhancing the risk control capability. At the local government level, some of the fee items were standardized, and the others were included in the government fund budget, which was transparent and open. Land finance, land financial, and government credit-based financing, by hiding debt risks, accumulated a large amount of implicit debt for local governments. After 2015, while pursuing governance-oriented risk management of public infrastructure investment, the central government reasonably increased the debt volume of local governments and tried to root out their disorderly borrowing, and thus discovered a more standard, transparent, and open financing model: local government bond issuing and PPPs.
(3) The PRC’s public infrastructure financing risk management has become systematic. From individual infrastructure projects to financing platform companies, and from local governments to the central government, risk management focuses on multilevel financing sustainability. At the single-project level, the capability of controlling financing risks of single projects is strengthened through control of the project implementation cycle, delicacy management, project library development, and performance management enhancement. At the financing platform company level, efforts are made to standardize high-risk financing channels such as shadow banking and promote market-oriented transformation in order to prevent and control financing risks and ensure the sustainability of financing. At the level of local and central governments, financing risk management is carried out through the issuance of government bonds, reduction of financing costs, and diversification of financing entities toward fiscal sustainability. In addition, at the institutional level, the sustainability of infrastructure financing all over the PRC is further guaranteed through fiscal system reform, the balancing of urban and rural reform, and administrative system reform.
Managing the Risks of Public Infrastructure Financing: Toward Sustainability 89
ReferencesCui, G. 2009. Research on Financing Models of Urban Infrastructure
Construction in China. Tianjin University of Finance and Economics.He, R. 2001. Status Quo of Chinese Government’s Revenue System,
Issues and Countermeasures. Southwestern University of Finance and Economics.
Hu, Y. 2006. Research on Investment Control Mechanisms of Major Engineering Projects Based on the Three Gorges Project. p. 71, PhD thesis of Wuhan University of Technology.
Liu, S. 2012. Risks and Reforms of Land-based Development Model. The International Economic Review. 2. pp. 92–109.
____. 2018. Land Institutional Reform and Structural Transformation in China: An Economic Interpretation for China’s 40 Years Development Experience. The China Land Sciences. 32 (1). pp. 1–10.
Liu, S., Y. Shi, and J. Wu. 2017. Malfunction of Public Debt Management Model under Institutionalism – A Reflection from the Public Risk Perspective. The Management World. 1. pp. 5–16.
Liu, S., and A. Hu. 2010. Test on the Externality of Infrastructure in China: 1988–2007. The Economic Research Journal. 3. pp. 4–15.
Liu, X., X. Zhang, and W. Fang. 2015. Urban–Rural Income Distribution Effect of Infrastructure: From the Perspective of Labor Transfer. The World Economy. 3. pp. 145–70.
Peng, F., Z. Ouyang, K. Zhan et al. 2017. Is China Falling into the Debt Trap? Theoretical Model and Empirical Evidence. The Journal of Financial Research. 2. pp. 70–83.
Xiao, J. 2017. Accelerate the Establishment of a Modern Fiscal System. The People’s Daily. 20 December.
Zhang, J., Y. Gao, Y. Fu et al. 2007. Why China Has Good Infrastructure?. The Economic Research Journal. 3. pp. 4–19.
Zheng, S., L. Zhou, and W. He. 2014. Telecommunications Infrastructure and China’s Economic Growth. The Economic Research Journal. 49 (5). pp. 77–90.
Zheng, S., W. Sun, J. Wu et al. 2014. Infrastructure Investment, Land Leasing and Real Estate Price: A Unique Financing and Investment Channel for Urban Development in Chinese Cities. The Economic Research Journal. 8. pp. 14–27.
Zhou, X., W. Li, N. Liu et al. 2014. Research on Local Debt Management and Financing Regulation. The Journal of Financial Research. 10. pp. 34–49.
90
4Public–Private Partnerships
in Georgia and Impact Assessment of Infrastructure
Nestan Devidze
4.1 Introduction
4.1.1 Increasing Need for Private Investments in Infrastructure
Georgia’s strategic location and ample natural resources create huge possibilities for its economic development, yet the country’s economic growth cannot keep pace with its growth ambitions. The average annual gross domestic product (GDP) growth between 2015 and 2017 fell to 3.5%, while the average growth in 2010–2014 was 5.6% (Ministry of Finance of Georgia 2018), the decline being mainly due to external factors. However, according to the Global Competitiveness Report 2017–2018, an inadequate supply of infrastructure is one of the main factors hindering economic growth. Georgia scored 4.2 out of 7 for the “adequate supply of infrastructure” and ranked 69th among 137 economies (World Economic Forum 2018). Although the ranking had improved from 75th in the preceding year, the country still faces substantial challenges due to the insufficient level of infrastructure. For instance, the lack of adequate roads blocks opportunities for one of the most rapidly growing sectors in the country—tourism. Likewise, access to a water supply in rural areas demolishes opportunities for agricultural development.
Georgia has taken steps to improve its business environment, with considerable changes in the local regulatory framework in various areas in 2016–2017, including a tax reform that placed Georgia high on the list of countries with the most liberal tax policies. Nevertheless, proper
Public–Private Partnerships in Georgia and Impact Assessment of Infrastructure 91
infrastructure is one of the most important conditions to make the country attractive to investors and to utilize its full economic potential. To bring the infrastructure to the desired level of development, one of the most challenging factors is financing. The main sources for infrastructure project financing have been donor financing and concessional lending. However, the shrinking fiscal gap creates a need for the active involvement of the private sector in infrastructure financing.
The Government of Georgia has outlined the importance of greater inclusion of the private sector in infrastructure financing and expressed its intention to promote infrastructure financing through public–private partnerships (PPPs). For the successful development of PPPs, it is crucial to ensure that the government has the capability to procure and manage such projects and to create a clear and transparent regulatory framework.
The government has taken considerable measures to create a PPP-friendly environment. With the support of multilateral development banks, it has established a PPP regulatory framework, followed with a PPP law and extensive secondary legislation. A dedicated PPP unit is in the process of formation. Despite these important developments, the country still faces numerous challenges to bring PPPs to the desired scale. One of the main constraints hindering private investors in infrastructure is the low rate of return of infrastructure projects; this is not only a national but also a global problem. The major source of income for most infrastructure projects is fees from the users. At the same time, the fact that infrastructure has to be accessible to the public sets bounds to the tariffs, therefore limiting the return to private investors. To address the problem, Yoshino and Abidhadjaev (2017b) presented an approach to measure the impact of infrastructure on public finance, based on which the government can decide to implement an incremental increase of the tax revenues to inject viability gap funding into the infrastructure investors.
4.1.2 Scope of the Study
The research study therefore sought to explore and investigate the following. Section 4.2 presents a case study measuring the impact of Kutaisi International Airport on the tax revenues of the surrounding regions—Imereti and two other regions in western Georgia that have received treatment from the airport. We use a modified difference-in-differences (DiD) method to measure the increase in the revenues derived from the total taxes and then break the revenues down into business taxes and property taxes. Furthermore, we discuss a potential way for the government to return the incremental revenue to the
92 Developing Infrastructure in Central Asia: Impacts and Financing Mechanisms
infrastructure investors. Section 4.3 analyzes the major points related to infrastructure financing in Georgia: the current state of infrastructure financing, barriers, incentives, and legislative framework. Section 4.4 provides a detailed overview of the state of PPPs in Georgia with the following aims:
• To analyze the current state of PPPs in infrastructure provision, including a review of ongoing PPP projects and the challenges and opportunities facing PPPs.
• To assess the newly established PPP law together with subsequent secondary legislation.
• To provide policy recommendations for further promoting PPPs for infrastructure projects with the aim of achieving a pipeline of sustainable and effective projects.
The final section provides a concluding statement.
4.2 Evaluation of the Effect of Infrastructure on Public Finance: The Case of Kutaisi International Airport in Georgia
Georgia is highly reliant on transportation for two reasons: it is a transit country and tourism has been one of the main contributors to the growth of the economy in previous years. Therefore, it is crucial for the country to have the proper infrastructure for transportation and logistics.
While focusing on the development of innovative methods to fill the infrastructure financing gap, assessing development outcomes has become essential for multiple reasons. For developing countries such as Georgia, the budget constraints on infrastructure spending are especially tight. Considering the underdeveloped capital market, the government has to request support from multilateral development banks or donor organizations. To evaluate and present the future impact of a proposed infrastructure project, the government needs to prepare itself with the tools to assess the impact accurately (Yoshino and Pontines 2015).
Due to the shrinking fiscal gap, many countries, including Georgia, are not able to increase their public debt; hence, the government has emphasized the need for greater involvement of the private sector in infrastructure financing through PPPs. One of the major challenges to attract private investment in infrastructure is the low rate of return of public infrastructure projects (Yoshino and Abidhadjaev 2017a). The instrument for the government to fill the viability gap is an additional return that it can guarantee to the private sector in the form of capital grants or various types of subsidy. For the government to make a
Public–Private Partnerships in Georgia and Impact Assessment of Infrastructure 93
sensible decision regarding viability gap funding, it requires tools and methodologies to assess the impact of infrastructure provisioning on public finance.
The revenues that infrastructure projects generate are not limited to their operational revenues. Upgraded infrastructure stimulates the economy and creates new employment and new opportunities for local enterprises. After accurately measuring the spillover effects of an infrastructure project, the government may take the decision to return part of the tax revenue to private investors. This kind of approach will raise the rate of return and make infrastructure investments more attractive to private investors (Yoshino and Abidhadjaev 2017a).
In this chapter, we present a microeconomic case study that examined the impact of Kutaisi International Airport on the public finance of the region in which it is located and two neighboring regions. The expectation is that the provision of the new infrastructure in the form of an international airport has increased the flow of tourists, prompting an improvement in economic performance. After the opening of the airport, the number of tourists visiting Kutaisi and its surrounding areas increased significantly. Consequently, it stimulated overall economic activity, with hotels, restaurants, and shops experiencing high growth. The revenues of the local tourist attractions have grown as well. Furthermore, the increased demand for transportation has created new employment opportunities for locals.
We used a modified DiD method to measure the increase in the revenues derived from the total taxes and then broke the revenues down into business taxes and property taxes.
4.2.1 Kutaisi International Airport
Kutaisi International Airport is the first international airport in the region of Imereti and the second international airport in West Georgia. After undergoing rebuilding in 2012, the airport started to attract a growing number of flights. The airport is fully owned by the state-owned United Georgian Airports, and the state budget fully financed the project of renovating the airport at a total cost of nearly $26.5 million. The focus of Kutaisi International Airport is on offering cost-efficient airline services. Its strategic location makes it an alternative airport for the region, within 200 kilometers from Tbilisi and connected to Armenia, Azerbaijan, the Russian Federation, and Turkey within a radius of 300 kilometers. As of 2017, the airport has served more than 400,000 passengers, and the number of passengers has increased rapidly since its reopening in 2012. Currently, the airport serves five airlines with 18 destinations and has high growth prospects with the
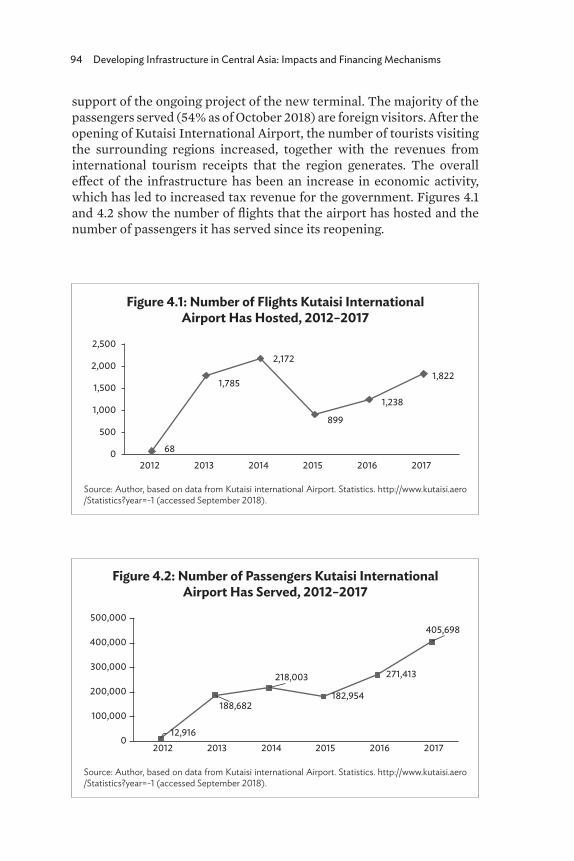
94 Developing Infrastructure in Central Asia: Impacts and Financing Mechanisms
support of the ongoing project of the new terminal. The majority of the passengers served (54% as of October 2018) are foreign visitors. After the opening of Kutaisi International Airport, the number of tourists visiting the surrounding regions increased, together with the revenues from international tourism receipts that the region generates. The overall effect of the infrastructure has been an increase in economic activity, which has led to increased tax revenue for the government. Figures 4.1 and 4.2 show the number of flights that the airport has hosted and the number of passengers it has served since its reopening.
Figure 4.1: Number of Flights Kutaisi International Airport Has Hosted, 2012–2017
Source: Author, based on data from Kutaisi international Airport. Statistics. http://www.kutaisi.aero /Statistics?year=-1 (accessed September 2018).
68
1,785
2,172
899
1,238
1,822
0
500
1,000
1,500
2,000
2,500
2012 2013 2014 2015 2016 2017
Figure 4.2: Number of Passengers Kutaisi International Airport Has Served, 2012–2017
Source: Author, based on data from Kutaisi international Airport. Statistics. http://www.kutaisi.aero /Statistics?year=-1 (accessed September 2018).
12,916
188,682
218,003
182,954
271,413
405,698
0
100,000
200,000
300,000
400,000
500,000
2012 2013 2014 2015 2016 2017
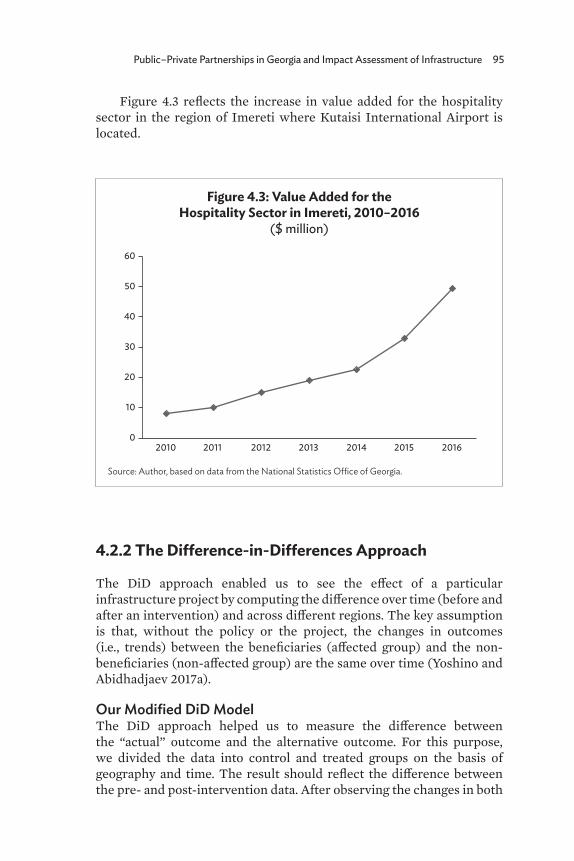
Public–Private Partnerships in Georgia and Impact Assessment of Infrastructure 95
Figure 4.3 reflects the increase in value added for the hospitality sector in the region of Imereti where Kutaisi International Airport is located.
4.2.2 The Difference-in-Differences Approach
The DiD approach enabled us to see the effect of a particular infrastructure project by computing the difference over time (before and after an intervention) and across different regions. The key assumption is that, without the policy or the project, the changes in outcomes (i.e., trends) between the beneficiaries (affected group) and the non-beneficiaries (non-affected group) are the same over time (Yoshino and Abidhadjaev 2017a).
Our Modified DiD ModelThe DiD approach helped us to measure the difference between the “actual” outcome and the alternative outcome. For this purpose, we divided the data into control and treated groups on the basis of geography and time. The result should reflect the difference between the pre- and post-intervention data. After observing the changes in both
Figure 4.3: Value Added for the Hospitality Sector in Imereti, 2010–2016
($ million)
Source: Author, based on data from the National Statistics Office of Georgia.
0
10
20
30
40
50
60
2010 2011 2012 2013 2014 2015 2016
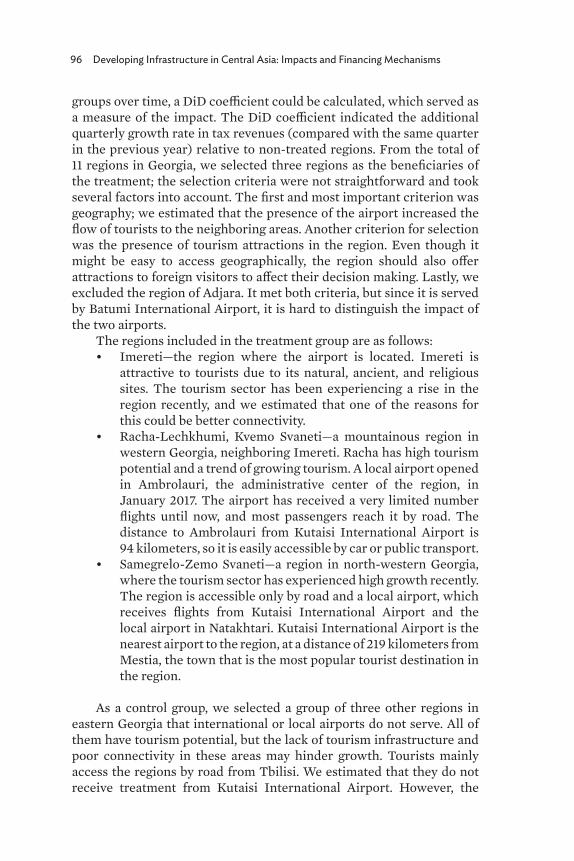
96 Developing Infrastructure in Central Asia: Impacts and Financing Mechanisms
groups over time, a DiD coefficient could be calculated, which served as a measure of the impact. The DiD coefficient indicated the additional quarterly growth rate in tax revenues (compared with the same quarter in the previous year) relative to non-treated regions. From the total of 11 regions in Georgia, we selected three regions as the beneficiaries of the treatment; the selection criteria were not straightforward and took several factors into account. The first and most important criterion was geography; we estimated that the presence of the airport increased the flow of tourists to the neighboring areas. Another criterion for selection was the presence of tourism attractions in the region. Even though it might be easy to access geographically, the region should also offer attractions to foreign visitors to affect their decision making. Lastly, we excluded the region of Adjara. It met both criteria, but since it is served by Batumi International Airport, it is hard to distinguish the impact of the two airports.
The regions included in the treatment group are as follows:• Imereti—the region where the airport is located. Imereti is
attractive to tourists due to its natural, ancient, and religious sites. The tourism sector has been experiencing a rise in the region recently, and we estimated that one of the reasons for this could be better connectivity.
• Racha-Lechkhumi, Kvemo Svaneti—a mountainous region in western Georgia, neighboring Imereti. Racha has high tourism potential and a trend of growing tourism. A local airport opened in Ambrolauri, the administrative center of the region, in January 2017. The airport has received a very limited number flights until now, and most passengers reach it by road. The distance to Ambrolauri from Kutaisi International Airport is 94 kilometers, so it is easily accessible by car or public transport.
• Samegrelo-Zemo Svaneti—a region in north-western Georgia, where the tourism sector has experienced high growth recently. The region is accessible only by road and a local airport, which receives flights from Kutaisi International Airport and the local airport in Natakhtari. Kutaisi International Airport is the nearest airport to the region, at a distance of 219 kilometers from Mestia, the town that is the most popular tourist destination in the region.
As a control group, we selected a group of three other regions in eastern Georgia that international or local airports do not serve. All of them have tourism potential, but the lack of tourism infrastructure and poor connectivity in these areas may hinder growth. Tourists mainly access the regions by road from Tbilisi. We estimated that they do not receive treatment from Kutaisi International Airport. However, the
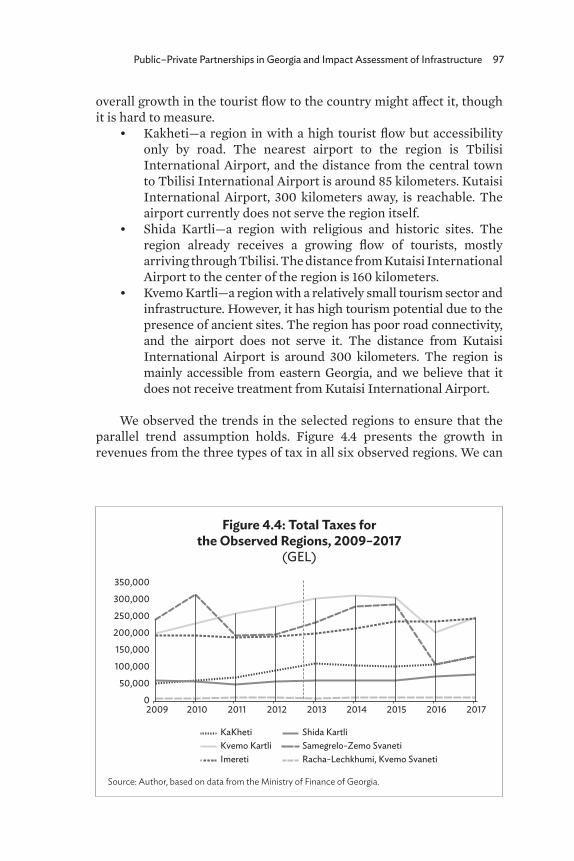
Public–Private Partnerships in Georgia and Impact Assessment of Infrastructure 97
overall growth in the tourist flow to the country might affect it, though it is hard to measure.
• Kakheti—a region in with a high tourist flow but accessibility only by road. The nearest airport to the region is Tbilisi International Airport, and the distance from the central town to Tbilisi International Airport is around 85 kilometers. Kutaisi International Airport, 300 kilometers away, is reachable. The airport currently does not serve the region itself.
• Shida Kartli—a region with religious and historic sites. The region already receives a growing flow of tourists, mostly arriving through Tbilisi. The distance from Kutaisi International Airport to the center of the region is 160 kilometers.
• Kvemo Kartli—a region with a relatively small tourism sector and infrastructure. However, it has high tourism potential due to the presence of ancient sites. The region has poor road connectivity, and the airport does not serve it. The distance from Kutaisi International Airport is around 300 kilometers. The region is mainly accessible from eastern Georgia, and we believe that it does not receive treatment from Kutaisi International Airport.
We observed the trends in the selected regions to ensure that the parallel trend assumption holds. Figure 4.4 presents the growth in revenues from the three types of tax in all six observed regions. We can
Figure 4.4: Total Taxes for the Observed Regions, 2009–2017
(GEL)
Source: Author, based on data from the Ministry of Finance of Georgia.
0
50,000
100,000
150,000
200,000
250,000
300,000
350,000
2009 2010 2011 2012 2013 2014 2015 2016 2017
KaKheti Shida KartliKvemo Kartli Samegrelo-Zemo SvanetiImereti Racha-Lechkhumi, Kvemo Svaneti
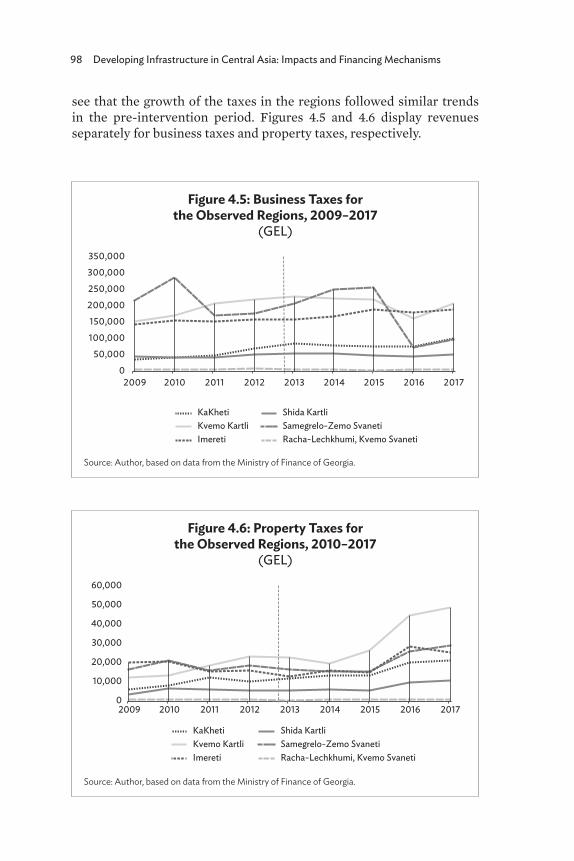
98 Developing Infrastructure in Central Asia: Impacts and Financing Mechanisms
see that the growth of the taxes in the regions followed similar trends in the pre-intervention period. Figures 4.5 and 4.6 display revenues separately for business taxes and property taxes, respectively.
Figure 4.5: Business Taxes for the Observed Regions, 2009–2017
(GEL)
Source: Author, based on data from the Ministry of Finance of Georgia.
0
50,000
100,000
150,000
200,000
250,000
300,000
350,000
2009 2010 2011 2012 2013 2014 2015 2016 2017
KaKheti Shida KartliKvemo Kartli Samegrelo-Zemo SvanetiImereti Racha-Lechkhumi, Kvemo Svaneti
Figure 4.6: Property Taxes for the Observed Regions, 2010–2017
(GEL)
Source: Author, based on data from the Ministry of Finance of Georgia.
0
10,000
20,000
30,000
40,000
50,000
60,000
2009 2010 2011 2012 2013 2014 2015 2016 2017
KaKheti Shida KartliKvemo Kartli Samegrelo-Zemo SvanetiImereti Racha-Lechkhumi, Kvemo Svaneti
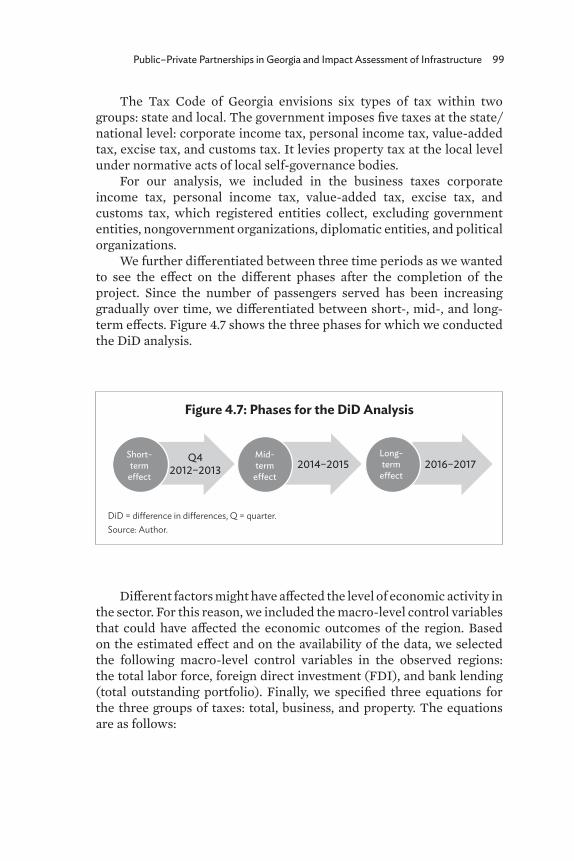
Public–Private Partnerships in Georgia and Impact Assessment of Infrastructure 99
The Tax Code of Georgia envisions six types of tax within two groups: state and local. The government imposes five taxes at the state/national level: corporate income tax, personal income tax, value-added tax, excise tax, and customs tax. It levies property tax at the local level under normative acts of local self-governance bodies.
For our analysis, we included in the business taxes corporate income tax, personal income tax, value-added tax, excise tax, and customs tax, which registered entities collect, excluding government entities, nongovernment organizations, diplomatic entities, and political organizations.
We further differentiated between three time periods as we wanted to see the effect on the different phases after the completion of the project. Since the number of passengers served has been increasing gradually over time, we differentiated between short-, mid-, and long-term effects. Figure 4.7 shows the three phases for which we conducted the DiD analysis.
Different factors might have affected the level of economic activity in the sector. For this reason, we included the macro-level control variables that could have affected the economic outcomes of the region. Based on the estimated effect and on the availability of the data, we selected the following macro-level control variables in the observed regions: the total labor force, foreign direct investment (FDI), and bank lending (total outstanding portfolio). Finally, we specified three equations for the three groups of taxes: total, business, and property. The equations are as follows:
Figure 4.7: Phases for the DiD Analysis
DiD = difference in differences, Q = quarter.Source: Author.
Short-term
e�ect
Q42012–2013 2014–2015 2016–2017
Mid-term
e�ect
Long-term
e�ect
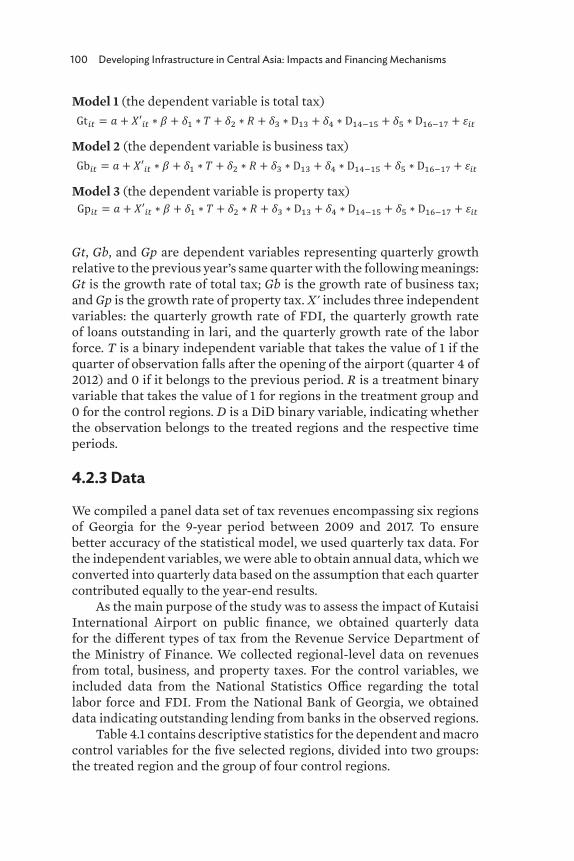
100 Developing Infrastructure in Central Asia: Impacts and Financing Mechanisms
Model 1 (the dependent variable is total tax)Model 1 (the dependent variable is total tax)
Gt𝑖𝑖𝑖𝑖 = 𝑎𝑎 + 𝑋𝑋′𝑖𝑖𝑖𝑖 ∗ 𝛽𝛽 + 𝛿𝛿1 ∗ 𝑇𝑇 + 𝛿𝛿2 ∗ 𝑅𝑅 + 𝛿𝛿3 ∗ D13 + 𝛿𝛿4 ∗ D14−15 + 𝛿𝛿5 ∗ D16−17 + 𝜀𝜀𝑖𝑖𝑖𝑖
Model 2 (the dependent variable is business tax)
Gb𝑖𝑖𝑖𝑖 = 𝑎𝑎 + 𝑋𝑋′𝑖𝑖𝑖𝑖 ∗ 𝛽𝛽 + 𝛿𝛿1 ∗ 𝑇𝑇 + 𝛿𝛿2 ∗ 𝑅𝑅 + 𝛿𝛿3 ∗ D13 + 𝛿𝛿4 ∗ D14−15 + 𝛿𝛿5 ∗ D16−17 + 𝜀𝜀𝑖𝑖𝑖𝑖
Model 3 (the dependent variable is property tax)
Gp𝑖𝑖𝑖𝑖 = 𝑎𝑎 + 𝑋𝑋′𝑖𝑖𝑖𝑖 ∗ 𝛽𝛽 + 𝛿𝛿1 ∗ 𝑇𝑇 + 𝛿𝛿2 ∗ 𝑅𝑅 + 𝛿𝛿3 ∗ D13 + 𝛿𝛿4 ∗ D14−15 + 𝛿𝛿5 ∗ D16−17 + 𝜀𝜀𝑖𝑖𝑖𝑖
Model 2 (the dependent variable is business tax)
Model 1 (the dependent variable is total tax)
Gt𝑖𝑖𝑖𝑖 = 𝑎𝑎 + 𝑋𝑋′𝑖𝑖𝑖𝑖 ∗ 𝛽𝛽 + 𝛿𝛿1 ∗ 𝑇𝑇 + 𝛿𝛿2 ∗ 𝑅𝑅 + 𝛿𝛿3 ∗ D13 + 𝛿𝛿4 ∗ D14−15 + 𝛿𝛿5 ∗ D16−17 + 𝜀𝜀𝑖𝑖𝑖𝑖
Model 2 (the dependent variable is business tax)
Gb𝑖𝑖𝑖𝑖 = 𝑎𝑎 + 𝑋𝑋′𝑖𝑖𝑖𝑖 ∗ 𝛽𝛽 + 𝛿𝛿1 ∗ 𝑇𝑇 + 𝛿𝛿2 ∗ 𝑅𝑅 + 𝛿𝛿3 ∗ D13 + 𝛿𝛿4 ∗ D14−15 + 𝛿𝛿5 ∗ D16−17 + 𝜀𝜀𝑖𝑖𝑖𝑖
Model 3 (the dependent variable is property tax)
Gp𝑖𝑖𝑖𝑖 = 𝑎𝑎 + 𝑋𝑋′𝑖𝑖𝑖𝑖 ∗ 𝛽𝛽 + 𝛿𝛿1 ∗ 𝑇𝑇 + 𝛿𝛿2 ∗ 𝑅𝑅 + 𝛿𝛿3 ∗ D13 + 𝛿𝛿4 ∗ D14−15 + 𝛿𝛿5 ∗ D16−17 + 𝜀𝜀𝑖𝑖𝑖𝑖
Model 3 (the dependent variable is property tax)
Model 1 (the dependent variable is total tax)
Gt𝑖𝑖𝑖𝑖 = 𝑎𝑎 + 𝑋𝑋′𝑖𝑖𝑖𝑖 ∗ 𝛽𝛽 + 𝛿𝛿1 ∗ 𝑇𝑇 + 𝛿𝛿2 ∗ 𝑅𝑅 + 𝛿𝛿3 ∗ D13 + 𝛿𝛿4 ∗ D14−15 + 𝛿𝛿5 ∗ D16−17 + 𝜀𝜀𝑖𝑖𝑖𝑖
Model 2 (the dependent variable is business tax)
Gb𝑖𝑖𝑖𝑖 = 𝑎𝑎 + 𝑋𝑋′𝑖𝑖𝑖𝑖 ∗ 𝛽𝛽 + 𝛿𝛿1 ∗ 𝑇𝑇 + 𝛿𝛿2 ∗ 𝑅𝑅 + 𝛿𝛿3 ∗ D13 + 𝛿𝛿4 ∗ D14−15 + 𝛿𝛿5 ∗ D16−17 + 𝜀𝜀𝑖𝑖𝑖𝑖
Model 3 (the dependent variable is property tax)
Gp𝑖𝑖𝑖𝑖 = 𝑎𝑎 + 𝑋𝑋′𝑖𝑖𝑖𝑖 ∗ 𝛽𝛽 + 𝛿𝛿1 ∗ 𝑇𝑇 + 𝛿𝛿2 ∗ 𝑅𝑅 + 𝛿𝛿3 ∗ D13 + 𝛿𝛿4 ∗ D14−15 + 𝛿𝛿5 ∗ D16−17 + 𝜀𝜀𝑖𝑖𝑖𝑖
Gt, Gb, and Gp are dependent variables representing quarterly growth relative to the previous year’s same quarter with the following meanings: Gt is the growth rate of total tax; Gb is the growth rate of business tax; and Gp is the growth rate of property tax. X' includes three independent variables: the quarterly growth rate of FDI, the quarterly growth rate of loans outstanding in lari, and the quarterly growth rate of the labor force. T is a binary independent variable that takes the value of 1 if the quarter of observation falls after the opening of the airport (quarter 4 of 2012) and 0 if it belongs to the previous period. R is a treatment binary variable that takes the value of 1 for regions in the treatment group and 0 for the control regions. D is a DiD binary variable, indicating whether the observation belongs to the treated regions and the respective time periods.
4.2.3 Data
We compiled a panel data set of tax revenues encompassing six regions of Georgia for the 9-year period between 2009 and 2017. To ensure better accuracy of the statistical model, we used quarterly tax data. For the independent variables, we were able to obtain annual data, which we converted into quarterly data based on the assumption that each quarter contributed equally to the year-end results.
As the main purpose of the study was to assess the impact of Kutaisi International Airport on public finance, we obtained quarterly data for the different types of tax from the Revenue Service Department of the Ministry of Finance. We collected regional-level data on revenues from total, business, and property taxes. For the control variables, we included data from the National Statistics Office regarding the total labor force and FDI. From the National Bank of Georgia, we obtained data indicating outstanding lending from banks in the observed regions.
Table 4.1 contains descriptive statistics for the dependent and macro control variables for the five selected regions, divided into two groups: the treated region and the group of four control regions.
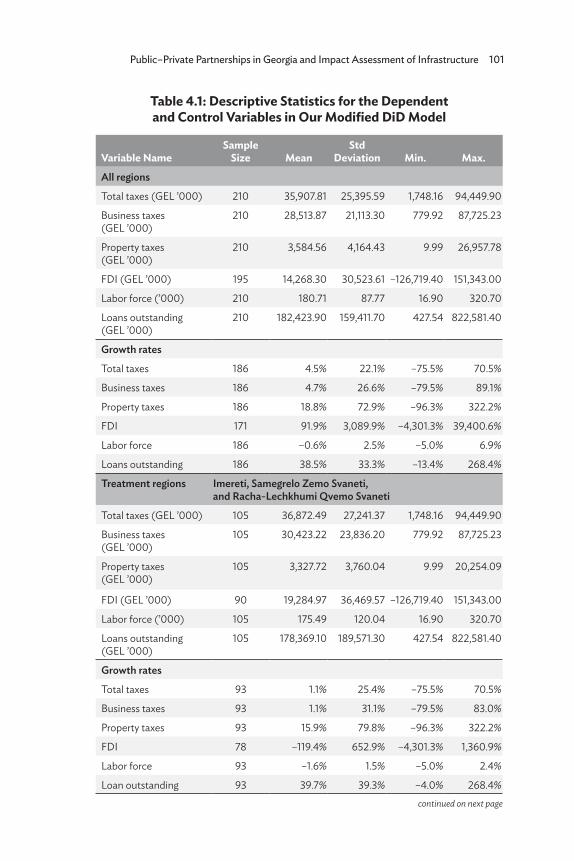
Public–Private Partnerships in Georgia and Impact Assessment of Infrastructure 101
Table 4.1: Descriptive Statistics for the Dependent and Control Variables in Our Modified DiD Model
Variable NameSample
Size MeanStd
Deviation Min. Max.All regions
Total taxes (GEL ’000) 210 35,907.81 25,395.59 1,748.16 94,449.90
Business taxes (GEL ’000)
210 28,513.87 21,113.30 779.92 87,725.23
Property taxes (GEL ’000)
210 3,584.56 4,164.43 9.99 26,957.78
FDI (GEL ’000) 195 14,268.30 30,523.61 –126,719.40 151,343.00
Labor force (’000) 210 180.71 87.77 16.90 320.70
Loans outstanding (GEL ’000)
210 182,423.90 159,411.70 427.54 822,581.40
Growth rates
Total taxes 186 4.5% 22.1% –75.5% 70.5%
Business taxes 186 4.7% 26.6% –79.5% 89.1%
Property taxes 186 18.8% 72.9% –96.3% 322.2%
FDI 171 91.9% 3,089.9% –4,301.3% 39,400.6%
Labor force 186 –0.6% 2.5% –5.0% 6.9%
Loans outstanding 186 38.5% 33.3% –13.4% 268.4%
Treatment regions Imereti, Samegrelo Zemo Svaneti, and Racha-Lechkhumi Qvemo Svaneti
Total taxes (GEL ’000) 105 36,872.49 27,241.37 1,748.16 94,449.90
Business taxes (GEL ’000)
105 30,423.22 23,836.20 779.92 87,725.23
Property taxes (GEL ’000)
105 3,327.72 3,760.04 9.99 20,254.09
FDI (GEL ’000) 90 19,284.97 36,469.57 –126,719.40 151,343.00
Labor force (’000) 105 175.49 120.04 16.90 320.70
Loans outstanding (GEL ’000)
105 178,369.10 189,571.30 427.54 822,581.40
Growth rates
Total taxes 93 1.1% 25.4% –75.5% 70.5%
Business taxes 93 1.1% 31.1% –79.5% 83.0%
Property taxes 93 15.9% 79.8% –96.3% 322.2%
FDI 78 –119.4% 652.9% –4,301.3% 1,360.9%
Labor force 93 –1.6% 1.5% –5.0% 2.4%
Loan outstanding 93 39.7% 39.3% –4.0% 268.4%continued on next page
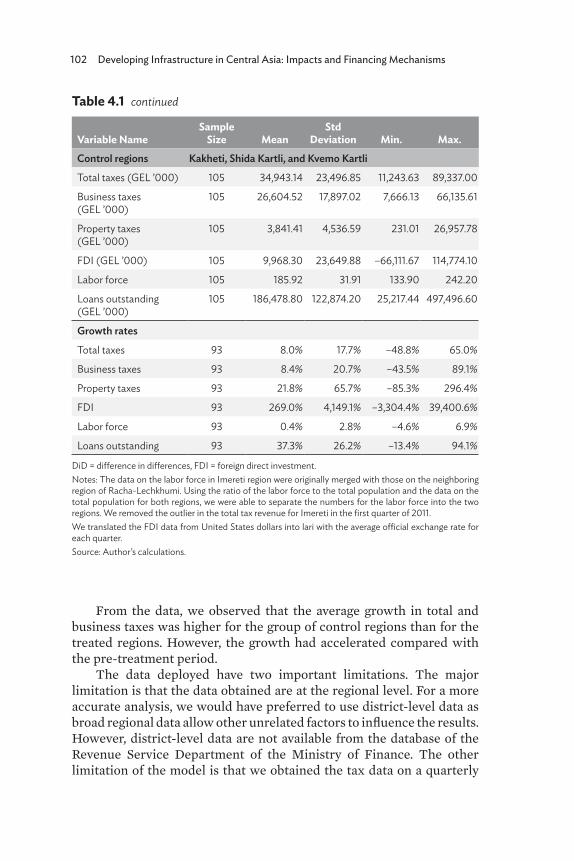
102 Developing Infrastructure in Central Asia: Impacts and Financing Mechanisms
Variable NameSample
Size MeanStd
Deviation Min. Max.Control regions Kakheti, Shida Kartli, and Kvemo Kartli
Total taxes (GEL ’000) 105 34,943.14 23,496.85 11,243.63 89,337.00
Business taxes (GEL ’000)
105 26,604.52 17,897.02 7,666.13 66,135.61
Property taxes (GEL ’000)
105 3,841.41 4,536.59 231.01 26,957.78
FDI (GEL ’000) 105 9,968.30 23,649.88 –66,111.67 114,774.10
Labor force 105 185.92 31.91 133.90 242.20
Loans outstanding (GEL ’000)
105 186,478.80 122,874.20 25,217.44 497,496.60
Growth rates
Total taxes 93 8.0% 17.7% –48.8% 65.0%
Business taxes 93 8.4% 20.7% –43.5% 89.1%
Property taxes 93 21.8% 65.7% –85.3% 296.4%
FDI 93 269.0% 4,149.1% –3,304.4% 39,400.6%
Labor force 93 0.4% 2.8% –4.6% 6.9%
Loans outstanding 93 37.3% 26.2% –13.4% 94.1%
DiD = difference in differences, FDI = foreign direct investment.Notes: The data on the labor force in Imereti region were originally merged with those on the neighboring region of Racha-Lechkhumi. Using the ratio of the labor force to the total population and the data on the total population for both regions, we were able to separate the numbers for the labor force into the two regions. We removed the outlier in the total tax revenue for Imereti in the first quarter of 2011.We translated the FDI data from United States dollars into lari with the average official exchange rate for each quarter. Source: Author’s calculations.
Table 4.1 continued
From the data, we observed that the average growth in total and business taxes was higher for the group of control regions than for the treated regions. However, the growth had accelerated compared with the pre-treatment period.
The data deployed have two important limitations. The major limitation is that the data obtained are at the regional level. For a more accurate analysis, we would have preferred to use district-level data as broad regional data allow other unrelated factors to influence the results. However, district-level data are not available from the database of the Revenue Service Department of the Ministry of Finance. The other limitation of the model is that we obtained the tax data on a quarterly
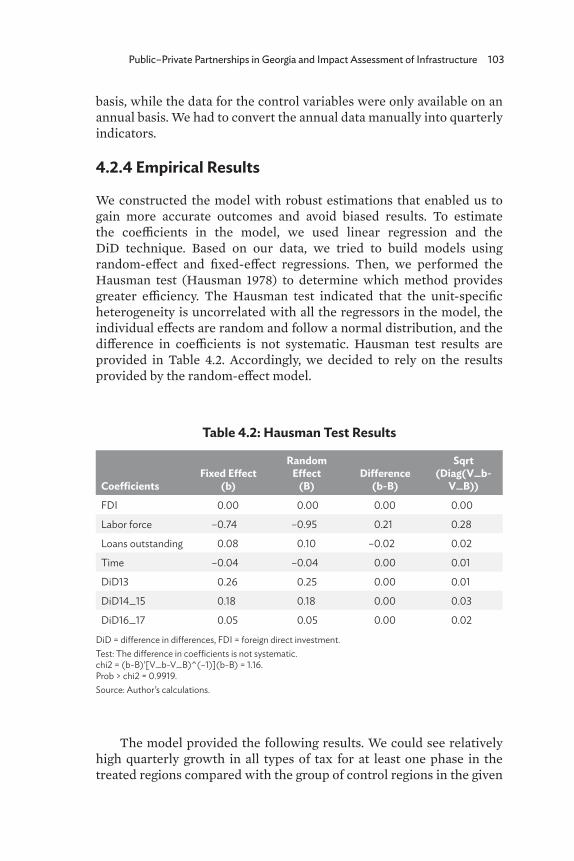
Public–Private Partnerships in Georgia and Impact Assessment of Infrastructure 103
basis, while the data for the control variables were only available on an annual basis. We had to convert the annual data manually into quarterly indicators.
4.2.4 Empirical Results
We constructed the model with robust estimations that enabled us to gain more accurate outcomes and avoid biased results. To estimate the coefficients in the model, we used linear regression and the DiD technique. Based on our data, we tried to build models using random-effect and fixed-effect regressions. Then, we performed the Hausman test (Hausman 1978) to determine which method provides greater efficiency. The Hausman test indicated that the unit-specific heterogeneity is uncorrelated with all the regressors in the model, the individual effects are random and follow a normal distribution, and the difference in coefficients is not systematic. Hausman test results are provided in Table 4.2. Accordingly, we decided to rely on the results provided by the random-effect model.
The model provided the following results. We could see relatively high quarterly growth in all types of tax for at least one phase in the treated regions compared with the group of control regions in the given
Table 4.2: Hausman Test Results
CoefficientsFixed Effect
(b)
Random Effect
(B)Difference
(b-B)
Sqrt (Diag(V_b-
V_B))FDI 0.00 0.00 0.00 0.00
Labor force –0.74 –0.95 0.21 0.28
Loans outstanding 0.08 0.10 –0.02 0.02
Time –0.04 –0.04 0.00 0.01
DiD13 0.26 0.25 0.00 0.01
DiD14_15 0.18 0.18 0.00 0.03
DiD16_17 0.05 0.05 0.00 0.02
DiD = difference in differences, FDI = foreign direct investment.Test: The difference in coefficients is not systematic.chi2 = (b-B)’[V_b-V_B)^(–1)](b-B) = 1.16.Prob > chi2 = 0.9919.Source: Author’s calculations.
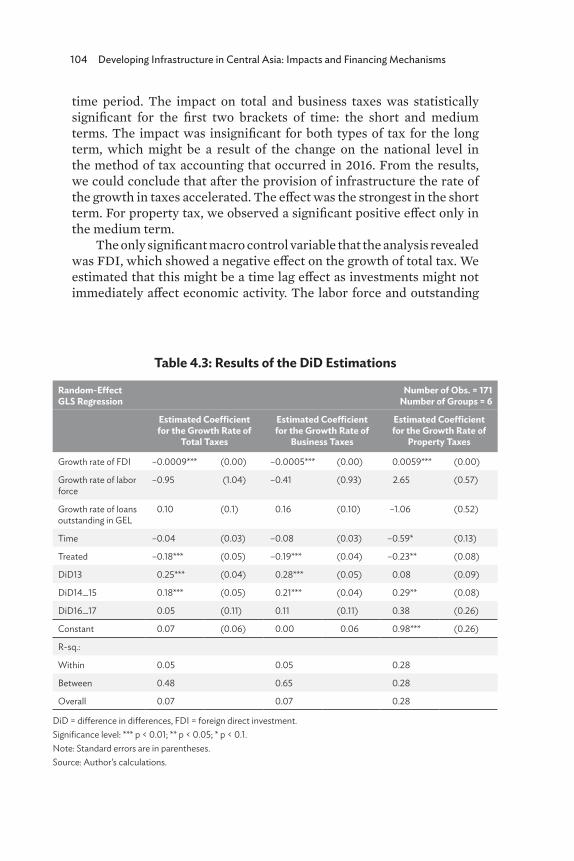
104 Developing Infrastructure in Central Asia: Impacts and Financing Mechanisms
time period. The impact on total and business taxes was statistically significant for the first two brackets of time: the short and medium terms. The impact was insignificant for both types of tax for the long term, which might be a result of the change on the national level in the method of tax accounting that occurred in 2016. From the results, we could conclude that after the provision of infrastructure the rate of the growth in taxes accelerated. The effect was the strongest in the short term. For property tax, we observed a significant positive effect only in the medium term.
The only significant macro control variable that the analysis revealed was FDI, which showed a negative effect on the growth of total tax. We estimated that this might be a time lag effect as investments might not immediately affect economic activity. The labor force and outstanding
Table 4.3: Results of the DiD Estimations
Random-Effect GLS Regression
Number of Obs. = 171Number of Groups = 6
Estimated Coefficient for the Growth Rate of
Total Taxes
Estimated Coefficient for the Growth Rate of
Business Taxes
Estimated Coefficient for the Growth Rate of
Property Taxes
Growth rate of FDI –0.0009*** (0.00) –0.0005*** (0.00) 0.0059*** (0.00)
Growth rate of labor force
–0.95 (1.04) –0.41 (0.93) 2.65 (0.57)
Growth rate of loans outstanding in GEL
0.10 (0.1) 0.16 (0.10) –1.06 (0.52)
Time –0.04 (0.03) –0.08 (0.03) –0.59* (0.13)
Treated –0.18*** (0.05) –0.19*** (0.04) –0.23** (0.08)
DiD13 0.25*** (0.04) 0.28*** (0.05) 0.08 (0.09)
DiD14_15 0.18*** (0.05) 0.21*** (0.04) 0.29** (0.08)
DiD16_17 0.05 (0.11) 0.11 (0.11) 0.38 (0.26)
Constant 0.07 (0.06) 0.00 0.06 0.98*** (0.26)
R-sq.:
Within 0.05 0.05 0.28
Between 0.48 0.65 0.28
Overall 0.07 0.07 0.28
DiD = difference in differences, FDI = foreign direct investment.Significance level: *** p < 0.01; ** p < 0.05; * p < 0.1.Note: Standard errors are in parentheses.Source: Author’s calculations.
Public–Private Partnerships in Georgia and Impact Assessment of Infrastructure 105
amount of bank loans showed an insignificant effect; we assumed that this is the result of the data limitation that Section 4.1.4 mentioned. We obtained tax data on a quarterly basis, but data for the control variables were available only on an annual basis. We manually converted annual data into quarterly indicators, which might have resulted in inconsistent quarterly data for the control variables.
The highest relative growth for total and business taxes manifested in the short term with a growth magnitude of 25 and 28 percentage points, respectively. Property tax displayed the highest coefficient in the medium term, with growth of 29 percentage points. Table 4.3 presents a summary of the DiD analysis, including the estimated DiD coefficients.
4.3 Current State of Infrastructure Financing in Georgia
4.3.1 Major Sources of Infrastructure Financing
Historically, the major sources of infrastructure financing in Georgia have been donor financing and concessional loans. However, state budget resources and privatization have played an important role in infrastructure financing, particularly in the last decade. This chapter briefly reviews the current state of infrastructure financing through different sources and presents the current regulatory framework for public spending.
External Debt and Donor FinancingAbout 60% of public debt funds infrastructure projects (UNESCAP 2017). Of the multilateral lenders, the World Bank followed by the Asian Development Bank (ADB) have provided the largest amount of public debt, specifically 60% of the total government external debt as of August 2018 (Ministry of Finance of Georgia 2018). The largest bilateral support has come from the German Kreditanstalt für Wiederaufbau (KfW), followed by the Japan International Cooperation Agency and France. The European Bank for Reconstruction and Development (EBRD) and International Finance Corporation (IFC) have invested heavily in Georgian infrastructure, mostly in the private sector. As for the donor funds, according to the Ministry of Finance, the United States Agency for International Development (USAID) and the European Union (EU) have provided the greatest support (UNESCAP 2017). Figure 4.8 shows the external public debt statistics by the share of each lender as of September 2018.
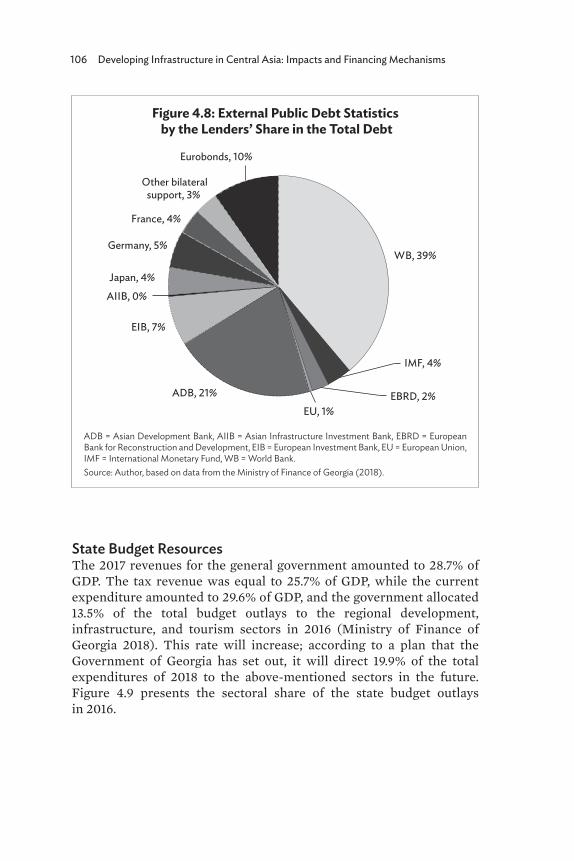
106 Developing Infrastructure in Central Asia: Impacts and Financing Mechanisms
State Budget ResourcesThe 2017 revenues for the general government amounted to 28.7% of GDP. The tax revenue was equal to 25.7% of GDP, while the current expenditure amounted to 29.6% of GDP, and the government allocated 13.5% of the total budget outlays to the regional development, infrastructure, and tourism sectors in 2016 (Ministry of Finance of Georgia 2018). This rate will increase; according to a plan that the Government of Georgia has set out, it will direct 19.9% of the total expenditures of 2018 to the above-mentioned sectors in the future. Figure 4.9 presents the sectoral share of the state budget outlays in 2016.
Figure 4.8: External Public Debt Statistics by the Lenders’ Share in the Total Debt
ADB = Asian Development Bank, AIIB = Asian Infrastructure Investment Bank, EBRD = European Bank for Reconstruction and Development, EIB = European Investment Bank, EU = European Union, IMF = International Monetary Fund, WB = World Bank. Source: Author, based on data from the Ministry of Finance of Georgia (2018).
WB, 39%
IMF, 4%
EBRD, 2%EU, 1%
ADB, 21%
EIB, 7%
AIIB, 0%
Japan, 4%
Germany, 5%
France, 4%
Other bilateralsupport, 3%
Eurobonds, 10%
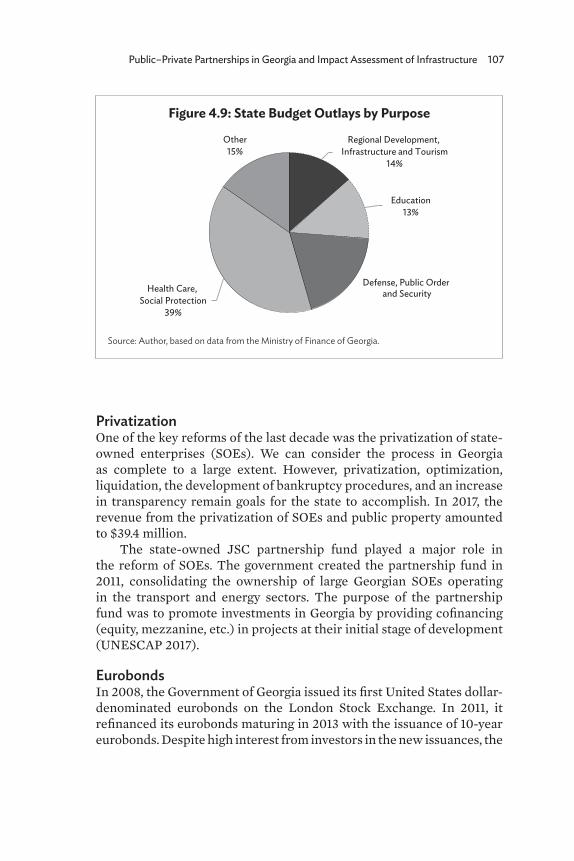
Public–Private Partnerships in Georgia and Impact Assessment of Infrastructure 107
Privatization One of the key reforms of the last decade was the privatization of state-owned enterprises (SOEs). We can consider the process in Georgia as complete to a large extent. However, privatization, optimization, liquidation, the development of bankruptcy procedures, and an increase in transparency remain goals for the state to accomplish. In 2017, the revenue from the privatization of SOEs and public property amounted to $39.4 million.
The state-owned JSC partnership fund played a major role in the reform of SOEs. The government created the partnership fund in 2011, consolidating the ownership of large Georgian SOEs operating in the transport and energy sectors. The purpose of the partnership fund was to promote investments in Georgia by providing cofinancing (equity, mezzanine, etc.) in projects at their initial stage of development (UNESCAP 2017).
Eurobonds In 2008, the Government of Georgia issued its first United States dollar-denominated eurobonds on the London Stock Exchange. In 2011, it refinanced its eurobonds maturing in 2013 with the issuance of 10-year eurobonds. Despite high interest from investors in the new issuances, the
Figure 4.9: State Budget Outlays by Purpose
Source: Author, based on data from the Ministry of Finance of Georgia.
Regional Development, Infrastructure and Tourism
14%
Education13%
Defense, Public Order and SecurityHealth Care,
Social Protection39%
Other15%
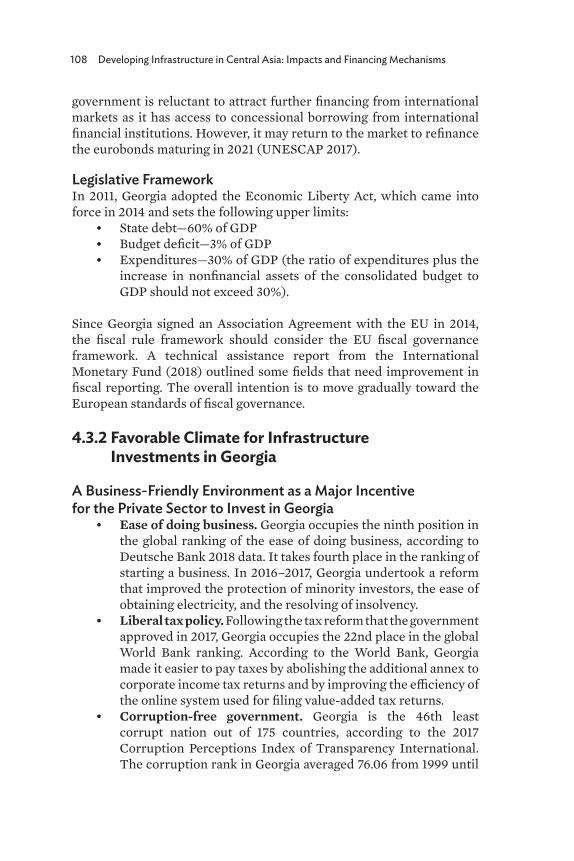
108 Developing Infrastructure in Central Asia: Impacts and Financing Mechanisms
government is reluctant to attract further financing from international markets as it has access to concessional borrowing from international financial institutions. However, it may return to the market to refinance the eurobonds maturing in 2021 (UNESCAP 2017).
Legislative FrameworkIn 2011, Georgia adopted the Economic Liberty Act, which came into force in 2014 and sets the following upper limits:
• State debt—60% of GDP • Budget deficit—3% of GDP • Expenditures—30% of GDP (the ratio of expenditures plus the
increase in nonfinancial assets of the consolidated budget to GDP should not exceed 30%).
Since Georgia signed an Association Agreement with the EU in 2014, the fiscal rule framework should consider the EU fiscal governance framework. A technical assistance report from the International Monetary Fund (2018) outlined some fields that need improvement in fiscal reporting. The overall intention is to move gradually toward the European standards of fiscal governance.
4.3.2 Favorable Climate for Infrastructure Investments in Georgia
A Business-Friendly Environment as a Major Incentive for the Private Sector to Invest in Georgia
• Ease of doing business. Georgia occupies the ninth position in the global ranking of the ease of doing business, according to Deutsche Bank 2018 data. It takes fourth place in the ranking of starting a business. In 2016–2017, Georgia undertook a reform that improved the protection of minority investors, the ease of obtaining electricity, and the resolving of insolvency.
• Liberal tax policy. Following the tax reform that the government approved in 2017, Georgia occupies the 22nd place in the global World Bank ranking. According to the World Bank, Georgia made it easier to pay taxes by abolishing the additional annex to corporate income tax returns and by improving the efficiency of the online system used for filing value-added tax returns.
• Corruption-free government. Georgia is the 46th least corrupt nation out of 175 countries, according to the 2017 Corruption Perceptions Index of Transparency International. The corruption rank in Georgia averaged 76.06 from 1999 until
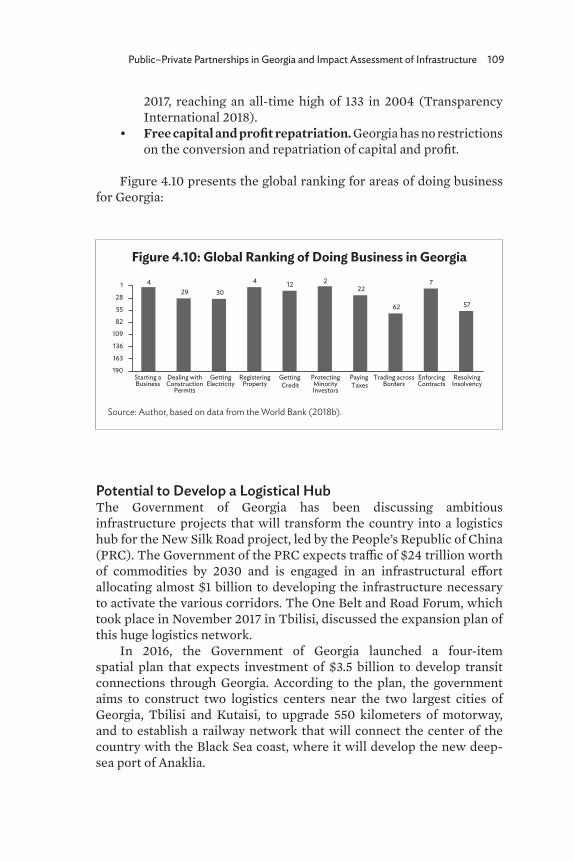
Public–Private Partnerships in Georgia and Impact Assessment of Infrastructure 109
2017, reaching an all-time high of 133 in 2004 (Transparency International 2018).
• Free capital and profit repatriation. Georgia has no restrictions on the conversion and repatriation of capital and profit.
Figure 4.10 presents the global ranking for areas of doing business for Georgia:
Potential to Develop a Logistical HubThe Government of Georgia has been discussing ambitious infrastructure projects that will transform the country into a logistics hub for the New Silk Road project, led by the People’s Republic of China (PRC). The Government of the PRC expects traffic of $24 trillion worth of commodities by 2030 and is engaged in an infrastructural effort allocating almost $1 billion to developing the infrastructure necessary to activate the various corridors. The One Belt and Road Forum, which took place in November 2017 in Tbilisi, discussed the expansion plan of this huge logistics network.
In 2016, the Government of Georgia launched a four-item spatial plan that expects investment of $3.5 billion to develop transit connections through Georgia. According to the plan, the government aims to construct two logistics centers near the two largest cities of Georgia, Tbilisi and Kutaisi, to upgrade 550 kilometers of motorway, and to establish a railway network that will connect the center of the country with the Black Sea coast, where it will develop the new deep-sea port of Anaklia.
Figure 4.10: Global Ranking of Doing Business in Georgia
Source: Author, based on data from the World Bank (2018b).
429 30
4 12 222
62
7
57
1
28
55
82
109
136
163
190Starting aBusiness
Dealing withConstruction
Permits
GettingElectricity
RegisteringProperty
Getting Credit
ProtectingMinorityInvestors
Paying Taxes
Trading acrossBorders
EnforcingContracts
ResolvingInsolvency
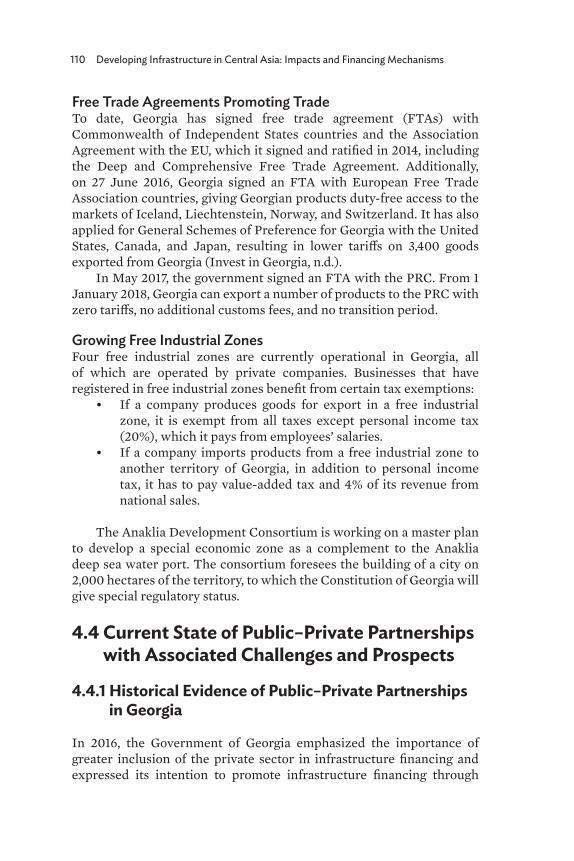
110 Developing Infrastructure in Central Asia: Impacts and Financing Mechanisms
Free Trade Agreements Promoting TradeTo date, Georgia has signed free trade agreement (FTAs) with Commonwealth of Independent States countries and the Association Agreement with the EU, which it signed and ratified in 2014, including the Deep and Comprehensive Free Trade Agreement. Additionally, on 27 June 2016, Georgia signed an FTA with European Free Trade Association countries, giving Georgian products duty-free access to the markets of Iceland, Liechtenstein, Norway, and Switzerland. It has also applied for General Schemes of Preference for Georgia with the United States, Canada, and Japan, resulting in lower tariffs on 3,400 goods exported from Georgia (Invest in Georgia, n.d.).
In May 2017, the government signed an FTA with the PRC. From 1 January 2018, Georgia can export a number of products to the PRC with zero tariffs, no additional customs fees, and no transition period.
Growing Free Industrial ZonesFour free industrial zones are currently operational in Georgia, all of which are operated by private companies. Businesses that have registered in free industrial zones benefit from certain tax exemptions:
• If a company produces goods for export in a free industrial zone, it is exempt from all taxes except personal income tax (20%), which it pays from employees’ salaries.
• If a company imports products from a free industrial zone to another territory of Georgia, in addition to personal income tax, it has to pay value-added tax and 4% of its revenue from national sales.
The Anaklia Development Consortium is working on a master plan to develop a special economic zone as a complement to the Anaklia deep sea water port. The consortium foresees the building of a city on 2,000 hectares of the territory, to which the Constitution of Georgia will give special regulatory status.
4.4 Current State of Public–Private Partnerships with Associated Challenges and Prospects
4.4.1 Historical Evidence of Public–Private Partnerships in Georgia
In 2016, the Government of Georgia emphasized the importance of greater inclusion of the private sector in infrastructure financing and expressed its intention to promote infrastructure financing through
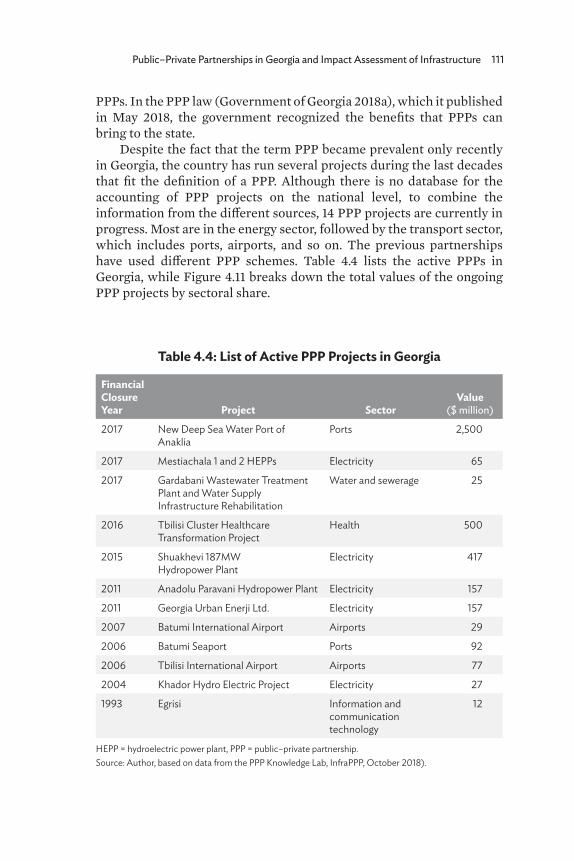
Public–Private Partnerships in Georgia and Impact Assessment of Infrastructure 111
PPPs. In the PPP law (Government of Georgia 2018a), which it published in May 2018, the government recognized the benefits that PPPs can bring to the state.
Despite the fact that the term PPP became prevalent only recently in Georgia, the country has run several projects during the last decades that fit the definition of a PPP. Although there is no database for the accounting of PPP projects on the national level, to combine the information from the different sources, 14 PPP projects are currently in progress. Most are in the energy sector, followed by the transport sector, which includes ports, airports, and so on. The previous partnerships have used different PPP schemes. Table 4.4 lists the active PPPs in Georgia, while Figure 4.11 breaks down the total values of the ongoing PPP projects by sectoral share.
Table 4.4: List of Active PPP Projects in Georgia
Financial Closure Year Project Sector
Value ($ million)
2017 New Deep Sea Water Port of Anaklia
Ports 2,500
2017 Mestiachala 1 and 2 HEPPs Electricity 65
2017 Gardabani Wastewater Treatment Plant and Water Supply Infrastructure Rehabilitation
Water and sewerage 25
2016 Tbilisi Cluster Healthcare Transformation Project
Health 500
2015 Shuakhevi 187MW Hydropower Plant
Electricity 417
2011 Anadolu Paravani Hydropower Plant Electricity 157
2011 Georgia Urban Enerji Ltd. Electricity 157
2007 Batumi International Airport Airports 29
2006 Batumi Seaport Ports 92
2006 Tbilisi International Airport Airports 77
2004 Khador Hydro Electric Project Electricity 27
1993 Egrisi Information and communication technology
12
HEPP = hydroelectric power plant, PPP = public–private partnership. Source: Author, based on data from the PPP Knowledge Lab, InfraPPP, October 2018).
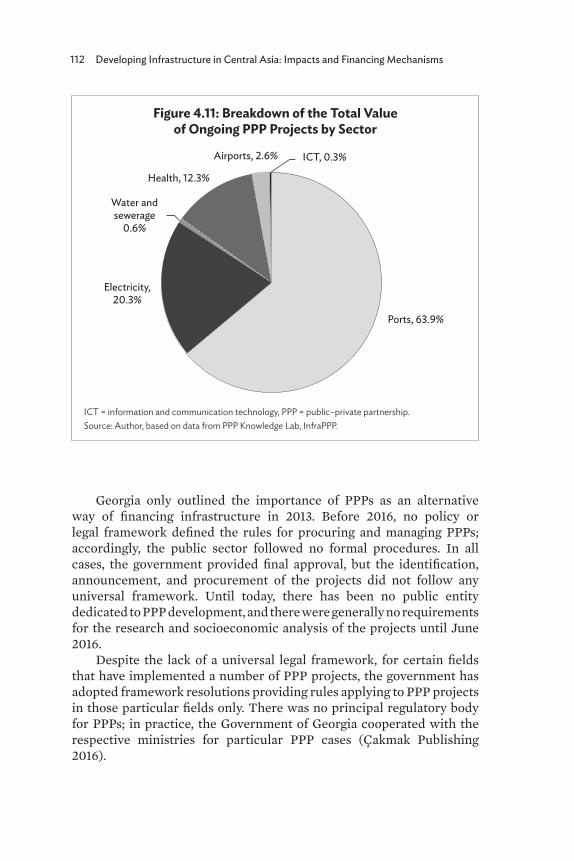
112 Developing Infrastructure in Central Asia: Impacts and Financing Mechanisms
Georgia only outlined the importance of PPPs as an alternative way of fi nancing infrastructure in 2013. Before 2016, no policy or legal framework defi ned the rules for procuring and managing PPPs; accordingly, the public sector followed no formal procedures. In all cases, the government provided fi nal approval, but the identifi cation, announcement, and procurement of the projects did not follow any universal framework. Until today, there has been no public entity dedicated to PPP development, and there were generally no requirements for the research and socioeconomic analysis of the projects until June 2016.
Despite the lack of a universal legal framework, for certain fi elds that have implemented a number of PPP projects, the government has adopted framework resolutions providing rules applying to PPP projects in those particular fi elds only. There was no principal regulatory body for PPPs; in practice, the Government of Georgia cooperated with the respective ministries for particular PPP cases (Çakmak Publishing 2016).
Figure 4.11: Breakdown of the Total Value of Ongoing PPP Projects by Sector
ICT = information and communication technology, PPP = public–private partnership.Source: Author, based on data from PPP Knowledge Lab, InfraPPP.
Airports, 2.6%
Health, 12.3%
Water andsewerage
0.6%
Electricity, 20.3%
ICT, 0.3%
Ports, 63.9%
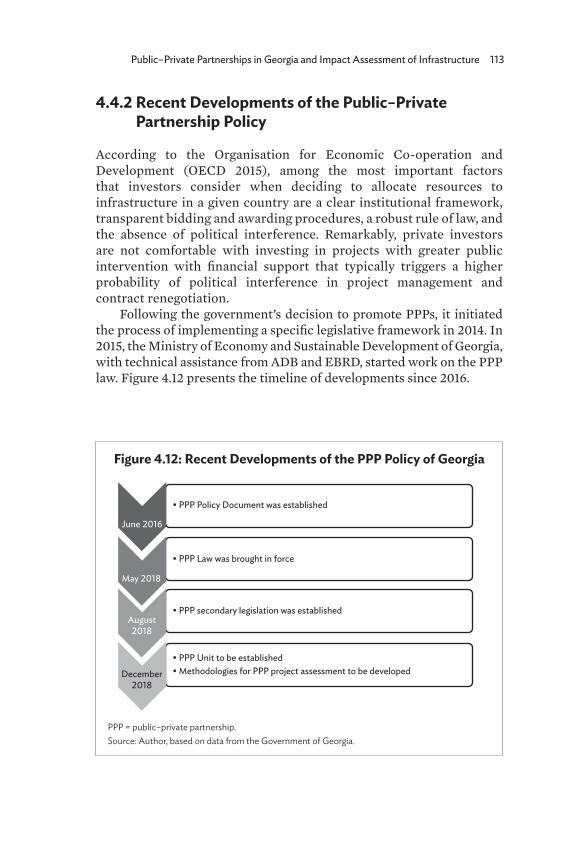
Public–Private Partnerships in Georgia and Impact Assessment of Infrastructure 113
4.4.2 Recent Developments of the Public–Private Partnership Policy
According to the Organisation for Economic Co-operation and Development (OECD 2015), among the most important factors that investors consider when deciding to allocate resources to infrastructure in a given country are a clear institutional framework, transparent bidding and awarding procedures, a robust rule of law, and the absence of political interference. Remarkably, private investors are not comfortable with investing in projects with greater public intervention with financial support that typically triggers a higher probability of political interference in project management and contract renegotiation.
Following the government’s decision to promote PPPs, it initiated the process of implementing a specific legislative framework in 2014. In 2015, the Ministry of Economy and Sustainable Development of Georgia, with technical assistance from ADB and EBRD, started work on the PPP law. Figure 4.12 presents the timeline of developments since 2016.
Figure 4.12: Recent Developments of the PPP Policy of Georgia
PPP = public–private partnership. Source: Author, based on data from the Government of Georgia.
• PPP Policy Document was established
• PPP Law was brought in force
• PPP secondary legislation was established
• PPP Unit to be established• Methodologies for PPP project assessment to be developed
June 2016
May 2018
August 2018
December 2018
114 Developing Infrastructure in Central Asia: Impacts and Financing Mechanisms
Public–Private Partnership Policy DocumentThe Ministry of Economic and Sustainable Development introduced a new framework in June 2016, with technical assistance from ADB and EBRD. The PPP assessment factors that the policy outlined were the following:
• Transparency—publicly available information about possibilities for PPPs and ongoing projects
• Foreseeability—clear and predictable rules • Nondiscrimination—fair and equal treatment of all foreign and
domestic entities • Value for money—maximal efficiency to reach the goals set
through the evaluation of the balance between expected revenues and expenditures
• Assessment and allocation of risks—adequate distribution of responsibilities and risks between parties
• Fiscal affordability—setting of financial responsibilities in a way that does not create fiscal risk
The framework outlined as well the priority sectors for PPPs (Government of Georgia 2016):
• Transport• Social infrastructure (health care, education, etc.)• Communal services (energy, water, waste management, etc.)• Other sectors (tourism, sport infrastructure, information
technology, etc.)
Public–Private Partnership LawThe PPP law represents a comprehensive document that creates legislation for procuring and managing PPPs. The law covers both concession and non-concession agreements. The document clarifies the definition of a PPP and presents eligibility criteria. It further describes each phase of a PPP project and defines relevant bodies for preparing, approving, procuring, and managing projects.
The procuring authority of a PPP project can be any relevant ministry or public entity. It is the authority that is the main body in the initiation and management of the PPP projects.
The Ministry of Finance, according to the law, acts as the fiscal authority. The analysis that the ministry conducts includes fiscal affordability assessment, value-for-money analysis, and fiscal risk assessment. Based on this analysis, the ministry will provide its recommendations to the government, which should further include these in the process of preparing the agreement or in the case of any modifications to the agreement throughout the life cycle of the project (Government of Georgia 2018a).
Public–Private Partnerships in Georgia and Impact Assessment of Infrastructure 115
Public–Private Partnership UnitAccording to the law, the PPP unit had to be operational by December 2018. The unit needs to be an independent public entity that will be under the direct supervision of the prime minister. Initially, the unit will comprise up to 10 people from different fields of expertise: finance, legal, and procurement. The focus is on bringing in staff from the private sector who are skilled in financing and/or structuring long-term infrastructure projects.
The main responsibilities of the PPP unit are:• Consulting the procuring authority with legal documentation
of the tender and the project itself.• If needed, recruiting, hiring, and monitoring a consultant for
the PPP project.• Monitoring the project.• Building capacity for a procuring authority.• Creating and managing the PPP database.• Developing the standards of PPP agreements.
The PPP unit does not have the power to initiate a project, but the government will encourage it to identify possible projects that the respective body can later initiate (Government of Georgia 2018a).
Secondary LegislationThe secondary legislation is a government decree, which was prepared in accordance with the PPP law. The document aimed to define the rules for implementing each phase of a PPP. It identified the following stages of a PPP project and provided comprehensive guidelines for managing every phase:
• Inception and identification of the project• Preparation• Identification of the private counterparty• Project implementation• Post appraisal of the project (Government of Georgia 2018b)
Methodological Guidelines for Leading Public–Private PartnershipsThe Ministry of Finance, in conjunction with the PPP unit, aims to establish methodological guidelines for a procuring authority in each phase of the project implementation. The guidelines will be in accordance with international best practices and based on the Legislative Guide on Privately Financed Infrastructure Projects by the United Nations Commission on International Trade Law (UNCITRAL 2001).
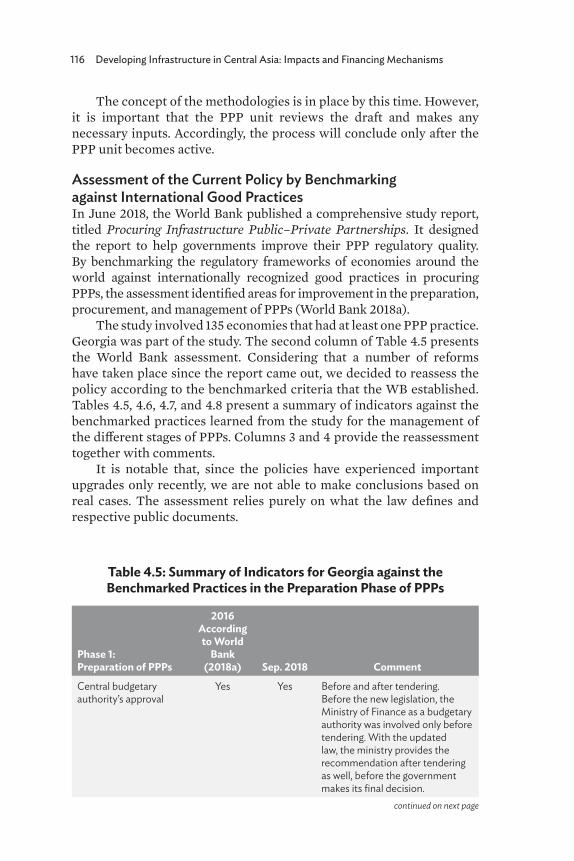
116 Developing Infrastructure in Central Asia: Impacts and Financing Mechanisms
The concept of the methodologies is in place by this time. However, it is important that the PPP unit reviews the draft and makes any necessary inputs. Accordingly, the process will conclude only after the PPP unit becomes active.
Assessment of the Current Policy by Benchmarking against International Good PracticesIn June 2018, the World Bank published a comprehensive study report, titled Procuring Infrastructure Public–Private Partnerships. It designed the report to help governments improve their PPP regulatory quality. By benchmarking the regulatory frameworks of economies around the world against internationally recognized good practices in procuring PPPs, the assessment identified areas for improvement in the preparation, procurement, and management of PPPs (World Bank 2018a).
The study involved 135 economies that had at least one PPP practice. Georgia was part of the study. The second column of Table 4.5 presents the World Bank assessment. Considering that a number of reforms have taken place since the report came out, we decided to reassess the policy according to the benchmarked criteria that the WB established. Tables 4.5, 4.6, 4.7, and 4.8 present a summary of indicators against the benchmarked practices learned from the study for the management of the different stages of PPPs. Columns 3 and 4 provide the reassessment together with comments.
It is notable that, since the policies have experienced important upgrades only recently, we are not able to make conclusions based on real cases. The assessment relies purely on what the law defines and respective public documents.
Table 4.5: Summary of Indicators for Georgia against the Benchmarked Practices in the Preparation Phase of PPPs
Phase 1: Preparation of PPPs
2016 According to World
Bank (2018a) Sep. 2018 Comment
Central budgetary authority’s approval
Yes Yes Before and after tendering. Before the new legislation, the Ministry of Finance as a budgetary authority was involved only before tendering. With the updated law, the ministry provides the recommendation after tendering as well, before the government makes its final decision.
continued on next page
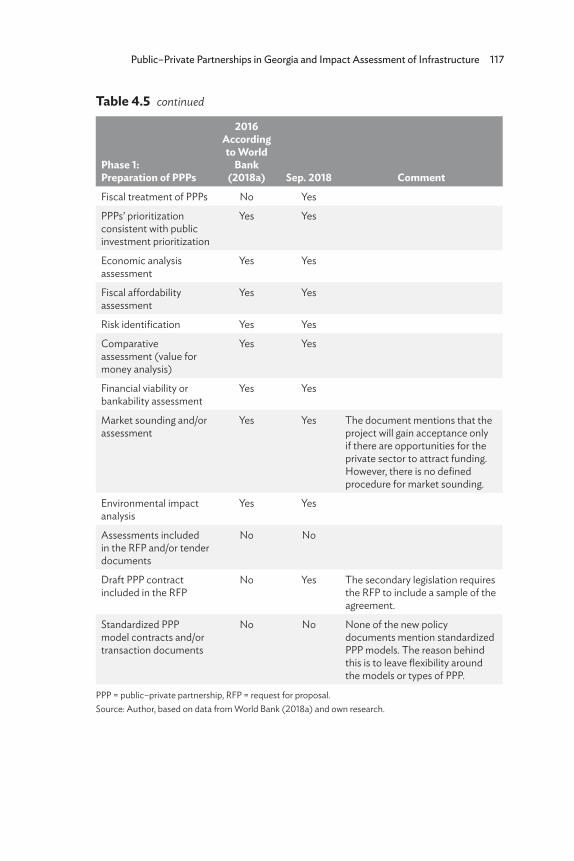
Public–Private Partnerships in Georgia and Impact Assessment of Infrastructure 117
Phase 1: Preparation of PPPs
2016 According to World
Bank (2018a) Sep. 2018 Comment
Fiscal treatment of PPPs No Yes
PPPs’ prioritization consistent with public investment prioritization
Yes Yes
Economic analysis assessment
Yes Yes
Fiscal affordability assessment
Yes Yes
Risk identification Yes Yes
Comparative assessment (value for money analysis)
Yes Yes
Financial viability or bankability assessment
Yes Yes
Market sounding and/or assessment
Yes Yes The document mentions that the project will gain acceptance only if there are opportunities for the private sector to attract funding. However, there is no defined procedure for market sounding.
Environmental impact analysis
Yes Yes
Assessments included in the RFP and/or tender documents
No No
Draft PPP contract included in the RFP
No Yes The secondary legislation requires the RFP to include a sample of the agreement.
Standardized PPP model contracts and/or transaction documents
No No None of the new policy documents mention standardized PPP models. The reason behind this is to leave flexibility around the models or types of PPP.
PPP = public–private partnership, RFP = request for proposal.Source: Author, based on data from World Bank (2018a) and own research.
Table 4.5 continued
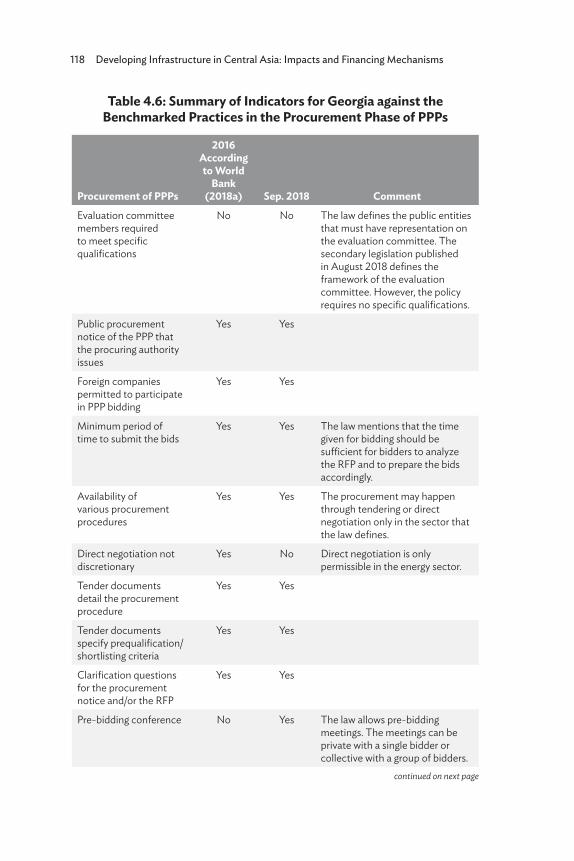
118 Developing Infrastructure in Central Asia: Impacts and Financing Mechanisms
Table 4.6: Summary of Indicators for Georgia against the Benchmarked Practices in the Procurement Phase of PPPs
Procurement of PPPs
2016 According to World
Bank (2018a) Sep. 2018 Comment
Evaluation committee members required to meet specific qualifications
No No The law defines the public entities that must have representation on the evaluation committee. The secondary legislation published in August 2018 defines the framework of the evaluation committee. However, the policy requires no specific qualifications.
Public procurement notice of the PPP that the procuring authority issues
Yes Yes
Foreign companies permitted to participate in PPP bidding
Yes Yes
Minimum period of time to submit the bids
Yes Yes The law mentions that the time given for bidding should be sufficient for bidders to analyze the RFP and to prepare the bids accordingly.
Availability of various procurement procedures
Yes Yes The procurement may happen through tendering or direct negotiation only in the sector that the law defines.
Direct negotiation not discretionary
Yes No Direct negotiation is only permissible in the energy sector.
Tender documents detail the procurement procedure
Yes Yes
Tender documents specify prequalification/shortlisting criteria
Yes Yes
Clarification questions for the procurement notice and/or the RFP
Yes Yes
Pre-bidding conference No Yes The law allows pre-bidding meetings. The meetings can be private with a single bidder or collective with a group of bidders.
continued on next page
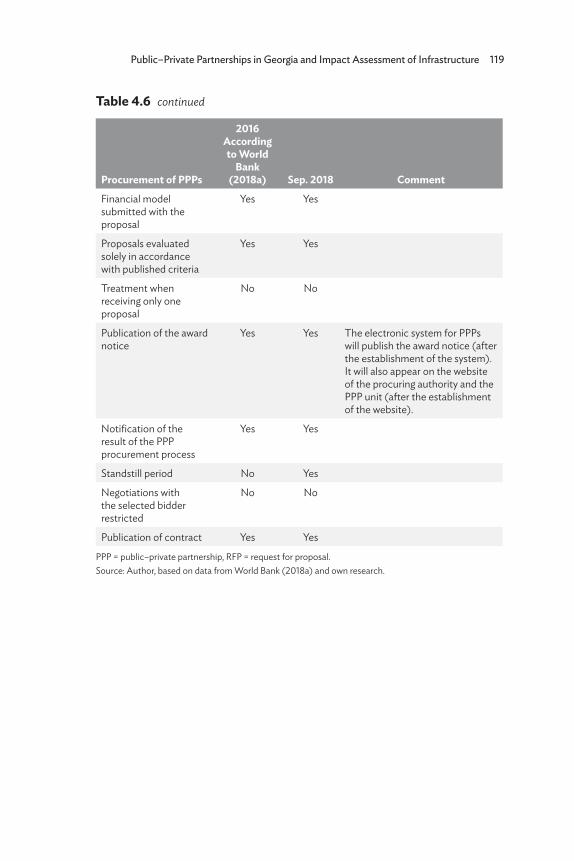
Public–Private Partnerships in Georgia and Impact Assessment of Infrastructure 119
Table 4.6 continued
Procurement of PPPs
2016 According to World
Bank (2018a) Sep. 2018 Comment
Financial model submitted with the proposal
Yes Yes
Proposals evaluated solely in accordance with published criteria
Yes Yes
Treatment when receiving only one proposal
No No
Publication of the award notice
Yes Yes The electronic system for PPPs will publish the award notice (after the establishment of the system). It will also appear on the website of the procuring authority and the PPP unit (after the establishment of the website).
Notification of the result of the PPP procurement process
Yes Yes
Standstill period No Yes
Negotiations with the selected bidder restricted
No No
Publication of contract Yes Yes
PPP = public–private partnership, RFP = request for proposal.Source: Author, based on data from World Bank (2018a) and own research.
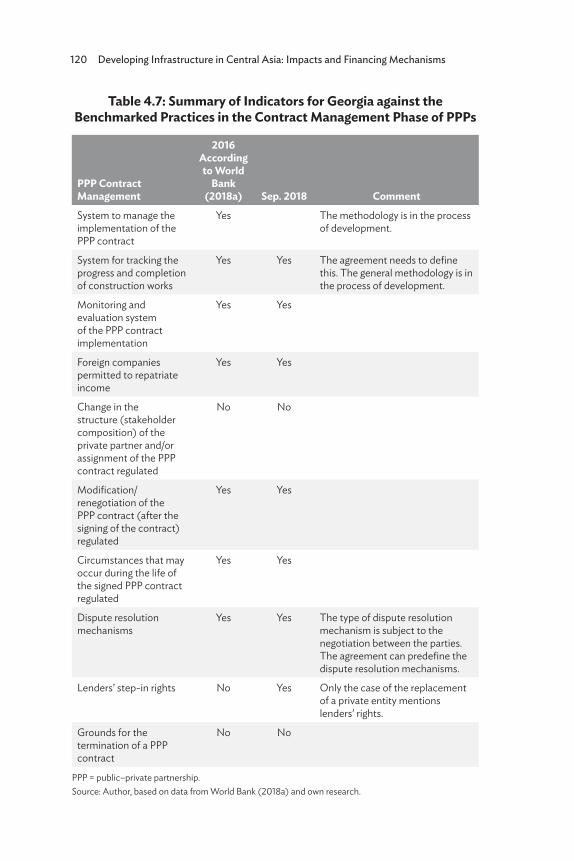
120 Developing Infrastructure in Central Asia: Impacts and Financing Mechanisms
Table 4.7: Summary of Indicators for Georgia against the Benchmarked Practices in the Contract Management Phase of PPPs
PPP Contract Management
2016 According to World
Bank (2018a) Sep. 2018 Comment
System to manage the implementation of the PPP contract
Yes The methodology is in the process of development.
System for tracking the progress and completion of construction works
Yes Yes The agreement needs to define this. The general methodology is in the process of development.
Monitoring and evaluation system of the PPP contract implementation
Yes Yes
Foreign companies permitted to repatriate income
Yes Yes
Change in the structure (stakeholder composition) of the private partner and/or assignment of the PPP contract regulated
No No
Modification/renegotiation of the PPP contract (after the signing of the contract) regulated
Yes Yes
Circumstances that may occur during the life of the signed PPP contract regulated
Yes Yes
Dispute resolution mechanisms
Yes Yes The type of dispute resolution mechanism is subject to the negotiation between the parties. The agreement can predefine the dispute resolution mechanisms.
Lenders’ step-in rights No Yes Only the case of the replacement of a private entity mentions lenders’ rights.
Grounds for the termination of a PPP contract
No No
PPP = public–private partnership.Source: Author, based on data from World Bank (2018a) and own research.
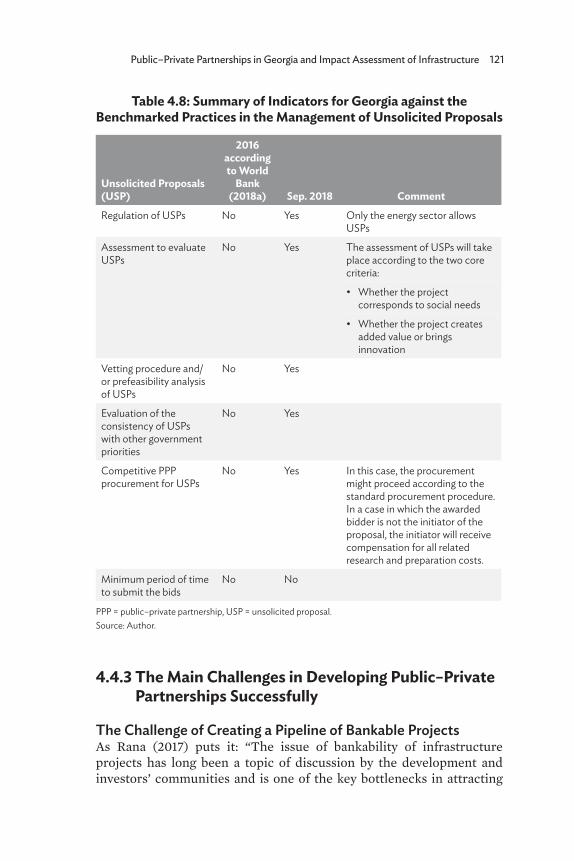
Public–Private Partnerships in Georgia and Impact Assessment of Infrastructure 121
Table 4.8: Summary of Indicators for Georgia against the Benchmarked Practices in the Management of Unsolicited Proposals
Unsolicited Proposals (USP)
2016 according to World
Bank (2018a) Sep. 2018 Comment
Regulation of USPs No Yes Only the energy sector allows USPs
Assessment to evaluate USPs
No Yes The assessment of USPs will take place according to the two core criteria:
• Whethertheprojectcorresponds to social needs
• Whethertheprojectcreatesadded value or brings innovation
Vetting procedure and/or prefeasibility analysis of USPs
No Yes
Evaluation of the consistency of USPs with other government priorities
No Yes
Competitive PPP procurement for USPs
No Yes In this case, the procurement might proceed according to the standard procurement procedure. In a case in which the awarded bidder is not the initiator of the proposal, the initiator will receive compensation for all related research and preparation costs.
Minimum period of time to submit the bids
No No
PPP = public–private partnership, USP = unsolicited proposal.Source: Author.
4.4.3 The Main Challenges in Developing Public–Private Partnerships Successfully
The Challenge of Creating a Pipeline of Bankable ProjectsAs Rana (2017) puts it: “The issue of bankability of infrastructure projects has long been a topic of discussion by the development and investors’ communities and is one of the key bottlenecks in attracting
122 Developing Infrastructure in Central Asia: Impacts and Financing Mechanisms
private capital to meet the global infrastructure gap and to provide millions of people with the key services they lack. The B20 task force on infrastructure confirms the investment gap in infrastructure is not the result of a shortage of capital. Real long-term interest rates are low, there is ample supply of long-term finance, interest by the private sector is high, and the benefits are obvious. However, a number of factors hold back investment in terms of financing and funding. One of those factors is to find bankable and investment-ready projects.”
The major step during the inception of a PPP project is to identify a bankable project that will make the project self-sustainable and bring financial benefit to the private counterparty. The fact that Georgia is a lower-middle-income country and that it has a relatively small population make it difficult to compensate for the investment in infrastructure development. However, the country’s strategic location and its booming tourism industry open the door for opportunities.
Low Awareness of Public–Private Partnerships among Government Officials, the Business Sector, and the PublicThe concept of PPPs is still new to the Georgian society. Government departments have little experience in preparing and managing PPP projects. Government officials who are employed by the government bodies already leading the PPP projects may misunderstand the PPP concept. Awareness among the public and the business sector is low as well. Likewise important is that the business sector is aware of the concept and the opportunities and benefits that it offers. As it is possible to view the business sector as the potential private counterparty of a PPP project, understanding and trust in a PPP may play a crucial role in ensuring the sector’s involvement.
Among the core responsibilities of the PPP unit will be capacity building and increasing the awareness in society and the public sector. The recommendations section will discuss the latter issue.
Inadequate Skill Set of WorkersThe Global Competitiveness Report 2017–2018 stated that the most problematic factor in doing business in Georgia is the inadequately educated workforce (World Economic Forum 2018). The country ranked 101st of 137 nations in quality of education and 131st in on-the job training (World Bank 2018b).
Generally, leading successful PPPs requires government officials to have the essential skills to initiate, prepare, and lead complex projects. To reach the desired level of proficiency, a long-term approach is necessary. The PPP unit will address this issue further. The unit will comprise high-level professionals who are skilled in preparing and
Public–Private Partnerships in Georgia and Impact Assessment of Infrastructure 123
managing large projects. The team will address the problem through continued capacity-building programs for the relevant public entities.
Likewise, one of the responsibilities of the PPP unit is, in the case of need, to help the procuring authority to find a consultant. The PPP unit will assess case by case the complexity of the projects in relation to the skill set of the workers. Whenever it identifies the need, it will invite external consultants to become involved in the preparation or management of the projects.
The Challenge of Attracting Long-Term Financing and an Underdeveloped Domestic Capital MarketFor large infrastructure projects, for which income stretches over a long period, attracting financing adjusted to their needs can be challenging. In Georgia, the major source of funding has been local banks historically. However, the availability of long-term financing from commercial banks can be limited. The issuance of corporate bonds can be a better option for PPPs to attract funding as they offer more flexibility and the ability for the issuer to set its preferred terms. The facts that the capital market of Georgia is at a low stage of development and that it is possible to appraise its activity as low can be hindering factors for PPPs.
Moreover, the instability of the local currency (lari) creates currency risks for long-term projects that receive funding in a foreign currency and generate income in the local currency. Due to the high costs, hedging cannot be an efficient way to eliminate risk. Thus, raising funds in the local currency is the only currency risk-free alternative for some long-term infrastructure projects.
Capital market development is a priority on the national level as the local market is currently underdeveloped. The most-traded instruments are government bonds, and commercial banks mostly own these bonds (with a few exceptional holdings of institutional investors). The secondary market is shallow. Currently, in the local capital market, there is a lack of institutional players that can provide an alternative source of financing for companies. The government, together with the National Bank, has elaborated a capital market development strategy and action plan. There are a number of structural reforms that should contribute directly or indirectly to capital market development. The ongoing work related to the introduction of a pension system is the most important reform that can facilitate capital market development (UNESCAP 2017).
In March 2016, the Ministry of Economy and Sustainable Development of Georgia introduced a plan for the reform of the pension system together with a supplementary pension scheme. According to the document, the private pension system will follow the defined contributions principle. A study by Finanzgruppe Sparkassenstiftung
124 Developing Infrastructure in Central Asia: Impacts and Financing Mechanisms
für internationale Kooperation (2017) presented the scheme according to which it will allocate the pension assets to the different pools of investment. According to the possible composition of pension fund assets, the system will invest 41.7% of the assets in bonds and 32.8% in enterprise shares, which are available through public offering. The reform of the capital market and pension system will enable the private sector to gain better access to long-term financing on the local market.
4.4.4 Recommendations for the Successful Promotion of Public–Private Partnerships in Georgia
The study revealed possible policy actions that will further encourage the development of PPPs in Georgia. In the following, we provide recommendations for the government and present relevant international practices.
Raise Awareness of PPPs among Government Officials and in the Business Sector As already indicated, the low awareness among government officials remains a challenge for the successful development of PPPs. We strongly recommend launching a capacity-building program that will address the government officials who are or will potentially be in charge of the implementation of the PPP projects. The program can be in the form of training sessions that will cover the essential materials regarding the characteristics of PPPs as well as the policies and procedures necessary to manage each phase.
Ideally, the program should consist of several modules, as has been done in India, for example, to address officials’ need for different depths of knowledge. Several countries have undertaken similar actions in the form of seminars and training. India has provided dedicated training of public functionaries at the state and municipal levels, implementing a training program with funding support from KfW. The courses aimed at five different categories of audience members distinguished in terms of their role in the PPP context as well as their specific need or purpose—that is, increasing awareness, obtaining a better understanding, and acquiring proficiency in the application of PPP skills (UNESCAP 2015).
To raise public awareness and make information available to the public or the business sector, it is equally important to create an information dissemination channel. The international practice is to establish a PPP website, on which, together with the PPP database and relevant updates, external users will be able to access policies, guidelines, information brochures, and updates regarding PPPs.

Public–Private Partnerships in Georgia and Impact Assessment of Infrastructure 125
Develop Robust Methodologies for the Assessment of PPPsDue to the lack of experience on the national level in preparing PPP projects, it will be highly beneficial to establish specific methodologies for each of the PPP assessment factors that the PPP policy document defines. The methodologies will help to focus on key criteria for the assessment. It is necessary to consider that different sectors of infrastructure might require different approaches. For particular assessment factors, it can be useful to have separate guidelines for each of the prioritized PPP sectors.
Different countries, including Canada, Germany, Ireland, Lithuania, the Netherlands, New Zealand, Peru, the Philippines, Slovakia, South Africa, and the United Kingdom, have developed specific methodologies for performing assessments (World Bank 2018a). However, there is no consensus around the world on the methods of conducting socioeconomic analysis of projects. Some countries have focused on qualitative factors, whereas others have developed quantitative assessment methodologies. A good example of a country that conducts thorough socioeconomic impact assessments is Austria, which has established a comprehensive set of variables for assessment. Austria has developed tools for economic, fiscal, and environmental impact assessment (World Bank 2018a).
It is equally important to share the methodologies for assessment with the private sector. These will act as a guideline for preparing suitable projects on each side of the partnership.
Develop a Market-Sounding ProcedureAs it is possible to view funding as one of the major challenges that PPPs currently face in Georgia, developing a market-sounding procedure will help the government to assess correctly the ability of a project to attract financing and consequently will provide the private counterparty with easier access to the fundraising process.
Through market-sounding exercises, important feedback from the lender community can inform the project preparation phase and shape the risk allocation matrix in a market-acceptable manner. The lending market and the appetite of lenders can vary over time due to various factors. These include legal and regulatory matters, global interest rate regimes, and capital market conditions. As such, bringing lenders’ feedback on board can be very useful for making a project bankable. An infrastructure project that has a risk-sharing protocol based on broad-level, early feedback from the lending community will be more likely to raise the required funding with fewer complications. Multilateral development banks have an important role to play in helping
126 Developing Infrastructure in Central Asia: Impacts and Financing Mechanisms
governments to develop such protocols and improve the bankability of potential PPP projects (World Bank 2017).
Promote Project Development FacilitiesA number of countries have established project development funds or facilities (PDFs) to strengthen their PPP programs. Such facilities provide the specialized resources necessary to conduct studies, design and structure a PPP, and procure a PPP. They call on a revolving fund to meet the up-front cost of developing a PPP, a cost that is normally higher than that of a project delivered in the conventional way. PDFs also provide governments with a tool for demonstrating good practice standards in project development (ADB 2016).
Despite the operational model differing according to countries, the core function of PDFs is to provide a professional service that generates high-quality studies and other transaction advisory support. In the case of the Philippines, the PDF facilitates the pre-investment activities of potential PPP projects, such as prefeasibility and feasibility studies, to develop a pipeline of viable projects. PDFs mainly cover the full phase of the project preparation, which projects normally recover from successful bidders afterward. The operation of the PDF as a revolving fund enables its benefits to sustain over a number of project cycles.
As for India’s case, the fund provides up to 75% of the project development expenses from the feasibility or structuring stage. It provides assistance in the form of interest-free loans from the government, which it recovers from the successful bidder.
In the case of Georgia, where the identification of bankable projects to create a robust pipeline remains one of the main challenges, the creation of a PDF is strongly recommended to adjust the structure and operational model to the current needs. The PDF can be based within the PPP unit, so the unit would provide strategic guidance to the fund; alternatively, it can be established as an autonomous entity.
Raise the Rate of Return on Infrastructure Projects through Viability Gap FundingOne of the major challenges in attracting private investment in infrastructure globally has been the low rate of return of public infrastructure projects (Yoshino and Abidhadjaev 2017a). The instrument for the government to fill the viability gap is an additional return that it can guarantee to the private sector in the form of a capital grant or various types of subsidy. For the government to make a sensible decision regarding viability gap funding, it needs to assess the potential impact of infrastructure provisioning on the economy. In Section 4.1,
Public–Private Partnerships in Georgia and Impact Assessment of Infrastructure 127
we presented the case of Kutaisi International Airport as an example of infrastructure impact assessment.
4.5 Conclusion and Policy ImplicationsGeorgia has recognized the importance of involving the private sector in infrastructure financing. It has taken important steps to develop a respective PPP policy and to create a PPP-friendly environment. The next challenge is to bring this into practice.
The expectation is that the reforms of the capital market and pension system will act as encouraging factors for private infrastructure investments. Moreover, the overall positive investment climate of Georgia, together with the growing free economic zones and the government’s plan to increase the importance of the country in the global transit corridors, create opportunities for successful infrastructure development.
However, to attract private investments successfully and fill the remaining infrastructure gap, the country will need to overcome the challenges that it still faces. It will be crucial for the government to mobilize its intellectual resources and maintain an active course.
In our empirical study, we evaluated the impact of infrastructure based on the evaluation of the effect of infrastructure provision on public finance, presenting the case of Kutaisi International Airport in Georgia. In the case study, we assessed the impact of the airport on the public finances of the region in which it is located and its spillover effects on the related regions. For the assessment, we obtained regional quarterly tax data for the years 2011–2017 from the Ministry of Finance and differentiated between total, business, and property taxes. We utilized the DiD approach, which assessed the impact of the airport on tax revenues for affected regions relative to a control group and found statistically significant increases in the growth rates of all three groups of tax revenue in at least one phase. The highest relative growth for total and business taxes manifested in the short term, with a growth magnitude of 25 and 28 percentage points, respectively. For property tax, the growth encouraged by the infrastructure procurement reached 29 percentage points in the medium term.
It is necessary to mention that our empirical model has two important limitations. The major limitation is that the data obtained were regional-level data. We realize that district-level data would have provided better results as broad regional data allow other unrelated factors to influence the results. However, district-level data are not available from the database of the Revenue Service Department of the
128 Developing Infrastructure in Central Asia: Impacts and Financing Mechanisms
Ministry of Finance. Another limitation of the model is that we obtained tax data on a quarterly basis, while the data for the control variables were available only on an annual basis, so they has to be converted manually. We assume that this might be why the effect of the labor force and bank lending is insignificant.
As a result of the empirical study, we concluded that the airport had a positive impact on the tax revenue. The findings from our case suggest that infrastructure investments may boost public revenues. The conclusion might serve as a basis for governments to think of an approach whereby the incremental tax revenues will revert to the infrastructure investors. As Yoshino and Abidhadjaev (2017b: 146) mentioned, “If the rate of return on infrastructure is increased by injecting spillover tax revenues generated in areas surrounding infrastructure investments, much more long-term private capital could be forthcoming for infrastructure investment.”
Public–Private Partnerships in Georgia and Impact Assessment of Infrastructure 129
ReferencesÇakmak Publishing. 2016. Global Public–Private Partnership (PPP)
Guide. Ankara: Çakmak Publishing. http://www.cakmak.av.tr/books/Global%20Public-Private%20Partnership%20(PPP)%20Guide%202016.pdf.
Finanzgruppe Sparkassenstiftung für Internationale Kooperation. 2017. Pension Reform: Recommendations from Policy Perspective. Berlin.
Government of Georgia. 2016. Policy Paper for Public–Private Partnerships (only in Georgian language). Tbilisi. https://matsne .gov.ge/ka/document/view/3298735?publication=0.
____. 2018a. Law of Georgia for Public–Private Partnerships (only in Georgian language). Tbilisi. https://matsne.gov.ge/ka/document /view/4193442?publication=0.
____. 2018b. Secondary Legislation for Public–Private Partnerships (only in Georgian language). Tbilisi. https://www.matsne.gov.ge/ka /document/view/4304519?publication=0.
Hausman, J. A. 1978. Specification Tests in Econometrics. Econometrica. 46. pp. 1251–71.
International Monetary Fund (IMF). 2018. Technical Assistance Report—Enhancing the Fiscal Rules Framework. Washington, DC: IMF. https://mof.ge/images/File/public%20finances%20in%20Geo /georgia-fiscal%20rules%20report%202018.pdf.
Invest in Georgia. n.d. Free Trade Regimes. https://investingeorgia.org /en/georgia/free-trade-regimes (accessed September 2018).
Ministry of Economy and Sustainable Development of Georgia. 2016. Georgian Pension Reform; Reform of the Universal Pension Benefit and Introduction of a Supplementary Pension Scheme. Tbilisi. http://www.economy.ge/uploads/meniu_publikaciebi/ouer /Goverment_Report_on_pensions_Final_ENG.pdf.
Ministry of Finance of Georgia. 2018. External Public Debt Statistics. Tbilisi. https://mof.ge/en/5160.
National Statistics Office of Georgia. n.d. Regional Statistics. http://www .geostat.ge/index.php?action=page&p_id=1190&lang=eng (accessed October 2018).
Organisation for Economic Co-operation and Development (OECD). 2015. Fostering Investment in Infrastructure. Paris: OECD. https://www.oecd.org/daf/inv/investment-policy/Fostering -Investment-in-Infrastructure.pdf.
PPP Knowledge Lab. Georgia. https://pppknowledgelab.org/countries /georgia (accessed October 2018).
Rana, F. 2017. Preparing Bankable Infrastructure Project. World Bank Blogs. 26 September. http://blogs.worldbank.org/ppps/preparing -bankable-infrastructure-projects.
130 Developing Infrastructure in Central Asia: Impacts and Financing Mechanisms
Transparency International. 2018. Corruption Perceptions Index 2017. https://www.transparency.org/news/feature/corruption _perceptions_index_2017.
United Nations Commission on International Trade Law (UNCITRAL). 2001. Legislative Guide on Privately Financed Infrastructure Projects. Vienna: UNCITRAL. https://www.uncitral.org/pdf/english/texts /procurem/pfip/guide/pfip-e.pdf.
United Nations Economic and Social Commission for Asia and the Pacific (UNESCAP). 2015. Sharing India’s Experience; UNESCAP Policy Dialogue on PPPs in Infrastructure. Bangkok: UNESCAP. https://www.unescap.org/sites/default/files/Day%201%20-%20Session%202.2%20-%20India%20PPP.pdf.
____. 2017. Infrastructure Financing for Sustainable Development in Georgia. Bangkok: UNESCAP. https://www.unescap.org/sites /default/files/Georgia-Financing%20Infrastructure_Draft _20170526.pdf.
World Bank. 2018a. Procuring Infrastructure Public–Private Partnerships 2018. Washington, DC: World Bank. https://ppp.worldbank.org /public-private-partnership/library/procuring-infrastructure-ppps -2018.
World Bank. 2018b. Doing Business 2018. Washington, DC: World Bank. http://www.doingbusiness.org/content/dam/doingBusiness /media/Annual-Reports/English/DB2018-Full-Report.pdf.
World Economic Forum. 2018. The Global Competitiveness Report 2017–2018. Geneva: World Economic Forum. https://www.weforum.org /reports/the-global-competitiveness-report-2017-2018.
Yoshino, N., and U. Abidhadjaev. 2017a. An Impact Evaluation of Investment in Infrastructure: The Case of a Railway Connection in Uzbekistan. Journal of Asian Economics. 49 (C). pp. 1–11.
Yoshino, N., and U. Abidhadjaev. 2017b. Impact of Infrastructure on Tax Revenue: Case Study of High-Speed Train in Japan. Journal of Infrastructure, Policy and Development. 1 (2). pp. 129–48.
Yoshino, N., and V. Pontines. 2015. The “Highway Effect” on Public Finance: Case of the STAR Highway in the Philippines. ADBI Working Paper. No. 549. Tokyo: Asian Development Bank Institute. https://www.adb.org/sites/default/files/publication/175868/adbi -wp549.pdf.
131
5Measuring Impacts
and Financing Infrastructure in Kazakhstan
Bibigul Aidarkhanova
5.1 IntroductionCurrent challenges in the global economy require new development models and mechanisms of interaction between the state and private investors. At present, new forms of cooperation between the state and the private sector, namely public–private partnerships (PPPs), are becoming increasingly important. PPPs are positioned as one of the most favorable prospects for solving problems associated with the interaction between the state and the private sector. In particular, PPP projects in various forms are actively gaining popularity in many countries as a tool for creating new infrastructure and providing public services. Indeed, the importance of PPPs is underlined in CAREC 2030, the newly developed institutional framework of the Central Asia Regional Economic Cooperation Program, which reinforces the strong participation of countries and development partners and enhances engagement with the private sector and civil society. Kazakhstan has also gained considerable experience in implementing PPP projects in various sectors, especially in the fields of infrastructure, transport, and services.
In this chapter, we will conduct a case study that will measure the impact of a PPP railway construction project in Kazakhstan on the country`s economic development by subregion and region. In conducting this study, we reviewed the literature of leading international foreign and domestic researchers on the development of PPPs and methodologies for assessing the impact of the implementation of PPP projects on economic performances. The issues regarding PPPs, the theory of finance in the investment process, financial analysis, and planning are studied in the works of Delmon (2010); Cruz and Marques (2011); Encinas (2013); and
132 Developing Infrastructure in Central Asia: Impacts and Financing Mechanisms
Kumar, Jindal, and Velaga (2018). The theoretical basis of issues relating to effective partnership between the state and the private sector in Kazakhstan was formed by the works of Kazakhstani social scientists (Mataev 2011; Toksanova et al. 2016). Summarizing the views of modern foreign and Kazakhstani researchers reveals that essential differences in approaches to evaluating PPP projects stem from the basic principles that ensure the appropriateness, validity, and possibility of organizing a PPP. After analyzing the scientific literature regarding public–private relations, we concluded that they are based on different approaches related to measuring impacts and financing infrastructure. Yoshino and Pontines (2015) said that, in order to evaluate and outline the future impact of the proposed infrastructure project, the government needs to be prepared and have the necessary tools to assess the impact accurately.
Additionally, we analyze the legal framework in Kazakhstan regulating the financial interaction between the state and private business in the course of implementing investment projects. In particular, we examined legislative acts in the PPP field such as the Law of the Republic of Kazakhstan “On concessions” (2006), “On amendments and additions to certain legislative acts of the Republic of Kazakhstan concerning the introduction of new types of public-private partnership and expansion of their application” (2013), “On amendments and additions to certain legislative acts of the Republic of Kazakhstan on public administration” (2014), “On public-private partnership” (2015), and other legislative instruments regulating PPPs in Kazakhstan. The developed legal framework and various government mechanisms regulating PPPs in Kazakhstan indicate that the country is among those with a significant potential for PPPs with the aim of increasing private investment in infrastructure, thereby enhancing economic growth and sustainable development.
Our study measures the impact of the construction of the Khorgos–Zhetygen railway in Kazakhstan on the economic development by subregions and regions. The difference-in-differences (DiD) approach is chosen to measure the impacts and financing infrastructure in Kazakhstan, based on research papers such as Yoshino and Abidhadjaev (2017a, 2017b) on measuring the impact of investment in infrastructure.
Our research study performs the following analyses in the case of Kazakhstan:
• analysis of the macroeconomic development in recent years, including the dynamics of the economic growth of gross domestic product (GDP) and external trade on the world market;
• analysis of investment financing, including foreign direct investment and investment in fixed capital;
Measuring Impacts and Financing Infrastructure in Kazakhstan 133
• analysis of the legislative frameworks for harmonizing regulatory and institutional PPP regimes;
• analysis of the development of PPPs, including their forms and current state; and
• analysis of challenges and opportunities for PPP development.
In the main research part, we evaluate the measurement of the investment effect in infrastructure based on a case study of the Khorgos–Zhetygen railway construction. In assessing the impact of implementing the PPP project in Kazakhstan, we use the DiD method, which differentiates impacts into the pre-construction and operating phases. Measuring the impacts of the implementation of the considered infrastructure project on the macroeconomic development of the country includes assessing the impact on regional GDP and tax revenues by region and production volume in major sectors of the economy, such as construction, industry, and agriculture, by subregions. We conclude with policy recommendations that show how the development of transport infrastructure supported by PPP mechanisms can contribute to inclusive economic growth.
5.2 Economic Background5.2.1 Growth of Gross Domestic Product
The macroeconomic situation in Kazakhstan has changed over the years depending on the influence of various external and internal factors. Indeed, the economic growth of the country has been volatile over the past 10 years. For example, the growth rate ranged from 10.7% in 2006 to 1.1% in 2016. Meanwhile, the average rate of real GDP growth was 5.5% between 2005 and 2016.
From 2014 to 2016, Kazakhstan experienced a slowdown in economic growth and accelerated prices. Real GDP growth shrank from 6% in 2013 to 1.1% in 2016 (Figure 5.1). This was spurred by deteriorating domestic demand. Moreover, the oil price drop that was observed in 2015 also affected the economy. The oil price shock, as well as the deteriorating external demand from the People’s Republic of China (PRC) and the Russian Federation for Kazakhstan’s crude oil, iron ore, and metal products, had a negative impact on the country’s economic growth trends. However, in 2017–2018, the recovery of world prices on the commodity markets boosted economic growth rates in Kazakhstan, with GDP in 2017 reaching T51.6 trillion in current prices, having increased by 4.1% in real terms, which is significantly above the 1.1% for the 2015–2016 period.
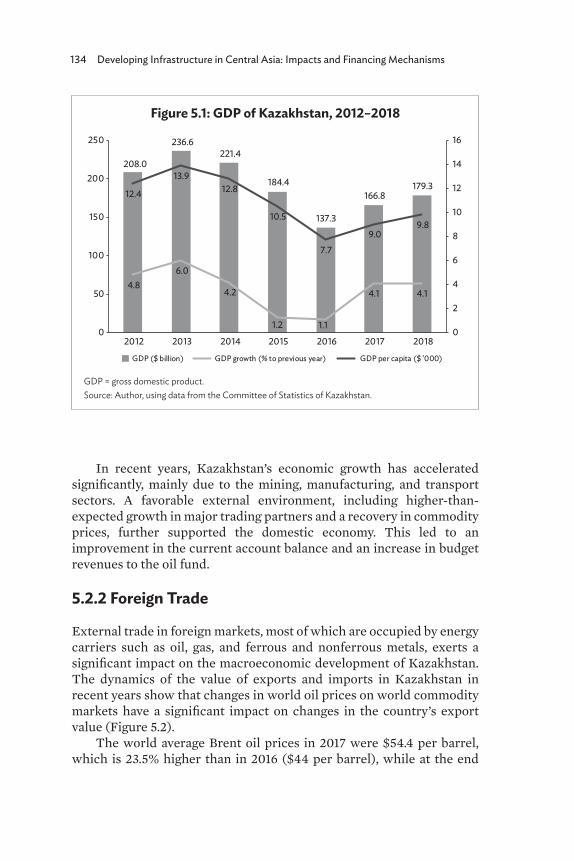
134 Developing Infrastructure in Central Asia: Impacts and Financing Mechanisms
In recent years, Kazakhstan’s economic growth has accelerated significantly, mainly due to the mining, manufacturing, and transport sectors. A favorable external environment, including higher-than-expected growth in major trading partners and a recovery in commodity prices, further supported the domestic economy. This led to an improvement in the current account balance and an increase in budget revenues to the oil fund.
5.2.2 Foreign Trade
External trade in foreign markets, most of which are occupied by energy carriers such as oil, gas, and ferrous and nonferrous metals, exerts a significant impact on the macroeconomic development of Kazakhstan. The dynamics of the value of exports and imports in Kazakhstan in recent years show that changes in world oil prices on world commodity markets have a significant impact on changes in the country’s export value (Figure 5.2).
The world average Brent oil prices in 2017 were $54.4 per barrel, which is 23.5% higher than in 2016 ($44 per barrel), while at the end
Figure 5.1: GDP of Kazakhstan, 2012–2018
GDP = gross domestic product. Source: Author, using data from the Committee of Statistics of Kazakhstan.
208.0
236.6221.4
184.4
137.3
166.8179.3
4.86.0
4.2
1.2 1.1
4.1 4.1
12.4
13.912.8
10.5
7.79.0
9.8
0
2
4
6
8
10
12
14
16
0
50
100
150
200
250
2012 2013 2014 2015 2016 2017 2018
GDP ($ billion) GDP growth (% to previous year) GDP per capita ($ '000)
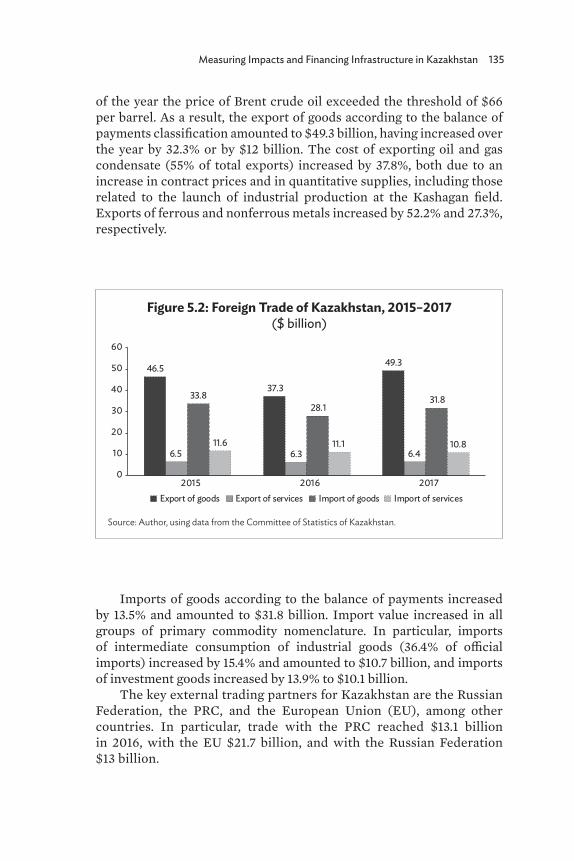
Measuring Impacts and Financing Infrastructure in Kazakhstan 135
of the year the price of Brent crude oil exceeded the threshold of $66 per barrel. As a result, the export of goods according to the balance of payments classification amounted to $49.3 billion, having increased over the year by 32.3% or by $12 billion. The cost of exporting oil and gas condensate (55% of total exports) increased by 37.8%, both due to an increase in contract prices and in quantitative supplies, including those related to the launch of industrial production at the Kashagan field. Exports of ferrous and nonferrous metals increased by 52.2% and 27.3%, respectively.
Figure 5.2: Foreign Trade of Kazakhstan, 2015–2017 ($ billion)
Source: Author, using data from the Committee of Statistics of Kazakhstan.
46.5
37.3
49.3
6.5 6.3 6.4
33.828.1
31.8
11.6 11.1 10.8
0
10
20
30
40
50
60
2015 2016 2017Export of goods Export of services Import of goods Import of services
Imports of goods according to the balance of payments increased by 13.5% and amounted to $31.8 billion. Import value increased in all groups of primary commodity nomenclature. In particular, imports of intermediate consumption of industrial goods (36.4% of official imports) increased by 15.4% and amounted to $10.7 billion, and imports of investment goods increased by 13.9% to $10.1 billion.
The key external trading partners for Kazakhstan are the Russian Federation, the PRC, and the European Union (EU), among other countries. In particular, trade with the PRC reached $13.1 billion in 2016, with the EU $21.7 billion, and with the Russian Federation $13 billion.
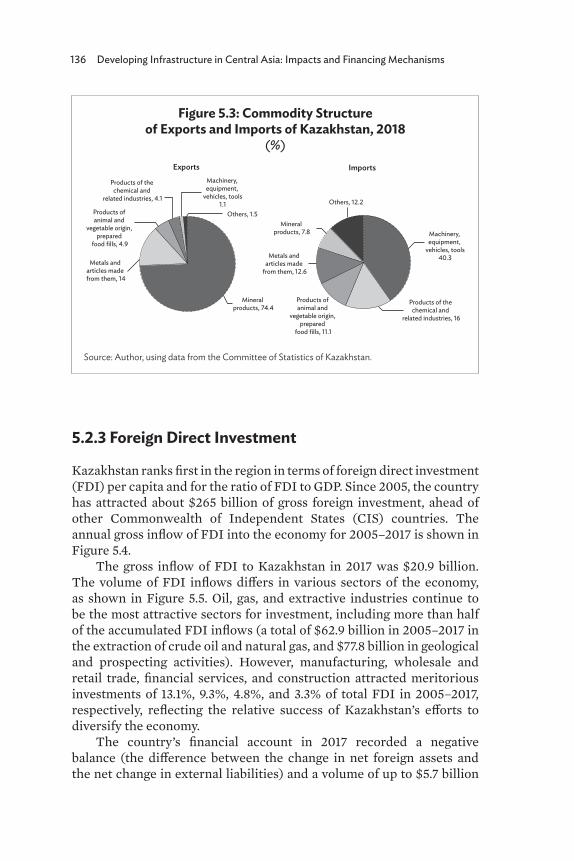
136 Developing Infrastructure in Central Asia: Impacts and Financing Mechanisms
5.2.3 Foreign Direct Investment
Kazakhstan ranks first in the region in terms of foreign direct investment (FDI) per capita and for the ratio of FDI to GDP. Since 2005, the country has attracted about $265 billion of gross foreign investment, ahead of other Commonwealth of Independent States (CIS) countries. The annual gross inflow of FDI into the economy for 2005–2017 is shown in Figure 5.4.
The gross inflow of FDI to Kazakhstan in 2017 was $20.9 billion. The volume of FDI inflows differs in various sectors of the economy, as shown in Figure 5.5. Oil, gas, and extractive industries continue to be the most attractive sectors for investment, including more than half of the accumulated FDI inflows (a total of $62.9 billion in 2005–2017 in the extraction of crude oil and natural gas, and $77.8 billion in geological and prospecting activities). However, manufacturing, wholesale and retail trade, financial services, and construction attracted meritorious investments of 13.1%, 9.3%, 4.8%, and 3.3% of total FDI in 2005–2017, respectively, reflecting the relative success of Kazakhstan’s efforts to diversify the economy.
The country’s financial account in 2017 recorded a negative balance (the difference between the change in net foreign assets and the net change in external liabilities) and a volume of up to $5.7 billion
Figure 5.3: Commodity Structure of Exports and Imports of Kazakhstan, 2018
(%)
Source: Author, using data from the Committee of Statistics of Kazakhstan.
Products of the chemical and
related industries, 4.1
Products of the chemical and
related industries, 16
Machinery, equipment,
vehicles, tools1.1
Machinery, equipment,
vehicles, tools40.3
Products of animal and
vegetable origin, prepared
food fills, 4.9
Products of animal and
vegetable origin, prepared
food fills, 11.1
Metals and articles made from them, 14
Metals and articles made
from them, 12.6
Others, 1.5
Others, 12.2
Mineral products, 74.4
Mineral products, 7.8
Exports Imports
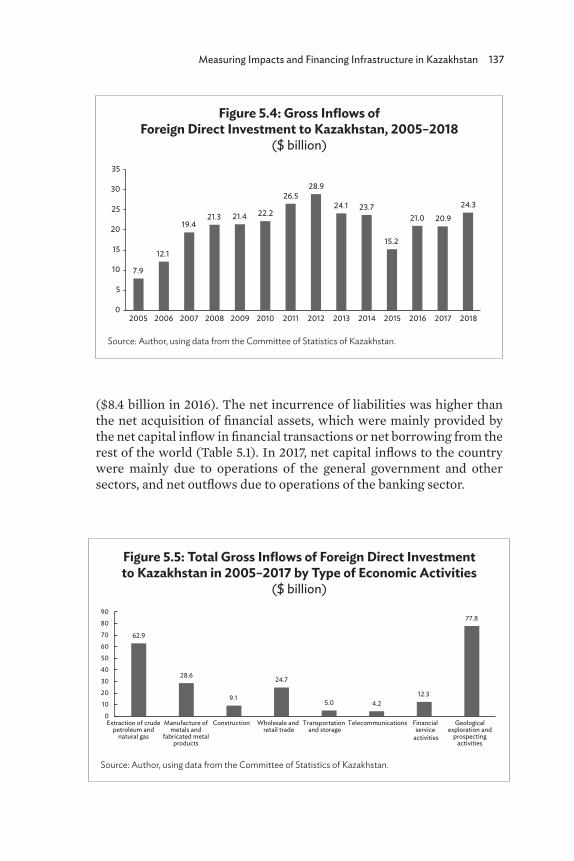
Measuring Impacts and Financing Infrastructure in Kazakhstan 137
($8.4 billion in 2016). The net incurrence of liabilities was higher than the net acquisition of financial assets, which were mainly provided by the net capital inflow in financial transactions or net borrowing from the rest of the world (Table 5.1). In 2017, net capital inflows to the country were mainly due to operations of the general government and other sectors, and net outflows due to operations of the banking sector.
Figure 5.4: Gross Inflows of Foreign Direct Investment to Kazakhstan, 2005–2018
($ billion)
Source: Author, using data from the Committee of Statistics of Kazakhstan.
7.9
12.1
19.421.3 21.4 22.2
26.528.9
24.1 23.7
15.2
21.0 20.9
24.3
0
5
10
15
20
25
30
35
2005 2006 2007 2008 2009 2010 2011 2012 2013 2014 2015 2016 2017 2018
Figure 5.5: Total Gross Inflows of Foreign Direct Investment to Kazakhstan in 2005–2017 by Type of Economic Activities
($ billion)
Source: Author, using data from the Committee of Statistics of Kazakhstan.
62.9
28.6
9.1
24.7
5.0 4.212.3
77.8
0
10
20
30
40
50
60
70
80
90
Extraction of crudepetroleum and
natural gas
Manufacture ofmetals and
fabricated metalproducts
Construction Wholesale and retail trade
Transportation and storage
Telecommunications Financial service
activities
Geologicalexploration and
prospectingactivities
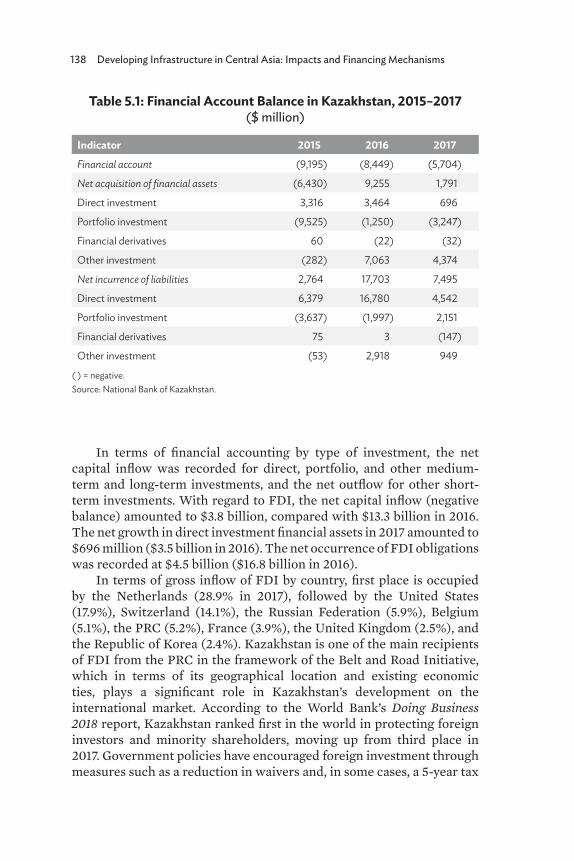
138 Developing Infrastructure in Central Asia: Impacts and Financing Mechanisms
In terms of financial accounting by type of investment, the net capital inflow was recorded for direct, portfolio, and other medium-term and long-term investments, and the net outflow for other short-term investments. With regard to FDI, the net capital inflow (negative balance) amounted to $3.8 billion, compared with $13.3 billion in 2016. The net growth in direct investment financial assets in 2017 amounted to $696 million ($3.5 billion in 2016). The net occurrence of FDI obligations was recorded at $4.5 billion ($16.8 billion in 2016).
In terms of gross inflow of FDI by country, first place is occupied by the Netherlands (28.9% in 2017), followed by the United States (17.9%), Switzerland (14.1%), the Russian Federation (5.9%), Belgium (5.1%), the PRC (5.2%), France (3.9%), the United Kingdom (2.5%), and the Republic of Korea (2.4%). Kazakhstan is one of the main recipients of FDI from the PRC in the framework of the Belt and Road Initiative, which in terms of its geographical location and existing economic ties, plays a significant role in Kazakhstan’s development on the international market. According to the World Bank’s Doing Business 2018 report, Kazakhstan ranked first in the world in protecting foreign investors and minority shareholders, moving up from third place in 2017. Government policies have encouraged foreign investment through measures such as a reduction in waivers and, in some cases, a 5-year tax
Table 5.1: Financial Account Balance in Kazakhstan, 2015–2017 ($ million)
Indicator 2015 2016 2017Financial account (9,195) (8,449) (5,704)
Net acquisition of financial assets (6,430) 9,255 1,791
Direct investment 3,316 3,464 696
Portfolio investment (9,525) (1,250) (3,247)
Financial derivatives 60 (22) (32)
Other investment (282) 7,063 4,374
Net incurrence of liabilities 2,764 17,703 7,495
Direct investment 6,379 16,780 4,542
Portfolio investment (3,637) (1,997) 2,151
Financial derivatives 75 3 (147)
Other investment (53) 2,918 949
( ) = negative. Source: National Bank of Kazakhstan.
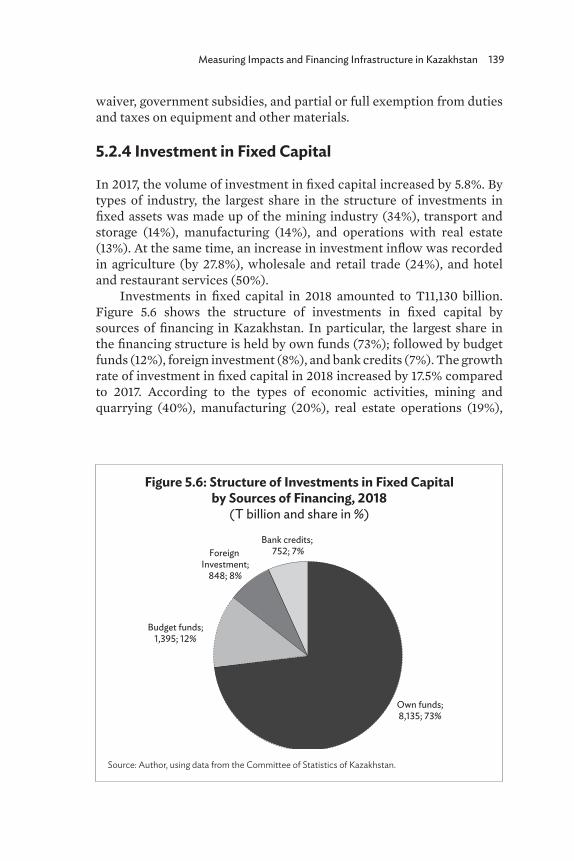
Measuring Impacts and Financing Infrastructure in Kazakhstan 139
waiver, government subsidies, and partial or full exemption from duties and taxes on equipment and other materials.
5.2.4 Investment in Fixed Capital
In 2017, the volume of investment in fixed capital increased by 5.8%. By types of industry, the largest share in the structure of investments in fixed assets was made up of the mining industry (34%), transport and storage (14%), manufacturing (14%), and operations with real estate (13%). At the same time, an increase in investment inflow was recorded in agriculture (by 27.8%), wholesale and retail trade (24%), and hotel and restaurant services (50%).
Investments in fixed capital in 2018 amounted to T11,130 billion. Figure 5.6 shows the structure of investments in fixed capital by sources of financing in Kazakhstan. In particular, the largest share in the financing structure is held by own funds (73%); followed by budget funds (12%), foreign investment (8%), and bank credits (7%). The growth rate of investment in fixed capital in 2018 increased by 17.5% compared to 2017. According to the types of economic activities, mining and quarrying (40%), manufacturing (20%), real estate operations (19%),
Figure 5.6: Structure of Investments in Fixed Capital by Sources of Financing, 2018
(T billion and share in %)
Source: Author, using data from the Committee of Statistics of Kazakhstan.
Own funds;8,135; 73%
Budget funds;1,395; 12%
Foreign Investment;
848; 8%
Bank credits; 752; 7%
140 Developing Infrastructure in Central Asia: Impacts and Financing Mechanisms
and transportation and storage (10%) remained the most attractive for investment. A current goal of the state investment policy is to invest in infrastructure, stimulate the development of the nonoil sector, and increase the role of the private sector in the economy.
5.3 Development of Public–Private Partnerships
5.3.1 Legislative Framework
The stage of preparing PPPs in Kazakhstan began in the first years of independence in 1991 and was initially considered an element of managing state assets, which was due to the presence of large reserves of natural and energy resources, and industrial and transport potential. The main regulatory legal acts concerning relations between the state and businesses were the Civil Code of the Republic of Kazakhstan as well as the Law of the Republic of Kazakhstan “On privatization,” “On joint-stock companies,” and “On public procurement.”
The first instrument regulating PPPs in Kazakhstan was a concession that was originally considered to be the transfer of property, land, and/or natural resources to a foreign legal entity or individual—the concessionaire; that is, it was determined through the prism of a lease (property lease) contract, although at the same time in the concession relations there could be other elements of contract. To implement this mechanism, the first Law of the Republic of Kazakhstan “On concessions” was accepted on 23 December 1991 and was operational until 1993. It regulated the organizational, economic, and legal conditions for granting facilities to a concession only to foreign investors in Kazakhstan’s territory. With the adoption of the new Law of the Republic of Kazakhstan “On concessions” on 7 July 2006, a legal framework was created allowing the private sector to invest financial and technological resources for the implementation of investment projects using the concession mechanism not only for foreign investors but also for domestic investors. In general, a number of laws and by-laws were adopted, on the basis of which a single law “On public–private partnership” was implemented on 31 October 2015, which contains the fundamental norms and principles that are the basis for regulating PPPs in various spheres of the economy.
In 2011, Kazakhstan adopted the first policy document on PPP issues, the PPP Development Program in Kazakhstan for 2011–2015, whose goal was to create a legislative and institutional framework for implementing investment projects using PPP mechanisms in Kazakhstan. One of the main directions of the program is the introduction of project financing to attract institutional investors both to PPP projects and to the economy
Measuring Impacts and Financing Infrastructure in Kazakhstan 141
of Kazakhstan as a whole. The government has been trying to implement PPP principles in a stepwise manner. Ongoing structural and institutional reforms include those under the 100 Concrete Steps program and the Strategic Plan for Development of Kazakhstan until 2025. Concurrently, the government continued to encourage infrastructure development by implementing several strategic programs, such as Nurly Zhol and the State Program for Industrial and Innovative Development for 2015–2019 (Office of the President 2014), aimed at enhancing transport infrastructure, transit potential, and diversification of the economy. According to these programs, Kazakhstan’s industrial development is seen as the main condition for the growth of the national economy. Thus, there is a required legislative base and conditions are created to facilitate the growth of the activity of PPP projects in Kazakhstan.
5.3.2 Institutional Forms
In Kazakhstan, PPPs in terms of implementation are divided into institutional and contractual. An institutional PPP is carried out by a company in accordance with the PPP agreement. A contractual PPP is implemented by concluding a PPP agreement, including the following types: concessions; trust management of state property; property (rental) of state property; leasing; contracts for the development of technology, prototyping, pilot testing, and small-scale production; life cycle contract; service contract; and other contracts that meet the characteristics of PPPs.1 While implementing certain types of contractual PPPs, the provisions of the relevant laws are applied, including the features provided with the Law of the Republic of Kazakhstan “On concessions.”2
Depending on the form of ownership, management, and financing, the following main PPP models can be distinguished, although in their pure form these models are rare and various mixed forms are used:
• The operator model, characterized by a clear division of responsibilities between the private partner and the state while maintaining control functions over the state, has become widespread in waste processing.
• The cooperation model is implemented through a joint project company of the state and a private investor when specific services are insufficiently defined and it is difficult to make them separate objects of taxation and depreciation.
1 Law of the Republic of Kazakhstan “On public–private partnership” (art. 7).2 Law of the Republic of Kazakhstan “On concessions” (with changes and additions to
29 September 2014).
142 Developing Infrastructure in Central Asia: Impacts and Financing Mechanisms
• The concession model is valid in industries with a long experience of implementation of projects, usually infrastructure, as well as in cases where the transfer of property rights from the state to a private partner is excluded for political or legal reasons.
• The negotiable model is used in industries in which investments, first and foremost, are aimed at reducing current costs, for instance in the energy sector. Often, the savings received from the reduction in current costs exceed the actual investment costs.
• The leasing model is one of the forms of partnership between local governments and private businesses, and also is most suitable for the construction of public buildings.
5.3.3 Government Agencies
The Government of Kazakhstan in 2008 established a specialized organization for PPP issues, the joint-stock company Kazakhstan Public–Private Partnership Center (PPP Center) with 100% state participation, the sole shareholder of which was the Ministry of Economy and Budget Planning representing the government. The main focus of the PPP Center is the economic examination of investment projects with state participation (concession projects, budget investment projects, and budget investments with government participation in the authorized capital of legal entities). The PPP Center is also working on improving the legislative framework and strategic development of the PPP system in Kazakhstan.
To expand the use of PPPs in the regions, as well as for closer interaction with government agencies, international and public organizations, and potential investors, regional PPP centers are being created in a number of regions. Thus, the first regional PPP center was established in 2010 in the Karaganda region, followed later by the East Kazakhstan, Pavlodar, South Kazakhstan, Mangystau, and Almaty regions. Corresponding structures have been created in the cities of Astana and Almaty.
The PPP Center has signed memorandums of understanding and cooperation with local executive bodies, commercial organizations, and foreign specialized organizations on PPP issues. The center actively cooperates with international organizations such as the World Bank, the Asian Development Bank, the European Bank for Reconstruction and Development, and the European Center for Public–Private Partnerships at the United Nations.3
3 See resources on the Kazakhstan Center for Public–Private Partnerships website at http://kzppp.kz.
Measuring Impacts and Financing Infrastructure in Kazakhstan 143
For the implementation and management of concession projects of the PPP Center, an appropriate organizational mechanism was developed, consisting of interconnected decision-making stages. When planning a PPP project, authorized persons, if necessary, create a project team, attracting specialists from subordinate organizations; independent experts; design, engineering, and other companies; interested state bodies; and business entities and consultants. The project team performs the following functions:
• considers proposals and initiatives on PPP project implementation mechanisms; selects, evaluates, and prioritizes them; and determines the implementation method, type of tender, issues related to the allocation of land, connection to utility networks, and other key parameters of the PPP project;
• studies the results of marketing and other necessary studies on the planned PPP project; and
• studies all necessary calculations, including preliminary ones, of the PPP project.
Financial and other organizations interested in financing the PPP project have the right to participate in the development and discussion of the project concept, the tender documentation, and the draft PPP agreement, including making proposals on the financing scheme for the project, ensuring obligations on borrowed funds are fulfilled.
5.3.4 Implementation Stages and Current State
The PPP Center conducted an examination of concession projects in such areas as construction and operation of roads, construction and operation of road infrastructure facilities, construction and operation of health facilities, and construction and operation of preschool organizations (kindergartens). According to the data of the PPP Center, as of 1 June 2020, 786 PPP agreements were concluded worth T1.8 trillion, of which 10 are agreements at the republic level and 776 are agreements at the local level (Mataev 2020). The have attracted investments amounting to T910 billion. PPPs are most actively developing in the field of education, where 437 agreements were concluded worth T115 billion. More than half of the PPP projects in education are concluded with preschool organizations, with 240 agreements concluded worth T70 billion. Within the framework of these projects, work was carried out on new construction and reconstruction, restoration, modernization, and operation of buildings of preschool institutions (Mataev 2020).
Thus, PPP projects in education account for more than half (55%) of the total number of PPP contracts in Kazakhstan. In second
144 Developing Infrastructure in Central Asia: Impacts and Financing Mechanisms
and third place are the health-care and utilities sectors, respectively. At the same time, the largest projects have been implemented in the field of transport and infrastructure. For example, the main reasons for implementing only 24 PPP projects in transport and infrastructure indicate that projects in this area are capital-intensive. The largest PPP projects in the transport and energy sectors of Kazakhstan at the republic level are the following: construction and operation of the Shar–Ust–Kamenogorsk railway line, construction and operation of the passenger terminal at Aktau International Airport, and construction and operation of the interregional power transmission line in the North Kazakhstan–Aktobe region. The remaining projects were completed and implemented in the regions. They cover various fields and have a social orientation, such as health care, education, physical education and sports, housing and communal services, and culture. In terms of railway PPPs, three major projects have been implemented: the Shar–Oskemen railroad in the East Kazakhstan region, a segment of railroad between Yeralievo and Kuryk near the Caspian Sea in the west, and a railway between Khorgos and Zhetygen in the east, the impact of which we consider in our empirical study.
5.3.5 Challenges and Opportunities
Evaluating and reviewing PPP projects reveal some problems and limitations in the implementation of PPP mechanisms caused by a conflict between private and public interests within the PPP framework, such as:
• the difficulty of accurately assessing the benefits to the state from PPP agreements;
• an increase in costs due to the complexity of the tenders and the approval of PPP agreements in comparison with the established procedures for public procurement;
• the complicated procedure for selecting and approving a private partner and evaluating the effectiveness of PPP projects;
• complexities in forecasting the risks associated with PPP projects;
• the possibility of increasing fees from consumers after the cancellation of explicit or implicit subsidies; and
• the need for a thorough study of projects, as not all projects are suitable for PPPs.
Therefore, the main factors hindering the further development of PPPs in Kazakhstan are the high institutional and commercial risks, as well as legislative and operational restrictions that prevent private
Measuring Impacts and Financing Infrastructure in Kazakhstan 145
investors from obtaining an acceptable return on their investment. Despite these problems and challenges, the PPP mechanism is sufficiently effective, requiring the involvement of both the state in the form of an authorized body and private businesses for the implementation of a joint project on the basis of mutual benefit in order to achieve economically significant results.
Currently, the main method for assessing the implementation of a PPP project and its impact on various economic indicators is an expert analytical method. One of the drawbacks of this expert approach to evaluating investment projects is its subjectivity depending on the opinions of experts. For a more objective approach, a quantitative approach to assessing PPP projects is preferable. In this regard, the second part of our study considers measuring the impact of an infrastructure project at the regional and subregional levels in Kazakhstan using econometric assessment methods; namely, we calculate the impact of project implementation using the DiD approach, which was described in Yoshino and Abidhadjaev (2017b) in assessing the implementation of infrastructure projects in other countries. In order to expand the possibilities of implementing a PPP project in Kazakhstan, we recommend taking into account the impact of the project on the regional and subregional levels. In the next part of this study, we conduct an empirical analysis of implementing an infrastructure project as an example.
5.4 Methodology, Data, and Results
5.4.1 Khorgos–Zhetygen Railway
In the present research, in order to investigate the impact of investment in infrastructure in Kazakhstan, we consider the construction project of the Khorgos-Zhetygen railway, which is located in the Almaty region in the eastern region of country on the border with the PRC. ICBC “Khorgos,” one of the largest projects undertaken on initiatives by the leaders of Kazakhstan and the PRC, aims to develop cross-border trade, and economic, scientific, technical, and cultural cooperation between the two countries, as well as to increase the transit potential of both countries.
The construction of the new Khorgos–Zhetygen railway line is of strategic importance, since its launch has opened a second railway crossing between Kazakhstan and the PRC. ICBC “Khorgos” consists of two parts: the Kazakhstani part located in the Panfilov subregion of the Almaty region, and the PRC part located in the Ili-Kazakh Autonomous
146 Developing Infrastructure in Central Asia: Impacts and Financing Mechanisms
Prefecture of the Xinjiang Uyghur Autonomous Region. The Almaty region is located in the extreme southeast of Kazakhstan and borders the PRC in the east. The Kazakhstan part of the Great Silk Road passes through this region’s territory. In this regard, we use the DiD approach in our study to analyze this region.
As part of ICBC Khorgos, several infrastructure projects were implemented, including the construction of the Khorgos–Zhetygen railway, which allowed the distance from the PRC to the southern regions of Kazakhstan and Central Asian countries to be reduced by 550 kilometers (km). During the implementation of this project, the main 293 km long railway was built. Construction was also completed of 28 bridges and two overpasses on the Khorgos–Zhetygen section and of office and technical buildings at 14 new dividing points. In Kazakhstan, a railway station building and an administrative building at the Altynkol border station and engineering networks with their facilities were also built. In addition, many infrastructure facilities were constructed, such as houses for railway workers and government employees, along with facilities such as a school, a kindergarten, and a clinic, among others. After the launch of the railway, more than 2,000 jobs were created. Given the favorable political environment, the mild investment climate, and the strategic location of the project area, the construction of the Khorgos–Zhetygen railway can be called a breakthrough project in the infrastructure sector of the economy, one that accelerated the development of the entire complex of customs, transport, tourism, and other infrastructure development in the area and the transit potential of the country as a whole in the international logistics business system.
5.4.2 Data
Subregional ModelKazakhstan consists of 14 regions (oblasts) and the two largest cities are Almaty and the capital Nur-Sultan (Astana). Further, according to the administrative-territorial division of the country, the regions are divided into subregions (rayons). In this study, we consider the impact of implementing an infrastructure project both at the regional level and at the subregional level. Consideration of the impact of the project at the subregional level allows a more accurate assessment of the impact of the project on the development of the subregions in which the project was implemented. Therefore, we first consider the impact of the project at the local level or at the level of subregions. In this case, we build a subregional model; that is, a model at the level of subregions or rayon level. Thus, conducting research at the subregional level makes
Measuring Impacts and Financing Infrastructure in Kazakhstan 147
the subject of the research more accurate and allows us to assess the impact of the investment project on the economic indicators at the local level.
In constructing the econometric model, we use the DiD approach to measure the impact of the infrastructure project under consideration in Kazakhstan. The DiD method help us to measure the difference between an actual result and an alternative outcome. To do this, we divide the data into control and treated groups based on geography and time. As the treated group using the DiD approach, we consider the subregions of the Almaty region through which the railway was constructed. The construction of the Kazakhstani section of the Khorgos–Zhetygen railway passes through the Panfilovsky, Uygurskiy, and Enbekshi–Kazakhskiy subregions of the Almaty region. We selected these subregions as the treated group under consideration in the subregional model. Thus, we consider the impact of railway construction on the economic performance of these three subregions of the Almaty region at the subregional level.
When choosing a control group at the regional level, we considered various regions of Kazakhstan. However, regions specializing in oil production and where investments are mainly made in the oil sector were excluded, which mainly relate to the western regions of the country. In the control group at the subregional level, we included one subregion in each of the selected regions of Kazakhstan. When choosing control subregions, we were guided by the relative similarity of the economic structure of these subregions with those under consideration in the treated group. Also, for comparison with the treated area using the DiD approach, we selected the control group to be those subregions that are not investing in the construction of railways at the relevant time. Table 5.2 presents the subregions of different regions of Kazakhstan included in the treated and the control group regarding the location of the Khorgos–Zhetygen railway.
The results from applying the DiD method should reflect the difference between pre- and post-intervention data. By observing the changes in both groups over time, the DiD coefficient can be calculated and serve as a measure of impact. We distinguish between short- and medium-term effects and differentiate among three time periods, since we wish to see the impact on the various operating phases of the project:
• Pre-construction: 2000–2008• Operation phase 1: 2009–2012• Operation phase 2: 2013–2017
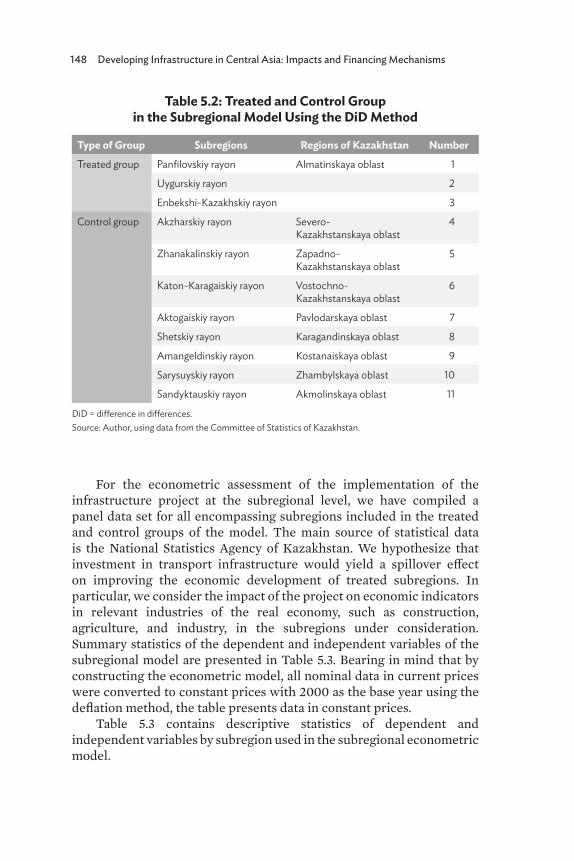
148 Developing Infrastructure in Central Asia: Impacts and Financing Mechanisms
For the econometric assessment of the implementation of the infrastructure project at the subregional level, we have compiled a panel data set for all encompassing subregions included in the treated and control groups of the model. The main source of statistical data is the National Statistics Agency of Kazakhstan. We hypothesize that investment in transport infrastructure would yield a spillover effect on improving the economic development of treated subregions. In particular, we consider the impact of the project on economic indicators in relevant industries of the real economy, such as construction, agriculture, and industry, in the subregions under consideration. Summary statistics of the dependent and independent variables of the subregional model are presented in Table 5.3. Bearing in mind that by constructing the econometric model, all nominal data in current prices were converted to constant prices with 2000 as the base year using the deflation method, the table presents data in constant prices.
Table 5.3 contains descriptive statistics of dependent and independent variables by subregion used in the subregional econometric model.
Table 5.2: Treated and Control Group in the Subregional Model Using the DiD Method
Type of Group Subregions Regions of Kazakhstan NumberTreated group Panfilovskiy rayon Almatinskaya oblast 1
Uygurskiy rayon 2
Enbekshi-Kazakhskiy rayon 3
Control group Akzharskiy rayon Severo- Kazakhstanskaya oblast
4
Zhanakalinskiy rayon Zapadno-Kazakhstanskaya oblast
5
Katon-Karagaiskiy rayon Vostochno-Kazakhstanskaya oblast
6
Aktogaiskiy rayon Pavlodarskaya oblast 7
Shetskiy rayon Karagandinskaya oblast 8
Amangeldinskiy rayon Kostanaiskaya oblast 9
Sarysuyskiy rayon Zhambylskaya oblast 10
Sandyktauskiy rayon Akmolinskaya oblast 11
DiD = difference in differences.Source: Author, using data from the Committee of Statistics of Kazakhstan.
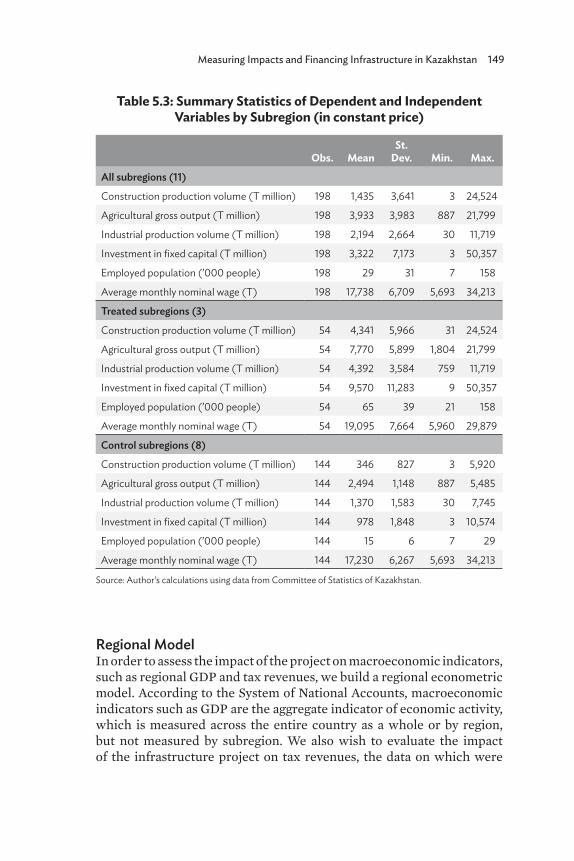
Measuring Impacts and Financing Infrastructure in Kazakhstan 149
Table 5.3: Summary Statistics of Dependent and Independent Variables by Subregion (in constant price)
Obs. MeanSt.
Dev. Min. Max.All subregions (11)
Construction production volume (T million) 198 1,435 3,641 3 24,524
Agricultural gross output (T million) 198 3,933 3,983 887 21,799
Industrial production volume (T million) 198 2,194 2,664 30 11,719
Investment in fixed capital (T million) 198 3,322 7,173 3 50,357
Employed population (’000 people) 198 29 31 7 158
Average monthly nominal wage (T) 198 17,738 6,709 5,693 34,213
Treated subregions (3)
Construction production volume (T million) 54 4,341 5,966 31 24,524
Agricultural gross output (T million) 54 7,770 5,899 1,804 21,799
Industrial production volume (T million) 54 4,392 3,584 759 11,719
Investment in fixed capital (T million) 54 9,570 11,283 9 50,357
Employed population (’000 people) 54 65 39 21 158
Average monthly nominal wage (T) 54 19,095 7,664 5,960 29,879
Control subregions (8)
Construction production volume (T million) 144 346 827 3 5,920
Agricultural gross output (T million) 144 2,494 1,148 887 5,485
Industrial production volume (T million) 144 1,370 1,583 30 7,745
Investment in fixed capital (T million) 144 978 1,848 3 10,574
Employed population (’000 people) 144 15 6 7 29
Average monthly nominal wage (T) 144 17,230 6,267 5,693 34,213
Source: Author’s calculations using data from Committee of Statistics of Kazakhstan.
Regional ModelIn order to assess the impact of the project on macroeconomic indicators, such as regional GDP and tax revenues, we build a regional econometric model. According to the System of National Accounts, macroeconomic indicators such as GDP are the aggregate indicator of economic activity, which is measured across the entire country as a whole or by region, but not measured by subregion. We also wish to evaluate the impact of the infrastructure project on tax revenues, the data on which were
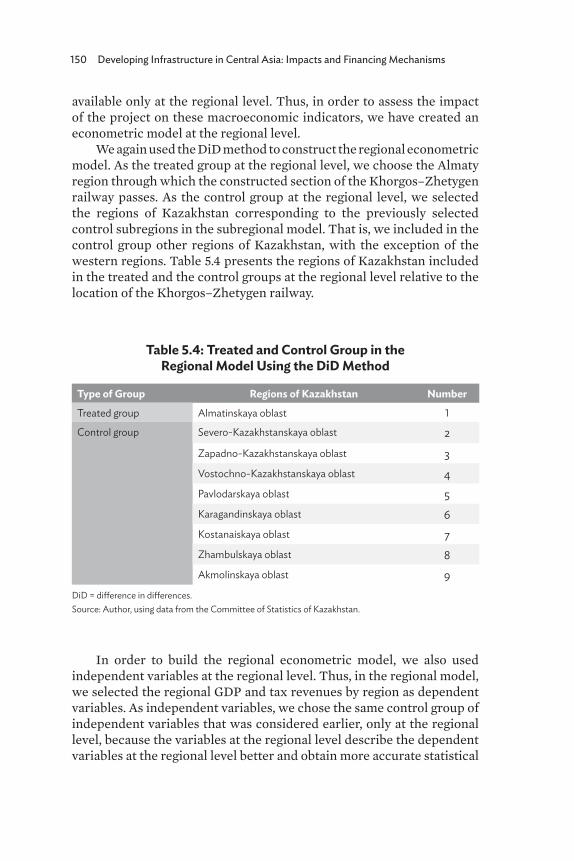
150 Developing Infrastructure in Central Asia: Impacts and Financing Mechanisms
available only at the regional level. Thus, in order to assess the impact of the project on these macroeconomic indicators, we have created an econometric model at the regional level.
We again used the DiD method to construct the regional econometric model. As the treated group at the regional level, we choose the Almaty region through which the constructed section of the Khorgos–Zhetygen railway passes. As the control group at the regional level, we selected the regions of Kazakhstan corresponding to the previously selected control subregions in the subregional model. That is, we included in the control group other regions of Kazakhstan, with the exception of the western regions. Table 5.4 presents the regions of Kazakhstan included in the treated and the control groups at the regional level relative to the location of the Khorgos–Zhetygen railway.
In order to build the regional econometric model, we also used independent variables at the regional level. Thus, in the regional model, we selected the regional GDP and tax revenues by region as dependent variables. As independent variables, we chose the same control group of independent variables that was considered earlier, only at the regional level, because the variables at the regional level describe the dependent variables at the regional level better and obtain more accurate statistical
Table 5.4: Treated and Control Group in the Regional Model Using the DiD Method
Type of Group Regions of Kazakhstan NumberTreated group Almatinskaya oblast 1
Control group Severo-Kazakhstanskaya oblast 2Zapadno-Kazakhstanskaya oblast 3Vostochno-Kazakhstanskaya oblast 4Pavlodarskaya oblast 5Karagandinskaya oblast 6Kostanaiskaya oblast 7Zhambulskaya oblast 8Akmolinskaya oblast 9
DiD = difference in differences. Source: Author, using data from the Committee of Statistics of Kazakhstan.
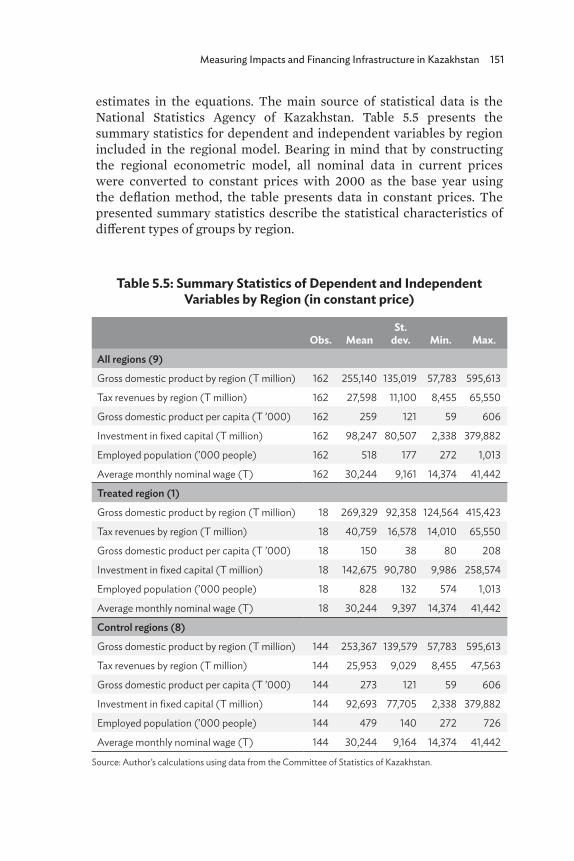
Measuring Impacts and Financing Infrastructure in Kazakhstan 151
estimates in the equations. The main source of statistical data is the National Statistics Agency of Kazakhstan. Table 5.5 presents the summary statistics for dependent and independent variables by region included in the regional model. Bearing in mind that by constructing the regional econometric model, all nominal data in current prices were converted to constant prices with 2000 as the base year using the deflation method, the table presents data in constant prices. The presented summary statistics describe the statistical characteristics of different types of groups by region.
Table 5.5: Summary Statistics of Dependent and Independent Variables by Region (in constant price)
Obs. MeanSt.
dev. Min. Max.All regions (9)
Gross domestic product by region (T million) 162 255,140 135,019 57,783 595,613
Tax revenues by region (T million) 162 27,598 11,100 8,455 65,550
Gross domestic product per capita (T ’000) 162 259 121 59 606
Investment in fixed capital (T million) 162 98,247 80,507 2,338 379,882
Employed population (’000 people) 162 518 177 272 1,013
Average monthly nominal wage (T) 162 30,244 9,161 14,374 41,442
Treated region (1)
Gross domestic product by region (T million) 18 269,329 92,358 124,564 415,423
Tax revenues by region (T million) 18 40,759 16,578 14,010 65,550
Gross domestic product per capita (T ’000) 18 150 38 80 208
Investment in fixed capital (T million) 18 142,675 90,780 9,986 258,574
Employed population (’000 people) 18 828 132 574 1,013
Average monthly nominal wage (T) 18 30,244 9,397 14,374 41,442
Control regions (8)
Gross domestic product by region (T million) 144 253,367 139,579 57,783 595,613
Tax revenues by region (T million) 144 25,953 9,029 8,455 47,563
Gross domestic product per capita (T ’000) 144 273 121 59 606
Investment in fixed capital (T million) 144 92,693 77,705 2,338 379,882
Employed population (’000 people) 144 479 140 272 726
Average monthly nominal wage (T) 144 30,244 9,164 14,374 41,442
Source: Author’s calculations using data from the Committee of Statistics of Kazakhstan.
152 Developing Infrastructure in Central Asia: Impacts and Financing Mechanisms
5.4.3 Difference-in-Differences Approach
Subregional Econometric ModelThe DiD approach enables us to see the effect of the particular infrastructure project by computing the difference over time (before and after the intervention) and across different regions. As explained, it helps us to measure the difference between an actual result and an alternative outcome, by dividing the data into treatment and control groups. The results should reflect the difference between pre- and post-intervention data. By observing the changes in both groups over time, a DiD coefficient can be calculated, which will serve as a measure of impact.
We assume that the launch of the railway will have an impact on improving economic efficiency in the respective subregions of the treated group. Our objective is to estimate the impact of infrastructure investment from construction of the railway connection on key economic indicators of treated subregions. In order to study the impact of the implementation of this project on the real economy by subregion, we consider three economic indicators: the real volume of output for each of the sectors, namely construction, agriculture, and industry. When calculating the econometric model, we converted all variables in nominal volume in tenge in current prices into the real volume in constant prices using deflation.
According to the DiD method, in order to test the various impacts on economic performance over time, we distinguish three periods: the pre-railway period is 2000–2008, the first phase of operation is 2009–2012, and the second phase of operation is 2013–2017. The DiD coefficient is estimated for each of these time periods. Hereby, we specify an assessment equation related to the affected subregional group. The DiD coefficients represent deviations from those subregions that are not included in the affected groups. Then, we evaluate the equation separately for each of the three subregional indicators of the relevant sectors of the real economy in the subregions under consideration, for a total of three regressions. Our estimating equation in the subregional model is as follows:
Yit = ai + X'it * β + δ1 * Dtr * D9−12 + δ2 * Dtr * D13−17, (1)
where Yit is the real volume of production of relevant economic sectors of the real economy (construction, agriculture, and industry) by subregion.
Dependent variables: • IND is the real volume of industrial production by subregion,
total in constant price (million tenge).
Measuring Impacts and Financing Infrastructure in Kazakhstan 153
• AGR is the real gross agricultural output by subregion, in constant price (million tenge).
• CNS is the real volume of construction production by subregion, in constant price (million tenge).
Independent variables: (included in X’ a vector of control variables)• INV is the real volume of investment in fixed capital by
subregion, in constant price (million tenge).• AWG is the real average monthly wage by subregion, in constant
price (tenge).• EMP is the employed population by subregion (thousand
people).• GDPC is the real gross domestic product per capita by region, in
constant price (thousand tenge).
Binary variables in DiD model:• Dtr is the binary variable indicating whether or not the
observation belongs to the treated subregions.• D9−12 and D13−17 are binary variables indicating whether or not
the observation belongs to the respective time periods for years 2009–2012 or 2013–2017.
• Dtr * D9−12 and Dtr * D13−17 are DiD binary variables indicating whether or not the observation belongs to the respective time periods and treated subregions.
As the economic structure in our model, we considered the dependent variables describing the volume of production of main sectors of the real economy, such as industry, agriculture, and construction, by a subregion under consideration. A number of different factors might affect the level of economic activity in the sector. Based on the estimated effect and the availability of subregional economic data, we have selected control economic variables that could influence the economic outcomes in the subregions. In particular, as independent variables we selected the GDP per capita by region and investment in fixed capital, employed population, and average monthly nominal wage by subregion. For differentiating the regional and year effects, we entered into the model the binary variables indicating whether the observation belongs to the respective years or type of region.
Regional Econometric Model At the regional level, we examine the impact of the project implementation on the GDP of the region under study. Moreover, the economic impact of investments in infrastructure can be caused by an
154 Developing Infrastructure in Central Asia: Impacts and Financing Mechanisms
increase in tax revenues in the region concerned. The DiD approach (Yoshino and Abidhadjaev 2017b; Yoshino and Pontines 2015) can be used to compute the effect of spillovers on tax revenues in places where infrastructure investment occurred compared to ones where no infrastructure investment took place. Therefore, this study uses dependent variables such as GDP and tax revenues to estimate the spillover effects of infrastructure investments. In accordance with the DiD approach, we separate the data into the control group and the treated group based on a geographic principle and time, making a distinction between the pre-intervention or baseline data and the post-intervention data.
We specify an assessment equation related to the affected regional group. In particular, we estimate the equation separately for each of the two macroeconomic indicators, namely regional GDP and tax income by region, in total for two regressions. As was done in the subregional model, when calculating the regional econometric model, we converted all the variables in nominal volume in tenge in current prices into the real volume in constant prices using deflation. In accordance with the DiD method, we selected the time periods in the same way as in the subregional model. In particular, we denote the pre-railway period as 2000–2008, while the construction period is 2009–2012, and the post-construction period is 2013–2017. The DiD coefficients are estimated for each of these time periods. Our estimating equation in the regional model is as follows:
Yit = ai + X'it * β + δ1 * Dtr * D9−12 + δ2 * Dtr * D13−17, (2)
where Yit is the dependent variable, describing regional GDP or tax revenues by region.
Dependent variables: • GDP is the real GDP by region, in constant price (million tenge).• TAXREG is the real tax income by region, in constant price
(million tenge).
Independent variables: (included in X’ a vector of control variables)• INVREG is the real volume of investments in fixed capital by
region, in constant price (million tenge).• EMPREG is the employed population by region (thousand
people).• GDPREGC is the real GDP per capita by region, in constant
price (thousand tenge).• AWGREG is the real average monthly wage by region, in
constant price (tenge).
Measuring Impacts and Financing Infrastructure in Kazakhstan 155
Binary variables in DiD model:• Dtr is the binary variable indicating whether or not the
observation belongs to the treated region;• D9−12 and D13−17 are binary variables indicating whether or not the
observation belongs to the respective time periods for the years 2009–2012 or 2013–2017;
• Dtr * D9−12 and Dtr * D13−17 are DiD binary variables indicating whether or not the observation belongs to the respective time periods and the treated region.
Based on the estimated effect and the availability of regional economic data, we have selected control economic variables that could influence the economic outcomes in regions. In particular, as independent variables, we selected the GDP per capita by region and investment in fixed capital, employed population, and average monthly nominal wage by region. For differentiating the regional and year effects, we entered into the model the binary variables indicating whether the observation belongs to the respective years or type of region.
5.4.4 Empirical Results
Subregional Estimation ResultsThe report on the results of the regression is organized in accordance with the effects on the dependent variables in the subregional model. The results for the subregions under study are shown in Table 5.6. From these results, the main conclusions were drawn on the impact on the real economy of the treated group and the time period at the subregional level.
As can be seen from the results of the subregional models, the obtained adjusted coefficients of determination (adjusted R-squared) are high, which indicates that the models are well suited for the data and able to predict well most variations in the response data or to explain the results of the regression. In addition, the regression results show that the selected independent variables are statistically significant in almost all regression equations. Generally, the results of the regression model show good explanatory power of the selected independent variables for predicting dependent variables, such as production in the construction, agriculture, and industry sectors of the real economy.
The evaluation coefficients in this model are different in various branches of the real economy. As can be seen from Table 5.6, the most significant independent variable, which has a positive effect on the increase of the production volume in all sectors of the economy, is population employment by subregion (significantly at 1%). According
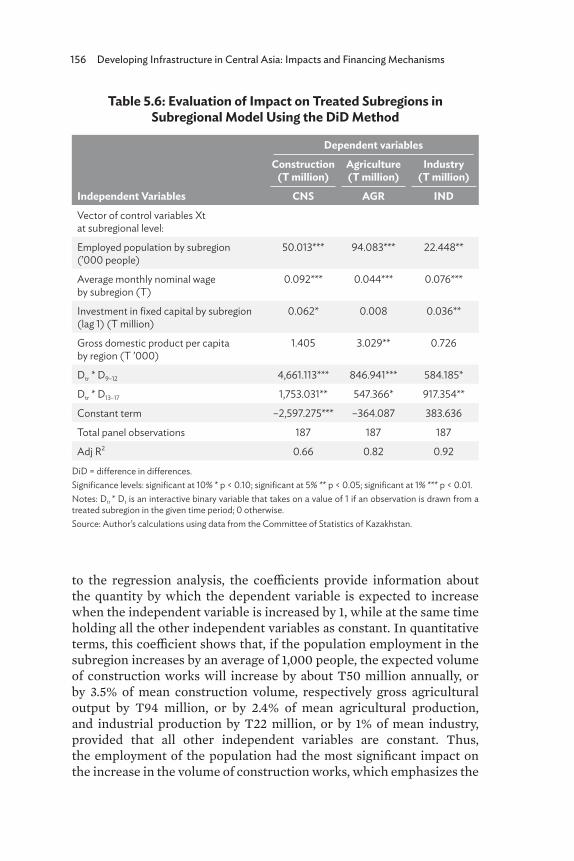
156 Developing Infrastructure in Central Asia: Impacts and Financing Mechanisms
to the regression analysis, the coefficients provide information about the quantity by which the dependent variable is expected to increase when the independent variable is increased by 1, while at the same time holding all the other independent variables as constant. In quantitative terms, this coefficient shows that, if the population employment in the subregion increases by an average of 1,000 people, the expected volume of construction works will increase by about T50 million annually, or by 3.5% of mean construction volume, respectively gross agricultural output by T94 million, or by 2.4% of mean agricultural production, and industrial production by T22 million, or by 1% of mean industry, provided that all other independent variables are constant. Thus, the employment of the population had the most significant impact on the increase in the volume of construction works, which emphasizes the
Table 5.6: Evaluation of Impact on Treated Subregions in Subregional Model Using the DiD Method
Independent Variables
Dependent variablesConstruction
(T million)Agriculture(T million)
Industry(T million)
CNS AGR INDVector of control variables Xt at subregional level:
Employed population by subregion (’000 people)
50.013*** 94.083*** 22.448**
Average monthly nominal wage by subregion (T)
0.092*** 0.044*** 0.076***
Investment in fixed capital by subregion (lag 1) (T million)
0.062* 0.008 0.036**
Gross domestic product per capita by region (T ’000)
1.405 3.029** 0.726
Dtr * D9–12 4,661.113*** 846.941*** 584.185*
Dtr * D13–17 1,753.031** 547.366* 917.354**
Constant term –2,597.275*** –364.087 383.636
Total panel observations 187 187 187
Adj R2 0.66 0.82 0.92
DiD = difference in differences. Significance levels: significant at 10% * p < 0.10; significant at 5% ** p < 0.05; significant at 1% *** p < 0.01.Notes: Dtr * Dt is an interactive binary variable that takes on a value of 1 if an observation is drawn from a treated subregion in the given time period; 0 otherwise.Source: Author’s calculations using data from the Committee of Statistics of Kazakhstan.
Measuring Impacts and Financing Infrastructure in Kazakhstan 157
economic and social significance of the construction of the railway in generating employment in the treated subregion.
Also, one of the important explanatory variables in this regression is the average monthly wage, which is significant at the 1% level for all sectors of the real economy (construction, agriculture, and industry). The coefficient for this independent variable indicates that for every additional T1,000 of average monthly wage, the expected volume of production in construction works will increase by about T92 million annually, or by 6.4% of mean construction production, respectively gross agricultural output by T44 million, or by 1.1% of mean agricultural production, and industrial production by T76 million, or by 3.5% of mean industry, provided that all other independent variables are constant. Thus, the construction sector also had the most economically significant impact at the subregional level. Other explanatory variables, such as investments in fixed capital and GDP per capita, also have a positive effect. In particular, investments in fixed capital have the most significant impact on industry, followed by construction. The explanatory variable GDP per capita is more significant in the agriculture sector, since agriculture employs a lot of people living in rural areas.
Further, we consider the coefficients of binary variables, which belong to categorical variables. As can be seen from the output of equations, the estimates of the coefficients of binary variables have positive signs in all equations, which means that, all things being equal, the treated subregions received a greater economic impact on the increasing production volumes in the respective sectors of the real economy than in the control subregions. All binary variables included in the regression are statistically significant at levels of 1%, 5%, and 10%. In general, positive and statistically significant values of the coefficients of binary variables show a more positive significant impact of the project on the sectors of the real economy in the treated subregions than in the control subregions during the project implementation period.
As can be seen from the DiD coefficients, the treated subregions demonstrated an increase in the volume of construction work of T4.7 billion during the construction of the railway, which is more than three times higher than the industry average, and after the construction it increased by T1.8 billion, or 122% of mean construction production, compared to the counterfactual scenario based on the performance of the nonaffected group. According to time periods, the project under consideration had a more positive significant impact on the construction industry in the period of constructing the railway in 2009–2012 (significant at 1%), and after the completion it had a less statistically significant effect (significant at 5%). In addition, the project under consideration had a positive and significant impact on the development
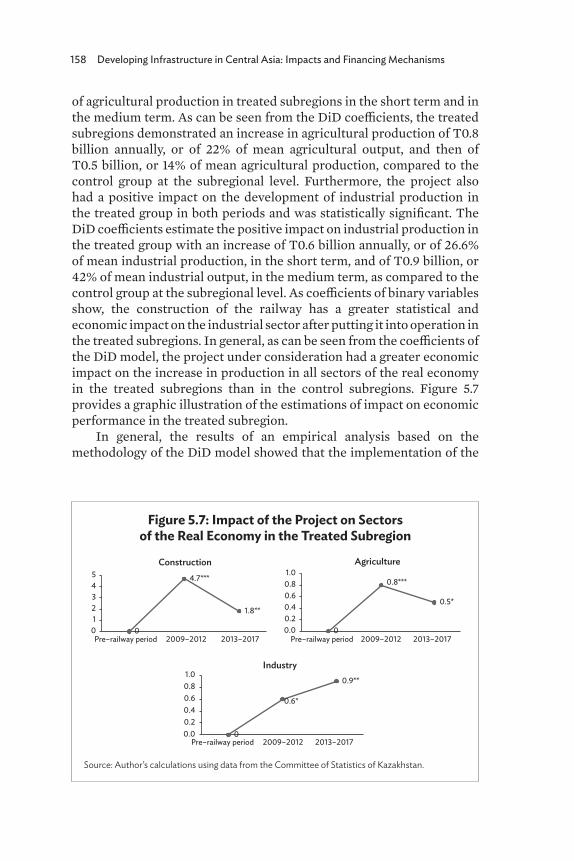
158 Developing Infrastructure in Central Asia: Impacts and Financing Mechanisms
of agricultural production in treated subregions in the short term and in the medium term. As can be seen from the DiD coefficients, the treated subregions demonstrated an increase in agricultural production of T0.8 billion annually, or of 22% of mean agricultural output, and then of T0.5 billion, or 14% of mean agricultural production, compared to the control group at the subregional level. Furthermore, the project also had a positive impact on the development of industrial production in the treated group in both periods and was statistically significant. The DiD coefficients estimate the positive impact on industrial production in the treated group with an increase of T0.6 billion annually, or of 26.6% of mean industrial production, in the short term, and of T0.9 billion, or 42% of mean industrial output, in the medium term, as compared to the control group at the subregional level. As coefficients of binary variables show, the construction of the railway has a greater statistical and economic impact on the industrial sector after putting it into operation in the treated subregions. In general, as can be seen from the coefficients of the DiD model, the project under consideration had a greater economic impact on the increase in production in all sectors of the real economy in the treated subregions than in the control subregions. Figure 5.7 provides a graphic illustration of the estimations of impact on economic performance in the treated subregion.
In general, the results of an empirical analysis based on the methodology of the DiD model showed that the implementation of the
Figure 5.7: Impact of the Project on Sectors of the Real Economy in the Treated Subregion
Source: Author’s calculations using data from the Committee of Statistics of Kazakhstan.
0
4.7***
1.8**
012345
Pre–railway period 2009–2012 2013–2017
Pre–railway period 2009–2012 2013–2017
Pre–railway period 2009–2012 2013–2017
Construction
0
0.8***
0.5*
0.00.20.40.60.81.0
Agriculture
0
0.6*
0.9**
0.00.20.40.60.81.0
Industry
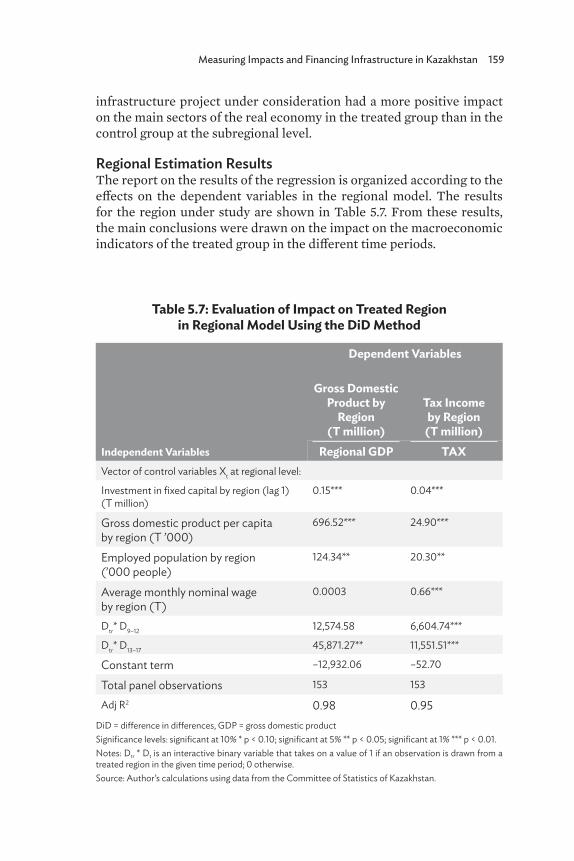
Measuring Impacts and Financing Infrastructure in Kazakhstan 159
infrastructure project under consideration had a more positive impact on the main sectors of the real economy in the treated group than in the control group at the subregional level.
Regional Estimation ResultsThe report on the results of the regression is organized according to the effects on the dependent variables in the regional model. The results for the region under study are shown in Table 5.7. From these results, the main conclusions were drawn on the impact on the macroeconomic indicators of the treated group in the different time periods.
Table 5.7: Evaluation of Impact on Treated Region in Regional Model Using the DiD Method
Independent Variables
Dependent Variables
Gross Domestic Product by
Region(T million)
Tax Incomeby Region
(T million)Regional GDP TAX
Vector of control variables Xt at regional level:
Investment in fixed capital by region (lag 1) (T million)
0.15*** 0.04***
Gross domestic product per capita by region (T ’000)
696.52*** 24.90***
Employed population by region (’000 people)
124.34** 20.30**
Average monthly nominal wage by region (T)
0.0003 0.66***
Dtr* D9–12 12,574.58 6,604.74***
Dtr* D13–17 45,871.27** 11,551.51***
Constant term –12,932.06 –52.70
Total panel observations 153 153
Adj R2 0.98 0.95DiD = difference in differences, GDP = gross domestic product Significance levels: significant at 10% * p < 0.10; significant at 5% ** p < 0.05; significant at 1% *** p < 0.01.Notes: Dtr * Dt is an interactive binary variable that takes on a value of 1 if an observation is drawn from a treated region in the given time period; 0 otherwise.Source: Author’s calculations using data from the Committee of Statistics of Kazakhstan.
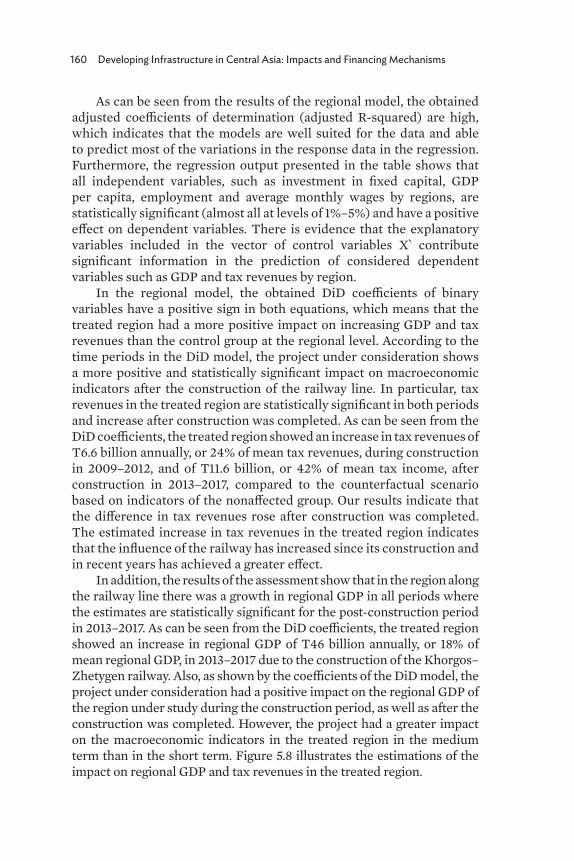
160 Developing Infrastructure in Central Asia: Impacts and Financing Mechanisms
As can be seen from the results of the regional model, the obtained adjusted coefficients of determination (adjusted R-squared) are high, which indicates that the models are well suited for the data and able to predict most of the variations in the response data in the regression. Furthermore, the regression output presented in the table shows that all independent variables, such as investment in fixed capital, GDP per capita, employment and average monthly wages by regions, are statistically significant (almost all at levels of 1%–5%) and have a positive effect on dependent variables. There is evidence that the explanatory variables included in the vector of control variables X` contribute significant information in the prediction of considered dependent variables such as GDP and tax revenues by region.
In the regional model, the obtained DiD coefficients of binary variables have a positive sign in both equations, which means that the treated region had a more positive impact on increasing GDP and tax revenues than the control group at the regional level. According to the time periods in the DiD model, the project under consideration shows a more positive and statistically significant impact on macroeconomic indicators after the construction of the railway line. In particular, tax revenues in the treated region are statistically significant in both periods and increase after construction was completed. As can be seen from the DiD coefficients, the treated region showed an increase in tax revenues of T6.6 billion annually, or 24% of mean tax revenues, during construction in 2009–2012, and of T11.6 billion, or 42% of mean tax income, after construction in 2013–2017, compared to the counterfactual scenario based on indicators of the nonaffected group. Our results indicate that the difference in tax revenues rose after construction was completed. The estimated increase in tax revenues in the treated region indicates that the influence of the railway has increased since its construction and in recent years has achieved a greater effect.
In addition, the results of the assessment show that in the region along the railway line there was a growth in regional GDP in all periods where the estimates are statistically significant for the post-construction period in 2013–2017. As can be seen from the DiD coefficients, the treated region showed an increase in regional GDP of T46 billion annually, or 18% of mean regional GDP, in 2013–2017 due to the construction of the Khorgos–Zhetygen railway. Also, as shown by the coefficients of the DiD model, the project under consideration had a positive impact on the regional GDP of the region under study during the construction period, as well as after the construction was completed. However, the project had a greater impact on the macroeconomic indicators in the treated region in the medium term than in the short term. Figure 5.8 illustrates the estimations of the impact on regional GDP and tax revenues in the treated region.
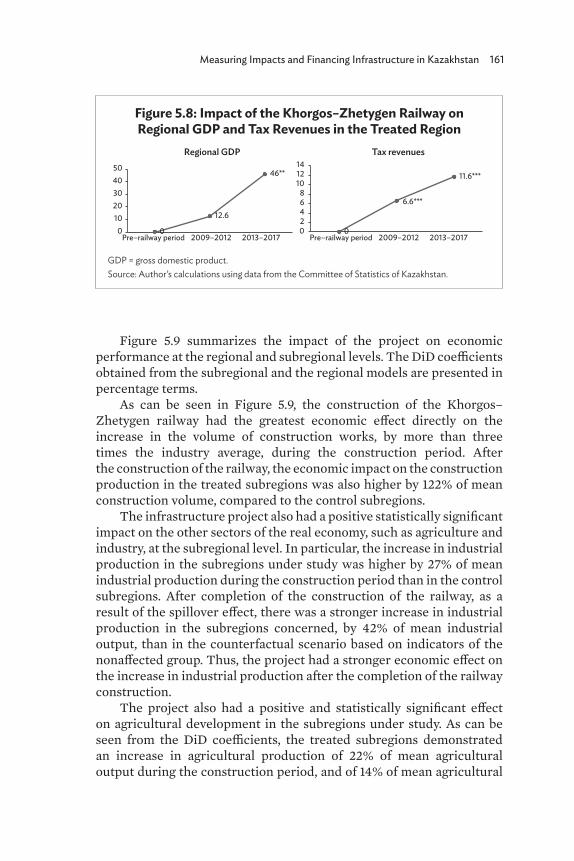
Measuring Impacts and Financing Infrastructure in Kazakhstan 161
Figure 5.9 summarizes the impact of the project on economic performance at the regional and subregional levels. The DiD coefficients obtained from the subregional and the regional models are presented in percentage terms.
As can be seen in Figure 5.9, the construction of the Khorgos–Zhetygen railway had the greatest economic effect directly on the increase in the volume of construction works, by more than three times the industry average, during the construction period. After the construction of the railway, the economic impact on the construction production in the treated subregions was also higher by 122% of mean construction volume, compared to the control subregions.
The infrastructure project also had a positive statistically significant impact on the other sectors of the real economy, such as agriculture and industry, at the subregional level. In particular, the increase in industrial production in the subregions under study was higher by 27% of mean industrial production during the construction period than in the control subregions. After completion of the construction of the railway, as a result of the spillover effect, there was a stronger increase in industrial production in the subregions concerned, by 42% of mean industrial output, than in the counterfactual scenario based on indicators of the nonaffected group. Thus, the project had a stronger economic effect on the increase in industrial production after the completion of the railway construction.
The project also had a positive and statistically significant effect on agricultural development in the subregions under study. As can be seen from the DiD coefficients, the treated subregions demonstrated an increase in agricultural production of 22% of mean agricultural output during the construction period, and of 14% of mean agricultural
Figure 5.8: Impact of the Khorgos–Zhetygen Railway on Regional GDP and Tax Revenues in the Treated Region
GDP = gross domestic product. Source: Author’s calculations using data from the Committee of Statistics of Kazakhstan.
Pre–railway period 2009–2012 2013–2017 Pre–railway period 2009–2012 2013–20170
12.6
46**
01020304050
Regional GDP
0
6.6***
11.6***
02468
101214
Tax revenues
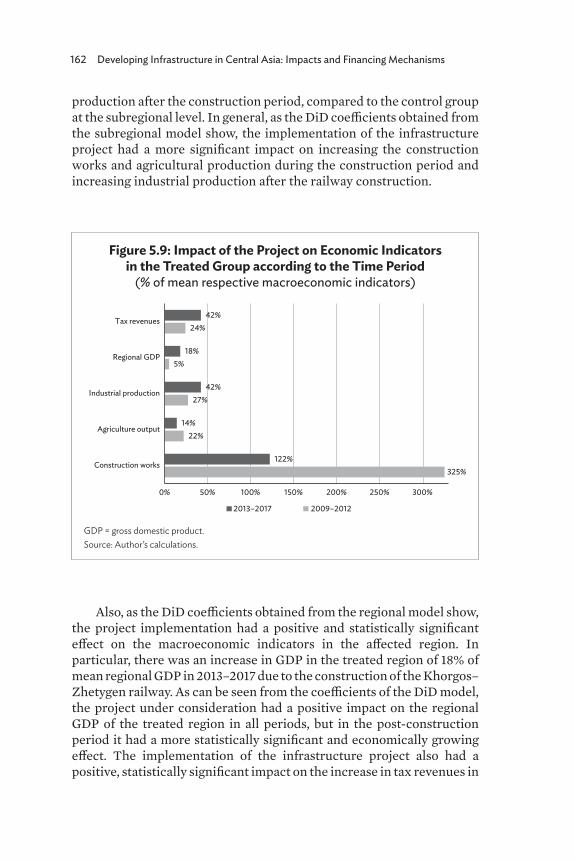
162 Developing Infrastructure in Central Asia: Impacts and Financing Mechanisms
production after the construction period, compared to the control group at the subregional level. In general, as the DiD coefficients obtained from the subregional model show, the implementation of the infrastructure project had a more significant impact on increasing the construction works and agricultural production during the construction period and increasing industrial production after the railway construction.
Also, as the DiD coefficients obtained from the regional model show, the project implementation had a positive and statistically significant effect on the macroeconomic indicators in the affected region. In particular, there was an increase in GDP in the treated region of 18% of mean regional GDP in 2013–2017 due to the construction of the Khorgos–Zhetygen railway. As can be seen from the coefficients of the DiD model, the project under consideration had a positive impact on the regional GDP of the treated region in all periods, but in the post-construction period it had a more statistically significant and economically growing effect. The implementation of the infrastructure project also had a positive, statistically significant impact on the increase in tax revenues in
Figure 5.9: Impact of the Project on Economic Indicators in the Treated Group according to the Time Period
(% of mean respective macroeconomic indicators)
GDP = gross domestic product. Source: Author’s calculations.
325%
22%
27%
5%
24%
122%
14%
42%
18%
42%
0% 50% 100% 150% 200% 250% 300%
Construction works
Agriculture output
Industrial production
Regional GDP
Tax revenues
2013–2017 2009–2012
Measuring Impacts and Financing Infrastructure in Kazakhstan 163
the region under study. According to the DiD coefficients in the regional model, tax revenues in the treated region increased by 24% of mean tax revenues during the construction period, and after its completion, as a result of the spillover effect, there was a greater increase of 42% of mean tax income, compared to the counterfactual scenario based on indicators of the unaffected group. In general, the results of the regional and subregional models using the DiD approach showed that the construction of the railway had a greater economic impact on the treated subregions in the short term. In the medium term, the project had a greater impact on the increase in the macroeconomic indicators in the region concerned. Generally, all the DiD coefficients obtained on the basis of the regional and subregional models are positive and statistically significant, which shows a more positive impact of the project on the economic indicators in the treated group than in the control group.
In general, this study shows that the increase in macroeconomic indicators is significant in the case of the Khorgos–Zhetygen railway. In particular, the data obtained indicate that the construction of the railway increased tax revenues during the construction and operation phases. Furthermore, the study showed a statistically significant and economically growing impact on tax revenues after its completion. Moreover, the implementation of the infrastructure project under consideration was associated with a positive and statistically significant effect on the regional GDP of the treated region. In general, the results confirm the assumption of an increase in economic activity during the construction of the railway and higher growth rates in the affected regions afterward. This study shows that the spillover effects from the development of such an infrastructure project are highly significant for the local economy and can stimulate business activity in the region and generate employment.
5.5 Discussion, Conclusions, and Policy Implications
As the ninth-largest country in the world and its location at the crossroads of transport routes, Kazakhstan’s favorable geographical location offers opportunities for the development of transport infrastructure as a transit area for international transport logistics. At the same time, the development of railway infrastructure plays an important role in the economic development of the country as a whole. The major priority for the railway infrastructure is the development of the transit potential, which can be achieved through the construction of new railway lines. In this regard, we recommend in the future attracting investment
164 Developing Infrastructure in Central Asia: Impacts and Financing Mechanisms
in transport infrastructure for the construction or reconstruction of other railways in other regions of the country, which may increase economic activity in the country, as well as the income of foreign investors. The development of railway infrastructure plays a significant role in connecting with other countries and has a multiplicative spillover effect on society and the economy. Specifically, attracting investment in the development of railway transport infrastructure in Kazakhstan will lead to the following economic benefits:
• New roads will significantly increase the transit potential of Kazakhstan for the development of international transport logistics.
• Construction of new railways will improve the accessibility and connectivity of rail transport communications, both domestically and with other countries.
• New directions of transport corridors will facilitate the development and expansion of economic relations between Kazakhstan and the Eurasian continent.
• Large volumes of road freight will be shifted to more reliable, cheaper, and safer railway transport.
• The operation of new railway lines will provide a new impulse to the development of treated subregions, as shown in this study.
The main incentives for financing infrastructure in Kazakhstan are the reduction of transport costs related to production in the following ways: reducing travel time; grouping macro-regions into a single integrated transport system; improving labor migration; creating comfortable conditions for the movement of people; and reducing operating costs during transportation of goods, among others. The general impact of financing infrastructure projects on related industries will be manifested in increasing the volume of freight and passenger transportation and development of the transit potential of the country, which will contribute to economic growth, and increase the competitiveness of the domestic economy and international integration into the foreign markets. Over time, it can be expected that the provision of new infrastructure in the form of a railway connection will generate spillover effects affecting local businesses, household incomes, government tax revenues, and the overall economic performance of related regions.
It should be noted that Kazakhstan has had successful experiences in implementing different PPP projects. However, there are still a number of problems for which we recommend the following measures to improve the PPP policy in Kazakhstan:
Measuring Impacts and Financing Infrastructure in Kazakhstan 165
• In recent years, Kazakhstan has implemented a large number of PPP programs funded by many international institutions, such as the World Bank, the Asian Development Bank, the European Bank for Reconstruction and Development, and the EU. With this extensive experience, the government authorities can develop a road map of the most attractive infrastructure sectors and branches of the economy to attract investments in the country on the basis of PPP mechanisms.
• It is also recommended to continue studying the best international experience of PPP programs in other countries in order to adapt these procedures and implement successful PPP processes in Kazakhstan.
• In this regard, it is recommended to adapt the current law on PPPs in Kazakhstan to international standards, which will help to attract more foreign investors.
• It is recommended that a clear legal environment be established, based on international practice, to improve the legislative framework for the implementation of PPP projects.
Global experience has shown that the successful implementation of PPP infrastructure projects should be based on a mutually beneficial and effective partnership between the state and business. The use of PPP mechanisms provides a number of incentives for both the state and business. The private sector receives new investment opportunities, which means new sources of income and opportunities to participate in major projects. On the other hand, for the Government of Kazakhstan, the financing of infrastructure projects is aimed at facilitating the development of the macro-region as a whole and stimulating the export of Kazakhstani goods to foreign markets. The use of PPP mechanisms not only provides an opportunity to increase the resource supply of infrastructure projects while reducing budget expenditures, but also makes it possible to provide better services.
Our study showed that the investments in transport infrastructure would yield a spillover effect by improving the economic development of the treated region and increasing the economic efficiency in the respective subregions. In the future, this will contribute to increasing the transport potential of Kazakhstan and its transformation into a major trade, logistics, and transit center in Central Asia, as well as a transport bridge between Europe and Asia.
166 Developing Infrastructure in Central Asia: Impacts and Financing Mechanisms
ReferencesCruz, C. O., and R. C. Marques. 2011. Revisiting the Portuguese
Experience with Public–Private Partnerships. African Journal of Business Management. 5(11). pp. 4023–4032.
Delmon, J. 2010. Public-Private Partnership in Infrastructure: Practical Guide for Government Agencies. Astana: Publishing House of JSC “Kazakhstan Center for Public-Private Partnership”.
Encinas, J. 2013. The UK PPP Program: Lessons from PFI History and the New PF2 Model. Paper presented at the 8th International PPP Forum “Growth Strategy and PPP” in Japan, Infrastructure UK, 17 October.
Government of the Republic of Kazakhstan. 2008. Decree No. 693 “On the Establishment of a Specialized Organization on Concession Issues” of 17 July 2008. http://www.zakon.kz.
____. 2011. Program for the Development of Public-Private Partnership in the Republic of Kazakhstan for 2011–2015 of 29 June 2011, No. 731. http://www.zakon.kz.
____. 2006. Law of the Republic of Kazakhstan of July 7, 2006 No. 167–III “On Concessions” (amended and supplemented as of 4 July 2013). http://www.zakon.kz.
____. 2013a. Law of the Republic of Kazakhstan “On Amendments and Additions to Certain Legislative Acts of the Republic of Kazakhstan Concerning the Introduction of New Types of Public–Private Partnership and Expansion of Their Application” of 4 July 2013. http://www.zakon.kz.
____. 2014. Law of the Republic of Kazakhstan “On Amendments and Additions to Certain Legislative Acts of the Republic of Kazakhstan on Public Administration” of 2 July 2014. http://www .zakon.kz
____. 2015. Law of the Republic of Kazakhstan “On Public-Private Partnership” of 31 October 2015. http://www.zakon.kz.
Kumar, L., Jindal, A., Velaga, N.R. 2018. Financial Risk Assessment and Modelling of PPP-based Indian Highway Infrastructure Projects. Transport Policy. 62. pp.2–11.
Mataev, T.M. 2011. Prospects for the development of public-private partnership forms in the Republic of Kazakhstan. Journal of Russian Entrepreneurship. 12(12). pp. 187–192.
____. 2020. Development of Public-Private Partnership in Kazakhstan: Status, Trends and Prospects. https://www.gov.kz/memleket /entities/economy/press/news/details/o-razvitii-gchp-v -kazahstane-sostoyanie-tendencii-i-perspektivy?lang=ru.
Measuring Impacts and Financing Infrastructure in Kazakhstan 167
National Bank of the Republic of Kazakhstan. www.nationalbank.kz.National Committee of Statistics of the Republic of Kazakhstan. www
.stat.gov.kz.Office of the President of the Republic of Kazakhstan. 2014. The
State Program of Industrial and Innovative Development of the Republic of Kazakhstan for 2015–2019. Astana. http://www .zakon.kz.
Toksanova, A.N., Abdymanapov, S.A., et al. 2016. Development of Public-Private Partnership in the Republic of Kazakhstan. IEJME — Mathematics Education. 11(5). pp. 1113–1126.
Yoshino, N., and U. Abidhadjaev. 2017a. An Impact Evaluation of Investment in Infrastructure: The Case of a Railway Connection in Uzbekistan. Journal of Asian Economics. 49 (2017). pp. 1–11.
____. 2017b. Impact of Infrastructure on Tax Revenue: Case Study of High-Speed Train in Japan. Journal of Infrastructure, Policy and Development. 1 (2). pp. 129–48.
Yoshino, N., and V. Pontines. 2015. The “Highway Effect” on Public Finance: Case of the STAR Highway in the Philippines. ADBI Working Paper Series. No. 549. Tokyo: Asian Development Bank Institute.
168
6Measuring the Impact
and Financing of Infrastructure in the Kyrgyz Republic
Kamalbek Karymshakov and Burulcha Sulaimanova
6.1 IntroductionTransportation costs play an important role in economic exchange by altering the transaction cost (Arvis, Raballand, and Marteau 2010). The development of infrastructure creates conditions for economic integration of countries and expands their economic performance. This is particularly important for landlocked countries. As landlocked countries, Central Asian economies are heavily dependent on border-crossings, which may have a negative effect on their international trade activities (Raballand 2003).
Transport infrastructure of the Kyrgyz Republic is not well developed, although recently the government has made a substantial effort at improvements. As the country is without direct access to seaports, the primary means of transportation remains road transport, which plays an important role for cargo turnover in the country. Railway infrastructure is not well developed and is represented by only a short distance of tracks within the country territory, although the railway is linked to Kazakhstan and is mostly used for transport to Kazakhstan and the Russian Federation. Given these facts, the development of infrastructure is one of the fundamental challenges confronting the Kyrgyz Republic’s long-term economic performance.
During the past decade, considerable financial resources have been used for road construction both within regional economic integration programs, such as the Central Asia Regional Economic Cooperation (CAREC) Program, and within country infrastructure development programs. Within the current policy context, these developments are considered necessary and the infrastructure investments important
Measuring the Impact and Financing of Infrastructure in the Kyrgyz Republic 169
for economic development. Given the low internal financial potential of the Kyrgyz Republic to finance large infrastructure projects, use of external funds in the most efficient way is critical. An evaluation of the impact of infrastructure investment in the Kyrgyz Republic is therefore important for the perspective of evidence-based policy decisions. However, impact evaluation analysis for such projects is not widespread in the country, and such analysis faces several technical issues such as data availability, realization of infrastructure projects by steps, and the variable completion rate of infrastructure projects.
Given these facts, this study seeks to provide empirical evidence on the impact of road construction projects in the Kyrgyz Republic and discuss the financing infrastructure in the context of the country.
6.2 Macroeconomic Developments and Infrastructure Investment in the Kyrgyz Republic
The population of the Kyrgyz Republic was estimated at 6.14 million in 2017, of which one-third (33.8%) reside in urban areas. More than half of the population (59.1%) is of working age, with the unemployment level at about 8%, and 33.6% are under the age of 15, and the remainder older than working age (NSCKR, Demographic Yearbook of the Kyrgyz Republic for 2012–2017, n.d.). The real gross domestic product (GDP) at purchasing power parity (PPP) per capita has been steadily growing since 2001, but it still has not reached the values from before the collapse of the Soviet Union (Table 6.1). Hence, GDP per capita in 2016 was only 94.8% of the 1990 level ($3,474.7).
The economy of the Kyrgyz Republic has an average growth rate of 4.38%, which peaked in 2007, 2008, and 2013 with 8.5%, 8.4%, and 10.9%, respectively. The general growth of the economy is believed to be caused mostly by private consumption, which is significantly influenced by the growth of remittances (from 5.3% of GDP in 2001–2005 to 30.4% in 2016 [World Bank 2017]), and the steady increase in the price of gold, which is the Kyrgyz Republic’s main export commodity (IFC 2015). The economy has, however, witnessed negative growth rates; in 2002 and 2012, GDP fell as a result of an accident in the Kumtor gold mining company in 2002 and an output decrease by the company in 2012. The mining company is the main commodity exporter in the Kyrgyz Republic, and its output accounts for more than the half of total exports and about 10% of the country’s GDP. In 2005 and 2010, there was zero economic growth, which was caused by political instability and revolutions. Overall, the country’s recent economic growth performance has not
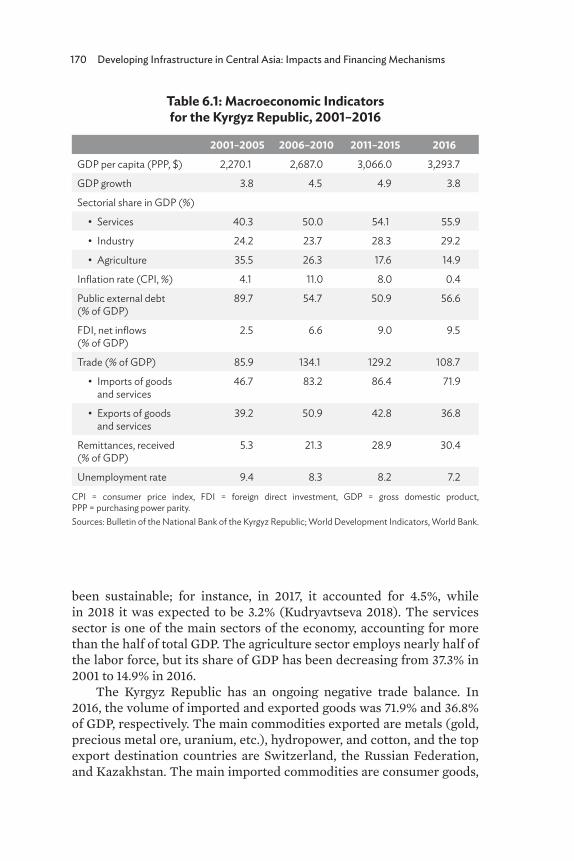
170 Developing Infrastructure in Central Asia: Impacts and Financing Mechanisms
Table 6.1: Macroeconomic Indicators for the Kyrgyz Republic, 2001–2016
2001–2005 2006–2010 2011–2015 2016GDP per capita (PPP, $) 2,270.1 2,687.0 3,066.0 3,293.7
GDP growth 3.8 4.5 4.9 3.8
Sectorial share in GDP (%)
• Services 40.3 50.0 54.1 55.9
• Industry 24.2 23.7 28.3 29.2
• Agriculture 35.5 26.3 17.6 14.9
Inflation rate (CPI, %) 4.1 11.0 8.0 0.4
Public external debt (% of GDP)
89.7 54.7 50.9 56.6
FDI, net inflows (% of GDP)
2.5 6.6 9.0 9.5
Trade (% of GDP) 85.9 134.1 129.2 108.7
• Imports of goods and services
46.7 83.2 86.4 71.9
• Exports of goods and services
39.2 50.9 42.8 36.8
Remittances, received (% of GDP)
5.3 21.3 28.9 30.4
Unemployment rate 9.4 8.3 8.2 7.2
CPI = consumer price index, FDI = foreign direct investment, GDP = gross domestic product, PPP = purchasing power parity. Sources: Bulletin of the National Bank of the Kyrgyz Republic; World Development Indicators, World Bank.
been sustainable; for instance, in 2017, it accounted for 4.5%, while in 2018 it was expected to be 3.2% (Kudryavtseva 2018). The services sector is one of the main sectors of the economy, accounting for more than the half of total GDP. The agriculture sector employs nearly half of the labor force, but its share of GDP has been decreasing from 37.3% in 2001 to 14.9% in 2016.
The Kyrgyz Republic has an ongoing negative trade balance. In 2016, the volume of imported and exported goods was 71.9% and 36.8% of GDP, respectively. The main commodities exported are metals (gold, precious metal ore, uranium, etc.), hydropower, and cotton, and the top export destination countries are Switzerland, the Russian Federation, and Kazakhstan. The main imported commodities are consumer goods,
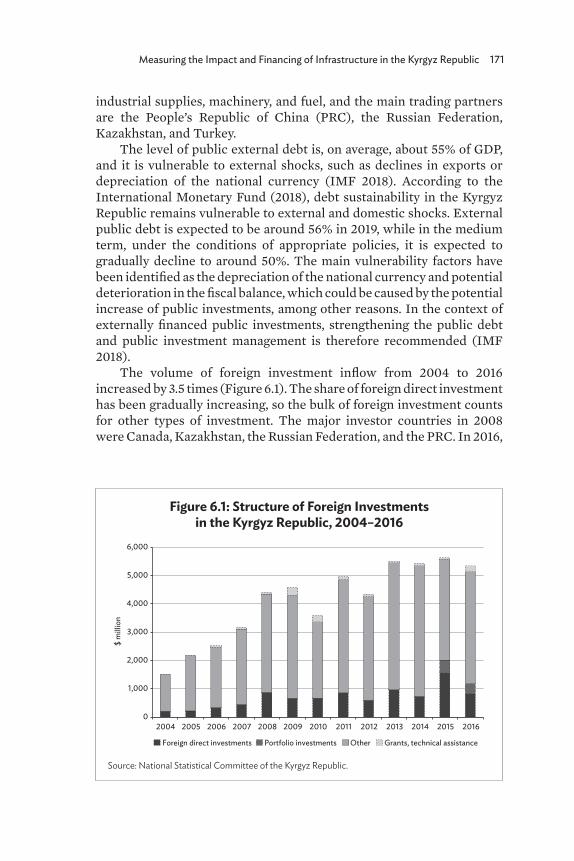
Measuring the Impact and Financing of Infrastructure in the Kyrgyz Republic 171
industrial supplies, machinery, and fuel, and the main trading partners are the People’s Republic of China (PRC), the Russian Federation, Kazakhstan, and Turkey.
The level of public external debt is, on average, about 55% of GDP, and it is vulnerable to external shocks, such as declines in exports or depreciation of the national currency (IMF 2018). According to the International Monetary Fund (2018), debt sustainability in the Kyrgyz Republic remains vulnerable to external and domestic shocks. External public debt is expected to be around 56% in 2019, while in the medium term, under the conditions of appropriate policies, it is expected to gradually decline to around 50%. The main vulnerability factors have been identified as the depreciation of the national currency and potential deterioration in the fiscal balance, which could be caused by the potential increase of public investments, among other reasons. In the context of externally financed public investments, strengthening the public debt and public investment management is therefore recommended (IMF 2018).
The volume of foreign investment inflow from 2004 to 2016 increased by 3.5 times (Figure 6.1). The share of foreign direct investment has been gradually increasing, so the bulk of foreign investment counts for other types of investment. The major investor countries in 2008 were Canada, Kazakhstan, the Russian Federation, and the PRC. In 2016,
Figure 6.1: Structure of Foreign Investments in the Kyrgyz Republic, 2004–2016
Source: National Statistical Committee of the Kyrgyz Republic.
0
1,000
2,000
3,000
4,000
5,000
6,000
2004 2005 2006 2007 2008 2009 2010 2011 2012 2013 2014 2015 2016
$ m
illio
n
Foreign direct investments Portfolio investments Other Grants, technical assistance
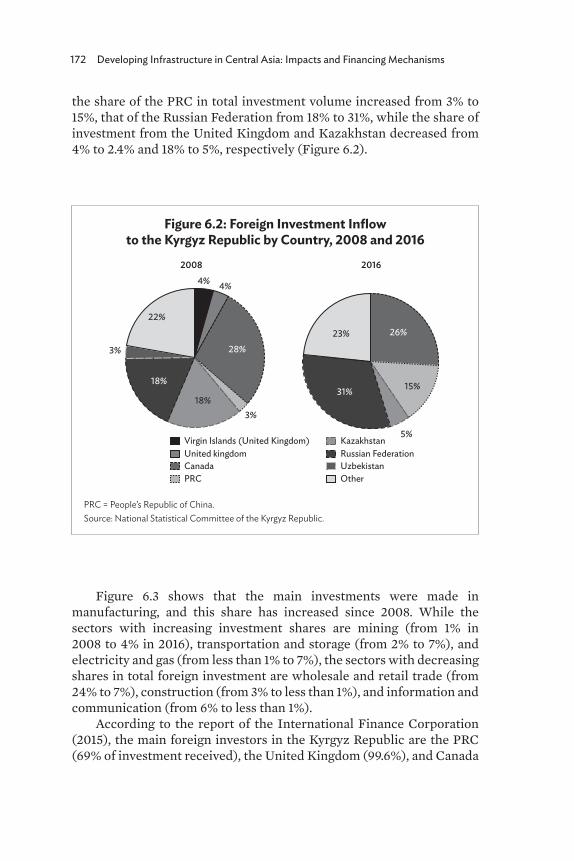
172 Developing Infrastructure in Central Asia: Impacts and Financing Mechanisms
the share of the PRC in total investment volume increased from 3% to 15%, that of the Russian Federation from 18% to 31%, while the share of investment from the United Kingdom and Kazakhstan decreased from 4% to 2.4% and 18% to 5%, respectively (Figure 6.2).
Figure 6.3 shows that the main investments were made in manufacturing, and this share has increased since 2008. While the sectors with increasing investment shares are mining (from 1% in 2008 to 4% in 2016), transportation and storage (from 2% to 7%), and electricity and gas (from less than 1% to 7%), the sectors with decreasing shares in total foreign investment are wholesale and retail trade (from 24% to 7%), construction (from 3% to less than 1%), and information and communication (from 6% to less than 1%).
According to the report of the International Finance Corporation (2015), the main foreign investors in the Kyrgyz Republic are the PRC (69% of investment received), the United Kingdom (99.6%), and Canada
Figure 6.2: Foreign Investment Inflow to the Kyrgyz Republic by Country, 2008 and 2016
PRC = People’s Republic of China. Source: National Statistical Committee of the Kyrgyz Republic.
4% 4%
28%
3%18%
18%
3%
22%
2008
Virgin Islands (United Kingdom)United kingdomCanadaPRC
KazakhstanRussian FederationUzbekistanOther
26%
15%
5%
31%
23%
2016
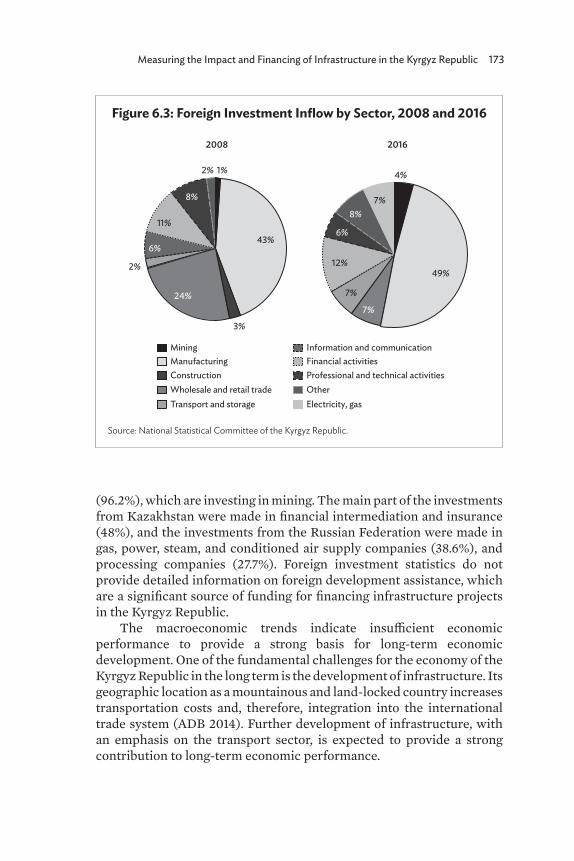
Measuring the Impact and Financing of Infrastructure in the Kyrgyz Republic 173
(96.2%), which are investing in mining. The main part of the investments from Kazakhstan were made in financial intermediation and insurance (48%), and the investments from the Russian Federation were made in gas, power, steam, and conditioned air supply companies (38.6%), and processing companies (27.7%). Foreign investment statistics do not provide detailed information on foreign development assistance, which are a significant source of funding for financing infrastructure projects in the Kyrgyz Republic.
The macroeconomic trends indicate insufficient economic performance to provide a strong basis for long-term economic development. One of the fundamental challenges for the economy of the Kyrgyz Republic in the long term is the development of infrastructure. Its geographic location as a mountainous and land-locked country increases transportation costs and, therefore, integration into the international trade system (ADB 2014). Further development of infrastructure, with an emphasis on the transport sector, is expected to provide a strong contribution to long-term economic performance.
Figure 6.3: Foreign Investment Inflow by Sector, 2008 and 2016
Source: National Statistical Committee of the Kyrgyz Republic.
1%
43%
3%
24%
2%
6%
11%
8%
2%
2008
MiningManufacturingConstructionWholesale and retail tradeTransport and storage
Information and communicationFinancial activitiesProfessional and technical activitiesOtherElectricity, gas
4%
7%
7%
12%
6%
8%7%
2016
49%
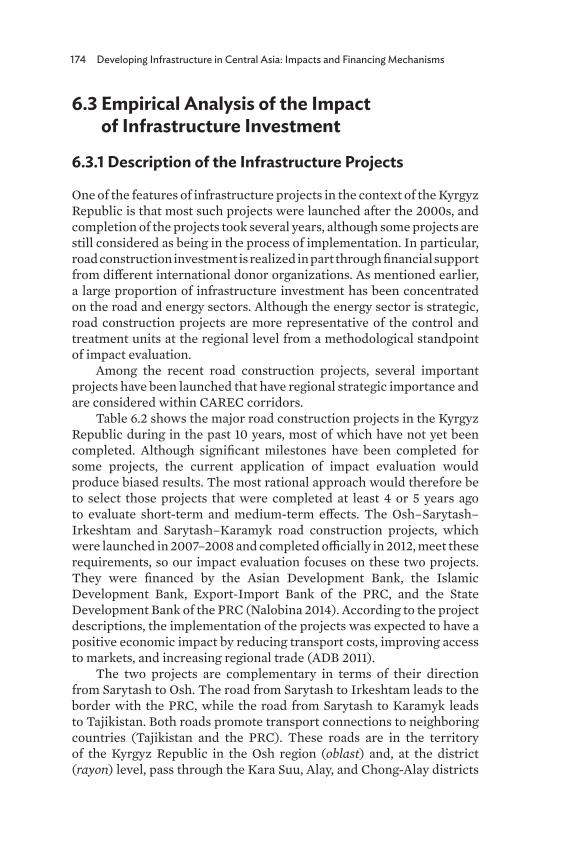
174 Developing Infrastructure in Central Asia: Impacts and Financing Mechanisms
6.3 Empirical Analysis of the Impact of Infrastructure Investment
6.3.1 Description of the Infrastructure Projects
One of the features of infrastructure projects in the context of the Kyrgyz Republic is that most such projects were launched after the 2000s, and completion of the projects took several years, although some projects are still considered as being in the process of implementation. In particular, road construction investment is realized in part through financial support from different international donor organizations. As mentioned earlier, a large proportion of infrastructure investment has been concentrated on the road and energy sectors. Although the energy sector is strategic, road construction projects are more representative of the control and treatment units at the regional level from a methodological standpoint of impact evaluation.
Among the recent road construction projects, several important projects have been launched that have regional strategic importance and are considered within CAREC corridors.
Table 6.2 shows the major road construction projects in the Kyrgyz Republic during in the past 10 years, most of which have not yet been completed. Although significant milestones have been completed for some projects, the current application of impact evaluation would produce biased results. The most rational approach would therefore be to select those projects that were completed at least 4 or 5 years ago to evaluate short-term and medium-term effects. The Osh–Sarytash–Irkeshtam and Sarytash–Karamyk road construction projects, which were launched in 2007–2008 and completed officially in 2012, meet these requirements, so our impact evaluation focuses on these two projects. They were financed by the Asian Development Bank, the Islamic Development Bank, Export-Import Bank of the PRC, and the State Development Bank of the PRC (Nalobina 2014). According to the project descriptions, the implementation of the projects was expected to have a positive economic impact by reducing transport costs, improving access to markets, and increasing regional trade (ADB 2011).
The two projects are complementary in terms of their direction from Sarytash to Osh. The road from Sarytash to Irkeshtam leads to the border with the PRC, while the road from Sarytash to Karamyk leads to Tajikistan. Both roads promote transport connections to neighboring countries (Tajikistan and the PRC). These roads are in the territory of the Kyrgyz Republic in the Osh region (oblast) and, at the district (rayon) level, pass through the Kara Suu, Alay, and Chong-Alay districts
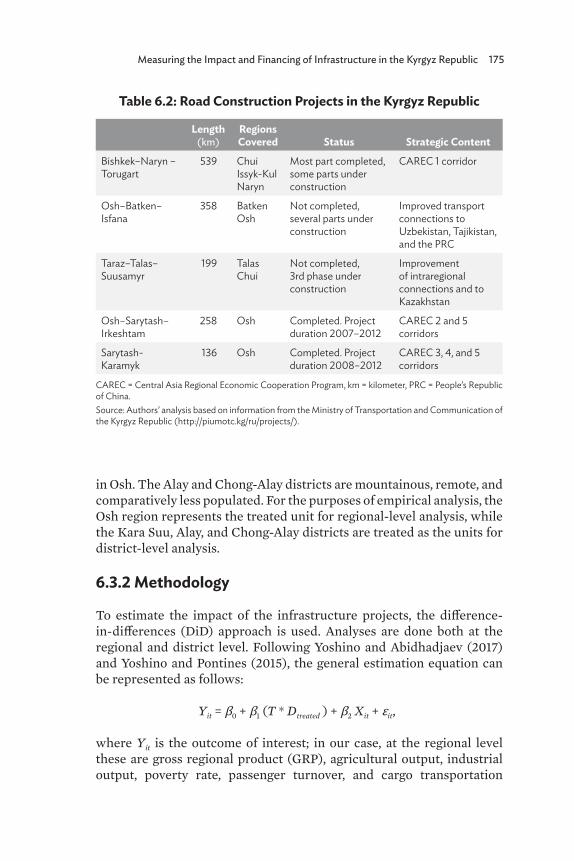
Measuring the Impact and Financing of Infrastructure in the Kyrgyz Republic 175
Table 6.2: Road Construction Projects in the Kyrgyz Republic
Length (km)
Regions Covered Status Strategic Content
Bishkek–Naryn – Torugart
539 ChuiIssyk-KulNaryn
Most part completed, some parts under construction
CAREC 1 corridor
Osh–Batken–Isfana
358 BatkenOsh
Not completed, several parts under construction
Improved transport connections to Uzbekistan, Tajikistan, and the PRC
Taraz–Talas–Suusamyr
199 TalasChui
Not completed, 3rd phase under construction
Improvement of intraregional connections and to Kazakhstan
Osh–Sarytash–Irkeshtam
258 Osh Completed. Project duration 2007–2012
CAREC 2 and 5 corridors
Sarytash-Karamyk
136 Osh Completed. Project duration 2008–2012
CAREC 3, 4, and 5 corridors
CAREC = Central Asia Regional Economic Cooperation Program, km = kilometer, PRC = People’s Republic of China.Source: Authors’ analysis based on information from the Ministry of Transportation and Communication of the Kyrgyz Republic (http://piumotc.kg/ru/projects/).
in Osh. The Alay and Chong-Alay districts are mountainous, remote, and comparatively less populated. For the purposes of empirical analysis, the Osh region represents the treated unit for regional-level analysis, while the Kara Suu, Alay, and Chong-Alay districts are treated as the units for district-level analysis.
6.3.2 Methodology
To estimate the impact of the infrastructure projects, the difference-in-differences (DiD) approach is used. Analyses are done both at the regional and district level. Following Yoshino and Abidhadjaev (2017) and Yoshino and Pontines (2015), the general estimation equation can be represented as follows:
Yit = β0 + β1 (T * Dtreated ) + β2 Xit + εit,
where Yit is the outcome of interest; in our case, at the regional level these are gross regional product (GRP), agricultural output, industrial output, poverty rate, passenger turnover, and cargo transportation
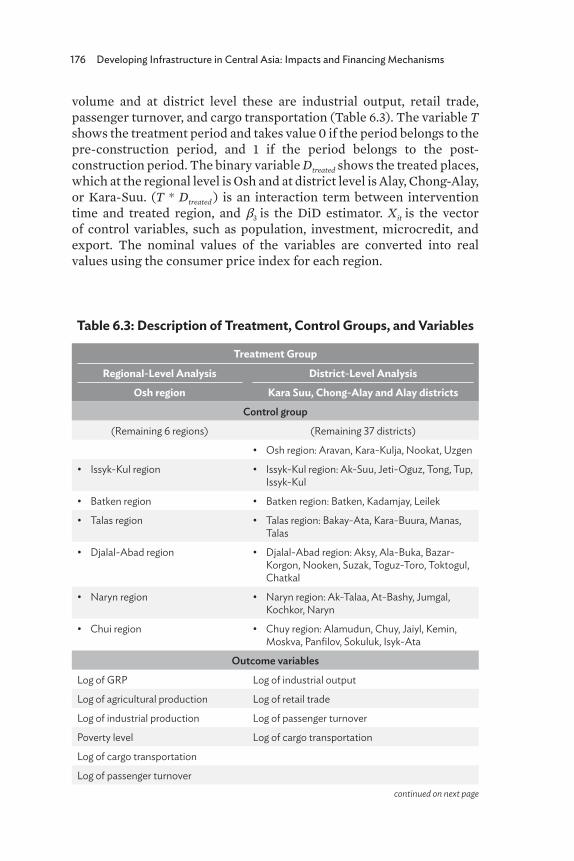
176 Developing Infrastructure in Central Asia: Impacts and Financing Mechanisms
volume and at district level these are industrial output, retail trade, passenger turnover, and cargo transportation (Table 6.3). The variable T shows the treatment period and takes value 0 if the period belongs to the pre-construction period, and 1 if the period belongs to the post-construction period. The binary variable Dtreated shows the treated places, which at the regional level is Osh and at district level is Alay, Chong-Alay, or Kara-Suu. (T * Dtreated ) is an interaction term between intervention time and treated region, and β3 is the DiD estimator. Xit is the vector of control variables, such as population, investment, microcredit, and export. The nominal values of the variables are converted into real values using the consumer price index for each region.
continued on next page
Table 6.3: Description of Treatment, Control Groups, and Variables
Treatment GroupRegional-Level Analysis District-Level Analysis
Osh region Kara Suu, Chong-Alay and Alay districtsControl group
(Remaining 6 regions) (Remaining 37 districts)
• Osh region: Aravan, Kara-Kulja, Nookat, Uzgen
• Issyk-Kul region • Issyk-Kul region: Ak-Suu, Jeti-Oguz, Tong, Tup, Issyk-Kul
• Batken region • Batken region: Batken, Kadamjay, Leilek
• Talas region • Talas region: Bakay-Ata, Kara-Buura, Manas, Talas
• Djalal-Abad region • Djalal-Abad region: Aksy, Ala-Buka, Bazar-Korgon, Nooken, Suzak, Toguz-Toro, Toktogul, Chatkal
• Naryn region • Naryn region: Ak-Talaa, At-Bashy, Jumgal, Kochkor, Naryn
• Chui region • Chuy region: Alamudun, Chuy, Jaiyl, Kemin, Moskva, Panfilov, Sokuluk, Isyk-Ata
Outcome variables
Log of GRP Log of industrial output
Log of agricultural production Log of retail trade
Log of industrial production Log of passenger turnover
Poverty level Log of cargo transportation
Log of cargo transportation
Log of passenger turnover
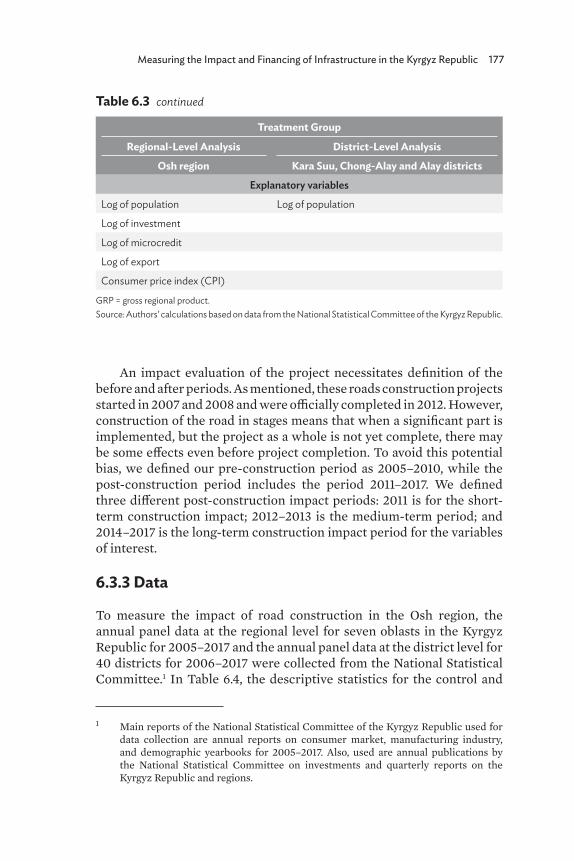
Measuring the Impact and Financing of Infrastructure in the Kyrgyz Republic 177
Table 6.3 continued
Treatment GroupRegional-Level Analysis District-Level Analysis
Osh region Kara Suu, Chong-Alay and Alay districtsExplanatory variables
Log of population Log of population
Log of investment
Log of microcredit
Log of export
Consumer price index (CPI)
GRP = gross regional product.Source: Authors’ calculations based on data from the National Statistical Committee of the Kyrgyz Republic.
An impact evaluation of the project necessitates definition of the before and after periods. As mentioned, these roads construction projects started in 2007 and 2008 and were officially completed in 2012. However, construction of the road in stages means that when a significant part is implemented, but the project as a whole is not yet complete, there may be some effects even before project completion. To avoid this potential bias, we defined our pre-construction period as 2005–2010, while the post-construction period includes the period 2011–2017. We defined three different post-construction impact periods: 2011 is for the short-term construction impact; 2012–2013 is the medium-term period; and 2014–2017 is the long-term construction impact period for the variables of interest.
6.3.3 Data
To measure the impact of road construction in the Osh region, the annual panel data at the regional level for seven oblasts in the Kyrgyz Republic for 2005–2017 and the annual panel data at the district level for 40 districts for 2006–2017 were collected from the National Statistical Committee.1 In Table 6.4, the descriptive statistics for the control and
1 Main reports of the National Statistical Committee of the Kyrgyz Republic used for data collection are annual reports on consumer market, manufacturing industry, and demographic yearbooks for 2005–2017. Also, used are annual publications by the National Statistical Committee on investments and quarterly reports on the Kyrgyz Republic and regions.
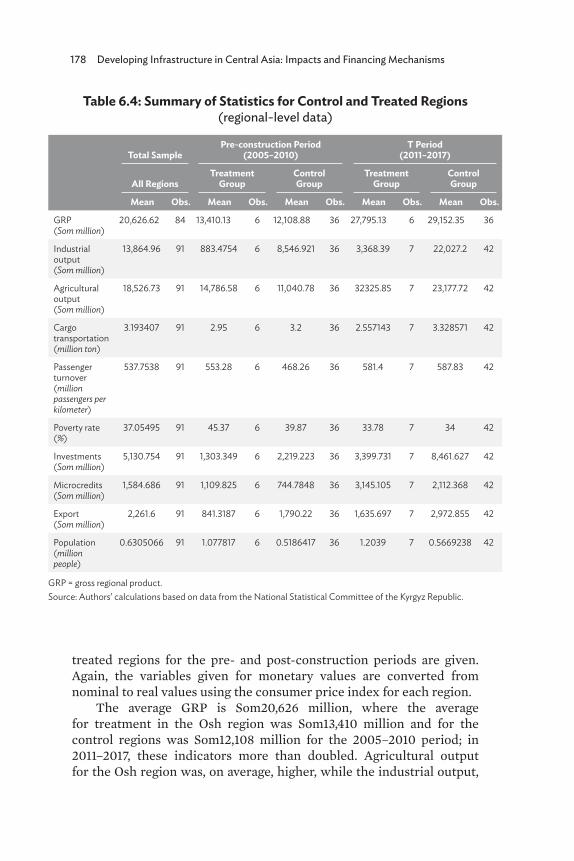
178 Developing Infrastructure in Central Asia: Impacts and Financing Mechanisms
Table 6.4: Summary of Statistics for Control and Treated Regions (regional-level data)
Total SamplePre-construction Period
(2005–2010)T Period
(2011–2017)
All RegionsTreatment
GroupControlGroup
TreatmentGroup
ControlGroup
Mean Obs. Mean Obs. Mean Obs. Mean Obs. Mean Obs.
GRP(Som million)
20,626.62 84 13,410.13 6 12,108.88 36 27,795.13 6 29,152.35 36
Industrial output(Som million)
13,864.96 91 883.4754 6 8,546.921 36 3,368.39 7 22,027.2 42
Agricultural output(Som million)
18,526.73 91 14,786.58 6 11,040.78 36 32325.85 7 23,177.72 42
Cargo transportation (million ton)
3.193407 91 2.95 6 3.2 36 2.557143 7 3.328571 42
Passenger turnover (million passengers per kilometer)
537.7538 91 553.28 6 468.26 36 581.4 7 587.83 42
Poverty rate(%)
37.05495 91 45.37 6 39.87 36 33.78 7 34 42
Investments (Som million)
5,130.754 91 1,303.349 6 2,219.223 36 3,399.731 7 8,461.627 42
Microcredits(Som million)
1,584.686 91 1,109.825 6 744.7848 36 3,145.105 7 2,112.368 42
Export(Som million)
2,261.6 91 841.3187 6 1,790.22 36 1,635.697 7 2,972.855 42
Population(million people)
0.6305066 91 1.077817 6 0.5186417 36 1.2039 7 0.5669238 42
GRP = gross regional product. Source: Authors’ calculations based on data from the National Statistical Committee of the Kyrgyz Republic.
treated regions for the pre- and post-construction periods are given. Again, the variables given for monetary values are converted from nominal to real values using the consumer price index for each region.
The average GRP is Som20,626 million, where the average for treatment in the Osh region was Som13,410 million and for the control regions was Som12,108 million for the 2005–2010 period; in 2011–2017, these indicators more than doubled. Agricultural output for the Osh region was, on average, higher, while the industrial output,
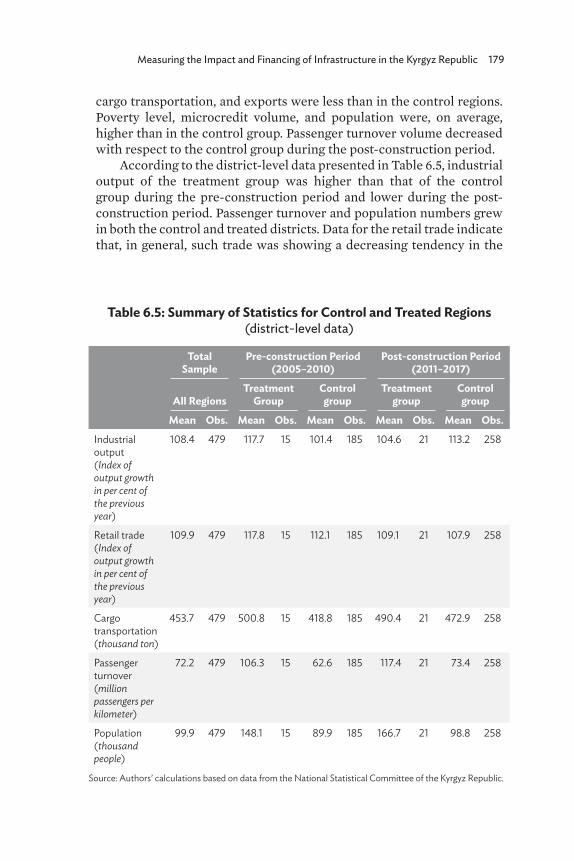
Measuring the Impact and Financing of Infrastructure in the Kyrgyz Republic 179
cargo transportation, and exports were less than in the control regions. Poverty level, microcredit volume, and population were, on average, higher than in the control group. Passenger turnover volume decreased with respect to the control group during the post-construction period.
According to the district-level data presented in Table 6.5, industrial output of the treatment group was higher than that of the control group during the pre-construction period and lower during the post-construction period. Passenger turnover and population numbers grew in both the control and treated districts. Data for the retail trade indicate that, in general, such trade was showing a decreasing tendency in the
Table 6.5: Summary of Statistics for Control and Treated Regions (district-level data)
Total Sample
Pre-construction Period(2005–2010)
Post-construction Period(2011–2017)
All RegionsTreatment
GroupControlgroup
Treatmentgroup
Controlgroup
Mean Obs. Mean Obs. Mean Obs. Mean Obs. Mean Obs.Industrial output(Index of output growth in per cent of the previous year)
108.4 479 117.7 15 101.4 185 104.6 21 113.2 258
Retail trade(Index of output growthin per cent of the previous year)
109.9 479 117.8 15 112.1 185 109.1 21 107.9 258
Cargo transportation (thousand ton)
453.7 479 500.8 15 418.8 185 490.4 21 472.9 258
Passenger turnover (million passengers per kilometer)
72.2 479 106.3 15 62.6 185 117.4 21 73.4 258
Population(thousand people)
99.9 479 148.1 15 89.9 185 166.7 21 98.8 258
Source: Authors’ calculations based on data from the National Statistical Committee of the Kyrgyz Republic.
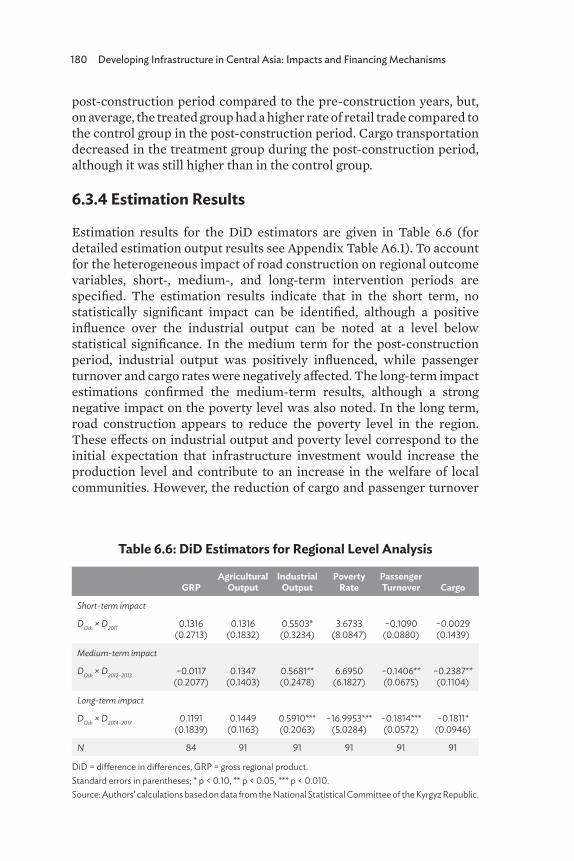
180 Developing Infrastructure in Central Asia: Impacts and Financing Mechanisms
post-construction period compared to the pre-construction years, but, on average, the treated group had a higher rate of retail trade compared to the control group in the post-construction period. Cargo transportation decreased in the treatment group during the post-construction period, although it was still higher than in the control group.
6.3.4 Estimation Results
Estimation results for the DiD estimators are given in Table 6.6 (for detailed estimation output results see Appendix Table A6.1). To account for the heterogeneous impact of road construction on regional outcome variables, short-, medium-, and long-term intervention periods are specified. The estimation results indicate that in the short term, no statistically significant impact can be identified, although a positive influence over the industrial output can be noted at a level below statistical significance. In the medium term for the post-construction period, industrial output was positively influenced, while passenger turnover and cargo rates were negatively affected. The long-term impact estimations confirmed the medium-term results, although a strong negative impact on the poverty level was also noted. In the long term, road construction appears to reduce the poverty level in the region. These effects on industrial output and poverty level correspond to the initial expectation that infrastructure investment would increase the production level and contribute to an increase in the welfare of local communities. However, the reduction of cargo and passenger turnover
Table 6.6: DiD Estimators for Regional Level Analysis
GRPAgricultural
OutputIndustrial
OutputPoverty
RatePassengerTurnover Cargo
Short-term impact
DOsh × D2011 0.1316(0.2713)
0.1316(0.1832)
0.5503*(0.3234)
3.6733(8.0847)
−0.1090(0.0880)
−0.0029(0.1439)
Medium-term impact
DOsh × D2012–2013 −0.0117(0.2077)
0.1347(0.1403)
0.5681**(0.2478)
6.6950(6.1827)
−0.1406**(0.0675)
−0.2387**(0.1104)
Long-term impact
DOsh × D2014–2017 0.1191(0.1839)
0.1449(0.1163)
0.5910***(0.2063)
−16.9953***(5.0284)
−0.1814***(0.0572)
−0.1811*(0.0946)
N 84 91 91 91 91 91
DiD = difference in differences, GRP = gross regional product. Standard errors in parentheses; * p < 0.10, ** p < 0.05, *** p < 0.010.Source: Authors’ calculations based on data from the National Statistical Committee of the Kyrgyz Republic.
Measuring the Impact and Financing of Infrastructure in the Kyrgyz Republic 181
rate after road construction do not correspond to the general expectations from road investment. It should be noted that these negative tendencies can be associated not only with the regional-level economic conditions, but also with external conditions caused by the country’s international trade trends, which may have a temporary character. It is noteworthy that, in the medium term, cargo was affected severely, but the scale of this negative effect scale decreased in the long term to a level below statistical significance.
Further analysis at the district level (Table 6.7) reveals that road construction appeared to have no significant impact on the industrial output of the treated Alay, Chong-Alay, and Kara-Suu districts (for detailed analysis see Appendix Tables A6.2–A6.4).
Although there is a difference in industrial output for the before and after cases for the treated districts in the descriptive statistics, the estimation results do not indicate that these differences possessed statistical significance. There is a positive and significant impact of road construction on retail trade volume in the short term, mostly for the Alay region. There was, however, a negative impact of road construction in the long term on cargo transportation, passenger turnover volume, and retail trade. These negative effects could be conditioned by the general economic conditions and tendency of external trade and transit of goods. External trade slowdown after the 2008 global financial crisis and further movement of the Kyrgyz Republic economy toward the Eurasian Economic Union (EEU) may be reflected in the decrease of road cargo. Although it may be argued that the external trade situation would affect the other regions, too, it should be pointed out that these districts (especially Alay and Chong-Alay) are highly mountainous and can thus be more sensitive to the reduction of trade flows. Indeed, part of the road studied (Sarytash–Karamyk) connects to Tajikistan. This feature makes these districts different from the others and external trade fluctuations with Tajikistan can be directly reflected in fluctuations in the retail trade and transportation volume. The tendency of the total trade volume of the Kyrgyz Republic with Tajikistan for 2010–2017 according to data from the National Statistical Committee of the Kyrgyz Republic accords with the estimation results; that is, there was an increase in trade for 2010–2011, which parallels the positive short-term effect on retail trade, while there was a decrease in trade after 2014, which agrees with the long-term negative effect.2
2 According to data from the National Statistical Committee of the Kyrgyz Republic, the total external trade volume (exports and imports) of the Kyrgyz Republic with Tajikistan in 2010 was Som18,093.5 million, while in 2011 it increased to Som37,290.1 million; it decreased from Som36,062.8 million in 2014 to Som28,331.2 million in 2016.
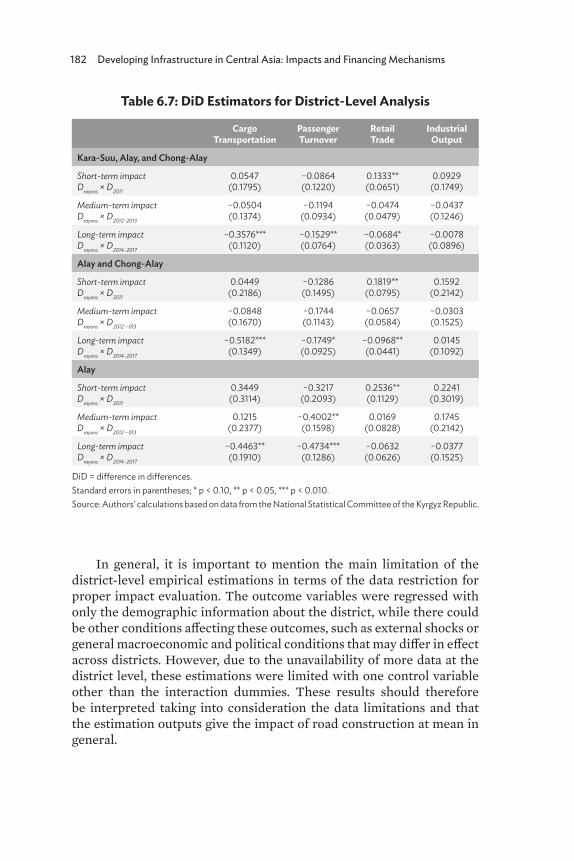
182 Developing Infrastructure in Central Asia: Impacts and Financing Mechanisms
Table 6.7: DiD Estimators for District-Level Analysis
CargoTransportation
PassengerTurnover
RetailTrade
IndustrialOutput
Kara-Suu, Alay, and Chong-Alay
Short-term impact Drayons × D2011
0.0547(0.1795)
−0.0864(0.1220)
0.1333**(0.0651)
0.0929(0.1749)
Medium-term impact Drayons × D2012–2013
−0.0504(0.1374)
−0.1194(0.0934)
−0.0474(0.0479)
−0.0437(0.1246)
Long-term impact Drayons × D2014–2017
−0.3576***(0.1120)
−0.1529**(0.0764)
−0.0684*(0.0363)
−0.0078(0.0896)
Alay and Chong-Alay
Short-term impact Drayons × D2011
0.0449(0.2186)
−0.1286(0.1495)
0.1819**(0.0795)
0.1592(0.2142)
Medium-term impact Drayons × D2012-–013
−0.0848(0.1670)
−0.1744(0.1143)
−0.0657(0.0584)
−0.0303(0.1525)
Long-term impact Drayons × D2014–2017
−0.5182***(0.1349)
−0.1749*(0.0925)
−0.0968**(0.0441)
0.0145(0.1092)
Alay
Short-term impact Drayons × D2011
0.3449(0.3114)
−0.3217(0.2093)
0.2536**(0.1129)
0.2241(0.3019)
Medium-term impact Drayons × D2012-–013
0.1215(0.2377)
−0.4002**(0.1598)
0.0169(0.0828)
0.1745(0.2142)
Long-term impact Drayons × D2014–2017
−0.4463** (0.1910)
−0.4734***(0.1286)
−0.0632(0.0626)
−0.0377(0.1525)
DiD = difference in differences. Standard errors in parentheses; * p < 0.10, ** p < 0.05, *** p < 0.010.Source: Authors’ calculations based on data from the National Statistical Committee of the Kyrgyz Republic.
In general, it is important to mention the main limitation of the district-level empirical estimations in terms of the data restriction for proper impact evaluation. The outcome variables were regressed with only the demographic information about the district, while there could be other conditions affecting these outcomes, such as external shocks or general macroeconomic and political conditions that may differ in effect across districts. However, due to the unavailability of more data at the district level, these estimations were limited with one control variable other than the interaction dummies. These results should therefore be interpreted taking into consideration the data limitations and that the estimation outputs give the impact of road construction at mean in general.
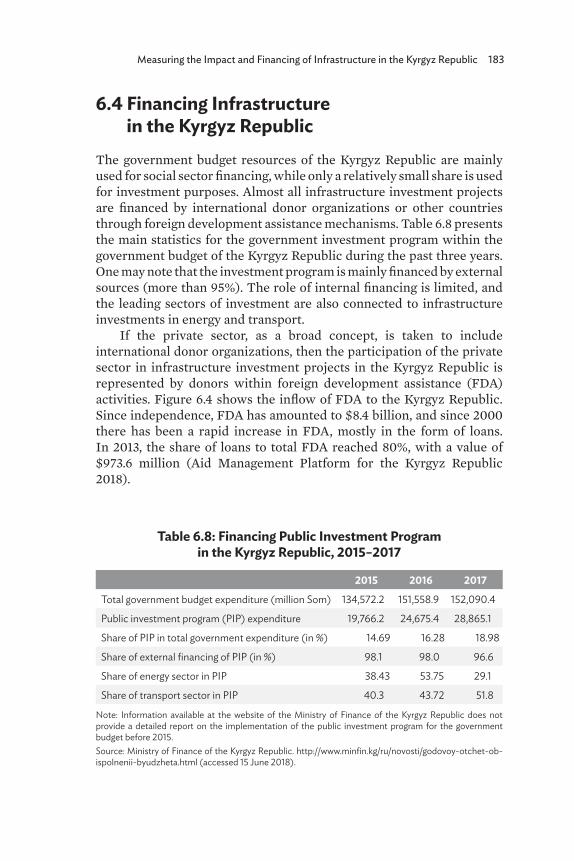
Measuring the Impact and Financing of Infrastructure in the Kyrgyz Republic 183
6.4 Financing Infrastructure in the Kyrgyz Republic
The government budget resources of the Kyrgyz Republic are mainly used for social sector financing, while only a relatively small share is used for investment purposes. Almost all infrastructure investment projects are financed by international donor organizations or other countries through foreign development assistance mechanisms. Table 6.8 presents the main statistics for the government investment program within the government budget of the Kyrgyz Republic during the past three years. One may note that the investment program is mainly financed by external sources (more than 95%). The role of internal financing is limited, and the leading sectors of investment are also connected to infrastructure investments in energy and transport.
If the private sector, as a broad concept, is taken to include international donor organizations, then the participation of the private sector in infrastructure investment projects in the Kyrgyz Republic is represented by donors within foreign development assistance (FDA) activities. Figure 6.4 shows the inflow of FDA to the Kyrgyz Republic. Since independence, FDA has amounted to $8.4 billion, and since 2000 there has been a rapid increase in FDA, mostly in the form of loans. In 2013, the share of loans to total FDA reached 80%, with a value of $973.6 million (Aid Management Platform for the Kyrgyz Republic 2018).
Table 6.8: Financing Public Investment Program in the Kyrgyz Republic, 2015–2017
2015 2016 2017Total government budget expenditure (million Som) 134,572.2 151,558.9 152,090.4
Public investment program (PIP) expenditure 19,766.2 24,675.4 28,865.1
Share of PIP in total government expenditure (in %) 14.69 16.28 18.98
Share of external financing of PIP (in %) 98.1 98.0 96.6
Share of energy sector in PIP 38.43 53.75 29.1
Share of transport sector in PIP 40.3 43.72 51.8
Note: Information available at the website of the Ministry of Finance of the Kyrgyz Republic does not provide a detailed report on the implementation of the public investment program for the government budget before 2015.Source: Ministry of Finance of the Kyrgyz Republic. http://www.minfin.kg/ru/novosti/godovoy-otchet-ob-ispolnenii-byudzheta.html (accessed 15 June 2018).
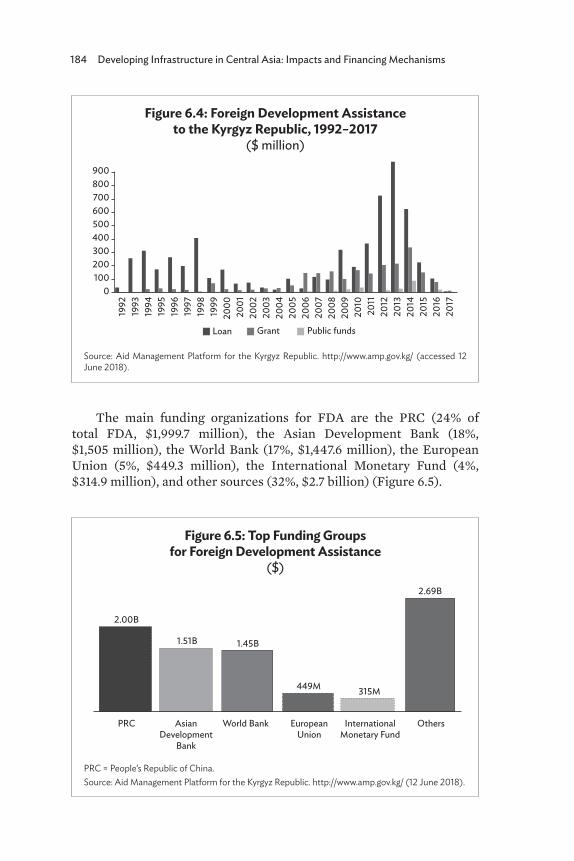
184 Developing Infrastructure in Central Asia: Impacts and Financing Mechanisms
The main funding organizations for FDA are the PRC (24% of total FDA, $1,999.7 million), the Asian Development Bank (18%, $1,505 million), the World Bank (17%, $1,447.6 million), the European Union (5%, $449.3 million), the International Monetary Fund (4%, $314.9 million), and other sources (32%, $2.7 billion) (Figure 6.5).
Figure 6.4: Foreign Development Assistance to the Kyrgyz Republic, 1992–2017
($ million)
Source: Aid Management Platform for the Kyrgyz Republic. http://www.amp.gov.kg/ (accessed 12 June 2018).
1992
1993
1994
1995
1996
1997
1998
1999
2000
2001
2002
2003
2004
2005
2006
2007
2008
2009
2010
2011
2012
2013
2014
2015
2016
2017
600700800900
500400300200100
0
Loan Grant Public funds
Figure 6.5: Top Funding Groups for Foreign Development Assistance
($)
PRC = People’s Republic of China.Source: Aid Management Platform for the Kyrgyz Republic. http://www.amp.gov.kg/ (12 June 2018).
PRC
2.00B
1.51B 1.45B
449M 315M
2.69B
World Bank OthersAsian Development
Bank
EuropeanUnion
International Monetary Fund
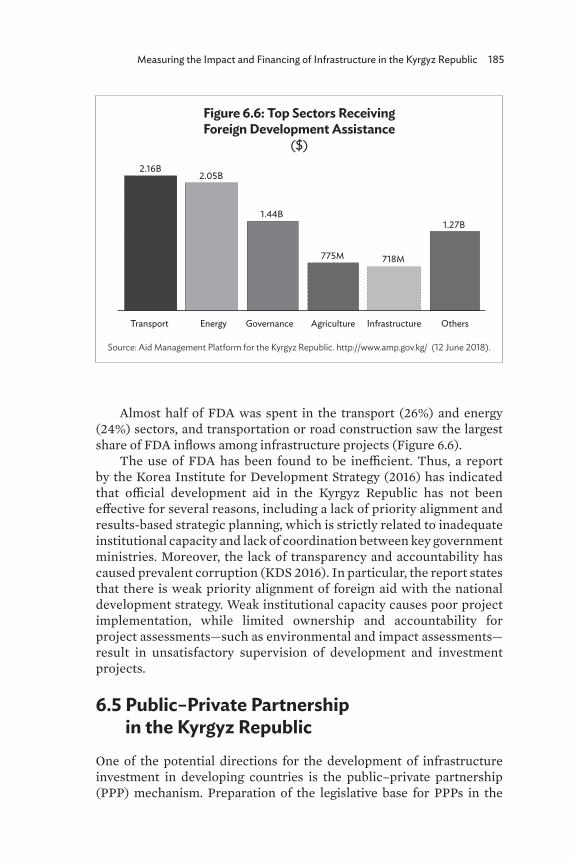
Measuring the Impact and Financing of Infrastructure in the Kyrgyz Republic 185
Almost half of FDA was spent in the transport (26%) and energy (24%) sectors, and transportation or road construction saw the largest share of FDA inflows among infrastructure projects (Figure 6.6).
The use of FDA has been found to be inefficient. Thus, a report by the Korea Institute for Development Strategy (2016) has indicated that official development aid in the Kyrgyz Republic has not been effective for several reasons, including a lack of priority alignment and results-based strategic planning, which is strictly related to inadequate institutional capacity and lack of coordination between key government ministries. Moreover, the lack of transparency and accountability has caused prevalent corruption (KDS 2016). In particular, the report states that there is weak priority alignment of foreign aid with the national development strategy. Weak institutional capacity causes poor project implementation, while limited ownership and accountability for project assessments—such as environmental and impact assessments—result in unsatisfactory supervision of development and investment projects.
6.5 Public–Private Partnership in the Kyrgyz Republic
One of the potential directions for the development of infrastructure investment in developing countries is the public–private partnership (PPP) mechanism. Preparation of the legislative base for PPPs in the
Figure 6.6: Top Sectors Receiving Foreign Development Assistance
($)
Source: Aid Management Platform for the Kyrgyz Republic. http://www.amp.gov.kg/ (12 June 2018).
Transport
2.16B2.05B
1.44B
775M 718M
1.27B
Governance OthersEnergy Agriculture Infrastructure
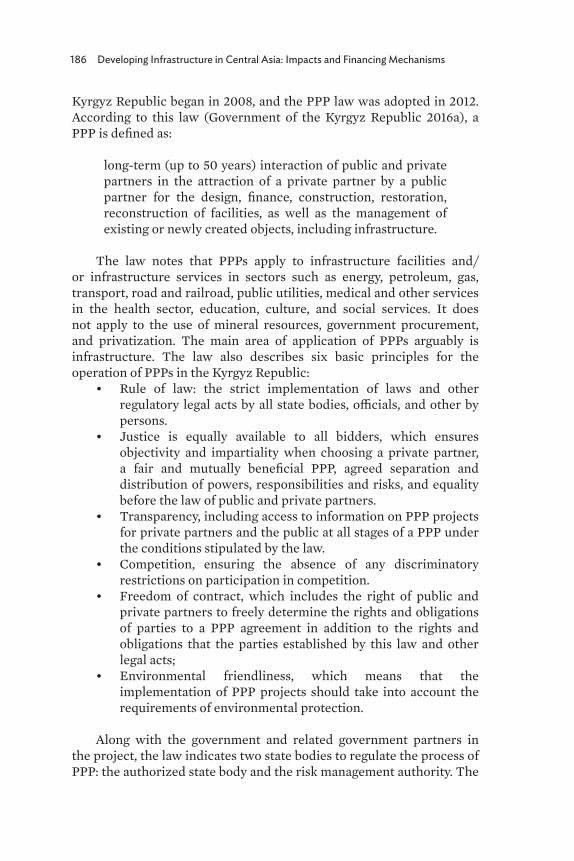
186 Developing Infrastructure in Central Asia: Impacts and Financing Mechanisms
Kyrgyz Republic began in 2008, and the PPP law was adopted in 2012. According to this law (Government of the Kyrgyz Republic 2016a), a PPP is defined as:
long-term (up to 50 years) interaction of public and private partners in the attraction of a private partner by a public partner for the design, finance, construction, restoration, reconstruction of facilities, as well as the management of existing or newly created objects, including infrastructure.
The law notes that PPPs apply to infrastructure facilities and/or infrastructure services in sectors such as energy, petroleum, gas, transport, road and railroad, public utilities, medical and other services in the health sector, education, culture, and social services. It does not apply to the use of mineral resources, government procurement, and privatization. The main area of application of PPPs arguably is infrastructure. The law also describes six basic principles for the operation of PPPs in the Kyrgyz Republic:
• Rule of law: the strict implementation of laws and other regulatory legal acts by all state bodies, officials, and other by persons.
• Justice is equally available to all bidders, which ensures objectivity and impartiality when choosing a private partner, a fair and mutually beneficial PPP, agreed separation and distribution of powers, responsibilities and risks, and equality before the law of public and private partners.
• Transparency, including access to information on PPP projects for private partners and the public at all stages of a PPP under the conditions stipulated by the law.
• Competition, ensuring the absence of any discriminatory restrictions on participation in competition.
• Freedom of contract, which includes the right of public and private partners to freely determine the rights and obligations of parties to a PPP agreement in addition to the rights and obligations that the parties established by this law and other legal acts;
• Environmental friendliness, which means that the implementation of PPP projects should take into account the requirements of environmental protection.
Along with the government and related government partners in the project, the law indicates two state bodies to regulate the process of PPP: the authorized state body and the risk management authority. The
Measuring the Impact and Financing of Infrastructure in the Kyrgyz Republic 187
authorized state body has competencies to implement the general policy of the government in the PPP sphere, including strategies and programs for development, the evaluation and approval of projects from other government partners, and the development of norms and regulations for the unification of processes. The risk management authority is mainly focused on approval of and changes in tender documentation. By government resolution, the Ministry of Economy is the authorized state body, while the Ministry of Finance is the state risk management body (Government of the Kyrgyz Republic 2012).
The law envisages two mechanisms to support PPPs: state financial support and economic support. Financial support is expressed through the provision of loans on concessional terms, credit guarantees, tariff subsidies, and guarantees on the minimum profitability of a PPP project, among other mechanisms. Economic support includes the granting of rights to movable or immovable property; assistance in obtaining licenses, permits, and approvals; and the establishment of preferential rental rates for the use of property, state and/or municipal property. Along with these potential support mechanisms, the partner and project company are guaranteed with nonintervention by the public partner, protection from nationalization, and the right to free possession of investment and its income.
Along with the adoption of the law, the Council on PPP in the Kyrgyz Republic was formed. This council, as a consultative and advisory body under the Government of the Kyrgyz Republic, coordinates the activities of state bodies and local governments in the development of PPPs. The council consists of the Vice Prime Minister, the Minister of Economy, the Minister of Finance, the Minister of Justice, the Director of the Agency for the Promotion and Protection of Investments, and the Director of the State Agency for Local Government Affairs (Government of the Kyrgyz Republic 2016b).
The availability of financial resources is one of the main issues in the promotion of PPP activities in the Kyrgyz Republic. Given this potential barrier, a fund for financing the preparation of PPP projects was created in 2014 with the support of the Asian Development Bank. The financial resources of this fund can be gathered from the central government budget and international and other organizations. These resources can be used for consulting services to prepare a draft PPP, for the preparation of tender documents, or feasibility studies (Government of the Kyrgyz Republic 2014).
According to the information given by the Investment Promotion Agency, due to annual allocation of Asian Development Bank grant funds, the state budget received $2 million in 2014, $1 million in 2015, and $1 million in 2016 to promote PPP projects. From this fund,
188 Developing Infrastructure in Central Asia: Impacts and Financing Mechanisms
$1.3 million was allocated for consulting services for the preparation of a feasibility study for eight projects with a total project cost of more than $79 million (Kyrgyz Republic Agency for the Promotion and Protection of Investments 2018).
In 2016, the government adopted the Program of Development of Public–Private Partnerships for 2016–2021 (Government of the Kyrgyz Republic 2016c). In this program, the following priority sectors for PPP projects have been identified: road and transport infrastructure, health care, housing and communal services, construction, energy, and tourism. Investments in these areas have a high multiplier effect and can considerably increase the public welfare. The program acknowledges the following problem areas for PPPs:
(1) Absence in the state and municipal bodies of sectoral programs on PPP, which leads to the lack of a clear vision and strategies to improve the quality of state and municipal services, long-term investment programs, and long-term budget plans.
(2) Lack of resources in terms of the administrative capacity for the preparation and implementation of PPP projects.
(3) The perception of the PPP mechanism by the private sector in the Kyrgyz Republic as a high-risk zone, which limits the interest of potential investors.
(4) Limited access to financial resources for the preparation and implementation of projects. Investment flow within PPP mechanisms, as a rule, comes from the own funds of investors and long-term lending by financial institutions.
(5) Limited experience of the private sector in the Kyrgyz Republic in the field of PPPs. The local business community is not yet able to prepare high-quality project proposals, which leads to significant costs for consulting services in the preparation of such proposals.
Taking these issues into consideration, the program aims to create a favorable and full-fledged environment for PPPs. The main quantitative objective is to conclude an agreement with private partners for the implementation of PPP projects that meet the best international principles with a total value of at least Som20 billion by 2021.
To solve these issues and achieve the main objective, several tasks related to private sector development, awareness raising, and administrative capacity improvement activities are planned. Among these activities, the development of financial instruments for PPP is highlighted, in particular, the development of mechanisms to create the necessary financial instruments to improve the viability and financial attractiveness of PPP projects in accordance with the best international
Measuring the Impact and Financing of Infrastructure in the Kyrgyz Republic 189
practices. Taking into consideration the limited capacity of the domestic banking system to provide long-term borrowing funds in the national currency, the creation of an infrastructure-financing fund is one of the main tasks prior to 2021. Among the potential sources for financing this fund, budgetary resources, financial development institutions, capital market, and other potential sources have been emphasized. As an outcome of such measures, it is expected that the fund will improve the position of the country in the INFRASCOPE evaluation, moving it from the “nascent” (as of 2014) to the “emerging markets” category, which will increase the country’s attractiveness to foreign investors.
According to the best of our knowledge, the latest issue of the INFRASCOPE evaluation does not include the Kyrgyz Republic. The website of the Investment Promotion Agency lists investment projects, but there is no detailed information on their current status. However, recent experience indicates a successful implementation of the PPP approach in the health sector. In October 2018, the dialysis center of Fresenius Medical Care Kyrgyzstan, a subsidiary of the international company, opened in Jalal-Abad. This is the first of four dialysis centers that will begin their work in the Kyrgyz Republic under a PPP agreement between Fresenius Medical Care and the Ministry of Health (2018).
PPPs in the Kyrgyz Republic are a recent phenomenon, but the legal basis has already been established. From the policy standpoint, adoption of the government program provides some expected objectives and action plans. However, the implementation of PPP projects has remained limited. Although infrastructure development is noted as the primary objective for PPP development in the Kyrgyz Republic both at the legislative level and within the government program, this would require the development of financial instruments oriented at PPP projects.
It can be argued that the major role of private sector participant in infrastructure investment in the Kyrgyz Republic is carried out by international organizations. Although some part of this financial inflow has taken the form of grants, the recent tendency indicates that the prevailing share of such funds is provided in the form of loans. Other mechanisms of financing infrastructure, such as through PPPs, are new in the country and have not been applied in large infrastructure projects. This limited evidence for PPP application does not imply the low potential of its introduction. The recently established fund for PPP project preparation is a good example and requires further development. For long-term infrastructure investments, however, other financial options should be developed. Realizing the infrastructure-financing fund as envisaged by the program is therefore important.
190 Developing Infrastructure in Central Asia: Impacts and Financing Mechanisms
Along with the financial constraints, one of the main constraints faced by potential private investors is the institutional weakness that causes low transparency and corruption. The development of private financing for infrastructure investment therefore requires government effort in several aspects: first, transparency throughout the PPP life cycle—at the preparation, procurement, and contract management stages; and second, it is important to ensure the availability to all stakeholders of necessary information about assessment results, the selection process, and project performance (World Bank 2018).
6.6 ConclusionsThis study sought to provide empirical evidence on the impact of road construction projects in the Kyrgyz Republic and discuss financing infrastructure in the country context. The impact evaluation analysis focused on the cases of the road construction for Osh–Sarytash–Irkeshtam and Sarytash–Karamyk in the Osh region. Estimations were based on the panel data set for 2005–2017 using both regional- and district-level information.
The findings indicate that, at the regional level, these particular road construction projects had a positive effect on poverty reduction and retail trade growth. Moreover, the estimation results at the district level showed that, in the short term, these projects increased retail trade, especially in the two mountainous districts of Alay and Chong-Alay. Interestingly, some negative effects on cargo transportation appeared, but this was probably due to external factors such as the general downturn of external trade flows with the PRC after the 2008 financial crisis; external trade limitations that appeared as the result of a Customs Union with the Russian Federation, Kazakhstan, and Belarus; and, the accession of the Kyrgyz Republic to the EEU, which resulted in lowering trends for external trade. These findings therefore support the argument that road construction itself may not be solely responsible for catalyzing trade, but other measures toward lowering trade barriers also are fundamental.
Several limitations of the empirical approach used in this study should be mentioned. First, for impact evaluation, a comparatively large dataset was available at the regional level, while the small number of regions restricts selection of an efficient comparison group. Second, the limited data availability at the district level does not allow for the use of a larger set of explanatory covariates. Additional information on credits, investment, and other indicators of economic activity at the district level would allow more concrete measurement of the impact. Third, the road construction projects analyzed in this study were part
Measuring the Impact and Financing of Infrastructure in the Kyrgyz Republic 191
of regional transit corridors, so their effect can be observed not only in the territory of one country, but may also have a spillover effect in the territory of neighboring countries. Complete understanding of the effects of this project may necessitate additional analysis of several regions in neighboring countries. Fourth, the economic benefits generated by infrastructure investment generally may not be observed in the official statistical data because of informal economic activities. Nevertheless, given these potential limitations, the positive effects on poverty reduction, along with the other benefits indicated in findings, show that road construction can make a considerable contribution to economic performance measured at the regional level within the Kyrgyz Republic.
A general overview of infrastructure investment in the Kyrgyz Republic reveals that the major role of private sector participants in infrastructure investment is carried out by the international organizations, and a large share of these financial resources takes the form of loans. The PPP mechanism is not well developed in the Kyrgyz Republic, but this does not imply a low potential for its use.
Increasing investment in infrastructure, like any other investment activity, requires improvement to the investment climate in the country. The general prerequisites for private sector participation in infrastructure investments include government policies to decrease the regulatory burden and private investment risk, as well as institutional development associated with transparency. Another direction for government policy would be improvement of institutional capacity to advance PPP initiatives. Capacity building in the relevant government authorities may be necessary for effective PPP program development. To increase private sector activity, an awareness-raising campaign could be used.
Limited financial resources are one of the main constraints facing potential private investors. The envisaged establishment of the infrastructure-financing fund in the government program for PPP development is important in this regard, as it would help accumulate long-term financial resources. For efficient preparatory activities, however, the further widening of the resources of the fund to finance the preparation of PPP projects is needed. Support for further enhancement of PPP activities in infrastructure projects depends on the transparency of these activities, so it is important to ensure information is available to all stakeholders at all stages of the PPP.
The long-term sustainable economic effects of road construction require the creation of a business ecosystem along the road. Taking into consideration the status of the studied projects as part of regional transit corridors, it is important to undertake other comprehensive
192 Developing Infrastructure in Central Asia: Impacts and Financing Mechanisms
measures, and international road construction in particular should be accompanied by the lowering of border barriers and increased external trade promotion initiatives. Another important aspect of infrastructure projects is that efficient functioning depends on improved regional cooperative ties. Government policies oriented to use the potential benefits provided by EEU membership would increase the full potential of these road construction projects by increasing commodity transportation to and from Tajikistan and the PRC. Another potential regional cooperative tie is represented by the Almaty–Bishkek Economic corridor. Consideration of the infrastructure project not only as a transit or transport corridor, but more comprehensively as an economic corridor, would increase its wider effect on the economy. It is therefore critical to identify economic potential and coordination across stakeholders through detailed economic analyses.
Measuring the Impact and Financing of Infrastructure in the Kyrgyz Republic 193
ReferencesAid Management Platform for the Kyrgyz Republic. 2018. http://www
.amp.gov.kg/TEMPLATE/ampTemplate/dashboard/build/index
.html (accessed 12 June 2018).Arvis, J.F., G. Raballand, and J.F. Marteau. 2010. The Cost of Being
Landlocked: Logistics Costs and Supply Chain Reliability. Washington, DC: World Bank Group.
Asian Development Bank (ADB). 2011. Completion Report: Kyrgyz Republic: Southern Transport Corridor Road Rehabilitation Project. Manila.
____. 2014. Central Asia Regional Economic Cooperation Corridor Performance Measurement and Monitoring: A Forward-Looking Retrospective. Manila: ADB.
Government of the Kyrgyz Republic. 2012. Resolution of Government of the Kyrgyz Republic No. 616, dated 14 September 2012, “On the Definition of Authorized Bodies in the Field of Public–Private Partnership.”
____. 2014. Regulation on the Fund for Financing the Preparation of Public–Private Partnership Projects. Approved by decree of the Government of the Kyrgyz Republic No. 147 dated 17 March 2014.
____. 2016a. The Law of the Kyrgyz Republic “On Public–Private Partnership in the Kyrgyz Republic,” (No. 7 dated 22 February 2012, as amended by the Law of the Kyrgyz Republic No. 88 dated 22 June 2016).
____. 2016b. Regulation on the Public–Private Partnership Council in the Kyrgyz Republic. Approved by decree of the Government of the Kyrgyz Republic No. 328, dated 16 June 2016.
____. 2016c. Resolution of the Government of the Kyrgyz Republic No. 327 from 16 June 2016 “On Approval of the Program for the Development of Public–Private Partnership in the Kyrgyz Republic for 2016–2021.”
International Finance Corporation (IFC). 2015. Investment Climate in Kyrgyz Republic: Views of Foreign Investors. Washington, DC: World Bank Group. https://openknowledge.worldbank.org /handle/10986/24460.
International Monetary Fund (IMF). 2018. Kyrgyz Republic Fourth and Fifth Reviews under the Three-Year Arrangement under the Extended Credit Facility, and Request for Modification of Performance Criteria—Debt Sustainability Analysis Update, 22 February 2018. Washington, DC: IMF. https://www.imf.org/en/Publications/CR/Issues/2018/02/22 /Kyrgyz-Republic-Fourth-and-Fifth-Reviews-under-the-Three -Year-Arrangements-under-the-45651.
194 Developing Infrastructure in Central Asia: Impacts and Financing Mechanisms
Korea Institute for Development Strategy (KDS). 2016. 2015/16 Knowledge Sharing Program with Kyrgyz Republic: Effective Utilization of Financial and Human Capital for Sustainable Development of the Kyrgyz Republic. Seoul: KDS. https://www .kdevelopedia.org/resource/view/04201802210149865.do.
Kyrgyz Bank. 2009. Bulletin of the National Bank of the Kyrgyz Republic, http://www.nbkr.kg/index1.jsp?item=137&lang=ENG (accessed 10 June 2018).
Kudryavtseva, T. 2018. National Bank Lowers Forecast for GDP Growth in Kyrgyzstan in 2018. 9 July. https://24.kg/ekonomika/90192 _natsbank_ponizil_prognoz_rosta_vvp_kyirgyizstana_poitogam _2018_goda/.
Kyrgyz Republic Agency for the Promotion and Protection of Investments. 2018. PPP Project Financing Facility. http://ppp.gov .kg/ru/finansovye-instrumenty/fond-finansirovaniia-podgotovki -proektov/.
Ministry of Health of the Kyrgyz Republic. 2018. The First Fresenius Medical Care Dialysis Center Opened in Jalalabad. 18 October. http://www.med.kg/ru/876-v-dzhalal-abade-otkrylsya-pervyj -dializnyj-tsentr-fresenius-medical-care.html
Nalobina, E. 2014. Project Report for Road Construction Project Bishkek–Naryn–Torugart. Presentation to Group of Experts on Euro-Asian Transport Links. WP5/GE2 11th Session. Geneva, Switzerland. https://www.unece.org/fileadmin/DAM/trans/doc/2014/wp5 /wp5-eatl/WP5_GE2_11th_session_Ms_Nalobina_Kyrgyzstan.pdf (accessed 6 September 2018).
National Statistical Committee of the Kyrgyz Republic (NSCKR). n.d. Demographic Yearbooks of the Kyrgyz Republic for 2005–2017. Bishkek.
____. n.d. Quarterly Reports on Kyrgyz Republic and Regions. Bishkek.Raballand, G. 2003. Determinants of the Negative Impact of Being
Landlocked on Trade: An Empirical Investigation Through the Central Asian Case. Comparative Economic Studies. 45 (4). pp. 520–36.
World Bank. 2017. Kyrgyz Republic – A Resilient Economy… On a Slow Growth Trajectory: With a Special Focus on Kyrgyzstan’s Ailing Energy Sector. Kyrgyz Republic Economic Update; No. 5. Washington, DC. http://documents.worldbank.org/curated/en/710331496766602711 /Kyrgyz-Republic-A-Resilient-Economy-On-a-Slow-Growth -Trajectory-With-a-Special-Focus-on-Kyrgyzstans-Ailing-Energy -Sector.
____. 2018. Procuring Infrastructure Public–Private Partnerships Report 2018. Washington, DC: World Bank.
Measuring the Impact and Financing of Infrastructure in the Kyrgyz Republic 195
____. World Development Indicators. https://data.worldbank.org /country/kyrgyz-republic?view=chart (accessed 10 June 2018).
Yoshino, N., and U. Abidhadjaev. 2017. An Impact Evaluation of Investment In Infrastructure: The Case of a Railway Connection in Uzbekistan. Journal of Asian Economics. 49. pp. 1–11.
Yoshino, N., and V. Pontines. 2015. The “Highway Effect” on Public Finance: Case of the Star Highway in the Philippines. ADBI Working Paper Series No. 549. Tokyo: ADB Institute.
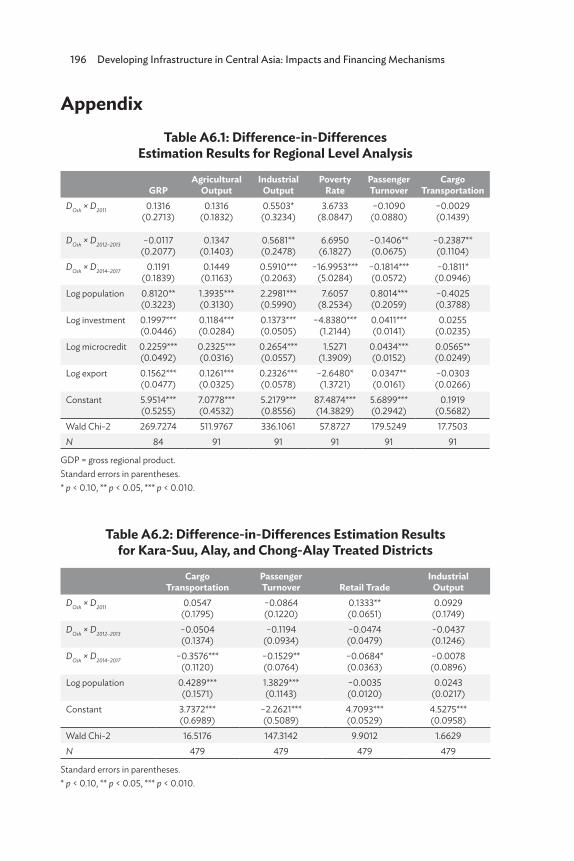
196 Developing Infrastructure in Central Asia: Impacts and Financing Mechanisms
AppendixTable A6.1: Difference-in-Differences
Estimation Results for Regional Level Analysis
GRPAgricultural
OutputIndustrial
OutputPoverty
RatePassengerTurnover
Cargo Transportation
DOsh × D2011 0.1316 (0.2713)
0.1316 (0.1832)
0.5503* (0.3234)
3.6733 (8.0847)
−0.1090 (0.0880)
−0.0029 (0.1439)
DOsh × D2012–2013 −0.0117 (0.2077)
0.1347 (0.1403)
0.5681** (0.2478)
6.6950 (6.1827)
−0.1406** (0.0675)
−0.2387** (0.1104)
DOsh × D2014–2017 0.1191 (0.1839)
0.1449 (0.1163)
0.5910*** (0.2063)
−16.9953***(5.0284)
−0.1814*** (0.0572)
−0.1811* (0.0946)
Log population 0.8120** (0.3223)
1.3935*** (0.3130)
2.2981*** (0.5990)
7.6057 (8.2534)
0.8014*** (0.2059)
−0.4025 (0.3788)
Log investment 0.1997*** (0.0446)
0.1184*** (0.0284)
0.1373*** (0.0505)
−4.8380*** (1.2144)
0.0411*** (0.0141)
0.0255 (0.0235)
Log microcredit 0.2259*** (0.0492)
0.2325*** (0.0316)
0.2654*** (0.0557)
1.5271 (1.3909)
0.0434*** (0.0152)
0.0565** (0.0249)
Log export 0.1562*** (0.0477)
0.1261*** (0.0325)
0.2326*** (0.0578)
−2.6480* (1.3721)
0.0347** (0.0161)
−0.0303 (0.0266)
Constant 5.9514*** (0.5255)
7.0778*** (0.4532)
5.2179*** (0.8556)
87.4874*** (14.3829)
5.6899*** (0.2942)
0.1919 (0.5682)
Wald Chi-2 269.7274 511.9767 336.1061 57.8727 179.5249 17.7503N 84 91 91 91 91 91
GDP = gross regional product.Standard errors in parentheses.* p < 0.10, ** p < 0.05, *** p < 0.010.
Table A6.2: Difference-in-Differences Estimation Results for Kara-Suu, Alay, and Chong-Alay Treated Districts
Cargo Transportation
PassengerTurnover Retail Trade
Industrial Output
DOsh × D2011 0.0547 (0.1795)
−0.0864 (0.1220)
0.1333** (0.0651)
0.0929 (0.1749)
DOsh × D2012–2013 −0.0504 (0.1374)
−0.1194 (0.0934)
−0.0474 (0.0479)
−0.0437 (0.1246)
DOsh × D2014–2017 −0.3576*** (0.1120)
−0.1529** (0.0764)
−0.0684* (0.0363)
−0.0078 (0.0896)
Log population 0.4289*** (0.1571)
1.3829*** (0.1143)
−0.0035 (0.0120)
0.0243 (0.0217)
Constant 3.7372*** (0.6989)
−2.2621*** (0.5089)
4.7093*** (0.0529)
4.5275*** (0.0958)
Wald Chi-2 16.5176 147.3142 9.9012 1.6629N 479 479 479 479
Standard errors in parentheses.* p < 0.10, ** p < 0.05, *** p < 0.010.
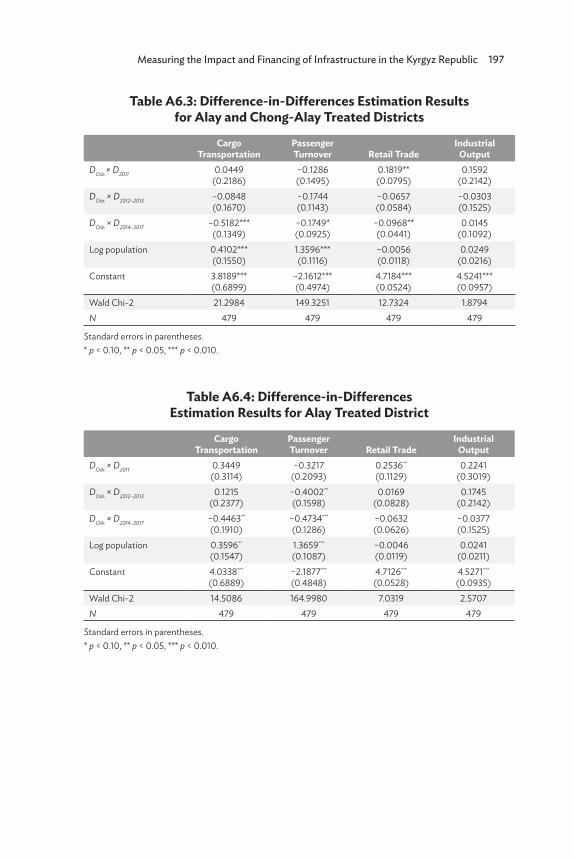
Measuring the Impact and Financing of Infrastructure in the Kyrgyz Republic 197
Table A6.3: Difference-in-Differences Estimation Results for Alay and Chong-Alay Treated Districts
Cargo Transportation
PassengerTurnover Retail Trade
Industrial Output
DOsh × D2011 0.0449 (0.2186)
−0.1286 (0.1495)
0.1819** (0.0795)
0.1592 (0.2142)
DOsh × D2012–2013 –0.0848 (0.1670)
−0.1744 (0.1143)
−0.0657 (0.0584)
−0.0303 (0.1525)
DOsh × D2014–2017 –0.5182*** (0.1349)
−0.1749* (0.0925)
−0.0968** (0.0441)
0.0145 (0.1092)
Log population 0.4102*** (0.1550)
1.3596*** (0.1116)
−0.0056 (0.0118)
0.0249 (0.0216)
Constant 3.8189*** (0.6899)
–2.1612*** (0.4974)
4.7184*** (0.0524)
4.5241*** (0.0957)
Wald Chi-2 21.2984 149.3251 12.7324 1.8794N 479 479 479 479
Standard errors in parentheses.* p < 0.10, ** p < 0.05, *** p < 0.010.
Table A6.4: Difference-in-Differences Estimation Results for Alay Treated District
Cargo Transportation
PassengerTurnover Retail Trade
Industrial Output
DOsh × D2011 0.3449 (0.3114)
−0.3217 (0.2093)
0.2536** (0.1129)
0.2241 (0.3019)
DOsh × D2012–2013 0.1215 (0.2377)
−0.4002** (0.1598)
0.0169 (0.0828)
0.1745 (0.2142)
DOsh × D2014–2017 −0.4463** (0.1910)
−0.4734*** (0.1286)
−0.0632 (0.0626)
−0.0377 (0.1525)
Log population 0.3596** (0.1547)
1.3659*** (0.1087)
−0.0046 (0.0119)
0.0241 (0.0211)
Constant 4.0338*** (0.6889)
−2.1877*** (0.4848)
4.7126*** (0.0528)
4.5271*** (0.0935)
Wald Chi-2 14.5086 164.9980 7.0319 2.5707N 479 479 479 479
Standard errors in parentheses.* p < 0.10, ** p < 0.05, *** p < 0.010.
198
7Infrastructure Development
and Public–Private Partnerships: Measuring Impacts of Urban
Transport Infrastructure in Pakistan
Muhammad Ayub Mehar
7.1 Introduction: Infrastructure and Economic Growth – Direction of Causality
Economic theory strongly supports the significant role of infrastructure development in economic growth. Though infrastructure development can directly generate several economic activities in the chemical, cement, steel, banking, transportation, energy, and services sectors, its main role is to provide a catalyst for the development of other sectors. There are numerous examples in the economic literature that demonstrate that the development of various kinds of infrastructure improves people’s living standards and creates employment opportunities. In the context of Uzbekistan, Yoshino and Abidhadjaev (2017) found that connectivity through railways led to a significant increase in gross domestic product (GDP). A study carried out in the context of Pakistan by the World Bank (2017) concluded that infrastructure development significantly impacts per capita income at purchasing power parity. The results of this study provide useful insight into how much spending on infrastructure development contributes in terms of per capita income. It explains that a spending of PRs1 billion on improving the quality of roads can increase the per capita income by PRs371 ($2.4) on a permanent basis. This mechanism is much more powerful than subsidies and transfer payments, because it provides a sustainable solution to poverty.
Infrastructure Development and Public–Private Partnerships: Measuring Impacts of Urban Transport Infrastructure in Pakistan 199
Other studies in the context of Pakistan have established linkages between economic growth and infrastructure development. Some of those studies have tested the direction of causality and explained how various types of infrastructure affect GDP growth. Several studies tried to quantify the impact of infrastructure on economic growth. Hussain and Zhang (2018) estimated that the net income loss from a lack of reliable access to electricity for households in Pakistan is $4.5 billion a year, which is about 1.7% of GDP. Electrification has a significant positive impact on household income and expenditure. Gaining access to electricity is associated with a 37% increase in per capita income and an 11% increase in expenditures (Hussain and Zhang 2018).
The World Economic Forum (2012) and the Organisation for Economic Co-operation and Development (2010, 2012) have estimated the impact of various types of infrastructure on the growth of per capita income. The Organisation for Economic Co-operation and Development (2018) has estimated the required investment in infrastructure to achieve the targets of the Sustainable Development Goals. The Asian Development Bank has estimated that developing Asia will need to invest $1.5 trillion per year in infrastructure up to 2030 to maintain its economic growth momentum and tackle poverty. Total infrastructure financing as a share of GDP will need to increase from around 3.8% to 5.6% by 2020 worldwide (Yoshino, Helble, and Abidhadjaev 2018). In this context, a declining trend in development expenditures by the government and the negligible role of the private sector in infrastructure development in Pakistan indicate an alarming situation. According to estimates from the Global Infrastructure Hub and Oxford Economics (2016, 2017), Pakistan faces a shortfall of $124 billion in infrastructure development between 2016 and 2040. The size of this gap is more than the country’s total outstanding external debts.
The lack of appropriate infrastructure, declining business competitiveness, lower rate of growth, and economic miseries are interconnected variables. The lower growth of the economy has resulted in falling tax revenue and insufficient resources to operate government institutions. It is also a common phenomenon that in the case of lower tax receipts and insufficient financial resources, government has to cut back necessary development projects and investment in public sector infrastructure. Mehar (2018) and the Federation of Pakistan Chambers of Commerce and Industry (2016) have established a causal relation between deterioration in infrastructure and the level of poverty. It is recommended in various research reports that Pakistan develop its infrastructure on a priority basis to accelerate its economic growth and to revive its economy (FPCCI 2015).
200 Developing Infrastructure in Central Asia: Impacts and Financing Mechanisms
In Pakistan, the government has tended to prioritize spending to meet its recurring expenditures such as debt servicing, defense, and general administration. Therefore, spending on the development of infrastructure has become the lowest priority. This situation has led to a deterioration in the physical infrastructure of Pakistan. The economy now faces a crisis in the supply of energy, a shortage of water, a badly damaged sanitation system, and outdated means of transportation. The deterioration in infrastructure has led to a lower ranking in business competitiveness, such that industries cannot utilize their available production capacity because of energy shortages, frequent interruption to energy supplies, and poor logistic facilities in transportation. The badly deteriorated physical infrastructure in Pakistan does not support economic progress and industrialization. The lack of physical infrastructure has become the primary cause of declining growth in GDP.
A consecutive decline in the inflow of foreign direct investment is also a drastic indicator for the economy of Pakistan. Attracting foreign and local investment and discouraging the outflow of domestic capital are natural requirements for rapid industrialization and economic development. It is obvious that inducing private sector investment—both foreign and domestic—requires a significant and visible improvement in public goods infrastructure. The concern with these suggestions is the lack of sufficient funds for the required development, which this study also tackles. The other objective of the study is to measure the impact of change in transport infrastructure on people’s living standards.
7.2 Infrastructure Financing in Pakistan: Historical Trends and Policy Change
Pakistan has experienced an interesting history of economic development. It enjoyed a remarkable rate of growth in its early years, but the country today is different to what it was in the 1950s and 1960s. It is unfortunate that the growing external debt has reached a level where further borrowing may destabilize the economy. The burden of these debts is transferred to the next generation, and repayment is the foremost problem in Pakistan’s fiscal policy. The gigantic volume of debt and servicing of the interest prevent the country from using its fiscal resources for its infrastructure development. The external debt liabilities are dominated by long-term loans from international finance institutions, multilateral agencies, and the Paris Club. The share of sovereign bonds (market-based external debt) in public debt is less than 5%. Another problem that exacerbates the high level of external leverage is the impact of the deteriorating value of the Pakistan rupee.
Infrastructure Development and Public–Private Partnerships: Measuring Impacts of Urban Transport Infrastructure in Pakistan 201
The devaluation of the currency means that the country will have to pay more interest in real terms, which will require higher levels of resource mobilization from domestic sources. This will lead to higher taxes on business and the public at large, especially since tax rises for the rich are not politically feasible. It indicates that the present burden of external debt does not allow the dependency of infrastructure development on foreign debt. Here it is also important that the majority of the present outstanding external borrowing belongs to program loans. The share in infrastructure-related projects has declined significantly.
The last decade has reflected the fast deterioration in macroeconomic indicators, and Pakistan currently has the lowest development ranking in the region. A global comparison also confirms the deterioration of physical infrastructure in the country in terms of international ranking. Pakistan ranks 110th in the overall infrastructure ranking of 137 countries (WEF 2011, 2018). Table 7.1 shows the deterioration in the quality of transport infrastructure over time. This deterioration in infrastructure has badly damaged the country’s economic competitiveness. Despite the badly required infrastructure development, the spending on this sector is negligible compared to the spending on non-development expenditures. Even the investment in infrastructure with private participation is not up to the required level. The lack of appropriate infrastructure can be observed in public places, civic facilities in metropolitan cities, the supply of utility services, electricity, railways, highways, shipping, and the national carrier airline, Pakistan International Airlines.
The development and modernization of physical infrastructure in developing countries during the bipolar regime was largely based on subsidized external debts and grants from industrialized countries. Affiliation with a political ideology was a more important consideration than economic justification and viability in this type of financing. This phenomenon is explained by the “dependency theory” and “domino effect model,” or in a different way, the “hegemonic stability theory” (Kindleberger 1970). Consequently, the infrastructure financing activities in low- and middle-income countries before 1990 have been considered a public sector responsibility. The flows of external debt and foreign direct investment have also been associated with political affiliations. After the fall of the bipolar regime, it was difficult for the politicians and the public in developing countries to understand the new realities. Though some development finance institutions (DFIs) have been working for infrastructure financing through venture capital activities in developing countries, these institutions were in the public sector and their budgets and accounts integrated with the centralized public accounts offices. Unfortunately, political leaders and policy makers in these countries still consider foreign aid and external
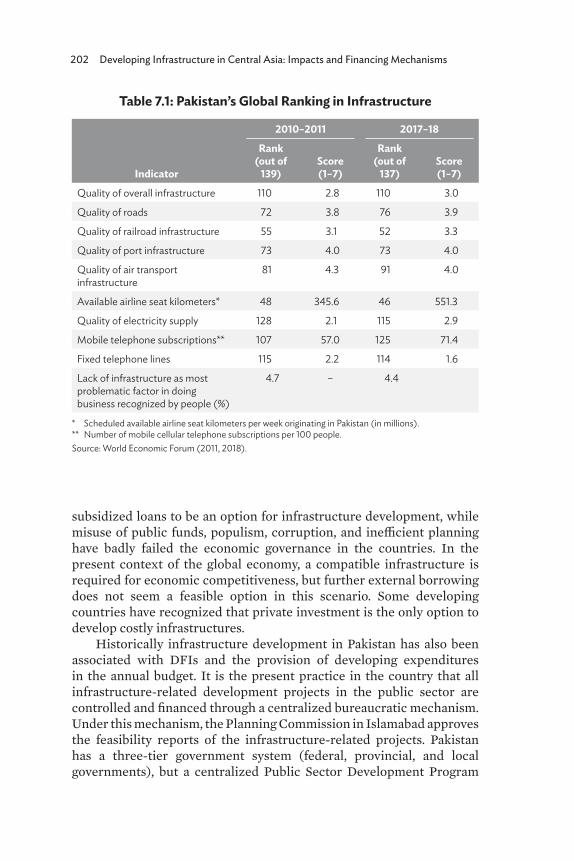
202 Developing Infrastructure in Central Asia: Impacts and Financing Mechanisms
subsidized loans to be an option for infrastructure development, while misuse of public funds, populism, corruption, and inefficient planning have badly failed the economic governance in the countries. In the present context of the global economy, a compatible infrastructure is required for economic competitiveness, but further external borrowing does not seem a feasible option in this scenario. Some developing countries have recognized that private investment is the only option to develop costly infrastructures.
Historically infrastructure development in Pakistan has also been associated with DFIs and the provision of developing expenditures in the annual budget. It is the present practice in the country that all infrastructure-related development projects in the public sector are controlled and financed through a centralized bureaucratic mechanism. Under this mechanism, the Planning Commission in Islamabad approves the feasibility reports of the infrastructure-related projects. Pakistan has a three-tier government system (federal, provincial, and local governments), but a centralized Public Sector Development Program
Table 7.1: Pakistan’s Global Ranking in Infrastructure
Indicator
2010–2011 2017–18Rank
(out of 139)
Score(1–7)
Rank(out of
137)Score(1–7)
Quality of overall infrastructure 110 2.8 110 3.0
Quality of roads 72 3.8 76 3.9
Quality of railroad infrastructure 55 3.1 52 3.3
Quality of port infrastructure 73 4.0 73 4.0
Quality of air transport infrastructure
81 4.3 91 4.0
Available airline seat kilometers* 48 345.6 46 551.3
Quality of electricity supply 128 2.1 115 2.9
Mobile telephone subscriptions** 107 57.0 125 71.4
Fixed telephone lines 115 2.2 114 1.6
Lack of infrastructure as most problematic factor in doing business recognized by people (%)
4.7 – 4.4
* Scheduled available airline seat kilometers per week originating in Pakistan (in millions).** Number of mobile cellular telephone subscriptions per 100 people.Source: World Economic Forum (2011, 2018).
Infrastructure Development and Public–Private Partnerships: Measuring Impacts of Urban Transport Infrastructure in Pakistan 203
is controlled by the Planning Commission. Some projects under this program are directly launched and managed by the federal government. The construction of railways, motorways, national highways, ports, a communication network, energy distribution, and distribution of water for irrigation and power generation are included in the federal projects, while 50% of matching grants are transferred to the provinces for the development of those projects that are launched by the provincial governments after approval by the Planning Commission.
There were several DFIs in the public sector, and the government had been providing equities to establish these before the 1990s. The National Development Finance Corporation, the Industrial Development Bank of Pakistan, the Agriculture Development Bank of Pakistan, the Pakistan Industrial Credit and Investment Corporation, the Pakistan Industrial Development Corporation, and many such other institutions were responsible for providing funds for big infrastructure projects in the public and private sectors. Now, they have either been dissolved because of bad governance and a lack of funding or play an ineffective role in the economy. In 2014, the government again announced it was to establish a new DFI (Pakistan Investment Fund) by injecting PRs500 billion ($3.2 billion) in initial equity, but it is still inactive. The large commercial banks in the public sector also provide financing facilities to public sector projects. The monetary policy of the State Bank of Pakistan plays an important role in allocating credit facilities to different sectors and determining the rate of interest. All these policy measures indicate the overdependency of infrastructure development on the public sector.
Some important changes in economic regulations and policies were observed in Pakistan in 1993 when the then caretaker government decided to limit the role of the public sector in infrastructure development and an unplanned openness in the economy was initiated. Deregulation and privatization of public sector commercial enterprises were proposed. For a smooth implementation of opening up trade, the tariff structure was revised downward. The economic policy reforms in Pakistan in 1993 included the convertibility of the Pakistani currency, stock market reforms, the adoption of a new mechanism to determine interbank offering (interest) rates, reforms in monetary policy, the introduction of a green channel for duty-free imports of goods in permissible quantities through air travel, the introduction of a withholding tax culture for direct taxes, and a significant enhancement of general sales tax.
Some public sector responsibilities and activities were shifted to the private sector. The participation of the private sector in infrastructure development was realized, and it was planned to involve the private sector in transport, communication, and infrastructure development. After 3 months of the caretaker government, the then newly elected
204 Developing Infrastructure in Central Asia: Impacts and Financing Mechanisms
parliament endorsed the continuity of policy reforms that were introduced by the caretaker government. Consequently, the share of development expenditures in the total public expenditures of the federal government was reduced significantly.
The development expenditures-to-GDP ratio in the federal budget was always greater than 6% before 1993, but was reduced to less than 4% after 1993 and even reached 1.8% in 2018/19. The declining role of DFIs in the economy and the closure of some big institutions have aggravated the deterioration in infrastructure development in Pakistan, while monetary policy has induced consumer banking services, as commercial banks have enhanced their lending for personal loans, credit cards, auto financing, and various types of revolving credits for maintaining household expenditures. This situation shifted the focus of commercial banks from industrial development financing to consumer-oriented lending. A sharp decline in public sector development expenditures as a percentage of GDP without ensuring a substitution from the private sector can be seen in Table 7.2.
The declining development expenditures of the public sector without ensuring substitution from the private sector have damaged the economic growth of Pakistan. No significant contribution from the private sector has been noted in infrastructure-related projects. The negligible share of the private sector in infrastructure development activities and the declining development expenditures of the government reflect the country’s deteriorating global infrastructure ranking. A deterioration in infrastructure was the obvious outcome of this policy and led to a declining rate of GDP growth and its spinoffs: exports, tax revenue, investment, savings, employment, etc. A visible difference in the economic growth of Pakistan before and after 1993 can be seen in Table 7.2. This change in 1993 was not a success story of fiscal reforms. Though prudence in the utilization of debt money was observed, overall its effect on growth was negative because private sector participation could not be ensured before a drop in public sector development expenditures. This was a policy failure that lowered the long-term economic growth of Pakistan.
The role of the private sector in infrastructure development financing has not been successful in Pakistan because of several frictions and bureaucratic barriers in the implementation of private financing procedures. According to a survey conducted by the World Bank, Pakistan is in a relatively better position in the preparation and procurement of a public–private partnership (PPP), but its position is below average in terms of contract management. The study was carried out among 135 countries, analyzing 47 indicators belonging to preparation, procurement, management, and unsolicited proposals of PPP projects
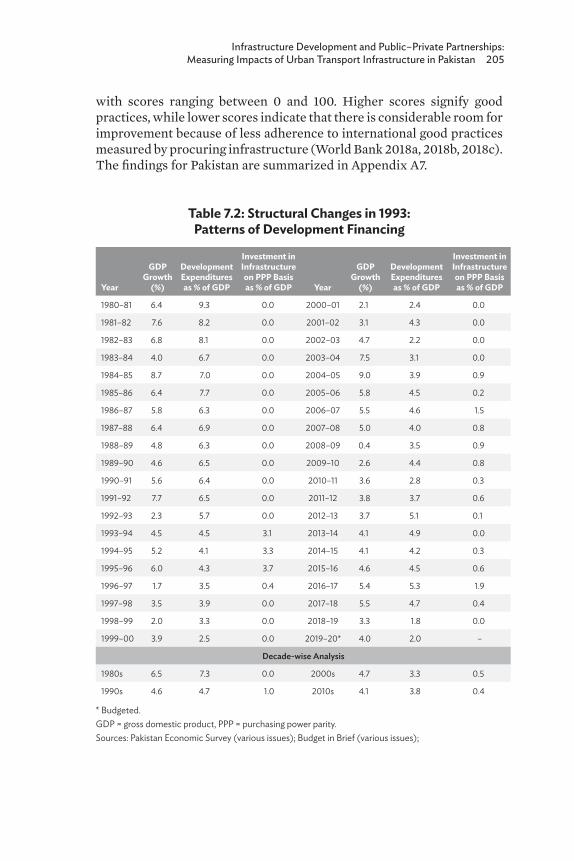
Infrastructure Development and Public–Private Partnerships: Measuring Impacts of Urban Transport Infrastructure in Pakistan 205
with scores ranging between 0 and 100. Higher scores signify good practices, while lower scores indicate that there is considerable room for improvement because of less adherence to international good practices measured by procuring infrastructure (World Bank 2018a, 2018b, 2018c). The findings for Pakistan are summarized in Appendix A7.
Table 7.2: Structural Changes in 1993: Patterns of Development Financing
Year
GDP Growth
(%)
Development Expenditures as % of GDP
Investment in Infrastructure on PPP Basis as % of GDP Year
GDP Growth
(%)
Development Expenditures as % of GDP
Investment in Infrastructure on PPP Basis as % of GDP
1980–81 6.4 9.3 0.0 2000–01 2.1 2.4 0.0
1981–82 7.6 8.2 0.0 2001–02 3.1 4.3 0.0
1982–83 6.8 8.1 0.0 2002–03 4.7 2.2 0.0
1983–84 4.0 6.7 0.0 2003–04 7.5 3.1 0.0
1984–85 8.7 7.0 0.0 2004–05 9.0 3.9 0.9
1985–86 6.4 7.7 0.0 2005–06 5.8 4.5 0.2
1986–87 5.8 6.3 0.0 2006–07 5.5 4.6 1.5
1987–88 6.4 6.9 0.0 2007–08 5.0 4.0 0.8
1988–89 4.8 6.3 0.0 2008–09 0.4 3.5 0.9
1989–90 4.6 6.5 0.0 2009–10 2.6 4.4 0.8
1990–91 5.6 6.4 0.0 2010–11 3.6 2.8 0.3
1991–92 7.7 6.5 0.0 2011–12 3.8 3.7 0.6
1992–93 2.3 5.7 0.0 2012–13 3.7 5.1 0.1
1993–94 4.5 4.5 3.1 2013–14 4.1 4.9 0.0
1994–95 5.2 4.1 3.3 2014–15 4.1 4.2 0.3
1995–96 6.0 4.3 3.7 2015–16 4.6 4.5 0.6
1996–97 1.7 3.5 0.4 2016–17 5.4 5.3 1.9
1997–98 3.5 3.9 0.0 2017–18 5.5 4.7 0.4
1998–99 2.0 3.3 0.0 2018–19 3.3 1.8 0.0
1999–00 3.9 2.5 0.0 2019–20* 4.0 2.0 –
Decade-wise Analysis
1980s 6.5 7.3 0.0 2000s 4.7 3.3 0.5
1990s 4.6 4.7 1.0 2010s 4.1 3.8 0.4
* Budgeted.GDP = gross domestic product, PPP = purchasing power parity. Sources: Pakistan Economic Survey (various issues); Budget in Brief (various issues);
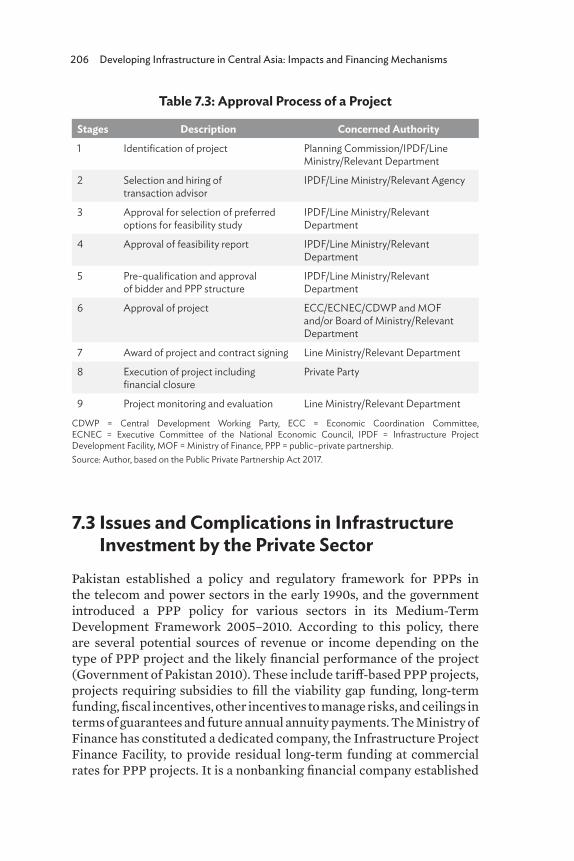
206 Developing Infrastructure in Central Asia: Impacts and Financing Mechanisms
Table 7.3: Approval Process of a Project
Stages Description Concerned Authority1 Identification of project Planning Commission/IPDF/Line
Ministry/Relevant Department
2 Selection and hiring of transaction advisor
IPDF/Line Ministry/Relevant Agency
3 Approval for selection of preferred options for feasibility study
IPDF/Line Ministry/Relevant Department
4 Approval of feasibility report IPDF/Line Ministry/Relevant Department
5 Pre-qualification and approval of bidder and PPP structure
IPDF/Line Ministry/Relevant Department
6 Approval of project ECC/ECNEC/CDWP and MOF and/or Board of Ministry/Relevant Department
7 Award of project and contract signing Line Ministry/Relevant Department
8 Execution of project including financial closure
Private Party
9 Project monitoring and evaluation Line Ministry/Relevant Department
CDWP = Central Development Working Party, ECC = Economic Coordination Committee, ECNEC = Executive Committee of the National Economic Council, IPDF = Infrastructure Project Development Facility, MOF = Ministry of Finance, PPP = public–private partnership.Source: Author, based on the Public Private Partnership Act 2017.
7.3 Issues and Complications in Infrastructure Investment by the Private Sector
Pakistan established a policy and regulatory framework for PPPs in the telecom and power sectors in the early 1990s, and the government introduced a PPP policy for various sectors in its Medium-Term Development Framework 2005–2010. According to this policy, there are several potential sources of revenue or income depending on the type of PPP project and the likely financial performance of the project (Government of Pakistan 2010). These include tariff-based PPP projects, projects requiring subsidies to fill the viability gap funding, long-term funding, fiscal incentives, other incentives to manage risks, and ceilings in terms of guarantees and future annual annuity payments. The Ministry of Finance has constituted a dedicated company, the Infrastructure Project Finance Facility, to provide residual long-term funding at commercial rates for PPP projects. It is a nonbanking financial company established
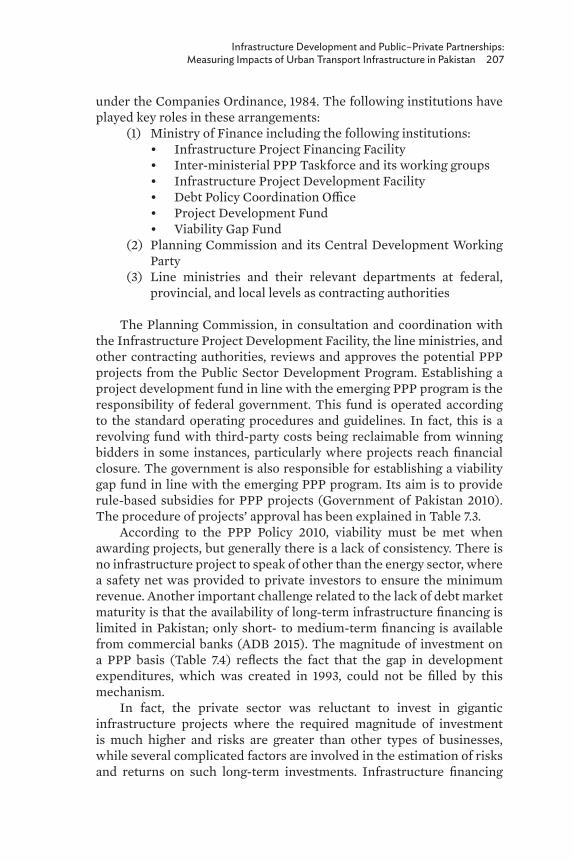
Infrastructure Development and Public–Private Partnerships: Measuring Impacts of Urban Transport Infrastructure in Pakistan 207
under the Companies Ordinance, 1984. The following institutions have played key roles in these arrangements:
(1) Ministry of Finance including the following institutions: • Infrastructure Project Financing Facility• Inter-ministerial PPP Taskforce and its working groups • Infrastructure Project Development Facility • Debt Policy Coordination Office • Project Development Fund • Viability Gap Fund
(2) Planning Commission and its Central Development Working Party
(3) Line ministries and their relevant departments at federal, provincial, and local levels as contracting authorities
The Planning Commission, in consultation and coordination with the Infrastructure Project Development Facility, the line ministries, and other contracting authorities, reviews and approves the potential PPP projects from the Public Sector Development Program. Establishing a project development fund in line with the emerging PPP program is the responsibility of federal government. This fund is operated according to the standard operating procedures and guidelines. In fact, this is a revolving fund with third-party costs being reclaimable from winning bidders in some instances, particularly where projects reach financial closure. The government is also responsible for establishing a viability gap fund in line with the emerging PPP program. Its aim is to provide rule-based subsidies for PPP projects (Government of Pakistan 2010). The procedure of projects’ approval has been explained in Table 7.3.
According to the PPP Policy 2010, viability must be met when awarding projects, but generally there is a lack of consistency. There is no infrastructure project to speak of other than the energy sector, where a safety net was provided to private investors to ensure the minimum revenue. Another important challenge related to the lack of debt market maturity is that the availability of long-term infrastructure financing is limited in Pakistan; only short- to medium-term financing is available from commercial banks (ADB 2015). The magnitude of investment on a PPP basis (Table 7.4) reflects the fact that the gap in development expenditures, which was created in 1993, could not be filled by this mechanism.
In fact, the private sector was reluctant to invest in gigantic infrastructure projects where the required magnitude of investment is much higher and risks are greater than other types of businesses, while several complicated factors are involved in the estimation of risks and returns on such long-term investments. Infrastructure financing
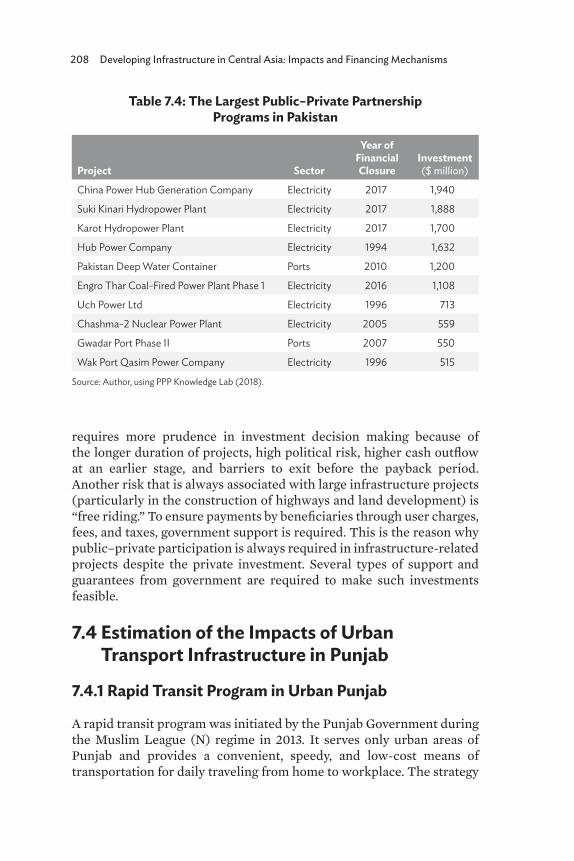
208 Developing Infrastructure in Central Asia: Impacts and Financing Mechanisms
requires more prudence in investment decision making because of the longer duration of projects, high political risk, higher cash outflow at an earlier stage, and barriers to exit before the payback period. Another risk that is always associated with large infrastructure projects (particularly in the construction of highways and land development) is “free riding.” To ensure payments by beneficiaries through user charges, fees, and taxes, government support is required. This is the reason why public–private participation is always required in infrastructure-related projects despite the private investment. Several types of support and guarantees from government are required to make such investments feasible.
7.4 Estimation of the Impacts of Urban Transport Infrastructure in Punjab
7.4.1 Rapid Transit Program in Urban Punjab
A rapid transit program was initiated by the Punjab Government during the Muslim League (N) regime in 2013. It serves only urban areas of Punjab and provides a convenient, speedy, and low-cost means of transportation for daily traveling from home to workplace. The strategy
Table 7.4: The Largest Public–Private Partnership Programs in Pakistan
Project Sector
Year of Financial Closure
Investment ($ million)
China Power Hub Generation Company Electricity 2017 1,940
Suki Kinari Hydropower Plant Electricity 2017 1,888
Karot Hydropower Plant Electricity 2017 1,700
Hub Power Company Electricity 1994 1,632
Pakistan Deep Water Container Ports 2010 1,200
Engro Thar Coal-Fired Power Plant Phase 1 Electricity 2016 1,108
Uch Power Ltd Electricity 1996 713
Chashma-2 Nuclear Power Plant Electricity 2005 559
Gwadar Port Phase II Ports 2007 550
Wak Port Qasim Power Company Electricity 1996 515
Source: Author, using PPP Knowledge Lab (2018).
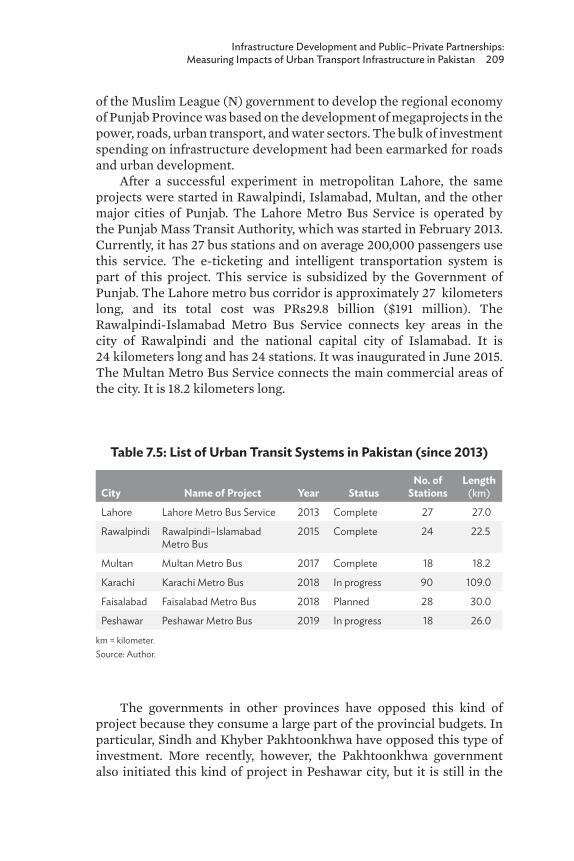
Infrastructure Development and Public–Private Partnerships: Measuring Impacts of Urban Transport Infrastructure in Pakistan 209
of the Muslim League (N) government to develop the regional economy of Punjab Province was based on the development of megaprojects in the power, roads, urban transport, and water sectors. The bulk of investment spending on infrastructure development had been earmarked for roads and urban development.
After a successful experiment in metropolitan Lahore, the same projects were started in Rawalpindi, Islamabad, Multan, and the other major cities of Punjab. The Lahore Metro Bus Service is operated by the Punjab Mass Transit Authority, which was started in February 2013. Currently, it has 27 bus stations and on average 200,000 passengers use this service. The e-ticketing and intelligent transportation system is part of this project. This service is subsidized by the Government of Punjab. The Lahore metro bus corridor is approximately 27 kilometers long, and its total cost was PRs29.8 billion ($191 million). The Rawalpindi-Islamabad Metro Bus Service connects key areas in the city of Rawalpindi and the national capital city of Islamabad. It is 24 kilometers long and has 24 stations. It was inaugurated in June 2015. The Multan Metro Bus Service connects the main commercial areas of the city. It is 18.2 kilometers long.
The governments in other provinces have opposed this kind of project because they consume a large part of the provincial budgets. In particular, Sindh and Khyber Pakhtoonkhwa have opposed this type of investment. More recently, however, the Pakhtoonkhwa government also initiated this kind of project in Peshawar city, but it is still in the
Table 7.5: List of Urban Transit Systems in Pakistan (since 2013)
City Name of Project Year StatusNo. of
StationsLength
(km)
Lahore Lahore Metro Bus Service 2013 Complete 27 27.0
Rawalpindi Rawalpindi–Islamabad Metro Bus
2015 Complete 24 22.5
Multan Multan Metro Bus 2017 Complete 18 18.2
Karachi Karachi Metro Bus 2018 In progress 90 109.0
Faisalabad Faisalabad Metro Bus 2018 Planned 28 30.0
Peshawar Peshawar Metro Bus 2019 In progress 18 26.0
km = kilometer.Source: Author.
210 Developing Infrastructure in Central Asia: Impacts and Financing Mechanisms
construction phase. The federal government also planned a rapid mass transit project in Karachi, the largest city of Pakistan in Sindh Province. Now, the planning of mass transit programs in other provinces reflects its positive impacts in Punjab.
7.4.2 Data and Sampling Methodology
The core objective of this study is to measure the impact of transport infrastructure on household income in Pakistan. It is notable that infrastructure-related projects in Pakistan are controlled and financed through a centralized Planning Commission, which assesses their impacts at the national level. Assessing the impacts of such projects on a regional basis is difficult because of the unavailability of regional data (at province or district level). Therefore, such a comparison is possible only in limited cases. For instance, we can analyze the impacts of urban transport infrastructure in Punjab Province using a difference-in-differences (DiD) approach. The Government of Punjab launched an extensive plan to modernize and upgrade transport infrastructure in Urban Punjab in 2013. Later on, the Punjab Assembly legislated a law (Urban Punjab Mass Transit Act 2015). The metro bus services in urban areas, metro trains, and several other transport-related projects are included in this program. We have compared the effects of this program in Punjab (treated group) with the other provinces (controlled groups). The change in household income and the patterns of household consumption have been taken as outcome variables. The trends of household income by regions and years are shown in Table 7.6, while Table 7.7 shows the descriptive statistics of the variables included in the models.
For this purpose, we applied data from the Household Income and Expenditure Survey (HIES), which is carried out by the Federal Bureau of Statistics, Government of Pakistan (various issues). This survey is conducted once every 2 or 3 years, but sometimes it may not be available regularly. We used the data for the most recent available years (2005, 2006, 2008, 2011, 2012, 2013, 2016) across eight administrative regions: Rural Punjab, Urban Punjab, Rural Sindh, Urban Sindh, Rural Khyber Pakhtoonkhwa, Urban Khyber Pakhtoonkhwa, Rural Balochistan, and Urban Balochistan. The panel least square model was constructed for this comparison and a DiD approach followed.
The universe of the HIES consists of all urban and rural areas of all four provinces of Pakistan (Punjab, Sindh, Khyber Pakhtoonkhwa, and Balochistan). Separate sampling frames are used in the survey for urban areas and rural areas. The Federal Bureau of Statistics (Government of Pakistan 2016) has developed its own urban area frame. All urban areas
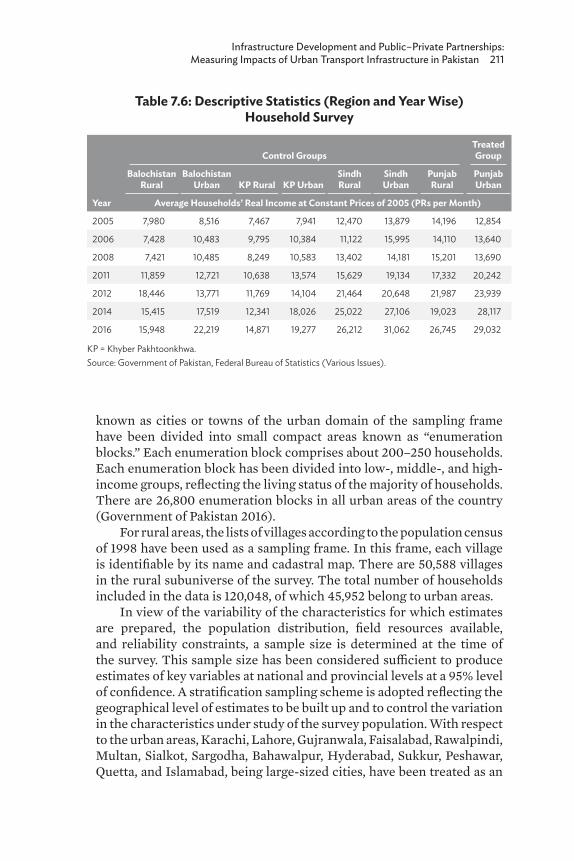
Infrastructure Development and Public–Private Partnerships: Measuring Impacts of Urban Transport Infrastructure in Pakistan 211
known as cities or towns of the urban domain of the sampling frame have been divided into small compact areas known as “enumeration blocks.” Each enumeration block comprises about 200–250 households. Each enumeration block has been divided into low-, middle-, and high-income groups, reflecting the living status of the majority of households. There are 26,800 enumeration blocks in all urban areas of the country (Government of Pakistan 2016).
For rural areas, the lists of villages according to the population census of 1998 have been used as a sampling frame. In this frame, each village is identifiable by its name and cadastral map. There are 50,588 villages in the rural subuniverse of the survey. The total number of households included in the data is 120,048, of which 45,952 belong to urban areas.
In view of the variability of the characteristics for which estimates are prepared, the population distribution, field resources available, and reliability constraints, a sample size is determined at the time of the survey. This sample size has been considered sufficient to produce estimates of key variables at national and provincial levels at a 95% level of confidence. A stratification sampling scheme is adopted reflecting the geographical level of estimates to be built up and to control the variation in the characteristics under study of the survey population. With respect to the urban areas, Karachi, Lahore, Gujranwala, Faisalabad, Rawalpindi, Multan, Sialkot, Sargodha, Bahawalpur, Hyderabad, Sukkur, Peshawar, Quetta, and Islamabad, being large-sized cities, have been treated as an
Table 7.6: Descriptive Statistics (Region and Year Wise) Household Survey
Year
Control GroupsTreated Group
Balochistan Rural
Balochistan Urban KP Rural KP Urban
Sindh Rural
Sindh Urban
Punjab Rural
Punjab Urban
Average Households’ Real Income at Constant Prices of 2005 (PRs per Month)
2005 7,980 8,516 7,467 7,941 12,470 13,879 14,196 12,854
2006 7,428 10,483 9,795 10,384 11,122 15,995 14,110 13,640
2008 7,421 10,485 8,249 10,583 13,402 14,181 15,201 13,690
2011 11,859 12,721 10,638 13,574 15,629 19,134 17,332 20,242
2012 18,446 13,771 11,769 14,104 21,464 20,648 21,987 23,939
2014 15,415 17,519 12,341 18,026 25,022 27,106 19,023 28,117
2016 15,948 22,219 14,871 19,277 26,212 31,062 26,745 29,032
KP = Khyber Pakhtoonkhwa. Source: Government of Pakistan, Federal Bureau of Statistics (Various Issues).
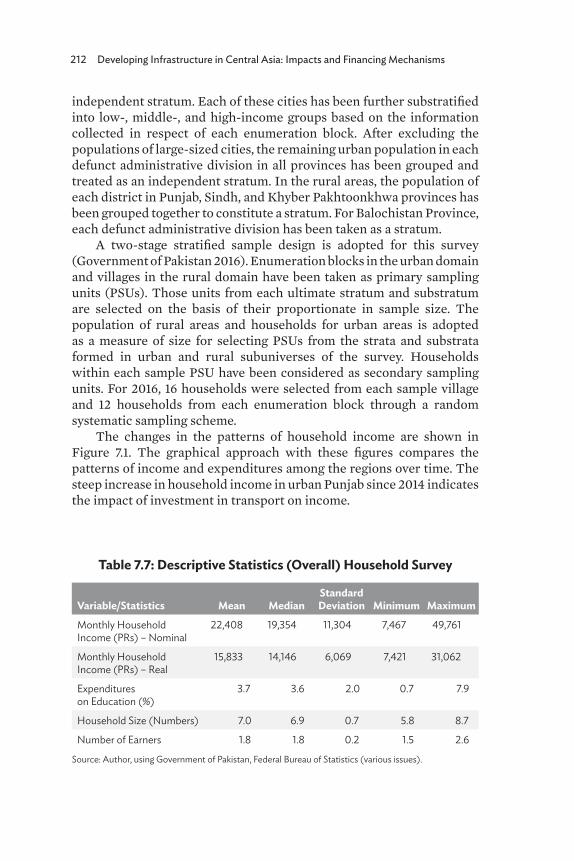
212 Developing Infrastructure in Central Asia: Impacts and Financing Mechanisms
independent stratum. Each of these cities has been further substratified into low-, middle-, and high-income groups based on the information collected in respect of each enumeration block. After excluding the populations of large-sized cities, the remaining urban population in each defunct administrative division in all provinces has been grouped and treated as an independent stratum. In the rural areas, the population of each district in Punjab, Sindh, and Khyber Pakhtoonkhwa provinces has been grouped together to constitute a stratum. For Balochistan Province, each defunct administrative division has been taken as a stratum.
A two-stage stratified sample design is adopted for this survey (Government of Pakistan 2016). Enumeration blocks in the urban domain and villages in the rural domain have been taken as primary sampling units (PSUs). Those units from each ultimate stratum and substratum are selected on the basis of their proportionate in sample size. The population of rural areas and households for urban areas is adopted as a measure of size for selecting PSUs from the strata and substrata formed in urban and rural subuniverses of the survey. Households within each sample PSU have been considered as secondary sampling units. For 2016, 16 households were selected from each sample village and 12 households from each enumeration block through a random systematic sampling scheme.
The changes in the patterns of household income are shown in Figure 7.1. The graphical approach with these figures compares the patterns of income and expenditures among the regions over time. The steep increase in household income in urban Punjab since 2014 indicates the impact of investment in transport on income.
Table 7.7: Descriptive Statistics (Overall) Household Survey
Variable/Statistics Mean MedianStandard Deviation Minimum Maximum
Monthly Household Income (PRs) – Nominal
22,408 19,354 11,304 7,467 49,761
Monthly Household Income (PRs) – Real
15,833 14,146 6,069 7,421 31,062
Expenditures on Education (%)
3.7 3.6 2.0 0.7 7.9
Household Size (Numbers) 7.0 6.9 0.7 5.8 8.7
Number of Earners 1.8 1.8 0.2 1.5 2.6
Source: Author, using Government of Pakistan, Federal Bureau of Statistics (various issues).
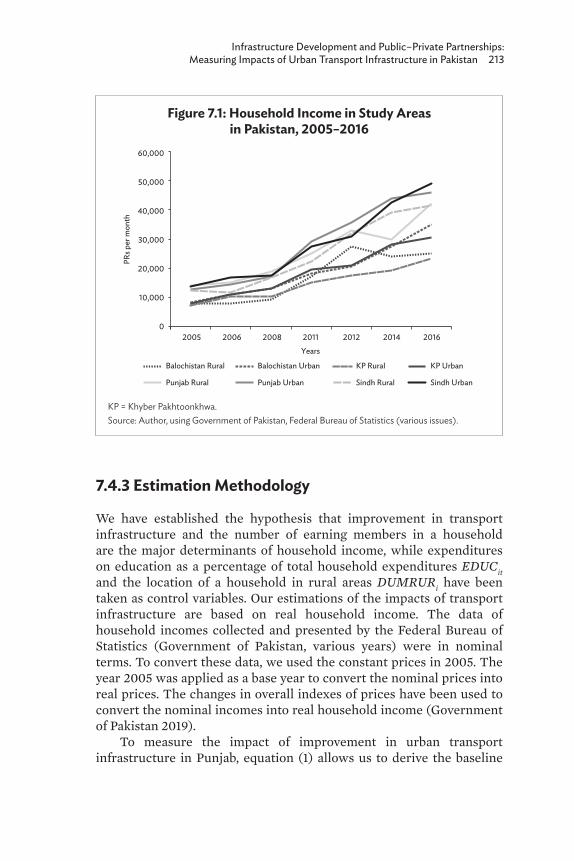
Infrastructure Development and Public–Private Partnerships: Measuring Impacts of Urban Transport Infrastructure in Pakistan 213
Figure 7.1: Household Income in Study Areas in Pakistan, 2005–2016
KP = Khyber Pakhtoonkhwa. Source: Author, using Government of Pakistan, Federal Bureau of Statistics (various issues).
0
10,000
20,000
30,000
40,000
50,000
60,000
2005 2006 2008 2011 2012 2014 2016
PRs p
er m
onth
Years
Balochistan Rural Balochistan Urban KP Rural KP Urban
Punjab Rural Punjab Urban Sindh Rural Sindh Urban
7.4.3 Estimation Methodology
We have established the hypothesis that improvement in transport infrastructure and the number of earning members in a household are the major determinants of household income, while expenditures on education as a percentage of total household expenditures EDUCit and the location of a household in rural areas DUMRURi have been taken as control variables. Our estimations of the impacts of transport infrastructure are based on real household income. The data of household incomes collected and presented by the Federal Bureau of Statistics (Government of Pakistan, various years) were in nominal terms. To convert these data, we used the constant prices in 2005. The year 2005 was applied as a base year to convert the nominal prices into real prices. The changes in overall indexes of prices have been used to convert the nominal incomes into real household income (Government of Pakistan 2019).
To measure the impact of improvement in urban transport infrastructure in Punjab, equation (1) allows us to derive the baseline
214 Developing Infrastructure in Central Asia: Impacts and Financing Mechanisms
estimation strategy of the DiD specification, which takes the following form:
INCOMit = ∝i + β0 PBi + β1 DUMTRNSt * Pi + β2 * Xit + εit, (1)
where INCOMit is the average household real income in year t for ith household. PBi is a binary variable that takes a value of 1 for a household that belongs to urban areas of Punjab (treated group) and a value of 0 for other provinces (controlled group). DUMTRNSt is also a binary variable that takes a value of 1 for the period in which transport infrastructure was improved in Punjab and 0 otherwise. Pi*DUMTRANSt is the interaction term between these two binary variables. Xit indicates all control variables included in the regression analysis, while εit is the error term, which is assumed to be uncorrelated among itself and have a constant variance.
In the first stage, we tested the impact of modernization and upgrading of transport infrastructure in urban Punjab on the income of households. The revolutionary change in the urban transport system in Punjab was initiated in 2013–2014. This type of initiative was not taken in other provinces. Balochistan did not initiate such a plan because of the budget constraints and its large scattered areas that require more funding for transport connectivity, while the governments in Sindh and Khyber Pakhtoonkhwa have opposed heavy spending on such projects. The public and private sectors have focused on the development of transport infrastructure in Punjab Province. The impact of this change has been captured through a dummy variable DUMTRNSt which is equal to 1 for 2014 and 2016 and 0 in other cases. The interaction variable DUMTRNSt*PBi reflects the effects of policy intervention. The average number of earners in a household EARNERS, households that belong to rural areas DUMRUR, and dummy variables to capture the provincial and regional impacts PBi for Punjab have also been introduced as control variables in the model, while other provinces have been considered as a reference category.
To determine household income INCOMit, we hypothesized that household income INCOMit depends on the number of earners EARNERSit, improvement in transport infrastructure DUMTRNSt, the location of a household in rural areas DUMRURi, and the province of the household (PBi for Punjab), while also including two interaction variables to capture the composite effects of the years of heavy investment in the transport sector in urban Punjab DUMTRNS, the number of earners in a household EARNRS, and the province of a household. This model is described by the following equation:
Infrastructure Development and Public–Private Partnerships: Measuring Impacts of Urban Transport Infrastructure in Pakistan 215
INCOMit = ∝i + β1 EARNERSit + β2 DUMTRNSt
* PBi + β3 * EDUCit + β4 DUMRURi + β5 DUMTRNSt * EDUCit + β6 PBi (2)
An increase in household income in urban Punjab after investment in transport system modernization and improvement can be seen in Table 7.8. The change in household income in urban Punjab is significantly higher than in other provinces. However, the higher change in household income in urban Sindh in 2016 (Table 7.9) indicates some other factors, including the growth in large-scale manufacturing industries in Karachi and improvement in the law and order conditions.
In interpreting the results, it is notable that the explanatory variables of the number of earners and household expenditures on education that we have included in this study explain the short- to medium-term effects only. There are several other factors, including education of household members, household assets, professions, and investment in business activities, that can affect household income. Due to the limited survey data, we have not included these variables. Incorporating these variables is possible either with cross-sectional data or if data from the same households are available over a number of years. Unfortunately, data from the same households have not been ensured in the survey. Our main concern is to capture the impact of infrastructure development on household income, so we used panel data where testing the policy effects over time is possible.
According to the definition in the HIES, a “household” may be either a single-person or a multi-person household. A multi-person household is a group of two or more persons who make some common provision for food or other living essentials and who have no usual place of residence elsewhere. The persons constituting the group may pool their incomes and have a common budget to a greater or lesser extent; they may be related or unrelated or a combination of both. The general criterion to be used in identifying the members of a multi-person household relates to whether they live and eat together and have no usual place of residence elsewhere (Government of Pakistan 2016). “Earners” are all those persons aged 10 and above who provide the household with material return, in cash or in kind.
Household income INCOM is the sum of monetary income and income “in kind.” It consists of receipts that are received regularly by the household or by individual household members. Household income in cash includes all money receipts, such as wages, salaries, rent from land and property, income from self-employment, and assistance. Household
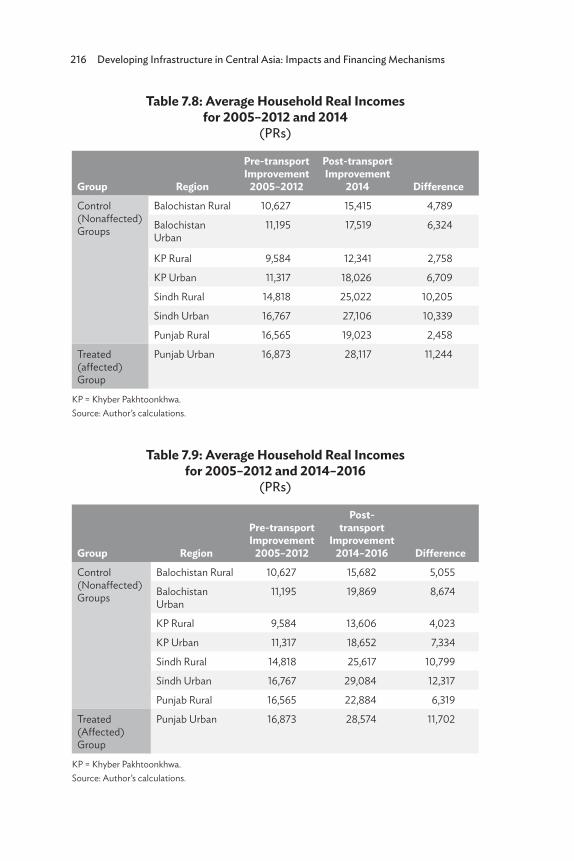
216 Developing Infrastructure in Central Asia: Impacts and Financing Mechanisms
Table 7.8: Average Household Real Incomes for 2005–2012 and 2014
(PRs)
Group Region
Pre-transport Improvement
2005–2012
Post-transport Improvement
2014 DifferenceControl (Nonaffected) Groups
Balochistan Rural 10,627 15,415 4,789
Balochistan Urban
11,195 17,519 6,324
KP Rural 9,584 12,341 2,758
KP Urban 11,317 18,026 6,709
Sindh Rural 14,818 25,022 10,205
Sindh Urban 16,767 27,106 10,339
Punjab Rural 16,565 19,023 2,458
Treated (affected) Group
Punjab Urban 16,873 28,117 11,244
KP = Khyber Pakhtoonkhwa. Source: Author’s calculations.
Table 7.9: Average Household Real Incomes for 2005–2012 and 2014–2016
(PRs)
Group Region
Pre-transport Improvement
2005–2012
Post-transport
Improvement2014–2016 Difference
Control (Nonaffected) Groups
Balochistan Rural 10,627 15,682 5,055
Balochistan Urban
11,195 19,869 8,674
KP Rural 9,584 13,606 4,023
KP Urban 11,317 18,652 7,334
Sindh Rural 14,818 25,617 10,799
Sindh Urban 16,767 29,084 12,317
Punjab Rural 16,565 22,884 6,319
Treated (Affected) Group
Punjab Urban 16,873 28,574 11,702
KP = Khyber Pakhtoonkhwa. Source: Author’s calculations.
Infrastructure Development and Public–Private Partnerships: Measuring Impacts of Urban Transport Infrastructure in Pakistan 217
income “in kind” includes wage payments in kind, goods, and services transferred free of charge by an enterprise to an employee. It also includes the value of home production that is consumed within the household (e.g., agricultural products, livestock products). Where an employee buys from his employer, for his household consumption, goods and services at concessionary or subsidized prices and thus obtains a significant advantage, the value of these concessions or subsidies is also taken into account as income “in kind.”
7.5 Results: Impact of Rapid Transit Program on Household Income and Expenditures
Tables 7.8 and 7.9 show that the increase in average household income in urban Punjab is significantly greater than in other regions. The average monthly real household income in urban Punjab in 2014 (after new transport infrastructure) was recorded at PRs28,117, which is 66% higher than the average monthly income during the period 2005–2012 (before new transport infrastructure). The percentage growth in household income was 56% in urban Balochistan, 59% in urban KP, and 61% in urban Sindh during the same period. This higher growth in household income in urban Punjab is attributed to the improvement in transport infrastructure. These inferences are validated by the regression results presented in Tables 7.10a and 7.10b.
The results presented in Tables 7.10a and 7.10b reflect two alternative scenarios. In Table 7.10a we used entire data including rural households. However, in Table 7.10b, we estimated the parameters based on the urban household data only. The province of Punjab PB was taken as the “treated group,” while the other three provinces belong to the “control group.”
It was hypothesized that modernizing and developing transport infrastructure in urban areas will improve household income. This hypothesis was accepted and the positive impact of the improvement in transport infrastructure in urban Punjab on household income INCOMit is validated by the results.
The results in Tables 7.10a and 7.10b indicate a significant improvement in household income after improvement in transport infrastructure. These results are consistent and robust in all alternative scenarios. The impacts of investment in transport infrastructure DUMTRNSt*PBi are positive and significant, which shows that improvement in transport infrastructure has affected household income positively. The significant impacts of the investment in transport infrastructure on per capita income and GDP growth have also been
218 Developing Infrastructure in Central Asia: Impacts and Financing Mechanisms
observed in current economic literature (Harmatuck 1996; Mehar 2017; Yoshino and Abidhadjaev 2015a, 2015b, 2016, 2017).
This study estimates the quantum of impact of modernizing and upgrading urban transport on household income. It shows an improvement in household income of more than 60% in real terms over 4 years. The beta associated with the interaction dummy DUMTRNSt*PBi reflects the impact of transport infrastructure on household income. Based on all regions’ data, it is envisaged that the average real income of households increased after 4 years from PRs9,681 to PRs11,828 per month after new transport infrastructure in urban Punjab. The results are reconfirmed by regression analysis based on urban household data only. The betas associated with the interaction variable DUMTRNSt*PBi in Table 7.10b indicate that the increase in average real household income after 4 years is between PRs8,404 and PRs10,229 per month.
The regional dummy PB showed its effects when it was taken as an interaction variable with DUMTRNSt (DUMTRNS*PB); however, it was noted that the transport dummy variable DUMTRNSt does not work simultaneously with its interaction variable DUMTRNS*PB. We applied the interaction variable DUMTRN*PB in all alternative scenarios and found it to be a significant determinant of household income INCOMit.
The magnitude of the estimated parameters shows some important and interesting behavior on the part of the households. The coefficients associated with the transport interaction variable DUMTRNS*PB are consistent and robust in all alternative scenarios. The estimated results in Table 7.10b (based on urban households only) revalidate the results in Table 7.10a (based on urban and rural households). This supports the investment in transport infrastructure for improvement and modernization.
The positive impacts of the improvement in transport infrastructure on household income can be seen in Tables 7.10a and 7.10b. How the improvement in transport infrastructure is transformed into household incremental income does not directly concern the scope of this study. However, it seems that the provision of good-quality transport infrastructure provides workers with timely access to their workplaces. Such timely access to workplaces without extra hardship may improve workers’ ability to do their work. Some workers cannot take desirable high-income opportunities in the absence of transport infrastructure from their residence to their workplace. A good transport system fills this gap, which may increase households’ earning.
The coefficients show some significant and robust effect of the number of earners in a household on household income. It is envisaged from the regression analysis that average household income in real terms declines by PRs5,085 per month per additional earning member
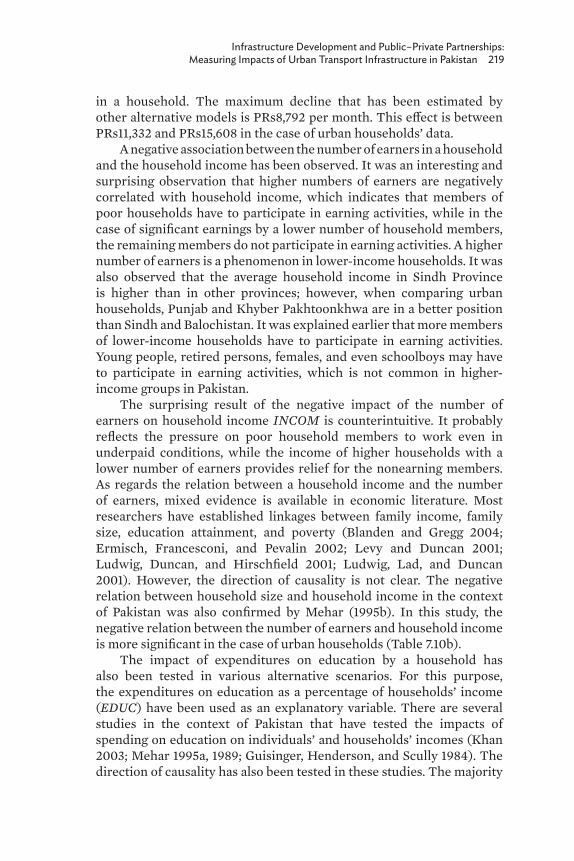
Infrastructure Development and Public–Private Partnerships: Measuring Impacts of Urban Transport Infrastructure in Pakistan 219
in a household. The maximum decline that has been estimated by other alternative models is PRs8,792 per month. This effect is between PRs11,332 and PRs15,608 in the case of urban households’ data.
A negative association between the number of earners in a household and the household income has been observed. It was an interesting and surprising observation that higher numbers of earners are negatively correlated with household income, which indicates that members of poor households have to participate in earning activities, while in the case of significant earnings by a lower number of household members, the remaining members do not participate in earning activities. A higher number of earners is a phenomenon in lower-income households. It was also observed that the average household income in Sindh Province is higher than in other provinces; however, when comparing urban households, Punjab and Khyber Pakhtoonkhwa are in a better position than Sindh and Balochistan. It was explained earlier that more members of lower-income households have to participate in earning activities. Young people, retired persons, females, and even schoolboys may have to participate in earning activities, which is not common in higher-income groups in Pakistan.
The surprising result of the negative impact of the number of earners on household income INCOM is counterintuitive. It probably reflects the pressure on poor household members to work even in underpaid conditions, while the income of higher households with a lower number of earners provides relief for the nonearning members. As regards the relation between a household income and the number of earners, mixed evidence is available in economic literature. Most researchers have established linkages between family income, family size, education attainment, and poverty (Blanden and Gregg 2004; Ermisch, Francesconi, and Pevalin 2002; Levy and Duncan 2001; Ludwig, Duncan, and Hirschfield 2001; Ludwig, Lad, and Duncan 2001). However, the direction of causality is not clear. The negative relation between household size and household income in the context of Pakistan was also confirmed by Mehar (1995b). In this study, the negative relation between the number of earners and household income is more significant in the case of urban households (Table 7.10b).
The impact of expenditures on education by a household has also been tested in various alternative scenarios. For this purpose, the expenditures on education as a percentage of households’ income (EDUC) have been used as an explanatory variable. There are several studies in the context of Pakistan that have tested the impacts of spending on education on individuals’ and households’ incomes (Khan 2003; Mehar 1995a, 1989; Guisinger, Henderson, and Scully 1984). The direction of causality has also been tested in these studies. The majority

220 Developing Infrastructure in Central Asia: Impacts and Financing Mechanisms
Table 7.10a: Impact of Infrastructure on Household Income (All Regions) Dependent Variable:
Real Household Income at Constant Prices of 2005Panel Least Squares
Number of Households: 120,048; Periods included: 7; Cross sections included: 8 (All Regions)
Independent Variables
Model: I Model: II
Coefficient T-Statistic Coefficient T-Statistic
Constant 31,429.21*** 5.514 29,251.55*** 4.873
DUMTRNS*PB: 1 (If 2014 or 2016) * 1 (If Punjab)
11,828.10*** 3.038 10,272.06** 2.493
DUMRUR: Dummy: 1 (If Rural Area)
484.94 0.309 169.11 0.106
EARNERS: No. of Earners –8,792.17*** –2.751 –7,774.18** –2.349
PB: Dummy: 1 (If Punjab) 2,033.65 1.130
EDUC: Expenditures on Education as % of Total Households’ Expenditures
Adjusted R-square 0.2396 0.2436
Akaike Info Criterion 20.0547 20.0657
Schwarz Criterion 20.1994 20.2466
H-Q Criterion 20.1108 20.1358
D-W Statistics 0.6088 0.5748
Independent Variables
Model: III Model: IV
Coefficient T-Statistic Coefficient T-Statistic
Constant 20,362.29** 2.843 20,375.53*** 2.872
DUMTRNS*PB: 1 (If 2014 or 2016) * 1 (If Punjab)
9,680.99** 2.4232 9,942.23** 2.616
DUMRUR: Dummy: 1 (If Rural Area)
1,352.08 0.826 1,462.04 0.941
EARNERS: No. of Earners –5,084.83 –1.477 –5,155.09* –1.517
PB: Dummy: 1 (If Punjab) 444.63 0.235
EDUC: Expenditures on Education as % of Total Households’ Expenditures
1,002.76** 2.121 1,046.592** 2.432
Adjusted R-square 0.2922 0.3053
Akaike Info Criterion 20.0153 19.9807
Schwarz Criterion 20.2323 20.1615
H-Q Criterion 20.0994 20.0508
D-W Statistics 0.7052 0.7225
*p < 0.1; **p < 0.05; ***p < 0.01.Source: Author’s estimations.
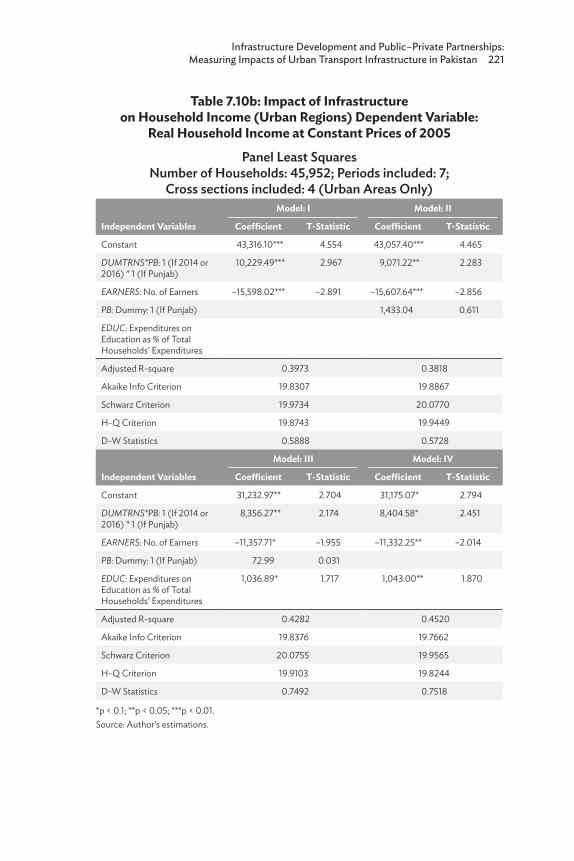
Infrastructure Development and Public–Private Partnerships: Measuring Impacts of Urban Transport Infrastructure in Pakistan 221
Table 7.10b: Impact of Infrastructure on Household Income (Urban Regions) Dependent Variable:
Real Household Income at Constant Prices of 2005Panel Least Squares
Number of Households: 45,952; Periods included: 7; Cross sections included: 4 (Urban Areas Only)
Independent Variables
Model: I Model: II
Coefficient T-Statistic Coefficient T-Statistic
Constant 43,316.10*** 4.554 43,057.40*** 4.465
DUMTRNS*PB: 1 (If 2014 or 2016) * 1 (If Punjab)
10,229.49*** 2.967 9,071.22** 2.283
EARNERS: No. of Earners –15,598.02*** –2.891 –15,607.64*** –2.856
PB: Dummy: 1 (If Punjab) 1,433.04 0.611
EDUC: Expenditures on Education as % of Total Households’ Expenditures
Adjusted R-square 0.3973 0.3818
Akaike Info Criterion 19.8307 19.8867
Schwarz Criterion 19.9734 20.0770
H-Q Criterion 19.8743 19.9449
D-W Statistics 0.5888 0.5728
Independent Variables
Model: III Model: IV
Coefficient T-Statistic Coefficient T-Statistic
Constant 31,232.97** 2.704 31,175.07* 2.794
DUMTRNS*PB: 1 (If 2014 or 2016) * 1 (If Punjab)
8,356.27** 2.174 8,404.58* 2.451
EARNERS: No. of Earners –11,357.71* –1.955 –11,332.25** –2.014
PB: Dummy: 1 (If Punjab) 72.99 0.031
EDUC: Expenditures on Education as % of Total Households’ Expenditures
1,036.89* 1.717 1,043.00** 1.870
Adjusted R-square 0.4282 0.4520
Akaike Info Criterion 19.8376 19.7662
Schwarz Criterion 20.0755 19.9565
H-Q Criterion 19.9103 19.8244
D-W Statistics 0.7492 0.7518
*p < 0.1; **p < 0.05; ***p < 0.01.Source: Author’s estimations.
222 Developing Infrastructure in Central Asia: Impacts and Financing Mechanisms
of studies in the context of Pakistan have concluded that spending on education affects individuals’ and households’ income positively. A positive impact of education expenditures on household income was also observed in this study. The parameters are statistically significant and robust. In quantitative terms, a 1% increase in the share of expenditures on education increases households’ earnings by PRs1,000 per month based on aggregate data. This magnitude is almost the same as in the analysis based on urban household data.
7.6 Policy RecommendationsThis study recommends investment in transport infrastructure to improve household income in Pakistan. A modernized transport system provides more connectivity and speedy access, which may provide timely access for workers to their workplaces. It shows that easy and timely access to workplaces after a rapid transit system has been transformed into increased household earnings. This phenomenon is confirmed by significant increases in household incomes in those urban areas of Pakistan where the transport system has been improved. The increase in the average household income in urban Punjab after new transport infrastructure is higher than in other regions. This incremental growth in household income is also validated by the regression results. It has been ascertained that the average real income of households increased by more than PRs10,000 per month after new transport infrastructure in urban Punjab. This increase was between PRs9,000 and PRs10,000 per month in the case of urban household data. This represents a very strong justification in favor of spending on transport infrastructure.
A rapid transit system may enhance efficiency in the labor market because it increases the size of the market. The accessibility of workplaces and the availability of more workers to employers create competition and efficiency in the labor market. An increase in household income as a consequence of the availability of a rapid transit system is quite logical, which has been confirmed in this study.
The negative association between the number of earning members in a household and the household income in the context of Pakistan depicts another important phenomenon. A household has to involve more members in earning activities if the aggregate household income is insufficient. Adolescent and female household members may have to scarify their studies, entertainment, and domestic responsibilities to participate in household income. An appropriate increase in the income of lower-class people can keep adolescents away from earning activities when they are still at school. Thus, investment in transport infrastructure
Infrastructure Development and Public–Private Partnerships: Measuring Impacts of Urban Transport Infrastructure in Pakistan 223
provides an indirect mechanism to provide more opportunities for adolescent and female household members.
It is important evidence in the context of Pakistan that investment in transport infrastructure in urban Punjab has significantly improved household income. This phenomenon was confirmed in various alternative models. The results in Table 7.10a show four different equations based on the entire population. The parameters are robust, while in Table 7.10b the results are based on the urban population only. The conclusions are the same in both cases. The improvement in transport infrastructure increases household income, because it provides timely access to workplaces. From the perspective of policy formulation, it is noteworthy that spending on transport infrastructure can improve household income significantly, which can be transformed ultimately into higher tax revenue and GDP growth.
7.7 Conclusion and LimitationsIn interpreting the explanation and uses of these results, it is important to note that we have several limitations in terms of the estimation of the parameters. There are several variables that affect household income. The qualifications of the earning members, their experience, and the types of professions are the important factors regarding the magnitude of households’ earning. Due to the limited data, we have not taken these factors as explanatory variables. The negative impacts of the number of earning members and the positive impact of expenditures on education reflect some special social aspects of Pakistani society. The higher level of earnings of some family members provides opportunities to other members to spend their time on nonearning activities like education, entertainment, and personal grooming. However, in the case of lower earnings, more members of a family will have to be engaged in earning activities. In interpreting the impacts of transport infrastructure, it is important that this analysis be based on pooled data from selected years. The results may be different in long-term analysis.
It is common knowledge that an efficient and convenient transport system provides more opportunities for work and earning, so it determines household incomes. In this study, it has been confirmed that the development of urban transport infrastructure has significantly improved household income in urban Punjab. However, another aspect of the conclusion and policy recommendations is the lack of fiscal resources in Pakistan. It was stated in earlier sections that Pakistan is facing a fiscal crisis because of high external debts, low tax revenue, and growing fiscal deficit. It is shown in Table 7.2 that development expenditures have been reducing over the last 2 decades. In this
224 Developing Infrastructure in Central Asia: Impacts and Financing Mechanisms
situation, it is extremely difficult to recommend public sector investment in infrastructure development. To encourage private investment in infrastructure development, including the provision of a rapid transport system, parliament legislated the Public Private Partnership Act in 2017, which determines the modes of private participation in infrastructure development. However, it is also important to mention that the success of a PPP model in Pakistan regarding infrastructure development is closely associated with contract management skills. The capability of private participation in infrastructure financing in Pakistan is summarized in Appendix A7. It is a common view that unnecessary fears in the minds of project executers, corrupt practices, and political pressures may lead to the failure of PPPs.
Infrastructure Development and Public–Private Partnerships: Measuring Impacts of Urban Transport Infrastructure in Pakistan 225
ReferencesAsian Development Bank (ADB). 2015. Country Partnership Strategy:
Pakistan: 2015–2019. Manila: ADB. Blanden, J.O., and P. Gregg. 2004. Family Income and Educational
Attainment: A Review of Approaches and Evidence for Britain. CMPO Working Paper Series No. 04/101; London School of Economics and Department of Economics, University College London (April).
Ermisch, J., M. Francesconi, and D. Pevalin. 2002. Childhood Parental Behaviour Young Peoples Outcomes. Institute for Social and Economic Research, Working Paper No. 2002-12.
Federation of Pakistan Chambers of Commerce and Industry (FPCCI). 2015. Revival of the Economy of Pakistan: Historical Evidences and Future Prospects. Karachi: FPCCI.
____. 2016. FPCCI Stance on China Pakistan Economic Corridor: Farsightedness, Apprehensions and Background. Karachi: FPCCI.
Global Infrastructure Hub Limited (GI Hub) and Oxford Economics. 2016. Economic Outlook: Country Profile – Pakistan. Sydney: GI Hub.
____. 2017. Global Infrastructure Outlook. Sydney: GI Hub.Government of Pakistan. 2010. Pakistan’s PPP Program: Presentation
to UNESCAP – Expert Group Meeting on Infrastructure Public Private Partnership for Sustainable Development. 11–13 November. Islamabad: Ministry of Finance/Infrastructure Project Development Facility.
____. 2016. Households Income and Expenditures Survey. Islamabad: Federal Bureau of Statistics.
____. 2017. The Public Private Partnership Authority Act, 2017. 31 March. Islamabad: National Assembly Secretariat (The Gazette of Pakistan).
____. 2019. Economic Survey of Pakistan. Islamabad: Ministry of Finance.____. Various issues (2012, 2018, and 2019). Budget in Brief. Islamabad:
Ministry of Finance. ____. Various issues. Households’ Income and Expenditures Survey.
Islamabad: Federal Bureau of Statistics.Guisinger, S.E., J.W. Henderson, and G.W. Scully. 1984. Earnings, Rates
of Return to Education and the Earnings Distribution in Pakistan. Economics of Education Review. 3 (4). pp. 257–67.
Harmatuck, D. 1996. The Influence of Transportation Infrastructure on Economic Development. Logistics and Transportation Review. 32 (1). pp. 63–76.
Hussain, S., and F. Zhang. 2018. Electrification and Household Welfare Evidence from Pakistan. Policy Research Working Paper 8582. Washington, DC: The World Bank Group, South Asia Region.
226 Developing Infrastructure in Central Asia: Impacts and Financing Mechanisms
Khan, F.S. 2003. Private Returns to Education: Evidence from Pakistan 1991–2002. Karachi: Social Policy and Development Center.
Kindleberger, C.P. 1970. Power and Money: The Economics of International Politics and the Politics of International Economics. New York, NY: Basic Books Incorporated.
Levy, D., and G. Duncan. 2001. Using Siblings to Assess the Effect of Childhood Family Income on Completed Schooling. JCPR Working Paper. Northwestern University/University of Chicago Joint Center for Poverty Research.
Ludwig, J., G. Duncan, and P. Hirschfield. 2001. Urban Poverty and Juvenile Crime: Evidence from a Randomised Housing Mobility Experiment. Quarterly Journal of Economics. 116 (2). pp. 655–80.
Ludwig, J., H. Lad, and G. Duncan, 2001. Urban Poverty and Educational Outcomes. Brookings-Wharton Papers on Urban Affairs, 147–2001.
Mehar, A. 1989. Income Elasticity of Demand for Social Services. Discussion Paper. Karachi: Applied Economics Research Center.
____. 1995a. An Inverse U-Shape Relationship Between Rate of Unemployment and Level of Education. Indian Economic Journal. 42 (4). pp. 104–10.
____. 1995b. Impacts of Households’ Income on Demand for Means of Transportation and Communications. Pakistan Economic and Social Review. 33 (1/2). pp. 117–36.
____. 2017. Infrastructure Development, CPEC and FDI in Pakistan: Is There Any Connection? Transnational Corporation Review. September. pp. 2–10.
____. 2018. Impact of Monetary Policy on Growth and Poverty: Drastic Consequences of Government Intervention. Journal of Modern Economy. 1 (1). pp. 1–16.
Organisation for Economic Co-operation and Development (OECD). 2010. Infrastructure to 2030, Volume 2: Mapping Policy for Electricity, Water and Transport. Paris: OECD.
____. 2012. Strategic Transport Infrastructure Needs to 2030. Paris: OECD.____. 2018. Infrastructure to 2030: Telecom, Land Transport, Water and
Electricity. Paris: OECD.PPP Knowledge Lab. 2018. Country Profile Pakistan. https://ppp
knowledgelab.org.Sokolowski, J. A., and C.M. Banks. 2009. Principles of Modeling
and Simulation. Hoboken, NJ: Wiley.World Bank. 2017. Private Participation in Infrastructure (PPI) – Annual Report 2017. Washington, DC.
____. 2018a. Procuring Infrastructure Public–Private Partnerships Report 2018: Assessing Government Capability to Prepare, Procure, and Manage PPPs. Washington, DC.
Infrastructure Development and Public–Private Partnerships: Measuring Impacts of Urban Transport Infrastructure in Pakistan 227
____. 2018b. Procuring PPP Pakistan. http://bpp.worldbank.org/en /data/exploreeconomies/pakistan/2018.
____. 2018c. Public–Private Partnership. World Bank Legal Resource Center. https://ppp.worldbank.org/public-private-partnership /financing.
World Economic Forum (WEF). 2011. World Competitiveness Report: 2009. Geneva.
____. 2012. Strategic Infrastructure: The Green Investment Report. Geneva: WEF.
____. 2018. World Competitiveness Report: 2016. Geneva: WEF.Yoshino, N., and U. Abidhadjaev. 2015a. An Impact Evaluation of
Investment in Infrastructure: The Case of the Railway Connection in Uzbekistan. ADBI Working Paper 548. Tokyo: Asian Development Bank Institute.
____. 2015b. Infrastructure Investment Impact Evaluation: Case of Uzbekistan: Effective Use of Social-Economic Potential and Attraction of New Sources of Economic Growth. Proceedings from VI Forum of Economists. Tashkent, Uzbekistan.
____. 2016. Impact of Infrastructure Investment on Tax: Estimating Spillover Effects of the Kyushu High-Speed Rail Line in Japan on Regional Tax Revenue. ADBI Working Paper 574. Tokyo: Asian Development Bank Institute.
____. 2017. An Impact Evaluation of Investment in Infrastructure: The Case of a Railway Connection in Uzbekistan. Journal of Asian Economics. 49. pp. 1–11
Yoshino, N., M. Helble, and U. Abidhadjaev. 2018. Financing Infrastructure in Asia and the Pacific Capturing Impacts and New Sources. Tokyo: Asian Development Bank Institute:
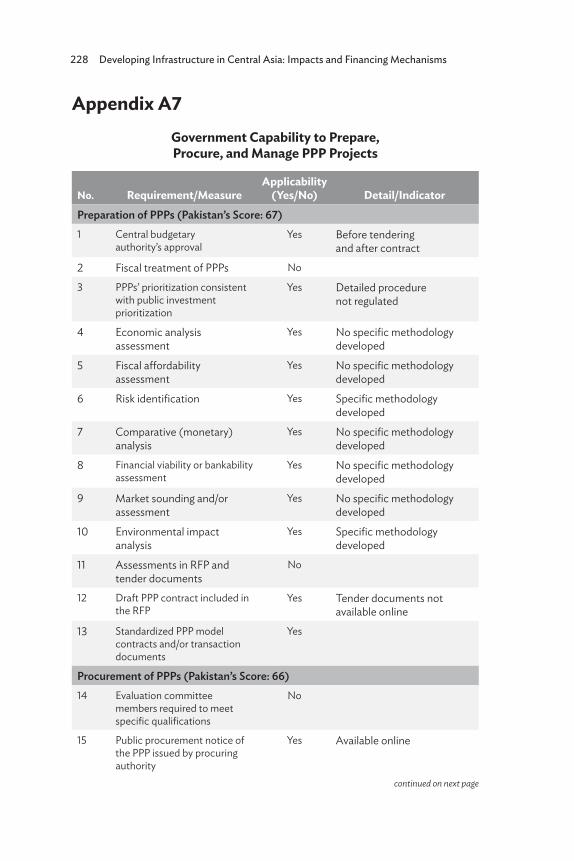
228 Developing Infrastructure in Central Asia: Impacts and Financing Mechanisms
Appendix A7Government Capability to Prepare, Procure, and Manage PPP Projects
No. Requirement/MeasureApplicability
(Yes/No) Detail/IndicatorPreparation of PPPs (Pakistan’s Score: 67)1 Central budgetary
authority’s approvalYes Before tendering
and after contract2 Fiscal treatment of PPPs No
3 PPPs’ prioritization consistent with public investment prioritization
Yes Detailed procedure not regulated
4 Economic analysis assessment
Yes No specific methodology developed
5 Fiscal affordability assessment
Yes No specific methodology developed
6 Risk identification Yes Specific methodology developed
7 Comparative (monetary) analysis
Yes No specific methodology developed
8 Financial viability or bankability assessment
Yes No specific methodology developed
9 Market sounding and/or assessment
Yes No specific methodology developed
10 Environmental impact analysis
Yes Specific methodology developed
11 Assessments in RFP and tender documents
No
12 Draft PPP contract included in the RFP
Yes Tender documents not available online
13 Standardized PPP model contracts and/or transaction documents
Yes
Procurement of PPPs (Pakistan’s Score: 66)14 Evaluation committee
members required to meet specific qualifications
No
15 Public procurement notice of the PPP issued by procuring authority
Yes Available online
continued on next page
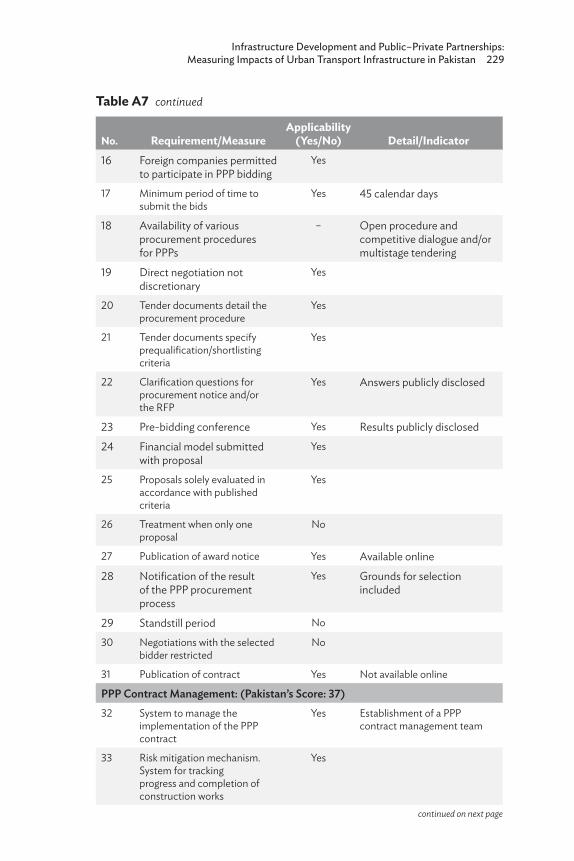
Infrastructure Development and Public–Private Partnerships: Measuring Impacts of Urban Transport Infrastructure in Pakistan 229
No. Requirement/MeasureApplicability
(Yes/No) Detail/Indicator16 Foreign companies permitted
to participate in PPP bidding Yes
17 Minimum period of time to submit the bids
Yes 45 calendar days
18 Availability of various procurement procedures for PPPs
– Open procedure and competitive dialogue and/or multistage tendering
19 Direct negotiation not discretionary
Yes
20 Tender documents detail the procurement procedure
Yes
21 Tender documents specify prequalification/shortlisting criteria
Yes
22 Clarification questions for procurement notice and/or the RFP
Yes Answers publicly disclosed
23 Pre-bidding conference Yes Results publicly disclosed24 Financial model submitted
with proposalYes
25 Proposals solely evaluated in accordance with published criteria
Yes
26 Treatment when only one proposal
No
27 Publication of award notice Yes Available online28 Notification of the result
of the PPP procurement process
Yes Grounds for selection included
29 Standstill period No
30 Negotiations with the selected bidder restricted
No
31 Publication of contract Yes Not available online
PPP Contract Management: (Pakistan’s Score: 37)32 System to manage the
implementation of the PPP contract
Yes Establishment of a PPP contract management team
33 Risk mitigation mechanism. System for tracking progress and completion of construction works
Yes
Table A7 continued
continued on next page
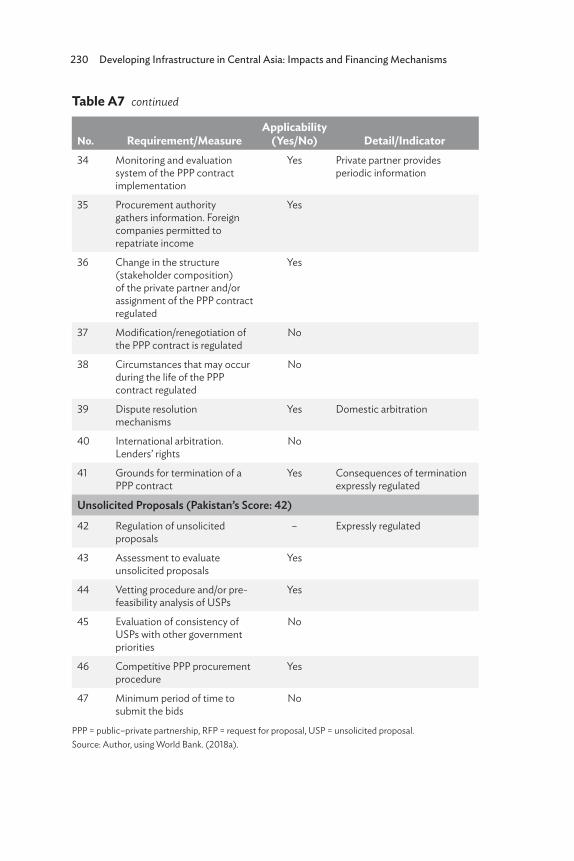
230 Developing Infrastructure in Central Asia: Impacts and Financing Mechanisms
No. Requirement/MeasureApplicability
(Yes/No) Detail/Indicator34 Monitoring and evaluation
system of the PPP contract implementation
Yes Private partner provides periodic information
35 Procurement authority gathers information. Foreign companies permitted to repatriate income
Yes
36 Change in the structure (stakeholder composition) of the private partner and/or assignment of the PPP contract regulated
Yes
37 Modification/renegotiation of the PPP contract is regulated
No
38 Circumstances that may occur during the life of the PPP contract regulated
No
39 Dispute resolution mechanisms
Yes Domestic arbitration
40 International arbitration. Lenders’ rights
No
41 Grounds for termination of a PPP contract
Yes Consequences of termination expressly regulated
Unsolicited Proposals (Pakistan’s Score: 42)
42 Regulation of unsolicited proposals
– Expressly regulated
43 Assessment to evaluate unsolicited proposals
Yes
44 Vetting procedure and/or pre-feasibility analysis of USPs
Yes
45 Evaluation of consistency of USPs with other government priorities
No
46 Competitive PPP procurement procedure
Yes
47 Minimum period of time to submit the bids
No
PPP = public–private partnership, RFP = request for proposal, USP = unsolicited proposal.Source: Author, using World Bank. (2018a).
Table A7 continued
231
8Are Public–Private Partnerships
a Solution to the Lagging Infrastructure of Tajikistan?
Ziyodullo Parpiev
8.1 IntroductionPublic–private partnerships (PPPs) may be an effective tool for the delivery of infrastructure and infrastructure-based services. They have been especially successful in the power, water and wastewater, and transport sectors. They allow poor countries to build and maintain infrastructure they could otherwise not afford. Most PPPs charge user fees to recover the initial capital investments. However, relatively high user fees in many countries have fueled concerns that they exclude large groups of the population (especially those with low incomes) from accessing the services.
The case of PPP projects in the infrastructure development of Tajikistan is interesting since it was the first Central Asian country to adopt the PPP modality to finance infrastructure development. Two high-profile examples of such collaboration between the public and private sector are the Pamir Private Power project in eastern Tajikistan and the Dushanbe-Chanak toll road that links the capital of the country and Khujand, the second-largest city in the north close to the Uzbekistan border. These infrastructure PPP projects differ in their approach to risk-taking and provide interesting cases for studying the feasibility of PPPs in developing countries.
As its external debt has grown over time, Tajikistan has become increasingly constrained in external borrowing. In these circumstances, PPPs can potentially become an important source of private investment, particularly in high-cost infrastructure projects. This study will look at a range of issues affecting PPPs and their implementation in Tajikistan.
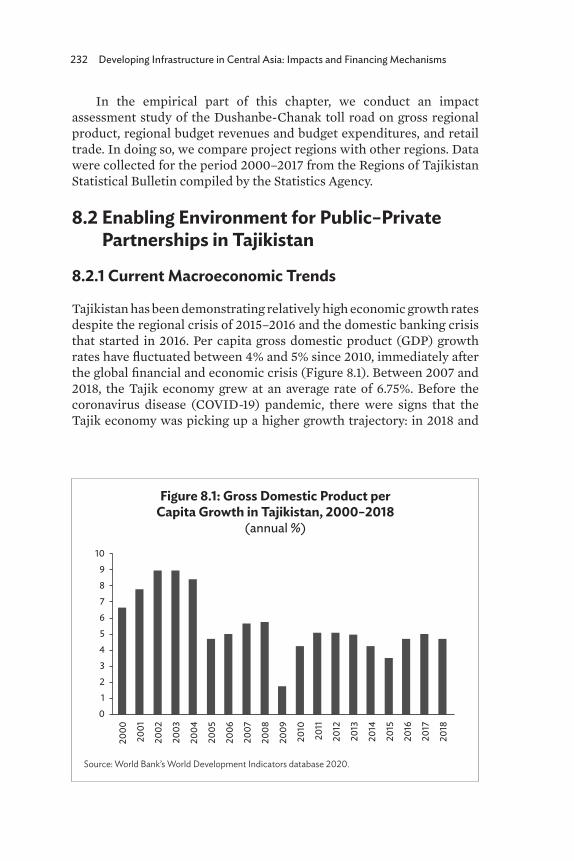
232 Developing Infrastructure in Central Asia: Impacts and Financing Mechanisms
In the empirical part of this chapter, we conduct an impact assessment study of the Dushanbe-Chanak toll road on gross regional product, regional budget revenues and budget expenditures, and retail trade. In doing so, we compare project regions with other regions. Data were collected for the period 2000–2017 from the Regions of Tajikistan Statistical Bulletin compiled by the Statistics Agency.
8.2 Enabling Environment for Public–Private Partnerships in Tajikistan
8.2.1 Current Macroeconomic Trends
Tajikistan has been demonstrating relatively high economic growth rates despite the regional crisis of 2015–2016 and the domestic banking crisis that started in 2016. Per capita gross domestic product (GDP) growth rates have fluctuated between 4% and 5% since 2010, immediately after the global financial and economic crisis (Figure 8.1). Between 2007 and 2018, the Tajik economy grew at an average rate of 6.75%. Before the coronavirus disease (COVID-19) pandemic, there were signs that the Tajik economy was picking up a higher growth trajectory: in 2018 and
Figure 8.1: Gross Domestic Product per Capita Growth in Tajikistan, 2000–2018
(annual %)
Source: World Bank’s World Development Indicators database 2020.
10
9
8
7
6
5
4
3
2
1
0
2000
2001
2002
2003
2004
2005
2006
2007
2008
2009
2010
2011
2012
2013
2014
2015
2016
2017
2018
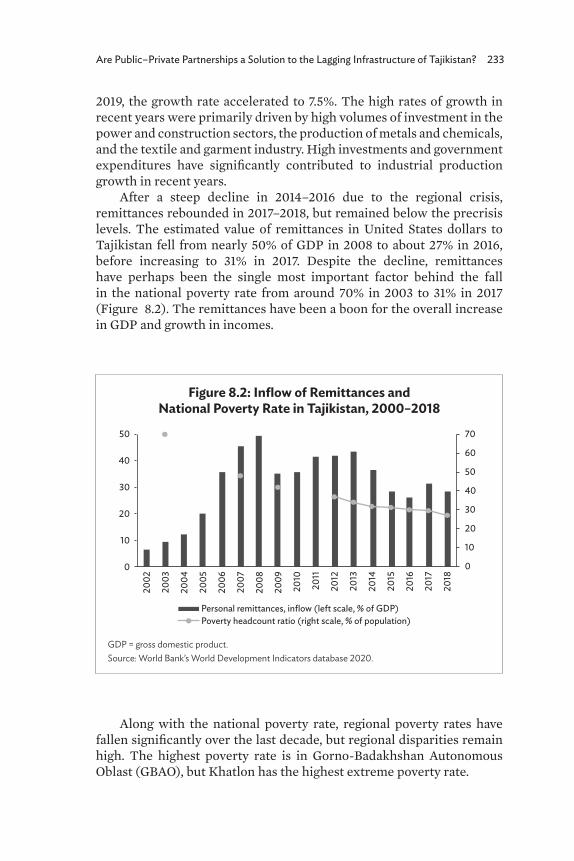
Are Public–Private Partnerships a Solution to the Lagging Infrastructure of Tajikistan? 233
2019, the growth rate accelerated to 7.5%. The high rates of growth in recent years were primarily driven by high volumes of investment in the power and construction sectors, the production of metals and chemicals, and the textile and garment industry. High investments and government expenditures have significantly contributed to industrial production growth in recent years.
After a steep decline in 2014–2016 due to the regional crisis, remittances rebounded in 2017–2018, but remained below the precrisis levels. The estimated value of remittances in United States dollars to Tajikistan fell from nearly 50% of GDP in 2008 to about 27% in 2016, before increasing to 31% in 2017. Despite the decline, remittances have perhaps been the single most important factor behind the fall in the national poverty rate from around 70% in 2003 to 31% in 2017 (Figure 8.2). The remittances have been a boon for the overall increase in GDP and growth in incomes.
Along with the national poverty rate, regional poverty rates have fallen significantly over the last decade, but regional disparities remain high. The highest poverty rate is in Gorno-Badakhshan Autonomous Oblast (GBAO), but Khatlon has the highest extreme poverty rate.
Figure 8.2: Inflow of Remittances and National Poverty Rate in Tajikistan, 2000–2018
GDP = gross domestic product. Source: World Bank’s World Development Indicators database 2020.
70
60
50
40
30
20
10
0
50
40
30
20
10
Personal remittances, inflow (left scale, % of GDP)Poverty headcount ratio (right scale, % of population)
0
2002
2003
2004
2005
2006
2007
2008
2009
2010
2011
2012
2013
2014
2015
2016
2017
2018
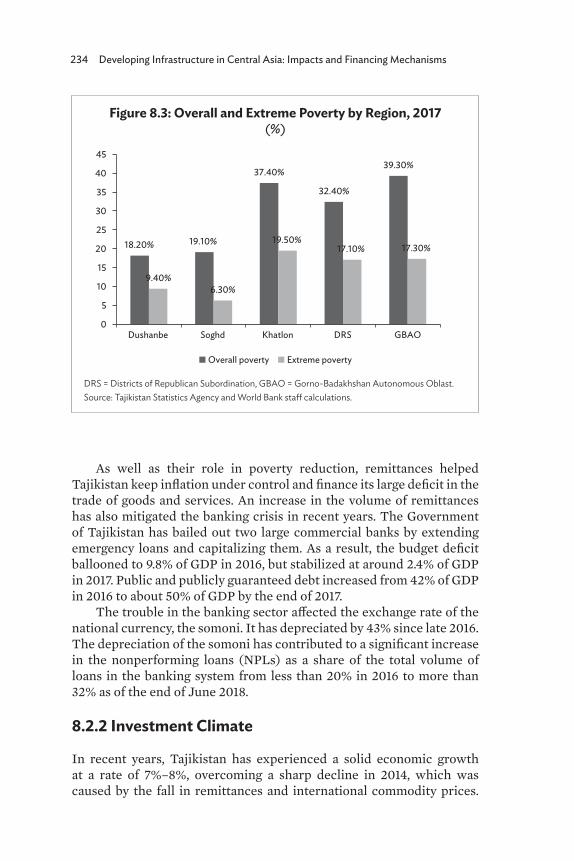
234 Developing Infrastructure in Central Asia: Impacts and Financing Mechanisms
As well as their role in poverty reduction, remittances helped Tajikistan keep inflation under control and finance its large deficit in the trade of goods and services. An increase in the volume of remittances has also mitigated the banking crisis in recent years. The Government of Tajikistan has bailed out two large commercial banks by extending emergency loans and capitalizing them. As a result, the budget deficit ballooned to 9.8% of GDP in 2016, but stabilized at around 2.4% of GDP in 2017. Public and publicly guaranteed debt increased from 42% of GDP in 2016 to about 50% of GDP by the end of 2017.
The trouble in the banking sector affected the exchange rate of the national currency, the somoni. It has depreciated by 43% since late 2016. The depreciation of the somoni has contributed to a significant increase in the nonperforming loans (NPLs) as a share of the total volume of loans in the banking system from less than 20% in 2016 to more than 32% as of the end of June 2018.
8.2.2 Investment Climate
In recent years, Tajikistan has experienced a solid economic growth at a rate of 7%–8%, overcoming a sharp decline in 2014, which was caused by the fall in remittances and international commodity prices.
Figure 8.3: Overall and Extreme Poverty by Region, 2017 (%)
DRS = Districts of Republican Subordination, GBAO = Gorno-Badakhshan Autonomous Oblast. Source: Tajikistan Statistics Agency and World Bank staff calculations.
18.20% 19.10%
37.40%
32.40%
39.30%
9.40%6.30%
19.50%17.10% 17.30%
0
5
10
15
20
25
30
35
40
45
Dushanbe Soghd Khatlon DRS GBAO
Overall poverty Extreme poverty
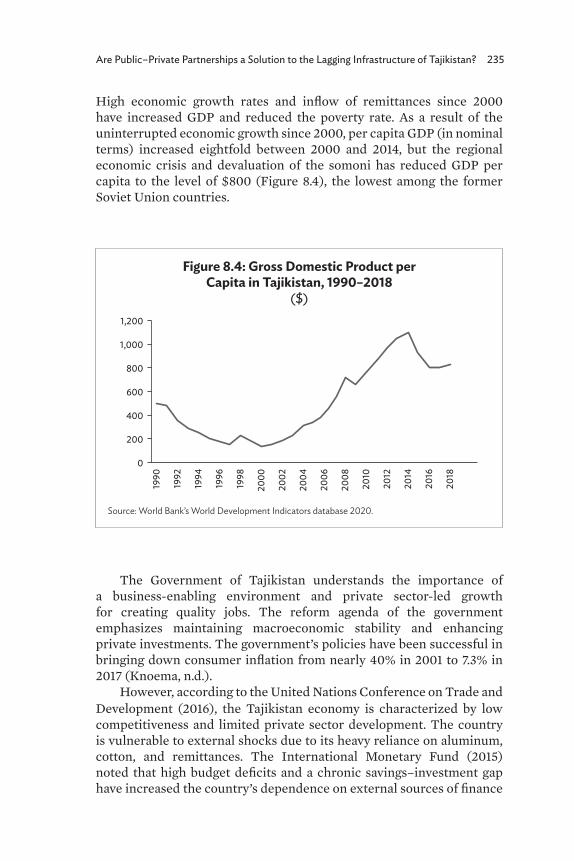
Are Public–Private Partnerships a Solution to the Lagging Infrastructure of Tajikistan? 235
High economic growth rates and inflow of remittances since 2000 have increased GDP and reduced the poverty rate. As a result of the uninterrupted economic growth since 2000, per capita GDP (in nominal terms) increased eightfold between 2000 and 2014, but the regional economic crisis and devaluation of the somoni has reduced GDP per capita to the level of $800 (Figure 8.4), the lowest among the former Soviet Union countries.
The Government of Tajikistan understands the importance of a business-enabling environment and private sector-led growth for creating quality jobs. The reform agenda of the government emphasizes maintaining macroeconomic stability and enhancing private investments. The government’s policies have been successful in bringing down consumer inflation from nearly 40% in 2001 to 7.3% in 2017 (Knoema, n.d.).
However, according to the United Nations Conference on Trade and Development (2016), the Tajikistan economy is characterized by low competitiveness and limited private sector development. The country is vulnerable to external shocks due to its heavy reliance on aluminum, cotton, and remittances. The International Monetary Fund (2015) noted that high budget deficits and a chronic savings–investment gap have increased the country’s dependence on external sources of finance
Figure 8.4: Gross Domestic Product per Capita in Tajikistan, 1990–2018
($)
Source: World Bank’s World Development Indicators database 2020.
1,000
1,200
800
600
200
400
0
1990
1992
1994
1996
1998
2000
2002
2004
2006
2008
2010
2012
2014
2016
2018
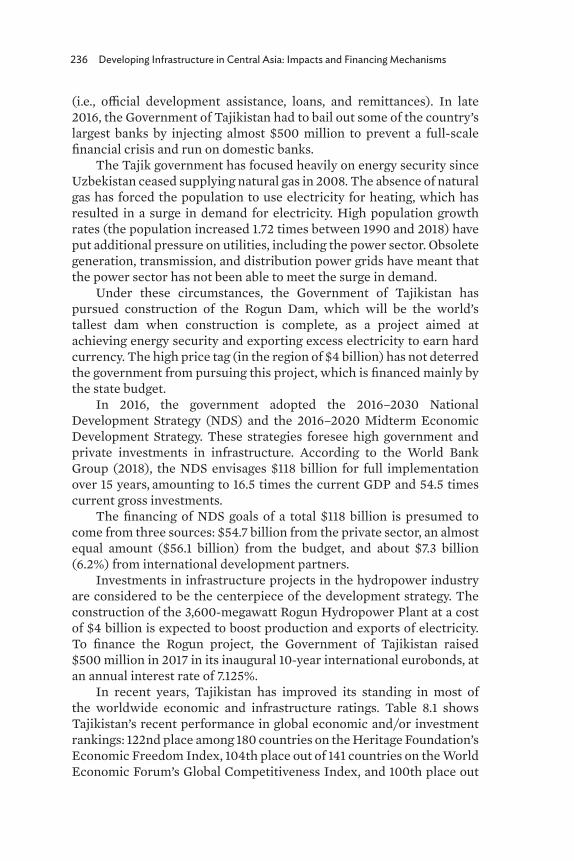
236 Developing Infrastructure in Central Asia: Impacts and Financing Mechanisms
(i.e., official development assistance, loans, and remittances). In late 2016, the Government of Tajikistan had to bail out some of the country’s largest banks by injecting almost $500 million to prevent a full-scale financial crisis and run on domestic banks.
The Tajik government has focused heavily on energy security since Uzbekistan ceased supplying natural gas in 2008. The absence of natural gas has forced the population to use electricity for heating, which has resulted in a surge in demand for electricity. High population growth rates (the population increased 1.72 times between 1990 and 2018) have put additional pressure on utilities, including the power sector. Obsolete generation, transmission, and distribution power grids have meant that the power sector has not been able to meet the surge in demand.
Under these circumstances, the Government of Tajikistan has pursued construction of the Rogun Dam, which will be the world’s tallest dam when construction is complete, as a project aimed at achieving energy security and exporting excess electricity to earn hard currency. The high price tag (in the region of $4 billion) has not deterred the government from pursuing this project, which is financed mainly by the state budget.
In 2016, the government adopted the 2016–2030 National Development Strategy (NDS) and the 2016–2020 Midterm Economic Development Strategy. These strategies foresee high government and private investments in infrastructure. According to the World Bank Group (2018), the NDS envisages $118 billion for full implementation over 15 years, amounting to 16.5 times the current GDP and 54.5 times current gross investments.
The financing of NDS goals of a total $118 billion is presumed to come from three sources: $54.7 billion from the private sector, an almost equal amount ($56.1 billion) from the budget, and about $7.3 billion (6.2%) from international development partners.
Investments in infrastructure projects in the hydropower industry are considered to be the centerpiece of the development strategy. The construction of the 3,600-megawatt Rogun Hydropower Plant at a cost of $4 billion is expected to boost production and exports of electricity. To finance the Rogun project, the Government of Tajikistan raised $500 million in 2017 in its inaugural 10-year international eurobonds, at an annual interest rate of 7.125%.
In recent years, Tajikistan has improved its standing in most of the worldwide economic and infrastructure ratings. Table 8.1 shows Tajikistan’s recent performance in global economic and/or investment rankings: 122nd place among 180 countries on the Heritage Foundation’s Economic Freedom Index, 104th place out of 141 countries on the World Economic Forum’s Global Competitiveness Index, and 100th place out
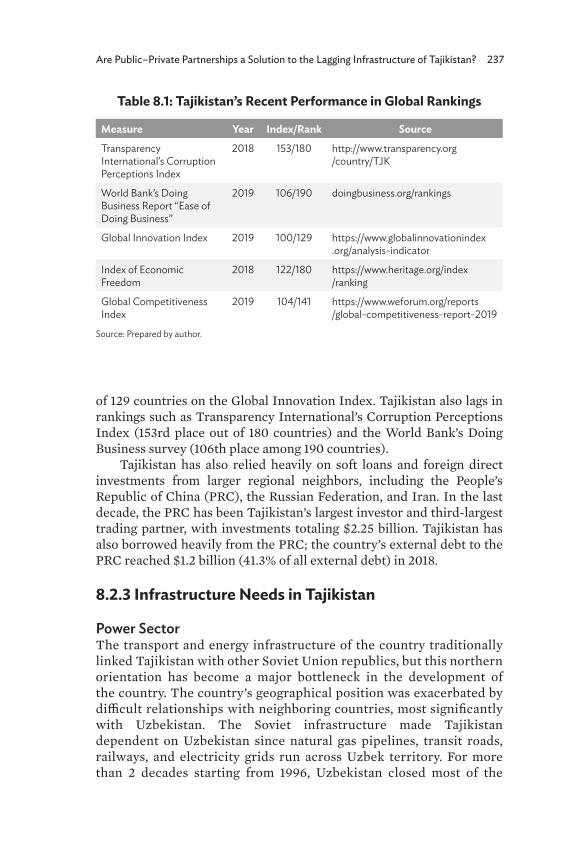
Are Public–Private Partnerships a Solution to the Lagging Infrastructure of Tajikistan? 237
of 129 countries on the Global Innovation Index. Tajikistan also lags in rankings such as Transparency International’s Corruption Perceptions Index (153rd place out of 180 countries) and the World Bank’s Doing Business survey (106th place among 190 countries).
Tajikistan has also relied heavily on soft loans and foreign direct investments from larger regional neighbors, including the People’s Republic of China (PRC), the Russian Federation, and Iran. In the last decade, the PRC has been Tajikistan’s largest investor and third-largest trading partner, with investments totaling $2.25 billion. Tajikistan has also borrowed heavily from the PRC; the country’s external debt to the PRC reached $1.2 billion (41.3% of all external debt) in 2018.
8.2.3 Infrastructure Needs in Tajikistan
Power SectorThe transport and energy infrastructure of the country traditionally linked Tajikistan with other Soviet Union republics, but this northern orientation has become a major bottleneck in the development of the country. The country’s geographical position was exacerbated by difficult relationships with neighboring countries, most significantly with Uzbekistan. The Soviet infrastructure made Tajikistan dependent on Uzbekistan since natural gas pipelines, transit roads, railways, and electricity grids run across Uzbek territory. For more than 2 decades starting from 1996, Uzbekistan closed most of the
Table 8.1: Tajikistan’s Recent Performance in Global Rankings
Measure Year Index/Rank SourceTransparency International’s Corruption Perceptions Index
2018 153/180 http://www.transparency.org /country/TJK
World Bank’s Doing Business Report “Ease of Doing Business”
2019 106/190 doingbusiness.org/rankings
Global Innovation Index 2019 100/129 https://www.globalinnovationindex .org/analysis-indicator
Index of Economic Freedom
2018 122/180 https://www.heritage.org/index /ranking
Global Competitiveness Index
2019 104/141 https://www.weforum.org/reports /global-competitiveness-report-2019
Source: Prepared by author.
238 Developing Infrastructure in Central Asia: Impacts and Financing Mechanisms
border checkpoints, mined the border areas, and introduced a visa regime for Tajik citizens.
The country relies heavily on hydropower for electricity, the primary source for industrial as well as household energy. The electricity supply is hampered by frequent blackouts, especially in the winter months. Businesses face frequent outages, incurring economic losses. The severe winter of 2017–2008 crippled the whole country and brought the power generation, transmission, and distribution system to breaking point.
Tajikistan’s state-owned energy company, Barqi Tojik, dominates the production of power, its mammoth aluminum factory, TALCO, consumes about 30% of the electricity produced in the country and more than 40% of the electricity produced by Barqi Tojik (ADB, n.d.). TALCO accounts for more than 30% of GDP and 40% of the country’s exports. The aluminum plant receives a special electricity tariff rate of $0.01 per kilowatt-hour, though the tariffs for TALCO are slated to increase by 15% in the summer months (April to September) and by 300% in the winter months (October to March). With this increase, TALCO will retain subsidized tariff rates in summer but has to pay rates closer to the cost-recovery levels in winter, estimated to be around $0.03 per kilowatt-hour. Agriculture uses about 30% of Tajikistan’s electricity consumption mainly through the use of electric water pumps, industry consumes approximately the same amount, and residential houses the rest.
The power sector is also characterized by significant swings in demand (high demand in winter and low demand in summer) and peak hours, making it difficult for Barqi Tojik to meet the demand. Due to the rapid deterioration of the generation facilities and transmission and distribution grids, the technical losses are thought to be double-digit figures.
In addition, Barqi Tojik is in serious financial distress due to operational inefficiencies and high debt burden. According to the Ministry of Energy of Tajikistan, Barqi Tojik’s outstanding debt, excluding loans taken out for the implementation of electric power projects, stood at TJS4.145 billion (approximately $450 million) as of July 2018, increasing by TJS450 million (about $50 million) in 6 months. Debts on loans for investment projects at the beginning of this year amounted to TJS11 billion ($1.2 billion).
RoadsIn the last decade, Tajikistan has invested significant funds into the rehabilitation of the main roads, such as Dushanbe–Chanak (Uzbekistan border), Dushanbe–Kulma (PRC border), and Kurgan–Tube–Nizhny
Are Public–Private Partnerships a Solution to the Lagging Infrastructure of Tajikistan? 239
Pyanj (Afghanistan border). Apart from these high-profile projects, the government has also undertaken the construction of tunnels and bridges in other parts of the country. The PRC has emerged as a major source of funding for road infrastructure rehabilitation with approximately $720 million since 2007.
Despite these efforts, road connectivity in the country remains poor and inadequate. Improving relations with Uzbekistan are expected to boost Tajikistan’s trade with Uzbekistan and the rest of the world. However, if the road networks cannot cope with the increasing traffic volumes and loads, the country will not reap the full extent of benefits from opening up. Another important aspect of road transportation is the deterioration of road safety and the increase in the number of traffic accidents.
In June 2018, the Ministry of Transport of Tajikistan unveiled its ambitious plan to build and renovate about 30 road projects, the implementation of which will require more than $2.7 billion. The most expensive project on the list of promising road projects is the project “Rehabilitation of Khorog–Kulma section of Dushanbe–Kulma highway.” According to preliminary data, it will cost about $568 million to rehabilitate the 395-kilometer section of this highway (Trend News Agency 2018).
Railway and air transport services in Tajikistan are relatively underdeveloped. These sectors are characterized by a high level of monopolization and high costs. Due to the political tensions with Uzbekistan, transit fees for railway transport have been high.
Overall, Tajikistan’s air transport system is expensive and inefficient due to limited competition and has inadequate coverage, with very few major international airlines flying in and out of the country, except for Turkish Airlines and Russian Airlines.
In 2017, the World Bank’s Logistics Performance Index estimated the quality of trade and transport-related infrastructure in Tajikistan to be 2.1, an extremely low ranking.1 The World Economic Forum’s Global Competitiveness Index assigns Tajikistan 3.3 points (out of 7) on the overall quality of infrastructure. These estimates indicate that Tajikistan’s infrastructure backwardness may be acting as a serious impediment to the country’s aspirations to become a prosperous country.
1 On a scale of 1 to 5, where 1 = lowest and 5 = highest.
240 Developing Infrastructure in Central Asia: Impacts and Financing Mechanisms
8.2.4 Public–Private Partnership Legislation
The legislation and regulations of Tajikistan in the sphere of PPPs include:
• Civil Code• Tax Code • Customs Code• Land Code• Law “On investments” • Law “On state procurement of goods, works, and services” • Law “On agreements on production sharing” • Law “On concessions” • Law “On public–private partnerships”
National legislation regulating PPPs in Tajikistan consists of many codes and laws, but the most important laws are the Law “On concessions” and the Law “On public–private partnerships.” Tajikistan adopted its first Concession Law in 1997, which served as the statutory basis for some PPPs, including the Dushanbe–Chanak toll road. The law regulates relations between participants of the concession, defines the rights and obligations of the authorized state agency, the rights and obligations of the concessionaire, and other issues. In particular, it allows the transfer of state objects into concession without tender in exceptional cases.
However, according to the European Bank for Reconstruction and Development (EBRD), the law fell far short of international best practice. In particular, the assessment found Tajikistan is in “very low compliance” with international standards such as the United Nations Commission on International Trade Law Legislative Guide on Privately Financed Infrastructure Projects (EBRD 2008). It also revealed that the Law “On concessions” is vague and major clauses are declarative in nature. EBRD (2008) recommended undertaking major legislative reforms to create a solid legal basis for the development of PPPs in Tajikistan.
The legal framework was improved with the introduction of Law No. 907 on Public–Private Partnerships, dated 28 December 2012 (hereinafter “the PPP Law”). According to Article 6 of the PPP Law, the PPP Unit is entrusted to make recommendations to the Public–Private Partnership Council on which projects to pursue or approve, what issues within the PPP program warrant further examination, etc. The PPP Law also stipulated the creation of a PPP Unit under the State Committee on Investments and State Property Management. In August 2013, the PPP Unit was established.
Are Public–Private Partnerships a Solution to the Lagging Infrastructure of Tajikistan? 241
The PPP Law specifies the following types of projects to be implemented under PPP agreement:
• infrastructure projects – design, construction, development, and use of a new infrastructure facility or reconstruction, modernization, extension, and operation of any existing infrastructure facility; and
• social services projects – design, development, and operation of any structure operating under the jurisdiction of the state partner prior to the start of the project that directly or indirectly provides social services to the population for a period of not less than three years (domestic, psychological, medical, educational, and other services).
The PPP Law assigns the following state authorities as authorities regulating the PPP activity:
• Government of the Republic of Tajikistan• Public–Private Partnership Council (hereinafter “the PPP
Council”)• State Committee on Investment and State Property Management
of the Republic of Tajikistan
The PPP Law assigns a leading role to a contracting authority (state authority) in reconciliation of a PPP project. The contracting authority prepares a feasibility study of the PPP project (independently or through engaging specialized organizations), develops tender documentation, and participates in negotiation and the preparation of a PPP agreement.
The PPP Law lays out the basic requirements for type, content, and implementation procedure of any PPP agreement. It also allows the introduction of additional conditions to a PPP agreement within certain PPP projects. The PPP Law establishes grounds and terms for termination of a PPP agreement by the contracting authority and private partner, as well as by mutual consent of the parties involved.
The PPP Law stipulates certain restrictions with respect to PPP projects. In particular, it shall not apply to:
• goods procurement, work performance, and service rendering in accordance with the Law “On state procurement of goods, works, and services”
• privatization and denationalization of state property and enterprises in accordance with the Law “On privatization of state property of the Republic of Tajikistan”
• granting rights for subsoil use according to the Law “On subsoil use” and “On concessions”

242 Developing Infrastructure in Central Asia: Impacts and Financing Mechanisms
The decision to keep the Law “On concessions” despite adoption of the more progressive PPP Law creates an unnecessary legal dilemma—whether to go along with the more rigorous PPP Law or use shallow stipulations of the Law “On concessions” as a basis of the PPP agreement.
Article 22 of the PPP Law defines the circumstances under which the government can grant PPP projects without a competitive procurement process. These include an urgent need to ensure delivery of a public service; if the project deals with matters of national defense and public security; when only one source can provide the required service, including services of intellectual property and trade secrets; cases in which no bidders meet the evaluation criteria in the preliminary selection stage and fail; and other cases when national, public, and local governmental interests arise. The United Nations Economic Commission for Europe (2013) expressed concerns regarding this provision of the law and stated that it can provide a long list of cases of nontransparent contractual operations, where the provisions of the PPP Law do not apply.
8.2.5 Institutional Framework for Public–Private Partnerships
The PPP Law created the current organizational and institutional framework that will be considered in the following section. Though the PPP Law provides a basis for the modern institutional framework, it lacks certain important elements. One of the provisions missing in the modern PPP legislation is international arbitration in dispute settlement. Any disputes, if not resolved amicably between public and private partners, will be referred to the PPP Council, consisting of senior Tajik government officials. This dispute settlement model will probably provide a little assurance to the investors that potential disputes with the public partner will be resolved objectively.
The PPP Law created two layers of decision making (Figure 8.5), the PPP Unit and the PPP Council, instead of one single decision-making unit as in many other countries. This additional layer of bureaucracy may delay decision making and the implementation of PPP projects.
Another issue is the placement of the PPP Unit under the State Committee on Investment and State Property Management. In terms of granting necessary authority, many countries have placed PPP units within either the economic development or finance ministries. In most cases, the establishment of PPP units inside the finance ministry enables countries to better integrate the PPP program with the state budget.
According to the PPP Law, the PPP Council is designated as a key decision-making organ in the PPP process. It is authorized to supervise the activities of all ministries and local governments related
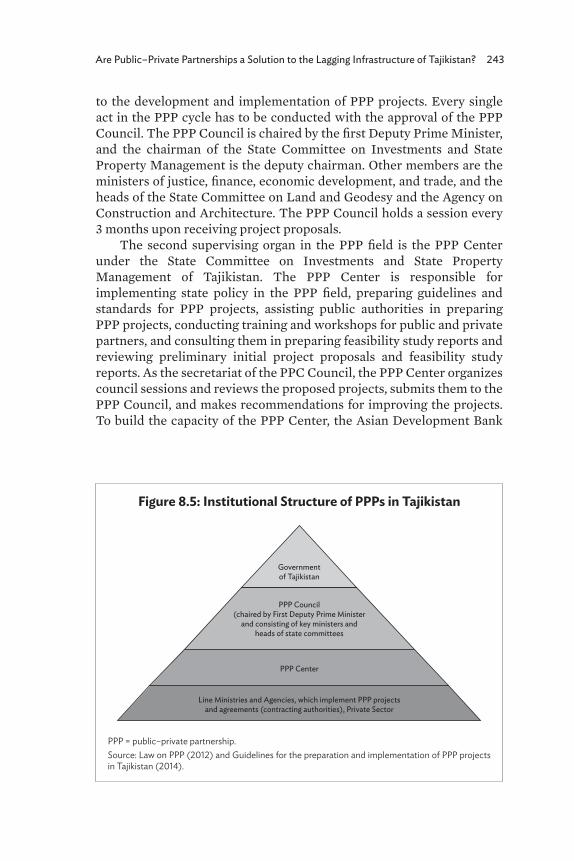
Are Public–Private Partnerships a Solution to the Lagging Infrastructure of Tajikistan? 243
to the development and implementation of PPP projects. Every single act in the PPP cycle has to be conducted with the approval of the PPP Council. The PPP Council is chaired by the first Deputy Prime Minister, and the chairman of the State Committee on Investments and State Property Management is the deputy chairman. Other members are the ministers of justice, finance, economic development, and trade, and the heads of the State Committee on Land and Geodesy and the Agency on Construction and Architecture. The PPP Council holds a session every 3 months upon receiving project proposals.
The second supervising organ in the PPP field is the PPP Center under the State Committee on Investments and State Property Management of Tajikistan. The PPP Center is responsible for implementing state policy in the PPP field, preparing guidelines and standards for PPP projects, assisting public authorities in preparing PPP projects, conducting training and workshops for public and private partners, and consulting them in preparing feasibility study reports and reviewing preliminary initial project proposals and feasibility study reports. As the secretariat of the PPC Council, the PPP Center organizes council sessions and reviews the proposed projects, submits them to the PPP Council, and makes recommendations for improving the projects. To build the capacity of the PPP Center, the Asian Development Bank
Figure 8.5: Institutional Structure of PPPs in Tajikistan
PPP = public–private partnership. Source: Law on PPP (2012) and Guidelines for the preparation and implementation of PPP projects in Tajikistan (2014).
Government of Tajikistan
PPP Center
PPP Council(chaired by First Deputy Prime Minister
and consisting of key ministers and heads of state committees
Line Ministries and Agencies, which implement PPP projects and agreements (contracting authorities), Private Sector
244 Developing Infrastructure in Central Asia: Impacts and Financing Mechanisms
provided technical assistance. Within 3 years of project implementation (2013–2016), international specialists assisted the PPP Center in developing methodological tools and guidelines for preparing PPP projects, and conducting training, workshops, and educational activities for government authorities, private partners, local entrepreneurs, and the public.
To coordinate the activities of the government authorities in the PPP field, focal points are identified in each ministry, committee, agency, and local government. The focal points prepare projects in their relevant sector and propose them to the PPP Center for review and further submission to the PPP Council. Additionally, a commission for evaluating bidding proposals for projects is established, comprising representatives of relevant government authorities. The commission organizes the bidding process, evaluates bidders, decides on the winner of the bid, and submits the result of the bidding process to the PPP Council for approval.
8.3 Case Studies
8.3.1 Case Study 1: Pamir Energy Project
The main goal of the Pamir Energy project was to restore a reliable electricity supply to the geographically isolated inhabitants of eastern Tajikistan. Under the former Soviet Union, 60% of Tajikistan’s energy was provided by diesel-generated machinery running on imported fuel. After the collapse of the Soviet Union, power failures became widespread. The project was supposed to contribute to Tajikistan’s poverty reduction strategy by providing electricity to businesses and citizens.
FinancingThe PPP agreement stipulates that the government remains the principal owner of all physical assets, while Pamir Private Power is responsible for all electricity generation, transmission, and distribution facilities through a special purpose vehicle company. The concessions agreement between the Government of Tajikistan and the Aga Khan Fund for Economic Development (AKFED) was signed in May 2002 for 25 years. The initial cost of the project was $26 million.
In order not to burden the company with a high level of debt, a consortium of international organizations developed a financing mix with 45% in equity finance and 55% debt, which was provided by the International Finance Corporation (IFC) and the International
Are Public–Private Partnerships a Solution to the Lagging Infrastructure of Tajikistan? 245
Development Association (IDA). The IFC provided $3.5 million in equity financing; the remainder, $8.2 million, was provided by AKFED, the private sector partner in the venture.
Social ProtectionThe project had important social aspects since GBAO is the poorest region in Tajikistan. About 98% of electricity in GBAO is consumed by households, and only 2% is consumed by businesses. In these circumstances, charging the full cost-recovery level of tariffs could potentially be burdensome for the most vulnerable population. Therefore, the Government of Tajikistan, supported by a Swiss government grant in the amount of $4 million, decided to subsidize the cost of electricity for the most vulnerable. For this purpose, a special trust fund was established.
The trust fund subsidized the so-called social tariff rate, which was designed to grow over the next decade. That was thought to decrease the cost of electricity without harming the bottom line of Pamir Energy. The scheme was later amended so that it lasted longer than the 10 years it was initially designed for. This social protection scheme shows that it is possible to design a program so that it has strong social protection aspects to it.
Structuring the ProjectPamir Energy and the Government of Tajikistan concluded a concession agreement for 25 years. The agreement detailed policy, regulatory, operational, and financial aspects of service provision. The IFC played a key role in drafting the agreement.
However, the need to renegotiate the agreement became clear in the first years of the project. Pamir Energy was initially responsible for power generation only, and Barqi Tojik was responsible for the distribution and collection of user fees. Due to the difficult financial situation of the state power company, however, the rate of collection remained low, in the region of 70%. In addition, it became clear that without simultaneous investment into transmission and distribution systems it is impossible to decrease the technical losses, which could reach up to 30%.
The government established a high-level working group including senior representatives from all relevant ministries and agencies to discuss and renegotiate the concession agreement. Two key changes were introduced. First, the structure of the deal was changed so that Pamir Energy became the sole operator of transmission and distribution grids. The second change concerned the social protection scheme: international donors agreed to enlarge the scheme to cover a greater
246 Developing Infrastructure in Central Asia: Impacts and Financing Mechanisms
share of the population and mobilized additional funding to finance the social protection program.
Successful Risk MitigationThe project assessed and mitigated emerging risks well. The IFC and IDA not only provided equity, but also the necessary regulatory, technical, and legal framework. Also, emerging risks were shared between the public and private partners.
Private Sector Added ValueThis project has shown that even in a relatively high-risk environment as in Tajikistan, successful private investments can bring necessary changes to people’s lives. However, the biggest challenge for Pamir Energy is to remain financially viable. For a small power company like Pamir Energy, it is difficult to remain profitable and generate sufficient funds to invest. In the case of Pamir Energy, the key to the financial viability of the project was to charge much higher cost-recovery tariffs for electricity than in the rest of Tajikistan. The mix of financing (with equity, loan, and grant components) served the project well in the long run.
8.3.2 Case Study 2: Dushanbe–Chanak Toll Road
Tajikistan has invested approximately $296 million into the improvement of the road between Dushanbe and Khujand. A total of $281 million came from the PRC in the form of a 20-year concessional loan at a 2% interest rate. The construction was entrusted to PRC road construction and tunneling companies. They reconstructed an old mountain pass but had to enlarge the road and rebuild 39 bridges and three large tunnels. The overall length of the road was 354 kilometers.
Figure 8.6 shows the repayment schedule of the PRC’s loan assuming the reported 2% interest rate. It shows that at the beginning of the 20-year period the payment of interest and repayment of principal constitute almost $20 million, but this gradually declines over time to around $14 million by 2029.
Upon the completion of the road renovation in early 2010, the Government of Tajikistan awarded the rights to manage the Dushanbe–Chanak (Sughd) toll road to a private sector company, Innovative Road Solutions (registered in the British Virgin Islands and reportedly established by Tajik citizens). The government signed a concession agreement with Innovative Road Solutions for 30 years, where the company was granted the right to equip the road with toll plazas and collect tolls from motorists. The company was also exempted from all
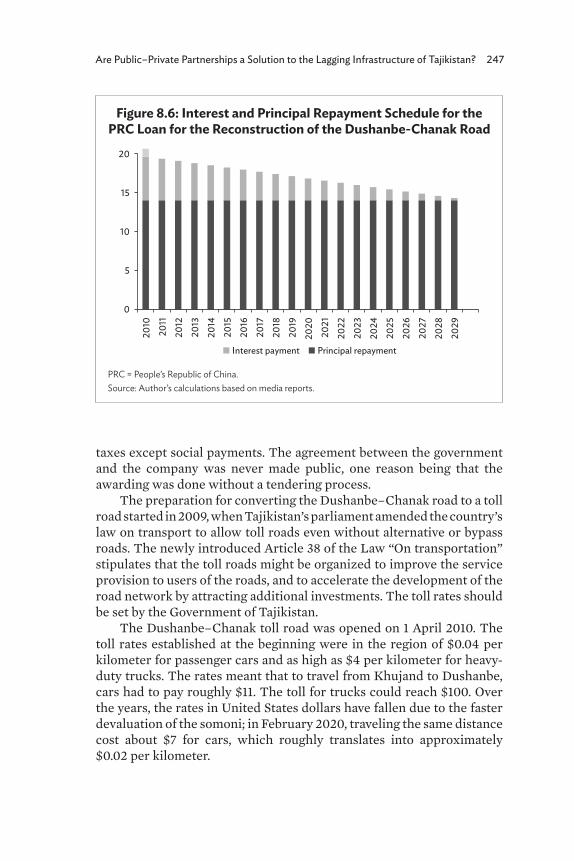
Are Public–Private Partnerships a Solution to the Lagging Infrastructure of Tajikistan? 247
taxes except social payments. The agreement between the government and the company was never made public, one reason being that the awarding was done without a tendering process.
The preparation for converting the Dushanbe–Chanak road to a toll road started in 2009, when Tajikistan’s parliament amended the country’s law on transport to allow toll roads even without alternative or bypass roads. The newly introduced Article 38 of the Law “On transportation” stipulates that the toll roads might be organized to improve the service provision to users of the roads, and to accelerate the development of the road network by attracting additional investments. The toll rates should be set by the Government of Tajikistan.
The Dushanbe–Chanak toll road was opened on 1 April 2010. The toll rates established at the beginning were in the region of $0.04 per kilometer for passenger cars and as high as $4 per kilometer for heavy-duty trucks. The rates meant that to travel from Khujand to Dushanbe, cars had to pay roughly $11. The toll for trucks could reach $100. Over the years, the rates in United States dollars have fallen due to the faster devaluation of the somoni; in February 2020, traveling the same distance cost about $7 for cars, which roughly translates into approximately $0.02 per kilometer.
Figure 8.6: Interest and Principal Repayment Schedule for the PRC Loan for the Reconstruction of the Dushanbe-Chanak Road
PRC = People’s Republic of China. Source: Author’s calculations based on media reports.
0
5
10
15
2020
10
2011
2012
2013
2014
2015
2016
2017
2018
2019
2020
2021
2022
2023
2024
2025
2026
2027
2028
2029
Interest payment Principal repayment
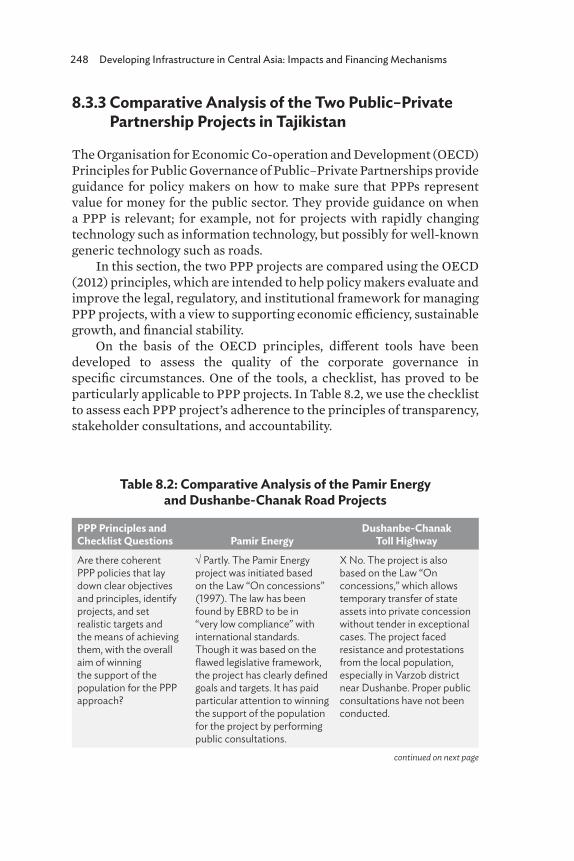
248 Developing Infrastructure in Central Asia: Impacts and Financing Mechanisms
8.3.3 Comparative Analysis of the Two Public–Private Partnership Projects in Tajikistan
The Organisation for Economic Co-operation and Development (OECD) Principles for Public Governance of Public–Private Partnerships provide guidance for policy makers on how to make sure that PPPs represent value for money for the public sector. They provide guidance on when a PPP is relevant; for example, not for projects with rapidly changing technology such as information technology, but possibly for well-known generic technology such as roads.
In this section, the two PPP projects are compared using the OECD (2012) principles, which are intended to help policy makers evaluate and improve the legal, regulatory, and institutional framework for managing PPP projects, with a view to supporting economic efficiency, sustainable growth, and financial stability.
On the basis of the OECD principles, different tools have been developed to assess the quality of the corporate governance in specific circumstances. One of the tools, a checklist, has proved to be particularly applicable to PPP projects. In Table 8.2, we use the checklist to assess each PPP project’s adherence to the principles of transparency, stakeholder consultations, and accountability.
continued on next page
Table 8.2: Comparative Analysis of the Pamir Energy and Dushanbe-Chanak Road Projects
PPP Principles and Checklist Questions Pamir Energy
Dushanbe-Chanak Toll Highway
Are there coherent PPP policies that lay down clear objectives and principles, identify projects, and set realistic targets and the means of achieving them, with the overall aim of winning the support of the population for the PPP approach?
√ Partly. The Pamir Energy project was initiated based on the Law “On concessions” (1997). The law has been found by EBRD to be in “very low compliance” with international standards. Though it was based on the flawed legislative framework, the project has clearly defined goals and targets. It has paid particular attention to winning the support of the population for the project by performing public consultations.
X No. The project is also based on the Law “On concessions,” which allows temporary transfer of state assets into private concession without tender in exceptional cases. The project faced resistance and protestations from the local population, especially in Varzob district near Dushanbe. Proper public consultations have not been conducted.
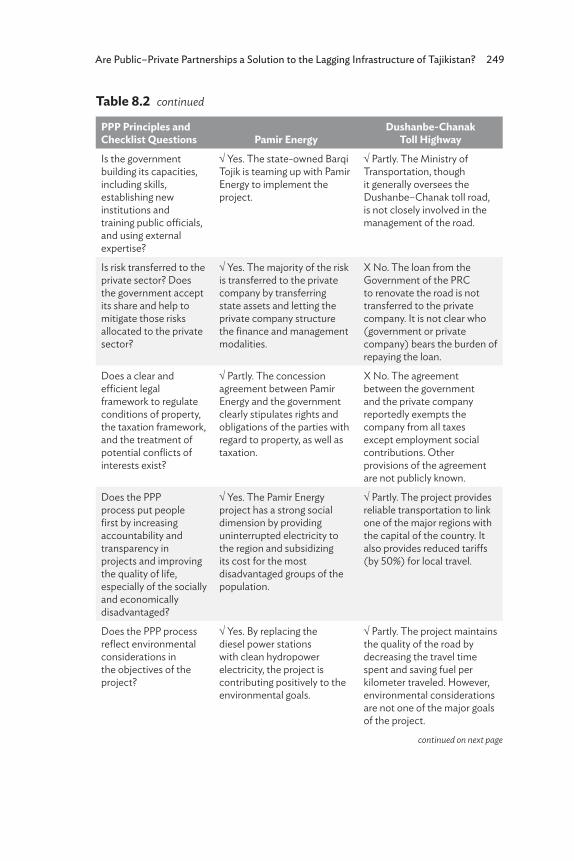
Are Public–Private Partnerships a Solution to the Lagging Infrastructure of Tajikistan? 249
PPP Principles and Checklist Questions Pamir Energy
Dushanbe-Chanak Toll Highway
Is the government building its capacities, including skills, establishing new institutions and training public officials, and using external expertise?
√ Yes. The state-owned Barqi Tojik is teaming up with Pamir Energy to implement the project.
√ Partly. The Ministry of Transportation, though it generally oversees the Dushanbe–Chanak toll road, is not closely involved in the management of the road.
Is risk transferred to the private sector? Does the government accept its share and help to mitigate those risks allocated to the private sector?
√ Yes. The majority of the risk is transferred to the private company by transferring state assets and letting the private company structure the finance and management modalities.
X No. The loan from the Government of the PRC to renovate the road is not transferred to the private company. It is not clear who (government or private company) bears the burden of repaying the loan.
Does a clear and efficient legal framework to regulate conditions of property, the taxation framework, and the treatment of potential conflicts of interests exist?
√ Partly. The concession agreement between Pamir Energy and the government clearly stipulates rights and obligations of the parties with regard to property, as well as taxation.
X No. The agreement between the government and the private company reportedly exempts the company from all taxes except employment social contributions. Other provisions of the agreement are not publicly known.
Does the PPP process put people first by increasing accountability and transparency in projects and improving the quality of life, especially of the socially and economically disadvantaged?
√ Yes. The Pamir Energy project has a strong social dimension by providing uninterrupted electricity to the region and subsidizing its cost for the most disadvantaged groups of the population.
√ Partly. The project provides reliable transportation to link one of the major regions with the capital of the country. It also provides reduced tariffs (by 50%) for local travel.
Does the PPP process reflect environmental considerations in the objectives of the project?
√ Yes. By replacing the diesel power stations with clean hydropower electricity, the project is contributing positively to the environmental goals.
√ Partly. The project maintains the quality of the road by decreasing the travel time spent and saving fuel per kilometer traveled. However, environmental considerations are not one of the major goals of the project.
Table 8.2 continued
continued on next page
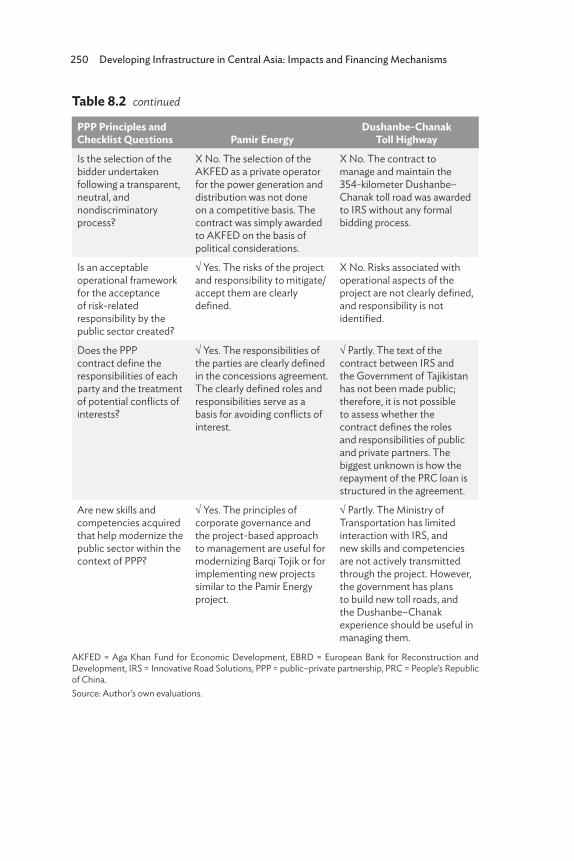
250 Developing Infrastructure in Central Asia: Impacts and Financing Mechanisms
PPP Principles and Checklist Questions Pamir Energy
Dushanbe-Chanak Toll Highway
Is the selection of the bidder undertaken following a transparent, neutral, and nondiscriminatory process?
X No. The selection of the AKFED as a private operator for the power generation and distribution was not done on a competitive basis. The contract was simply awarded to AKFED on the basis of political considerations.
X No. The contract to manage and maintain the 354-kilometer Dushanbe–Chanak toll road was awarded to IRS without any formal bidding process.
Is an acceptable operational framework for the acceptance of risk-related responsibility by the public sector created?
√ Yes. The risks of the project and responsibility to mitigate/accept them are clearly defined.
X No. Risks associated with operational aspects of the project are not clearly defined, and responsibility is not identified.
Does the PPP contract define the responsibilities of each party and the treatment of potential conflicts of interests?
√ Yes. The responsibilities of the parties are clearly defined in the concessions agreement. The clearly defined roles and responsibilities serve as a basis for avoiding conflicts of interest.
√ Partly. The text of the contract between IRS and the Government of Tajikistan has not been made public; therefore, it is not possible to assess whether the contract defines the roles and responsibilities of public and private partners. The biggest unknown is how the repayment of the PRC loan is structured in the agreement.
Are new skills and competencies acquired that help modernize the public sector within the context of PPP?
√ Yes. The principles of corporate governance and the project-based approach to management are useful for modernizing Barqi Tojik or for implementing new projects similar to the Pamir Energy project.
√ Partly. The Ministry of Transportation has limited interaction with IRS, and new skills and competencies are not actively transmitted through the project. However, the government has plans to build new toll roads, and the Dushanbe–Chanak experience should be useful in managing them.
AKFED = Aga Khan Fund for Economic Development, EBRD = European Bank for Reconstruction and Development, IRS = Innovative Road Solutions, PPP = public–private partnership, PRC = People’s Republic of China. Source: Author’s own evaluations.
Table 8.2 continued
Are Public–Private Partnerships a Solution to the Lagging Infrastructure of Tajikistan? 251
8.4 Empirical Model
8.4.1 Brief Review of Literature
Road infrastructure is thought to have a tangible impact on the livelihoods of households through a number of channels, such as improving people’s mobility, providing access to remote markets, and stimulating economic activity along the roads. Almost 60 years ago, Rostow (1962) wrote about infrastructure and roads being catalyzers for economic development. De Vera Garcia (1984) considered roads to be important factors in the development of rural areas.
However, interest in evaluating the impact of infrastructure projects had started growing again by the end of the 20th and beginning of the 21st century. One of the earliest studies, Yoshino and Nakahigashi (2000), used a production function approach to examine the impact of infrastructure on productivity in Japan and found that the effect of social capital stock, which increases the potential productivity of the private sector, was high during the high economic growth period. In addition, they found that the productivity effect of infrastructure is greater in tertiary industries than in primary and secondary industries.
Other authors have found significant and positive relationships between road infrastructure and a reduction in poverty levels (Gibson and Rozelle 2003; Jalan and Ravallion 1998; van de Walle and Mu 2011), increased household income and consumption (Escobal and Ponce 2003; Jalan and Ravallion 2002; Khandker, Bakht, and Koolwal 2006), health and education (Lokshin and Yemtsov 2003; Stifel and Minten 2008), and improvements in water and sanitation facilities (Jalan and Ravallion 2003).
One of the most popular methods for estimating the impact of road infrastructure is the difference-in-differences (DiD) method. This method proved its worth in establishing a cause-and-effect relationship and used observational data for deriving proper counterfactuals.
8.4.2 Data and Methodology
We collected a panel data set for four regions of Tajikistan: Sughd, Khatlon, GBAO, and Districts of Republican Subordination (DRS), as summarized in Table 8.3.
The information collected ranges from population to gross regional product, investments, number of employed and unemployed, and revenues and expenditures of local authorities. The data from 2000 to 2017 come from the Regions of Tajikistan Statistical Bulletin compiled by the Statistics Agency for various years. Descriptive statistics for all variables are provided in Table 8.4.
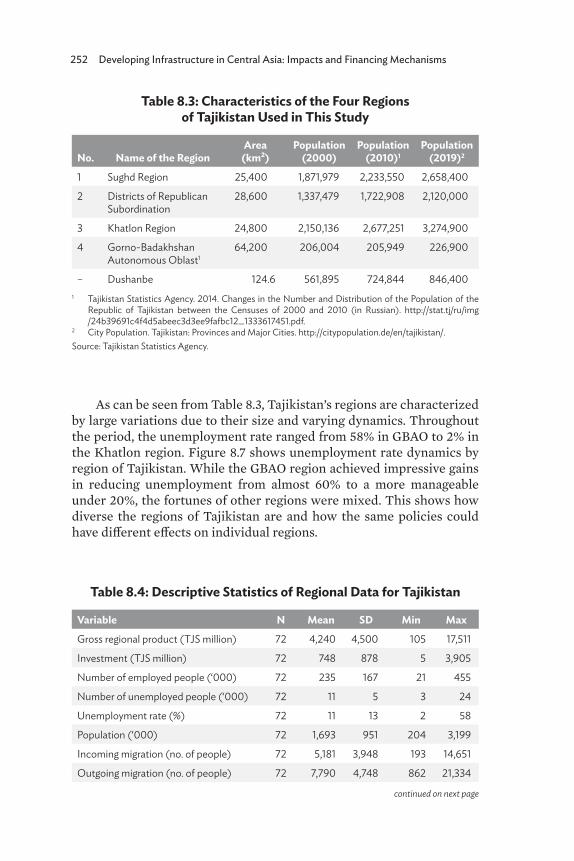
252 Developing Infrastructure in Central Asia: Impacts and Financing Mechanisms
As can be seen from Table 8.3, Tajikistan’s regions are characterized by large variations due to their size and varying dynamics. Throughout the period, the unemployment rate ranged from 58% in GBAO to 2% in the Khatlon region. Figure 8.7 shows unemployment rate dynamics by region of Tajikistan. While the GBAO region achieved impressive gains in reducing unemployment from almost 60% to a more manageable under 20%, the fortunes of other regions were mixed. This shows how diverse the regions of Tajikistan are and how the same policies could have different effects on individual regions.
Table 8.3: Characteristics of the Four Regions of Tajikistan Used in This Study
No. Name of the RegionArea
(km²)Population
(2000)Population
(2010)1Population
(2019)2
1 Sughd Region 25,400 1,871,979 2,233,550 2,658,400
2 Districts of Republican Subordination
28,600 1,337,479 1,722,908 2,120,000
3 Khatlon Region 24,800 2,150,136 2,677,251 3,274,900
4 Gorno-Badakhshan Autonomous Oblast1
64,200 206,004 205,949 226,900
– Dushanbe 124.6 561,895 724,844 846,4001 Tajikistan Statistics Agency. 2014. Changes in the Number and Distribution of the Population of the
Republic of Tajikistan between the Censuses of 2000 and 2010 (in Russian). http://stat.tj/ru/img /24b39691c4f4d5abeec3d3ee9fafbc12_1333617451.pdf.
2 City Population. Tajikistan: Provinces and Major Cities. http://citypopulation.de/en/tajikistan/.Source: Tajikistan Statistics Agency.
continued on next page
Table 8.4: Descriptive Statistics of Regional Data for Tajikistan
Variable N Mean SD Min MaxGross regional product (TJS million) 72 4,240 4,500 105 17,511
Investment (TJS million) 72 748 878 5 3,905
Number of employed people (‘000) 72 235 167 21 455
Number of unemployed people (‘000) 72 11 5 3 24
Unemployment rate (%) 72 11 13 2 58
Population (‘000) 72 1,693 951 204 3,199
Incoming migration (no. of people) 72 5,181 3,948 193 14,651
Outgoing migration (no. of people) 72 7,790 4,748 862 21,334
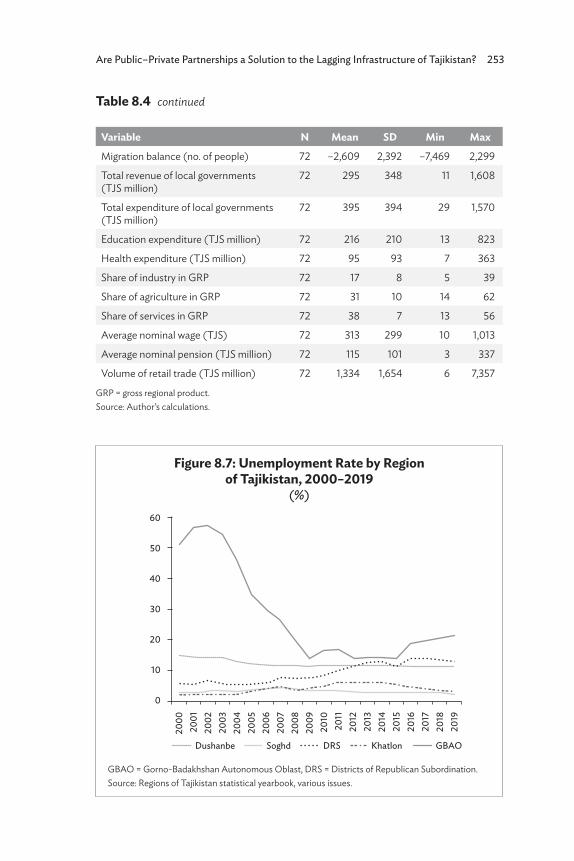
Are Public–Private Partnerships a Solution to the Lagging Infrastructure of Tajikistan? 253
Variable N Mean SD Min MaxMigration balance (no. of people) 72 –2,609 2,392 –7,469 2,299
Total revenue of local governments (TJS million)
72 295 348 11 1,608
Total expenditure of local governments (TJS million)
72 395 394 29 1,570
Education expenditure (TJS million) 72 216 210 13 823
Health expenditure (TJS million) 72 95 93 7 363
Share of industry in GRP 72 17 8 5 39
Share of agriculture in GRP 72 31 10 14 62
Share of services in GRP 72 38 7 13 56
Average nominal wage (TJS) 72 313 299 10 1,013
Average nominal pension (TJS million) 72 115 101 3 337
Volume of retail trade (TJS million) 72 1,334 1,654 6 7,357
GRP = gross regional product. Source: Author’s calculations.
Table 8.4 continued
Figure 8.7: Unemployment Rate by Region of Tajikistan, 2000–2019
(%)
GBAO = Gorno-Badakhshan Autonomous Oblast, DRS = Districts of Republican Subordination. Source: Regions of Tajikistan statistical yearbook, various issues.
60
50
40
30
20
10
2000
2001
2002
2003
2004
2005
2006
2007
2008
2009
2010
2011
2012
2013
2014
2015
2016
2017
2018
2019
0
Dushanbe DRSSoghd Khatlon GBAO
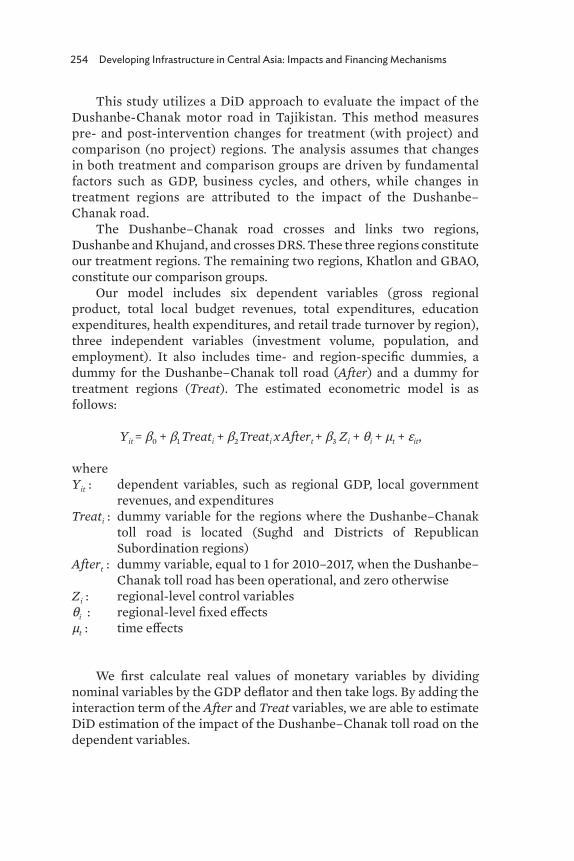
254 Developing Infrastructure in Central Asia: Impacts and Financing Mechanisms
This study utilizes a DiD approach to evaluate the impact of the Dushanbe-Chanak motor road in Tajikistan. This method measures pre- and post-intervention changes for treatment (with project) and comparison (no project) regions. The analysis assumes that changes in both treatment and comparison groups are driven by fundamental factors such as GDP, business cycles, and others, while changes in treatment regions are attributed to the impact of the Dushanbe–Chanak road.
The Dushanbe–Chanak road crosses and links two regions, Dushanbe and Khujand, and crosses DRS. These three regions constitute our treatment regions. The remaining two regions, Khatlon and GBAO, constitute our comparison groups.
Our model includes six dependent variables (gross regional product, total local budget revenues, total expenditures, education expenditures, health expenditures, and retail trade turnover by region), three independent variables (investment volume, population, and employment). It also includes time- and region-specific dummies, a dummy for the Dushanbe–Chanak toll road (After) and a dummy for treatment regions (Treat). The estimated econometric model is as follows:
Yit = β0 + β1 Treati + β2 Treati x Aftert + β3 Zi + θi + μt + εit,
whereYit : dependent variables, such as regional GDP, local government
revenues, and expendituresTreati : dummy variable for the regions where the Dushanbe–Chanak
toll road is located (Sughd and Districts of Republican Subordination regions)
Aftert : dummy variable, equal to 1 for 2010–2017, when the Dushanbe–Chanak toll road has been operational, and zero otherwise
Zi : regional-level control variablesθi : regional-level fixed effectsμt : time effects
We first calculate real values of monetary variables by dividing nominal variables by the GDP deflator and then take logs. By adding the interaction term of the After and Treat variables, we are able to estimate DiD estimation of the impact of the Dushanbe–Chanak toll road on the dependent variables.
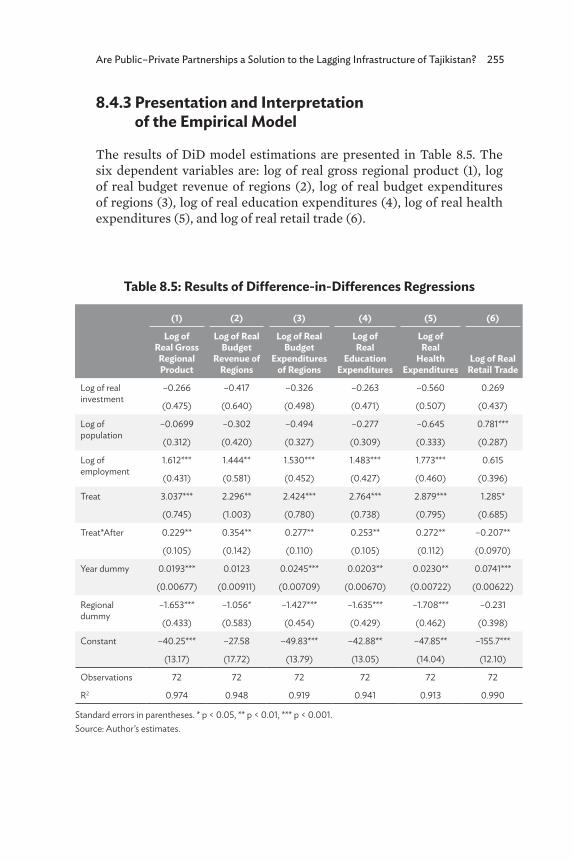
Are Public–Private Partnerships a Solution to the Lagging Infrastructure of Tajikistan? 255
8.4.3 Presentation and Interpretation of the Empirical Model
The results of DiD model estimations are presented in Table 8.5. The six dependent variables are: log of real gross regional product (1), log of real budget revenue of regions (2), log of real budget expenditures of regions (3), log of real education expenditures (4), log of real health expenditures (5), and log of real retail trade (6).
Table 8.5: Results of Difference-in-Differences Regressions
(1) (2) (3) (4) (5) (6)
Log of Real Gross
Regional Product
Log of Real Budget
Revenue of Regions
Log of Real Budget
Expenditures of Regions
Log of Real
Education Expenditures
Log of Real
Health Expenditures
Log of Real Retail Trade
Log of real investment
–0.266 –0.417 –0.326 –0.263 –0.560 0.269
(0.475) (0.640) (0.498) (0.471) (0.507) (0.437)
Log of population
–0.0699 –0.302 –0.494 –0.277 –0.645 0.781***
(0.312) (0.420) (0.327) (0.309) (0.333) (0.287)
Log of employment
1.612*** 1.444** 1.530*** 1.483*** 1.773*** 0.615
(0.431) (0.581) (0.452) (0.427) (0.460) (0.396)
Treat 3.037*** 2.296** 2.424*** 2.764*** 2.879*** 1.285*
(0.745) (1.003) (0.780) (0.738) (0.795) (0.685)
Treat*After 0.229** 0.354** 0.277** 0.253** 0.272** –0.207**
(0.105) (0.142) (0.110) (0.105) (0.112) (0.0970)
Year dummy 0.0193*** 0.0123 0.0245*** 0.0203** 0.0230** 0.0741***
(0.00677) (0.00911) (0.00709) (0.00670) (0.00722) (0.00622)
Regional dummy
–1.653*** –1.056* –1.427*** –1.635*** –1.708*** –0.231
(0.433) (0.583) (0.454) (0.429) (0.462) (0.398)
Constant –40.25*** –27.58 –49.83*** –42.88** –47.85** –155.7***
(13.17) (17.72) (13.79) (13.05) (14.04) (12.10)
Observations 72 72 72 72 72 72
R2 0.974 0.948 0.919 0.941 0.913 0.990
Standard errors in parentheses. * p < 0.05, ** p < 0.01, *** p < 0.001.Source: Author’s estimates.
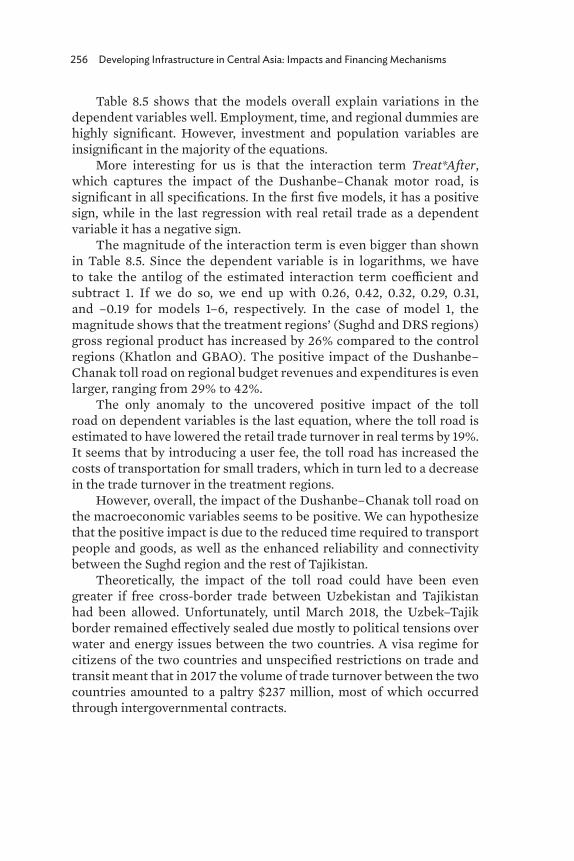
256 Developing Infrastructure in Central Asia: Impacts and Financing Mechanisms
Table 8.5 shows that the models overall explain variations in the dependent variables well. Employment, time, and regional dummies are highly significant. However, investment and population variables are insignificant in the majority of the equations.
More interesting for us is that the interaction term Treat*After, which captures the impact of the Dushanbe–Chanak motor road, is significant in all specifications. In the first five models, it has a positive sign, while in the last regression with real retail trade as a dependent variable it has a negative sign.
The magnitude of the interaction term is even bigger than shown in Table 8.5. Since the dependent variable is in logarithms, we have to take the antilog of the estimated interaction term coefficient and subtract 1. If we do so, we end up with 0.26, 0.42, 0.32, 0.29, 0.31, and –0.19 for models 1–6, respectively. In the case of model 1, the magnitude shows that the treatment regions’ (Sughd and DRS regions) gross regional product has increased by 26% compared to the control regions (Khatlon and GBAO). The positive impact of the Dushanbe–Chanak toll road on regional budget revenues and expenditures is even larger, ranging from 29% to 42%.
The only anomaly to the uncovered positive impact of the toll road on dependent variables is the last equation, where the toll road is estimated to have lowered the retail trade turnover in real terms by 19%. It seems that by introducing a user fee, the toll road has increased the costs of transportation for small traders, which in turn led to a decrease in the trade turnover in the treatment regions.
However, overall, the impact of the Dushanbe–Chanak toll road on the macroeconomic variables seems to be positive. We can hypothesize that the positive impact is due to the reduced time required to transport people and goods, as well as the enhanced reliability and connectivity between the Sughd region and the rest of Tajikistan.
Theoretically, the impact of the toll road could have been even greater if free cross-border trade between Uzbekistan and Tajikistan had been allowed. Unfortunately, until March 2018, the Uzbek–Tajik border remained effectively sealed due mostly to political tensions over water and energy issues between the two countries. A visa regime for citizens of the two countries and unspecified restrictions on trade and transit meant that in 2017 the volume of trade turnover between the two countries amounted to a paltry $237 million, most of which occurred through intergovernmental contracts.
Are Public–Private Partnerships a Solution to the Lagging Infrastructure of Tajikistan? 257
8.5 Conclusion Tajikistan in recent years has significantly improved its business climate and created a legislative and institutional framework with the adoption of the PPP Law in 2012 and creation of the PPP Unit in 2013 under the State Committee on Investments and State Property Management. The PPP Law has been a significant improvement compared to the Law “On concessions”. However, there are still areas where the PPP Law can be improved in terms of risk sharing, transparency, and clarity. In addition, it does not allow a private partner to bring in international arbitration in the case of disputes with a public partner. Instead, disputes would be considered by the PPP Council, consisting of senior Tajik government officials, leaving a lot of questions regarding the objectivity of the dispute settlement mechanism in the PPP Law.
Adoption of the PPP Law and creation of the PPP Unit have not led to a stream of projects in the infrastructure sector. Big infrastructure projects have mostly been awarded on a concessional basis, without a competitive process. The country might not be getting the best deal without a competitive process. To demonstrate that competition yields the best value for money, the PPP Unit can solicit proposals for smaller infrastructure projects from foreign and domestic investors.
The two infrastructure projects reviewed in this chapter, Pamir Energy and the Dushanbe–Chanak toll road, reveal the importance of transparency and public oversight. In the absence of transparency and public oversight, the risk for the public of getting a bad deal increases disproportionately. The Dushanbe–Chanak toll road is a typical example of a project where the public sector is loaded with risk and a private sector company is awarded monopoly rights over one of the most important transport arteries in the country. To avoid this kind of risk in the future, the country should make the decision-making process as transparent as possible.
Due to the heavy indebtedness of the country, ability of the Government of Tajikistan to finance infrastructure projects through debt financing is limited. Therefore, PPP schemes, where private investors will bring necessary financing and deal with risks associated with the project, are attractive to the government. Each successfully executed PPP project improves Tajikistan’s image in international capital markets and relieves the government from taking on unnecessary debt obligations.
258 Developing Infrastructure in Central Asia: Impacts and Financing Mechanisms
The capacity of the government to implement large-scale PPP projects in the infrastructure sector is limited, therefore it should cooperate with international financial institutes. Through this kind of cooperation, the government can learn to utilize different project finance modes, such as equity, credits, and grants, for infrastructure development.
In both case studies, the private partners have opted for the establishment of a special purpose vehicle for managing and operating a PPP project. Such special purpose vehicles make it possible to bring together many parties, including sponsors, bankers, government agencies, construction contractors, operation and maintenance operators, insurers, and guarantors. Under this modality of operations, the special purpose vehicles raise funds, manage project cash flow, and pay debt and investors’ dividends from the project revenue. The revenue of the project is generated from the fees charged for the service provided to either the public sector or civilians.
The experience of Tajikistan shows that, when properly designed, PPP projects can help address social issues such as uninterrupted access to electricity, reduction of fatalities and road accidents, empowerment, social protection, and other problems.
Complex PPP arrangements in the infrastructure sector bear high transaction costs and internal capacity constraints, and as such are not suitable for all projects. Extra caution should be exercised when dealing with projects that have large user fees or use taxpayer money. Therefore, the public should be properly informed and fiscal risks associated with large infrastructure projects must be properly assessed and monitored.
Are Public–Private Partnerships a Solution to the Lagging Infrastructure of Tajikistan? 259
ReferencesAsian Development Bank (ADB). n.d. Access to Green Finance Project
(RRP TAJ 45229), Supplementary Document 16: Private Sector Development Roadmap. https://www.adb.org/sites/default/files /linked-documents/45229-001-taj-oth-03.pdf (accessed 5 November 2018).
de Vera Garcia, E. 1984. The Impact of Rural Roads. Philippine Journal of Development. XI (1-f ). Philippine Institute for Development Studies.
European Bank for Reconstruction and Development (EBRD). 2008. EBRD Assessment of the Quality of Concession Legislation in Tajikistan, 2008. https://www.ebrd.com/documents/legal-reform /tajikistan-ppps-concessions-assessment-2008.pdf.
Escobal, J., and C. Ponce. 2003. The Benefits of Rural Roads. Enhancing Income Opportunities for the Rural Poor [Documentos de Trabajo] (Tech. Rep.). Grupo de Análisis para el Desarrollo (GRADE): Updated 2009. 36.
Gibson, J., and S. Rozelle. 2003. Poverty and Access to Roads in Papua New Guinea. Economic Development and Cultural Change. 52 (1). pp. 159–85.
International Monetary Fund. 2015. Article IV Consultation with Tajikistan. Press Release No. 15/268, 9 June, Washington, DC.
Jalan, J., and M. Ravallion. 1998. Are There Dynamic Gains from a Poor-Area Development Program? Journal of Public Economics. 67 (1). pp. 65–85.
____. 2002. Geographic Poverty Traps? A Micro Model of Consumption Growth in Rural China. Journal of Applied Econometrics. 17. pp. 329–46.
____. 2003. Does Piped Water Reduce Diarrhea for Children in Rural India? Journal of Econometrics. 112 (1). pp. 153–73.
Khandker, S.R., Z. Bakht, and G.B. Koolwal. 2006. The Poverty Impact of Rural Roads: Evidence from Bangladesh. Policy Research Working Paper Series (Tech. Rep.). Washington, DC: World Bank.
Knoema. n.d. Tajikistan – Average Consumer Prices Inflation Rate. https://knoema.com/atlas/Tajikistan/Inflation-rate.
Lokshin, M., and R. Yemtsov. 2003. Evaluating the Impact of Infrastructure Rehabilitation Projects on Household Welfare in Rural Georgia. Policy Research Working Paper Series (Tech. Rep. No. 3155). Washington, DC: World Bank.
Organisation for Economic Co-operation and Development (OECD). 2012. Principles for the Public Governance of Public–Private Partnerships. Paris: OECD.
260 Developing Infrastructure in Central Asia: Impacts and Financing Mechanisms
Rostow, W.W. 1962. The Stages of Economic Growth. The Economic History Review, New Series. 12 (1 (1959)). pp. 1–16.
Stifel, D., and B. Minten. 2008. Isolation and Agricultural Productivity. Agricultural Economics. 39 (1). pp. 1–15.
Trend News Agency. 2018. Tajikistan Needs Nearly $3B for Development of Transport Infrastructure. 12 June. https://en.trend.az/casia /tajikistan/3369538.html.
United Nations Conference on Trade and Development. 2016. The Investment Policy Review of Tajikistan. Geneva. https://unctad.org/en/PublicationsLibrary/diaepcb2016d1_en.pdf (accessed 20 October 2018).
United Nations Economic Commission for Europe. 2013. National PPP Readiness Assessment Report: Tajikistan. November. https://www .unece.org/fileadmin/DAM/ceci/documents/UNDA_project/PPP _Readiness_Assessment_Tajikistan.pdf.
van de Walle, D., and R. Mu. 2011. Rural Roads and Local Market Development in Vietnam. Journal of Development Studies. 47 (5). pp. 709–34.
World Bank Group. 2018. Tajikistan Systematic Country Diagnostic Making the National Development Strategy 2030 a Success: Building the Foundation for Shared Prosperity. Report No. 126209-TJ, May. p. ix.
Yoshino, N., and M. Nakahigashi. 2000. Economic Effects of Infrastructure: Japan’s Experience after World War II. JBIC Review. 3. pp. 3–19.