Embed Size (px)
Citation preview
The effect of gender equality in education on
economic growth A study of developing countries in Asia
Lund University, Department of Economics
NEKH02 – Bachelor thesis, spring 2018
Author: Eline Kesti
Supervisor: Pontus Hansson
2
Abstract Gender equality is not only a human right, but is also suggested to have economic
benefits. One of the rights discriminated to girls, especially in developing countries, is
their right to education. The purpose of this thesis is to find the effect of gender
equality in education on economic growth in developing countries in Asia. An
economic growth model is modified to include a gender ratio variable and used to
find theoretical evidence for the relationship between gender equality in education
and economic growth. Theories indicate that educating girls increases the average
level of human capital as well as generates female-specific effects that contribute to
economic growth. Panel data for 18 countries is used for linear and nonlinear
regression analysis. Data from 1970 to 2015 is divided into five-year periods to find
the relationship between gender equality in education and economic growth. Both the
level of gender equality and the growth rate of gender equality in education are
explored as factors of economic growth. The regression analysis implies that a more
gender equal education or a higher growth rate of gender equality benefits GDP per
capita growth.
Key words: economic growth, gender equality, education
3
Table of Contents1 Introduction.........................................................................................................................................4
1.1 Background................................................................................................................................................41.2 Scope of the study...................................................................................................................................51.3 Thesis purpose..........................................................................................................................................61.4 Disposition.................................................................................................................................................7
2 Previous empirical research...........................................................................................................83 Theory................................................................................................................................................11
3.1 Technology transfer model................................................................................................................113.2 Modified technology transfer model with gender equality.....................................................123.3 The possible effects of education on economic growth...........................................................14
4 Data.....................................................................................................................................................174.1 Countries..................................................................................................................................................174.2 Dependent variable..............................................................................................................................174.3 Independent variables..........................................................................................................................184.4 Control variables...................................................................................................................................18
5 Method...............................................................................................................................................205.1 Linear regression..................................................................................................................................205.2 Nonlinear regression............................................................................................................................215.3 Endogeneity............................................................................................................................................215.4 Multicollinearity...................................................................................................................................225.5 Autocorrelation......................................................................................................................................225.6 Stationarity..............................................................................................................................................235.7 Heteroscedasticity................................................................................................................................235.8 Normal distribution of error terms..................................................................................................235.9 Omitted variables..................................................................................................................................24
6 Results................................................................................................................................................25
7 Discussion.........................................................................................................................................297.1 Problems..................................................................................................................................................32
8 Conclusion........................................................................................................................................34References............................................................................................................................................36
Data sources...................................................................................................................................................37Appendix 1...........................................................................................................................................39Appendix 2...........................................................................................................................................41
Appendix 3...........................................................................................................................................43
4
1 Introduction
1.1 Background
Being born a girl is still today a reason for discrimination, thereby affecting the
economic, social and political opportunities of half of the world’s population. Of
those living in poverty, women are the most affected as their needs and rights are
prioritized last when families deal with scarce resources. Gender equality itself is an
important and legitimate goal, but it also has many positive multiplier effects that
benefit global growth and development. Equal education for girls is one step towards
gender equality.
One of the rights discriminated to girls is their access to education. Girls have the
possibility of receiving equal access to education in less than 40 percent of all the
world’s countries (UNESCO, 2014). The United Nations Development Programme
(UNDP) has presented 17 goals to promote sustainable growth and ending all poverty,
called the Sustainable Development Goals. The fourth goal included is “quality
education” and the fifth “gender equality”, signifying the importance the UN places
on these issues for achieving global development (United Nations, 2015). The targets
include provision of equal access to free, quality primary and secondary education for
boys and girls by 2030.
Overall, increasing the level of education has positive effects on efficiency and
development. On the individual level education improves the chances of employment
and reduces poverty as well as contributes to better health (World Bank, 2018, p.39).
From society’s point of view education is beneficial through increased productivity,
long-run development and faster rate of economic growth. In low and middle-income
countries that are further behind in technological progress education can boost
economic growth faster through helping the countries adapt to and use the existing
technology (World Bank, 2018, p.42). These facts alone are a reason for increasing
the access and level of education to both genders.
Educating girls gives not only the above-mentioned benefits, but also female-specific
external effects, such as decreasing fertility and child mortality rates, as well as
5
benefits on children’s health and education (Gakidou, et al., 2010, p.969; World
Bank, 2012b, p.151).
Human capital is an essential element for economic growth. It is the source of
productivity as well as the basis for technological innovation, thereby being a crucial
factor for economic growth models. According to the Organisation for Economic
Cooperation and Development (OECD) the average annual GDP growth rate would
be 0.7 percentage points higher if all countries reached a minimum of 400 points on
PISA (2010, pp.26-27).
The returns to education are closely linked to institutional factors such as rule of law,
property rights and employment opportunities (World Bank, 2018, p.44). Gender
discriminating norms are a factor that limits the returns to education. Women often
have more restricted economic opportunities compared to men and experience
horizontal and vertical segregation (World Bank, 2018, p.44). Social norms can lead
to these issues becoming self-perpetuating. The empowerment of women is a
prerequisite for creating an economy where education can be used efficiently by both
genders and thereby the full benefits of it can be absorbed.
1.2 Scope of the study
This paper focuses on the economic effect of gender equality in education in
developing countries in Asia. These restrictions are taken in order to find more
specific effects and explain growth for a specific group of countries. Because of these
restrictions the compared countries are more alike each other in aspects such as
culture and economic conditions and therefore the comparisons are more reliable.
Cedric Chebab, the head of global strategy for BMI Research, says “By 2030, Asia
will account for the largest share of global GDP at around 40 percent” (Fensom,
2017). Asia makes up for over half of the world population and its continuous growth
gives an additional push for the region’s economy. Asia is thus growing towards
becoming an increasingly important actor in the global economy.
Among the challenges Asia’s long-term economic growth is facing are the aging
population and slow improvement of productivity (IMF, 2017, pp.47-52). The fact
that Asia, apart from some of its developed countries, has not been successful at
6
meeting the global technological advances is harmful directly for the productivity
growth as well as indirectly through lower foreign direct investments. In the 1970s
two thirds of the world’s children without access to education lived in Asia (Asian
Development Bank, 2018). Therefore, improving girls’ education can partly be a
solution to the issue. Mentionable projects for promoting education in Asia have been
the Karachi Plan and the Asian Development Bank’s work in the education sector
since the 1960s. Yet there still exist large gender inequalities.
Other empirical research, such as Klasen’s (1999), focus on Africa in order to find
region specific outcomes and find positive economic effects of gender equality. It is
therefore interesting and meaningful to test if similar results can be found in other
regions. Outcomes that support gender equality would strengthen the overall
conclusion of gender equality promoting economic growth.
More specifically, developing countries are chosen for the empirical analysis. This
restriction is done due to the belief that developing countries often have larger
differences in gender inequality, and the effects of it therefore could be better
detected. It can also be argued that some of the female-specific effects, such as
mothers’ influence on children’s education and health, are larger due to the gender
norms typically present in developing countries.
1.3 Thesis purpose
Gender equality by itself is an important target because of the equal worth of all
humans, but could the empowerment of women also be economically beneficial?
Proving that gender equal education promotes economic growth would be a strong
argument for combatting gender inequality in education. Female education can also
be seen as one of the main indicators for gender equality and the empowerment of
women.
The purpose of this thesis is to find out how gender equality in education affects
economic growth. The research question is as follows: how does gender equality in
education affect economic growth in developing countries in Asia?
An empirical study is done in order to attempt to answer the research question. The
research question is explored through regression analysis with panel data from
7
developing countries in Asia from 1970 to 2015, divided into five-year periods. The
hypothesis of the empirical study is that gender equality in education has a positive
effect on GDP per capita growth.
1.4 Disposition
A brief summary of previous empirical research is given in the following chapter. The
previous studies help to understand what kind of relationship between gender equality
and economic growth the existing research points at. It explains how the previous
research has been conducted, giving ideas as well as thoughts for improvement.
Chapter three explains the theories that are used to investigate the relationship. A
technology transfer model is explained to lay a foundation for how to analyse
economic growth in developing countries. The model is modified by including gender
equality in education to fully fit the research question. Channels through which
education affects economic growth are described in order to understand both direct
and indirect, as well as overall and gender specific effects of education on GDP per
capita growth.
The data used in the empirical study is presented in chapter four. After that the
method for this paper is explained. This is done to give clarity in how the upcoming
results are obtained and to explain the regression process. Both linear and nonlinear
regression models are shown and econometric issues are lifted and solutions
presented.
In chapter six the results are presented in a table as well as verbally. The results are
discussed and evaluated in the following chapter. The results and conclusions are
compared to previous research and connected to policy ideas. An overview of the
paper and its main results are given in the conclusion in chapter eight.
8
2 Previous empirical research
Klasen (1999) investigates the effects of gender inequality in education on economic
growth in developing countries through cross-country and panel regressions. He uses
cross-country data to find the effects of gender bias and education on GDP per capita
growth rate between 1960 and 1992. The regressions used by Klasen measure gender
education with two variables: the female-male ratio of total years of school and the
annual growth in total years of schooling, both as average growth rates as well as
initial levels. To catch the indirect effects of educating girls he includes the variables
population growth, rate of labour force growth, investment rate and the growth in the
share of females in the formal sector. Klasen also does a panel regression with 10-
year periods in order to tackle the causality issue. The regressions are made on a
sample of 109 countries of varying income levels as well as on a sample of African
countries to see regional effects. The paper comes to the conclusion that gender
inequality has a negative effect on income per capita through the direct as well as the
indirect effects. The results indicate that if Sub-Saharan Africa and South Asia had
more gender equal education in the 1960s their annual economic growth would have
been 0.9 percentage points higher. Klasen also finds strong correlations between
gender equality in education and reduced child mortality and fertility.
Klasen continues his study later together with Lamanna (2009) using more recent data
from 1960 to 2000. The same empirical method is used with a special focus on
Middle East, Northern Africa and South Asia. They come to the same conclusion as
before, suggesting that gender inequality in education reduces economic growth. The
results imply that different growth rates between regions are increasingly explained
by gender inequality.
Dollar and Gatti (1999) investigate whether it is economically efficient for developing
countries to invest less in girls’ education, coming to a similar positive conclusion
while using shorter time periods. They also examine the existence of social and
cultural preferences for gender inequality as well as explore the possible market
failures that lead to the under-investment of girls’ education. The regressions are done
for 127 countries with 5-year periods from 1975 to 1990. Dollar and Gatti found a
convex relationship between female education and income. For low and lower middle
9
income countries there is no relationship found between the two variables. The effect
of female education on income is however strong in countries with middle or high-
income status. The results can be interpreted as the greater need for higher skill-level
of human capital in industrialized economies compared to developing countries where
agriculture societies are more dominant. The article points out the cultural, regional
and religion-related factors that all affect the investment decision of female education
and includes them in the regression. Dollar and Gatti use a panel growth regression to
find the effects of gender inequality on income. For measuring gender inequality in
education they use differential secondary school achievement. They come to the
conclusion that gender inequality in education impedes economic growth. A one
percent increase in the share of females with secondary education is found to increase
economic growth by 0.3 percentage points. There is therefore a positive relationship
between the variables, with gender equality in education increasing economic growth
and higher income growth benefiting gender equality.
Barro and Lee (1994) use average years of schooling and cross-country regression
with instrumental variables for the periods 1965-1975 and 1975-1985. They come to
the surprising conclusion that growth rate of male schooling is more essential than
that of female schooling for economic growth. Female secondary attainment is found
to have a negative effect on GDP per capita growth. Barro and Lee suggest that this
implies an economy at a very low-income level, and thereby shows high growth
potential.
Knowles, Lorgelly and Owen (2002) introduce a more model-based technique for
investigating the issue of gender inequality in education and economic growth. They
research the effects of female education on productivity in the long run. They present
a modified version of the Solow growth model where they distinguish between female
and male education. They find female education to have a statistically significant
positive effect on productivity but cannot come to the same conclusion for male
education. Hence, they conclude that gender gaps reduce economic development in
the long run.
The differences in results may be due to some papers measuring short-run growth
while others focusing on long-run growth. The variable of gender inequality in
education is also differently measured in the different papers and therefore can give
varying outcomes. This paper focuses on measuring the effect of gender equality

10
through the use of gender ratio in enrolment of secondary schooling and with five-
year periods and lags to see long-term results on GDP per capita growth.
11
3 Theory
Fundamental economic questions that have been discussed through ages are those of
why some countries are rich while others are poor and what drives economic growth.
Different economic models, both endogenous and exogenous, have been introduced to
answer the questions. For investigating the effect of gender in human capital, a
modified technology transfer model is presented to enlighten the research question of
how gender equality affects economic growth. There are also several paths through
which education, especially that of women, affects economic growth. Full
calculations of the equations can be found in appendix 1.
3.1 Technology transfer model
The technology transfer model is applicable for developing countries that use and
adapt to the existing technology rather than develop new1. It focuses on the transfer of
technology from the technology-advancing countries to those that adapt to the
progress. Fundamental assumptions in the model are that more skilful labour force
can use more advanced technology, and that this in turn provides a larger range of
input. The model has the following Cobb-Douglas production function:
𝑌 = 𝐾! ℎ𝐿 !!!
The production function shows how GDP (Y) depends on capital (K), human capital
(h) and labour (L). In the model human capital is measured as the amount of goods an
individual has the skills for producing. Human capital accumulation looks as follows:
ℎ = 𝜇𝑒!"𝐴!ℎ!!!
Where 𝜇 represents the productivity in the education sector as well as other
unmentioned factors such as socio-cultural aspects and openness. The quality of
education is measured by 𝜓 and the amount of time spent in education by 𝑢 .
𝐴 denotes the world leading technology level and 𝛾 stands for the importance of the
world level of technology compared to the country’s own. The technology is assumed
to growth at a constant rate, g:
1 Jones and Vollrath (2013, pp.140-148) are used as a reference for the whole chapter.
12
𝐴𝐴 = 𝑔
In steady state the rate of GDP per capita growth rate is equal to the human capital
and technological growth rate (gy = gh = gA). The human capital growth rate depends
on the productivity and quality of education, years of education, the technology gap
and the importance of the world technology compared to the country’s own.
Increasing any of these factors thereby creates economic growth. The larger the
difference between the country’s own technology level and the world technology
front, the faster the growth in human capital will be, hence increasing the economic
growth rate.
All countries converge towards their own steady state level in the long run, which can
differ for countries depending on their productivity, quality and amount of education.
According to the model all countries grow at the same speed because of the transfer of
world technology, thereby leading to conditional convergence. In steady state GDP
per capita is defined as following:
𝑦 =𝑠
𝑛 + 𝑔 + 𝛿
!!!!
𝜇𝑒!"
𝑔
!!𝐴
GDP per capita depends on capital accumulation, human capital as well as the world
technology. Technology has to be adapted to the country’s conditions and needs, as
some technology might not be relevant due to the lack of skills or inability to combine
it with the existing processes. Increasing the productivity, quality or quantity of
education thereby results in a higher GDP per capita.
3.2 Modified technology transfer model with gender equality
In order to analyse the effects of gender inequality in education a gender ratio variable
can be included in the technology transfer model. Klasen (1999) uses a gender ratio
variable in his empirical analysis in order to measure gender inequality. This idea was
applied to the technology transfer model in order to see the theoretical effects of
gender equality in education. The effects of education are measured in the human
capital variable by including a ratio of females to males in enrolled in education, as
following:
13
ℎ = 𝜇𝑒!"𝐴!ℎ!!!𝑠!𝑠!
Where the average female enrolment in education is denoted by 𝑠! and the average
male enrolment by 𝑠!. The closer the ratio is to one the larger the effect on human
capital. The restriction of this is that a gender bias towards females creates a positive
effect, which is incorrect if trying to achieve equality. It can however be assumed that
since the model is in this paper used for developing countries that such gender bias is
not as common as bias toward males and should therefore not cause too misleading
results. A possible way to correct this is to switch the variables for female and male
schooling if the education is female biased.
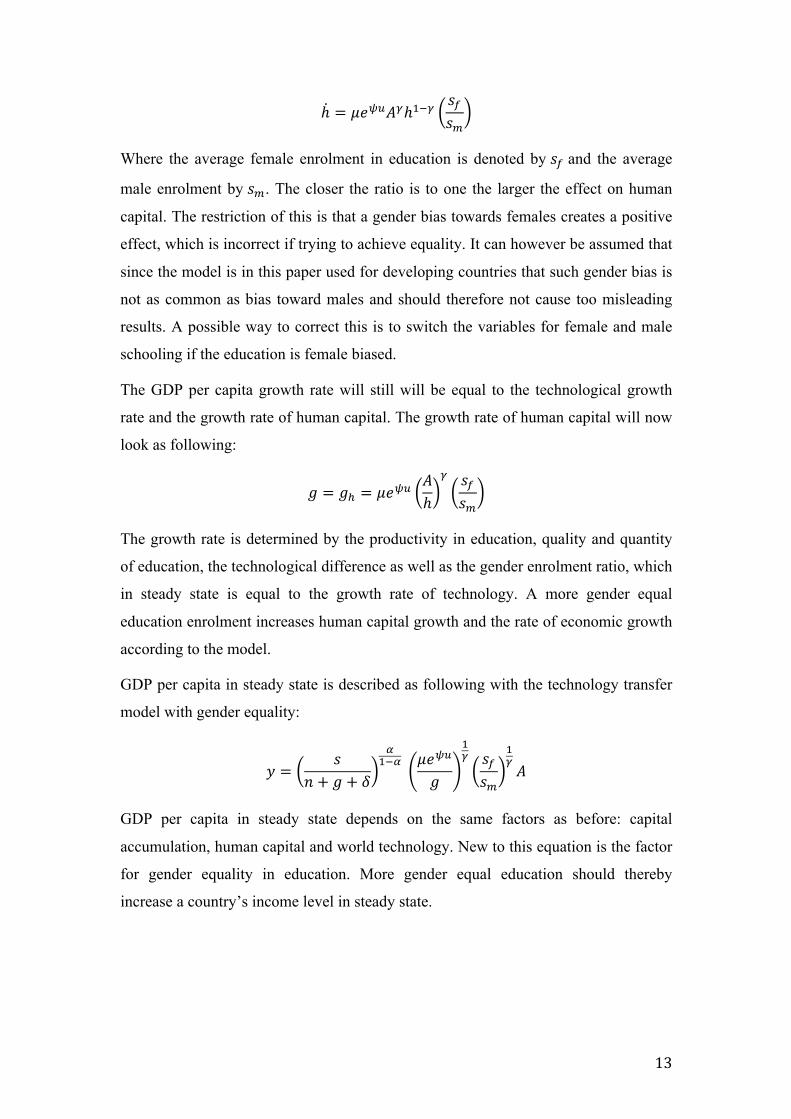
The GDP per capita growth rate will still will be equal to the technological growth
rate and the growth rate of human capital. The growth rate of human capital will now
look as following:
𝑔 = 𝑔! = 𝜇𝑒!"𝐴ℎ
! 𝑠!𝑠!
The growth rate is determined by the productivity in education, quality and quantity
of education, the technological difference as well as the gender enrolment ratio, which
in steady state is equal to the growth rate of technology. A more gender equal
education enrolment increases human capital growth and the rate of economic growth
according to the model.
GDP per capita in steady state is described as following with the technology transfer
model with gender equality:
𝑦 =𝑠
𝑛 + 𝑔 + 𝛿
!!!!
𝜇𝑒!"
𝑔
!! 𝑠!𝑠!
!!𝐴
GDP per capita in steady state depends on the same factors as before: capital
accumulation, human capital and world technology. New to this equation is the factor
for gender equality in education. More gender equal education should thereby
increase a country’s income level in steady state.
14
3.3 The possible effects of education on economic growth
Education of both genders increases the overall productivity of labour force and
creates a more knowledge based economy and society (World Bank, 2018, pp.38-39).
Skills acquired through education can be used to utilize more advanced technology as
assumed in the technology transfer model, which increases the economy’s
productivity and gives increased returns to capital. By educating more children the
available human capital is more effectively used and the average quality of human
capital increases. This is assuming that increasing girls’ education does not decrease
the education amount available to boys. Increased education thus results in economic
growth.
It can, realistically, be assumed that women and men have the same average innate
intelligence levels, as suggested by Stenberg and Kaufman (2011, p.266) among
others. Thus there arises the question of why education is not equally provided to both
genders? Gender inequality in education in favour of boys would then mean that some
of the boys receiving education have a lower innate intelligence level compared to the
intelligence level of the next girl in line for receiving education. Thus, education is
not efficiently distributed to the available human capital and therefore the full
capacity of the educational benefits cannot be reached. This is called the selection-
distortion factor and leads to a lower average competence of the labour force, unless
males and females are not perfect substitutes in labour force activities (Klasen, 1999,
p.8). The ineffective use of human capital results in a lower rate of return to capital,
and hence lower economic growth.
Gender inequality in education also decreases labour productivity by diminishing
girls’ possibilities of using technology and thereby diminishing the work they are able
to produce. According to the World Bank (2012a, p.3), output per worker could be
increased by 7-18 percent in the East Asia and Pacific region, if females worked in
the same sectors, types of jobs and activities as men and had equal access to
productive resources. The economy’s resources are used inefficiently, resulting in less
than potential economic growth. It is therefore important to achieve gender equality in
education even if the amount of total education available for provision cannot be
increased.
15
Educating girls has many multiplier effects, one of them being the environment effect.
By educating a girl you educate a future family as educated mothers have a higher
impact on the children’s education and well being than educated fathers (Klasen,
1999, p.8). Mothers, especially in developing countries where their roles are often in
the home taking care of the children, are more likely to pass along knowledge to the
children. They are also more likely to prioritize the children’s quantity and quality of
education if they have experienced the benefits themselves. Women’s empowerment
and education have positive effects on children’s health and level of education,
resulting in positive intergenerational correlation (World Bank, 2012b, p.151).
Families where women have a bigger voice in household spending have been found to
increase expenditures on food and increase years of schooling for the children. This
promotes the productivity of the future labour force and consequently economic
growth. Similarity in education level between siblings can also strengthen the benefits
of education (Klasen, 1999, p.8).
Mothers that are educated receive more respect and decision power in the family,
which has been proven to reduce poverty and increase productivity (Morrison, Raju &
Sinha, 2007). Bloom and Williamson (1998) explained that educated women are able
to earn more and thereby save more. “Providing girls one extra year of education
beyond the average boosts eventual wages by 10-20 percent” (Herz & Sperling, 2004,
p.3). We can from the previous arguments understand that women use their savings
competently, and this therefore leads to economic growth. Increased savings is a
factor of economic growth in many growth models, such as the technology transfer
model.
Klasen (1999, p.9) also explains the indirect demographic transition effect of female
education. Educating women causes declined fertility and child mortality. A similar
result was presented by Gakidou et al. (2010, p.969), who conclude that child
mortality decreases by 9.5 percentage points for an additional year of schooling of
women of reproductive age. The declined fertility generates demographic effects as
the working force has lower youth dependency and more possibilities for joining the
labour force, contributing to higher savings and production. This results in economic
growth and increased investments during a couple of decades. These decades of
demographic transition with a higher investment demand need to be met with higher
16
domestic savings or capital inflow as well as employment opportunities in order to
benefit from the possible growth effects.
The female-specific effects can be argued to have larger outcomes in developing
countries due to the position females often have in the societies. Due to the
construction of the economic society and the norms in it women are often responsible
for domestic work. As women spend more time with the children it is reasonable that
their knowledge and decisions will be more beneficial for the next generation’s
education and well-being. Women’s labour force participation rate is globally lower
than men’s, with a gender gap of 29.5 percentage in the labour force participation in
2012 (Verick, 2014, p.3). Across developing countries the labour force participation
of women remains under 40 percent, with varying figures across Asia (p.4). Educating
women gives them a higher possibility of competing for jobs, although other
measures such as child care and norms also are needed for this to be able to happen.
With educated women joining the labour force productivity is increased and more
labour is available in the economy, resulting in economic growth. “Overall, women
receive higher returns to their schooling investments.” (Psacharopoulos & Patrinos,
2002, p.2). It can therefore be argued that the education of women is more beneficial
for economic growth than that of men, especially in developing countries.
17
4 Data
The data for this empirical study is in panel form in order to catch both time and
country specific effects. The data used is from well-known and widely used sources,
such as the World Bank Databank and Penn World Tables. They can be trusted to be
reliable data sources and unbiased towards specific countries or regions. However, as
with all data, there are possibilities of data errors and biases. All the used variables,
how they are calculated and data sources are fully explained in appendix 2.
4.1 Countries
The region chosen for this empirical study is Asia. The paper focuses on developing
countries since gender inequality often is larger in those countries and hence
improving equality could possibly have large effects. Countries are in this paper
classified as developing countries if they are low or lower middle income countries as
defined by the World Bank. The regression is done on 18 developing countries in
Asia from 1970 to 2015. See appendix 3 for full list of countries. Three countries
were omitted due to missing values for gender parity index.
4.2 Dependent variable
Economic growth is measured as gross domestic product (GDP) growth rate per
capita. GDP measures the value of total output of all production and services in a
country during a given time period. It is not a perfect measurement and only takes
into account economic factors, ignoring issues such as productivity, equality and
effects on the environment. It is however a commonly accepted and comparable
measure of economic growth. GDP per capita is used to measure the income level of a
country, as it is adjusted to the size of the population. The growth rate of GDP per
capita is hence a measure for the average increase in the income level of a country.
18
4.3 Independent variables
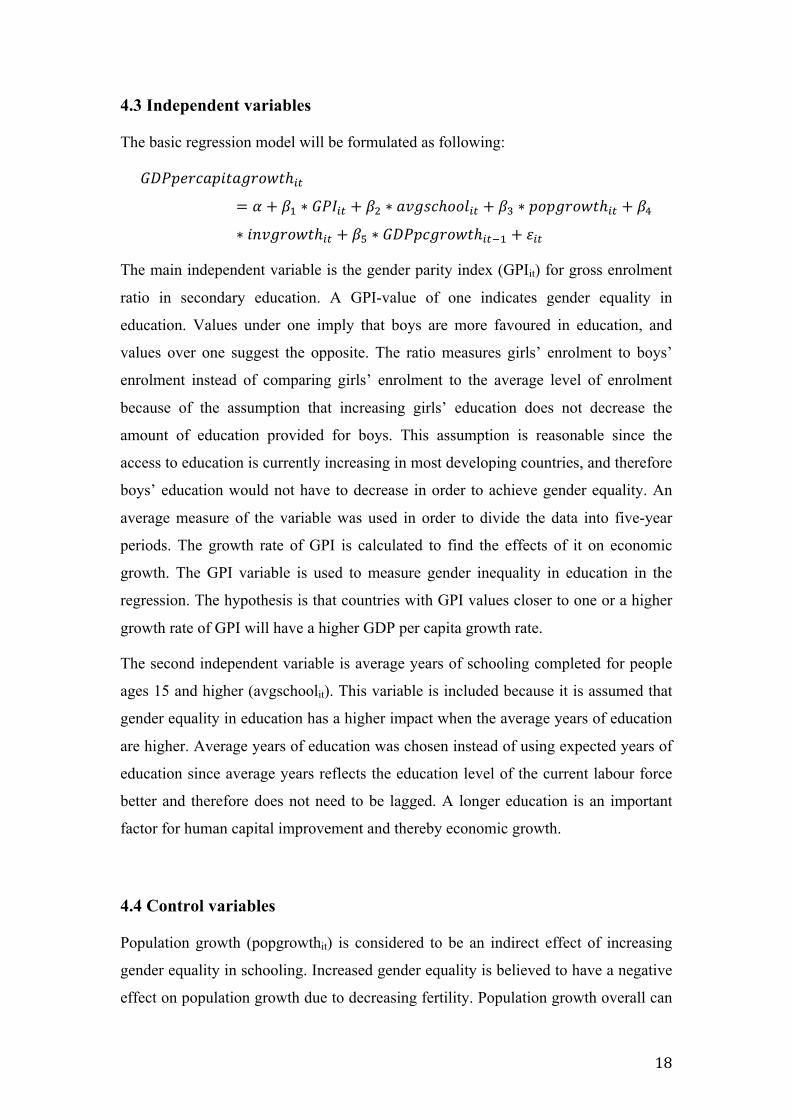
The basic regression model will be formulated as following:
𝐺𝐷𝑃𝑝𝑒𝑟𝑐𝑎𝑝𝑖𝑡𝑎𝑔𝑟𝑜𝑤𝑡ℎ!"= 𝛼 + 𝛽! ∗ 𝐺𝑃𝐼!" + 𝛽! ∗ 𝑎𝑣𝑔𝑠𝑐ℎ𝑜𝑜𝑙!" + 𝛽! ∗ 𝑝𝑜𝑝𝑔𝑟𝑜𝑤𝑡ℎ!" + 𝛽!∗ 𝑖𝑛𝑣𝑔𝑟𝑜𝑤𝑡ℎ!" + 𝛽! ∗ 𝐺𝐷𝑃𝑝𝑐𝑔𝑟𝑜𝑤𝑡ℎ!"!! + 𝜀!"
The main independent variable is the gender parity index (GPIit) for gross enrolment
ratio in secondary education. A GPI-value of one indicates gender equality in
education. Values under one imply that boys are more favoured in education, and
values over one suggest the opposite. The ratio measures girls’ enrolment to boys’
enrolment instead of comparing girls’ enrolment to the average level of enrolment
because of the assumption that increasing girls’ education does not decrease the
amount of education provided for boys. This assumption is reasonable since the
access to education is currently increasing in most developing countries, and therefore
boys’ education would not have to decrease in order to achieve gender equality. An
average measure of the variable was used in order to divide the data into five-year
periods. The growth rate of GPI is calculated to find the effects of it on economic
growth. The GPI variable is used to measure gender inequality in education in the
regression. The hypothesis is that countries with GPI values closer to one or a higher
growth rate of GPI will have a higher GDP per capita growth rate.
The second independent variable is average years of schooling completed for people
ages 15 and higher (avgschoolit). This variable is included because it is assumed that
gender equality in education has a higher impact when the average years of education
are higher. Average years of education was chosen instead of using expected years of
education since average years reflects the education level of the current labour force
better and therefore does not need to be lagged. A longer education is an important
factor for human capital improvement and thereby economic growth.
4.4 Control variables
Population growth (popgrowthit) is considered to be an indirect effect of increasing
gender equality in schooling. Increased gender equality is believed to have a negative
effect on population growth due to decreasing fertility. Population growth overall can
19
have either a positive impact on economic growth since a larger population can
produce more, or a negative impact due to the resource restrictions a large population
creates.
Investment (invgrowthit) is an important foundation for economic growth. Economic
growth requires spending on capital in order to enhance production and technology.
Increasing investments can also be seen as an indirect effect of more gender equal
education due to higher average human capital, which results in productivity and
higher returns to investment.
Lagged GDP per capita growth (GDPpcgrowthit-1) is included since it is likely that the
growth in GDP per capita is correlated with the previous growth rates. This
assumption is also supported by previous empirical research that includes lagged
economic growth as one of the explanatory variables of the current growth rate.
20
5 Method
All regression analyses are done with Eviews 10 student version.
5.1 Linear regression
The purpose of the regression analysis is to find the effect of gender equality in
education on GDP per capita growth. This is done with panel data for 18 countries
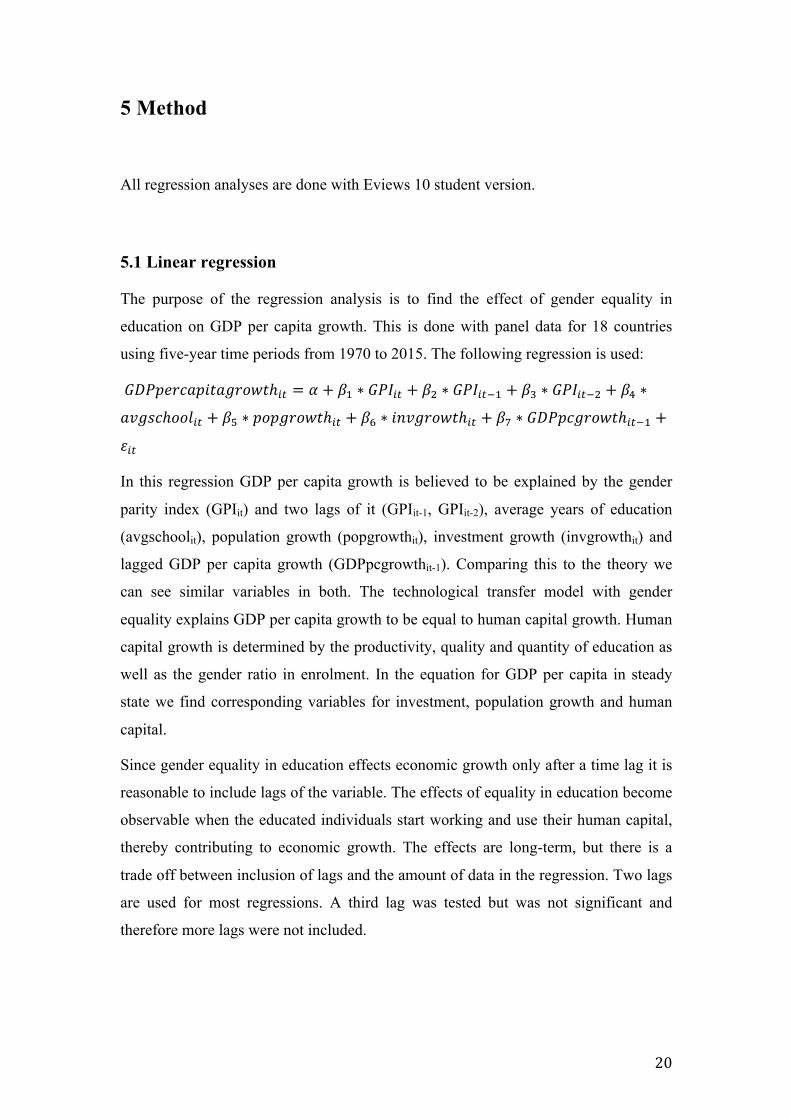
using five-year time periods from 1970 to 2015. The following regression is used:
𝐺𝐷𝑃𝑝𝑒𝑟𝑐𝑎𝑝𝑖𝑡𝑎𝑔𝑟𝑜𝑤𝑡ℎ!" = 𝛼 + 𝛽! ∗ 𝐺𝑃𝐼!" + 𝛽! ∗ 𝐺𝑃𝐼!"!! + 𝛽! ∗ 𝐺𝑃𝐼!"!! + 𝛽! ∗
𝑎𝑣𝑔𝑠𝑐ℎ𝑜𝑜𝑙!" + 𝛽! ∗ 𝑝𝑜𝑝𝑔𝑟𝑜𝑤𝑡ℎ!" + 𝛽! ∗ 𝑖𝑛𝑣𝑔𝑟𝑜𝑤𝑡ℎ!" + 𝛽! ∗ 𝐺𝐷𝑃𝑝𝑐𝑔𝑟𝑜𝑤𝑡ℎ!"!! +
𝜀!"
In this regression GDP per capita growth is believed to be explained by the gender
parity index (GPIit) and two lags of it (GPIit-1, GPIit-2), average years of education
(avgschoolit), population growth (popgrowthit), investment growth (invgrowthit) and
lagged GDP per capita growth (GDPpcgrowthit-1). Comparing this to the theory we
can see similar variables in both. The technological transfer model with gender
equality explains GDP per capita growth to be equal to human capital growth. Human
capital growth is determined by the productivity, quality and quantity of education as
well as the gender ratio in enrolment. In the equation for GDP per capita in steady
state we find corresponding variables for investment, population growth and human
capital.
Since gender equality in education effects economic growth only after a time lag it is
reasonable to include lags of the variable. The effects of equality in education become
observable when the educated individuals start working and use their human capital,
thereby contributing to economic growth. The effects are long-term, but there is a
trade off between inclusion of lags and the amount of data in the regression. Two lags
are used for most regressions. A third lag was tested but was not significant and
therefore more lags were not included.
21
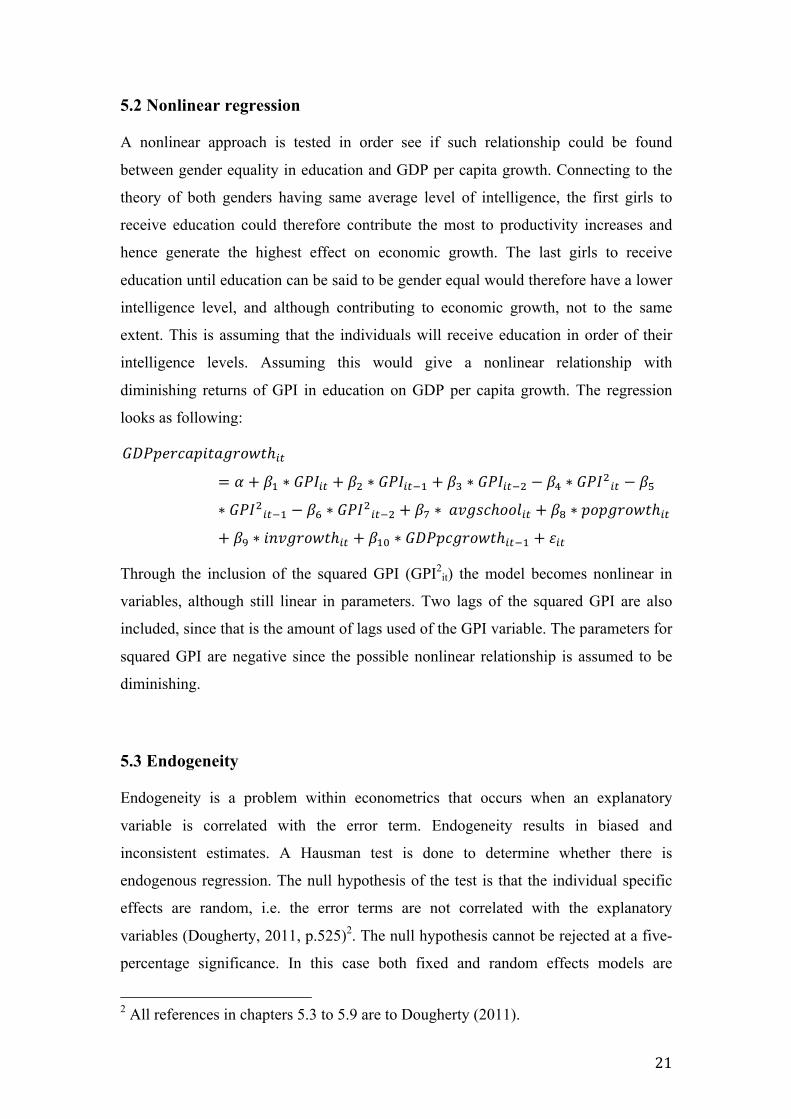
5.2 Nonlinear regression
A nonlinear approach is tested in order see if such relationship could be found
between gender equality in education and GDP per capita growth. Connecting to the
theory of both genders having same average level of intelligence, the first girls to
receive education could therefore contribute the most to productivity increases and
hence generate the highest effect on economic growth. The last girls to receive
education until education can be said to be gender equal would therefore have a lower
intelligence level, and although contributing to economic growth, not to the same
extent. This is assuming that the individuals will receive education in order of their
intelligence levels. Assuming this would give a nonlinear relationship with
diminishing returns of GPI in education on GDP per capita growth. The regression
looks as following:
𝐺𝐷𝑃𝑝𝑒𝑟𝑐𝑎𝑝𝑖𝑡𝑎𝑔𝑟𝑜𝑤𝑡ℎ!"= 𝛼 + 𝛽! ∗ 𝐺𝑃𝐼!" + 𝛽! ∗ 𝐺𝑃𝐼!"!! + 𝛽! ∗ 𝐺𝑃𝐼!"!! − 𝛽! ∗ 𝐺𝑃𝐼!!" − 𝛽!∗ 𝐺𝑃𝐼!!"!! − 𝛽! ∗ 𝐺𝑃𝐼!!"!! + 𝛽! ∗ 𝑎𝑣𝑔𝑠𝑐ℎ𝑜𝑜𝑙!" + 𝛽! ∗ 𝑝𝑜𝑝𝑔𝑟𝑜𝑤𝑡ℎ!"+ 𝛽! ∗ 𝑖𝑛𝑣𝑔𝑟𝑜𝑤𝑡ℎ!" + 𝛽!" ∗ 𝐺𝐷𝑃𝑝𝑐𝑔𝑟𝑜𝑤𝑡ℎ!"!! + 𝜀!"
Through the inclusion of the squared GPI (GPI2it) the model becomes nonlinear in
variables, although still linear in parameters. Two lags of the squared GPI are also
included, since that is the amount of lags used of the GPI variable. The parameters for
squared GPI are negative since the possible nonlinear relationship is assumed to be
diminishing.
5.3 Endogeneity
Endogeneity is a problem within econometrics that occurs when an explanatory
variable is correlated with the error term. Endogeneity results in biased and
inconsistent estimates. A Hausman test is done to determine whether there is
endogenous regression. The null hypothesis of the test is that the individual specific
effects are random, i.e. the error terms are not correlated with the explanatory
variables (Dougherty, 2011, p.525)2. The null hypothesis cannot be rejected at a five-
percentage significance. In this case both fixed and random effects models are
2 All references in chapters 5.3 to 5.9 are to Dougherty (2011).
22
consistent, but only random effects model is efficient. Random effects model is
therefore used for the regression (p.525).
5.4 Multicollinearity
Multicollinearity occurs when two or more explanatory variables are highly correlated
(pp.165-166). This results in large standard error terms and therefore makes it
difficult to draw conclusions from the regression analysis. An alternative to using the
ratio of girls’ education enrolment to boys’ as the measurement for gender equality in
education was using separate variables for girls’ and boys’ education enrolment. This
alternative would possibly have given more data to analyse in order to see the
differences in the different genders’ effects on economic growth. The decision to
instead use a ratio of the enrolment was made to avoid a multicollinearity issue in the
regression. For many developing countries both genders’ education enrolment levels
increased over time, and it would have been difficult to distinguish which caused an
effect and to what degree on GDP per capita growth. Therefore a ratio between girls’
and boys’ enrolment in secondary schooling is used to measure gender inequality in
education.
5.5 Autocorrelation
Autocorrelation is serial correlation within the error terms. If the error terms fluctuate
with another lagged error term this results in inconsistent errors in the regression. A
Durbin-Watson test is done to test for autocorrelation. For all methods the Durbin-
Watson value was below two, suggesting positive autocorrelation (pp.429-436).
Robust standard errors are used for correcting autocorrelation. This provides unbiased
standard errors for the coefficients. Robust standard errors are larger than the original
standard errors and therefore less efficient in that sense, though vital for correcting the
consistency of error terms.
23
5.6 Stationarity
Stationarity is a common requirement for regression and means that the mean and
variance of the data are independent of time and the covariance only depends on the
distance between the points (p.465). A common problem occurring with non-
stationary data is spurious regression, which is when the estimation produces
statistically significant relations between variables although no such relation exists
(p.475).
We can assume that the gender parity index and average years of schooling are
stationary, as they in the long run are realistically not expected to keep increasing. We
also know from previous world development trends that in the long run countries’
population growth slow down.
Stationarity can be tested with a unit root test where the null hypothesis is that the
data has a unit root, i.e. is not stationary (p.489). Investment-, population- and GDP
per capita growth show low p-values for the Levin-Lin-Chu panel data unit root test
and the null hypothesis can thereby be rejected.
5.7 Heteroscedasticity
Heteroscedasticity occurs when the error terms are correlated with the independent
variables, resulting in biased standard errors and inefficient estimates (pp.281-283).
Heteroscedasticity can be corrected by using robust standard error terms, which is
done with the used data in this regression.
5.8 Normal distribution of error terms
Normally distributed error terms are important for reliable estimates. To test for this
the Jarque Bera test was done. The test confirmed the assumption of normally
distributed error terms.
24
5.9 Omitted variables
Some variables are not used in the regression due to insufficient amount of data.
Institutions are believed to have an effect on economic growth, and a variable for rule
of law was supposed to be included in order to represent institutions in the regression.
Data for rule of law is however only available from 1990 onward and would therefore
not have contributed to the regression analysis. Due to the same reason the variables
for women’s labour force participation and quality of education are not included.
Women’s labour force participation would have been an important variable as it is
important that the educated women have the possibility of using their acquired
knowledge and contributing to economic growth through productivity and skills. The
quality of education would have been a relevant variable, as it would have enabled
better comparison between the countries’ educational levels.
These variables are considered relevant and omitting them therefore results in omitted
variable bias. It is possible that other variables not thought of also cause this bias.
This causes the results to be biased since the effects of the omitted variables are
shown in the included variables, resulting in misleading coefficients and analysis
(pp.252-254).
A variable that was thought to be of significance for the regression is the countries’
openness. This would have been measured as the growth in a country’s exports and
imports as a share of GDP. However, when performing an omitted variable test it
could be concluded that trade is not a significant variable and is therefore not included
in the regression.
25
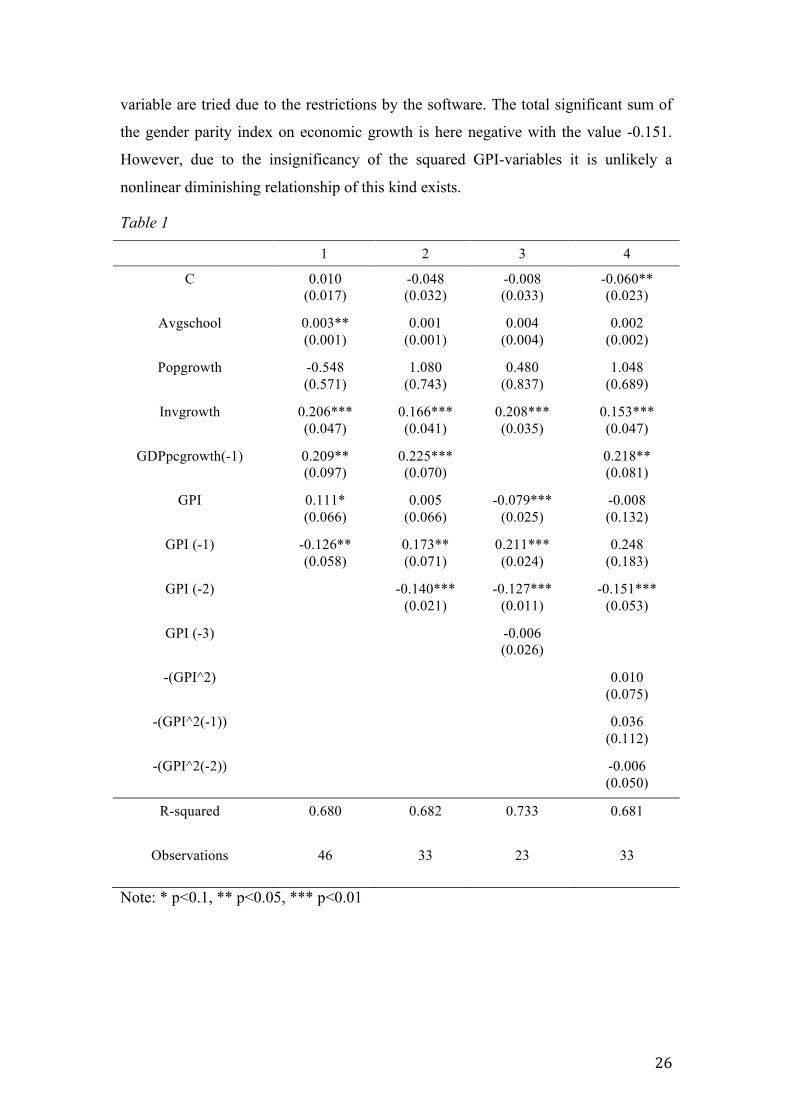
6 Results
In order to explore the effect of gender equality in education on economic growth
different regression models are used. First, linear and nonlinear regressions with
varying amount of lags are tested. After that the growth rate of the gender parity index
is used to explain economic growth.
The results from both linear and nonlinear regressions are shown below in table 1.
Models 1.1, 1.2 and 1.3 are linear with varying amount of lags and variables included
in order to see which factors possibly could enhance or affect the role of gender
equality in economic growth. Model 1.4 is nonlinear.
In model 1.1 we receive significant values for investment growth, lagged GDP per
capita growth and for the present and lagged gender parity indexes. The total
significant effect of gender equality in education (the sum of the lags) becomes
negative with a value of -0.015. This model is the only one in table 1 where average
years of schooling becomes significant and has a positive effect on GDP per capita
growth.
The added second lag of gender parity index became significant in model 1.2. Gender
parity index itself is expectedly not significant because education has a long-term
effect on economic growth, which appears through the addition of significant lags to
the model. The sum of the significant gender parity index values adds up to 0.033.
Surprisingly, neither population growth nor average years of schooling are significant.
Investment growth and lagged GDP per capita growth are positive and significant.
In model 1.3 another lag of the gender parity index is included to see more long-term
effects of gender equality in education on economic growth. The third lag does not
become significant, but the addition of it results in significance in the GPI variable.
The total sum of the significant coefficients is 0.005. Only investment growth
becomes significant out of the control variables. Lagged GDP per capita growth is not
included due to software restrictions.
In column 1.4 a nonlinear estimation is used but the coefficients for squared GPI are
not found significant. The lagged GDP per capita growth, investment growth and the
second lagged GPI-variable become significant. Only two lags of the squared GPI-
26
variable are tried due to the restrictions by the software. The total significant sum of
the gender parity index on economic growth is here negative with the value -0.151.
However, due to the insignificancy of the squared GPI-variables it is unlikely a
nonlinear diminishing relationship of this kind exists.
Table 1
1 2 3 4
C 0.010 (0.017)
-0.048 (0.032)
-0.008 (0.033)
-0.060** (0.023)
Avgschool 0.003** (0.001)
0.001 (0.001)
0.004 (0.004)
0.002 (0.002)
Popgrowth -0.548 (0.571)
1.080 (0.743)
0.480 (0.837)
1.048 (0.689)
Invgrowth 0.206*** (0.047)
0.166*** (0.041)
0.208*** (0.035)
0.153*** (0.047)
GDPpcgrowth(-1) 0.209** (0.097)
0.225*** (0.070)
0.218** (0.081)
GPI 0.111* (0.066)
0.005 (0.066)
-0.079*** (0.025)
-0.008 (0.132)
GPI (-1) -0.126** (0.058)
0.173** (0.071)
0.211*** (0.024)
0.248 (0.183)
GPI (-2) -0.140*** (0.021)
-0.127*** (0.011)
-0.151*** (0.053)
GPI (-3) -0.006 (0.026)
-(GPI^2) 0.010 (0.075)
-(GPI^2(-1)) 0.036 (0.112)
-(GPI^2(-2)) -0.006 (0.050)
R-squared 0.680 0.682 0.733 0.681
Observations 46 33 23 33
Note: * p<0.1, ** p<0.05, *** p<0.01
27
A regression with no lags for GPI was also done, but did not give any significant
results apart from a positive effect of investment growth on GDP per capita growth.
The results are therefore not included in the table.
Overall, the effect of gender equality in education is found to be positive in two out of
four models. Model 1.2, which can be argued to best represent the true relationship
due to the significance of the variables and highest R-squared value, gives a positive
relationship between gender equality in education and economic growth. Population
growth is not found significant in any of the columns, and average years of education
only in one. Investment growth and lagged GDP per capita growth are highly
significant in all models.
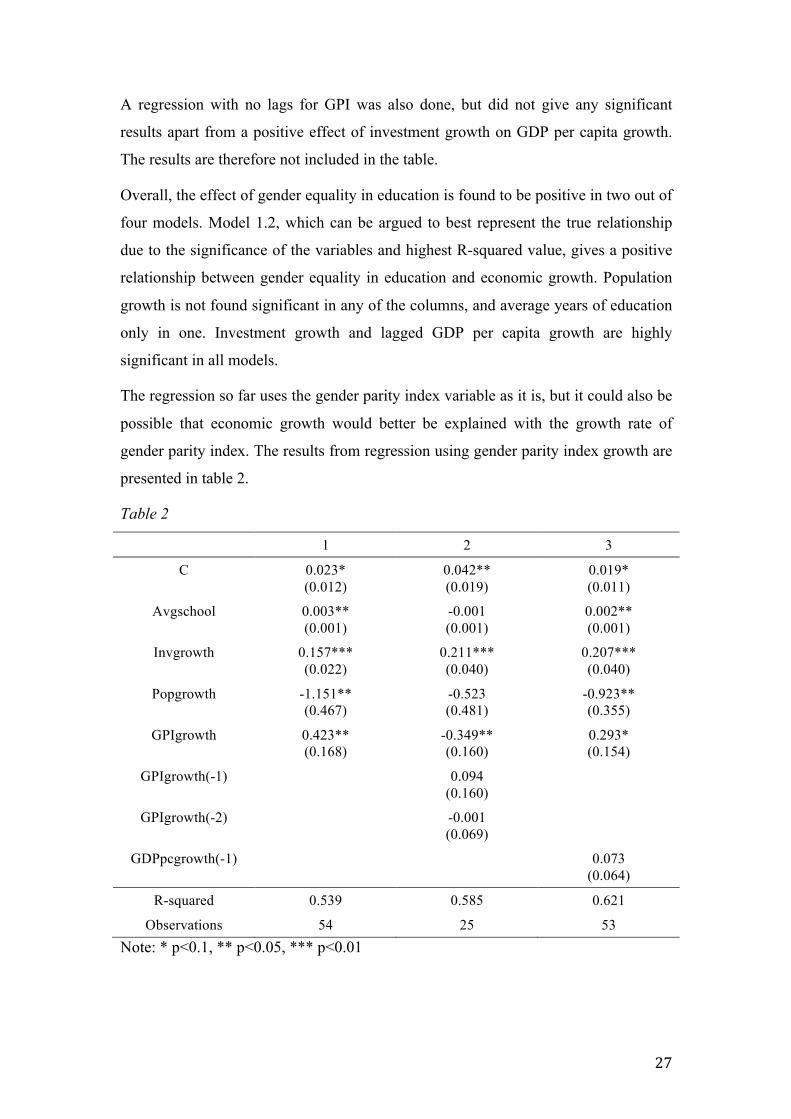
The regression so far uses the gender parity index variable as it is, but it could also be
possible that economic growth would better be explained with the growth rate of
gender parity index. The results from regression using gender parity index growth are
presented in table 2.
Table 2
1 2 3
C 0.023* (0.012)
0.042** (0.019)
0.019* (0.011)
Avgschool 0.003** (0.001)
-0.001 (0.001)
0.002** (0.001)
Invgrowth 0.157*** (0.022)
0.211*** (0.040)
0.207*** (0.040)
Popgrowth -1.151** (0.467)
-0.523 (0.481)
-0.923** (0.355)
GPIgrowth 0.423** (0.168)
-0.349** (0.160)
0.293* (0.154)
GPIgrowth(-1) 0.094 (0.160)
GPIgrowth(-2) -0.001 (0.069)
GDPpcgrowth(-1) 0.073 (0.064)
R-squared 0.539 0.585 0.621
Observations 54 25 53 Note: * p<0.1, ** p<0.05, *** p<0.01
28
Model 2.1 is the plain model with GPI growth without lags. All variables are
significant, indicating that the model is appropriate for measuring the determinants of
economic growth. The coefficient for growth in gender equality in education is
positive and significant with a value of 0.423. Average schooling is also significant
and has a positive effect of 0.3 percentage points on GDP per capita growth.
Population growth has a significant negative effect on economic growth while
investment growth has a positive significant effect.
Model 2.2 includes lagged variables for GPI growth. Only the variables for
investment growth and GPI growth became significant. Since the lagged variables for
gender parity index growth were not significant this suggests that model 2.2 is not the
best applicable for estimating the true relationship of the variables. A model with
only one lag of the GPI variable was also tested and gave positive but insignificant
results and is therefore not included in the table.
Model 2.3 includes a lagged variable for GDP per capita growth in addition to the
variables from model 2.1. The lagged GDP per capita variable is not significant,
signifying that neither this model is relevant. All other variables are significant, but
not as reliable as in model 2.1 due to the inclusion of the insignificant lagged GDP per
capita variable.
Overall, the regression analysis shows that growth in gender equality in education has
a positive and significant effect on economic growth, as suggested by model 2.1. This
supports the idea of increased GPI having a positive effect on economic growth, as
shown in model 1.2.
29
7 Discussion
The main discovery of the empirical study is that gender equality in education has a
positive lagged effect on GDP per capita growth. As expected, the current GPI-
variable had in most cases no significant effect on GDP per capita growth. This is due
to the fact that education has a long-term effect on economic growth. The believed
channels through which education affects economic growth are productivity,
environmental effects and demographic effects, all which show outcomes after an
individual is educated rather than during the education.
The first and second lags of the GPI-variable were in all cases but one significant,
supporting the hypothesis that gender equality has an effect on economic growth. Two
lags of the GPI variable were found significant, meaning that the effect of gender
equality in education affects economic growth for a decade. It can be concluded in
this empirical study that higher gender equality contributes to higher GDP per capita
growth.
Both linear and nonlinear regressions were tested in order to see what the relationship
between gender equality in education and economic growth might look like.
Concluding from the significance levels of the squared GPI terms it is evident that a
nonlinear relationship with diminishing returns is not applicable. From the regression
models used, the linear regression model was a more valid fit for finding a
relationship in this data. It could however still be the case that another type of
nonlinear relationship would fit the data better. Other ideas of nonlinear models were
however not supported by the theories and therefore not tested. This could be a
possible way to continue this study.
From the significance of the variables it can be concluded that models 1.2 and 1.3 are
the most reliable for studying the relationship between the gender equality and GDP
per capita growth. From these regressions it is estimated that the effect of gender
equality in education on economic growth is between 3.3 and 0.5 percentage points.
Since the third lag of gender parity index in method three was not significant, it
suggests that method two is more reliable. Increasing the gender ratio of secondary
enrolment gives a 3.3 percentage increase in GDP per capita growth with model 1.2.
30
An interesting observation is that the second lag of GPI in table 1 is always negative,
while the first lag is positive. It is difficult to explain why this is the case since the
negativity cannot be supported by the theories used. It is more likely that the negative
effect caught by the second depends on something else, possibly an omitted variable,
rather than education having a negative effect on economic growth. Since the first
lags are of higher values the overall effect is still positive.
A higher growth rate of the gender parity index in secondary education enrolment has
a positive effect on GDP per capita growth, as suggested by column one in table 2. It
can therefore be concluded that high gender equality in education, as well as high
growth in gender equality in education both have positive effects on economic growth
in developing countries in Asia.
Demographic effects were one of the theoretical effects mentioned about girls’
education. This channel is included in the regression in the population growth
variable. Theory implies that a higher education level of girls will decrease population
growth. The results however do not find the population growth variable to be
significant in any of the regression methods in table 1. It could be possible that this
effect too would be observable with a lagged population growth variable, but due to
software restrictions such experiments could not be done. A possible explanation
could be that Asia already has experienced the demographic effect the theory predicts.
One of the challenges Asia’s economy currently is experiencing is the aging
population which implies that Asia has already experienced this transition and
therefore the indirect effect of gender equality in education no longer has a strong
effect. In table 2 the coefficient for population growth is negative and significant,
providing some evidence for the theoretical analysis. This empirical analysis hence
provides only some evidence for the negative effect of population growth on GDP per
capita growth.
Gender ratio in education is one of the factors of GDP per capita growth in the
technological transfer model with gender equality. A more gender equal education
enrolment should result in higher human capital growth and thereby higher economic
growth in steady state. The empirical results thus confirm the theory. This provides
more guidance for the policymakers in Asia’s developing countries through another
possibility for increasing human capital growth. It would not only be a human right
and a development goal for everyone to receive education, but it would also generate
31
economic benefits. This is the same conclusion as Klasen (1999) came to, calling it a
“win-win strategy” to invest in girls’ education (p.27).
Investment growth is a significant and relatively constant variable in all methods
used. This gives strong evidence for the importance of investment for GDP per capita
growth, which also was included in technology transfer model. This could be an
indirect effect of the, mostly, increasing trend of gender equality in education over the
time period. With a more gender equal education the productivity of human capital
will increase and therefore generate higher returns to capital investments. Although a
possible effect, it cannot be proven with the regression model used and the indirect
relationship can hence only be speculated.
In comparison to Klasen (1999) this paper used much smaller time periods in order to
catch more specific effects. The empirical results could nevertheless support his
conclusion through confirming positive effects of gender quality in education on GDP
per capita growth. Klasen came to the conclusion that education had indirect effects
on economic growth through increased investments and decreased population growth,
which cannot be confirmed in this study. The results from this empirical study as well
as previous evidence (for example Klasen, 1999; Dollar & Gatti, 1999; Klasen &
Lamanna, 2009) support the view that gender equality in education increases
economic growth.
An important way to promote girls’ education is to decrease the costs of education.
Reduced costs have both a direct effect of making school more affordable, but also
decreases the opportunity cost of education as discussed by Herz and Sperling (2004,
p.9). The government is an important actor in education policies and should focus on
cutting education fees and building schools in order to achieve gender equality,
increase school enrolment and promote economic growth. Focusing on girls’
education is important and can be done through providing female facilities at schools,
hiring female teachers and by discouraging gender stereotypes in order to encourage
female learning and re-construct social norms (Herz & Sperling, 2004, p.11).
Asia is currently experiencing problems with achieving productivity growth and
struggles to match the world technological front (IMF, 2017, pp.47-52). An important
factor for solving these issues is increasing the quality of education. It is important to
have a sufficient amount of qualified teachers and make sure that the education
32
framework is updated (Herz & Sperling, 2004, p.12). This promotes education of both
genders, and can particularly result in a higher enrolment of girls if the education is
efficient and relevant.
7.1 Problems
The determination of education’s effects on economic growth is challenging due to
measurement difficulties. Enrolment rates of secondary schooling were chosen due to
the high data availability, but it would have been ideal to complement with the quality
of education. The quality of education is a much varying concept and has a significant
effect on how education affects human capital. It is not therefore fully valid to
compare countries from only enrolment rates and average years of education. A more
qualified comparison would be to compare the abilities learned by those receiving
education. Quality of education was however not included as a variable because of the
lack of data that is caused by difficulties in measuring education quality.
It is also important to take into account that gender quality in education alone cannot
accomplish much. Other institutional factors are needed in addition in order for the
society and economy to be able to benefit from the full effects. It is important that the
educated women have the opportunity to contribute to productivity by participating in
the labour force. If the case is that women are unable to join the labour force, then
their education can be seen as a misused investment. Women’s labour force
participation was one of the variables that would have been interesting and possibly
explanatory to include in the regression, but was not included due to the lack of
sufficient amount of data. Overlapping with this factor are the society’s norms and the
cultural mindset of women’s role in the economy. It is important that the economy
and society empowers women and thereby gives them the possibility to receive
education and use their knowledge and skills to generate economic growth. There
exists a mutual relationship between gender equality in education and the
empowerment of women, hence educating girls is a step towards right direction.
The data set of this empirical study only includes countries that currently are
classified as low or lower middle-income countries. It could however be possible that
a different result would have been obtained if countries that developed from a lower
income status to a higher during the time period had been included in the regression.
The effect of gender equality in education could have been a significant contributor to
33
those countries’ growth. This is an idea for a possible extension that could be made
from this paper.
There is of course always the issue of measurement and data errors, which can distort
the results. This is something that is hard to correct. The availability of data,
especially from developing countries, is another problem that causes a less than ideal
ground for regression. The regression analyses include a very limited amount of
observations, which makes the conclusions less reliable.
As with most regression, it is hard to be completely sure of the correlation between
the variables. The results from this paper suggest that gender equality in education
cause GDP per capita growth due to the significance of GPI-lags. It can however not
be rejected that a higher GDP per capita growth could decrease gender inequality in
education.
34
8 Conclusion
The purpose of this empirical study was to find what the effect of gender equality in
education is on economic growth in developing countries in Asia. The empirical study
was done with panel data using five-year periods in order to catch the effects in 18
countries between 1970 and 2015. The hypothesis was discussed through theories and
an empirical study. The overall conclusion is that reducing gender inequality in
education benefits economic growth.
Increasing the gender ratio in secondary enrolment results in a 3.3 percentage increase
in GDP per capita growth in developing countries in Asia. Increasing the growth rate
of gender parity index in school enrolment also has a positive significant effect on
economic growth. The empirical study therefore suggests that high gender equality or
a high growth rate of gender equality in education promotes economic growth. The
positive results are also in line with much of the previous research.
This was an expected result from the theoretical analysis. The modified technology
transfer model with gender equality confirms the empirical results. According to the
model the GDP per capita growth rate is equal to the human capital growth rate. The
human capital growth rate depends on the productivity in education, quality and
quantity of education, the technological difference as well as the gender enrolment
ratio. The conclusion is also supported by the channels through which education,
especially that of women, can affect economic growth. Increased productivity,
environmental effects and the selection-distortion factor are possible ways of how this
occurs.
The effects of education are believed to be long-term and have benefits over
generations. This was not fully explored in the empirical study since only two lags of
the gender equality variable were significant. The results that were found significant
were with five to ten year lags. This indicates that the time frame in which
investments in gender equality in education starts to shows positive returns is
relatively short, possibly giving more of a reason for investment as the time trade-off
is shorter. The quicker the effects of a policy for improving gender equality are, the
more beneficial it is for the issue of gender equality and the economical gain of the
investment.
35
A restriction of this model is that many variables that were thought to have an effect
on economic growth and bind together the independent and dependent variables could
not be included. A more accurate model would include variables such as women’s
labour force participation and quality of education in order to more specifically
analyse the effects of gender equality in education on economic growth. This could be
a possible way to improve the study. The low number of observations is another issue
that weakens the reliability of the conclusions.
In conclusion it can be stated that increasing gender equality increases economic
growth. It is therefore not only a good target from human development point of view,
but increasing gender equality also promotes economic growth.
36
References
Asian Development Bank (2018). Education Issues in Asia and the Pacific. Asian
Development Bank. Available at: https://www.adb.org/sectors/education/issues
[Accessed 6 May 2018]
Barro, R.J. & Lee, J.W. (1994). Sources of Economic Growth. Carnegie-Rochester
Conference Series on Public Policy, 40, pp. 1-46.
Dollar, D. & Gatti, R. (1999). Gender Inequality, Income, and Growth: Are Good
Times Good for Women? Policy Research Report on Gender and Development
Working Paper Series, No.1, The World Bank.
Dougherty, C. (2011). Introduction to Econometrics. 4th ed. New York: Oxford
University Press Inc.
Fensom, A. (2017). Asia To Stay World’s Fastest-Growing Region Through 2030.
The Diplomat. Available at: https://thediplomat.com/2017/12/asia-to-stay-worlds-
fastest-growing-region-through-2030/ [Accessed 3 May 2018]
Gakidou, E., Cowling, K., Lozano, R. & Murray, C. (2010). Increased Educational
Attainment and its Effect on Child Mortality in 175 Countries between 1970 and
2009: A Systematic Analysis, The Lancet, Vol. 376.
Herz, B. & Sperling, G. (2004). What Works in Girls’ Education: Evidence and
Policies from the Developing World. Council on Foreign Relations.
IMF (2017). Regional economic outlook. Asia and Pacific: preparing for choppy seas,
World Economic and Financial Surveys.
Jones, C. & Vollrath, D. (2013). Introduction to Economic Growth. 3rd ed. New York:
W.W. Norton.
Klasen, S. (1999). Does Gender Inequality Reduce Growth and Development?
Evidence from Cross-Country Regressions, Policy Research Report on Gender and
Development Working Paper Series, No. 7, the World Bank.
Klasen, S. & Lamanna, F. (2009). The impact of gender inequality in education and
employment on economic growth: new evidence for a panel of countries. Feminist
Economics, 15(3), pp. 91-132.
37
Knowles, S., Lorgelly, P. & Owen, D. (2002). Are educational gender gaps a brake on
economic development? Some cross-country empirical evidence. Oxford economic
papers, 54, pp. 118-149. Oxford University Press.
Morrison, A., Raju, D. & Sinha, N. (2007). Equality, Poverty and Economic Growth.
Policy Research Working Paper 4349.
OECD (2010). The High Cost of Low Educational Performance: The Long-Run
Economic Impact of Improving PISA Outcomes, Programme for International
Student Assessment, OECD, Paris.
Psacharopoulos, G. & Patrinos, H. (2002). Returns to investment in education: a
further update, Policy Research Working Papers 2881, The World Bank.
Stenberg, R. & Kaufman S. (2011). The Cambridge Handbook of Intelligence.
Cambridge: Cambridge University Press.
UNESCO (2014). Women and girls’ education – facts and figures. Available at:
http://www.unesco.org/new/en/unesco/events/prizes-and-
celebrations/celebrations/international-days/international-womens-day-2014/women-
ed-facts-and-figure/ [Accessed 24 Apr. 2018]
United Nations (2015). The Millennium Development Goals Report 2015. New York.
Verick, S. (2014). Female labour force participation in developing countries. IZA
World of Labour.
World Bank (2012a). Toward Gender Equality in East Asia and the Pacific: A
Companion to the World Development Report. Washington, DC: World Bank.
World Bank (2012b). World Development Report 2012: Gender Equality and
Development. Washington, DC: World Bank.
World Bank (2018). World Development Report 2018: Learning to Realize
Education's Promise. Washington, DC: World Bank.
Data sources
Barro, R. & Lee, J.W. (2013). A New Data Set of Educational Attainment in the
World, 1950-2010. Journal of Development Economics, vol 104, pp.184-198.
38
Feenstra, R.C., Inklaar, R. & Timmer, M.P. (2015). The Next Generation of the Penn
World Table. American Economic Review, 105(10), 3150-3182. Available at:
www.ggdc.net/pwt [Accessed 13 Apr 2018]
World Bank (2018). Databank – World Development Indicators. Available at:
http://databank.worldbank.org/data/home.aspx [Accessed 5 Apr 2018]
39
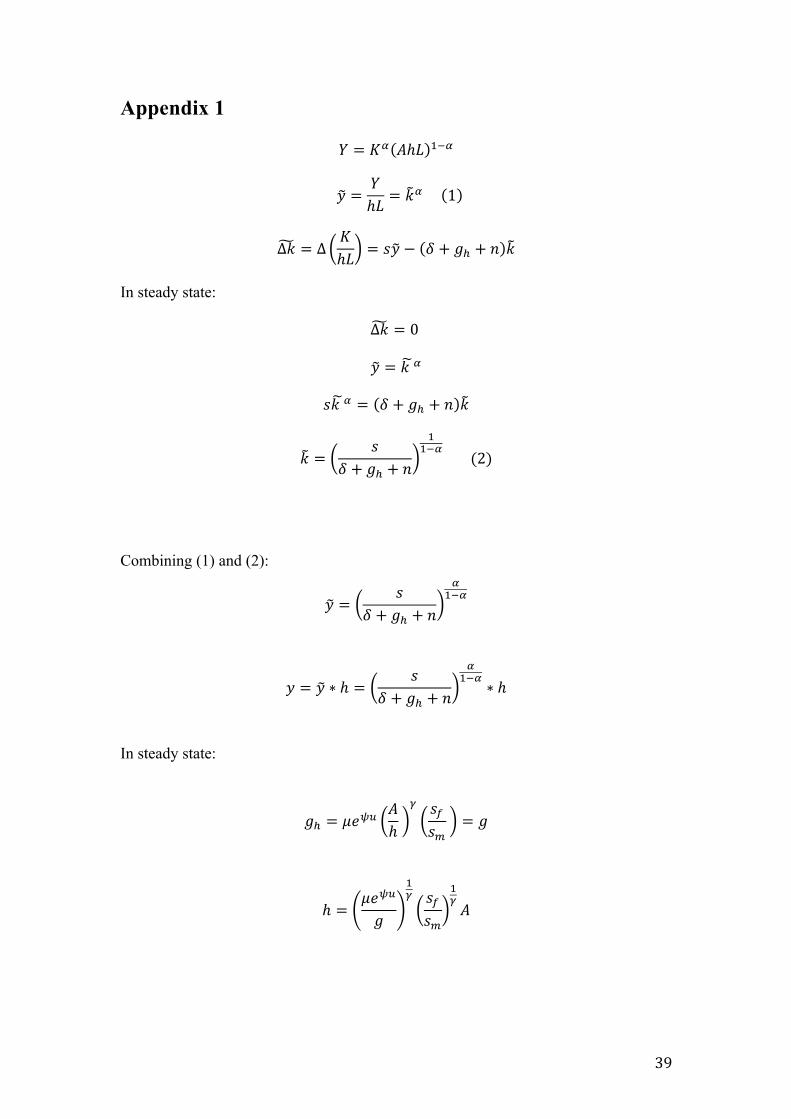
Appendix 1
𝑌 = 𝐾! 𝐴ℎ𝐿 !!!
𝑦 =𝑌ℎ𝐿 = 𝑘! 1
∆𝑘 = ∆𝐾ℎ𝐿 = 𝑠𝑦 − 𝛿 + 𝑔! + 𝑛 𝑘
In steady state:
∆𝑘 = 0
𝑦 = 𝑘 !
𝑠𝑘 ! = 𝛿 + 𝑔! + 𝑛 𝑘
𝑘 =𝑠
𝛿 + 𝑔! + 𝑛
!!!!
(2)
Combining (1) and (2):
𝑦 =𝑠
𝛿 + 𝑔! + 𝑛
!!!!
𝑦 = 𝑦 ∗ ℎ =𝑠
𝛿 + 𝑔! + 𝑛
!!!!
∗ ℎ
In steady state:
𝑔! = 𝜇𝑒!"𝐴ℎ
! 𝑠!𝑠!
= 𝑔
ℎ =𝜇𝑒!"
𝑔
!! 𝑠!𝑠!
!!𝐴
40
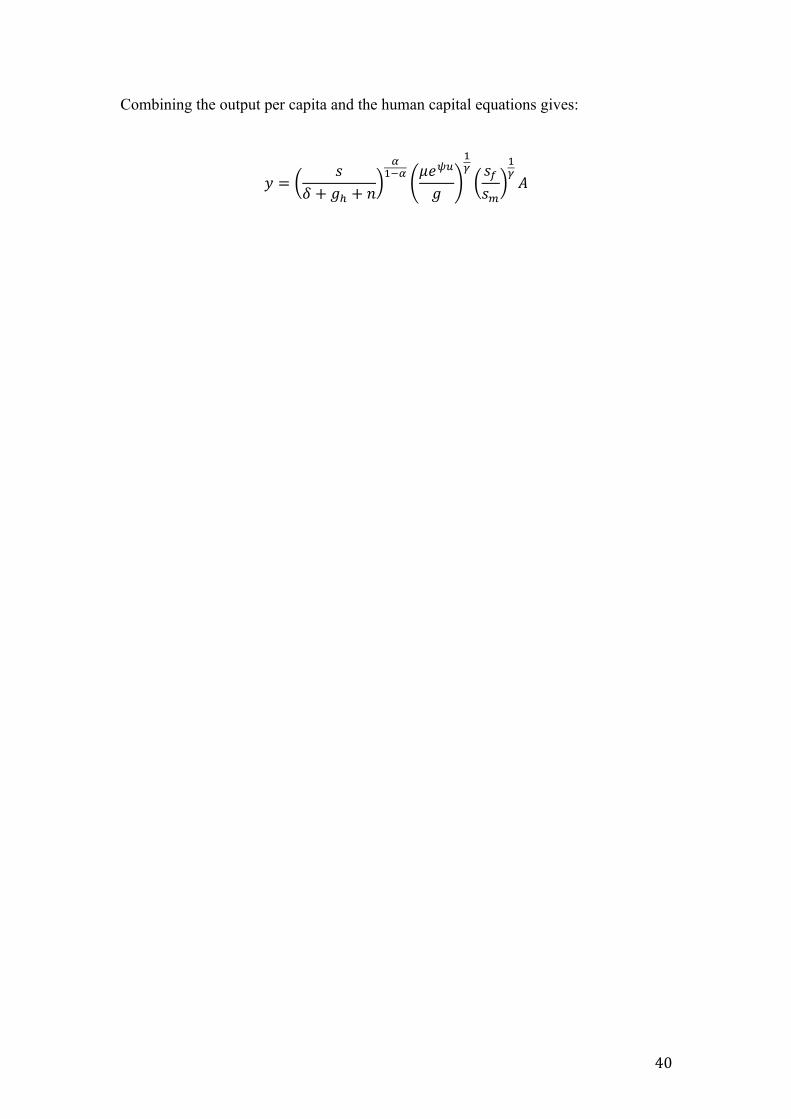
Combining the output per capita and the human capital equations gives:
𝑦 =𝑠
𝛿 + 𝑔! + 𝑛
!!!! 𝜇𝑒!"
𝑔
!! 𝑠!𝑠!
!!𝐴
41
Appendix 2
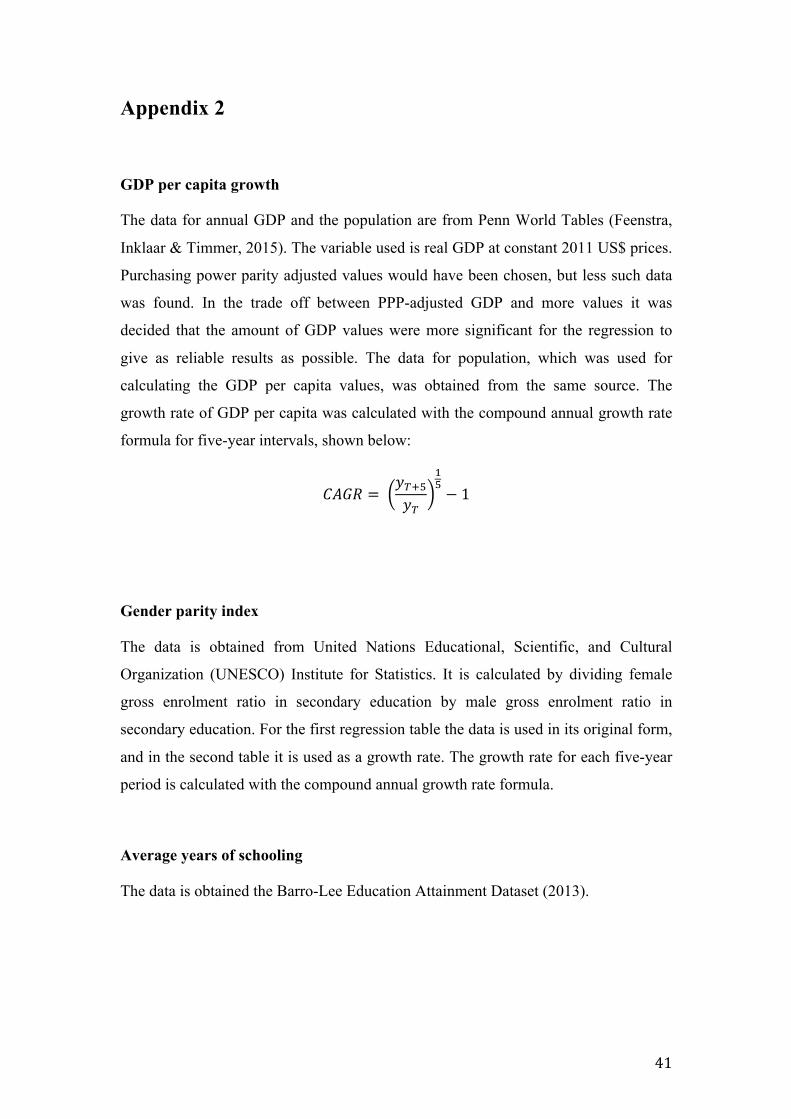
GDP per capita growth
The data for annual GDP and the population are from Penn World Tables (Feenstra,
Inklaar & Timmer, 2015). The variable used is real GDP at constant 2011 US$ prices.
Purchasing power parity adjusted values would have been chosen, but less such data
was found. In the trade off between PPP-adjusted GDP and more values it was
decided that the amount of GDP values were more significant for the regression to
give as reliable results as possible. The data for population, which was used for
calculating the GDP per capita values, was obtained from the same source. The
growth rate of GDP per capita was calculated with the compound annual growth rate
formula for five-year intervals, shown below:
𝐶𝐴𝐺𝑅 = 𝑦!!!𝑦!
!!− 1
Gender parity index
The data is obtained from United Nations Educational, Scientific, and Cultural
Organization (UNESCO) Institute for Statistics. It is calculated by dividing female
gross enrolment ratio in secondary education by male gross enrolment ratio in
secondary education. For the first regression table the data is used in its original form,
and in the second table it is used as a growth rate. The growth rate for each five-year
period is calculated with the compound annual growth rate formula.
Average years of schooling
The data is obtained the Barro-Lee Education Attainment Dataset (2013).
42
Population growth
The data for population was obtained from the Penn World Table (Feenstra, Inklaar &
Timmer, 2015). The compound annual growth rate formula was used to calculate the
growth of population.
Investment growth
The investment growth was calculated with the compounded annual growth rate
formula with data for gross capital formation at constant 2010 US$ prices from World
Development Indicators from The World Bank Databank (2018).

43
Appendix 3
List of included countries:
Afghanistan
Armenia
Bangladesh
Cambodia
India
Indonesia
Kyrgyzstan
Laos
Mongolia
Myanmar
Nepal
Pakistan
Philippines
Sri Lanka
Syria
Tajikistan
Vietnam
Yemen
Number of countries: 18
Bhutan, Timor-Leste and Uzbekistan also fit the criteria of low or lower middle
income countries in Asia, but did not have enough available data to be included in the
regression analysis.