Embed Size (px)
Citation preview
Financial and Financial and operational reviewoperational reviewoperational reviewoperational review
FY 2014FY 2014
Investor presentationInvestor presentation20 March 201520 March 2015
1
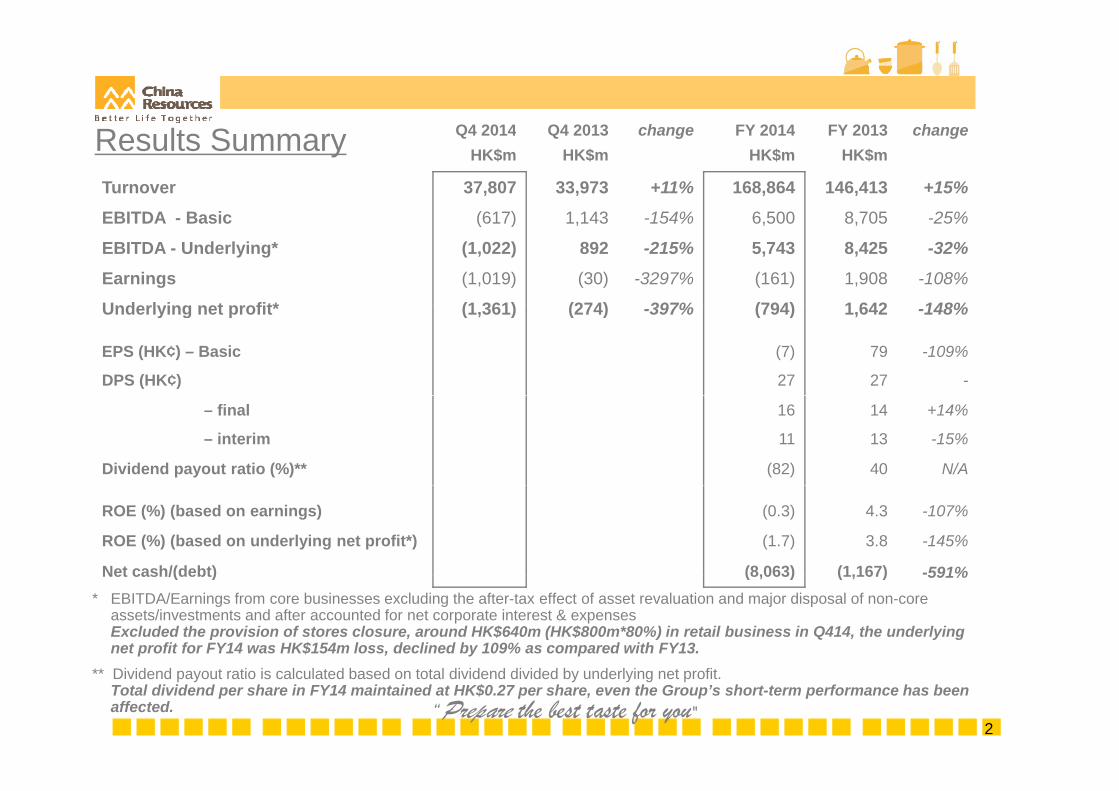
Q4 2014 Q4 2013 h FY 2014 FY 2013 hResults Summary Q4 2014 Q4 2013 change FY 2014 FY 2013 changeHK$m HK$m HK$m HK$m
Turnover 37,807 33,973 +11% 168,864 146,413 +15%
EBITDA Basic (617) 1 143 154% 6 500 8 705 25%EBITDA - Basic (617) 1,143 -154% 6,500 8,705 -25%
EBITDA - Underlying* (1,022) 892 -215% 5,743 8,425 -32%
Earnings (1,019) (30) -3297% (161) 1,908 -108%
Underlying net profit* (1 361) (274) 397% (794) 1 642 148%Underlying net profit* (1,361) (274) -397% (794) 1,642 -148%
EPS (HK¢) – Basic (7) 79 -109%
DPS (HK¢) 27 27 -
DPS (HK¢) – final 16 14 +14%
DPS (HK¢) – interim 11 13 -15%
Dividend payout ratio (%)** (82) 40 N/A
ROE (%) (based on earnings) (0.3) 4.3 -107%
ROE (%) (based on underlying net profit*) (1.7) 3.8 -145%
Net cash/(debt) (8,063) (1,167) -591%Net cash/(debt) (8,063) (1,167) 591%* EBITDA/Earnings from core businesses excluding the after-tax effect of asset revaluation and major disposal of non-core
assets/investments and after accounted for net corporate interest & expensesExcluded the provision of stores closure, around HK$640m (HK$800m*80%) in retail business in Q414, the underlying net profit for FY14 was HK$154m loss, declined by 109% as compared with FY13.
2“Prepare the best taste for you"
** Dividend payout ratio is calculated based on total dividend divided by underlying net profit.Total dividend per share in FY14 maintained at HK$0.27 per share, even the Group’s short-term performance has been affected.
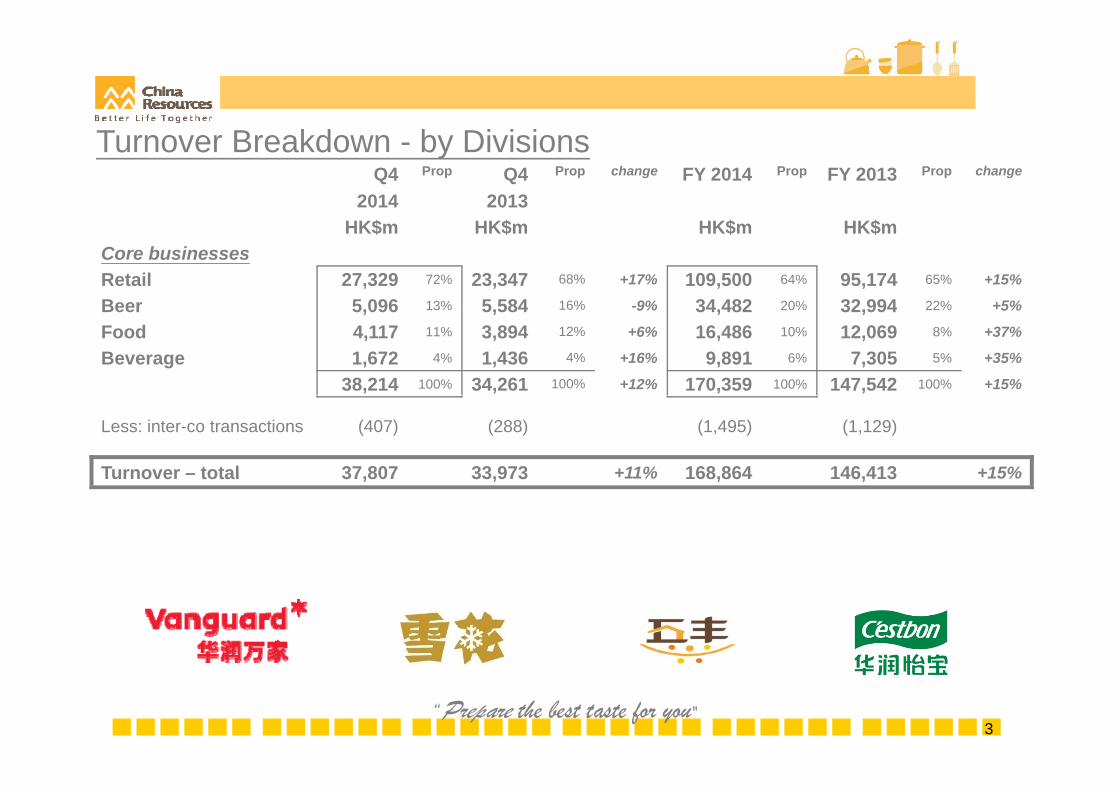
Turnover Breakdown - by DivisionsQ4
2014Prop Q4
2013Prop change FY 2014 Prop FY 2013 Prop change
HK$m HK$m HK$m HK$mCore businessesRetail 27,329 72% 23,347 68% +17% 109,500 64% 95,174 65% +15%
Beer 5 096 13% 5 584 16% -9% 34 482 20% 32 994 22% +5%Beer 5,096 13% 5,584 16% -9% 34,482 20% 32,994 22% +5%
Food 4,117 11% 3,894 12% +6% 16,486 10% 12,069 8% +37%
Beverage 1,672 4% 1,436 4% +16% 9,891 6% 7,305 5% +35%
38,214 100% 34,261 100% +12% 170,359 100% 147,542 100% +15%
Less: inter-co transactions (407) (288) (1,495) (1,129)
Turnover – total 37,807 33,973 +11% 168,864 146,413 +15%
3“Prepare the best taste for you"
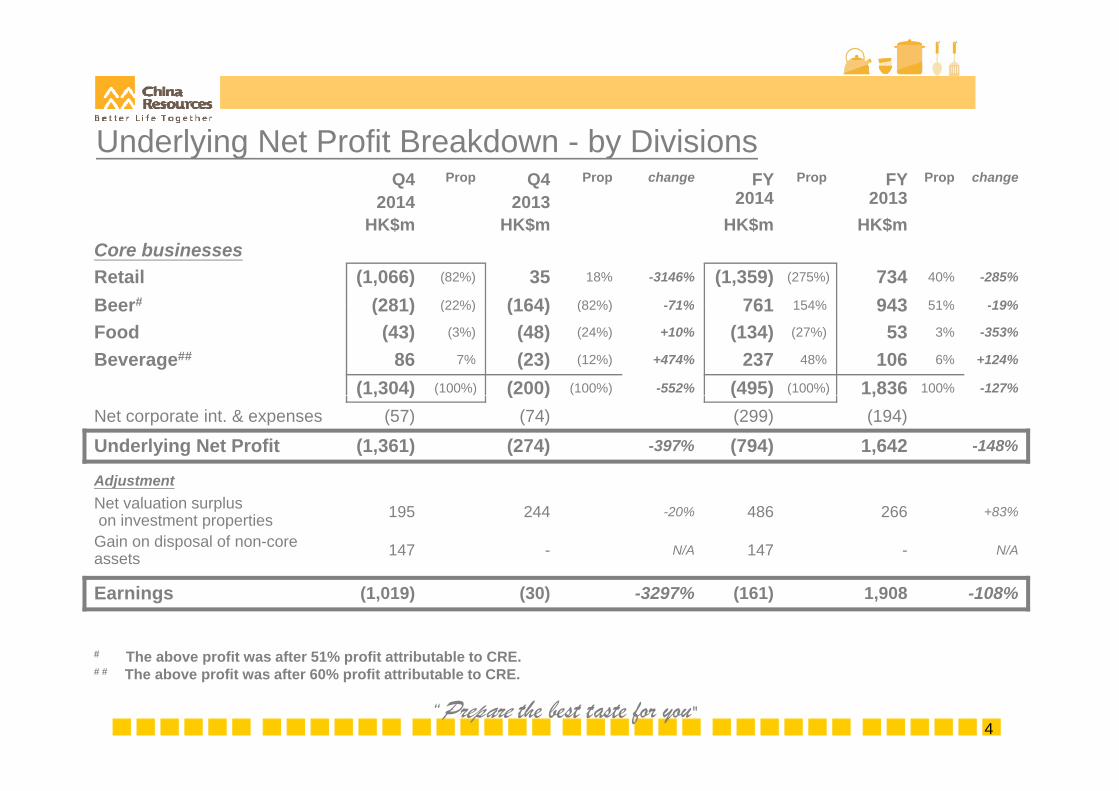
Underlying Net Profit Breakdown - by DivisionsQ4
2014Prop Q4
2013Prop change FY
2014Prop FY
2013Prop change
HK$m HK$m HK$m HK$mCore businessesRetail (1,066) (82%) 35 18% -3146% (1,359) (275%) 734 40% -285%
Beer# (281) (22%) (164) (82%) -71% 761 154% 943 51% -19%Beer# (281) (22%) (164) (82%) -71% 761 154% 943 51% -19%
Food (43) (3%) (48) (24%) +10% (134) (27%) 53 3% -353%
Beverage## 86 7% (23) (12%) +474% 237 48% 106 6% +124%
(1,304) (100%) (200) (100%) -552% (495) (100%) 1,836 100% -127%( , ) ( ) ( ) ,Net corporate int. & expenses (57) (74) (299) (194)
Underlying Net Profit (1,361) (274) -397% (794) 1,642 -148%
AdjustmentAdjustmentNet valuation surpluson investment properties 195 244 -20% 486 266 +83%
Gain on disposal of non-core assets 147 - N/A 147 - N/A
Earnings (1,019) (30) -3297% (161) 1,908 -108%
# The above profit was after 51% profit attributable to CRE.
4
# # The above profit was after 60% profit attributable to CRE.
“Prepare the best taste for you"
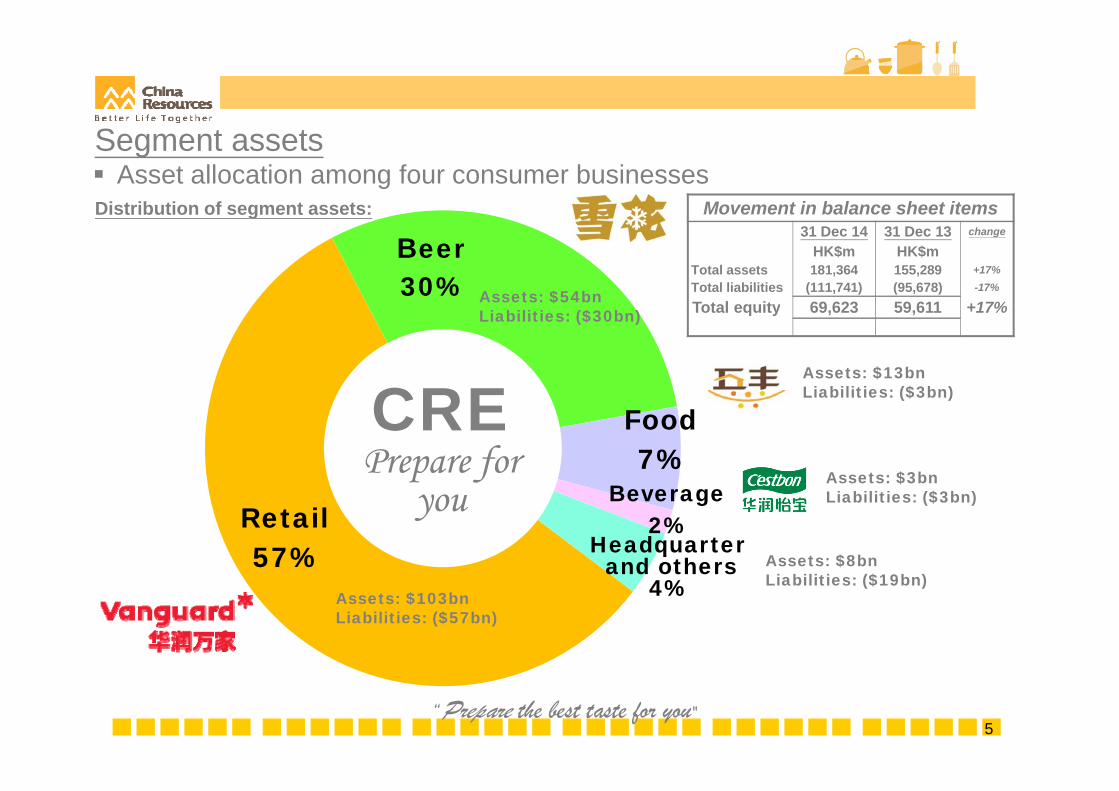
Segment assets
Distribution of segment assets: Asset allocation among four consumer businesses
Movement in balance sheet itemsg31 Dec 14 31 Dec 13 change
HK$m HK$mTotal assets 181,364 155,289 +17%Total liabilities (111,741) (95,678) -17%
Total equity 69 623 59 611 +17%
Beer30% Assets: $54bn Total equity 69,623 59,611 +17%
Assets: $13bnLiabilities: ($3bn)
Liabilities: ($30bn)
CREAssets: $3bn
Liabilities: ($3bn)
Food7%
B
CREPrepare for
Assets: $8bnLi biliti ($19b )
Liabilities: ($3bn)Retail57%
Beverage2%
youHeadquarter
and othersLiabilities: ($19bn)
Assets: $103bnLiabilities: ($57bn)
4%
5“Prepare the best taste for you"
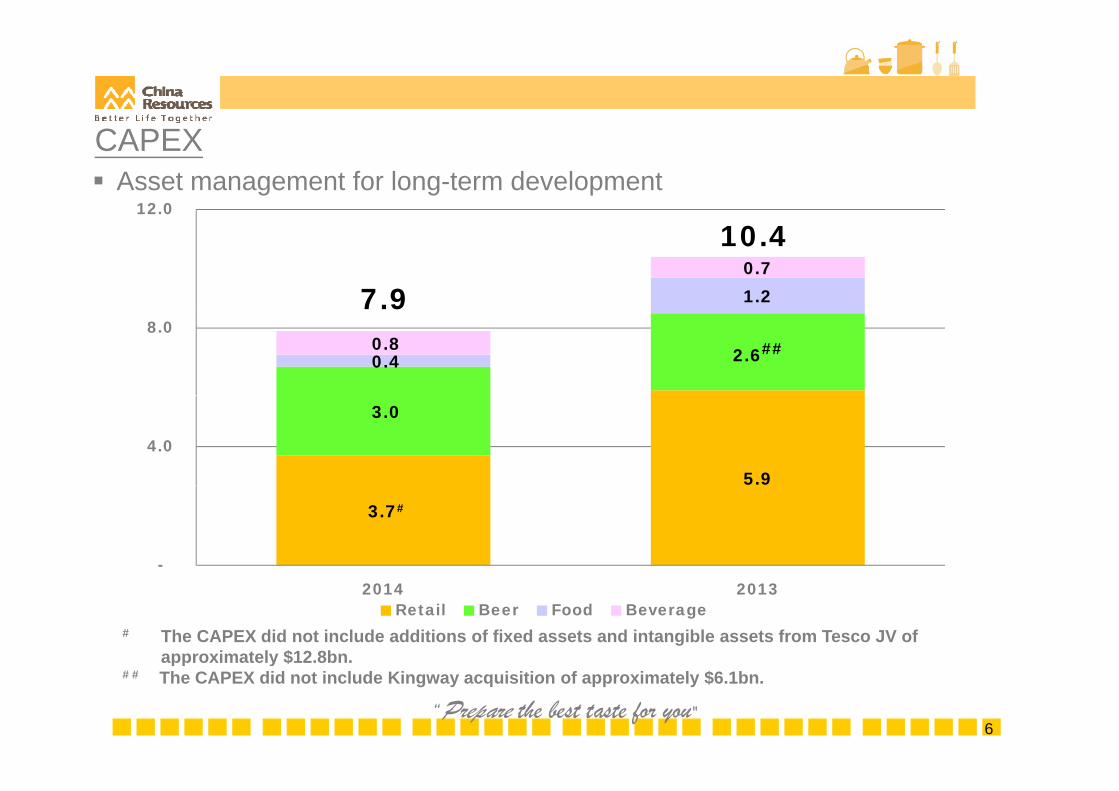
CAPEX Asset management for long-term development
12.0
1.20.7
7.9
10.4
2.6##0.4 0.8
8.0 7.9
5.9
3.0
4.0
3.7#
-
# The CAPEX did not include additions of fixed assets and intangible assets from Tesco JV ofapproximately $12.8bn.
2014 2013Retail Beer Food Beverage
6
pp y# # The CAPEX did not include Kingway acquisition of approximately $6.1bn.
“Prepare the best taste for you"
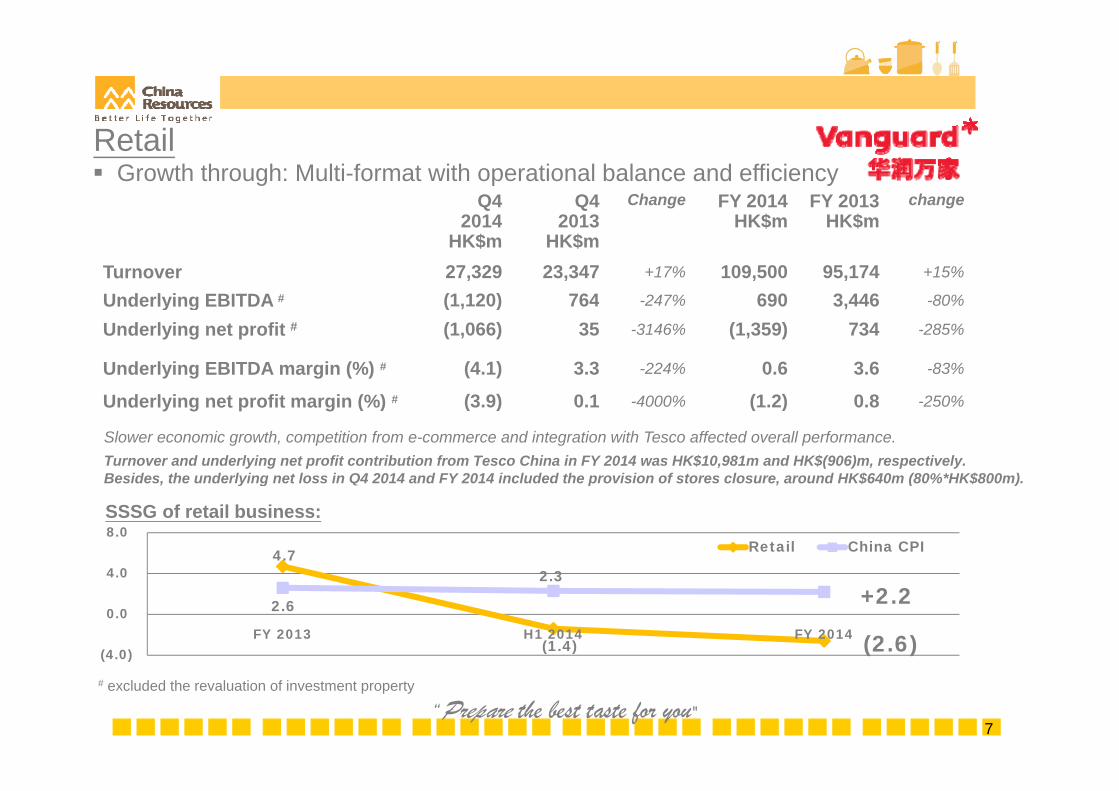
Retail
Q42014
Q42013
Change FY 2014HK$
FY 2013HK$
change Growth through: Multi-format with operational balance and efficiency
2014HK$m
2013HK$m
HK$m HK$m
Turnover 27,329 23,347 +17% 109,500 95,174 +15%
Underlying EBITDA # (1,120) 764 -247% 690 3,446 -80%Underlying EBITDA (1,120) 764 % 690 3,446 80%
Underlying net profit # (1,066) 35 -3146% (1,359) 734 -285%
Underlying EBITDA margin (%) # (4.1) 3.3 -224% 0.6 3.6 -83%
U d l i t fit i (%) # (3 9) 0 1 4000% (1 2) 0 8 250%
Slower economic growth, competition from e-commerce and integration with Tesco affected overall performance.Turnover and underlying net profit contribution from Tesco China in FY 2014 was HK$10,981m and HK$(906)m, respectively. Besides, the underlying net loss in Q4 2014 and FY 2014 included the provision of stores closure, around HK$640m (80%*HK$800m).
Underlying net profit margin (%) # (3.9) 0.1 -4000% (1.2) 0.8 -250%
SSSG of retail business:
, y g p , ( )
4.7 2 3 4.0
8.0 Retail China CPI
(1.4)
2.6
2.3
(4.0)
0.0
4.0
FY 2013 H1 2014 FY 2014
+2.2
(2.6)
7
# excluded the revaluation of investment property
“Prepare the best taste for you"
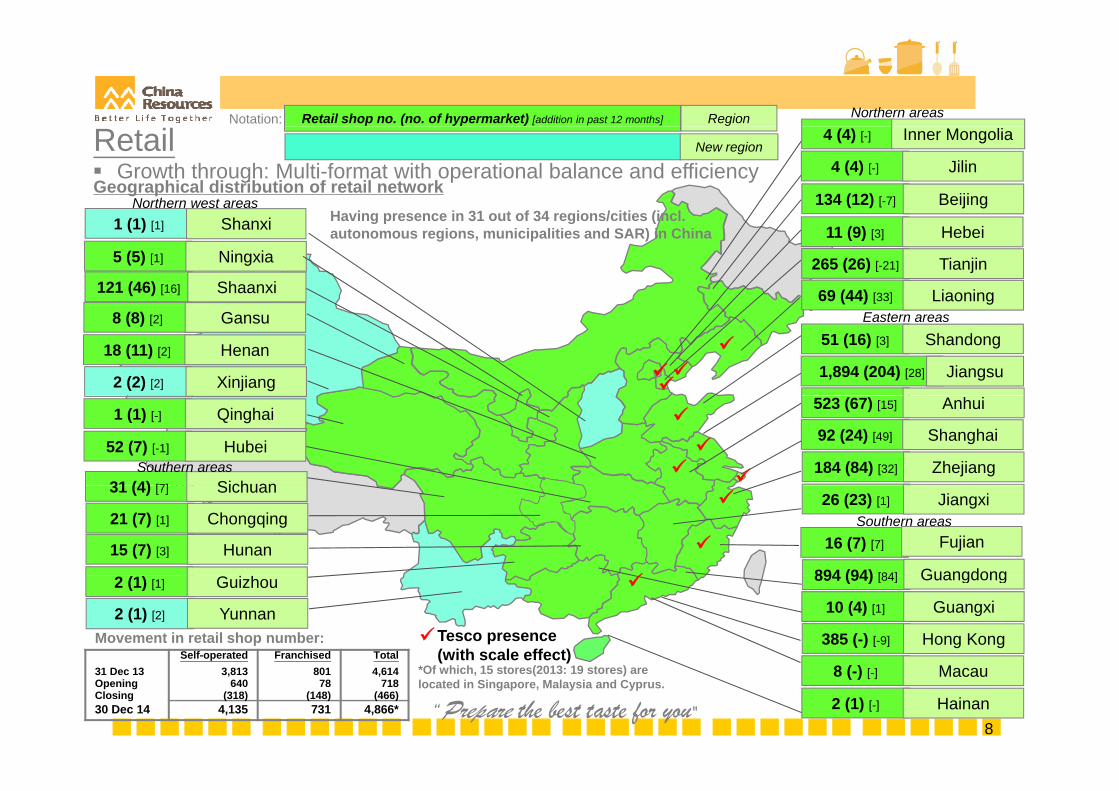
Northern areasRetail shop no. (no. of hypermarket) [addition in past 12 months] RegionNotation:
Geographical distribution of retail network
Retail 4 (4) [-] Inner Mongolia
Having presence in 31 out of 34 regions/cities (incl
New region
Northern west areas 134 (12) [-7] Beijing
4 (4) [-] Jilin Growth through: Multi-format with operational balance and efficiency
Having presence in 31 out of 34 regions/cities (incl. autonomous regions, municipalities and SAR) in China 11 (9) [3] Hebei
265 (26) [-21] Tianjin
69 (44) [33] Liaoning121 (46) [16] Shaanxi
5 (5) [1] Ningxia
1 (1) [1] Shanxi
Eastern areas51 (16) [3] Shandong
1,894 (204) [28] Jiangsu
8 (8) [2] Gansu
18 (11) [2] Henan
2 (2) [2] Xinjiang
523 (67) [15] Anhui
92 (24) [49] Shanghai
184 (84) [32] Zhejiang31 (4) [7] Sichuan
52 (7) [-1] HubeiSouthern areas
1 (1) [-] Qinghai
Southern areas26 (23) [1] Jiangxi
16 (7) [7] Fujian
894 (94) [84] Guangdong15 (7) [3] Hunan
21 (7) [1] Chongqing
31 (4) [7] Sichuan
Movement in retail shop number:Self-operated Franchised Total
894 (94) [84] Guangdong
385 (-) [-9] Hong Kong
M
10 (4) [1] Guangxi2 (1) [1] Guizhou
2 (1) [2] Yunnan
Tesco presence(with scale effect)
8
31 Dec 13 3,813 801 4,614Opening 640 78 718Closing (318) (148) (466)30 Dec 14 4,135 731 4,866*
8 (-) [-] Macau
2 (1) [-] Hainan
*Of which, 15 stores(2013: 19 stores) are located in Singapore, Malaysia and Cyprus.
“Prepare the best taste for you"
Retail
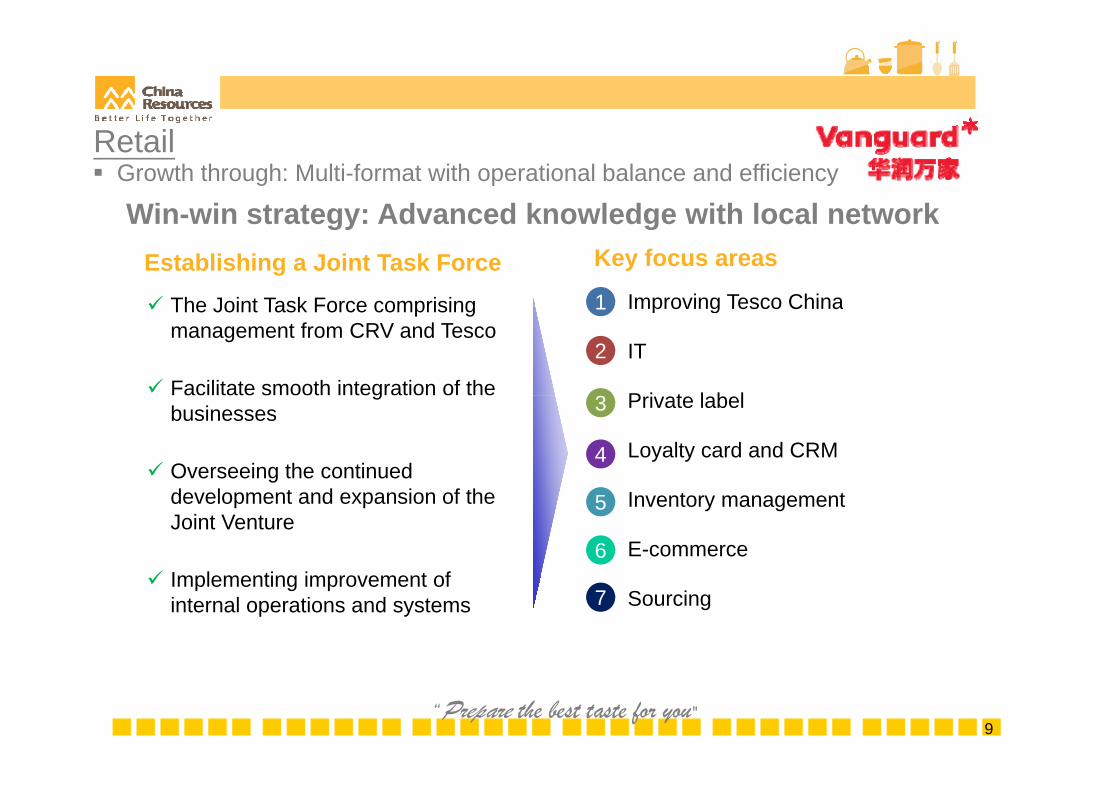
Win-win strategy: Advanced knowledge with local network Growth through: Multi-format with operational balance and efficiency
Win-win strategy: Advanced knowledge with local networkEstablishing a Joint Task Force Key focus areas
The Joint Task Force comprising Improving Tesco China1 The Joint Task Force comprising management from CRV and Tesco
Facilitate smooth integration of the
Improving Tesco China
IT
P i t l b l
2
1
3g
businesses
Overseeing the continued
Private label
Loyalty card and CRM
3
4
development and expansion of the Joint Venture
I l ti i t f
Inventory management
E-commerce
5
6 Implementing improvement of
internal operations and systems Sourcing7
9“Prepare the best taste for you"
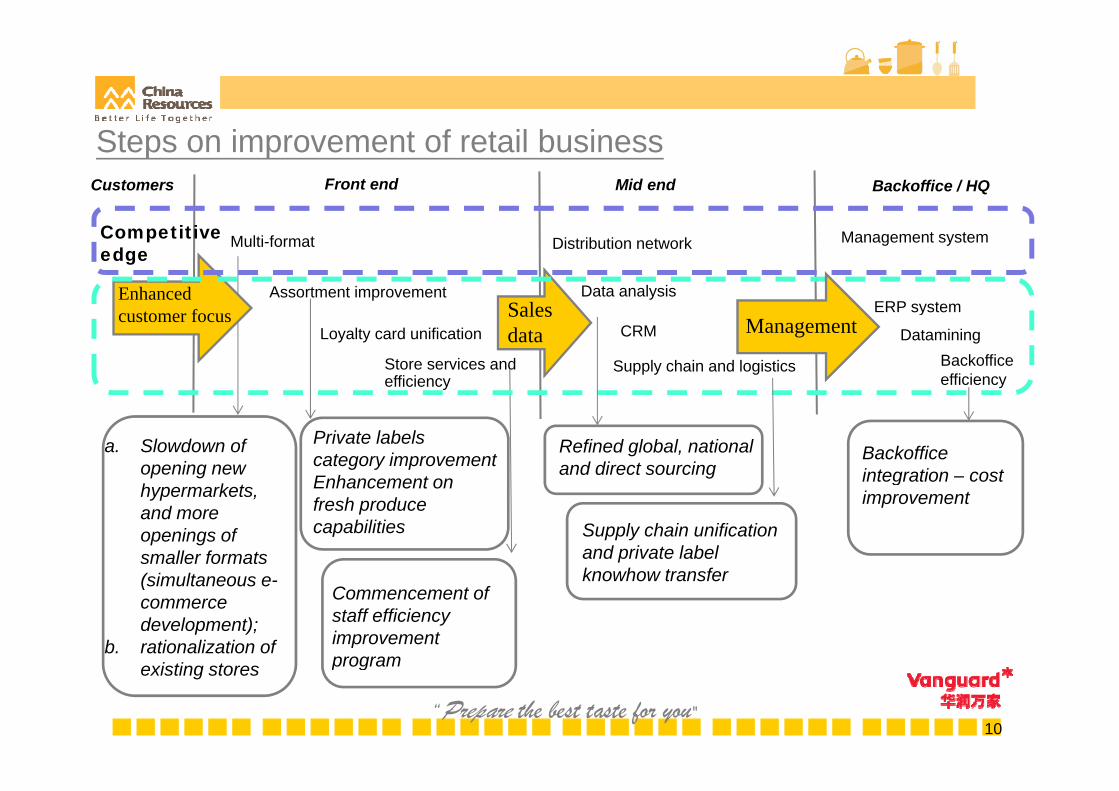
Steps on improvement of retail businessCustomers Front end Mid end Backoffice / HQ
Multi-format
Assortment improvementS l
Enhanced
Competitive edge Distribution network
Data analysis
Management system
ERP system
Loyalty card unification
Store services and efficiency
Sales data
customer focus
Supply chain and logistics
ERP system
Backofficeefficiency
Management DataminingCRM
a. Slowdown of opening new h k t
Private labels category improvementEnhancement on
Refined global, national and direct sourcing
Backofficeintegration – cost
hypermarkets, and more openings of smaller formats ( i lt
Enhancement on fresh produce capabilities Supply chain unification
and private label knowhow transfer
gimprovement
(simultaneous e-commerce development);
b. rationalization of i ti t
Commencement of staff efficiency improvement program
knowhow transfer
10
existing stores program
“Prepare the best taste for you"
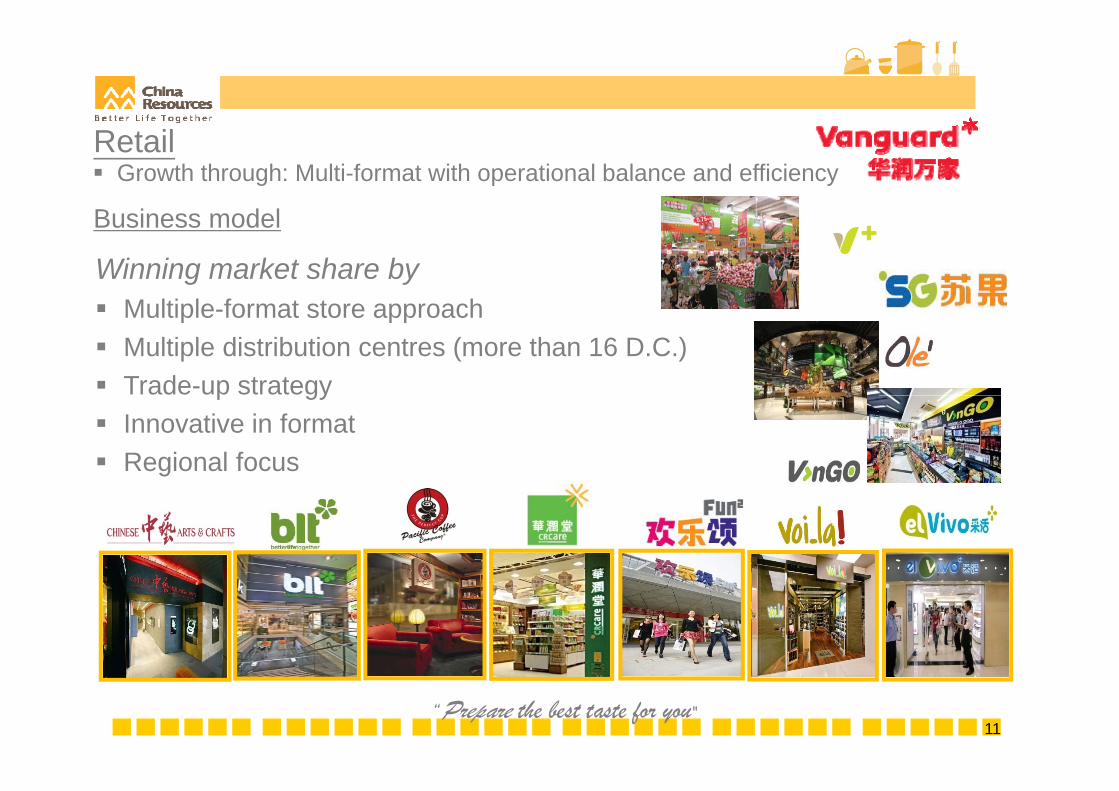
Business model
Retail Growth through: Multi-format with operational balance and efficiency
Business model
Winning market share by Multiple format store approach Multiple-format store approach Multiple distribution centres (more than 16 D.C.) Trade-up strategyp gy Innovative in format Regional focus
11“Prepare the best taste for you"
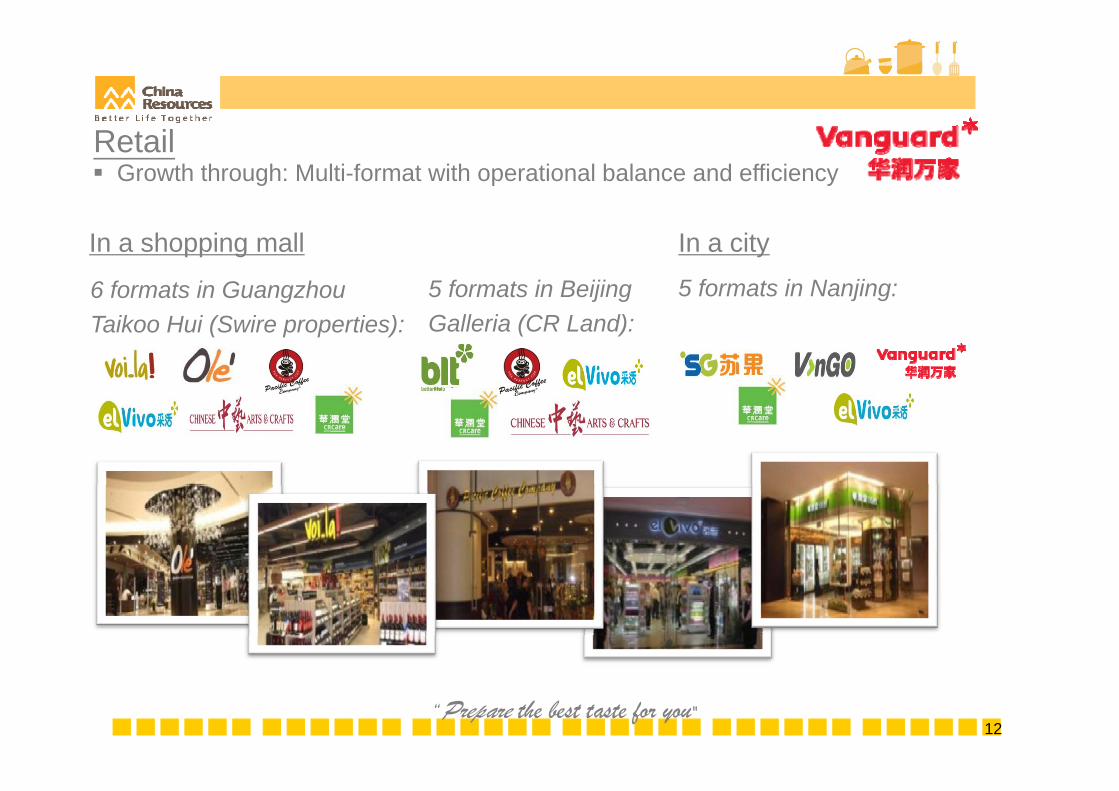
Retail Growth through: Multi-format with operational balance and efficiency
6 formats in Guangzhou 5 formats in Beijing
In a shopping mall In a city
5 formats in Nanjing:Taikoo Hui (Swire properties): Galleria (CR Land):
12“Prepare the best taste for you"
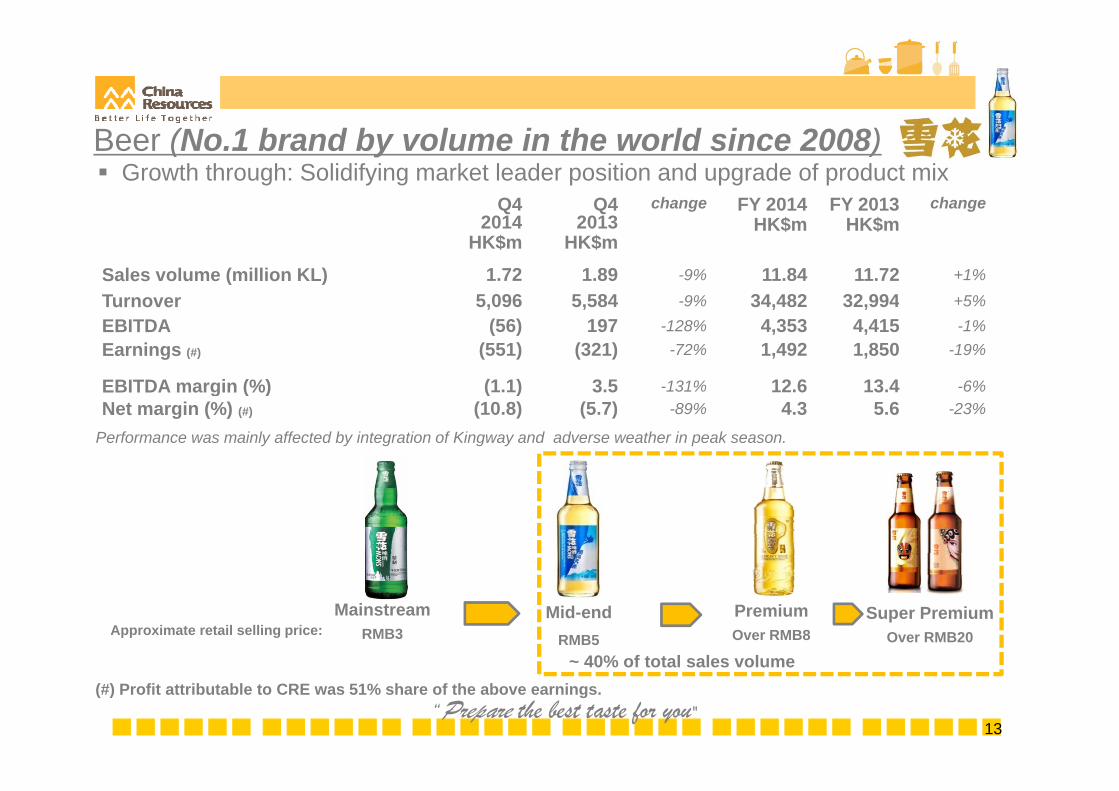
Beer (No.1 brand by volume in the world since 2008) Growth through: Solidifying market leader position and upgrade of product mix
Q42014
Q42013
change FY 2014 FY 2013 change2014
HK$m2013
HK$mHK$m HK$m
Sales volume (million KL) 1.72 1.89 -9% 11.84 11.72 +1%
Turnover 5,096 5,584 -9% 34,482 32,994 +5%Turnover 5,096 5,584 9% 34,482 32,994 5%EBITDA (56) 197 -128% 4,353 4,415 -1%Earnings (#) (551) (321) -72% 1,492 1,850 -19%
EBITDA margin (%) (1.1) 3.5 -131% 12.6 13.4 -6%
Performance was mainly affected by integration of Kingway and adverse weather in peak season.
g ( ) ( )Net margin (%) (#) (10.8) (5.7) -89% 4.3 5.6 -23%
MainstreamRMB3Approximate retail selling price:
Mid-endRMB5
PremiumOver RMB8
~ 40% of total sales volume
Super PremiumOver RMB20
13
(#) Profit attributable to CRE was 51% share of the above earnings. 40% of total sales volume
“Prepare the best taste for you"
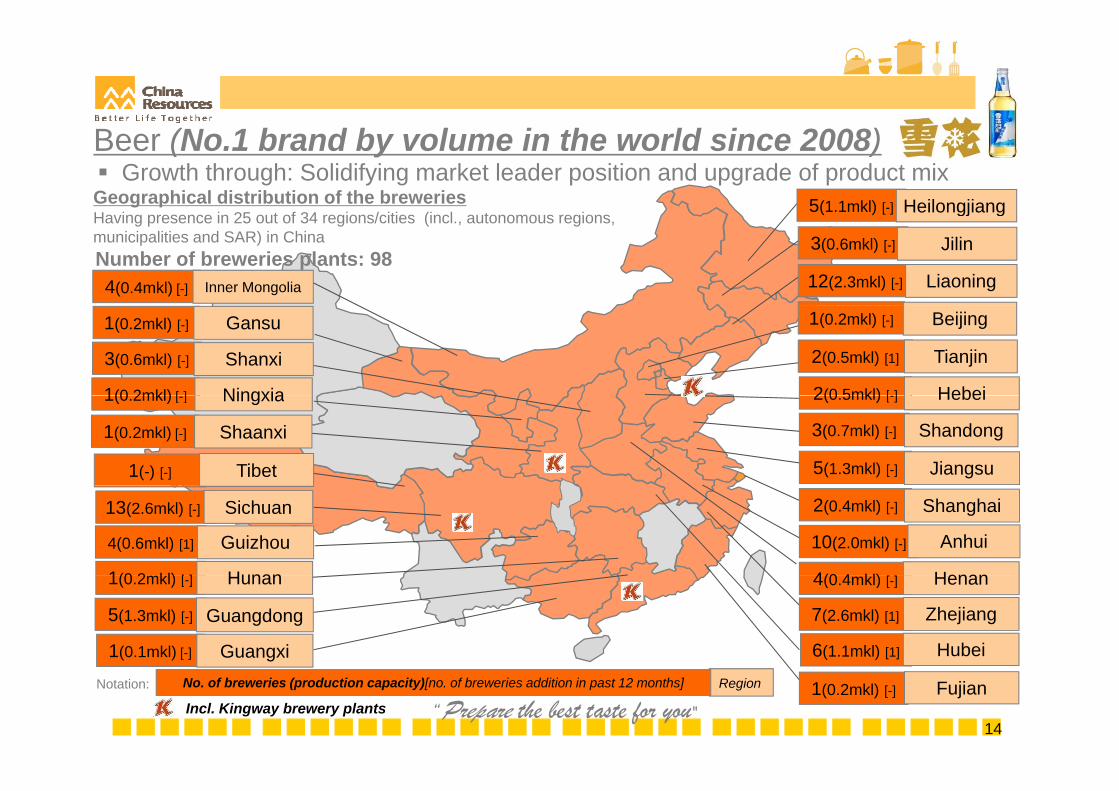
5(1.1mkl) [-] HeilongjiangGeographical distribution of the breweriesHaving presence in 25 out of 34 regions/cities (incl autonomous regions
Growth through: Solidifying market leader position and upgrade of product mixBeer (No.1 brand by volume in the world since 2008)
12(2.3mkl) [-] Liaoning
gj g
4(0.4mkl) [-] Inner Mongolia
3(0.6mkl) [-] JilinNumber of breweries plants: 98
Having presence in 25 out of 34 regions/cities (incl., autonomous regions,municipalities and SAR) in China
2(0.5mkl) [1] Tianjin
1(0.2mkl) [-] Beijing1(0.2mkl) [-] Gansu
3(0.6mkl) [-] Shanxi
2(0 5mkl) [ ] Hebei1(0 2mkl) [ ] Ningxia
3(0.7mkl) [-] Shandong
1(-) [-] Tibet
2(0.5mkl) [-] Hebei
5(1.3mkl) [-] Jiangsu
1(0.2mkl) [-] Ningxia
1(0.2mkl) [-] Shaanxi
10(2.0mkl) [-] Anhui
4(0 4 kl) Henan
4(0.6mkl) [1] Guizhou
2(0.4mkl) [-] Shanghai13(2.6mkl) [-] Sichuan
1(0 2 kl) [ ] Hunan
6(1.1mkl) [1] Hubei
4(0.4mkl) [-] Henan
7(2.6mkl) [1] Zhejiang
1(0.2mkl) [-] Hunan
5(1.3mkl) [-] Guangdong
1(0.1mkl) [-] Guangxi
14
1(0.2mkl) [-] FujianRegionNo. of breweries (production capacity)[no. of breweries addition in past 12 months]Notation:
Incl. Kingway brewery plants “Prepare the best taste for you"
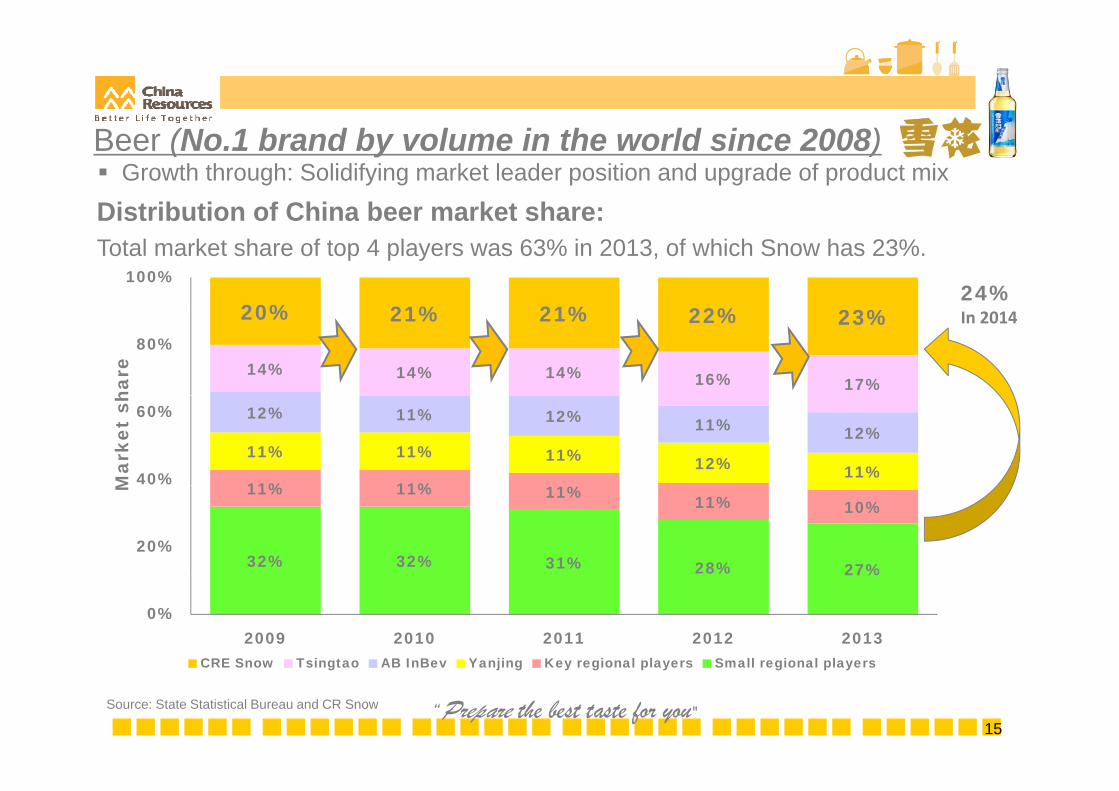
Distribution of China beer market share: Growth through: Solidifying market leader position and upgrade of product mixBeer (No.1 brand by volume in the world since 2008)
Distribution of China beer market share:Total market share of top 4 players was 63% in 2013, of which Snow has 23%.
24%20% 21% 21%
100%
In 2014
14% 14% 14% 16% 17%
20% 21% 21% 22% 23%80%
hare
11% 11%
11% 11% 11% 12% 11%
12% 11% 12% 11% 12%
40%
60%
Mar
ket
sh
32% 32% 31% 28% 27%
11% 11% 11% 11% 10%
20%
M
27%
0%2009 2010 2011 2012 2013
CRE Snow Tsingtao AB InBev Yanjing Key regional players Small regional players
15Source: State Statistical Bureau and CR Snow
CRE Snow Tsingtao AB InBev Yanjing Key regional players Small regional players
“Prepare the best taste for you"
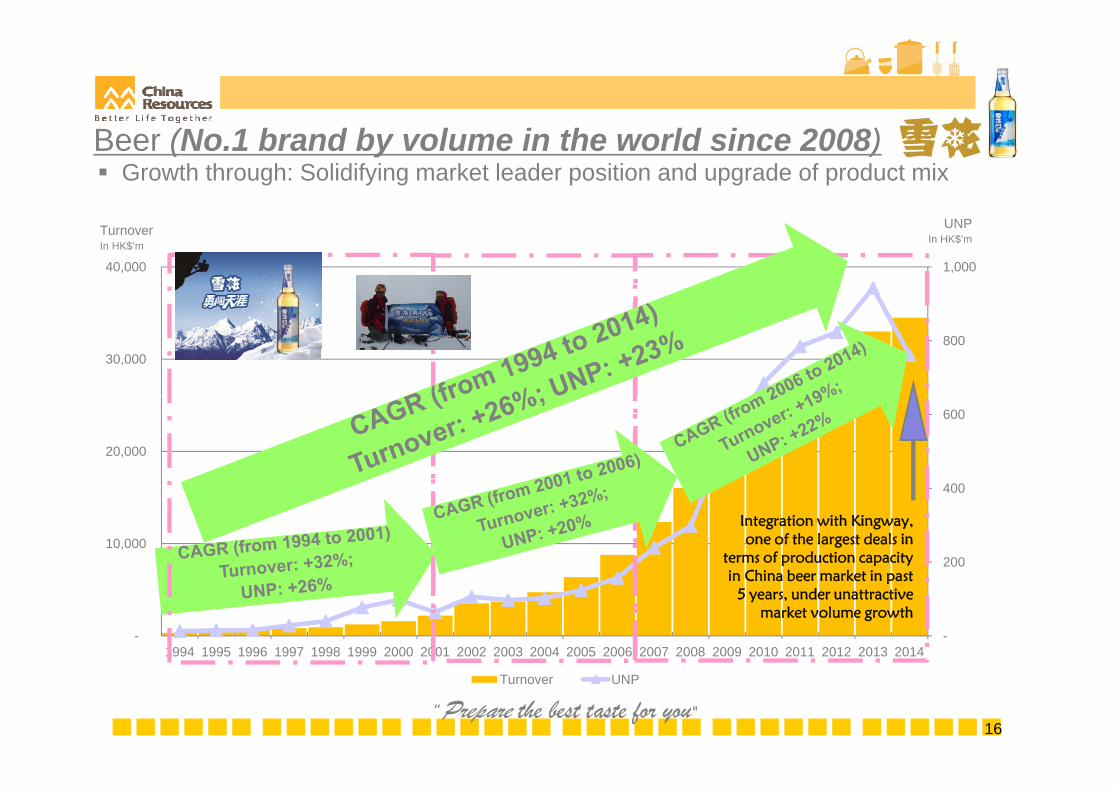
Beer (No.1 brand by volume in the world since 2008) Growth through: Solidifying market leader position and upgrade of product mix
1,000 40,000
TurnoverIn HK$’m
UNPIn HK$’m
800 30,000
400
600
20,000
200
400
10,000
Integration with Kingway, one of the largest deals in
terms of production capacity in China beer market in past
--1994 1995 1996 1997 1998 1999 2000 2001 2002 2003 2004 2005 2006 2007 2008 2009 2010 2011 2012 2013 2014
in China beer market in past 5 years, under unattractive
market volume growth
16
Turnover UNP
“Prepare the best taste for you"
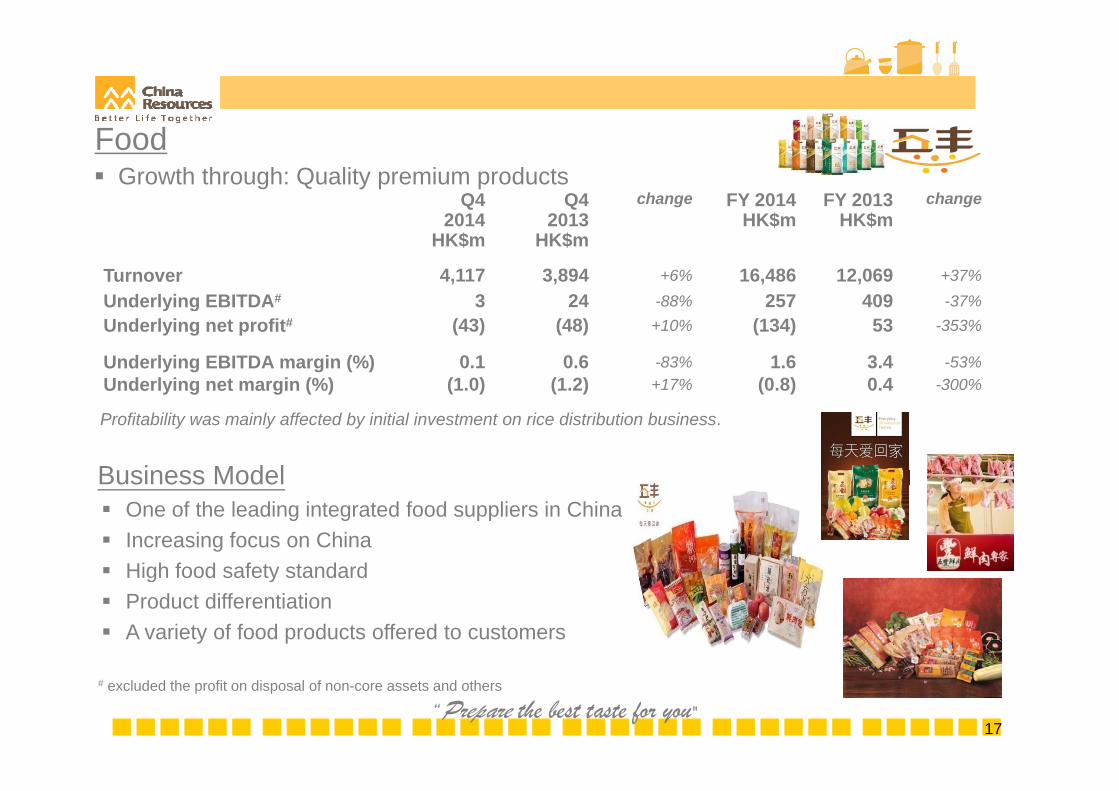
Food Growth through: Quality premium products
Q42014
Q42013
change FY 2014HK$
FY 2013HK$
change2014
HK$m2013
HK$mHK$m HK$m
Turnover 4,117 3,894 +6% 16,486 12,069 +37%
Underlying EBITDA# 3 24 -88% 257 409 -37%Underlying EBITDA 3 24 88% 257 409 37%Underlying net profit# (43) (48) +10% (134) 53 -353%
Underlying EBITDA margin (%) 0.1 0.6 -83% 1.6 3.4 -53%Underlying net margin (%) (1.0) (1.2) +17% (0.8) 0.4 -300%
Business Model
Profitability was mainly affected by initial investment on rice distribution business.
One of the leading integrated food suppliers in China Increasing focus on China High food safety standardHigh food safety standard Product differentiation A variety of food products offered to customers
17
# excluded the profit on disposal of non-core assets and others
“Prepare the best taste for you"
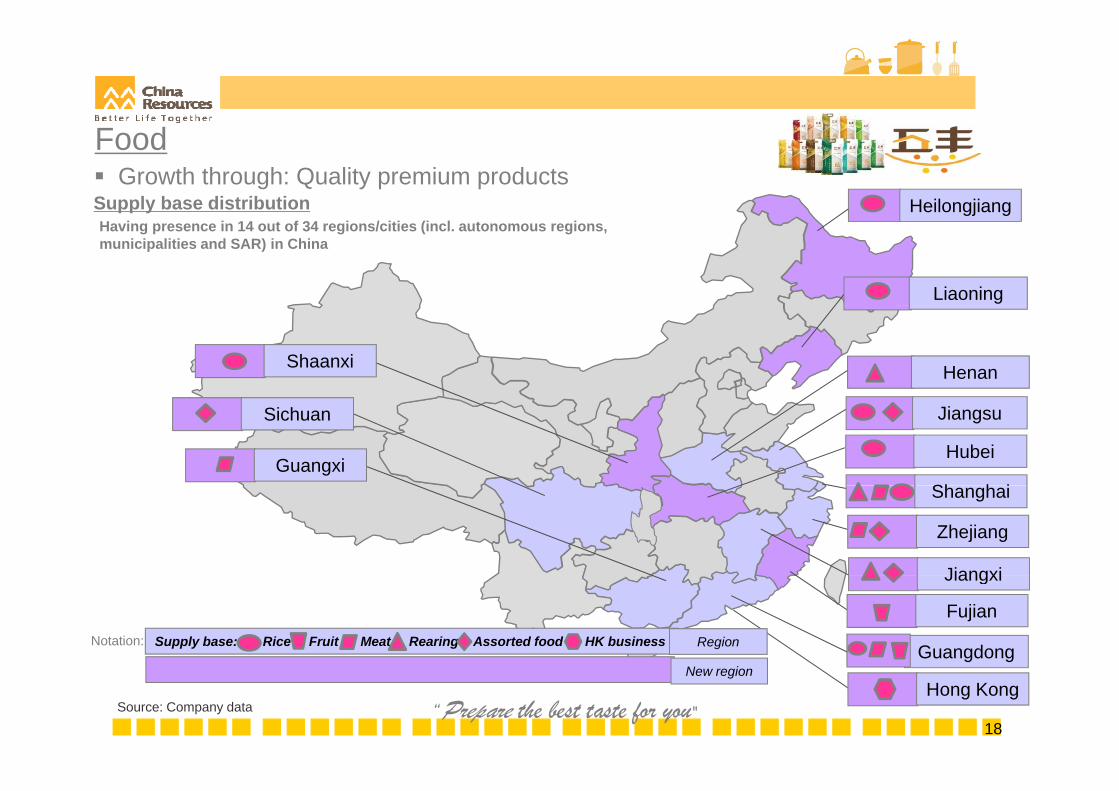
Supply base distribution
Food Growth through: Quality premium products
HeilongjiangHaving presence in 14 out of 34 regions/cities (incl. autonomous regions, municipalities and SAR) in China
Liaoning
HenanShaanxi
Sh h i
Jiangsu
Hubei
Sichuan
GuangxiShanghai
Zhejiang
JiangxiJiangxi
Fujian
GuangdongNotation: Supply base: Rice Fruit Meat Rearing Assorted food HK business Region
18Source: Company data
Hong KongNew region
“Prepare the best taste for you"
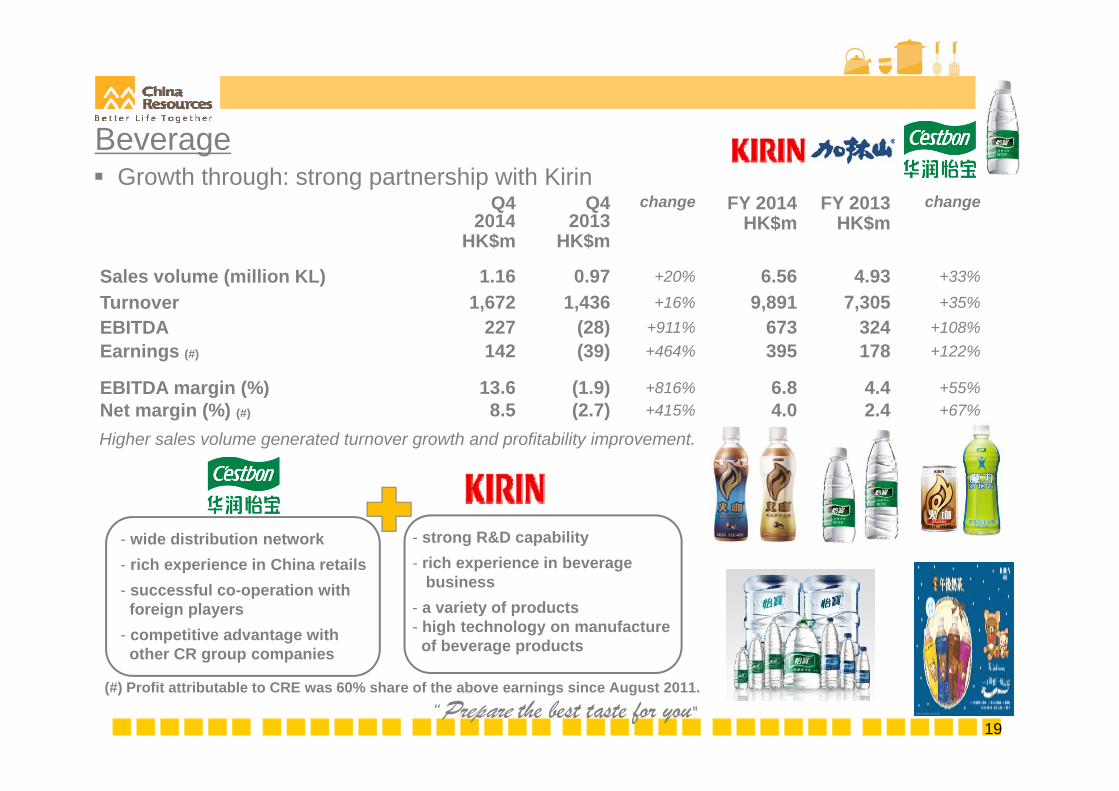
Beverage Growth through: strong partnership with Kirin
Q42014
Q42013
change FY 2014HK$
FY 2013HK$
change2014
HK$m2013
HK$mHK$m HK$m
Sales volume (million KL) 1.16 0.97 +20% 6.56 4.93 +33%
Turnover 1 672 1 436 +16% 9 891 7 305 +35%Turnover 1,672 1,436 +16% 9,891 7,305 +35%EBITDA 227 (28) +911% 673 324 +108%Earnings (#) 142 (39) +464% 395 178 +122%
EBITDA margin (%) 13.6 (1.9) +816% 6.8 4.4 +55%
Higher sales volume generated turnover growth and profitability improvement.
g ( ) ( )Net margin (%) (#) 8.5 (2.7) +415% 4.0 2.4 +67%
- strong R&D capability- rich experience in beverage
- wide distribution network- rich experience in China retails
business- a variety of products- high technology on manufacture
of beverage products
- successful co-operation with foreign players
- competitive advantage with other CR group companies
19
(#) Profit attributable to CRE was 60% share of the above earnings since August 2011. “Prepare the best taste for you"
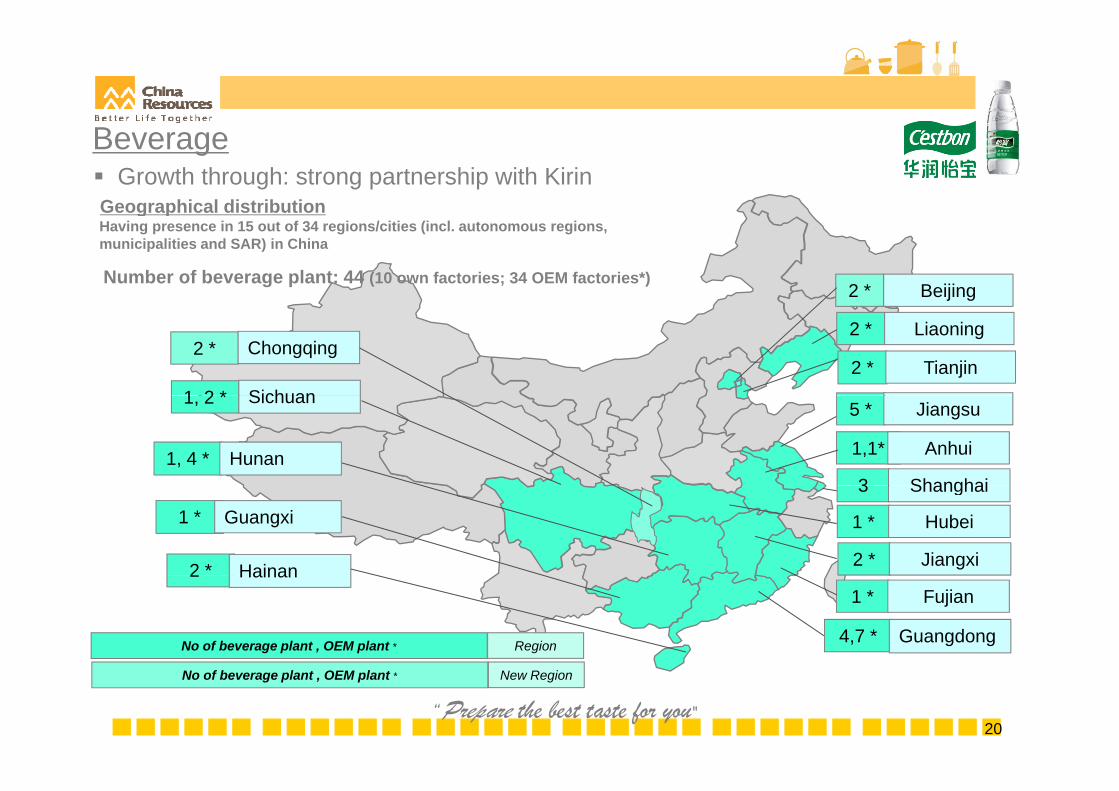
Beverage
Geographical distribution Growth through: strong partnership with Kirin
g p
Number of beverage plant: 44 (10 own factories; 34 OEM factories*)
Having presence in 15 out of 34 regions/cities (incl. autonomous regions, municipalities and SAR) in China
2 * Beijing
2 * Tianjin1 2 * Sichuan
2 * Liaoning2 * Chongqing
5 * Jiangsu
1, 4 * Hunan
1, 2 * Sichuan
1,1* Anhui
3 Shanghai
2 * Hainan
1 * Guangxi
3 Shanghai
1 * Hubei
2 * Jiangxi2 Hainan
4,7 * Guangdong
1 * Fujian
No of beverage plant , OEM plant * Region
20
No of beverage plant , OEM plant * New Region
“Prepare the best taste for you"
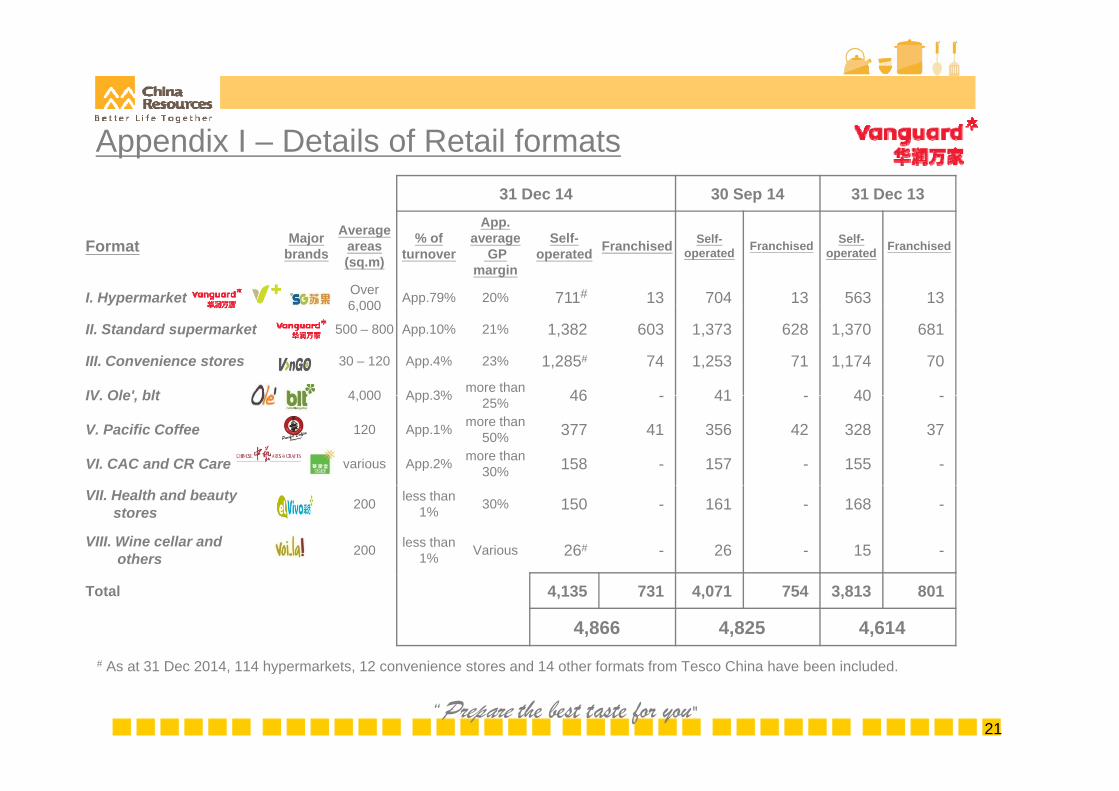
Appendix I – Details of Retail formats31 Dec 14 30 Sep 14 31 Dec 13
Format Major brands
Average areas (sq.m)
% of turnover
App. average
GP margin
Self-operated Franchised Self-
operated Franchised Self-operated Franchised
I. Hypermarket Over 6 000 App.79% 20% 711# 13 704 13 563 13 6,000
II. Standard supermarket 500 – 800 App.10% 21% 1,382 603 1,373 628 1,370 681
III. Convenience stores 30 – 120 App.4% 23% 1,285# 74 1,253 71 1,174 70
IV Ole' blt 4 000 App 3% more than 46 41 40IV. Ole , blt 4,000 App.3% 25% 46 - 41 - 40 -
V. Pacific Coffee 120 App.1% more than 50% 377 41 356 42 328 37
VI. CAC and CR Care various App.2% more than 30% 158 - 157 - 155 -
VII. Health and beauty stores 200 less than
1% 30% 150 - 161 - 168 -
VIII. Wine cellar and others 200 less than
1% Various 26# - 26 - 15 -
Total 4,135 731 4,071 754 3,813 801
4,866 4,825 4,614
# As at 31 Dec 2014 114 hypermarkets 12 convenience stores and 14 other formats from Tesco China have been included
21
# As at 31 Dec 2014, 114 hypermarkets, 12 convenience stores and 14 other formats from Tesco China have been included.
“Prepare the best taste for you"
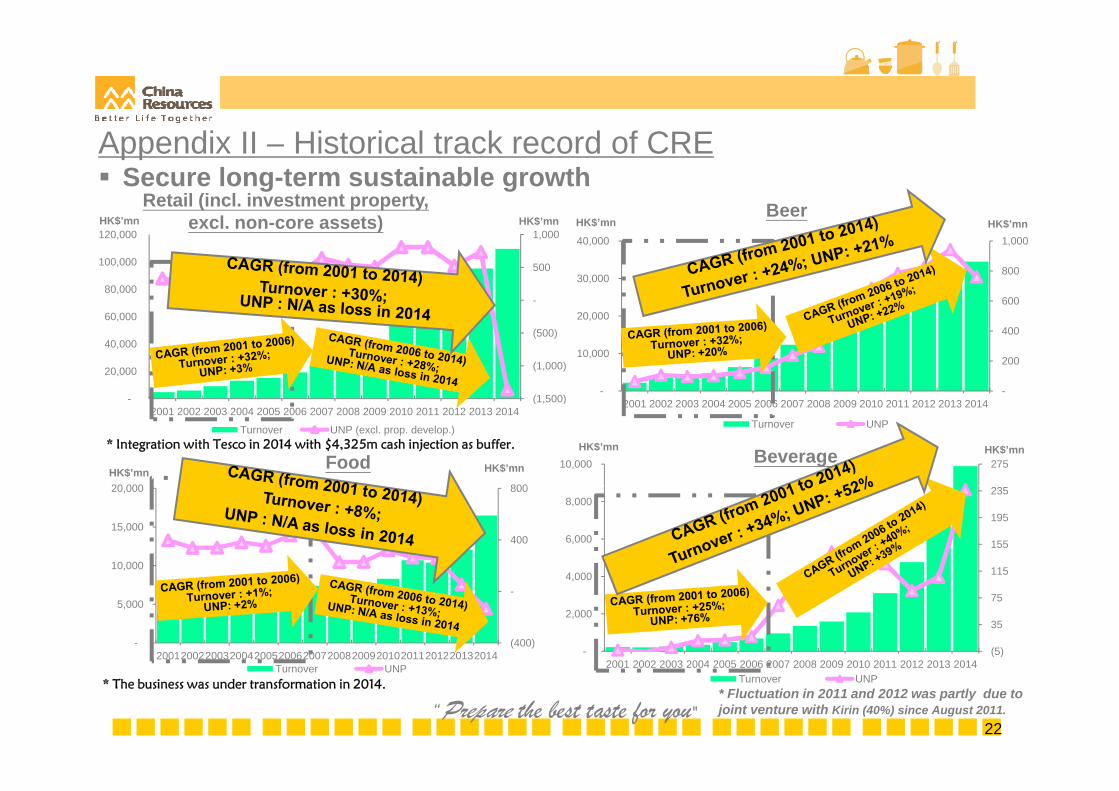
Secure long-term sustainable growthRetail (incl. investment property,
l t ) Beer
Appendix II – Historical track record of CRE
excl. non-core assets) Beer
600
800
1,000
30,000
40,000 HK$’mnHK$’mn
-
500
1,000
80,000
100,000
120,000 HK$’mn HK$’mn
-
200
400
-
10,000
20,000
(1 500)
(1,000)
(500)
20,000
40,000
60,000
2001 2002 2003 2004 2005 2006 2007 2008 2009 2010 2011 2012 2013 2014
Turnover UNP
275 10,000 Beverage
(1,500)-2001 2002 2003 2004 2005 2006 2007 2008 2009 2010 2011 2012 2013 2014
Turnover UNP (excl. prop. develop.)
HK$’mnHK$’mn* Integration with Tesco in 2014 with $4,325m cash injection as buffer.
80020 000
FoodHK$’mn HK$’mn
115
155
195
235
4 000
6,000
8,000
400
800
10,000
15,000
20,000
(5)
35
75
-
2,000
4,000
2001 2002 2003 2004 2005 2006 2007 2008 2009 2010 2011 2012 2013 2014
(400)
-
-
5,000
20012002200320042005200620072008200920102011201220132014T UNP
22
* Fluctuation in 2011 and 2012 was partly due to joint venture with Kirin (40%) since August 2011.
2001 2002 2003 2004 2005 2006 2007 2008 2009 2010 2011 2012 2013 2014Turnover UNP
Turnover UNP* The business was under transformation in 2014.
“Prepare the best taste for you"
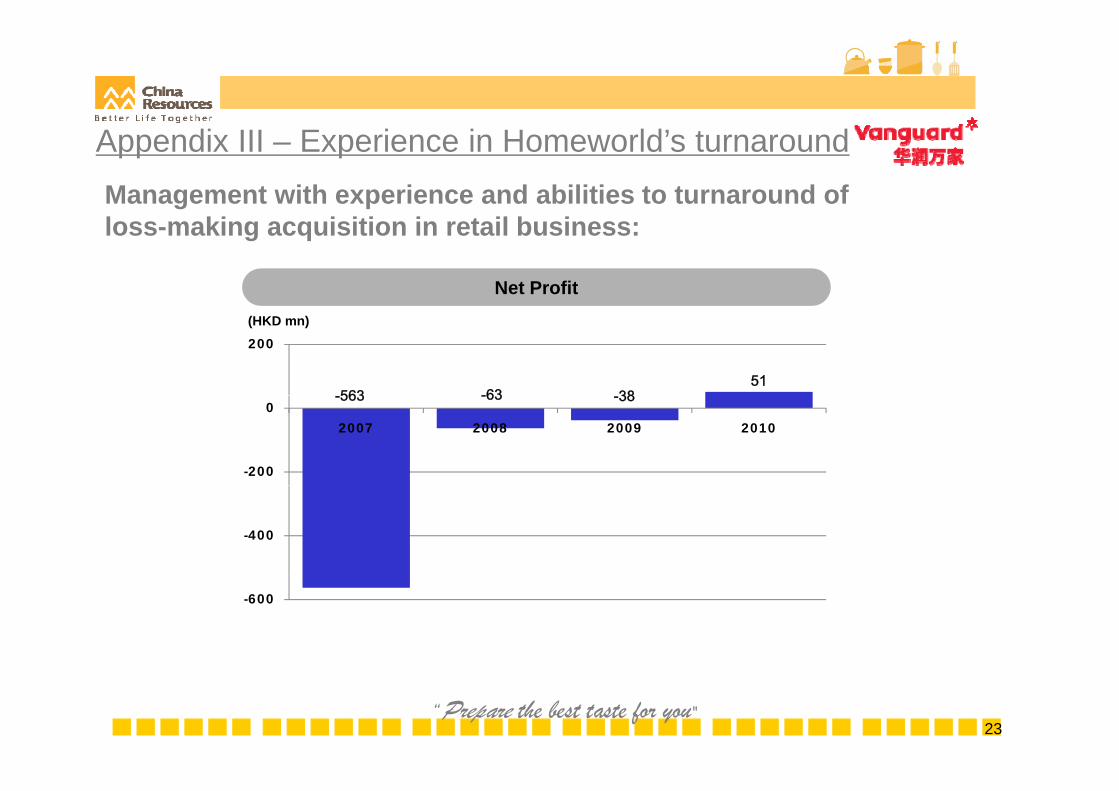
Management with experience and abilities to turnaround of
Appendix III – Experience in Homeworld’s turnaround
loss-making acquisition in retail business:
Net Profit(HKD mn)
563 -63 3851
200
-563 -63 -38
-200
02007 2008 2009 2010
-400
-600
23“Prepare the best taste for you"
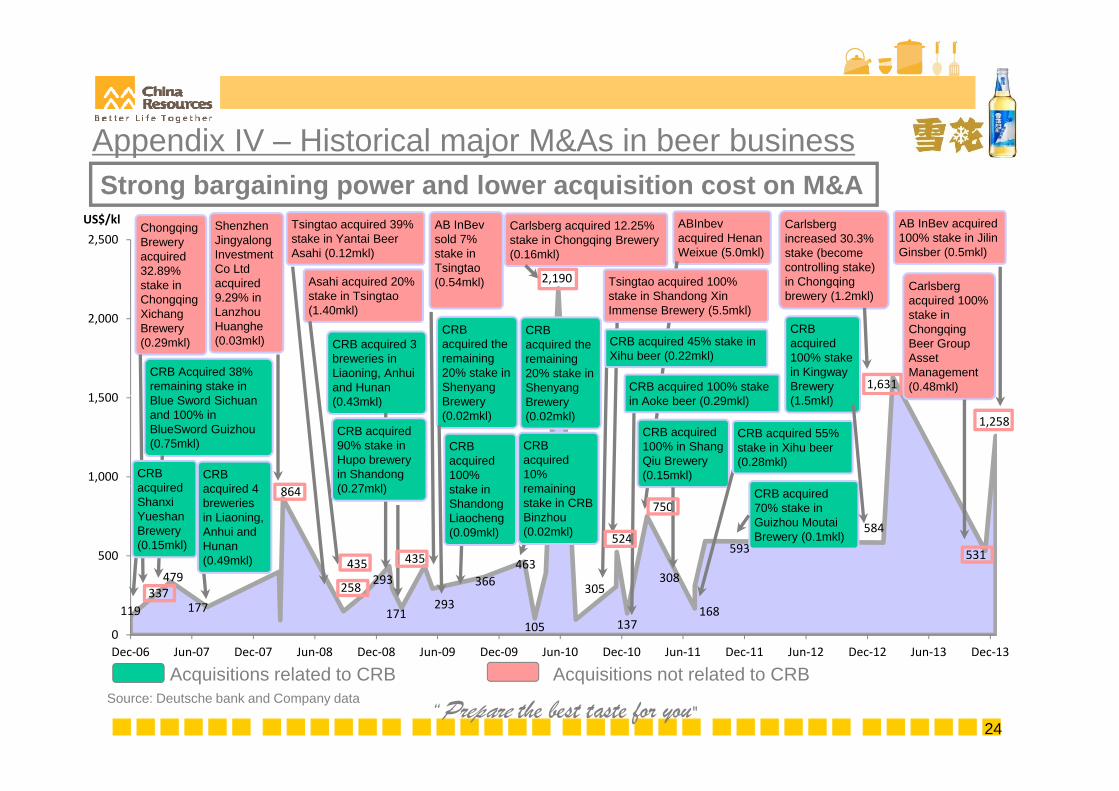
Strong bargaining power and lower acquisition cost on M&AAppendix IV – Historical major M&As in beer business
US$/kl
2,190
2,500US$/kl
Chongqing Brewery acquired 32.89% stake in Chongqing
Shenzhen Jingyalong Investment Co Ltd acquired 9.29% in
Asahi acquired 20% stake in Tsingtao (1 40 kl)
Tsingtao acquired 39% stake in Yantai Beer Asahi (0.12mkl)
AB InBev sold 7% stake in Tsingtao (0.54mkl)
Carlsberg acquired 12.25% stake in Chongqing Brewery(0.16mkl)
ABInbev acquired Henan Weixue (5.0mkl)
Tsingtao acquired 100% stake in Shandong Xin I B ( kl)
Carlsberg increased 30.3% stake (become controlling stake) in Chongqing brewery (1.2mkl)
Carlsberg acquired 100%
AB InBev acquired 100% stake in Jilin Ginsber (0.5mkl)
1,6311 500
2,000gq g
Xichang Brewery (0.29mkl)
Lanzhou Huanghe(0.03mkl)
(1.40mkl)
CRB acquired 3 breweries in Liaoning, Anhui and Hunan
CRB acquired the remaining 20% stake in Shenyang
CRB Acquired 38% remaining stake in
CRB acquired the remaining 20% stake in Shenyang
Immense Brewery (5.5mkl)
CRB acquired 45% stake in Xihu beer (0.22mkl)
CRB acquired 100% stake
qstake in Chongqing Beer Group Asset Management (0.48mkl)
CRB acquired 100% stake in Kingway Brewery
1,258
1,000
1,500 (0.43mkl) Brewery (0.02mkl)
CRB acquired 100% t k i
Blue Sword Sichuan and 100% in BlueSword Guizhou (0.75mkl)
CRB acq ired
CRB i d 4
CRB acquired 90% stake in Hupo brewery in Shandong (0 27 kl)
Brewery (0.02mkl)
CRB acquired 10%
i i
in Aoke beer (0.29mkl)
CRB acquired 100% in Shang Qiu Brewery (0.15mkl)
CRB acquired 55% stake in Xihu beer (0.28mkl)
(1.5mkl)
864
435 435 463
524
750
308
593584
531500
stake in Shandong Liaocheng (0.09mkl)
479
acquired Shanxi Yueshan Brewery (0.15mkl)
acquired 4 breweries in Liaoning, Anhui and Hunan (0.49mkl)
(0.27mkl) remaining stake in CRB Binzhou (0.02mkl)
CRB acquired 70% stake in Guizhou Moutai Brewery (0.1mkl)
119337
177258 293
171293
366
105
305
137168
308
0Dec‐06 Jun‐07 Dec‐07 Jun‐08 Dec‐08 Jun‐09 Dec‐09 Jun‐10 Dec‐10 Jun‐11 Dec‐11 Jun‐12 Dec‐12 Jun‐13 Dec‐13
479
24
Acquisitions related to CRB Acquisitions not related to CRBSource: Deutsche bank and Company data
“Prepare the best taste for you"
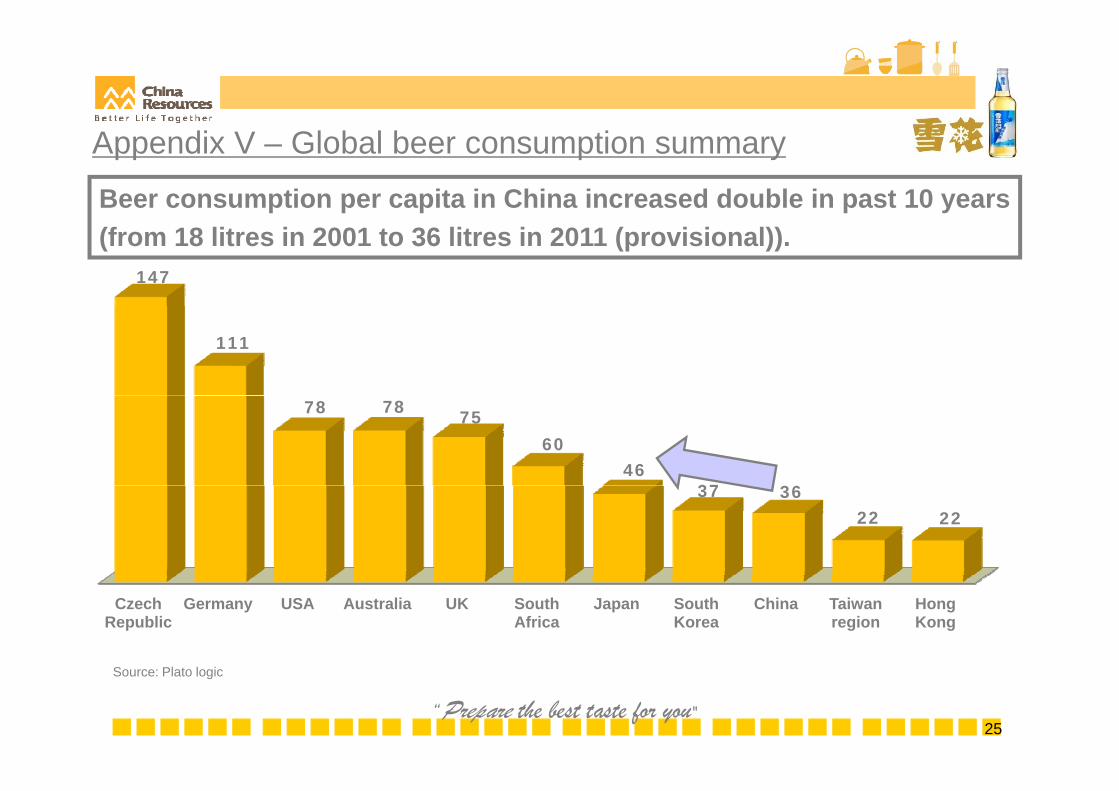
Appendix V – Global beer consumption summary
Beer consumption per capita in China increased double in past 10 years
147
(from 18 litres in 2001 to 36 litres in 2011 (provisional)).
111
78 78 7560
4637 3637 36
22 22
Czech Republic
Germany USA Australia UK South Africa
Japan South Korea
China Taiwan region
Hong Kong
25
Source: Plato logic
“Prepare the best taste for you"
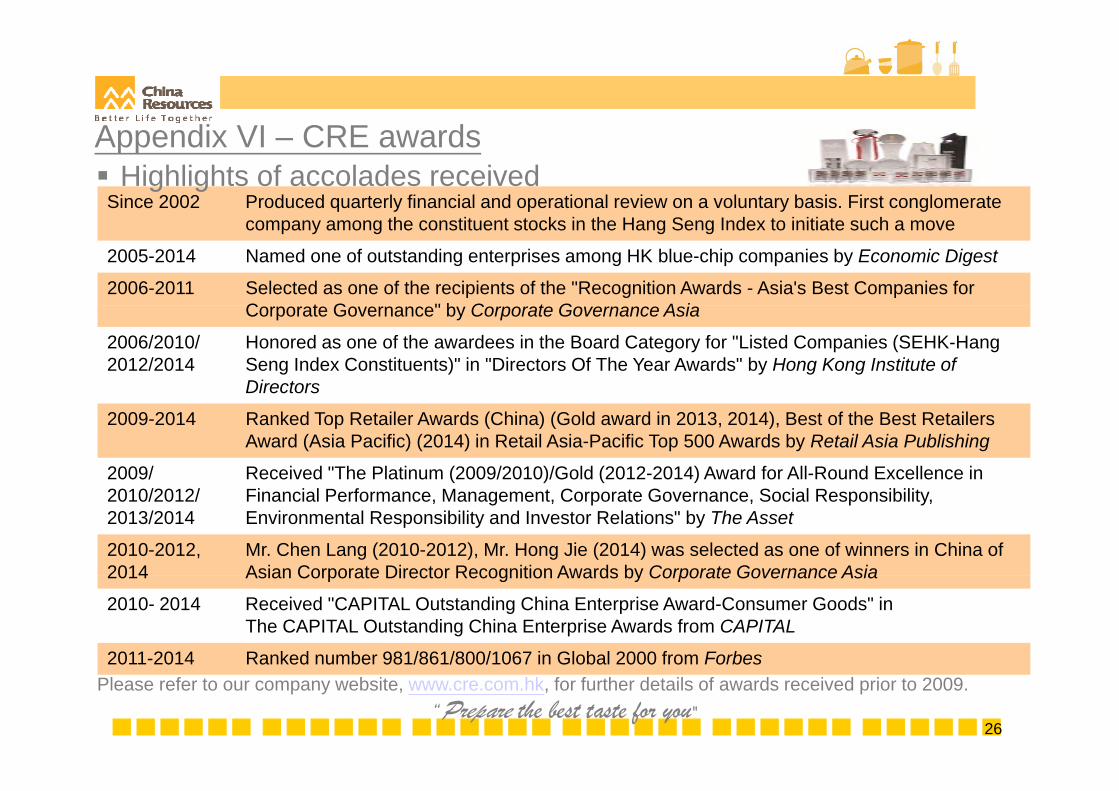
A di VI CRE dAppendix VI – CRE awards
Since 2002 Produced quarterly financial and operational review on a voluntary basis. First conglomerate Highlights of accolades received
company among the constituent stocks in the Hang Seng Index to initiate such a move
2005-2014 Named one of outstanding enterprises among HK blue-chip companies by Economic Digest
2006-2011 Selected as one of the recipients of the "Recognition Awards - Asia's Best Companies for C t G " b C t G A iCorporate Governance" by Corporate Governance Asia
2006/2010/2012/2014
Honored as one of the awardees in the Board Category for "Listed Companies (SEHK-Hang Seng Index Constituents)" in "Directors Of The Year Awards" by Hong Kong Institute of Directors
2009-2014 Ranked Top Retailer Awards (China) (Gold award in 2013, 2014), Best of the Best Retailers Award (Asia Pacific) (2014) in Retail Asia-Pacific Top 500 Awards by Retail Asia Publishing
2009/ Received "The Platinum (2009/2010)/Gold (2012-2014) Award for All-Round Excellence in 2010/2012/2013/2014
Financial Performance, Management, Corporate Governance, Social Responsibility, Environmental Responsibility and Investor Relations" by The Asset
2010-2012, 2014
Mr. Chen Lang (2010-2012), Mr. Hong Jie (2014) was selected as one of winners in China of Asian Corporate Director Recognition Awards by Corporate Governance Asia2014 Asian Corporate Director Recognition Awards by Corporate Governance Asia
2010- 2014 Received "CAPITAL Outstanding China Enterprise Award-Consumer Goods" inThe CAPITAL Outstanding China Enterprise Awards from CAPITAL
2011-2014 Ranked number 981/861/800/1067 in Global 2000 from Forbes
26
Please refer to our company website, www.cre.com.hk, for further details of awards received prior to 2009.“Prepare the best taste for you"
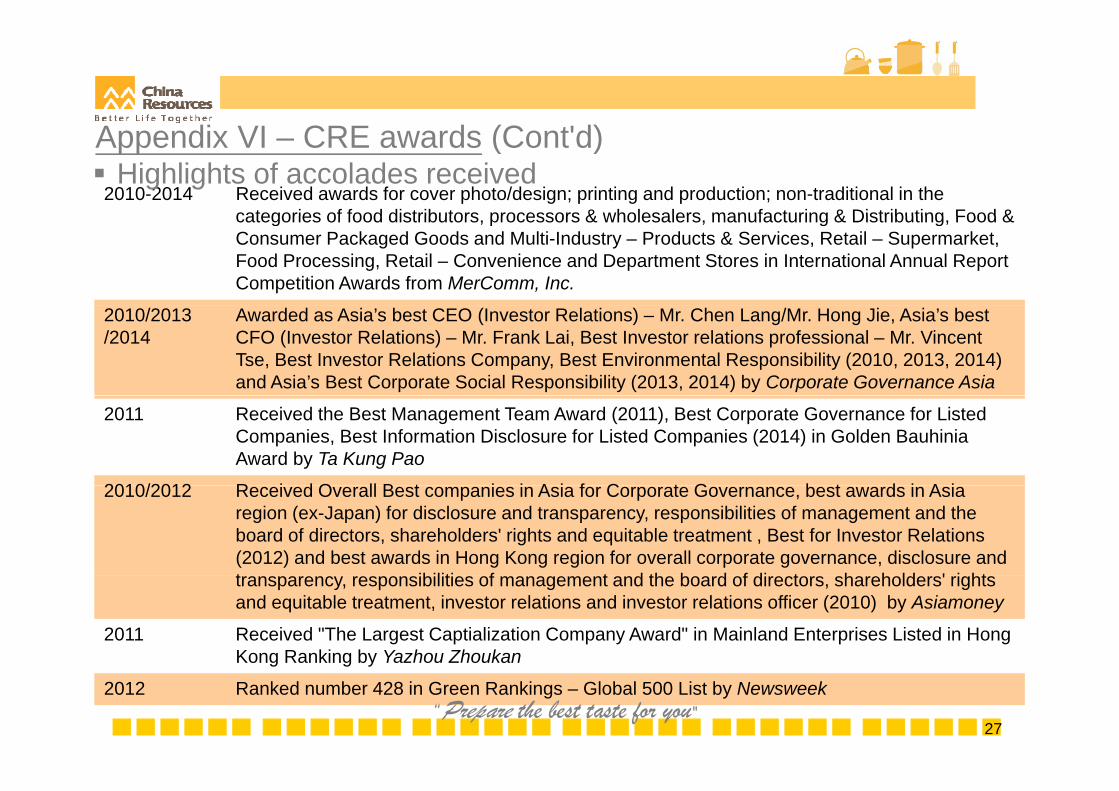
A di VI CRE d (C t'd)2010-2014 Received awards for cover photo/design; printing and production; non-traditional in the
categories of food distributors processors & wholesalers manufacturing & Distributing Food &
Appendix VI – CRE awards (Cont'd) Highlights of accolades received
categories of food distributors, processors & wholesalers, manufacturing & Distributing, Food & Consumer Packaged Goods and Multi-Industry – Products & Services, Retail – Supermarket, Food Processing, Retail – Convenience and Department Stores in International Annual Report Competition Awards from MerComm, Inc.
2010/2013/2014
Awarded as Asia’s best CEO (Investor Relations) – Mr. Chen Lang/Mr. Hong Jie, Asia’s best CFO (Investor Relations) – Mr. Frank Lai, Best Investor relations professional – Mr. Vincent Tse, Best Investor Relations Company, Best Environmental Responsibility (2010, 2013, 2014) and Asia’s Best Corporate Social Responsibility (2013, 2014) by Corporate Governance Asia
2011 Received the Best Management Team Award (2011), Best Corporate Governance for Listed Companies, Best Information Disclosure for Listed Companies (2014) in Golden Bauhinia Award by Ta Kung Pao
2010/2012 R i d O ll B t i i A i f C t G b t d i A i2010/2012 Received Overall Best companies in Asia for Corporate Governance, best awards in Asia region (ex-Japan) for disclosure and transparency, responsibilities of management and the board of directors, shareholders' rights and equitable treatment , Best for Investor Relations (2012) and best awards in Hong Kong region for overall corporate governance, disclosure and t ibiliti f t d th b d f di t h h ld ' i httransparency, responsibilities of management and the board of directors, shareholders' rights and equitable treatment, investor relations and investor relations officer (2010) by Asiamoney
2011 Received "The Largest Captialization Company Award" in Mainland Enterprises Listed in Hong Kong Ranking by Yazhou Zhoukan
27
g g y
2012 Ranked number 428 in Green Rankings – Global 500 List by Newsweek“Prepare the best taste for you"
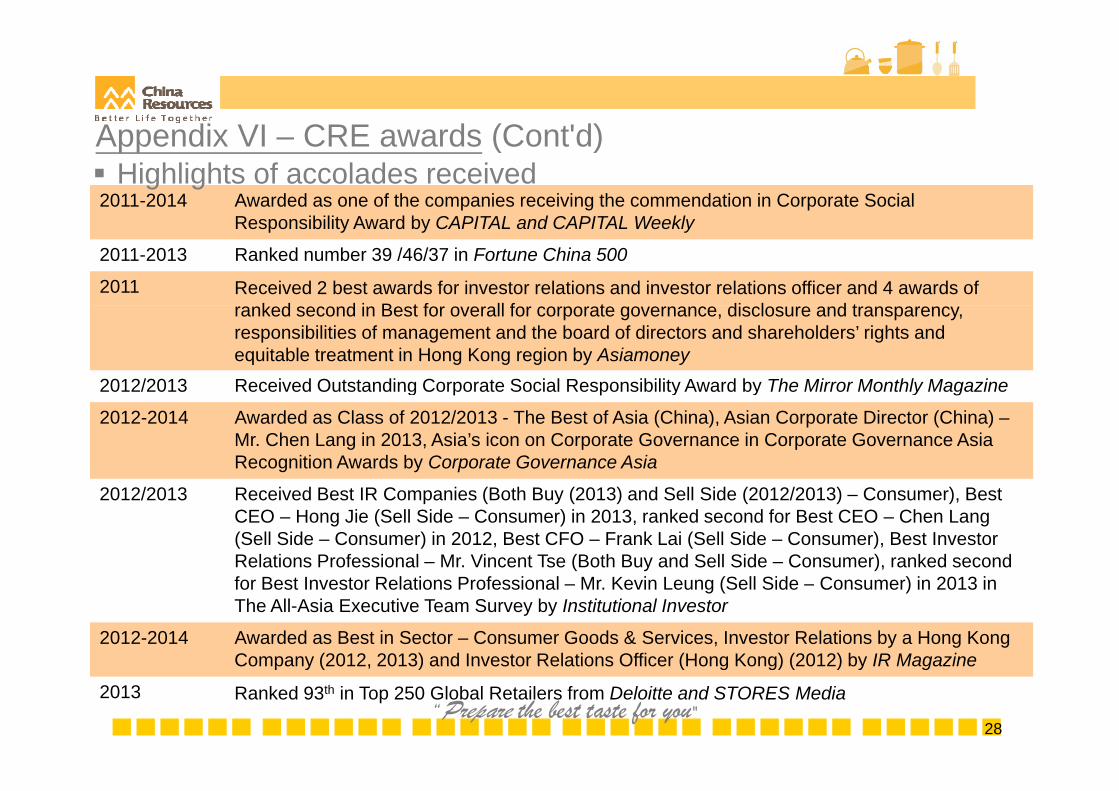
A di VI CRE d (C t'd)
2011-2014 Awarded as one of the companies receiving the commendation in Corporate Social R ibilit A d b CAPITAL d CAPITAL W kl
Appendix VI – CRE awards (Cont'd) Highlights of accolades received
Responsibility Award by CAPITAL and CAPITAL Weekly
2011-2013 Ranked number 39 /46/37 in Fortune China 500
2011 Received 2 best awards for investor relations and investor relations officer and 4 awards of k d d i B t f ll f t di l d tranked second in Best for overall for corporate governance, disclosure and transparency,
responsibilities of management and the board of directors and shareholders’ rights and equitable treatment in Hong Kong region by Asiamoney
2012/2013 Received Outstanding Corporate Social Responsibility Award by The Mirror Monthly Magazineg y y y
2012-2014 Awarded as Class of 2012/2013 - The Best of Asia (China), Asian Corporate Director (China) –Mr. Chen Lang in 2013, Asia’s icon on Corporate Governance in Corporate Governance Asia Recognition Awards by Corporate Governance Asia
2012/2013 Received Best IR Companies (Both Buy (2013) and Sell Side (2012/2013) – Consumer), Best CEO – Hong Jie (Sell Side – Consumer) in 2013, ranked second for Best CEO – Chen Lang (Sell Side – Consumer) in 2012, Best CFO – Frank Lai (Sell Side – Consumer), Best Investor Relations Professional – Mr. Vincent Tse (Both Buy and Sell Side – Consumer), ranked second for Best Investor Relations Professional – Mr. Kevin Leung (Sell Side – Consumer) in 2013 in The All-Asia Executive Team Survey by Institutional Investor
2012-2014 Awarded as Best in Sector – Consumer Goods & Services, Investor Relations by a Hong Kong Company (2012, 2013) and Investor Relations Officer (Hong Kong) (2012) by IR Magazine
28
Company (2012, 2013) and Investor Relations Officer (Hong Kong) (2012) by IR Magazine
2013 Ranked 93th in Top 250 Global Retailers from Deloitte and STORES Media“Prepare the best taste for you"
A di VI CRE d (C t'd)
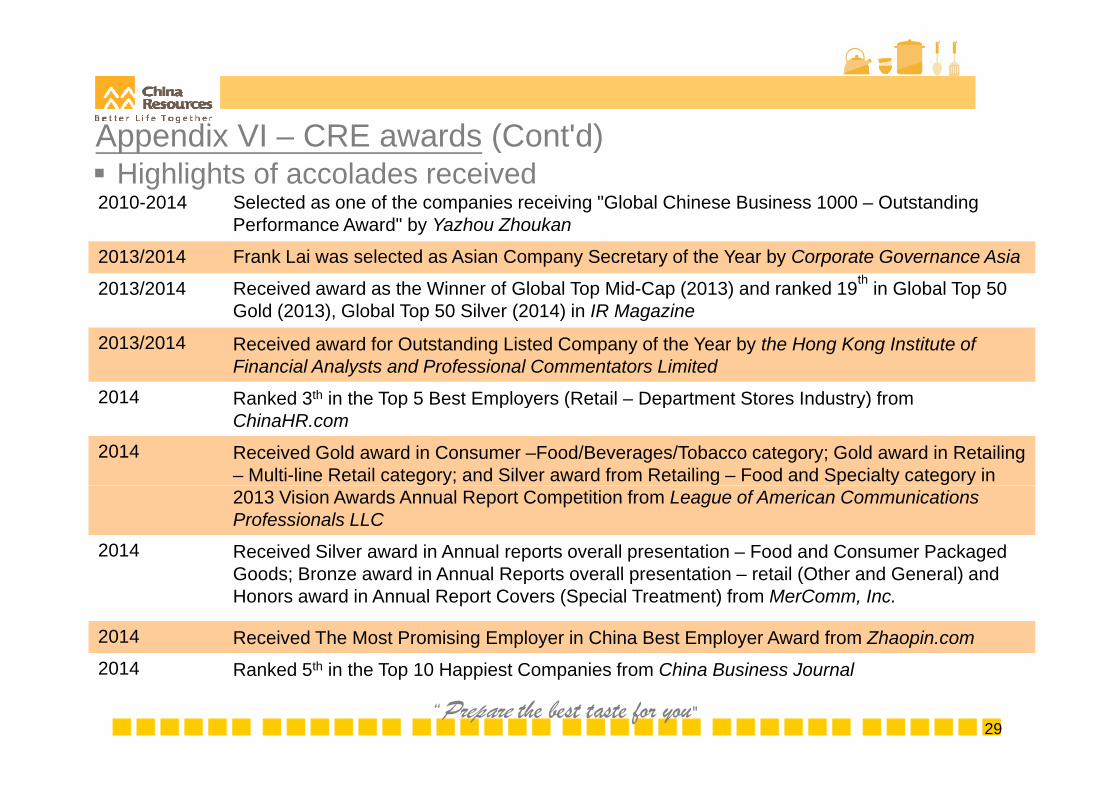
2010-2014 Selected as one of the companies receiving "Global Chinese Business 1000 – Outstanding
Appendix VI – CRE awards (Cont'd) Highlights of accolades received
Performance Award" by Yazhou Zhoukan
2013/2014 Frank Lai was selected as Asian Company Secretary of the Year by Corporate Governance Asia
2013/2014 Received award as the Winner of Global Top Mid-Cap (2013) and ranked 19th in Global Top 50 G ld (2013) Gl b l T 50 Sil (2014) i IR M iGold (2013), Global Top 50 Silver (2014) in IR Magazine
2013/2014 Received award for Outstanding Listed Company of the Year by the Hong Kong Institute of Financial Analysts and Professional Commentators Limited
2014 Ranked 3th in the Top 5 Best Employers (Retail Department Stores Industry) from2014 Ranked 3th in the Top 5 Best Employers (Retail – Department Stores Industry) from ChinaHR.com
2014 Received Gold award in Consumer –Food/Beverages/Tobacco category; Gold award in Retailing – Multi-line Retail category; and Silver award from Retailing – Food and Specialty category in 2013 Vision Awards Annual Report Competition from League of American Communications Professionals LLC
2014 Received Silver award in Annual reports overall presentation – Food and Consumer Packaged Goods; Bronze award in Annual Reports overall presentation – retail (Other and General) andGoods; Bronze award in Annual Reports overall presentation – retail (Other and General) and Honors award in Annual Report Covers (Special Treatment) from MerComm, Inc.
2014 Received The Most Promising Employer in China Best Employer Award from Zhaopin.com2014 R k d 5th i th T 10 H i t C i f Chi B i J l
29
2014 Ranked 5th in the Top 10 Happiest Companies from China Business Journal
“Prepare the best taste for you"
DisclaimerData and information contained in this presentation is provided for informational purposes only. NeitherChi R E t i Li it d f it b idi i h ll b li bl f d l iChina Resources Enterprise, Limited nor any of its subsidiaries shall be liable for any errors or delays inthe content, or for any actions taken in reliance thereon.
This presentation and subsequent discussion may contain forward-looking statements that are based onThis presentation and subsequent discussion may contain forward looking statements that are based onthe current beliefs, assumptions, expectations, estimates, and projections of the management of ChinaResources Enterprise, Limited about its business and the industry and markets in which it operates.These forward-looking statements include, without limitation, statements relating to revenues, earningsg , , g , gand stock performance. The words “believe”, “intend”, “expect”, “anticipate”, “project”, “estimate”, “predict”and similar expressions are also intended to identify forward-looking statements. These statements arenot guarantees of future performance and are subject to risks, uncertainties and other factors, includingg p j gbut not limited to price fluctuations, actual demand, exchange rate fluctuations, development outcomes,market shares, competition, environmental risks, changes in legal, financial and regulatory frameworks,international economic and financial market conditions, political risks, project delay, project approval, costestimates and other risks, which are beyond the control of China Resources Enterprise, Limited and aredifficult to predict. Consequently, actual results could differ materially from those expressed or forecastedin the forward-looking statements.
30“Prepare the best taste for you"