Embed Size (px)
DESCRIPTION
for quarter ending September 30, 2010
Citation preview
Financial Report and Investment Report
for Quarter Ended September 30, 2010
4th Fiscal Quarter – 2009 Executive Financial Summary
Executive Summary Quarter ended 9/30/10
I. Quarterly Financial Analysis
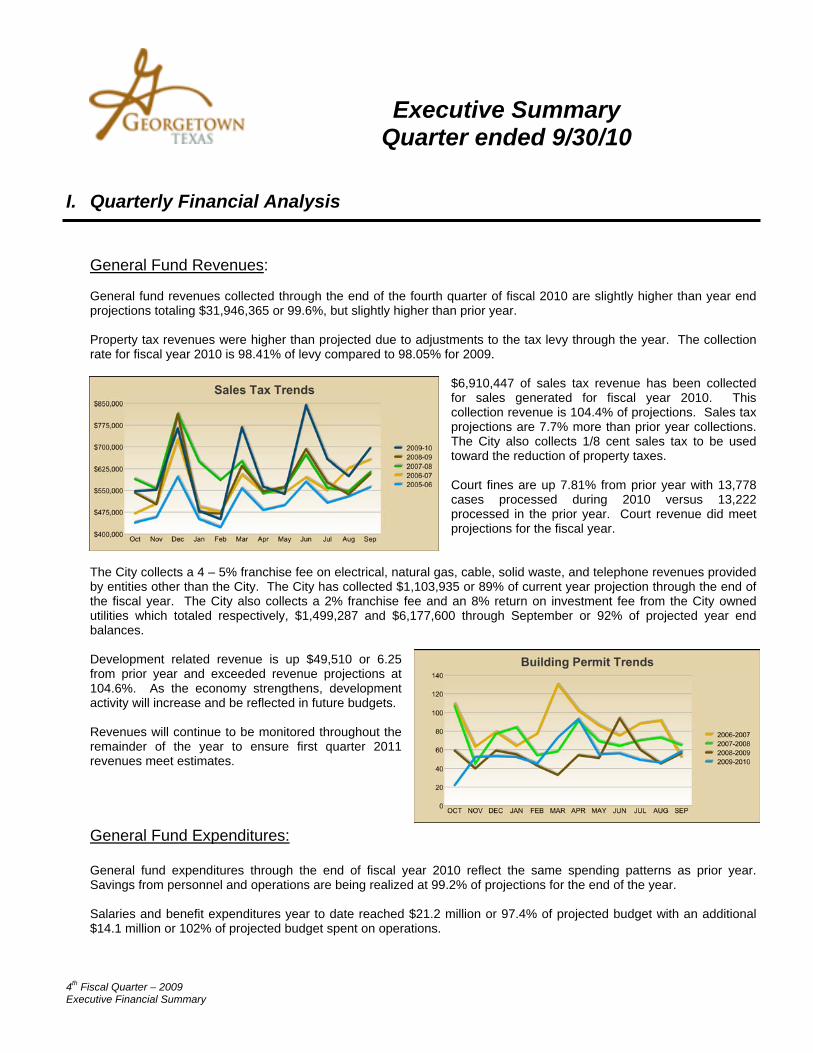
General Fund Revenues: General fund revenues collected through the end of the fourth quarter of fiscal 2010 are slightly higher than year end projections totaling $31,946,365 or 99.6%, but slightly higher than prior year. Property tax revenues were higher than projected due to adjustments to the tax levy through the year. The collection rate for fiscal year 2010 is 98.41% of levy compared to 98.05% for 2009.
$6,910,447 of sales tax revenue has been collected for sales generated for fiscal year 2010. This collection revenue is 104.4% of projections. Sales tax projections are 7.7% more than prior year collections. The City also collects 1/8 cent sales tax to be used toward the reduction of property taxes. Court fines are up 7.81% from prior year with 13,778 cases processed during 2010 versus 13,222 processed in the prior year. Court revenue did meet projections for the fiscal year.
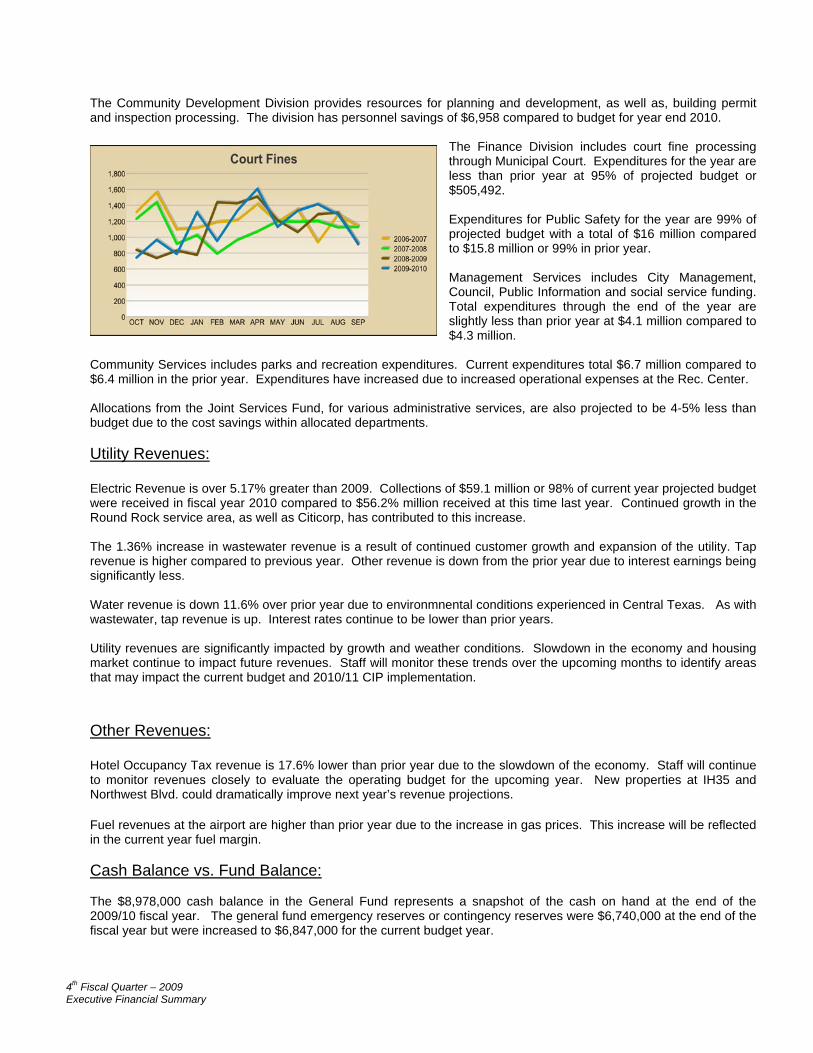
The City collects a 4 – 5% franchise fee on electrical, natural gas, cable, solid waste, and telephone revenues provided by entities other than the City. The City has collected $1,103,935 or 89% of current year projection through the end of the fiscal year. The City also collects a 2% franchise fee and an 8% return on investment fee from the City owned utilities which totaled respectively, $1,499,287 and $6,177,600 through September or 92% of projected year end balances. Development related revenue is up $49,510 or 6.25 from prior year and exceeded revenue projections at 104.6%. As the economy strengthens, development activity will increase and be reflected in future budgets. Revenues will continue to be monitored throughout the remainder of the year to ensure first quarter 2011 revenues meet estimates. General Fund Expenditures: General fund expenditures through the end of fiscal year 2010 reflect the same spending patterns as prior year. Savings from personnel and operations are being realized at 99.2% of projections for the end of the year. Salaries and benefit expenditures year to date reached $21.2 million or 97.4% of projected budget with an additional $14.1 million or 102% of projected budget spent on operations.
4th Fiscal Quarter – 2009 Executive Financial Summary
The Community Development Division provides resources for planning and development, as well as, building permit and inspection processing. The division has personnel savings of $6,958 compared to budget for year end 2010.
The Finance Division includes court fine processing through Municipal Court. Expenditures for the year are less than prior year at 95% of projected budget or $505,492. Expenditures for Public Safety for the year are 99% of projected budget with a total of $16 million compared to $15.8 million or 99% in prior year. Management Services includes City Management, Council, Public Information and social service funding. Total expenditures through the end of the year are slightly less than prior year at $4.1 million compared to $4.3 million.
Community Services includes parks and recreation expenditures. Current expenditures total $6.7 million compared to $6.4 million in the prior year. Expenditures have increased due to increased operational expenses at the Rec. Center. Allocations from the Joint Services Fund, for various administrative services, are also projected to be 4-5% less than budget due to the cost savings within allocated departments. Utility Revenues: Electric Revenue is over 5.17% greater than 2009. Collections of $59.1 million or 98% of current year projected budget were received in fiscal year 2010 compared to $56.2% million received at this time last year. Continued growth in the Round Rock service area, as well as Citicorp, has contributed to this increase. The 1.36% increase in wastewater revenue is a result of continued customer growth and expansion of the utility. Tap revenue is higher compared to previous year. Other revenue is down from the prior year due to interest earnings being significantly less. Water revenue is down 11.6% over prior year due to environmnental conditions experienced in Central Texas. As with wastewater, tap revenue is up. Interest rates continue to be lower than prior years. Utility revenues are significantly impacted by growth and weather conditions. Slowdown in the economy and housing market continue to impact future revenues. Staff will monitor these trends over the upcoming months to identify areas that may impact the current budget and 2010/11 CIP implementation.
Other Revenues: Hotel Occupancy Tax revenue is 17.6% lower than prior year due to the slowdown of the economy. Staff will continue to monitor revenues closely to evaluate the operating budget for the upcoming year. New properties at IH35 and Northwest Blvd. could dramatically improve next year’s revenue projections.
Fuel revenues at the airport are higher than prior year due to the increase in gas prices. This increase will be reflected in the current year fuel margin. Cash Balance vs. Fund Balance: The $8,978,000 cash balance in the General Fund represents a snapshot of the cash on hand at the end of the 2009/10 fiscal year. The general fund emergency reserves or contingency reserves were $6,740,000 at the end of the fiscal year but were increased to $6,847,000 for the current budget year.
4th Fiscal Quarter – 2009 Executive Financial Summary
II. Internal Control
Internal Control Program:
Internal controls are the practices performed by departments to provide management with reasonable assurance that assets are safeguarded and transactions are authorized, valid, complete, and accurate. Elements of a good internal control system include 1) separation of duties; 2) authorization; 3) documentation; and 4) reconciliation. During the 4th quarter of the fiscal year several audits were performed and reported. These internal audits validate the accuracy and validity of the City’s financial records by detail testing on individual transactions and ensuring compliance with City’s financial and administrative policies. Areas reviewed include:
A Travel audit was performed by reviewing individual expense reports and evaluating receipts to ensure compliance with current travel policies.
A procurement card audit was done to ensure compliance with current purchasing policies. A Long Distance usage Audit was performed to prevent excessive use. All bills greater than $1 are
evaluated and substantiated. Fuel usage was audited comparing gallons purchased with monthly usage to verify amounts. Petty Cash and cash drawer audits were performed at various locations to verify cash on hand. A development fee audit was performed by taking a random sample of Planning and Zoning approved
items and correlating them to the development payment receipts in the financial system. A municipal court audit was performed by looking at cases whereby community service or jail time
credit was granted by the Judge. In these cases, no payment was received therefore documentation is crucial.
No other material weaknesses or issues were discovered. All identified items have been or are being addressed by each department.
A copy of the audit results is included at the end of this report.
III. Capital Projects
Capital Improvement Program:
The projects in the Capital Improvement Program (CIP) generally consists of infrastructure and related construction and do not include small capital items such as furniture, equipment, and vehicles. Significant maintenance projects, such as street overlay are not included in the capital project schedules. These maintenance type projects are not capitalized as a fixed asset and are always cash-funded therefore, are considered operational in nature and are included in the departmental operating budget. A report showing the current year budget status as well as, project to date information on the approved capital improvement projects is included in the quarterly financial report. Information on projects completed during the quarter is also provided for review.
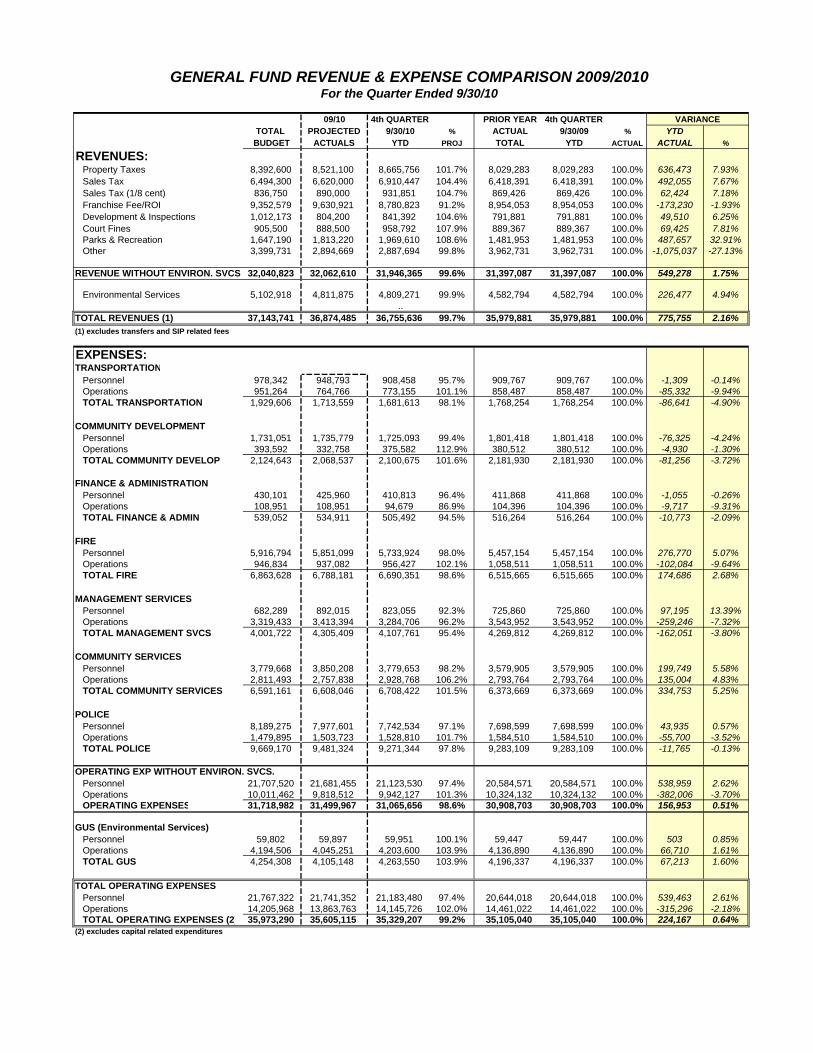
GENERAL FUND REVENUE & EXPENSE COMPARISON 2009/2010For the Quarter Ended 9/30/10
09/10 4th QUARTER PRIOR YEAR 4th QUARTERTOTAL PROJECTED 9/30/10 % ACTUAL 9/30/09 % YTD
BUDGET ACTUALS YTD PROJ TOTAL YTD ACTUAL ACTUAL %
REVENUES:Property Taxes 8,392,600 8,521,100 8,665,756 101.7% 8,029,283 8,029,283 100.0% 636,473 7.93%Sales Tax 6,494,300 6,620,000 6,910,447 104.4% 6,418,391 6,418,391 100.0% 492,055 7.67%Sales Tax (1/8 cent) 836,750 890,000 931,851 104.7% 869,426 869,426 100.0% 62,424 7.18%Franchise Fee/ROI 9,352,579 9,630,921 8,780,823 91.2% 8,954,053 8,954,053 100.0% -173,230 -1.93%Development & Inspections 1,012,173 804,200 841,392 104.6% 791,881 791,881 100.0% 49,510 6.25%Court Fines 905,500 888,500 958,792 107.9% 889,367 889,367 100.0% 69,425 7.81%Parks & Recreation 1,647,190 1,813,220 1,969,610 108.6% 1,481,953 1,481,953 100.0% 487,657 32.91%Other 3,399,731 2,894,669 2,887,694 99.8% 3,962,731 3,962,731 100.0% -1,075,037 -27.13%
REVENUE WITHOUT ENVIRON. SVCS 32,040,823 32,062,610 31,946,365 99.6% 31,397,087 31,397,087 100.0% 549,278 1.75%
Environmental Services 5,102,918 4,811,875 4,809,271 99.9% 4,582,794 4,582,794 100.0% 226,477 4.94%..
TOTAL REVENUES (1) 37,143,741 36,874,485 36,755,636 99.7% 35,979,881 35,979,881 100.0% 775,755 2.16%(1) excludes transfers and SIP related fees
EXPENSES:TRANSPORTATION
Personnel 978,342 948,793 908,458 95.7% 909,767 909,767 100.0% -1,309 -0.14%Operations 951,264 764,766 773,155 101.1% 858,487 858,487 100.0% -85,332 -9.94%TOTAL TRANSPORTATION 1,929,606 1,713,559 1,681,613 98.1% 1,768,254 1,768,254 100.0% -86,641 -4.90%
COMMUNITY DEVELOPMENTPersonnel 1,731,051 1,735,779 1,725,093 99.4% 1,801,418 1,801,418 100.0% -76,325 -4.24%Operations 393,592 332,758 375,582 112.9% 380,512 380,512 100.0% -4,930 -1.30%TOTAL COMMUNITY DEVELOP 2,124,643 2,068,537 2,100,675 101.6% 2,181,930 2,181,930 100.0% -81,256 -3.72%
FINANCE & ADMINISTRATIONPersonnel 430,101 425,960 410,813 96.4% 411,868 411,868 100.0% -1,055 -0.26%Operations 108,951 108,951 94,679 86.9% 104,396 104,396 100.0% -9,717 -9.31%TOTAL FINANCE & ADMIN 539,052 534,911 505,492 94.5% 516,264 516,264 100.0% -10,773 -2.09%
FIREPersonnel 5,916,794 5,851,099 5,733,924 98.0% 5,457,154 5,457,154 100.0% 276,770 5.07%Operations 946,834 937,082 956,427 102.1% 1,058,511 1,058,511 100.0% -102,084 -9.64%TOTAL FIRE 6,863,628 6,788,181 6,690,351 98.6% 6,515,665 6,515,665 100.0% 174,686 2.68%
MANAGEMENT SERVICESPersonnel 682,289 892,015 823,055 92.3% 725,860 725,860 100.0% 97,195 13.39%Operations 3,319,433 3,413,394 3,284,706 96.2% 3,543,952 3,543,952 100.0% -259,246 -7.32%TOTAL MANAGEMENT SVCS 4,001,722 4,305,409 4,107,761 95.4% 4,269,812 4,269,812 100.0% -162,051 -3.80%
COMMUNITY SERVICESPersonnel 3,779,668 3,850,208 3,779,653 98.2% 3,579,905 3,579,905 100.0% 199,749 5.58%Operations 2,811,493 2,757,838 2,928,768 106.2% 2,793,764 2,793,764 100.0% 135,004 4.83%TOTAL COMMUNITY SERVICES 6,591,161 6,608,046 6,708,422 101.5% 6,373,669 6,373,669 100.0% 334,753 5.25%
POLICEPersonnel 8,189,275 7,977,601 7,742,534 97.1% 7,698,599 7,698,599 100.0% 43,935 0.57%Operations 1,479,895 1,503,723 1,528,810 101.7% 1,584,510 1,584,510 100.0% -55,700 -3.52%TOTAL POLICE 9,669,170 9,481,324 9,271,344 97.8% 9,283,109 9,283,109 100.0% -11,765 -0.13%
OPERATING EXP WITHOUT ENVIRON. SVCS.Personnel 21,707,520 21,681,455 21,123,530 97.4% 20,584,571 20,584,571 100.0% 538,959 2.62%Operations 10,011,462 9,818,512 9,942,127 101.3% 10,324,132 10,324,132 100.0% -382,006 -3.70%OPERATING EXPENSES 31,718,982 31,499,967 31,065,656 98.6% 30,908,703 30,908,703 100.0% 156,953 0.51%
GUS (Environmental Services)Personnel 59,802 59,897 59,951 100.1% 59,447 59,447 100.0% 503 0.85%Operations 4,194,506 4,045,251 4,203,600 103.9% 4,136,890 4,136,890 100.0% 66,710 1.61%TOTAL GUS 4,254,308 4,105,148 4,263,550 103.9% 4,196,337 4,196,337 100.0% 67,213 1.60%
TOTAL OPERATING EXPENSESPersonnel 21,767,322 21,741,352 21,183,480 97.4% 20,644,018 20,644,018 100.0% 539,463 2.61%Operations 14,205,968 13,863,763 14,145,726 102.0% 14,461,022 14,461,022 100.0% -315,296 -2.18%TOTAL OPERATING EXPENSES (2) 35,973,290 35,605,115 35,329,207 99.2% 35,105,040 35,105,040 100.0% 224,167 0.64%
(2) excludes capital related expenditures
VARIANCE
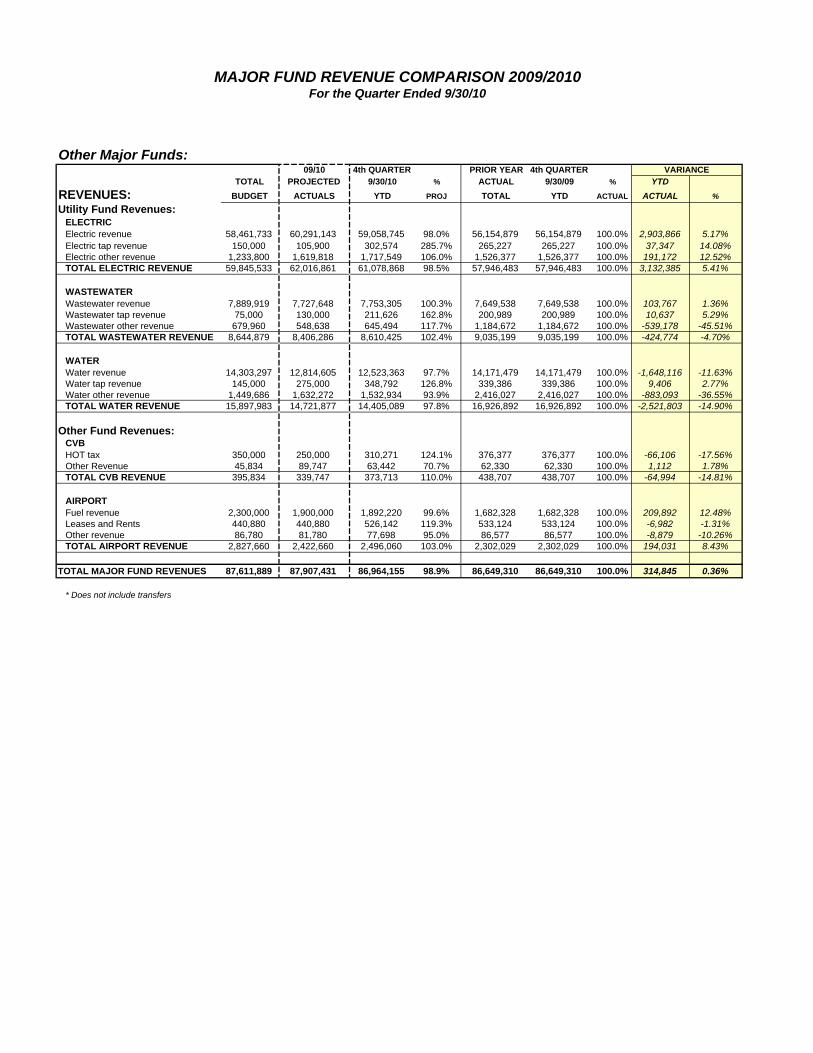
MAJOR FUND REVENUE COMPARISON 2009/2010For the Quarter Ended 9/30/10
Other Major Funds:09/10 4th QUARTER PRIOR YEAR 4th QUARTER
TOTAL PROJECTED 9/30/10 % ACTUAL 9/30/09 % YTD
REVENUES: BUDGET ACTUALS YTD PROJ TOTAL YTD ACTUAL ACTUAL %
Utility Fund Revenues:ELECTRICElectric revenue 58,461,733 60,291,143 59,058,745 98.0% 56,154,879 56,154,879 100.0% 2,903,866 5.17%Electric tap revenue 150,000 105,900 302,574 285.7% 265,227 265,227 100.0% 37,347 14.08%Electric other revenue 1,233,800 1,619,818 1,717,549 106.0% 1,526,377 1,526,377 100.0% 191,172 12.52%TOTAL ELECTRIC REVENUE 59,845,533 62,016,861 61,078,868 98.5% 57,946,483 57,946,483 100.0% 3,132,385 5.41%
WASTEWATER Wastewater revenue 7,889,919 7,727,648 7,753,305 100.3% 7,649,538 7,649,538 100.0% 103,767 1.36%Wastewater tap revenue 75,000 130,000 211,626 162.8% 200,989 200,989 100.0% 10,637 5.29%Wastewater other revenue 679,960 548,638 645,494 117.7% 1,184,672 1,184,672 100.0% -539,178 -45.51%TOTAL WASTEWATER REVENUE 8,644,879 8,406,286 8,610,425 102.4% 9,035,199 9,035,199 100.0% -424,774 -4.70%
WATERWater revenue 14,303,297 12,814,605 12,523,363 97.7% 14,171,479 14,171,479 100.0% -1,648,116 -11.63%Water tap revenue 145,000 275,000 348,792 126.8% 339,386 339,386 100.0% 9,406 2.77%Water other revenue 1,449,686 1,632,272 1,532,934 93.9% 2,416,027 2,416,027 100.0% -883,093 -36.55%TOTAL WATER REVENUE 15,897,983 14,721,877 14,405,089 97.8% 16,926,892 16,926,892 100.0% -2,521,803 -14.90%
Other Fund Revenues:CVBHOT tax 350,000 250,000 310,271 124.1% 376,377 376,377 100.0% -66,106 -17.56%Other Revenue 45,834 89,747 63,442 70.7% 62,330 62,330 100.0% 1,112 1.78%TOTAL CVB REVENUE 395,834 339,747 373,713 110.0% 438,707 438,707 100.0% -64,994 -14.81%
AIRPORTFuel revenue 2,300,000 1,900,000 1,892,220 99.6% 1,682,328 1,682,328 100.0% 209,892 12.48%Leases and Rents 440,880 440,880 526,142 119.3% 533,124 533,124 100.0% -6,982 -1.31%Other revenue 86,780 81,780 77,698 95.0% 86,577 86,577 100.0% -8,879 -10.26%TOTAL AIRPORT REVENUE 2,827,660 2,422,660 2,496,060 103.0% 2,302,029 2,302,029 100.0% 194,031 8.43%
TOTAL MAJOR FUND REVENUES 87,611,889 87,907,431 86,964,155 98.9% 86,649,310 86,649,310 100.0% 314,845 0.36%
* Does not include transfers
VARIANCE
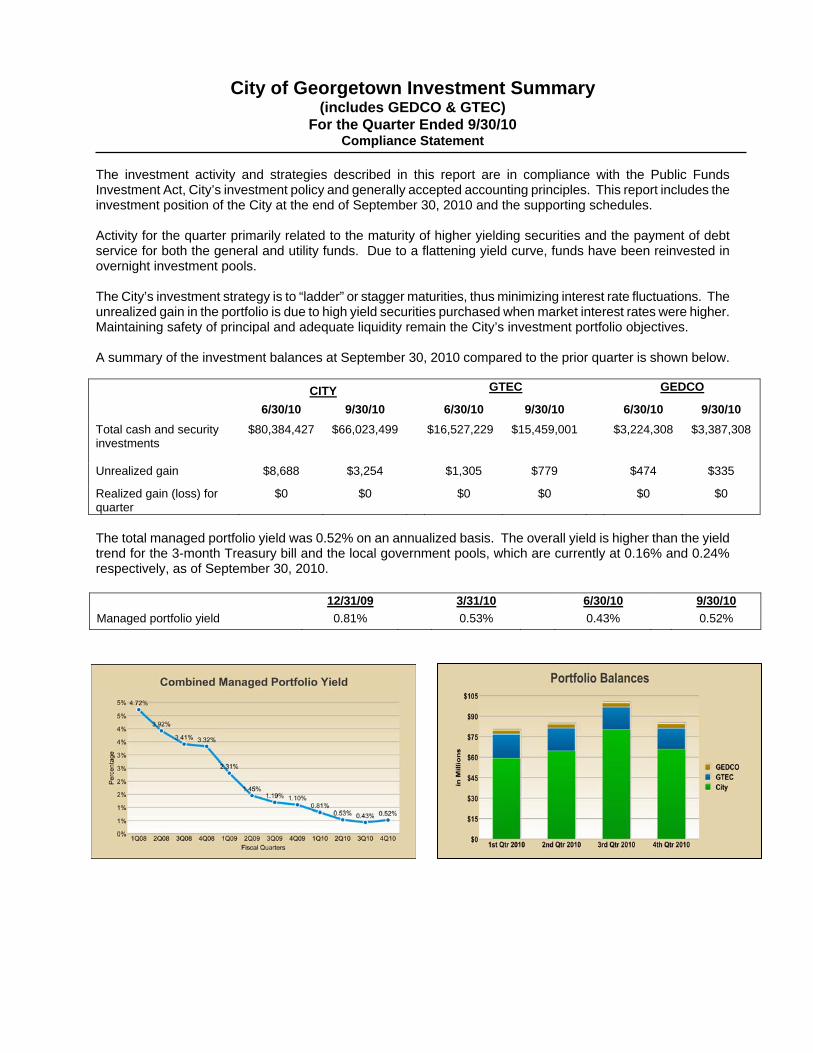
City of Georgetown Investment Summary (includes GEDCO & GTEC)
For the Quarter Ended 9/30/10 Compliance Statement
The investment activity and strategies described in this report are in compliance with the Public Funds Investment Act, City’s investment policy and generally accepted accounting principles. This report includes the investment position of the City at the end of September 30, 2010 and the supporting schedules. Activity for the quarter primarily related to the maturity of higher yielding securities and the payment of debt service for both the general and utility funds. Due to a flattening yield curve, funds have been reinvested in overnight investment pools. The City’s investment strategy is to “ladder” or stagger maturities, thus minimizing interest rate fluctuations. The unrealized gain in the portfolio is due to high yield securities purchased when market interest rates were higher. Maintaining safety of principal and adequate liquidity remain the City’s investment portfolio objectives. A summary of the investment balances at September 30, 2010 compared to the prior quarter is shown below.
CITY GTEC GEDCO
6/30/10 9/30/10 6/30/10 9/30/10 6/30/10 9/30/10
Total cash and security investments
$80,384,427 $66,023,499 $16,527,229 $15,459,001 $3,224,308 $3,387,308
Unrealized gain $8,688 $3,254 $1,305 $779 $474 $335
Realized gain (loss) for quarter
$0 $0 $0 $0 $0 $0
The total managed portfolio yield was 0.52% on an annualized basis. The overall yield is higher than the yield trend for the 3-month Treasury bill and the local government pools, which are currently at 0.16% and 0.24% respectively, as of September 30, 2010. 12/31/09 3/31/10 6/30/10 9/30/10
Managed portfolio yield 0.81% 0.53% 0.43% 0.52%
City of Georgetown Portfolio For the Quarter Ended 9/30/10
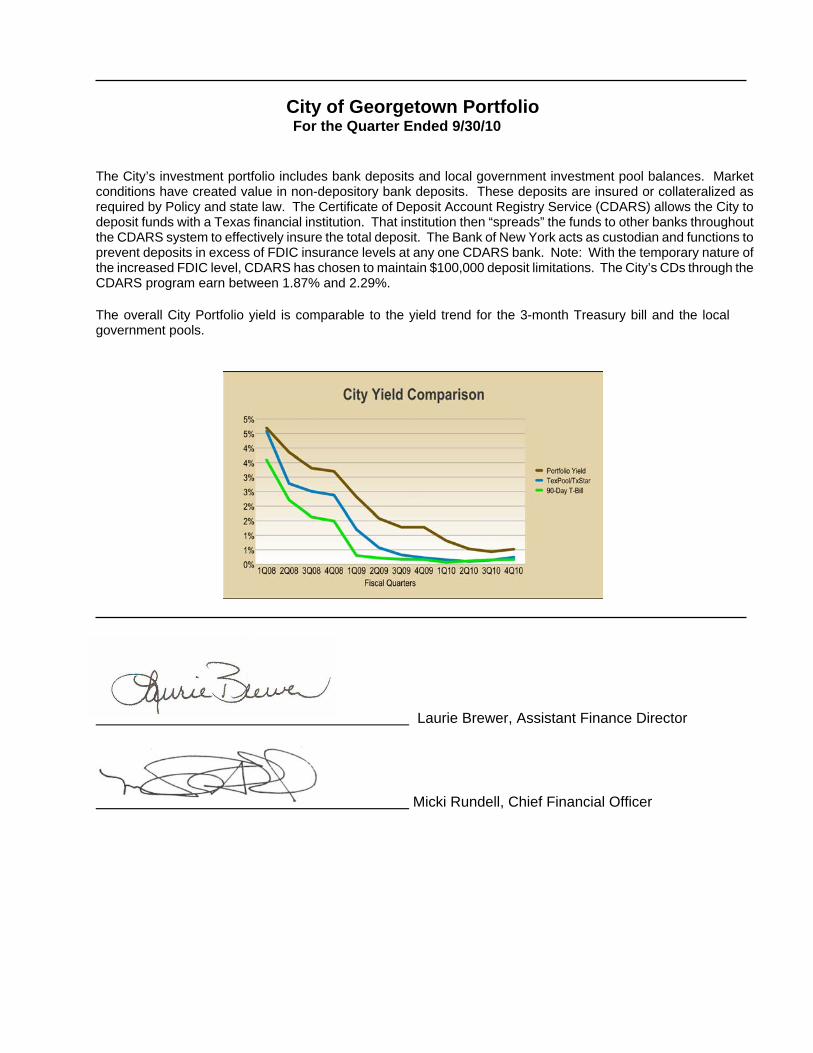
The City’s investment portfolio includes bank deposits and local government investment pool balances. Market conditions have created value in non-depository bank deposits. These deposits are insured or collateralized as required by Policy and state law. The Certificate of Deposit Account Registry Service (CDARS) allows the City to deposit funds with a Texas financial institution. That institution then “spreads” the funds to other banks throughout the CDARS system to effectively insure the total deposit. The Bank of New York acts as custodian and functions to prevent deposits in excess of FDIC insurance levels at any one CDARS bank. Note: With the temporary nature of the increased FDIC level, CDARS has chosen to maintain $100,000 deposit limitations. The City’s CDs through the CDARS program earn between 1.87% and 2.29%.
The overall City Portfolio yield is comparable to the yield trend for the 3-month Treasury bill and the local government pools.
Laurie Brewer, Assistant Finance Director Micki Rundell, Chief Financial Officer
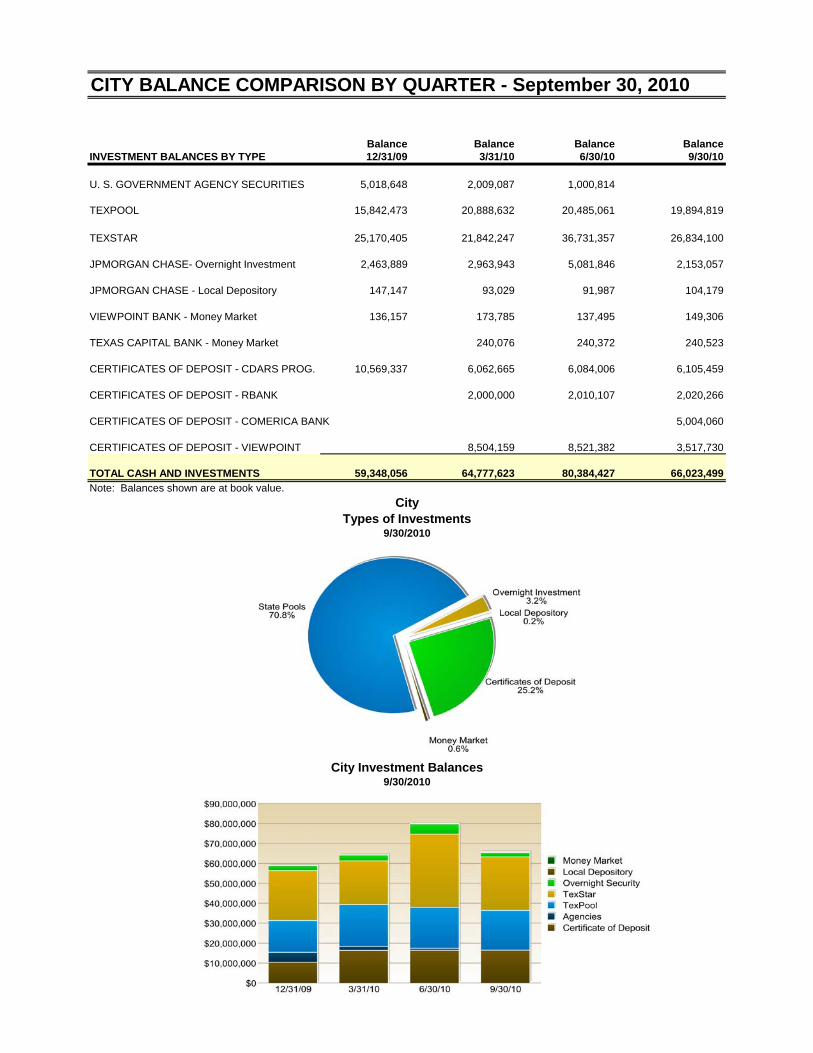
CITY BALANCE COMPARISON BY QUARTER - September 30, 2010
Balance Balance Balance BalanceINVESTMENT BALANCES BY TYPE 12/31/09 3/31/10 6/30/10 9/30/10
U. S. GOVERNMENT AGENCY SECURITIES 5,018,648 2,009,087 1,000,814
TEXPOOL 15,842,473 20,888,632 20,485,061 19,894,819
TEXSTAR 25,170,405 21,842,247 36,731,357 26,834,100
JPMORGAN CHASE- Overnight Investment 2,463,889 2,963,943 5,081,846 2,153,057
JPMORGAN CHASE - Local Depository 147,147 93,029 91,987 104,179
VIEWPOINT BANK - Money Market 136,157 173,785 137,495 149,306
TEXAS CAPITAL BANK - Money Market 240,076 240,372 240,523
CERTIFICATES OF DEPOSIT - CDARS PROG. 10,569,337 6,062,665 6,084,006 6,105,459
CERTIFICATES OF DEPOSIT - RBANK 2,000,000 2,010,107 2,020,266
CERTIFICATES OF DEPOSIT - COMERICA BANK 5,004,060
CERTIFICATES OF DEPOSIT - VIEWPOINT 8,504,159 8,521,382 3,517,730
TOTAL CASH AND INVESTMENTS 59,348,056 64,777,623 80,384,427 66,023,499Note: Balances shown are at book value.
CityTypes of Investments
9/30/2010
City Investment Balances9/30/2010
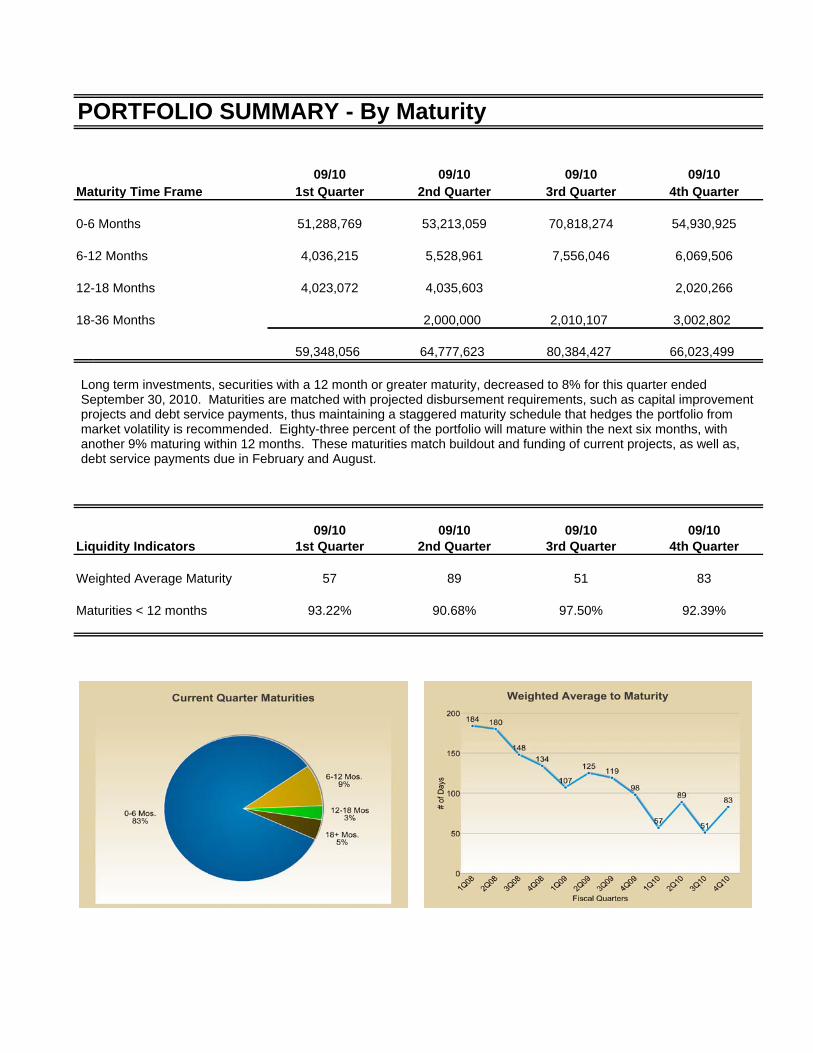
PORTFOLIO SUMMARY - By Maturity
09/10 09/10 09/10 09/10Maturity Time Frame 1st Quarter 2nd Quarter 3rd Quarter 4th Quarter
0 6 M th 51 288 769 53 213 059 70 818 274 54 930 9250-6 Months 51,288,769 53,213,059 70,818,274 54,930,925
6-12 Months 4,036,215 5,528,961 7,556,046 6,069,506
12-18 Months 4,023,072 4,035,603 2,020,266
18-36 Months 2,000,000 2,010,107 3,002,802
59,348,056 64,777,623 80,384,427 66,023,499
Long term investments, securities with a 12 month or greater maturity, decreased to 8% for this quarter ended September 30, 2010. Maturities are matched with projected disbursement requirements, such as capital improvement projects and debt service payments, thus maintaining a staggered maturity schedule that hedges the portfolio from market volatility is recommended. Eighty-three percent of the portfolio will mature within the next six months, withanother 9% maturing within 12 months. These maturities match buildout and funding of current projects, as well as, debt service payments due in February and August.
09/10 09/10 09/10 09/10Liquidity Indicators 1st Quarter 2nd Quarter 3rd Quarter 4th Quarter
Weighted Average Maturity 57 89 51 83
Long term investments, securities with a 12 month or greater maturity, decreased to 8% for this quarter ended September 30, 2010. Maturities are matched with projected disbursement requirements, such as capital improvement projects and debt service payments, thus maintaining a staggered maturity schedule that hedges the portfolio from market volatility is recommended. Eighty-three percent of the portfolio will mature within the next six months, withanother 9% maturing within 12 months. These maturities match buildout and funding of current projects, as well as, debt service payments due in February and August.
Maturities < 12 months 93.22% 90.68% 97.50% 92.39%
Long term investments, securities with a 12 month or greater maturity, decreased to 8% for this quarter ended September 30, 2010. Maturities are matched with projected disbursement requirements, such as capital improvement projects and debt service payments, thus maintaining a staggered maturity schedule that hedges the portfolio from market volatility is recommended. Eighty-three percent of the portfolio will mature within the next six months, withanother 9% maturing within 12 months. These maturities match buildout and funding of current projects, as well as, debt service payments due in February and August.
Long term investments, securities with a 12 month or greater maturity, decreased to 8% for this quarter ended September 30, 2010. Maturities are matched with projected disbursement requirements, such as capital improvement projects and debt service payments, thus maintaining a staggered maturity schedule that hedges the portfolio from market volatility is recommended. Eighty-three percent of the portfolio will mature within the next six months, withanother 9% maturing within 12 months. These maturities match buildout and funding of current projects, as well as, debt service payments due in February and August.
Long term investments, securities with a 12 month or greater maturity, decreased to 8% for this quarter ended September 30, 2010. Maturities are matched with projected disbursement requirements, such as capital improvement projects and debt service payments, thus maintaining a staggered maturity schedule that hedges the portfolio from market volatility is recommended. Eighty-three percent of the portfolio will mature within the next six months, withanother 9% maturing within 12 months. These maturities match buildout and funding of current projects, as well as, debt service payments due in February and August.
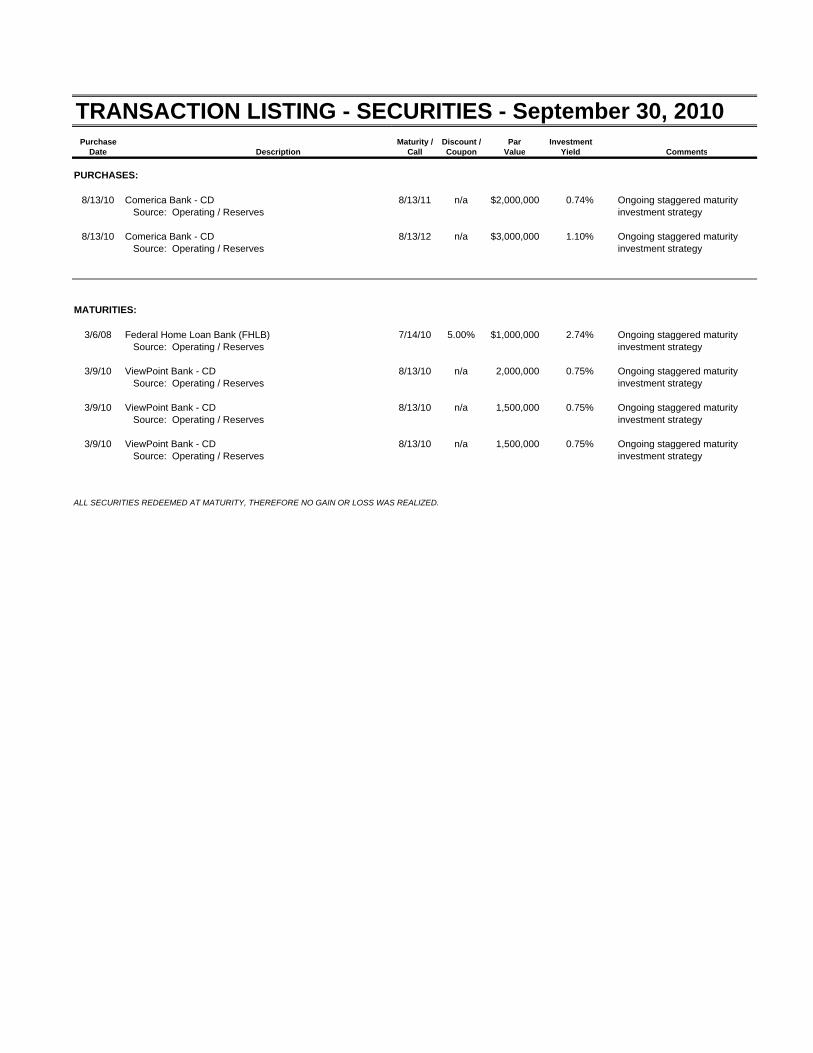
TRANSACTION LISTING - SECURITIES - September 30, 2010Purchase Maturity / Discount / Par Investment
Date Description Call Coupon Value Yield Comments
PURCHASES:
8/13/10 Comerica Bank - CD 8/13/11 n/a $2,000,000 0.74% Ongoing staggered maturity Source: Operating / Reserves investment strategy
8/13/10 Comerica Bank - CD 8/13/12 n/a $3,000,000 1.10% Ongoing staggered maturity Source: Operating / Reserves investment strategy
MATURITIES:
3/6/08 Federal Home Loan Bank (FHLB) 7/14/10 5.00% $1,000,000 2.74% Ongoing staggered maturity Source: Operating / Reserves investment strategy
3/9/10 ViewPoint Bank - CD 8/13/10 n/a 2,000,000 0.75% Ongoing staggered maturity Source: Operating / Reserves investment strategy
3/9/10 ViewPoint Bank - CD 8/13/10 n/a 1,500,000 0.75% Ongoing staggered maturity Source: Operating / Reserves investment strategy
3/9/10 ViewPoint Bank - CD 8/13/10 n/a 1,500,000 0.75% Ongoing staggered maturity Source: Operating / Reserves investment strategy
ALL SECURITIES REDEEMED AT MATURITY, THEREFORE NO GAIN OR LOSS WAS REALIZED.
6/30/10
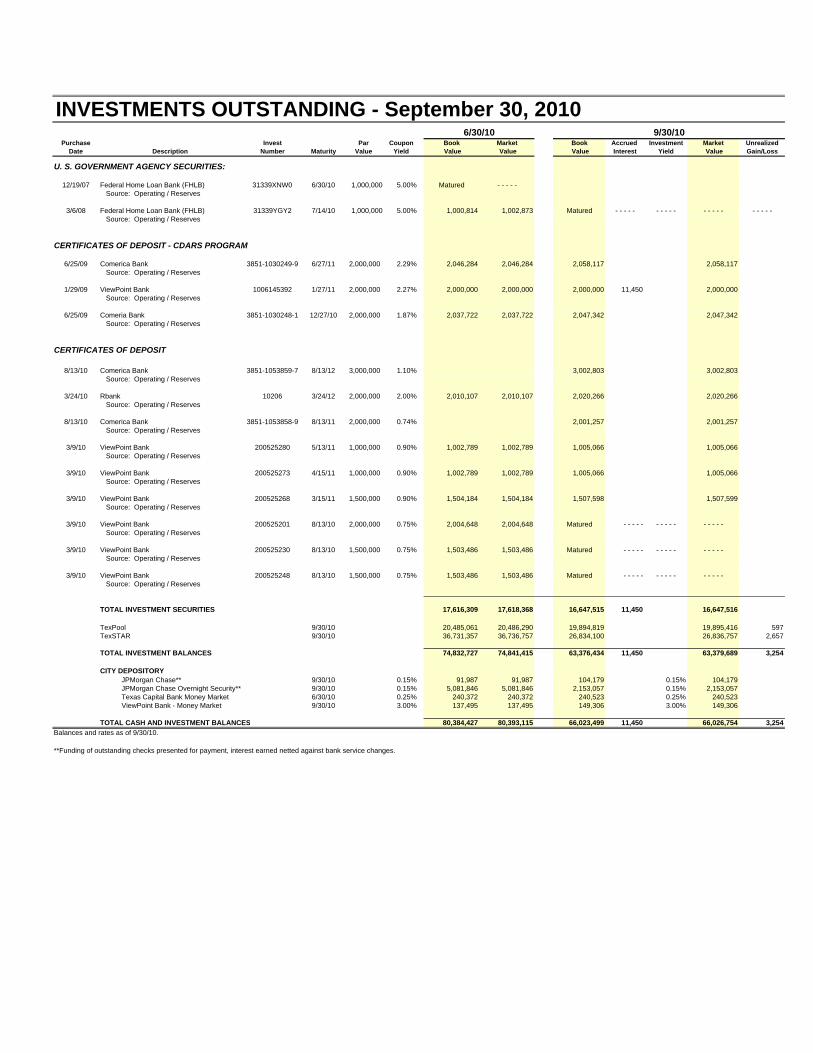
Purchase Invest Par Coupon Book Market Book Accrued Investment Market UnrealizedDate Description Number Maturity Value Yield Value Value Value Interest Yield Value Gain/Loss
U. S. GOVERNMENT AGENCY SECURITIES:
12/19/07 Federal Home Loan Bank (FHLB) 31339XNW0 6/30/10 1,000,000 5.00% Matured - - - - - Source: Operating / Reserves
3/6/08 Federal Home Loan Bank (FHLB) 31339YGY2 7/14/10 1,000,000 5.00% 1,000,814 1,002,873 Matured - - - - - - - - - - - - - - - - - - - - Source: Operating / Reserves
CERTIFICATES OF DEPOSIT - CDARS PROGRAM
6/25/09 Comerica Bank 3851-1030249-9 6/27/11 2,000,000 2.29% 2,046,284 2,046,284 2,058,117 2,058,117 Source: Operating / Reserves
1/29/09 ViewPoint Bank 1006145392 1/27/11 2,000,000 2.27% 2,000,000 2,000,000 2,000,000 11,450 2,000,000 Source: Operating / Reserves
6/25/09 Comeria Bank 3851-1030248-1 12/27/10 2,000,000 1.87% 2,037,722 2,037,722 2,047,342 2,047,342 Source: Operating / Reserves
CERTIFICATES OF DEPOSIT
8/13/10 Comerica Bank 3851-1053859-7 8/13/12 3,000,000 1.10% 3,002,803 3,002,803 Source: Operating / Reserves
3/24/10 Rbank 10206 3/24/12 2,000,000 2.00% 2,010,107 2,010,107 2,020,266 2,020,266 Source: Operating / Reserves
8/13/10 Comerica Bank 3851-1053858-9 8/13/11 2,000,000 0.74% 2,001,257 2,001,257 Source: Operating / Reserves
3/9/10 ViewPoint Bank 200525280 5/13/11 1,000,000 0.90% 1,002,789 1,002,789 1,005,066 1,005,066 Source: Operating / Reserves
3/9/10 ViewPoint Bank 200525273 4/15/11 1,000,000 0.90% 1,002,789 1,002,789 1,005,066 1,005,066 Source: Operating / Reserves
3/9/10 ViewPoint Bank 200525268 3/15/11 1,500,000 0.90% 1,504,184 1,504,184 1,507,598 1,507,599 Source: Operating / Reserves
3/9/10 ViewPoint Bank 200525201 8/13/10 2,000,000 0.75% 2,004,648 2,004,648 Matured - - - - - - - - - - - - - - - Source: Operating / Reserves
3/9/10 ViewPoint Bank 200525230 8/13/10 1,500,000 0.75% 1,503,486 1,503,486 Matured - - - - - - - - - - - - - - - Source: Operating / Reserves
3/9/10 ViewPoint Bank 200525248 8/13/10 1,500,000 0.75% 1,503,486 1,503,486 Matured - - - - - - - - - - - - - - - Source: Operating / Reserves
TOTAL INVESTMENT SECURITIES 17,616,309 17,618,368 16,647,515 11,450 16,647,516
TexPool 9/30/10 20,485,061 20,486,290 19,894,819 19,895,416 597TexSTAR 9/30/10 36,731,357 36,736,757 26,834,100 26,836,757 2,657
TOTAL INVESTMENT BALANCES 74,832,727 74,841,415 63,376,434 11,450 63,379,689 3,254
CITY DEPOSITORY JPMorgan Chase** 9/30/10 0.15% 91,987 91,987 104,179 0.15% 104,179 JPMorgan Chase Overnight Security** 9/30/10 0.15% 5,081,846 5,081,846 2,153,057 0.15% 2,153,057 Texas Capital Bank Money Market 6/30/10 0.25% 240,372 240,372 240,523 0.25% 240,523 ViewPoint Bank - Money Market 9/30/10 3.00% 137,495 137,495 149,306 3.00% 149,306
TOTAL CASH AND INVESTMENT BALANCES 80,384,427 80,393,115 66,023,499 11,450 66,026,754 3,254
Balances and rates as of 9/30/10.
**Funding of outstanding checks presented for payment, interest earned netted against bank service changes.
9/30/10
INVESTMENTS OUTSTANDING - September 30, 2010
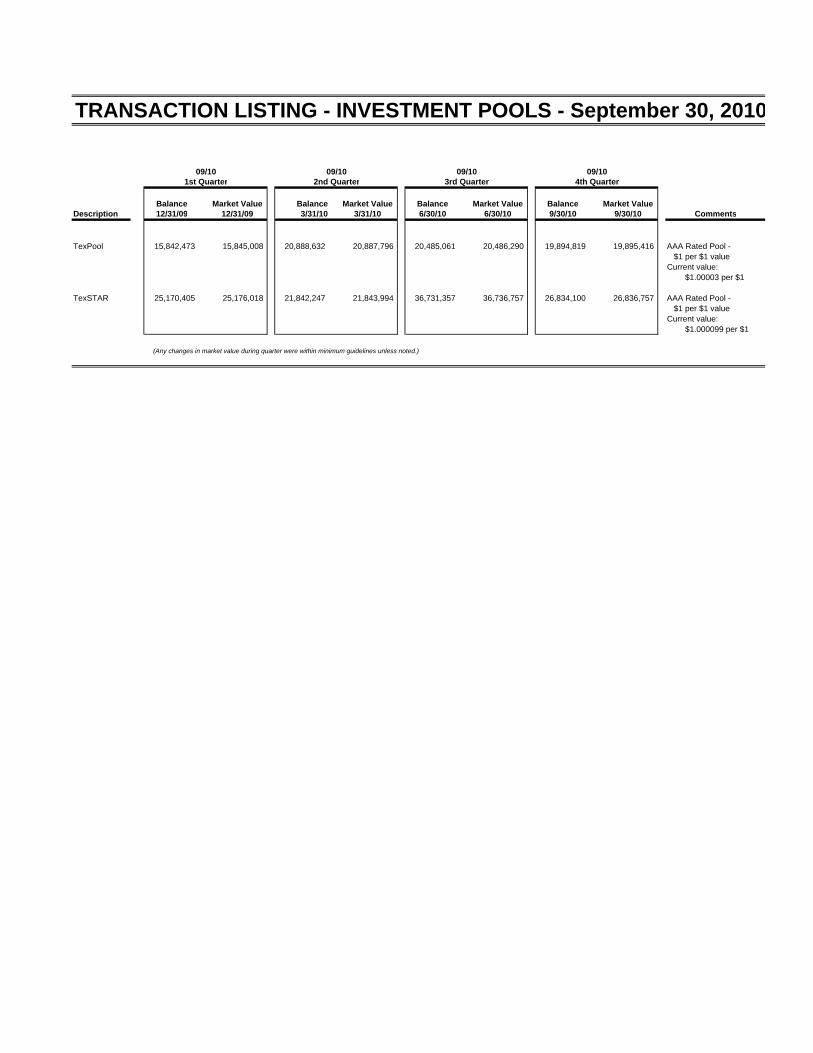
TRANSACTION LISTING - INVESTMENT POOLS - September 30, 2010
09/10 09/10 09/10 09/101st Quarter 2nd Quarter 3rd Quarter 4th Quarter
Balance Market Value Balance Market Value Balance Market Value Balance Market Value
Description 12/31/09 12/31/09 3/31/10 3/31/10 6/30/10 6/30/10 9/30/10 9/30/10 Comments
TexPool 15,842,473 15,845,008 20,888,632 20,887,796 20,485,061 20,486,290 19,894,819 19,895,416 AAA Rated Pool - $1 per $1 value
Current value: $1.00003 per $1
TexSTAR 25,170,405 25,176,018 21,842,247 21,843,994 36,731,357 36,736,757 26,834,100 26,836,757 AAA Rated Pool - $1 per $1 valueCurrent value: $1.000099 per $1
(Any changes in market value during quarter were within minimum guidelines unless noted.)
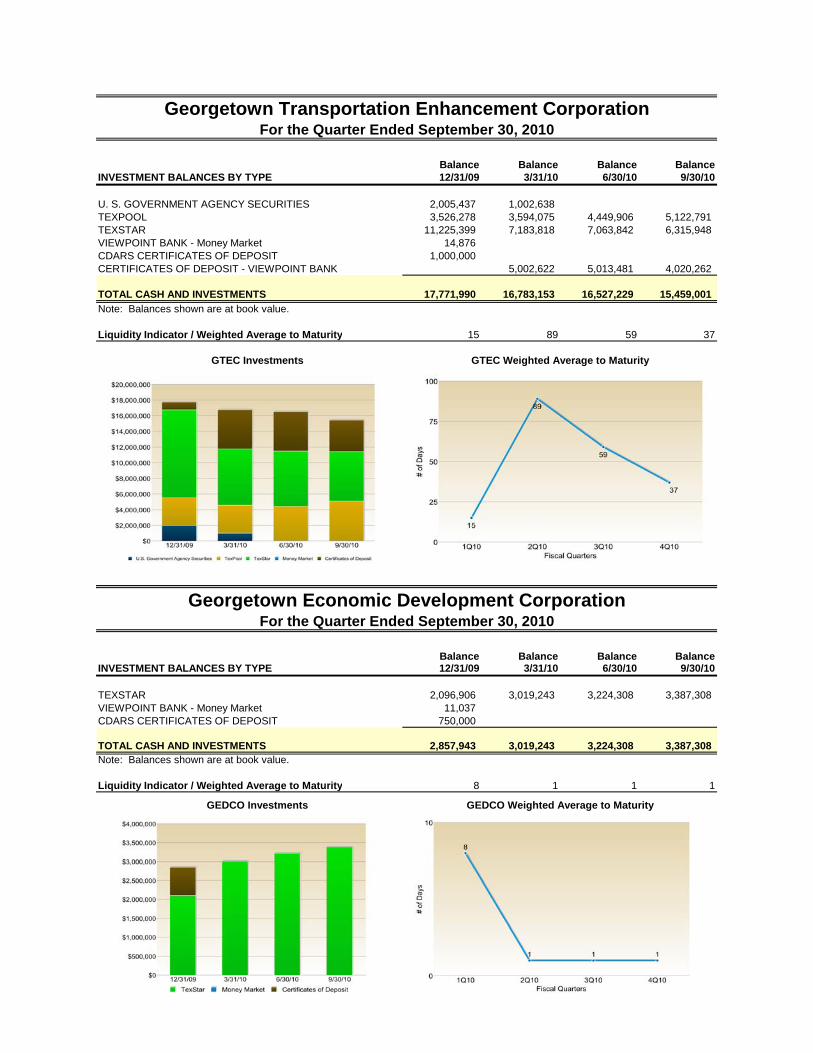
Balance Balance Balance BalanceINVESTMENT BALANCES BY TYPE 12/31/09 3/31/10 6/30/10 9/30/10
U. S. GOVERNMENT AGENCY SECURITIES 2,005,437 1,002,638 TEXPOOL 3,526,278 3,594,075 4,449,906 5,122,791 TEXSTAR 11,225,399 7,183,818 7,063,842 6,315,948 VIEWPOINT BANK - Money Market 14,876 CDARS CERTIFICATES OF DEPOSIT 1,000,000 CERTIFICATES OF DEPOSIT - VIEWPOINT BANK 5,002,622 5,013,481 4,020,262
TOTAL CASH AND INVESTMENTS 17,771,990 16,783,153 16,527,229 15,459,001
Note: Balances shown are at book value.
Liquidity Indicator / Weighted Average to Maturity 15 89 59 37
Georgetown Transportation Enhancement CorporationFor the Quarter Ended September 30, 2010
GTEC Investments GTEC Weighted Average to Maturity
Balance Balance Balance BalanceINVESTMENT BALANCES BY TYPE 12/31/09 3/31/10 6/30/10 9/30/10
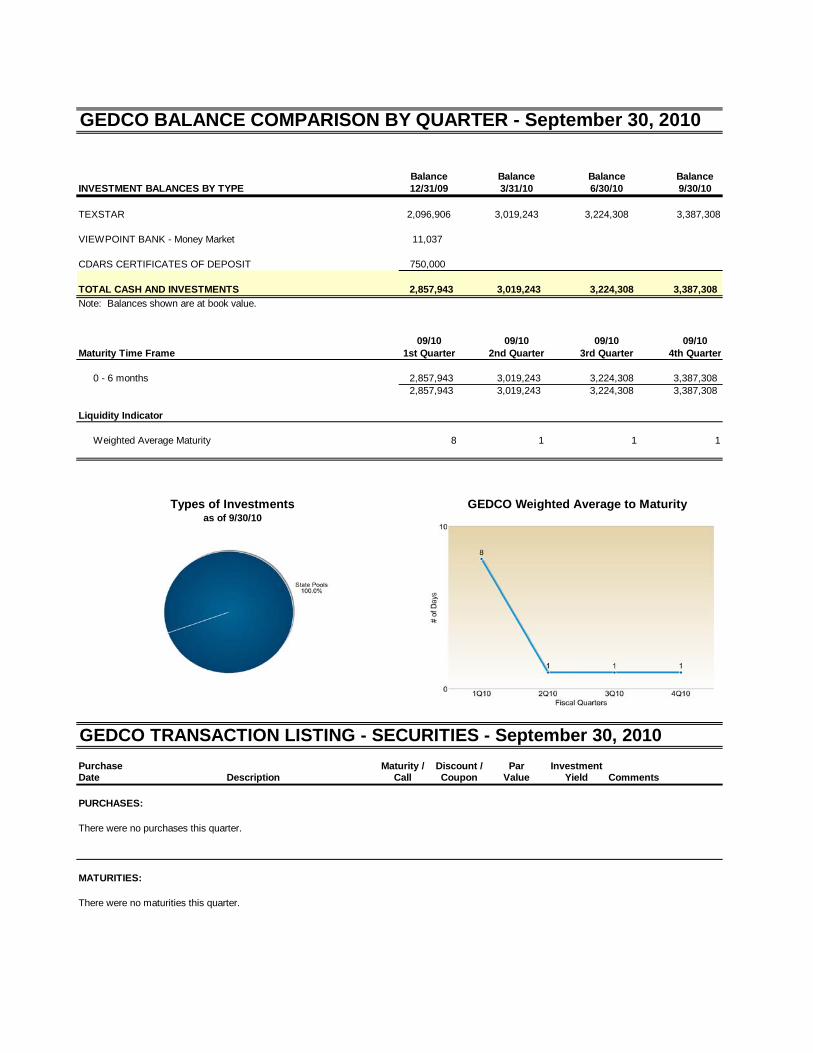
TEXSTAR 2,096,906 3,019,243 3,224,308 3,387,308 VIEWPOINT BANK - Money Market 11,037 CDARS CERTIFICATES OF DEPOSIT 750,000
TOTAL CASH AND INVESTMENTS 2,857,943 3,019,243 3,224,308 3,387,308 Note: Balances shown are at book value.
Liquidity Indicator / Weighted Average to Maturity 8 1 1 1
GEDCO Investments GEDCO Weighted Average to Maturity
Georgetown Economic Development CorporationFor the Quarter Ended September 30, 2010
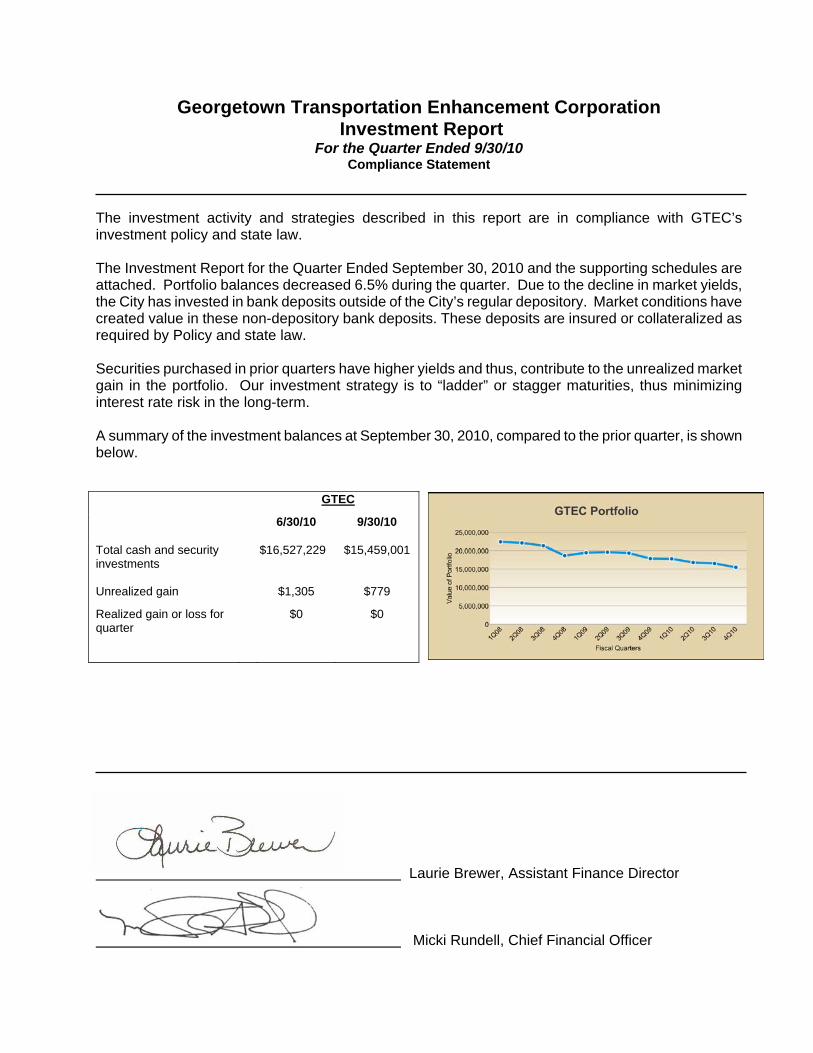
Georgetown Transportation Enhancement Corporation Investment Report
For the Quarter Ended 9/30/10 Compliance Statement
The investment activity and strategies described in this report are in compliance with GTEC’s investment policy and state law. The Investment Report for the Quarter Ended September 30, 2010 and the supporting schedules are attached. Portfolio balances decreased 6.5% during the quarter. Due to the decline in market yields, the City has invested in bank deposits outside of the City’s regular depository. Market conditions have created value in these non-depository bank deposits. These deposits are insured or collateralized as required by Policy and state law. Securities purchased in prior quarters have higher yields and thus, contribute to the unrealized market gain in the portfolio. Our investment strategy is to “ladder” or stagger maturities, thus minimizing interest rate risk in the long-term. A summary of the investment balances at September 30, 2010, compared to the prior quarter, is shown below.
GTEC
6/30/10 9/30/10
Total cash and security investments
$16,527,229 $15,459,001
Unrealized gain $1,305 $779
Realized gain or loss for quarter
$0 $0
Laurie Brewer, Assistant Finance Director Micki Rundell, Chief Financial Officer
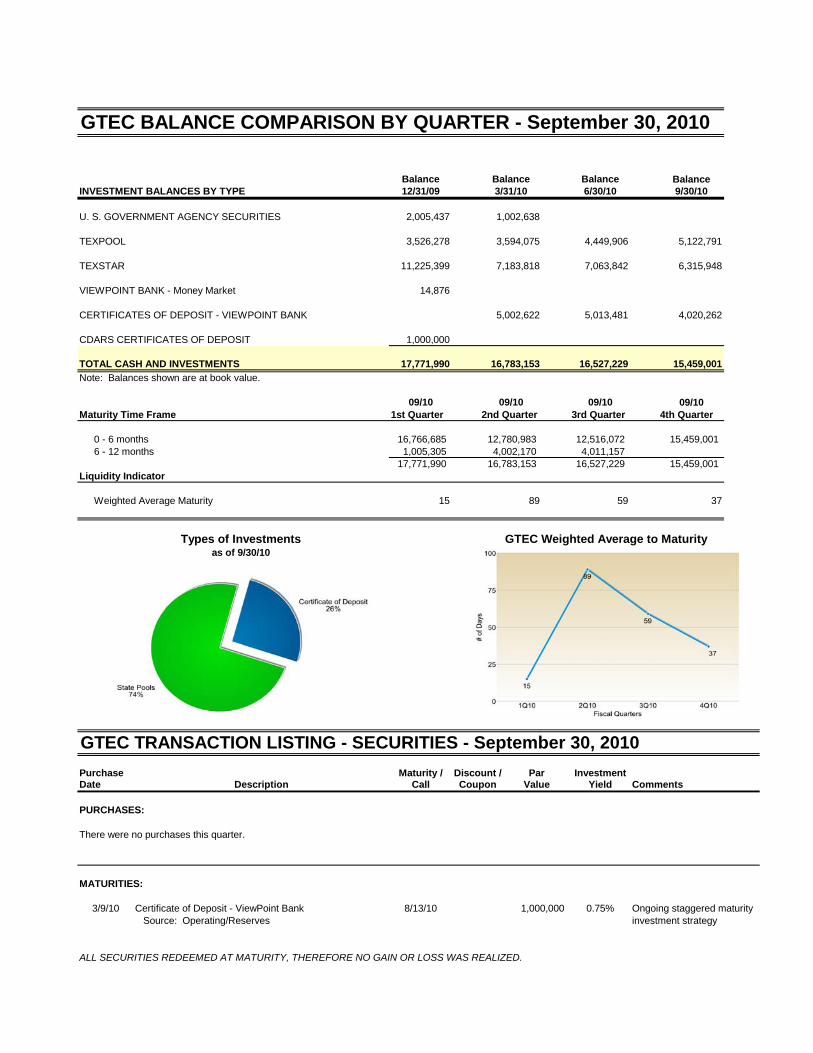
GTEC BALANCE COMPARISON BY QUARTER - September 30, 2010
BalanceINVESTMENT BALANCES BY TYPE 9/30/10
U. S. GOVERNMENT AGENCY SECURITIES
TEXPOOL 5,122,791
TEXSTAR 6,315,948
VIEWPOINT BANK - Money Market
CERTIFICATES OF DEPOSIT - VIEWPOINT BANK 4,020,262
CDARS CERTIFICATES OF DEPOSIT
TOTAL CASH AND INVESTMENTS 15,459,001
Note: Balances shown are at book value.
09/10Maturity Time Frame 1st Quarter 2nd Quarter 3rd Quarter 4th Quarter
0 - 6 months 15,459,001 6 - 12 months
15,459,001 Liquidity Indicator
Weighted Average Maturity 15 89 59 37
12,780,983 4,002,170
5,002,622
09/1009/10
16,783,153
16,766,685
16,527,229
as of 9/30/10
Balance
3,594,075
14,876
1,000,000
17,771,990 1,005,305
7,183,818
Balance12/31/09
2,005,437
3,526,278
11,225,399
3/31/10
GTEC Weighted Average to Maturity
Balance6/30/10
4,449,906
1,002,638
7,063,842
5,013,481
Types of Investments
12,516,072 4,011,157
09/10
17,771,990 16,527,229
16,783,153
GTEC TRANSACTION LISTING - SECURITIES - September 30, 2010
Description Comments
PURCHASES:
There were no purchases this quarter.
MATURITIES:
Certificate of Deposit - ViewPoint Bank Ongoing staggered maturity Source: Operating/Reserves investment strategy
ALL SECURITIES REDEEMED AT MATURITY, THEREFORE NO GAIN OR LOSS WAS REALIZED.
InvestmentYieldValue
Maturity /Coupon
0.75%1,000,000
Date Call
3/9/10 8/13/10
Purchase Discount / Par
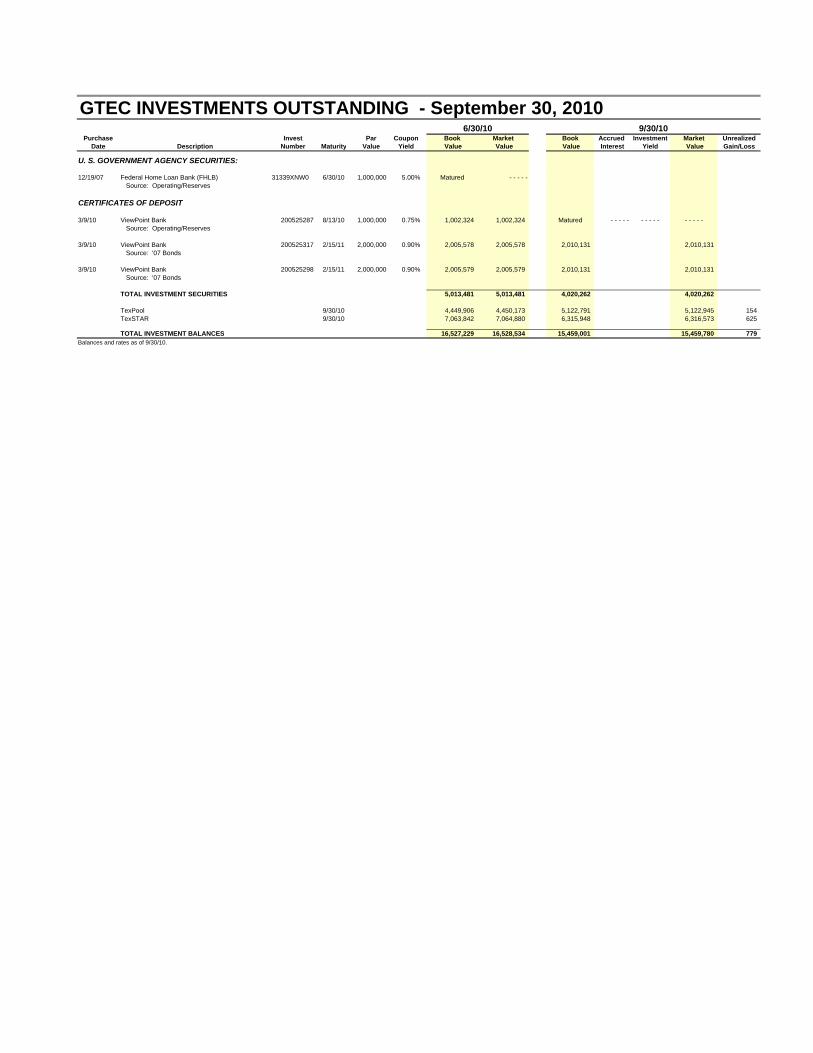
GTEC INVESTMENTS OUTSTANDING - September 30, 2010 9/30/10
Purchase Invest Par Coupon Book Market Book Accrued Investment Market UnrealizedDate Description Number Maturity Value Yield Value Value Value Interest Yield Value Gain/Loss
U. S. GOVERNMENT AGENCY SECURITIES:
12/19/07 Federal Home Loan Bank (FHLB) 31339XNW0 6/30/10 1,000,000 5.00% Matured - - - - - Source: Operating/Reserves
CERTIFICATES OF DEPOSIT
3/9/10 ViewPoint Bank 200525287 8/13/10 1,000,000 0.75% 1,002,324 1,002,324 Matured - - - - - - - - - - - - - - - Source: Operating/Reserves
3/9/10 ViewPoint Bank 200525317 2/15/11 2,000,000 0.90% 2,005,578 2,005,578 2,010,131 2,010,131 Source: '07 Bonds
3/9/10 ViewPoint Bank 200525298 2/15/11 2,000,000 0.90% 2,005,579 2,005,579 2,010,131 2,010,131 Source: '07 Bonds TOTAL INVESTMENT SECURITIES 5,013,481 5,013,481 4,020,262 4,020,262
TexPool 9/30/10 4,449,906 4,450,173 5,122,791 5,122,945 154TexSTAR 9/30/10 7,063,842 7,064,880 6,315,948 6,316,573 625
TOTAL INVESTMENT BALANCES 16,527,229 16,528,534 15,459,001 15,459,780 779Balances and rates as of 9/30/10.
6/30/10
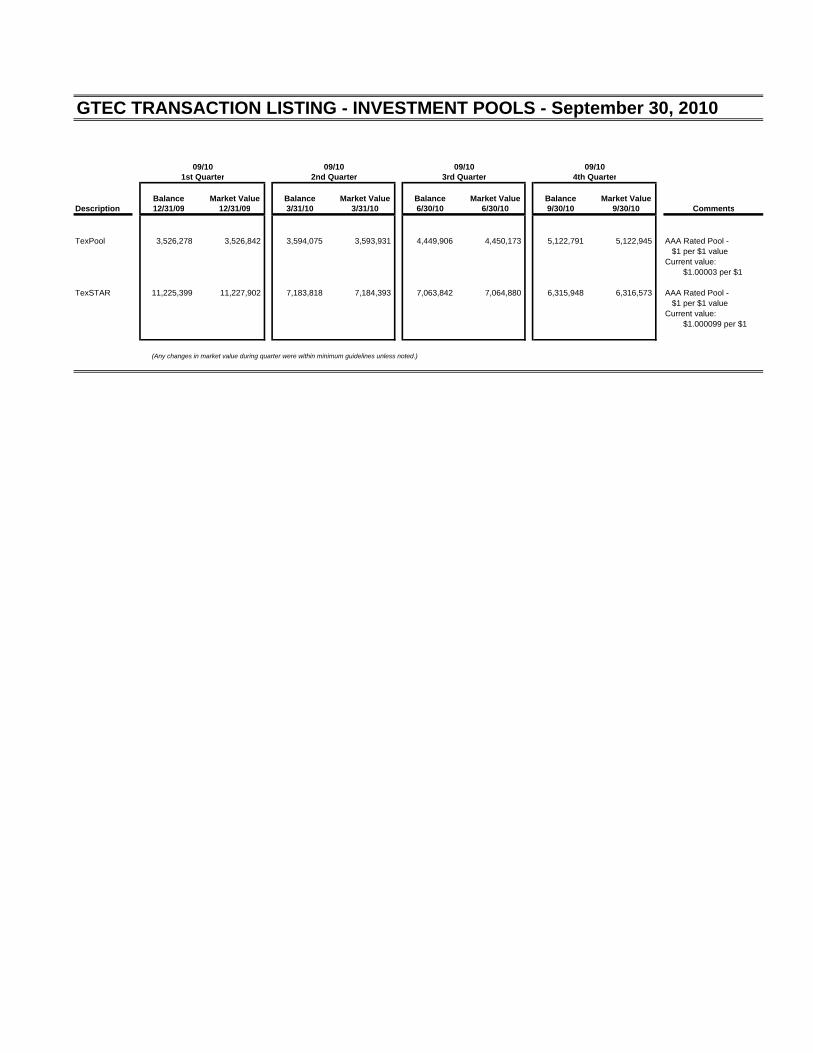
GTEC TRANSACTION LISTING - INVESTMENT POOLS - September 30, 2010
09/10 09/10 09/10 09/101st Quarter 2nd Quarter 3rd Quarter 4th Quarter
Balance Market Value Balance Market Value Balance Market Value Balance Market Value
Description 12/31/09 12/31/09 3/31/10 3/31/10 6/30/10 6/30/10 9/30/10 9/30/10 Comments
TexPool 3,526,278 3,526,842 3,594,075 3,593,931 4,449,906 4,450,173 5,122,791 5,122,945 AAA Rated Pool - $1 per $1 value
Current value: $1.00003 per $1
TexSTAR 11,225,399 11,227,902 7,183,818 7,184,393 7,063,842 7,064,880 6,315,948 6,316,573 AAA Rated Pool - $1 per $1 value
Current value: $1.000099 per $1
(Any changes in market value during quarter were within minimum guidelines unless noted.)
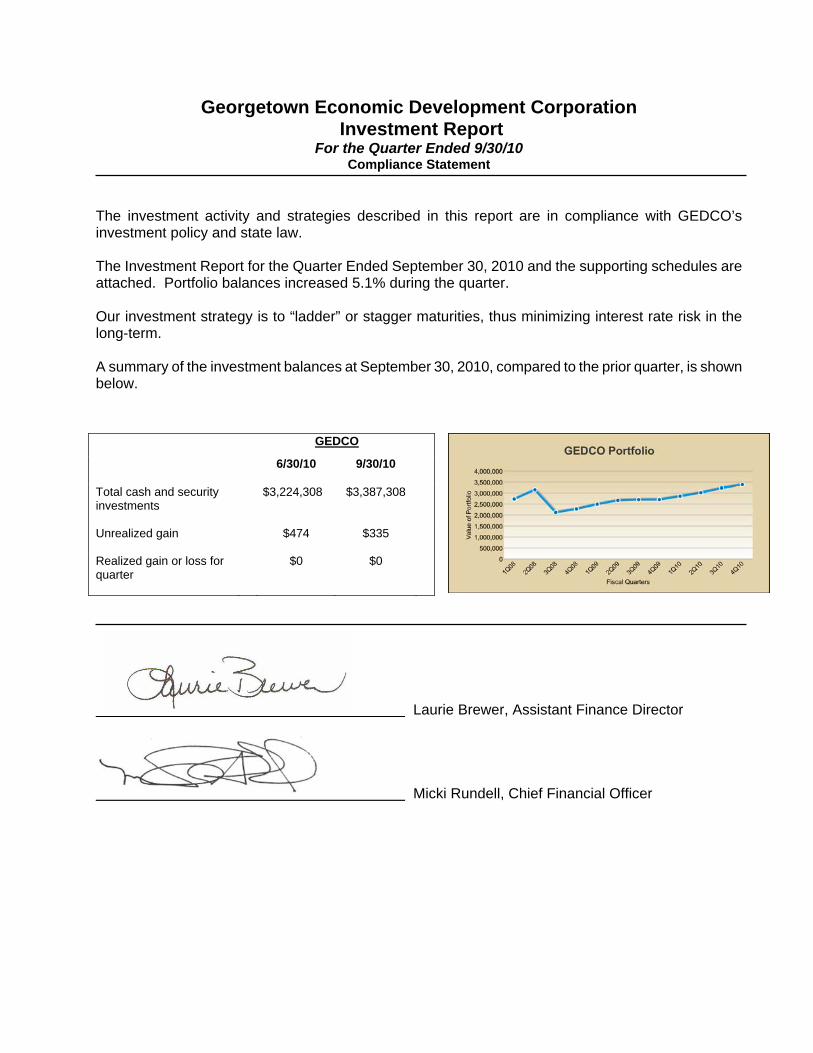
Georgetown Economic Development Corporation Investment Report
For the Quarter Ended 9/30/10 Compliance Statement
The investment activity and strategies described in this report are in compliance with GEDCO’s investment policy and state law. The Investment Report for the Quarter Ended September 30, 2010 and the supporting schedules are attached. Portfolio balances increased 5.1% during the quarter. Our investment strategy is to “ladder” or stagger maturities, thus minimizing interest rate risk in the long-term. A summary of the investment balances at September 30, 2010, compared to the prior quarter, is shown below.
Laurie Brewer, Assistant Finance Director Micki Rundell, Chief Financial Officer
GEDCO
6/30/10 9/30/10
Total cash and security investments
$3,224,308 $3,387,308
Unrealized gain $474 $335
Realized gain or loss for quarter
$0 $0
GEDCO BALANCE COMPARISON BY QUARTER - September 30, 2010
BalanceINVESTMENT BALANCES BY TYPE 9/30/10
TEXSTAR 3,387,308
VIEWPOINT BANK - Money Market
CDARS CERTIFICATES OF DEPOSIT
TOTAL CASH AND INVESTMENTS 3,387,308
Note: Balances shown are at book value.
09/10Maturity Time Frame 4th Quarter
0 - 6 months 3,387,308 3,387,308
Liquidity Indicator
Weighted Average Maturity 8 1 1 1
GEDCO TRANSACTION LISTING - SECURITIES - September 30, 2010
Description Comments
PURCHASES:
There were no purchases this quarter.
MATURITIES:
There were no maturities this quarter.
Balance6/30/10
Balance3/31/10
Balance12/31/09
09/10
2,857,943
2nd Quarter
3,019,2432,096,906
11,037
DatePurchase Discount /
GEDCO Weighted Average to Maturity
2,857,943
3,224,308
3,224,308
09/10
3,019,243
Types of Investmentsas of 9/30/10
3,224,308
Coupon
3,224,308
2,857,943
Maturity /
3rd Quarter
YieldCall
750,000
1st Quarter09/10
ValueInvestmentPar
3,019,243 3,019,243
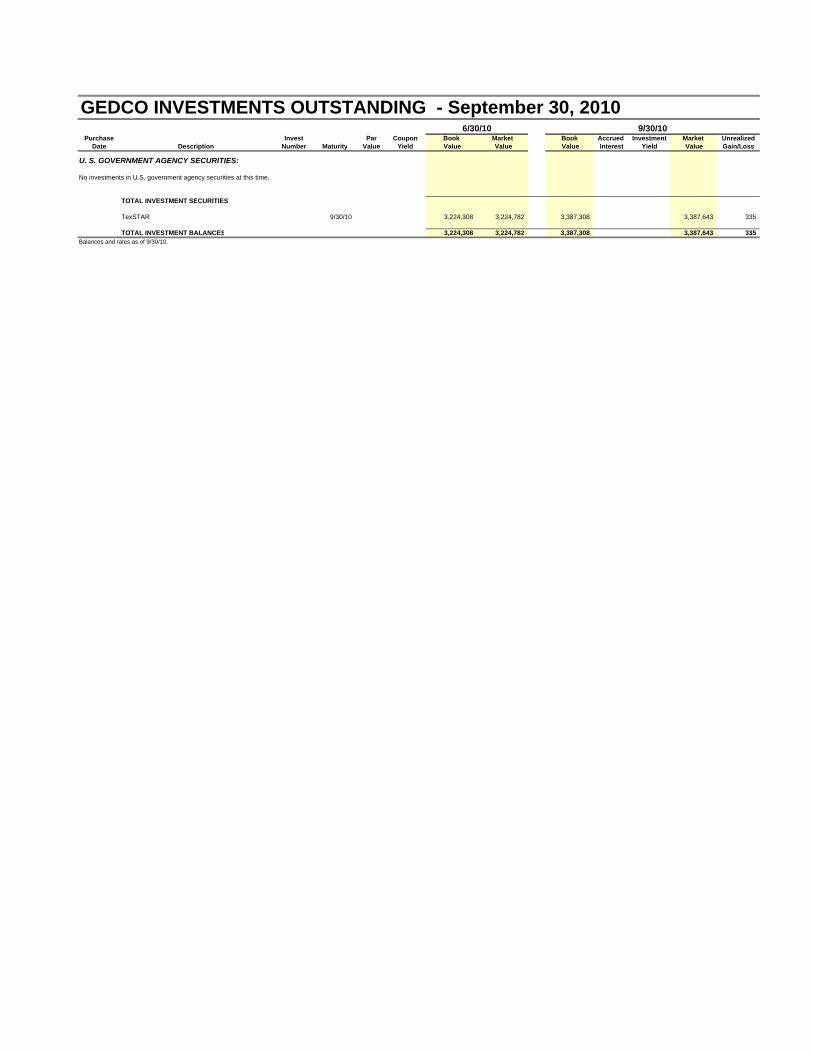
GEDCO INVESTMENTS OUTSTANDING - September 30, 20106/30/10 9/30/10
Purchase Invest Par Coupon Book Market Book Accrued Investment Market UnrealizedDate Description Number Maturity Value Yield Value Value Value Interest Yield Value Gain/Loss
U. S. GOVERNMENT AGENCY SECURITIES:
No investments in U.S. government agency securities at this time.
TOTAL INVESTMENT SECURITIES
TexSTAR 9/30/10 3,224,308 3,224,782 3,387,308 3,387,643 335
TOTAL INVESTMENT BALANCES 3,224,308 3,224,782 3,387,308 3,387,643 335Balances and rates as of 9/30/10.
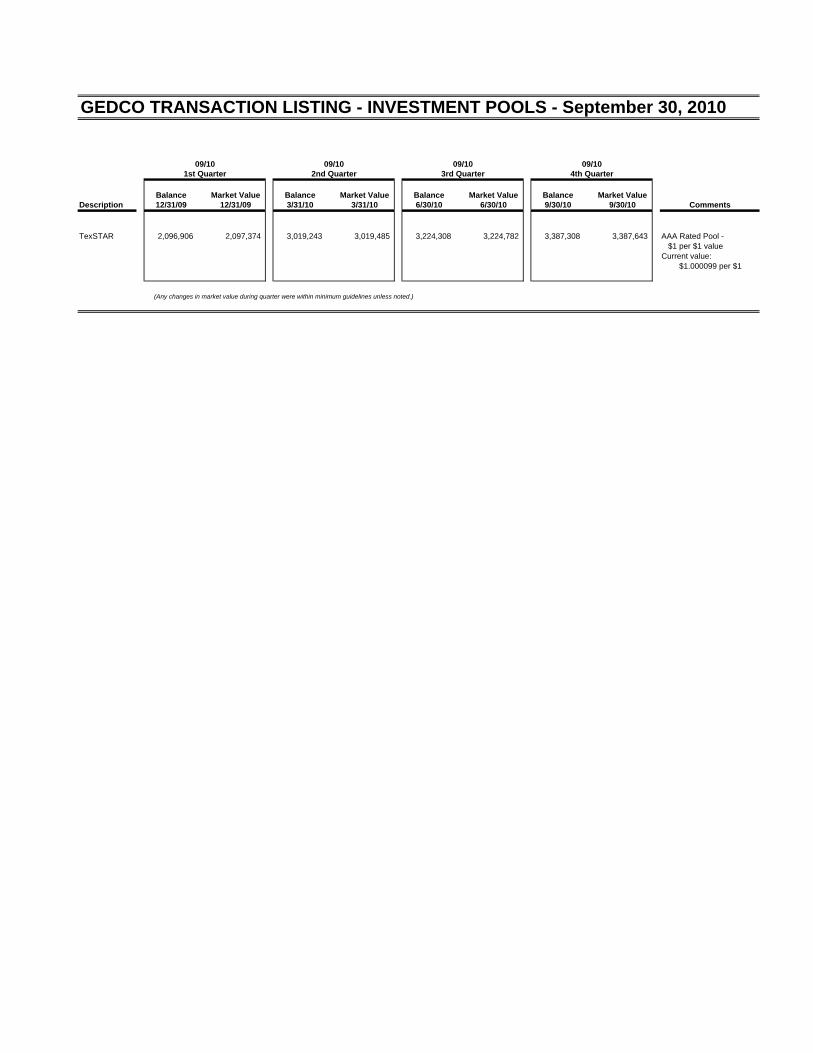
GEDCO TRANSACTION LISTING - INVESTMENT POOLS - September 30, 2010
09/10 09/10 09/10 09/101st Quarter 2nd Quarter 3rd Quarter 4th Quarter
Balance Market Value Balance Market Value Balance Market Value Balance Market Value
Description 12/31/09 12/31/09 3/31/10 3/31/10 6/30/10 6/30/10 9/30/10 9/30/10 Comments
TexSTAR 2,096,906 2,097,374 3,019,243 3,019,485 3,224,308 3,224,782 3,387,308 3,387,643 AAA Rated Pool - $1 per $1 value
Current value: $1.000099 per $1
(Any changes in market value during quarter were within minimum guidelines unless noted.)
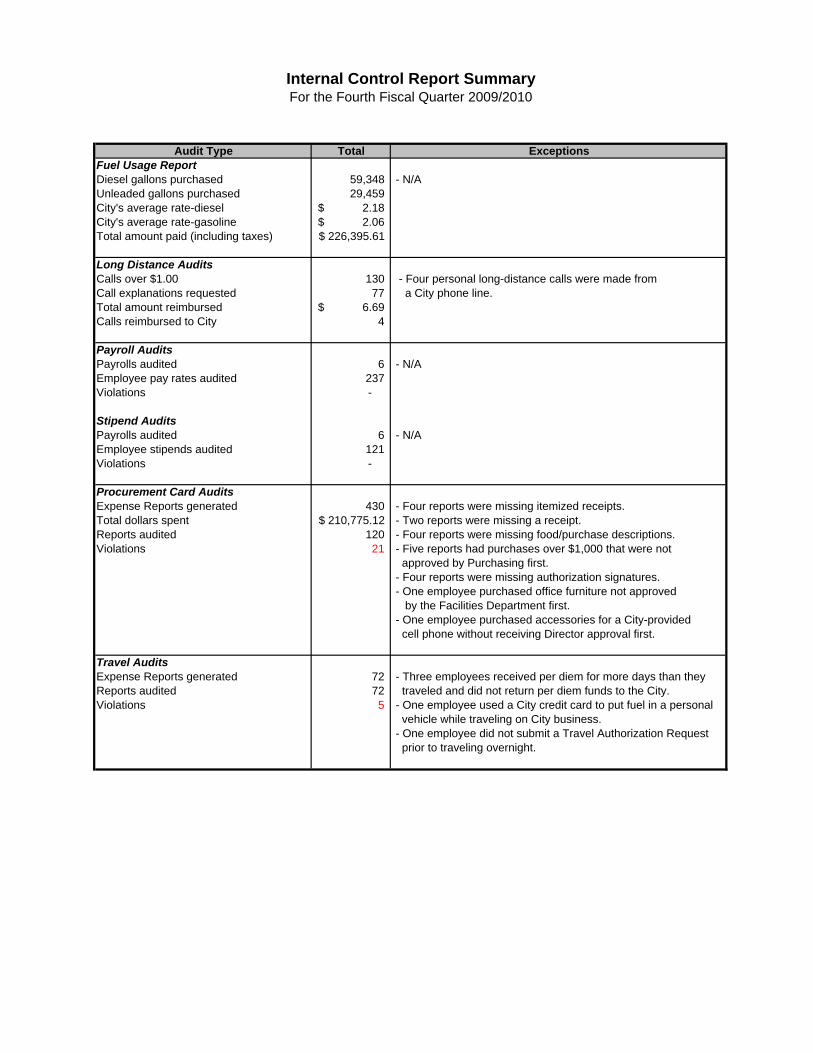
Audit Type Total ExceptionsFuel Usage ReportDiesel gallons purchased 59,348 - N/AUnleaded gallons purchased 29,459 City's average rate-diesel 2.18$ City's average rate-gasoline 2.06$ Total amount paid (including taxes) 226,395.61$
Long Distance AuditsCalls over $1.00 130 - Four personal long-distance calls were made from Call explanations requested 77 a City phone line.Total amount reimbursed 6.69$ Calls reimbursed to City 4
Payroll AuditsPayrolls audited 6 - N/AEmployee pay rates audited 237 Violations -
Stipend AuditsPayrolls audited 6 - N/AEmployee stipends audited 121 Violations -
Procurement Card AuditsExpense Reports generated 430 - Four reports were missing itemized receipts.Total dollars spent 210,775.12$ - Two reports were missing a receipt.Reports audited 120 - Four reports were missing food/purchase descriptions.Violations 21 - Five reports had purchases over $1,000 that were not
approved by Purchasing first. - Four reports were missing authorization signatures. - One employee purchased office furniture not approved by the Facilities Department first. - One employee purchased accessories for a City-provided cell phone without receiving Director approval first.
Travel AuditsExpense Reports generated 72 - Three employees received per diem for more days than theyReports audited 72 traveled and did not return per diem funds to the City.Violations 5 - One employee used a City credit card to put fuel in a personal
vehicle while traveling on City business. - One employee did not submit a Travel Authorization Request prior to traveling overnight.
Internal Control Report SummaryFor the Fourth Fiscal Quarter 2009/2010
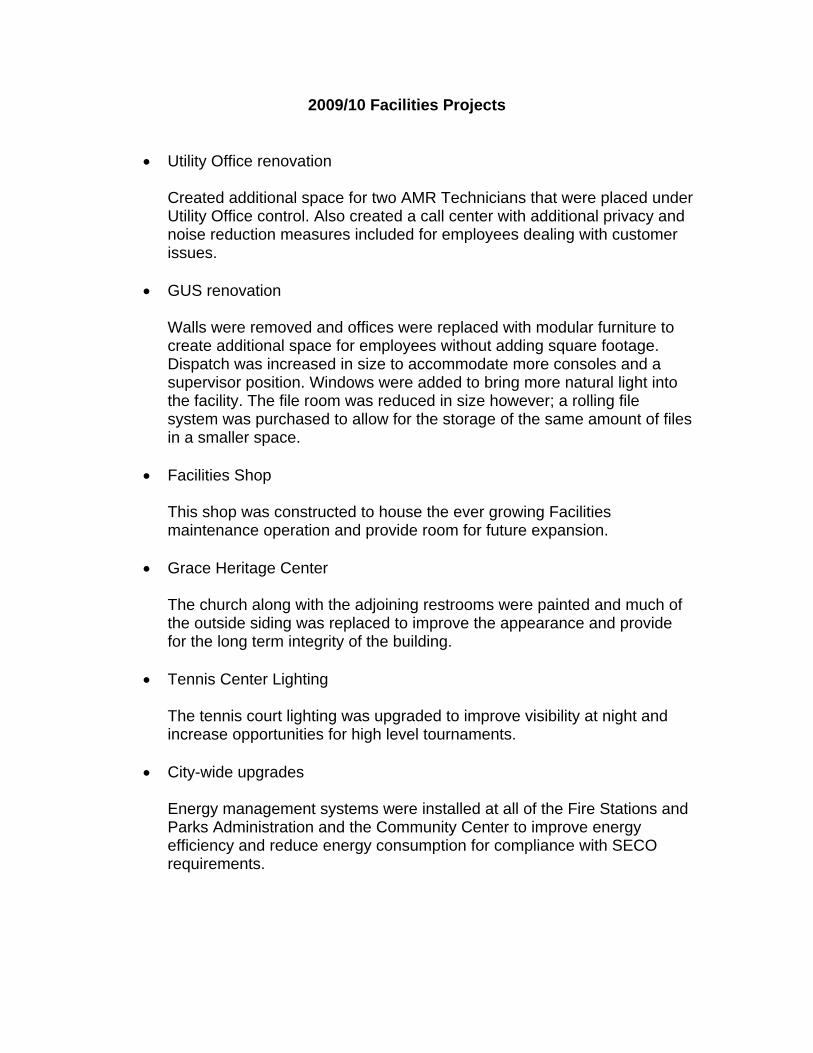
2009/10 Facilities Projects
Utility Office renovation Created additional space for two AMR Technicians that were placed under Utility Office control. Also created a call center with additional privacy and noise reduction measures included for employees dealing with customer issues.
GUS renovation
Walls were removed and offices were replaced with modular furniture to create additional space for employees without adding square footage. Dispatch was increased in size to accommodate more consoles and a supervisor position. Windows were added to bring more natural light into the facility. The file room was reduced in size however; a rolling file system was purchased to allow for the storage of the same amount of files in a smaller space.
Facilities Shop
This shop was constructed to house the ever growing Facilities maintenance operation and provide room for future expansion.
Grace Heritage Center
The church along with the adjoining restrooms were painted and much of the outside siding was replaced to improve the appearance and provide for the long term integrity of the building.
Tennis Center Lighting
The tennis court lighting was upgraded to improve visibility at night and increase opportunities for high level tournaments.
City-wide upgrades
Energy management systems were installed at all of the Fire Stations and Parks Administration and the Community Center to improve energy efficiency and reduce energy consumption for compliance with SECO requirements.
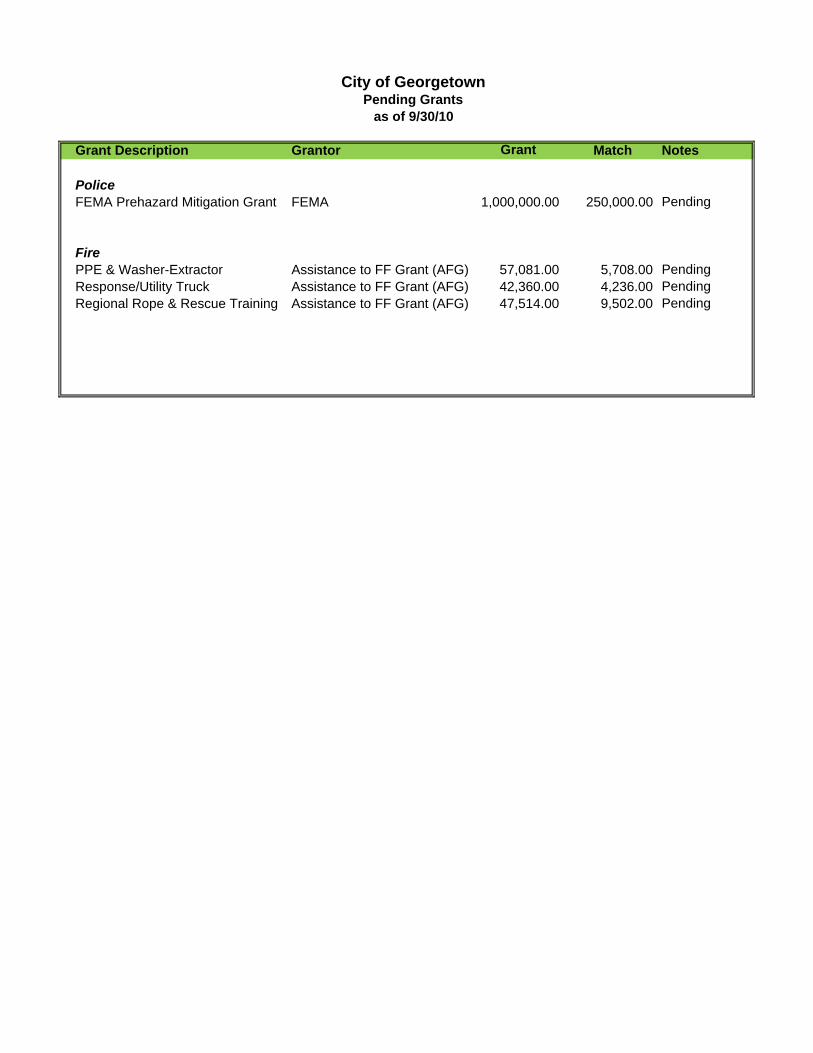
Grant Description Grantor Grant Match Notes
PoliceFEMA Prehazard Mitigation Grant FEMA 1,000,000.00 250,000.00 Pending
FirePPE & Washer-Extractor Assistance to FF Grant (AFG) 57,081.00 5,708.00 PendingResponse/Utility Truck Assistance to FF Grant (AFG) 42,360.00 4,236.00 PendingRegional Rope & Rescue Training Assistance to FF Grant (AFG) 47,514.00 9,502.00 Pending
City of GeorgetownPending Grants
as of 9/30/10
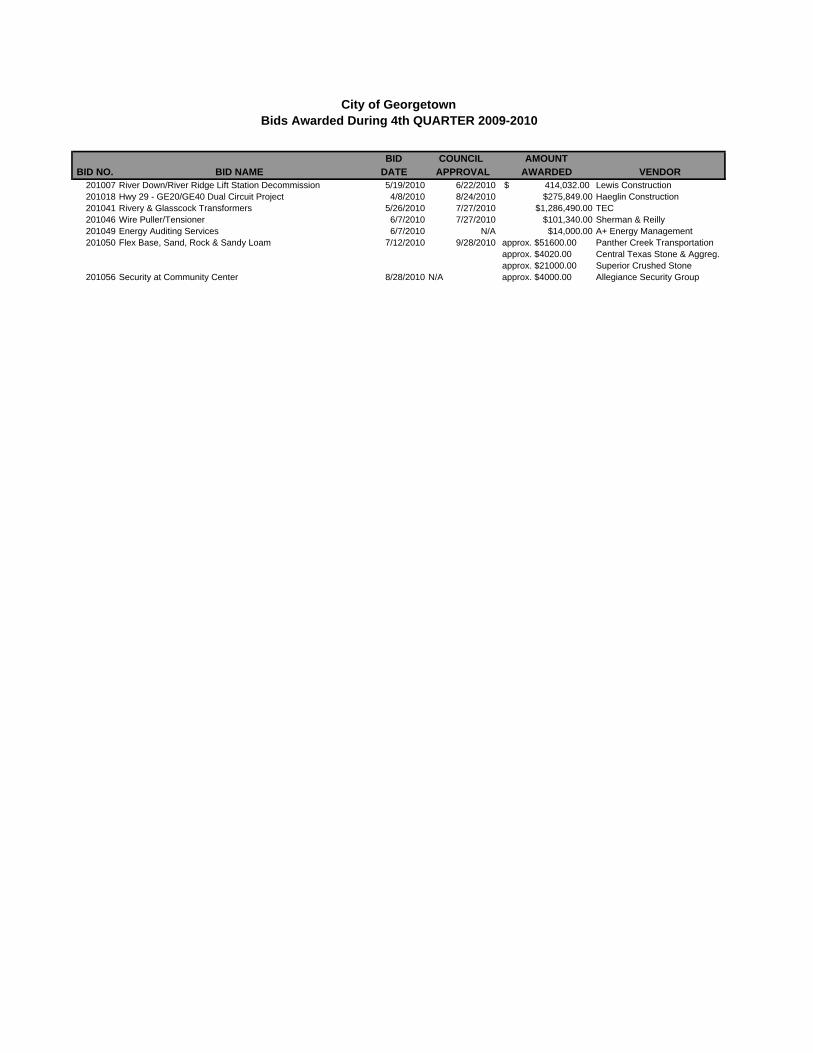
BID COUNCIL AMOUNTBID NO. BID NAME DATE APPROVAL AWARDED VENDOR
201007 River Down/River Ridge Lift Station Decommission 5/19/2010 6/22/2010 414,032.00$ Lewis Construction201018 Hwy 29 - GE20/GE40 Dual Circuit Project 4/8/2010 8/24/2010 $275,849.00 Haeglin Construction201041 Rivery & Glasscock Transformers 5/26/2010 7/27/2010 $1,286,490.00 TEC201046 Wire Puller/Tensioner 6/7/2010 7/27/2010 $101,340.00 Sherman & Reilly201049 Energy Auditing Services 6/7/2010 N/A $14,000.00 A+ Energy Management201050 Flex Base, Sand, Rock & Sandy Loam 7/12/2010 9/28/2010 approx. $51600.00 Panther Creek Transportation
approx. $4020.00 Central Texas Stone & Aggreg.approx. $21000.00 Superior Crushed Stone
201056 Security at Community Center 8/28/2010 N/A approx. $4000.00 Allegiance Security Group
City of GeorgetownBids Awarded During 4th QUARTER 2009-2010
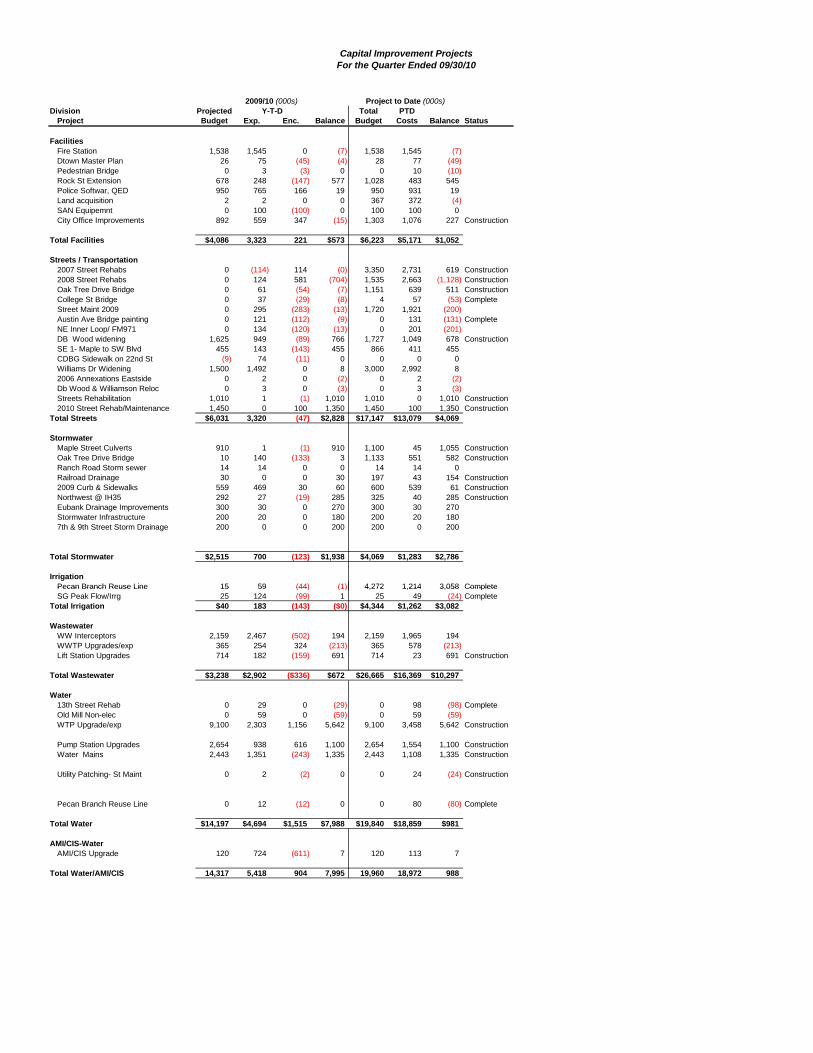
Capital Improvement ProjectsFor the Quarter Ended 09/30/10
Division Projected Total PTDProject Budget Exp. Enc. Balance Budget Costs Balance Status
FacilitiesFire Station 1,538 1,545 0 (7) 1,538 1,545 (7)Dtown Master Plan 26 75 (45) (4) 28 77 (49)Pedestrian Bridge 0 3 (3) 0 0 10 (10)Rock St Extension 678 248 (147) 577 1,028 483 545Police Softwar, QED 950 765 166 19 950 931 19Land acquisition 2 2 0 0 367 372 (4)SAN Equipemnt 0 100 (100) 0 100 100 0City Office Improvements 892 559 347 (15) 1,303 1,076 227 Construction
Total Facilities $4,086 3,323 221 $573 $6,223 $5,171 $1,052
Streets / Transportation2007 Street Rehabs 0 (114) 114 (0) 3,350 2,731 619 Construction2008 Street Rehabs 0 124 581 (704) 1,535 2,663 (1,128) ConstructionOak Tree Drive Bridge 0 61 (54) (7) 1,151 639 511 ConstructionCollege St Bridge 0 37 (29) (8) 4 57 (53) CompleteStreet Maint 2009 0 295 (283) (13) 1,720 1,921 (200)Austin Ave Bridge painting 0 121 (112) (9) 0 131 (131) CompleteNE Inner Loop/ FM971 0 134 (120) (13) 0 201 (201)DB Wood widening 1,625 949 (89) 766 1,727 1,049 678 ConstructionSE 1- Maple to SW Blvd 455 143 (143) 455 866 411 455CDBG Sidewalk on 22nd St (9) 74 (11) 0 0 0 0Williams Dr Widening 1,500 1,492 0 8 3,000 2,992 82006 Annexations Eastside 0 2 0 (2) 0 2 (2)Db Wood & Williamson Reloc 0 3 0 (3) 0 3 (3)Streets Rehabilitation 1,010 1 (1) 1,010 1,010 0 1,010 Construction2010 Street Rehab/Maintenance 1,450 0 100 1,350 1,450 100 1,350 Construction
Total Streets $6,031 3,320 (47) $2,828 $17,147 $13,079 $4,069
StormwaterMaple Street Culverts 910 1 (1) 910 1,100 45 1,055 ConstructionOak Tree Drive Bridge 10 140 (133) 3 1,133 551 582 ConstructionRanch Road Storm sewer 14 14 0 0 14 14 0Railroad Drainage 30 0 0 30 197 43 154 Construction2009 Curb & Sidewalks 559 469 30 60 600 539 61 ConstructionNorthwest @ IH35 292 27 (19) 285 325 40 285 ConstructionEubank Drainage Improvements 300 30 0 270 300 30 270Stormwater Infrastructure 200 20 0 180 200 20 1807th & 9th Street Storm Drainage 200 0 0 200 200 0 200
Total Stormwater $2,515 700 (123) $1,938 $4,069 $1,283 $2,786
IrrigationPecan Branch Reuse Line 15 59 (44) (1) 4,272 1,214 3,058 Complete
Y-T-D2009/10 (000s) Project to Date (000s)
Pecan Branch Reuse Line 15 59 (44) (1) 4,272 1,214 3,058 CompleteSG Peak Flow/Irrg 25 124 (99) 1 25 49 (24) Complete
Total Irrigation $40 183 (143) ($0) $4,344 $1,262 $3,082
WastewaterWW Interceptors 2,159 2,467 (502) 194 2,159 1,965 194WWTP Upgrades/exp 365 254 324 (213) 365 578 (213)Lift Station Upgrades 714 182 (159) 691 714 23 691 Construction
Total Wastewater $3,238 $2,902 ($336) $672 $26,665 $16,369 $10,297
Water13th Street Rehab 0 29 0 (29) 0 98 (98) CompleteOld Mill Non-elec 0 59 0 (59) 0 59 (59)WTP Upgrade/exp 9,100 2,303 1,156 5,642 9,100 3,458 5,642 Construction
Pump Station Upgrades 2,654 938 616 1,100 2,654 1,554 1,100 ConstructionWater Mains 2,443 1,351 (243) 1,335 2,443 1,108 1,335 Construction
Utility Patching- St Maint 0 2 (2) 0 0 24 (24) Construction
Pecan Branch Reuse Line 0 12 (12) 0 0 80 (80) Complete
Total Water $14,197 $4,694 $1,515 $7,988 $19,840 $18,859 $981
AMI/CIS-WaterAMI/CIS Upgrade 120 724 (611) 7 120 113 7
Total Water/AMI/CIS 14,317 5,418 904 7,995 19,960 18,972 988