Embed Size (px)
Citation preview
3Q16 Investment Review Presented to Lisle Woodridge FPD Pension Fund November 21st 2016
Jon Willhite, CIMA UBS Institutional Consulting 1780 Hughes Landing Blvd., Ste 200 The Woodlands, TX 77380
281-362-2250 [email protected]
©U
BS 2
01
3.
All
rig
hts
rese
rved. U
BS F
inanci
al Serv
ices
Inc.
is
a s
ubsi
dia
ry o
f U
BS A
G. M
em
ber
SIP
C.
Institutional Consulting Group
Investment Committee Agenda 3Q16
Lisle Woodridge FPD Pension Fund November 21st 2016 Pension Governance
Investment Policy updated and approved February 2015- review as needed or by February 2017
Cash Flow Policy updated January 2016, review as needed or by January 2017
Review of Changes Made in 2Q16 (Jon was unable to attend the August meeting)
No changes requested
Items to be addressed at 3Q16 board meeting
1. Review Informa performance report & current market environment
2. Rebalance portfolio as: Proposed Do nothing Other: _____________________________________________________________________
3. Other_________________________________________________________________________ 4. Other_________________________________________________________________________ 5. Other_________________________________________________________________________
Trustee Signature:__________________________________ Date:________________________ Wealth management services in the United States are provided by UBS Financial Services Inc., a registered broker-dealer offering securities, trading, brokerage and related products and services. It is important that you understand the ways in which we conduct business and the applicable laws and regulations that govern us. As a firm providing wealth management services to clients in the U.S., we are registered with the U.S. Securities and Exchange Commission (SEC) as an investment adviser and a broker-dealer, offering both investment advisory and brokerage services. Advisory services and brokerage services are separate and distinct, differ in material ways and are governed by different laws and separate contracts. It is important that you carefully read the agreements and disclosures that we provide to you about the products or services we offer. While we strive to ensure the nature of our services is clear in the materials we publish, if at any time you seek clarification on the nature of your accounts or the services you receive, please speak with your Institutional Consultant. For more information, please visit our website at ubs.com/workingwithus. UBS Institutional Consulting Services are investment advisory services and clients should carefully read the UBS Institutional Consulting ADV Disclosure Document for important information regarding our consulting services, including fees and scope of services, before entering into a Consulting Services Agreement.
Investment Review
©UBS 2014. All rights reserved. UBS Financial Services Inc. is a subsidiary of UBS AG. Member FINRA/SIPC. 141022-1747-003

Please contact your UBS Institutional Consultant if you have any questions regarding this report, if your financial situation, individualneeds or investment objectives have changed, or if you would like to initiate or modify any investment restrictions on this account.Please note that you are also required to inform your Institutional Consultant, directly, of any changes in your financial condition,investment objectives or investment restrictions on your account.
Prepared for:Lisle Woodridge FPD Pension FundNovember 14, 2016
Prepared by:
Investment Performance
Period Ending September 30, 2016
Lisle Woodridge FPD Pension Fund
Willhite Institutional Consulting Group
This report is provided for informational purposes only. The information shown was obtained from sources believed to be reliable, the accuracy of which cannot be guaranteed. Account statements provided by UBS or other financial institutions are theofficial record of your holdings, balances, transactions and security values and are not amended or superseded by any of the information presented in this report. Information is current as of the date shown. Past performance is no guarantee of futurereturns. See IMPORTANT INFORMATION at end of report for details.
Actual vs Target Asset Allocation 4 of 99
Opp Gains & Loss w/Returns 5 of 99
Performance Bar 6 of 99
Performance Profile Report 7 of 99
Opportunity Gain/Loss Report 8 of 99
Growth Of A Dollar 9 of 99
Objective Comparison 10 of 99
Capture Ratio Trend Graph 11 of 99
Asset Distribution Graph 12 of 99
Investment Earnings Report 13 of 99
Asset Allocation 14 of 99
Investment Performance Summary 16 of 99
Benchmark Comparisons Report 17 of 99
Invesco Equally-Weighted S&P 500 19 of 99
Risk/Reward & Multi-Stat Quartile 20 of 99
Capture Ratio Trend & Rolling Alpha 21 of 99
Performance Profile 22 of 99
RNC Genter LCV High Dividend 23 of 99
Risk/Reward & Multi-Stat Quartile 24 of 99
Capture Ratio Trend & Rolling Alpha 25 of 99
Performance Profile 26 of 99
Loomis Sayles Growth 27 of 99
Risk/Reward & Multi-Stat Quartile 28 of 99
Capture Ratio Trend & Rolling Alpha 29 of 99
Performance Profile 30 of 99
FMI Common Stock Fund 31 of 99
Risk/Reward & Multi-Stat Quartile 32 of 99
Capture Ratio Trend & Rolling Alpha 33 of 99
Performance Profile 34 of 99
Table of Contents
returns. See IMPORTANT INFORMATION at end of report for details.official record of your holdings, balances, transactions and security values and are not amended or superseded by any of the information presented in this report. Information is current as of the date shown. Past performance is no guarantee of future
This report is provided for informational purposes only. The information shown was obtained from sources believed to be reliable, the accuracy of which cannot be guaranteed. Account statements provided by UBS or other financial institutions are the
2
Undiscovered Managers Behavioral Value 35 of 99
Risk/Reward & Multi-Stat Quartile 36 of 99
Capture Ratio Trend & Rolling Alpha 37 of 99
Performance Profile 38 of 99
Invesco Intl Gowth Fund 39 of 99
Risk/Reward & Multi-Stat Quartile 40 of 99
Capture Ratio Trend & Rolling Alpha 41 of 99
Performance Profile 42 of 99
MFS International Value 43 of 99
Risk/Reward & Multi-Stat Quartile 44 of 99
Capture Ratio Trend & Rolling Alpha 45 of 99
Performance Profile 46 of 99
Lazard EM 47 of 99
Risk/Reward & Multi-Stat Quartile 48 of 99
Capture Ratio Trend & Rolling Alpha 49 of 99
Performance Profile 50 of 99
iShares Core MSCI Emerging Market 51 of 99
Risk/Reward & Multi-Stat Quartile 52 of 99
Capture Ratio Trend & Rolling Alpha 53 of 99
Performance Profile 54 of 99
Chilton REIT 55 of 99
Risk/Reward & Multi-Stat Quartile 56 of 99
Capture Ratio Trend & Rolling Alpha 57 of 99
Performance Profile 58 of 99
Stonebridge Advisors 59 of 99
Risk/Reward & Multi-Stat Quartile 60 of 99
Capture Ratio Trend & Rolling Alpha 61 of 99
Performance Profile 62 of 99
Table of Contents
returns. See IMPORTANT INFORMATION at end of report for details.official record of your holdings, balances, transactions and security values and are not amended or superseded by any of the information presented in this report. Information is current as of the date shown. Past performance is no guarantee of future
This report is provided for informational purposes only. The information shown was obtained from sources believed to be reliable, the accuracy of which cannot be guaranteed. Account statements provided by UBS or other financial institutions are the
3

Convertible Sec SPDR 63 of 99
Risk/Reward & Multi-Stat Quartile 64 of 99
Capture Ratio Trend & Rolling Alpha 65 of 99
Performance Profile 66 of 99
Wells Fargo Absolute Return 67 of 99
Risk/Reward & Multi-Stat Quartile 68 of 99
Capture Ratio Trend & Rolling Alpha 69 of 99
Performance Profile 70 of 99
Bradford Marzec 71 of 99
Risk/Reward & Multi-Stat Quartile 72 of 99
Capture Ratio Trend & Rolling Alpha 73 of 99
Performance Profile 74 of 99
PIA Fixed Income 75 of 99
Risk/Reward & Multi-Stat Quartile 76 of 99
Capture Ratio Trend & Rolling Alpha 77 of 99
Performance Profile 78 of 99
BlackRock Strategic Income Opportunities 79 of 99
Risk/Reward & Multi-Stat Quartile 80 of 99
Capture Ratio Trend & Rolling Alpha 81 of 99
Performance Profile 82 of 99
Pioneer Strategic Income Opportunities 83 of 99
Risk/Reward & Multi-Stat Quartile 84 of 99
Capture Ratio Trend & Rolling Alpha 85 of 99
Performance Profile 86 of 99
UBS Cash Account 87 of 99
Risk/Reward & Multi-Stat Quartile 88 of 99
Capture Ratio Trend & Rolling Alpha 89 of 99
Performance Profile 90 of 99
Disclosures 91 of 99
Definitions 94 of 99
Table of Contents
returns. See IMPORTANT INFORMATION at end of report for details.official record of your holdings, balances, transactions and security values and are not amended or superseded by any of the information presented in this report. Information is current as of the date shown. Past performance is no guarantee of future
This report is provided for informational purposes only. The information shown was obtained from sources believed to be reliable, the accuracy of which cannot be guaranteed. Account statements provided by UBS or other financial institutions are the
4

Table of Contents
returns. See IMPORTANT INFORMATION at end of report for details.official record of your holdings, balances, transactions and security values and are not amended or superseded by any of the information presented in this report. Information is current as of the date shown. Past performance is no guarantee of future
This report is provided for informational purposes only. The information shown was obtained from sources believed to be reliable, the accuracy of which cannot be guaranteed. Account statements provided by UBS or other financial institutions are the
5
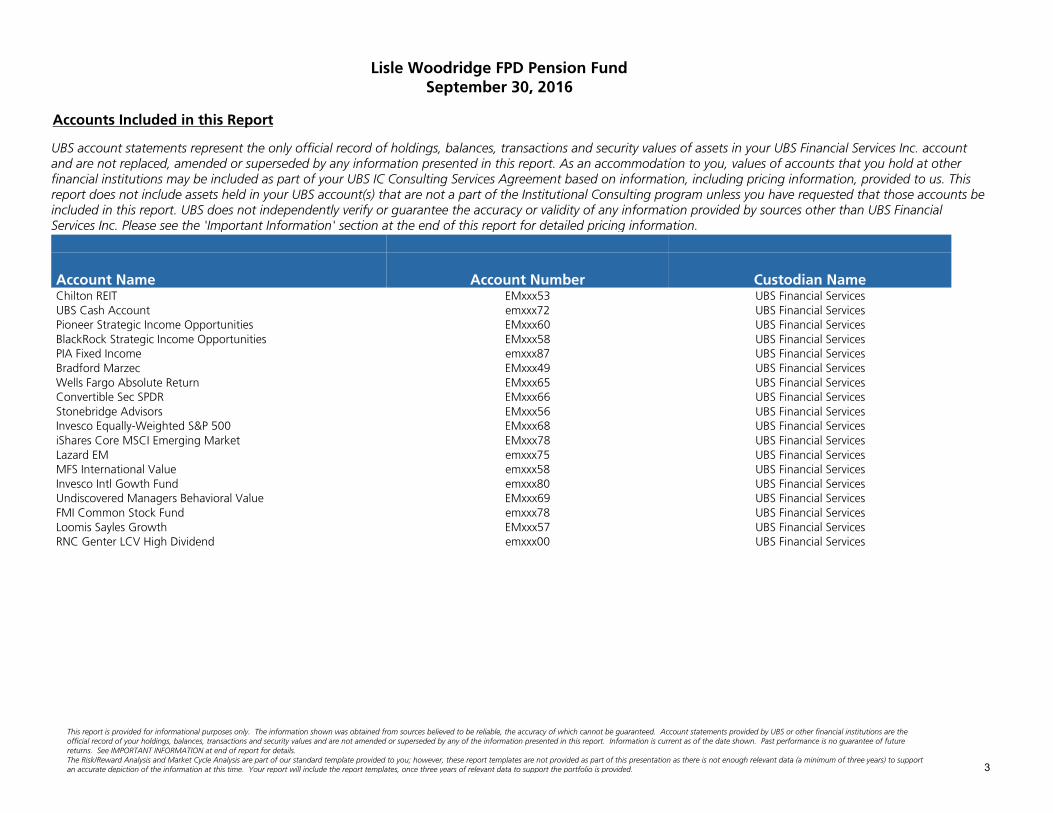
Account Name Account Number Custodian NameChilton REIT EMxxx53 UBS Financial ServicesUBS Cash Account emxxx72 UBS Financial ServicesPioneer Strategic Income Opportunities EMxxx60 UBS Financial ServicesBlackRock Strategic Income Opportunities EMxxx58 UBS Financial ServicesPIA Fixed Income emxxx87 UBS Financial ServicesBradford Marzec EMxxx49 UBS Financial ServicesWells Fargo Absolute Return EMxxx65 UBS Financial ServicesConvertible Sec SPDR EMxxx66 UBS Financial ServicesStonebridge Advisors EMxxx56 UBS Financial ServicesInvesco Equally-Weighted S&P 500 EMxxx68 UBS Financial ServicesiShares Core MSCI Emerging Market EMxxx78 UBS Financial ServicesLazard EM emxxx75 UBS Financial ServicesMFS International Value emxxx58 UBS Financial ServicesInvesco Intl Gowth Fund emxxx80 UBS Financial ServicesUndiscovered Managers Behavioral Value EMxxx69 UBS Financial ServicesFMI Common Stock Fund emxxx78 UBS Financial ServicesLoomis Sayles Growth EMxxx57 UBS Financial ServicesRNC Genter LCV High Dividend emxxx00 UBS Financial Services
UBS account statements represent the only official record of holdings, balances, transactions and security values of assets in your UBS Financial Services Inc. accountand are not replaced, amended or superseded by any information presented in this report. As an accommodation to you, values of accounts that you hold at otherfinancial institutions may be included as part of your UBS IC Consulting Services Agreement based on information, including pricing information, provided to us. Thisreport does not include assets held in your UBS account(s) that are not a part of the Institutional Consulting program unless you have requested that those accounts beincluded in this report. UBS does not independently verify or guarantee the accuracy or validity of any information provided by sources other than UBS FinancialServices Inc. Please see the 'Important Information' section at the end of this report for detailed pricing information.
This report is provided for informational purposes only. The information shown was obtained from sources believed to be reliable, the accuracy of which cannot be guaranteed. Account statements provided by UBS or other financial institutions are theofficial record of your holdings, balances, transactions and security values and are not amended or superseded by any of the information presented in this report. Information is current as of the date shown. Past performance is no guarantee of futurereturns. See IMPORTANT INFORMATION at end of report for details.The Risk/Reward Analysis and Market Cycle Analysis are part of our standard template provided to you; however, these report templates are not provided as part of this presentation as there is not enough relevant data (a minimum of three years) to supportan accurate depiction of the information at this time. Your report will include the report templates, once three years of relevant data to support the portfolio is provided.
Lisle Woodridge FPD Pension FundSeptember 30, 2016
Accounts Included in this Report
3
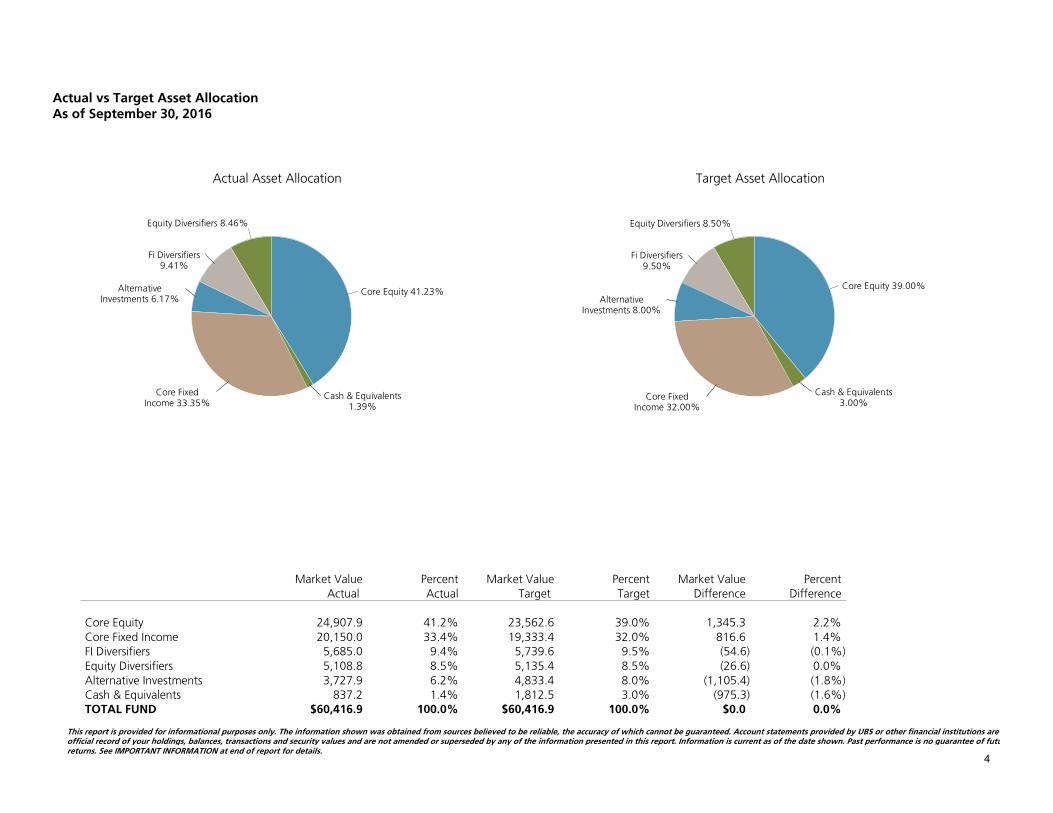
Market Value Percent Market Value Percent Market Value PercentActual Actual Target Target Difference Difference
Core Equity 24,907.9 41.2% 23,562.6 39.0% 1,345.3 2.2%Core Fixed Income 20,150.0 33.4% 19,333.4 32.0% 816.6 1.4%FI Diversifiers 5,685.0 9.4% 5,739.6 9.5% (54.6) (0.1%)Equity Diversifiers 5,108.8 8.5% 5,135.4 8.5% (26.6) 0.0%Alternative Investments 3,727.9 6.2% 4,833.4 8.0% (1,105.4) (1.8%)Cash & Equivalents 837.2 1.4% 1,812.5 3.0% (975.3) (1.6%)TOTAL FUND $60,416.9 100.0% $60,416.9 100.0% $0.0 0.0%
Equity Diversifiers 8.46%
Fi Diversifiers9.41%
AlternativeInvestments 6.17%
Core FixedIncome 33.35%
Cash & Equivalents1.39%
Core Equity 41.23%
Equity Diversifiers 8.50%
Fi Diversifiers9.50%
AlternativeInvestments 8.00%
Core FixedIncome 32.00%
Cash & Equivalents3.00%
Core Equity 39.00%
Target Asset AllocationActual Asset Allocation
Actual vs Target Asset AllocationAs of September 30, 2016
returns. See IMPORTANT INFORMATION at end of report for details.official record of your holdings, balances, transactions and security values and are not amended or superseded by any of the information presented in this report. Information is current as of the date shown. Past performance is no guarantee of futureThis report is provided for informational purposes only. The information shown was obtained from sources believed to be reliable, the accuracy of which cannot be guaranteed. Account statements provided by UBS or other financial institutions are the
4
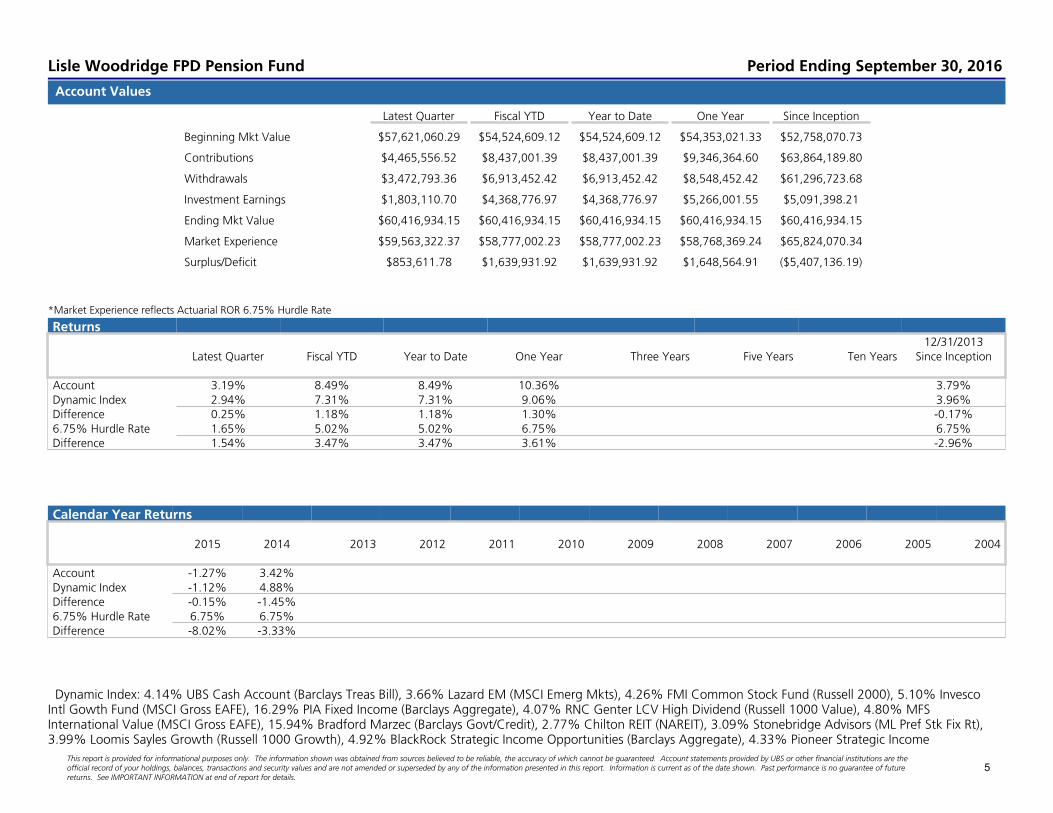
Returns 12/31/2013 Latest Quarter Fiscal YTD Year to Date One Year Three Years Five Years Ten Years Since Inception Account 3.19% 8.49% 8.49% 10.36% 3.79%Dynamic Index 2.94% 7.31% 7.31% 9.06% 3.96%Difference 0.25% 1.18% 1.18% 1.30% -0.17%6.75% Hurdle Rate 1.65% 5.02% 5.02% 6.75% 6.75%Difference 1.54% 3.47% 3.47% 3.61% -2.96%
Calendar Year Returns 2015 2014 2013 2012 2011 2010 2009 2008 2007 2006 2005 2004 Account -1.27% 3.42%Dynamic Index -1.12% 4.88%Difference -0.15% -1.45%6.75% Hurdle Rate 6.75% 6.75%Difference -8.02% -3.33%
Latest Quarter Fiscal YTD Year to Date One Year Since Inception
Beginning Mkt Value $57,621,060.29 $54,524,609.12 $54,524,609.12 $54,353,021.33 $52,758,070.73
Contributions $4,465,556.52 $8,437,001.39 $8,437,001.39 $9,346,364.60 $63,864,189.80
Withdrawals $3,472,793.36 $6,913,452.42 $6,913,452.42 $8,548,452.42 $61,296,723.68
Investment Earnings $1,803,110.70 $4,368,776.97 $4,368,776.97 $5,266,001.55 $5,091,398.21
Ending Mkt Value $60,416,934.15 $60,416,934.15 $60,416,934.15 $60,416,934.15 $60,416,934.15
Market Experience $59,563,322.37 $58,777,002.23 $58,777,002.23 $58,768,369.24 $65,824,070.34
Surplus/Deficit $853,611.78 $1,639,931.92 $1,639,931.92 $1,648,564.91 ($5,407,136.19)
Account Values
Dynamic Index: 4.14% UBS Cash Account (Barclays Treas Bill), 3.66% Lazard EM (MSCI Emerg Mkts), 4.26% FMI Common Stock Fund (Russell 2000), 5.10% InvescoIntl Gowth Fund (MSCI Gross EAFE), 16.29% PIA Fixed Income (Barclays Aggregate), 4.07% RNC Genter LCV High Dividend (Russell 1000 Value), 4.80% MFSInternational Value (MSCI Gross EAFE), 15.94% Bradford Marzec (Barclays Govt/Credit), 2.77% Chilton REIT (NAREIT), 3.09% Stonebridge Advisors (ML Pref Stk Fix Rt),3.99% Loomis Sayles Growth (Russell 1000 Growth), 4.92% BlackRock Strategic Income Opportunities (Barclays Aggregate), 4.33% Pioneer Strategic Income
Lisle Woodridge FPD Pension Fund Period Ending September 30, 2016
This report is provided for informational purposes only. The information shown was obtained from sources believed to be reliable, the accuracy of which cannot be guaranteed. Account statements provided by UBS or other financial institutions are theofficial record of your holdings, balances, transactions and security values and are not amended or superseded by any of the information presented in this report. Information is current as of the date shown. Past performance is no guarantee of futurereturns. See IMPORTANT INFORMATION at end of report for details.
*Market Experience reflects Actuarial ROR 6.75% Hurdle Rate
5
Rate of Return (%)
11.00
10.00
9.00
8.00
7.00
6.00
5.00
4.00
3.00
2.00
1.00
0.00
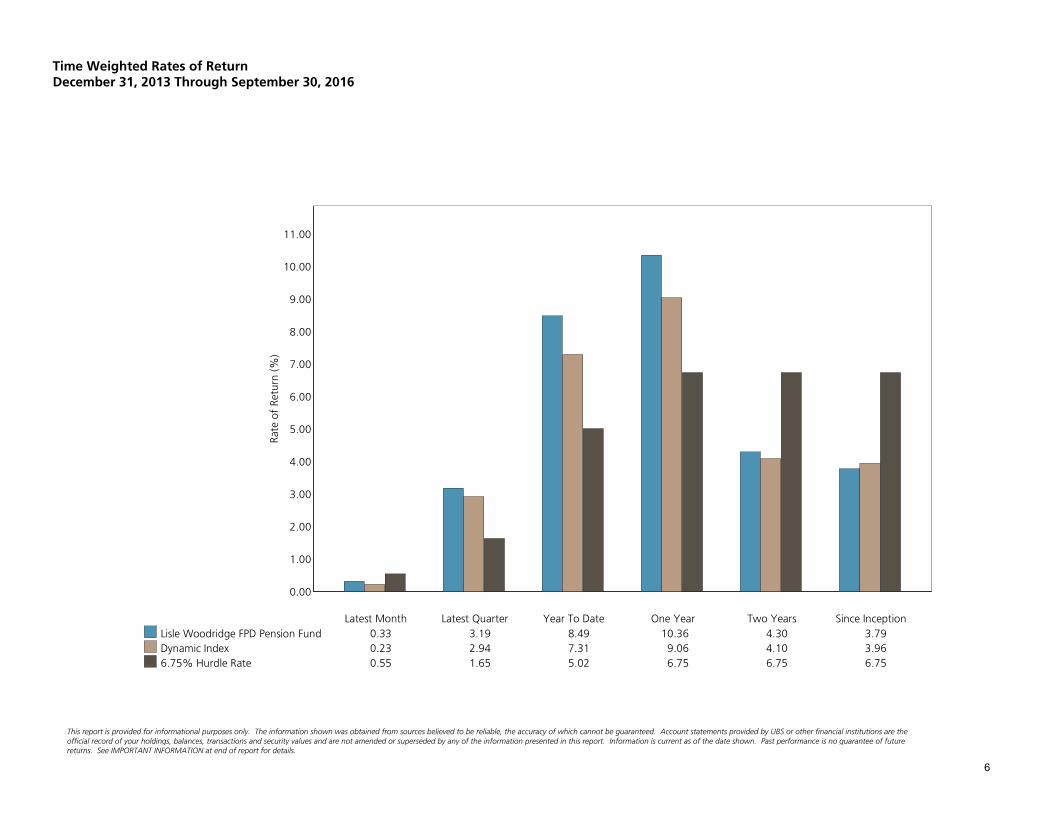
Latest Month Latest Quarter Year To Date One Year Two Years Since Inception
Lisle Woodridge FPD Pension Fund 0.33 3.19 8.49 10.36 4.30 3.79
Dynamic Index 0.23 2.94 7.31 9.06 4.10 3.96
6.75% Hurdle Rate 0.55 1.65 5.02 6.75 6.75 6.75
Time Weighted Rates of ReturnDecember 31, 2013 Through September 30, 2016
returns. See IMPORTANT INFORMATION at end of report for details.official record of your holdings, balances, transactions and security values and are not amended or superseded by any of the information presented in this report. Information is current as of the date shown. Past performance is no guarantee of future
This report is provided for informational purposes only. The information shown was obtained from sources believed to be reliable, the accuracy of which cannot be guaranteed. Account statements provided by UBS or other financial institutions are the
6

Ended ReturnBest Quarter 9/2016 3.19Worst Quarter 9/2015 -3.92Best 4 Quarters 9/2016 10.36Worst 4 Quarters 9/2015 -1.42
Total # of Periods: 33# of Positive Periods: 20# of Negative Periods: 13
YearLatest Latest To One Two SinceMonth Quarter Date Year Years Inception
TOTAL FUND 0.33 3.19 8.49 10.36 4.30 3.79Dynamic Index 0.23 2.94 7.31 9.06 4.10 3.96Excess 0.10 0.25 1.18 1.30 0.20 -0.17Riskless Index 0.04 0.09 0.31 0.32 0.21 0.17Real ROR 0.13 3.08 6.36 8.74 3.58 2.48
Std Sharpe Relative Track Treynor InfoPeriod Return Dev Ratio Alpha Beta R-Squared Risk Error Ratio Ratio
One Year 10.36 6.14 1.64 1.11 1.01 97.61 1.02 0.95 9.93 1.27Two Years 4.30 5.85 0.70 0.15 1.01 98.22 1.02 0.78 4.04 0.25Since Inception 3.79 6.19 0.59 -0.34 1.05 94.71 1.08 1.45 3.44 -0.10
Lisle Woodridge FPD Pension FundPerformance ProfileDecember 31, 2013 Through September 30, 2016
returns. See IMPORTANT INFORMATION at end of report for details.official record of your holdings, balances, transactions and security values and are not amended or superseded by any of the information presented in this report. Information is current as of the date shown. Past performance is no guarantee of future
This report is provided for informational purposes only. The information shown was obtained from sources believed to be reliable, the accuracy of which cannot be guaranteed. Account statements provided by UBS or other financial institutions are the
7
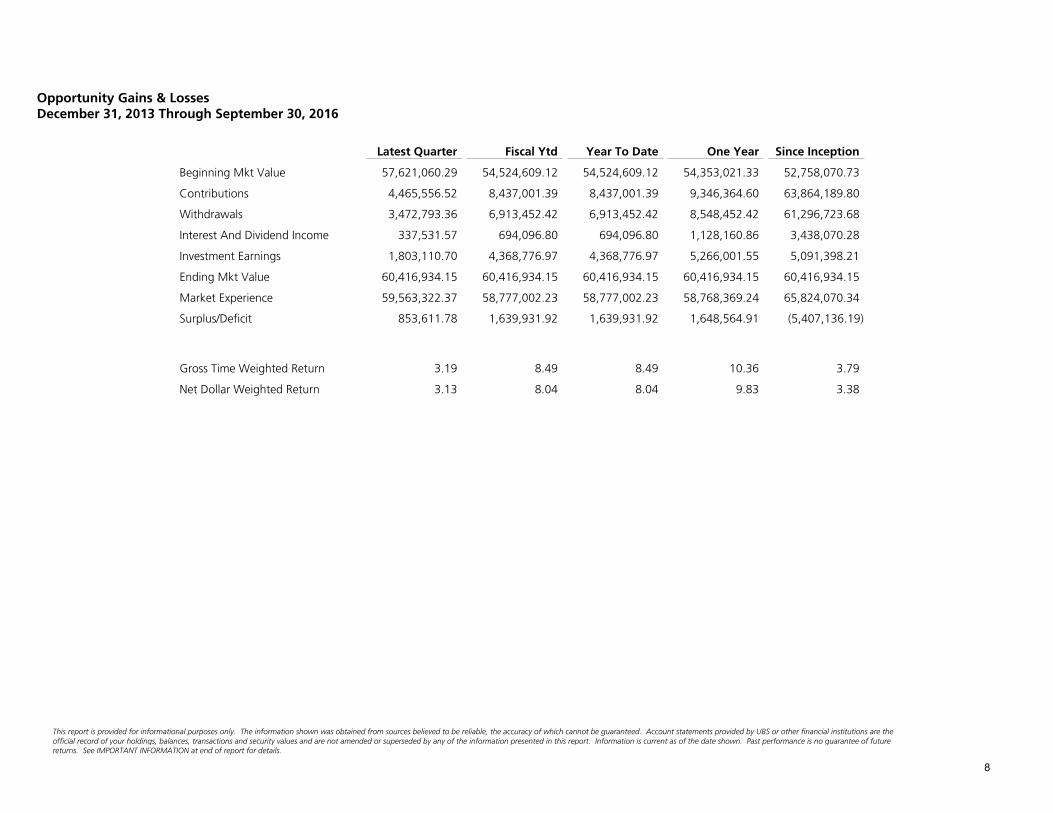
Latest Quarter Fiscal Ytd Year To Date One Year Since Inception
Beginning Mkt Value 57,621,060.29 54,524,609.12 54,524,609.12 54,353,021.33 52,758,070.73
Contributions 4,465,556.52 8,437,001.39 8,437,001.39 9,346,364.60 63,864,189.80
Withdrawals 3,472,793.36 6,913,452.42 6,913,452.42 8,548,452.42 61,296,723.68
Interest And Dividend Income 337,531.57 694,096.80 694,096.80 1,128,160.86 3,438,070.28
Investment Earnings 1,803,110.70 4,368,776.97 4,368,776.97 5,266,001.55 5,091,398.21
Ending Mkt Value 60,416,934.15 60,416,934.15 60,416,934.15 60,416,934.15 60,416,934.15
Market Experience 59,563,322.37 58,777,002.23 58,777,002.23 58,768,369.24 65,824,070.34
Surplus/Deficit 853,611.78 1,639,931.92 1,639,931.92 1,648,564.91 (5,407,136.19)
Gross Time Weighted Return 3.19 8.49 8.49 10.36 3.79
Net Dollar Weighted Return 3.13 8.04 8.04 9.83 3.38
Opportunity Gains & LossesDecember 31, 2013 Through September 30, 2016
returns. See IMPORTANT INFORMATION at end of report for details.official record of your holdings, balances, transactions and security values and are not amended or superseded by any of the information presented in this report. Information is current as of the date shown. Past performance is no guarantee of future
This report is provided for informational purposes only. The information shown was obtained from sources believed to be reliable, the accuracy of which cannot be guaranteed. Account statements provided by UBS or other financial institutions are the
8
3/2014 9/2014 3/2015 9/2015 3/2016 9/2016
Dollar Value
112.00
110.00
108.00
106.00
104.00
102.00
100.00
98.00
96.00
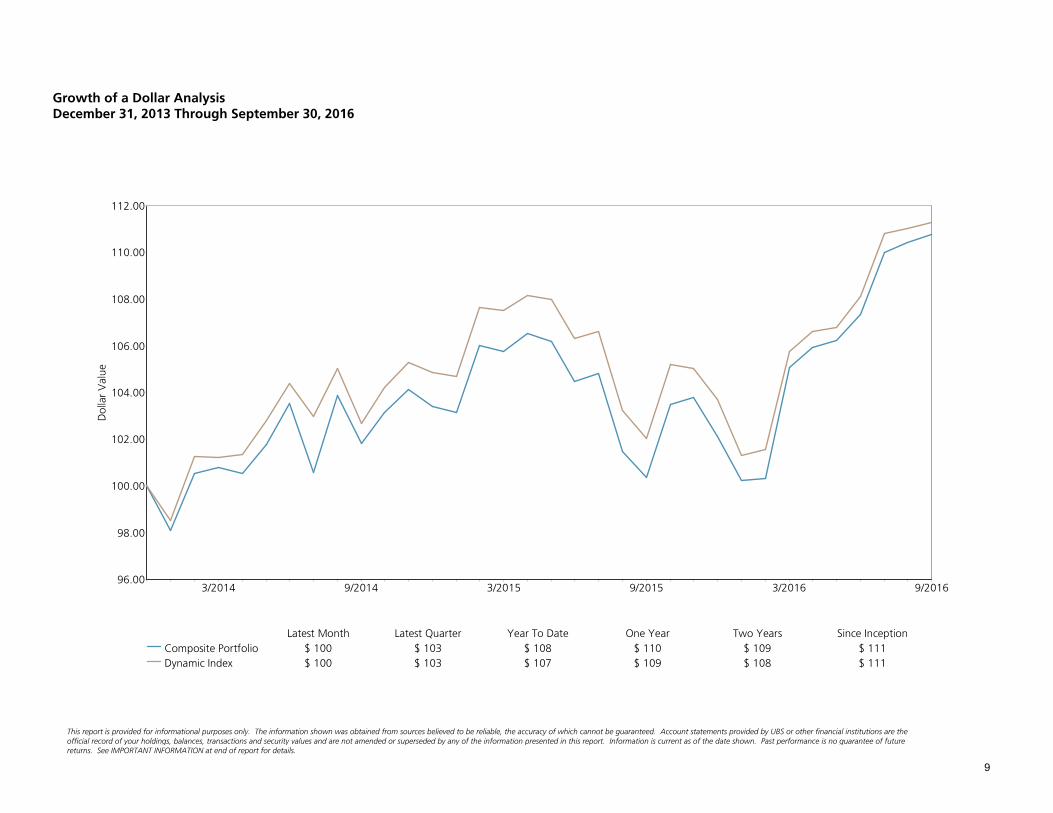
Latest Month Latest Quarter Year To Date One Year Two Years Since Inception
Composite Portfolio $ 100 $ 103 $ 108 $ 110 $ 109 $ 111
Dynamic Index $ 100 $ 103 $ 107 $ 109 $ 108 $ 111
Growth of a Dollar AnalysisDecember 31, 2013 Through September 30, 2016
returns. See IMPORTANT INFORMATION at end of report for details.official record of your holdings, balances, transactions and security values and are not amended or superseded by any of the information presented in this report. Information is current as of the date shown. Past performance is no guarantee of future
This report is provided for informational purposes only. The information shown was obtained from sources believed to be reliable, the accuracy of which cannot be guaranteed. Account statements provided by UBS or other financial institutions are the
9
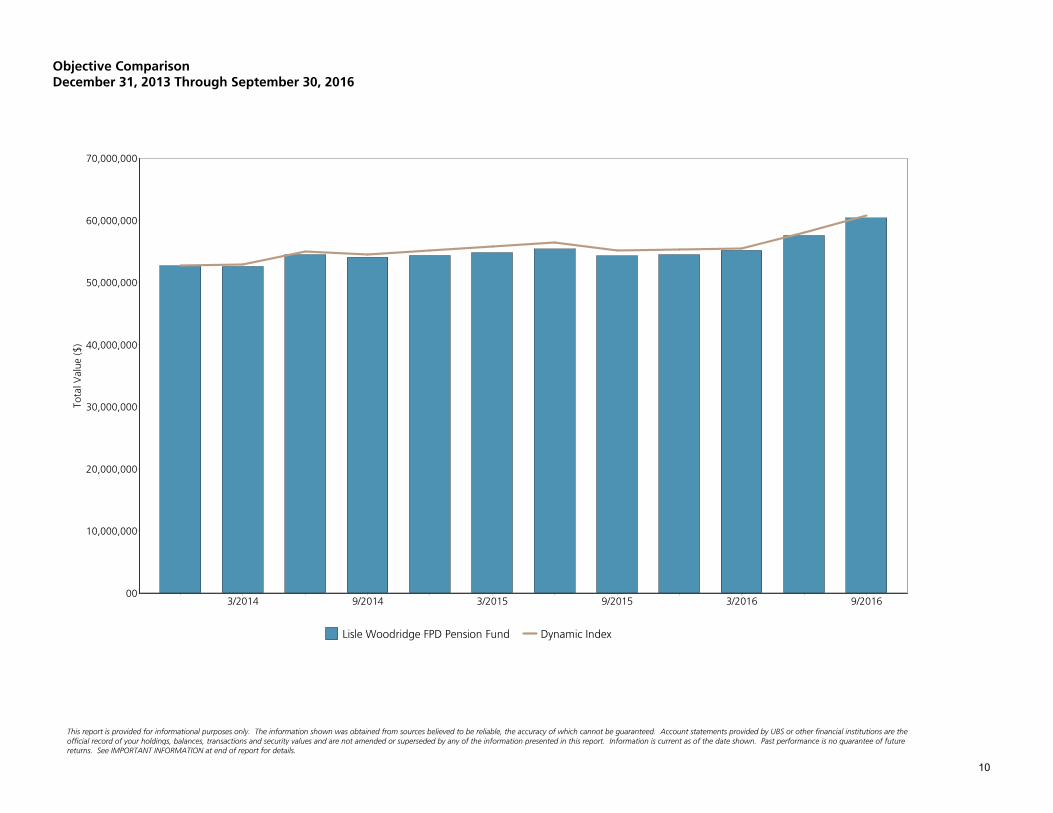
3/2014 9/2014 3/2015 9/2015 3/2016 9/2016
Total V
alue ($)
70,000,000
60,000,000
50,000,000
40,000,000
30,000,000
20,000,000
10,000,000
00
Lisle Woodridge FPD Pension Fund Dynamic Index
Objective ComparisonDecember 31, 2013 Through September 30, 2016
returns. See IMPORTANT INFORMATION at end of report for details.official record of your holdings, balances, transactions and security values and are not amended or superseded by any of the information presented in this report. Information is current as of the date shown. Past performance is no guarantee of future
This report is provided for informational purposes only. The information shown was obtained from sources believed to be reliable, the accuracy of which cannot be guaranteed. Account statements provided by UBS or other financial institutions are the
10
Downside Capture Ratio (%)1301201101009080706050403020100
Upside Cap
ture Ratio (%
)
130
120
110
100
90
80
70
60
50
40
30
20
10
0
1 2 3
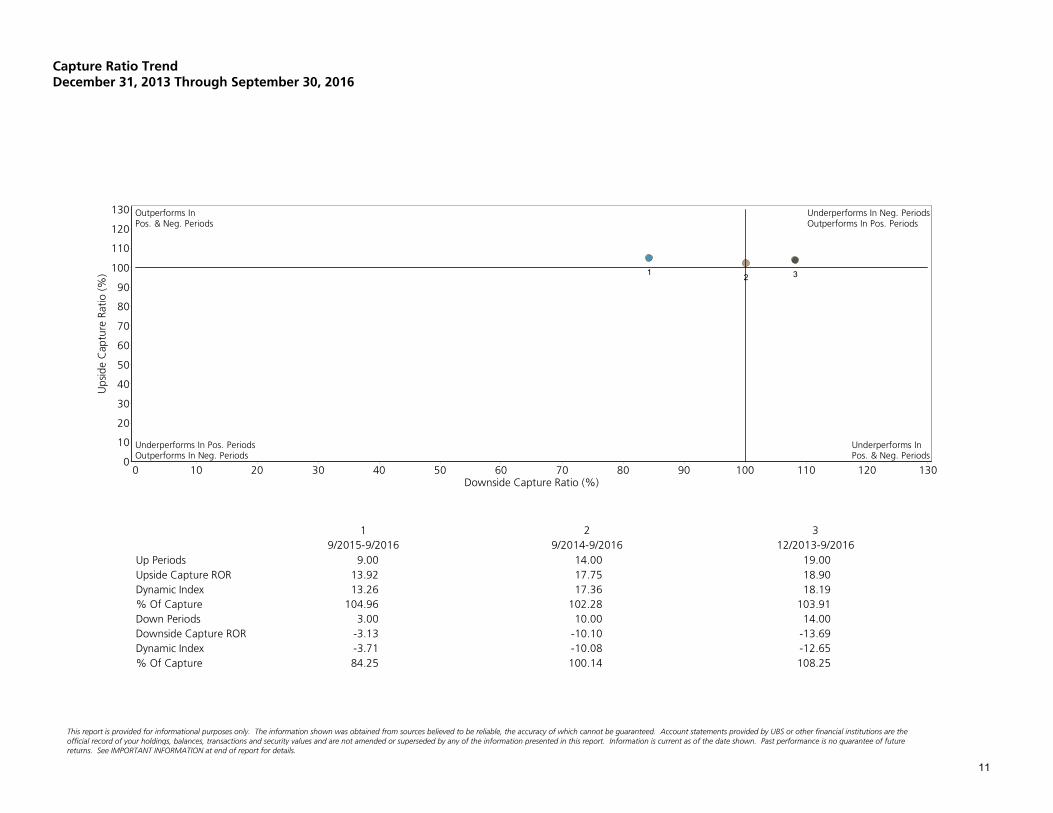
9/2015-9/2016 9/2014-9/2016 12/2013-9/2016
Up Periods 9.00 14.00 19.00
Upside Capture ROR 13.92 17.75 18.90
Dynamic Index 13.26 17.36 18.19
% Of Capture 104.96 102.28 103.91
Down Periods 3.00 10.00 14.00
Downside Capture ROR -3.13 -10.10 -13.69
Dynamic Index -3.71 -10.08 -12.65
% Of Capture 84.25 100.14 108.25
Outperforms InPos. & Neg. Periods
Underperforms In Neg. PeriodsOutperforms In Pos. Periods
Underperforms In Pos. PeriodsOutperforms In Neg. Periods
Underperforms InPos. & Neg. Periods
12
3
Capture Ratio TrendDecember 31, 2013 Through September 30, 2016
returns. See IMPORTANT INFORMATION at end of report for details.official record of your holdings, balances, transactions and security values and are not amended or superseded by any of the information presented in this report. Information is current as of the date shown. Past performance is no guarantee of future
This report is provided for informational purposes only. The information shown was obtained from sources believed to be reliable, the accuracy of which cannot be guaranteed. Account statements provided by UBS or other financial institutions are the
11
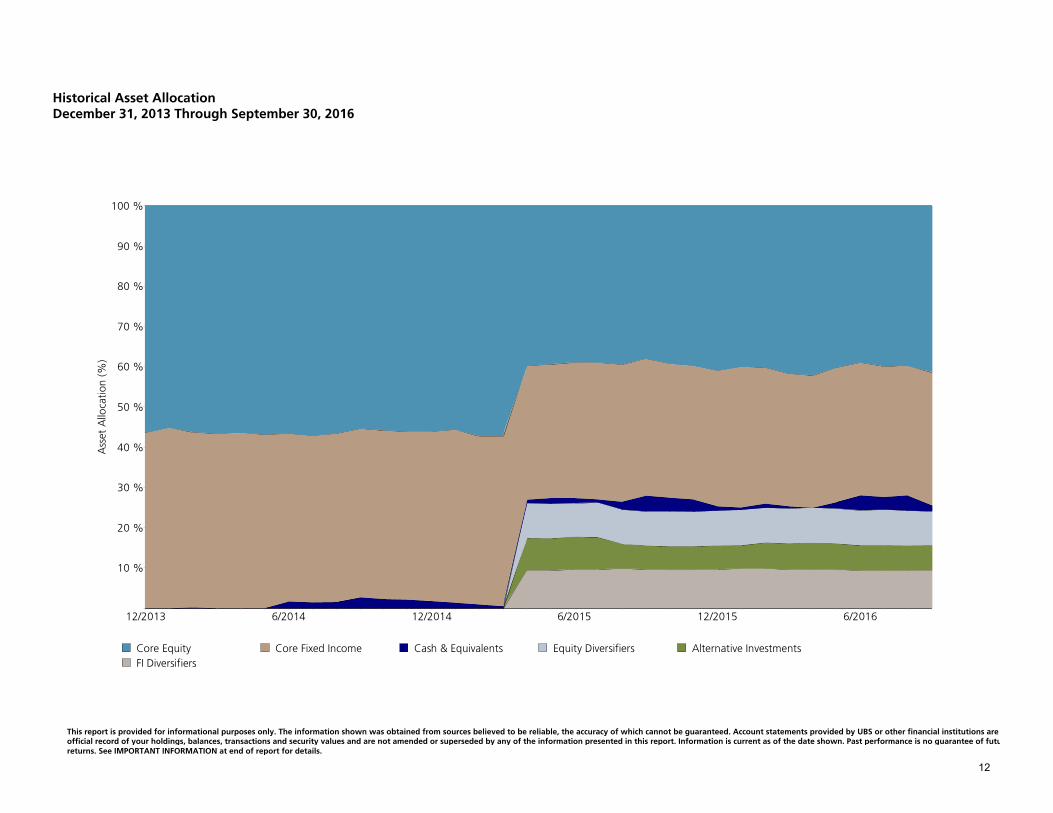
12/2013 6/2014 12/2014 6/2015 12/2015 6/2016
Asset Allo
cation (%)
100 %
90 %
80 %
70 %
60 %
50 %
40 %
30 %
20 %
10 %
Core Equity Core Fixed Income Cash & Equivalents Equity Diversifiers Alternative Investments
FI Diversifiers
Historical Asset AllocationDecember 31, 2013 Through September 30, 2016
returns. See IMPORTANT INFORMATION at end of report for details.official record of your holdings, balances, transactions and security values and are not amended or superseded by any of the information presented in this report. Information is current as of the date shown. Past performance is no guarantee of futureThis report is provided for informational purposes only. The information shown was obtained from sources believed to be reliable, the accuracy of which cannot be guaranteed. Account statements provided by UBS or other financial institutions are the
12

Manager Beginning Interest Net Ending TotalAnd Market New And Capital Market Investment Rate Of
Asset Class Value Money Dividends Appreciation Value Earnings Return
Invesco Equally-Weighted S&P 500 2,736,927 500,000 0 125,482 3,362,410 125,482 4.43
RNC Genter LCV High Dividend 2,353,794 0 18,886 55,324 2,428,005 74,210 3.33
Loomis Sayles Growth 2,230,694 0 0 178,779 2,409,473 178,779 8.07
FMI Common Stock Fund 2,390,977 300,000 0 117,271 2,808,248 117,271 4.78
Undiscovered Managers Behavioral Value 2,534,483 0 0 181,294 2,715,777 181,294 7.20
Invesco Intl Gowth Fund 2,952,227 0 0 111,569 3,063,797 111,569 3.83
MFS International Value 2,774,928 0 0 148,286 2,923,214 148,286 5.40
Lazard EM 2,022,298 350,000 12,296 167,488 2,552,082 179,784 8.88
iShares Core MSCI Emerging Market 2,429,158 0 1 215,760 2,644,919 215,761 8.93
Chilton REIT 1,648,509 -10,993 26,434 -40,148 1,623,802 -13,714 -0.67
Stonebridge Advisors 1,805,950 205 25,926 6,811 1,838,892 32,737 1.96
Convertible Sec SPDR 1,542,825 0 16,416 86,873 1,646,114 103,289 6.75
Wells Fargo Absolute Return 3,606,593 0 0 121,348 3,727,942 121,348 3.41
Bradford Marzec 9,363,116 650,000 109,315 -39,869 10,082,562 69,446 0.79
PIA Fixed Income 9,686,631 350,000 73,007 -42,201 10,067,437 30,806 0.43
BlackRock Strategic Income Opportunities 2,902,086 0 30,976 22,533 2,955,595 53,509 1.89
Pioneer Strategic Income Opportunities 2,507,031 150,000 23,422 48,977 2,729,431 72,399 2.94
UBS Cash Account 2,132,833 -1,296,449 853 0 837,237 853 0.04
Lisle Woodridge FPD Pension Fund 57,621,060 992,763 337,532 1,465,579 60,416,934 1,803,111 3.19
Investment EarningsJune 30, 2016 Through September 30, 2016
returns. See IMPORTANT INFORMATION at end of report for details.official record of your holdings, balances, transactions and security values and are not amended or superseded by any of the information presented in this report. Information is current as of the date shown. Past performance is no guarantee of future
This report is provided for informational purposes only. The information shown was obtained from sources believed to be reliable, the accuracy of which cannot be guaranteed. Account statements provided by UBS or other financial institutions are the
13
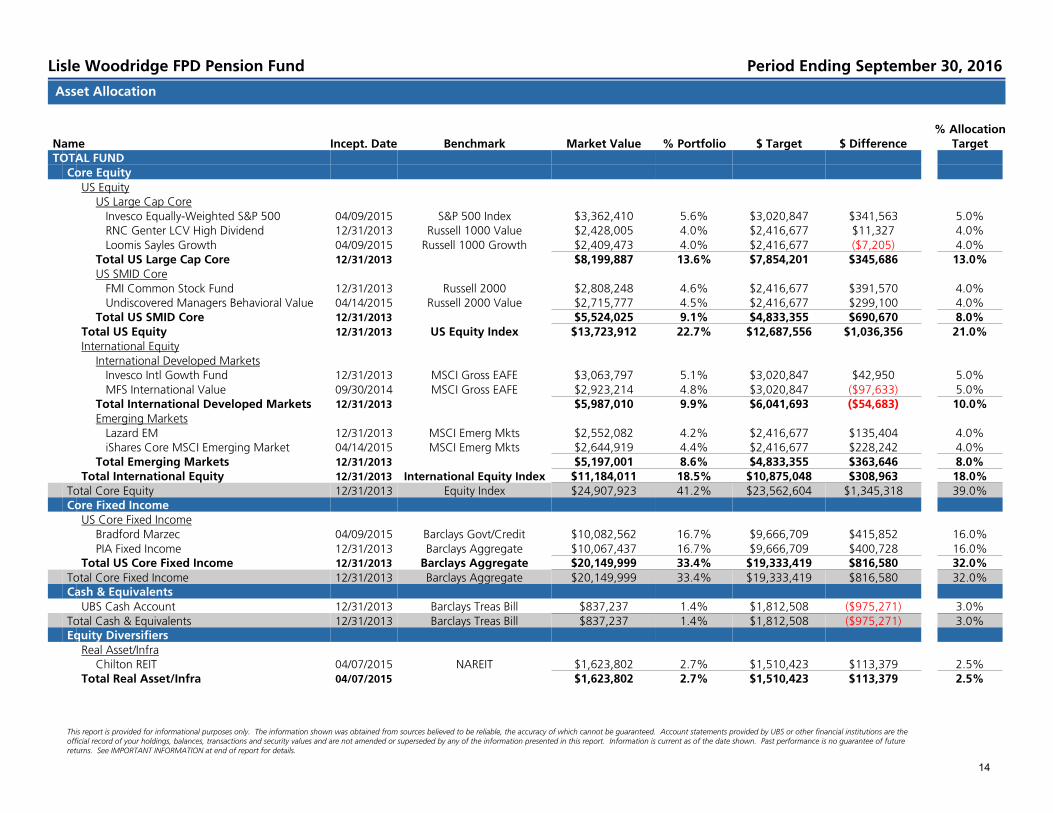
% AllocationName Incept. Date Benchmark Market Value % Portfolio $ Target $ Difference TargetTOTAL FUND
Core EquityUS Equity
US Large Cap Core Invesco Equally-Weighted S&P 500 04/09/2015 S&P 500 Index $3,362,410 5.6% $3,020,847 $341,563 5.0% RNC Genter LCV High Dividend 12/31/2013 Russell 1000 Value $2,428,005 4.0% $2,416,677 $11,327 4.0% Loomis Sayles Growth 04/09/2015 Russell 1000 Growth $2,409,473 4.0% $2,416,677 ($7,205) 4.0%Total US Large Cap Core 12/31/2013 $8,199,887 13.6% $7,854,201 $345,686 13.0%US SMID Core FMI Common Stock Fund 12/31/2013 Russell 2000 $2,808,248 4.6% $2,416,677 $391,570 4.0% Undiscovered Managers Behavioral Value 04/14/2015 Russell 2000 Value $2,715,777 4.5% $2,416,677 $299,100 4.0%Total US SMID Core 12/31/2013 $5,524,025 9.1% $4,833,355 $690,670 8.0%
Total US Equity 12/31/2013 US Equity Index $13,723,912 22.7% $12,687,556 $1,036,356 21.0%International Equity
International Developed Markets Invesco Intl Gowth Fund 12/31/2013 MSCI Gross EAFE $3,063,797 5.1% $3,020,847 $42,950 5.0% MFS International Value 09/30/2014 MSCI Gross EAFE $2,923,214 4.8% $3,020,847 ($97,633) 5.0%Total International Developed Markets 12/31/2013 $5,987,010 9.9% $6,041,693 ($54,683) 10.0%Emerging Markets Lazard EM 12/31/2013 MSCI Emerg Mkts $2,552,082 4.2% $2,416,677 $135,404 4.0% iShares Core MSCI Emerging Market 04/14/2015 MSCI Emerg Mkts $2,644,919 4.4% $2,416,677 $228,242 4.0%Total Emerging Markets 12/31/2013 $5,197,001 8.6% $4,833,355 $363,646 8.0%
Total International Equity 12/31/2013 International Equity Index $11,184,011 18.5% $10,875,048 $308,963 18.0%Total Core Equity 12/31/2013 Equity Index $24,907,923 41.2% $23,562,604 $1,345,318 39.0%Core Fixed Income
US Core Fixed IncomeBradford Marzec 04/09/2015 Barclays Govt/Credit $10,082,562 16.7% $9,666,709 $415,852 16.0%PIA Fixed Income 12/31/2013 Barclays Aggregate $10,067,437 16.7% $9,666,709 $400,728 16.0%
Total US Core Fixed Income 12/31/2013 Barclays Aggregate $20,149,999 33.4% $19,333,419 $816,580 32.0%Total Core Fixed Income 12/31/2013 Barclays Aggregate $20,149,999 33.4% $19,333,419 $816,580 32.0%Cash & Equivalents
UBS Cash Account 12/31/2013 Barclays Treas Bill $837,237 1.4% $1,812,508 ($975,271) 3.0%Total Cash & Equivalents 12/31/2013 Barclays Treas Bill $837,237 1.4% $1,812,508 ($975,271) 3.0%Equity Diversifiers
Real Asset/InfraChilton REIT 04/07/2015 NAREIT $1,623,802 2.7% $1,510,423 $113,379 2.5%
Total Real Asset/Infra 04/07/2015 $1,623,802 2.7% $1,510,423 $113,379 2.5%
Asset Allocation
Lisle Woodridge FPD Pension Fund Period Ending September 30, 2016
This report is provided for informational purposes only. The information shown was obtained from sources believed to be reliable, the accuracy of which cannot be guaranteed. Account statements provided by UBS or other financial institutions are theofficial record of your holdings, balances, transactions and security values and are not amended or superseded by any of the information presented in this report. Information is current as of the date shown. Past performance is no guarantee of futurereturns. See IMPORTANT INFORMATION at end of report for details.
14

% AllocationName Incept. Date Benchmark Market Value % Portfolio $ Target $ Difference Target
Hybrid SecuritiesStonebridge Advisors 04/10/2015 ML Pref Stk Fix Rt $1,838,892 3.0% $1,812,508 $26,384 3.0%Convertible Sec SPDR 04/10/2015 ML All Conv Ex Mand $1,646,114 2.7% $1,812,508 ($166,394) 3.0%
Total Hybrid Securities 04/10/2015 $3,485,006 5.8% $3,625,016 ($140,010) 6.0%Total Equity Diversifiers 04/07/2015 $5,108,808 8.5% $5,135,439 ($26,631) 8.5%Alternative Investments
Tactical Multi AssetWells Fargo Absolute Return 04/16/2015 HFRI Macro (Total) $3,727,942 6.2% $2,416,677 $1,311,264 4.0%
Total Tactical Multi Asset 04/16/2015 $3,727,942 6.2% $4,833,355 ($1,105,413) 8.0%Total Alternative Investments 04/16/2015 $3,727,942 6.2% $4,833,355 ($1,105,413) 8.0%FI Diversifiers
Fixed Income: Strategic BondBlackRock Strategic Income Opportunities 04/15/2015 Barclays Aggregate $2,955,595 4.9% $3,020,847 ($65,251) 5.0%Pioneer Strategic Income Opportunities 04/15/2015 Barclays Aggregate $2,729,431 4.5% $2,718,762 $10,668 4.5%
Total Fixed Income: Strategic Bond 04/15/2015 $5,685,026 9.4% $5,739,609 ($54,583) 9.5%Total FI Diversifiers 04/15/2015 $5,685,026 9.4% $5,739,609 ($54,583) 9.5%
TOTAL: 12/31/2013 Dynamic Index $60,416,934 100.0% $60,416,934 $0 100.0%
Asset Allocation
Lisle Woodridge FPD Pension Fund Period Ending September 30, 2016
This report is provided for informational purposes only. The information shown was obtained from sources believed to be reliable, the accuracy of which cannot be guaranteed. Account statements provided by UBS or other financial institutions are theofficial record of your holdings, balances, transactions and security values and are not amended or superseded by any of the information presented in this report. Information is current as of the date shown. Past performance is no guarantee of futurereturns. See IMPORTANT INFORMATION at end of report for details.
15
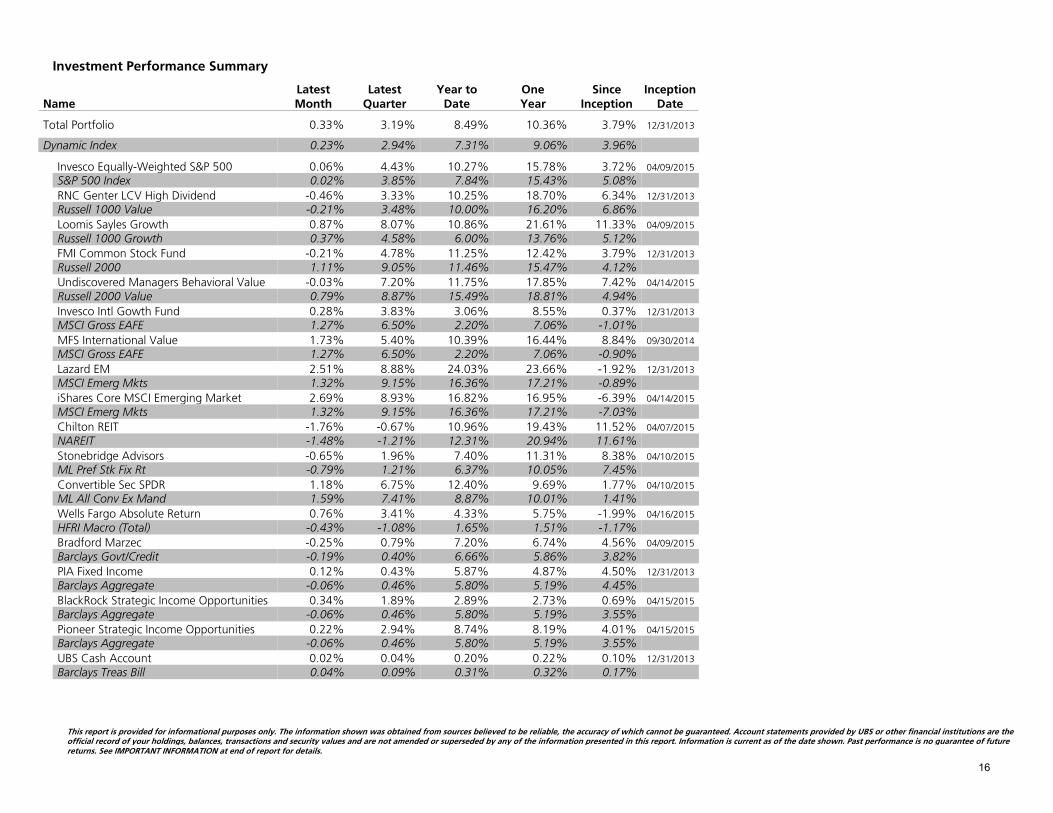
Latest Latest Year to One Since InceptionName Month Quarter Date Year Inception Date
Total Portfolio 0.33% 3.19% 8.49% 10.36% 3.79% 12/31/2013
Dynamic Index 0.23% 2.94% 7.31% 9.06% 3.96%
Invesco Equally-Weighted S&P 500 0.06% 4.43% 10.27% 15.78% 3.72% 04/09/2015
S&P 500 Index 0.02% 3.85% 7.84% 15.43% 5.08%
RNC Genter LCV High Dividend -0.46% 3.33% 10.25% 18.70% 6.34% 12/31/2013
Russell 1000 Value -0.21% 3.48% 10.00% 16.20% 6.86%
Loomis Sayles Growth 0.87% 8.07% 10.86% 21.61% 11.33% 04/09/2015
Russell 1000 Growth 0.37% 4.58% 6.00% 13.76% 5.12%
FMI Common Stock Fund -0.21% 4.78% 11.25% 12.42% 3.79% 12/31/2013
Russell 2000 1.11% 9.05% 11.46% 15.47% 4.12%
Undiscovered Managers Behavioral Value -0.03% 7.20% 11.75% 17.85% 7.42% 04/14/2015
Russell 2000 Value 0.79% 8.87% 15.49% 18.81% 4.94%
Invesco Intl Gowth Fund 0.28% 3.83% 3.06% 8.55% 0.37% 12/31/2013
MSCI Gross EAFE 1.27% 6.50% 2.20% 7.06% -1.01%
MFS International Value 1.73% 5.40% 10.39% 16.44% 8.84% 09/30/2014
MSCI Gross EAFE 1.27% 6.50% 2.20% 7.06% -0.90%
Lazard EM 2.51% 8.88% 24.03% 23.66% -1.92% 12/31/2013
MSCI Emerg Mkts 1.32% 9.15% 16.36% 17.21% -0.89%
iShares Core MSCI Emerging Market 2.69% 8.93% 16.82% 16.95% -6.39% 04/14/2015
MSCI Emerg Mkts 1.32% 9.15% 16.36% 17.21% -7.03%
Chilton REIT -1.76% -0.67% 10.96% 19.43% 11.52% 04/07/2015
NAREIT -1.48% -1.21% 12.31% 20.94% 11.61%
Stonebridge Advisors -0.65% 1.96% 7.40% 11.31% 8.38% 04/10/2015
ML Pref Stk Fix Rt -0.79% 1.21% 6.37% 10.05% 7.45%
Convertible Sec SPDR 1.18% 6.75% 12.40% 9.69% 1.77% 04/10/2015
ML All Conv Ex Mand 1.59% 7.41% 8.87% 10.01% 1.41%
Wells Fargo Absolute Return 0.76% 3.41% 4.33% 5.75% -1.99% 04/16/2015
HFRI Macro (Total) -0.43% -1.08% 1.65% 1.51% -1.17%
Bradford Marzec -0.25% 0.79% 7.20% 6.74% 4.56% 04/09/2015
Barclays Govt/Credit -0.19% 0.40% 6.66% 5.86% 3.82%
PIA Fixed Income 0.12% 0.43% 5.87% 4.87% 4.50% 12/31/2013
Barclays Aggregate -0.06% 0.46% 5.80% 5.19% 4.45%
BlackRock Strategic Income Opportunities 0.34% 1.89% 2.89% 2.73% 0.69% 04/15/2015
Barclays Aggregate -0.06% 0.46% 5.80% 5.19% 3.55%
Pioneer Strategic Income Opportunities 0.22% 2.94% 8.74% 8.19% 4.01% 04/15/2015
Barclays Aggregate -0.06% 0.46% 5.80% 5.19% 3.55%
UBS Cash Account 0.02% 0.04% 0.20% 0.22% 0.10% 12/31/2013
Barclays Treas Bill 0.04% 0.09% 0.31% 0.32% 0.17%
Investment Performance Summary
returns. See IMPORTANT INFORMATION at end of report for details.official record of your holdings, balances, transactions and security values and are not amended or superseded by any of the information presented in this report. Information is current as of the date shown. Past performance is no guarantee of futureThis report is provided for informational purposes only. The information shown was obtained from sources believed to be reliable, the accuracy of which cannot be guaranteed. Account statements provided by UBS or other financial institutions are the
16
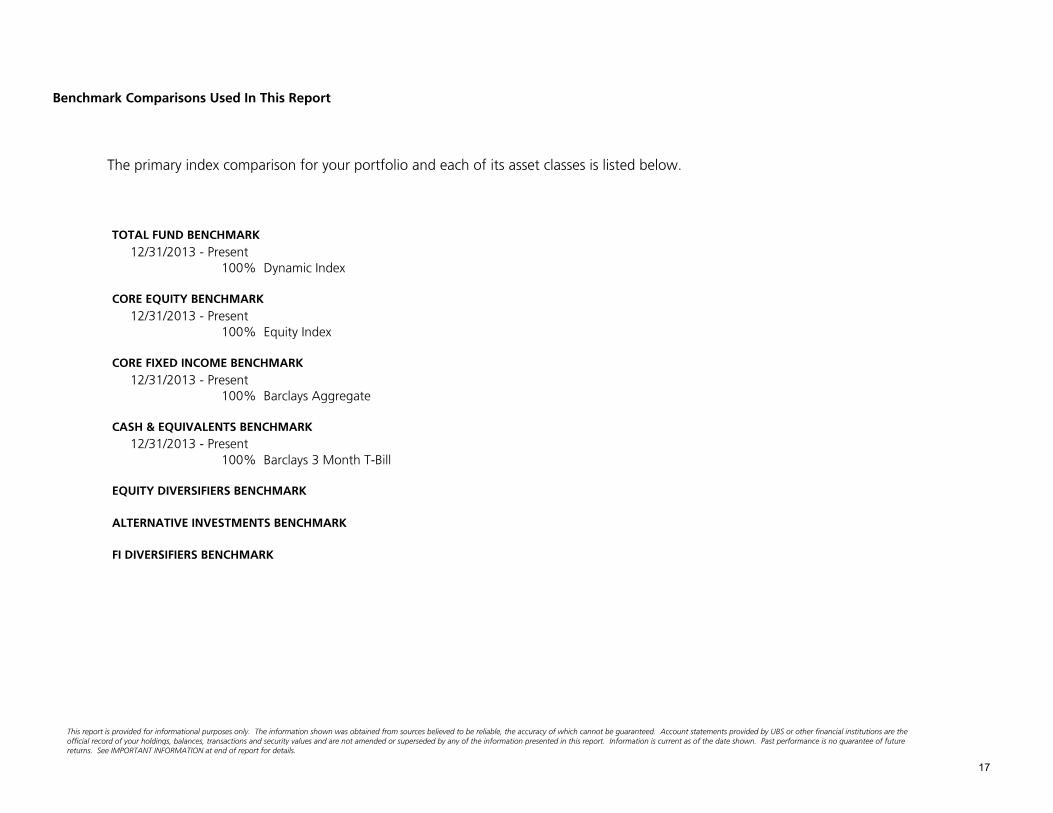
TOTAL FUND BENCHMARK
12/31/2013 - Present 100% Dynamic Index
CORE EQUITY BENCHMARK
12/31/2013 - Present 100% Equity Index
CORE FIXED INCOME BENCHMARK
12/31/2013 - Present 100% Barclays Aggregate
CASH & EQUIVALENTS BENCHMARK
12/31/2013 - Present 100% Barclays 3 Month T-Bill
EQUITY DIVERSIFIERS BENCHMARK
ALTERNATIVE INVESTMENTS BENCHMARK
FI DIVERSIFIERS BENCHMARK
The primary index comparison for your portfolio and each of its asset classes is listed below.
Benchmark Comparisons Used In This Report
returns. See IMPORTANT INFORMATION at end of report for details.official record of your holdings, balances, transactions and security values and are not amended or superseded by any of the information presented in this report. Information is current as of the date shown. Past performance is no guarantee of future
This report is provided for informational purposes only. The information shown was obtained from sources believed to be reliable, the accuracy of which cannot be guaranteed. Account statements provided by UBS or other financial institutions are the
17

Scenario Description Net Adjustment (+/-)
No differences in information were used in the creation of this performance report.
This section provides a record of differences between information reported by your custodian and information used to create this performance report, whether at yourdirection or as prescribed by your Institutional Consultant on your behalf.
Performance Reconciliation Adjustments
returns. See IMPORTANT INFORMATION at end of report for details.official record of your holdings, balances, transactions and security values and are not amended or superseded by any of the information presented in this report. Information is current as of the date shown. Past performance is no guarantee of future
This report is provided for informational purposes only. The information shown was obtained from sources believed to be reliable, the accuracy of which cannot be guaranteed. Account statements provided by UBS or other financial institutions are the
18

Prepared for:Lisle Woodridge FPD Pension FundNovember 14, 2016
Prepared by:
Investment Performance
Period Ending September 30, 2016
Invesco Equally-Weighted S&P 500
Willhite Institutional Consulting Group
This report is provided for informational purposes only. The information shown was obtained from sources believed to be reliable, the accuracy of which cannot be guaranteed. Account statements provided by UBS or other financial institutions are theofficial record of your holdings, balances, transactions and security values and are not amended or superseded by any of the information presented in this report. Information is current as of the date shown. Past performance is no guarantee of futurereturns. See IMPORTANT INFORMATION at end of report for details.
19
Standard Deviation15.0014.0013.0012.0011.0010.009.008.007.006.005.004.003.002.001.000.00-1.00
Rate of Return (%)
17.00
16.00
15.00
14.00
13.00
12.00
11.00
10.00
9.00
8.00
7.00
6.00
5.00
4.00
3.00
2.00
1.00
0.00
-1.00
-2.00
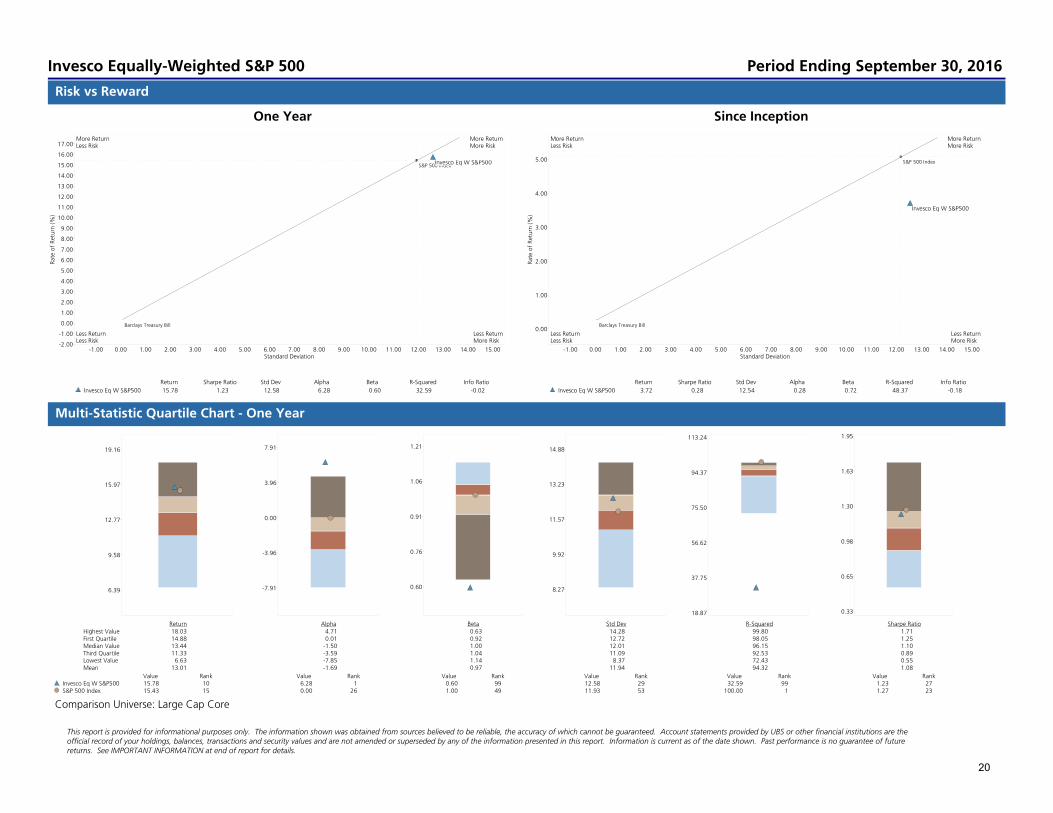
Return Sharpe Ratio Std Dev Alpha Beta R-Squared Info Ratio
Invesco Eq W S&P500 15.78 1.23 12.58 6.28 0.60 32.59 -0.02
S&P 500 Index
Barclays Treasury Bill
Invesco Eq W S&P500
More ReturnLess Risk
More ReturnMore Risk
Less ReturnLess Risk
Less ReturnMore Risk
Standard Deviation15.0014.0013.0012.0011.0010.009.008.007.006.005.004.003.002.001.000.00-1.00
Rate of Return (%)
5.00
4.00
3.00
2.00
1.00
0.00
Return Sharpe Ratio Std Dev Alpha Beta R-Squared Info Ratio
Invesco Eq W S&P500 3.72 0.28 12.54 0.28 0.72 48.37 -0.18
S&P 500 Index
Barclays Treasury Bill
Invesco Eq W S&P500
More ReturnLess Risk
More ReturnMore Risk
Less ReturnLess Risk
Less ReturnMore Risk
19.16
15.97
12.77
9.58
6.39
Return Highest Value 18.03 First Quartile 14.88 Median Value 13.44 Third Quartile 11.33 Lowest Value 6.63 Mean 13.01
Value Rank Invesco Eq W S&P500 15.78 10 S&P 500 Index 15.43 15
7.91
3.96
0.00
-3.96
-7.91
Alpha 4.71 0.01 -1.50 -3.59 -7.85 -1.69
Value Rank 6.28 1 0.00 26
1.21
1.06
0.91
0.76
0.60
Beta 0.63 0.92 1.00 1.04 1.14 0.97
Value Rank 0.60 99 1.00 49
14.88
13.23
11.57
9.92
8.27
Std Dev 14.28 12.72 12.01 11.09 8.37 11.94
Value Rank 12.58 29 11.93 53
113.24
94.37
75.50
56.62
37.75
18.87
R-Squared 99.80 98.05 96.15 92.53 72.43 94.32
Value Rank 32.59 99 100.00 1
1.95
1.63
1.30
0.98
0.65
0.33
Sharpe Ratio 1.71 1.25 1.10 0.89 0.55 1.08
Value Rank 1.23 27 1.27 23
Risk vs Reward
Multi-Statistic Quartile Chart - One Year
One Year Since Inception
Comparison Universe: Large Cap Core
Invesco Equally-Weighted S&P 500 Period Ending September 30, 2016
This report is provided for informational purposes only. The information shown was obtained from sources believed to be reliable, the accuracy of which cannot be guaranteed. Account statements provided by UBS or other financial institutions are theofficial record of your holdings, balances, transactions and security values and are not amended or superseded by any of the information presented in this report. Information is current as of the date shown. Past performance is no guarantee of futurereturns. See IMPORTANT INFORMATION at end of report for details.
20

Downside Capture Ratio (%)13012512011511010510095908580757065605550454035302520151050
Upside Cap
ture Ratio (%
)
130
120
110
100
90
80
70
60
50
40
30
20
10
0
1 2 3 4
6/2016-9/2016 12/2015-9/2016 9/2015-9/2016 4/2015-9/2016
Up Periods 3.00 7.00 9.00 11.00
Upside Capture ROR 4.43 15.60 24.26 26.36
S&P 500 Index 3.85 13.62 23.57 27.78
% Of Capture 114.91 114.53 102.94 94.89
Down Periods 0.00 2.00 3.00 6.00
Downside Capture ROR N/A -4.61 -6.83 -16.66
S&P 500 Index N/A -5.09 -6.59 -16.05
% Of Capture N/A 90.58 103.69 103.79
Outperforms InPos. & Neg. Periods
Underperforms In Neg. PeriodsOutperforms In Pos. Periods
Underperforms In Pos. PeriodsOutperforms In Neg. Periods
Underperforms InPos. & Neg. Periods
2
3
4
Capture Ratio Trend
Three Years Rolling Alpha
Lisle Woodridge FPD Pension Fund Period Ending September 30, 2016
This report is provided for informational purposes only. The information shown was obtained from sources believed to be reliable, the accuracy of which cannot be guaranteed. Account statements provided by UBS or other financial institutions are theofficial record of your holdings, balances, transactions and security values and are not amended or superseded by any of the information presented in this report. Information is current as of the date shown. Past performance is no guarantee of futurereturns. See IMPORTANT INFORMATION at end of report for details.
21
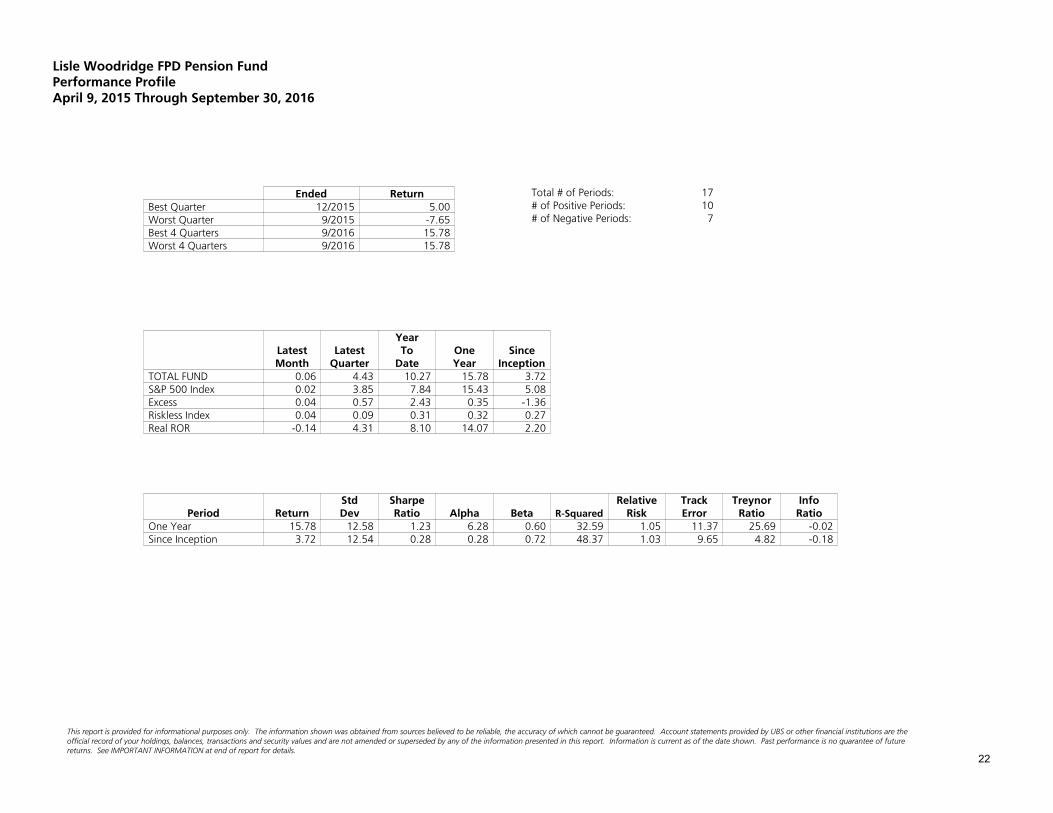
Ended ReturnBest Quarter 12/2015 5.00Worst Quarter 9/2015 -7.65Best 4 Quarters 9/2016 15.78Worst 4 Quarters 9/2016 15.78
Total # of Periods: 17# of Positive Periods: 10# of Negative Periods: 7
YearLatest Latest To One SinceMonth Quarter Date Year Inception
TOTAL FUND 0.06 4.43 10.27 15.78 3.72S&P 500 Index 0.02 3.85 7.84 15.43 5.08Excess 0.04 0.57 2.43 0.35 -1.36Riskless Index 0.04 0.09 0.31 0.32 0.27Real ROR -0.14 4.31 8.10 14.07 2.20
Std Sharpe Relative Track Treynor InfoPeriod Return Dev Ratio Alpha Beta R-Squared Risk Error Ratio Ratio
One Year 15.78 12.58 1.23 6.28 0.60 32.59 1.05 11.37 25.69 -0.02Since Inception 3.72 12.54 0.28 0.28 0.72 48.37 1.03 9.65 4.82 -0.18
Lisle Woodridge FPD Pension FundPerformance ProfileApril 9, 2015 Through September 30, 2016
returns. See IMPORTANT INFORMATION at end of report for details.official record of your holdings, balances, transactions and security values and are not amended or superseded by any of the information presented in this report. Information is current as of the date shown. Past performance is no guarantee of future
This report is provided for informational purposes only. The information shown was obtained from sources believed to be reliable, the accuracy of which cannot be guaranteed. Account statements provided by UBS or other financial institutions are the
22
Please contact your UBS Institutional Consultant if you have any questions regarding this report, if your financial situation, individualneeds or investment objectives have changed, or if you would like to initiate or modify any investment restrictions on this account.Please note that you are also required to inform your Institutional Consultant, directly, of any changes in your financial condition,investment objectives or investment restrictions on your account.
Prepared for:Lisle Woodridge FPD Pension FundNovember 14, 2016
Prepared by:
Investment Performance
Period Ending September 30, 2016
RNC Genter LCV High Dividend
Willhite Institutional Consulting Group
This report is provided for informational purposes only. The information shown was obtained from sources believed to be reliable, the accuracy of which cannot be guaranteed. Account statements provided by UBS or other financial institutions are theofficial record of your holdings, balances, transactions and security values and are not amended or superseded by any of the information presented in this report. Information is current as of the date shown. Past performance is no guarantee of futurereturns. See IMPORTANT INFORMATION at end of report for details.
23
Standard Deviation14.0013.0012.0011.0010.009.008.007.006.005.004.003.002.001.000.00-1.00
Rate of Return (%)
21.00
20.00
19.00
18.00
17.00
16.00
15.00
14.00
13.00
12.00
11.00
10.00
9.00
8.00
7.00
6.00
5.00
4.00
3.00
2.00
1.00
0.00
-1.00
-2.00
Return Sharpe Ratio Std Dev Alpha Beta R-Squared Info Ratio
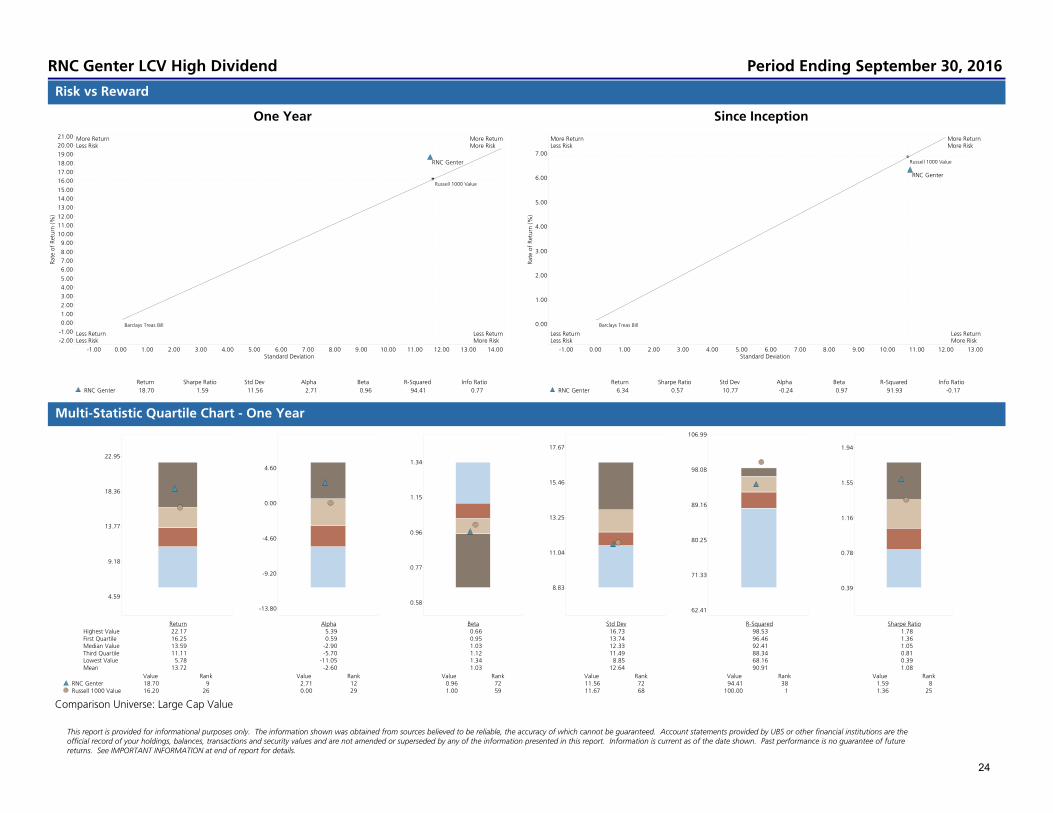
RNC Genter 18.70 1.59 11.56 2.71 0.96 94.41 0.77
Russell 1000 Value
Barclays Treas Bill
RNC Genter
More ReturnLess Risk
More ReturnMore Risk
Less ReturnLess Risk
Less ReturnMore Risk
Standard Deviation13.0012.0011.0010.009.008.007.006.005.004.003.002.001.000.00-1.00
Rate of Return (%)
7.00
6.00
5.00
4.00
3.00
2.00
1.00
0.00
Return Sharpe Ratio Std Dev Alpha Beta R-Squared Info Ratio
RNC Genter 6.34 0.57 10.77 -0.24 0.97 91.93 -0.17
Russell 1000 Value
Barclays Treas Bill
RNC Genter
More ReturnLess Risk
More ReturnMore Risk
Less ReturnLess Risk
Less ReturnMore Risk
22.95
18.36
13.77
9.18
4.59
Return Highest Value 22.17 First Quartile 16.25 Median Value 13.59 Third Quartile 11.11 Lowest Value 5.78 Mean 13.72
Value Rank RNC Genter 18.70 9 Russell 1000 Value 16.20 26
4.60
0.00
-4.60
-9.20
-13.80
Alpha 5.39 0.59 -2.90 -5.70 -11.05 -2.60
Value Rank 2.71 12 0.00 29
1.34
1.15
0.96
0.77
0.58
Beta 0.66 0.95 1.03 1.12 1.34 1.03
Value Rank 0.96 72 1.00 59
17.67
15.46
13.25
11.04
8.83
Std Dev 16.73 13.74 12.33 11.49 8.85 12.64
Value Rank 11.56 72 11.67 68
106.99
98.08
89.16
80.25
71.33
62.41
R-Squared 98.53 96.46 92.41 88.34 68.16 90.91
Value Rank 94.41 38 100.00 1
1.94
1.55
1.16
0.78
0.39
Sharpe Ratio 1.78 1.36 1.05 0.81 0.39 1.08
Value Rank 1.59 8 1.36 25
Risk vs Reward
Multi-Statistic Quartile Chart - One Year
One Year Since Inception
Comparison Universe: Large Cap Value
RNC Genter LCV High Dividend Period Ending September 30, 2016
This report is provided for informational purposes only. The information shown was obtained from sources believed to be reliable, the accuracy of which cannot be guaranteed. Account statements provided by UBS or other financial institutions are theofficial record of your holdings, balances, transactions and security values and are not amended or superseded by any of the information presented in this report. Information is current as of the date shown. Past performance is no guarantee of futurereturns. See IMPORTANT INFORMATION at end of report for details.
24

Downside Capture Ratio (%)2302202102001901801701601501401301201101009080706050403020100
Upside Cap
ture Ratio (%
)
130
120
110
100
90
80
70
60
50
40
30
20
10
0
1 2 3 4
6/2016-9/2016 12/2015-9/2016 9/2015-9/2016 12/2013-9/2016
Up Periods 2.00 6.00 8.00 21.00
Upside Capture ROR 3.81 15.40 26.47 31.09
Russell 1000 Value 3.70 16.26 25.51 33.11
% Of Capture 103.09 94.67 103.74 93.90
Down Periods 1.00 3.00 4.00 12.00
Downside Capture ROR -0.46 -4.46 -6.14 -26.27
Russell 1000 Value -0.21 -5.39 -7.42 -27.24
% Of Capture 222.93 82.75 82.69 96.44
Outperforms InPos. & Neg. Periods
Underperforms In Neg. PeriodsOutperforms In Pos. Periods
Underperforms In Pos. PeriodsOutperforms In Neg. Periods
Underperforms InPos. & Neg. Periods
1
2
3
4
Capture Ratio Trend
Three Years Rolling Alpha
Lisle Woodridge FPD Pension Fund Period Ending September 30, 2016
This report is provided for informational purposes only. The information shown was obtained from sources believed to be reliable, the accuracy of which cannot be guaranteed. Account statements provided by UBS or other financial institutions are theofficial record of your holdings, balances, transactions and security values and are not amended or superseded by any of the information presented in this report. Information is current as of the date shown. Past performance is no guarantee of futurereturns. See IMPORTANT INFORMATION at end of report for details.
25

Ended ReturnBest Quarter 12/2015 7.67Worst Quarter 9/2015 -6.17Best 4 Quarters 9/2016 18.70Worst 4 Quarters 9/2015 -4.41
Total # of Periods: 33# of Positive Periods: 20# of Negative Periods: 13
YearLatest Latest To One Two SinceMonth Quarter Date Year Years Inception
TOTAL FUND -0.46 3.33 10.25 18.70 6.52 6.34Russell 1000 Value -0.21 3.48 10.00 16.20 5.38 6.86Excess -0.26 -0.15 0.25 2.51 1.14 -0.52Riskless Index 0.04 0.09 0.31 0.32 0.21 0.17Real ROR -0.66 3.22 8.09 16.97 5.80 5.01
Std Sharpe Relative Track Treynor InfoPeriod Return Dev Ratio Alpha Beta R-Squared Risk Error Ratio Ratio
One Year 18.70 11.56 1.59 2.71 0.96 94.41 0.99 2.77 19.09 0.77Two Years 6.52 11.09 0.57 1.31 0.96 93.91 0.99 2.78 6.61 0.37Since Inception 6.34 10.77 0.57 -0.24 0.97 91.93 1.01 3.08 6.39 -0.17
Lisle Woodridge FPD Pension FundPerformance ProfileDecember 31, 2013 Through September 30, 2016
returns. See IMPORTANT INFORMATION at end of report for details.official record of your holdings, balances, transactions and security values and are not amended or superseded by any of the information presented in this report. Information is current as of the date shown. Past performance is no guarantee of future
This report is provided for informational purposes only. The information shown was obtained from sources believed to be reliable, the accuracy of which cannot be guaranteed. Account statements provided by UBS or other financial institutions are the
26

Prepared for:Lisle Woodridge FPD Pension FundNovember 14, 2016
Prepared by:
Investment Performance
Period Ending September 30, 2016
Loomis Sayles Growth
Willhite Institutional Consulting Group
This report is provided for informational purposes only. The information shown was obtained from sources believed to be reliable, the accuracy of which cannot be guaranteed. Account statements provided by UBS or other financial institutions are theofficial record of your holdings, balances, transactions and security values and are not amended or superseded by any of the information presented in this report. Information is current as of the date shown. Past performance is no guarantee of futurereturns. See IMPORTANT INFORMATION at end of report for details.
27
Standard Deviation17.0016.0015.0014.0013.0012.0011.0010.009.008.007.006.005.004.003.002.001.000.00-1.00-2.00
Rate of Return (%)
24.00
23.00
22.00
21.00
20.00
19.00
18.00
17.00
16.00
15.00
14.00
13.0012.00
11.00
10.00
9.00
8.00
7.00
6.00
5.00
4.00
3.00
2.00
1.00
0.00
-1.00
-2.00
Return Sharpe Ratio Std Dev Alpha Beta R-Squared Info Ratio
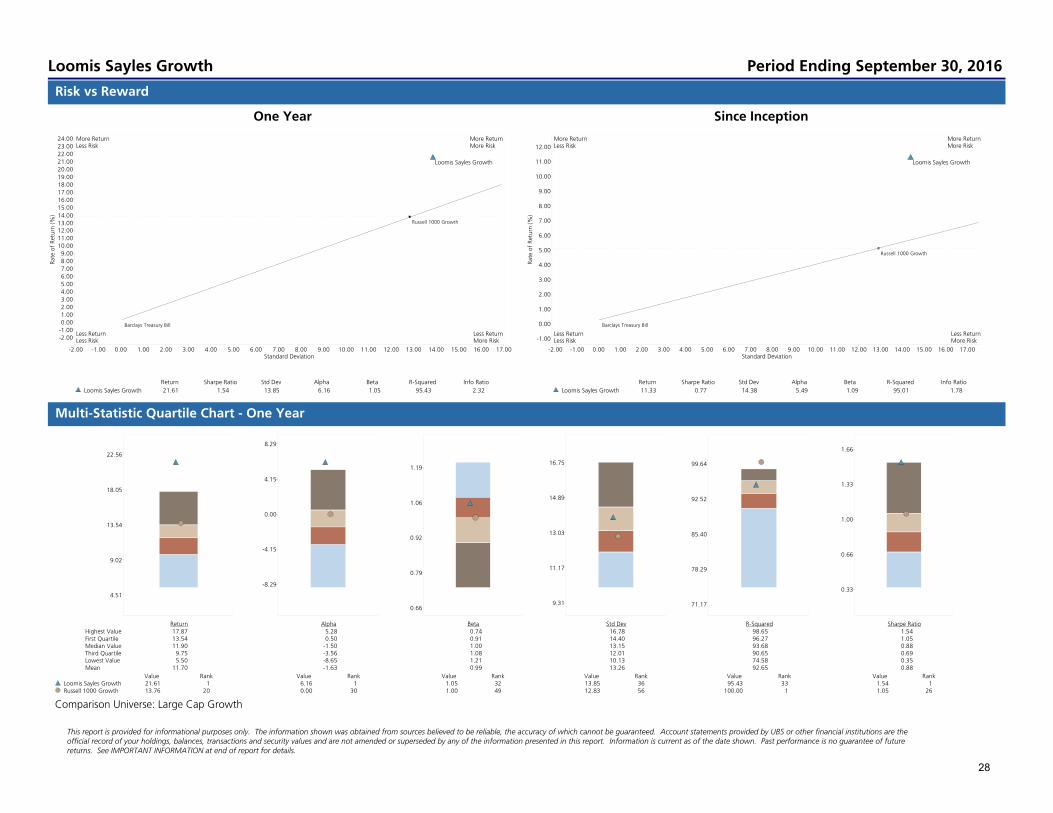
Loomis Sayles Growth 21.61 1.54 13.85 6.16 1.05 95.43 2.32
Russell 1000 Growth
Barclays Treasury Bill
Loomis Sayles Growth
More ReturnLess Risk
More ReturnMore Risk
Less ReturnLess Risk
Less ReturnMore Risk
Standard Deviation17.0016.0015.0014.0013.0012.0011.0010.009.008.007.006.005.004.003.002.001.000.00-1.00-2.00
Rate of Return (%)
12.00
11.00
10.00
9.00
8.00
7.00
6.00
5.00
4.00
3.00
2.00
1.00
0.00
-1.00
Return Sharpe Ratio Std Dev Alpha Beta R-Squared Info Ratio
Loomis Sayles Growth 11.33 0.77 14.38 5.49 1.09 95.01 1.78
Russell 1000 Growth
Barclays Treasury Bill
Loomis Sayles Growth
More ReturnLess Risk
More ReturnMore Risk
Less ReturnLess Risk
Less ReturnMore Risk
22.56
18.05
13.54
9.02
4.51
Return Highest Value 17.87 First Quartile 13.54 Median Value 11.90 Third Quartile 9.75 Lowest Value 5.50 Mean 11.70
Value Rank Loomis Sayles Growth 21.61 1 Russell 1000 Growth 13.76 20
8.29
4.15
0.00
-4.15
-8.29
Alpha 5.28 0.50 -1.50 -3.56 -8.65 -1.63
Value Rank 6.16 1 0.00 30
1.19
1.06
0.92
0.79
0.66
Beta 0.74 0.91 1.00 1.08 1.21 0.99
Value Rank 1.05 32 1.00 49
16.75
14.89
13.03
11.17
9.31
Std Dev 16.78 14.40 13.15 12.01 10.13 13.26
Value Rank 13.85 36 12.83 56
99.64
92.52
85.40
78.29
71.17
R-Squared 98.65 96.27 93.68 90.65 74.58 92.65
Value Rank 95.43 33 100.00 1
1.66
1.33
1.00
0.66
0.33
Sharpe Ratio 1.54 1.05 0.88 0.69 0.35 0.88
Value Rank 1.54 1 1.05 26
Risk vs Reward
Multi-Statistic Quartile Chart - One Year
One Year Since Inception
Comparison Universe: Large Cap Growth
Loomis Sayles Growth Period Ending September 30, 2016
This report is provided for informational purposes only. The information shown was obtained from sources believed to be reliable, the accuracy of which cannot be guaranteed. Account statements provided by UBS or other financial institutions are theofficial record of your holdings, balances, transactions and security values and are not amended or superseded by any of the information presented in this report. Information is current as of the date shown. Past performance is no guarantee of futurereturns. See IMPORTANT INFORMATION at end of report for details.
28

Downside Capture Ratio (%)100500-50-100-150-200-250
Upside Cap
ture Ratio (%
)
150
140
130
120
110
100
90
80
70
60
50
40
30
20
10
0
1 2 3 4
6/2016-9/2016 12/2015-9/2016 9/2015-9/2016 4/2015-9/2016
Up Periods 2.00 4.00 6.00 8.00
Upside Capture ROR 6.95 17.37 30.41 38.89
Russell 1000 Growth 5.10 14.37 24.57 30.60
% Of Capture 136.23 120.89 123.78 127.07
Down Periods 1.00 5.00 6.00 9.00
Downside Capture ROR 1.04 -5.55 -6.74 -16.18
Russell 1000 Growth -0.50 -7.31 -8.68 -17.82
% Of Capture -209.52 75.90 77.75 90.81
Outperforms InPos. & Neg. Periods
Underperforms In Neg. PeriodsOutperforms In Pos. Periods
Underperforms In Pos. PeriodsOutperforms In Neg. Periods
Underperforms InPos. & Neg. Periods
1
23
4
Capture Ratio Trend
Three Years Rolling Alpha
Lisle Woodridge FPD Pension Fund Period Ending September 30, 2016
This report is provided for informational purposes only. The information shown was obtained from sources believed to be reliable, the accuracy of which cannot be guaranteed. Account statements provided by UBS or other financial institutions are theofficial record of your holdings, balances, transactions and security values and are not amended or superseded by any of the information presented in this report. Information is current as of the date shown. Past performance is no guarantee of futurereturns. See IMPORTANT INFORMATION at end of report for details.
29

Ended ReturnBest Quarter 12/2015 9.70Worst Quarter 9/2015 -2.50Best 4 Quarters 9/2016 21.61Worst 4 Quarters 9/2016 21.61
Total # of Periods: 17# of Positive Periods: 10# of Negative Periods: 7
YearLatest Latest To One SinceMonth Quarter Date Year Inception
TOTAL FUND 0.87 8.07 10.86 21.61 11.33Russell 1000 Growth 0.37 4.58 6.00 13.76 5.12Excess 0.51 3.48 4.85 7.85 6.20Riskless Index 0.04 0.09 0.31 0.32 0.27Real ROR 0.67 7.95 8.68 19.82 9.70
Std Sharpe Relative Track Treynor InfoPeriod Return Dev Ratio Alpha Beta R-Squared Risk Error Ratio Ratio
One Year 21.61 13.85 1.54 6.16 1.05 95.43 1.08 3.05 20.19 2.32Since Inception 11.33 14.38 0.77 5.49 1.09 95.01 1.11 3.40 10.18 1.78
Lisle Woodridge FPD Pension FundPerformance ProfileApril 9, 2015 Through September 30, 2016
returns. See IMPORTANT INFORMATION at end of report for details.official record of your holdings, balances, transactions and security values and are not amended or superseded by any of the information presented in this report. Information is current as of the date shown. Past performance is no guarantee of future
This report is provided for informational purposes only. The information shown was obtained from sources believed to be reliable, the accuracy of which cannot be guaranteed. Account statements provided by UBS or other financial institutions are the
30

Please contact your UBS Institutional Consultant if you have any questions regarding this report, if your financial situation, individualneeds or investment objectives have changed, or if you would like to initiate or modify any investment restrictions on this account.Please note that you are also required to inform your Institutional Consultant, directly, of any changes in your financial condition,investment objectives or investment restrictions on your account.
Prepared for:Lisle Woodridge FPD Pension FundNovember 14, 2016
Prepared by:
Investment Performance
Period Ending September 30, 2016
FMI Common Stock Fund
Willhite Institutional Consulting Group
This report is provided for informational purposes only. The information shown was obtained from sources believed to be reliable, the accuracy of which cannot be guaranteed. Account statements provided by UBS or other financial institutions are theofficial record of your holdings, balances, transactions and security values and are not amended or superseded by any of the information presented in this report. Information is current as of the date shown. Past performance is no guarantee of futurereturns. See IMPORTANT INFORMATION at end of report for details.
31
Standard Deviation20.0018.0016.0014.0012.0010.008.006.004.002.000.00-2.00-4.00
Rate of Return (%)
17.00
16.00
15.00
14.00
13.00
12.00
11.00
10.00
9.00
8.00
7.00
6.00
5.00
4.00
3.00
2.00
1.00
0.00
-1.00
Return Sharpe Ratio Std Dev Alpha Beta R-Squared Info Ratio
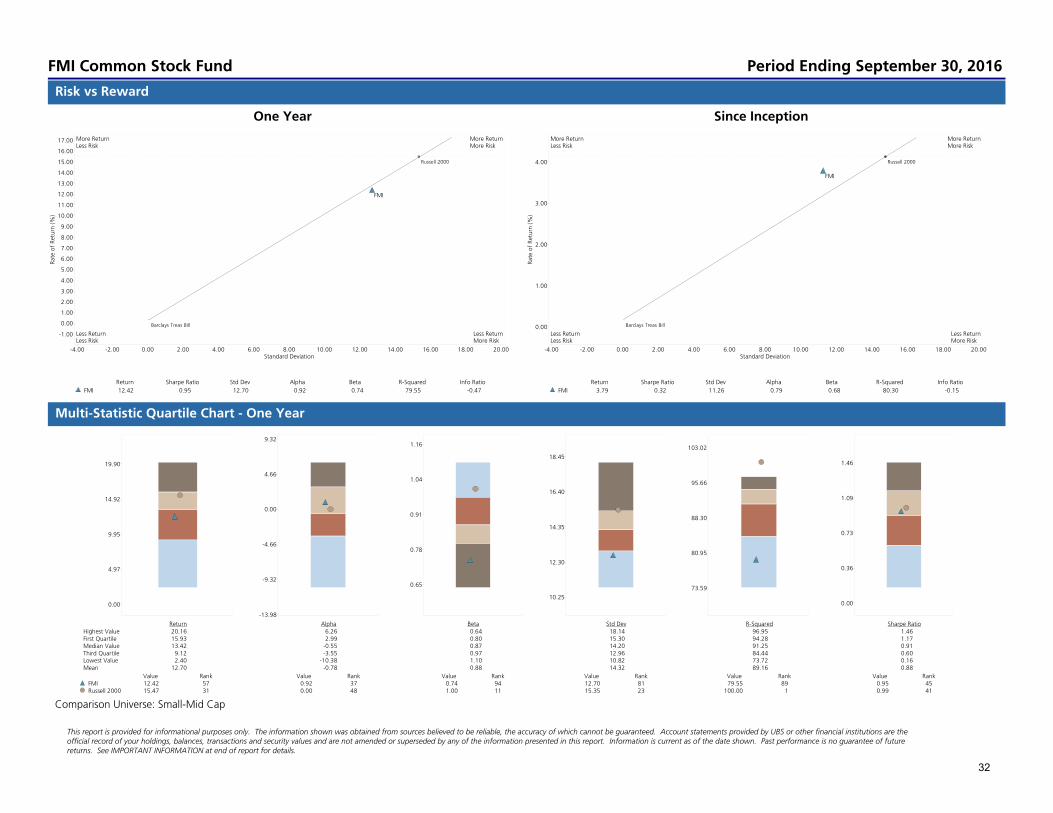
FMI 12.42 0.95 12.70 0.92 0.74 79.55 -0.47
Russell 2000
Barclays Treas Bill
FMI
More ReturnLess Risk
More ReturnMore Risk
Less ReturnLess Risk
Less ReturnMore Risk
Standard Deviation20.0018.0016.0014.0012.0010.008.006.004.002.000.00-2.00-4.00
Rate of Return (%)
4.00
3.00
2.00
1.00
0.00
Return Sharpe Ratio Std Dev Alpha Beta R-Squared Info Ratio
FMI 3.79 0.32 11.26 0.79 0.68 80.30 -0.15
Russell 2000
Barclays Treas Bill
FMI
More ReturnLess Risk
More ReturnMore Risk
Less ReturnLess Risk
Less ReturnMore Risk
19.90
14.92
9.95
4.97
0.00
Return Highest Value 20.16 First Quartile 15.93 Median Value 13.42 Third Quartile 9.12 Lowest Value 2.40 Mean 12.70
Value Rank FMI 12.42 57 Russell 2000 15.47 31
9.32
4.66
0.00
-4.66
-9.32
-13.98
Alpha 6.26 2.99 -0.55 -3.55 -10.38 -0.78
Value Rank 0.92 37 0.00 48
1.16
1.04
0.91
0.78
0.65
Beta 0.64 0.80 0.87 0.97 1.10 0.88
Value Rank 0.74 94 1.00 11
18.45
16.40
14.35
12.30
10.25
Std Dev 18.14 15.30 14.20 12.96 10.82 14.32
Value Rank 12.70 81 15.35 23
103.02
95.66
88.30
80.95
73.59
R-Squared 96.95 94.28 91.25 84.44 73.72 89.16
Value Rank 79.55 89 100.00 1
1.46
1.09
0.73
0.36
0.00
Sharpe Ratio 1.46 1.17 0.91 0.60 0.16 0.88
Value Rank 0.95 45 0.99 41
Risk vs Reward
Multi-Statistic Quartile Chart - One Year
One Year Since Inception
Comparison Universe: Small-Mid Cap
FMI Common Stock Fund Period Ending September 30, 2016
This report is provided for informational purposes only. The information shown was obtained from sources believed to be reliable, the accuracy of which cannot be guaranteed. Account statements provided by UBS or other financial institutions are theofficial record of your holdings, balances, transactions and security values and are not amended or superseded by any of the information presented in this report. Information is current as of the date shown. Past performance is no guarantee of futurereturns. See IMPORTANT INFORMATION at end of report for details.
32
Downside Capture Ratio (%)13012512011511010510095908580757065605550454035302520151050
Upside Cap
ture Ratio (%
)
130
120
110
100
90
80
70
60
50
40
30
20
10
0
1 2 3 4
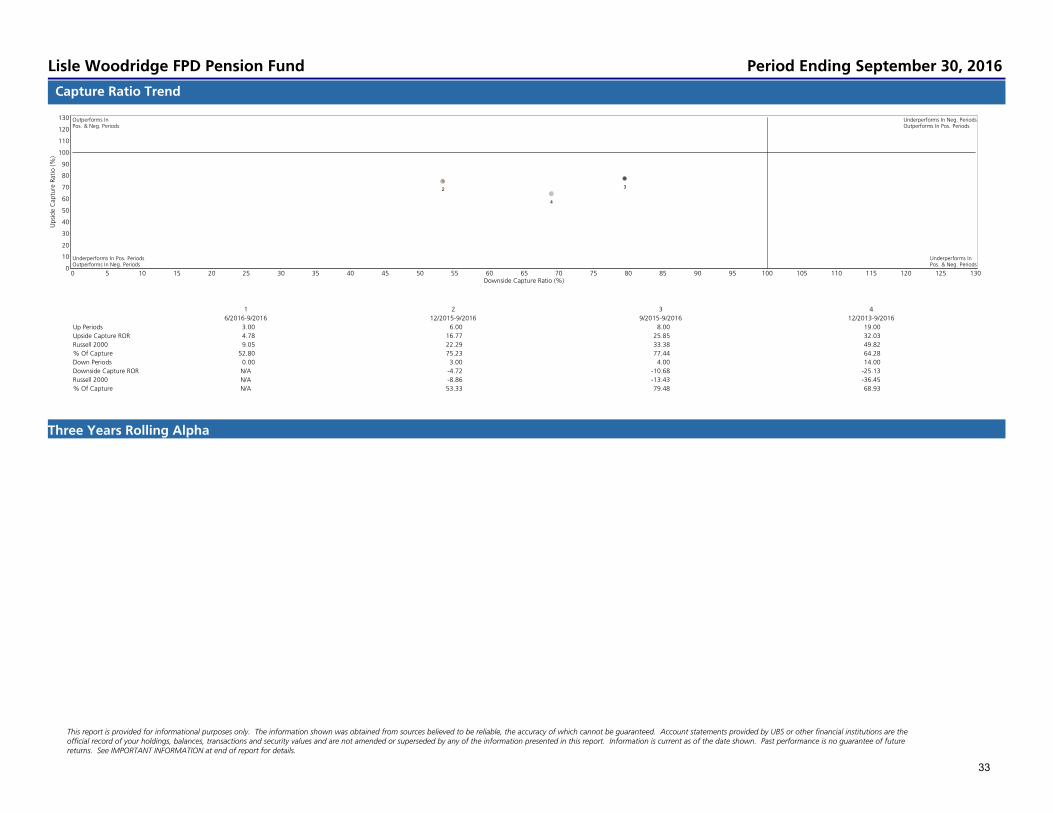
6/2016-9/2016 12/2015-9/2016 9/2015-9/2016 12/2013-9/2016
Up Periods 3.00 6.00 8.00 19.00
Upside Capture ROR 4.78 16.77 25.85 32.03
Russell 2000 9.05 22.29 33.38 49.82
% Of Capture 52.80 75.23 77.44 64.28
Down Periods 0.00 3.00 4.00 14.00
Downside Capture ROR N/A -4.72 -10.68 -25.13
Russell 2000 N/A -8.86 -13.43 -36.45
% Of Capture N/A 53.33 79.48 68.93
Outperforms InPos. & Neg. Periods
Underperforms In Neg. PeriodsOutperforms In Pos. Periods
Underperforms In Pos. PeriodsOutperforms In Neg. Periods
Underperforms InPos. & Neg. Periods
23
4
Capture Ratio Trend
Three Years Rolling Alpha
Lisle Woodridge FPD Pension Fund Period Ending September 30, 2016
This report is provided for informational purposes only. The information shown was obtained from sources believed to be reliable, the accuracy of which cannot be guaranteed. Account statements provided by UBS or other financial institutions are theofficial record of your holdings, balances, transactions and security values and are not amended or superseded by any of the information presented in this report. Information is current as of the date shown. Past performance is no guarantee of futurereturns. See IMPORTANT INFORMATION at end of report for details.
33
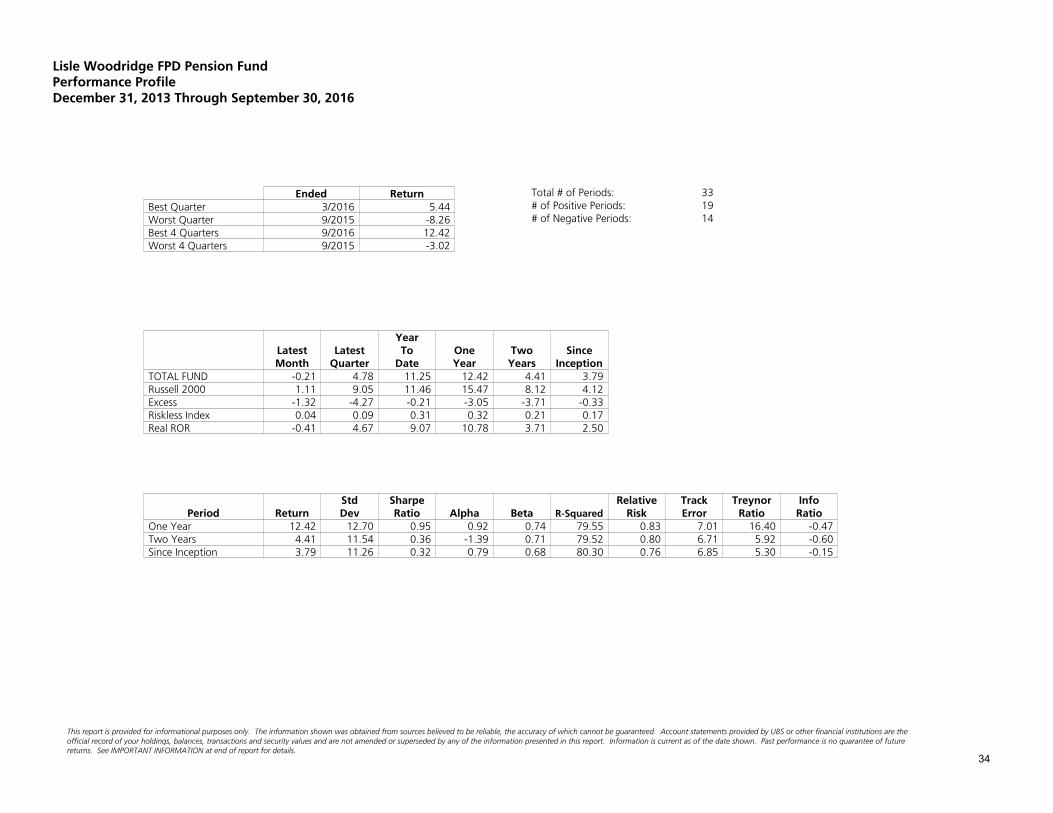
Ended ReturnBest Quarter 3/2016 5.44Worst Quarter 9/2015 -8.26Best 4 Quarters 9/2016 12.42Worst 4 Quarters 9/2015 -3.02
Total # of Periods: 33# of Positive Periods: 19# of Negative Periods: 14
YearLatest Latest To One Two SinceMonth Quarter Date Year Years Inception
TOTAL FUND -0.21 4.78 11.25 12.42 4.41 3.79Russell 2000 1.11 9.05 11.46 15.47 8.12 4.12Excess -1.32 -4.27 -0.21 -3.05 -3.71 -0.33Riskless Index 0.04 0.09 0.31 0.32 0.21 0.17Real ROR -0.41 4.67 9.07 10.78 3.71 2.50
Std Sharpe Relative Track Treynor InfoPeriod Return Dev Ratio Alpha Beta R-Squared Risk Error Ratio Ratio
One Year 12.42 12.70 0.95 0.92 0.74 79.55 0.83 7.01 16.40 -0.47Two Years 4.41 11.54 0.36 -1.39 0.71 79.52 0.80 6.71 5.92 -0.60Since Inception 3.79 11.26 0.32 0.79 0.68 80.30 0.76 6.85 5.30 -0.15
Lisle Woodridge FPD Pension FundPerformance ProfileDecember 31, 2013 Through September 30, 2016
returns. See IMPORTANT INFORMATION at end of report for details.official record of your holdings, balances, transactions and security values and are not amended or superseded by any of the information presented in this report. Information is current as of the date shown. Past performance is no guarantee of future
This report is provided for informational purposes only. The information shown was obtained from sources believed to be reliable, the accuracy of which cannot be guaranteed. Account statements provided by UBS or other financial institutions are the
34

Prepared for:Lisle Woodridge FPD Pension FundNovember 14, 2016
Prepared by:
Investment Performance
Period Ending September 30, 2016
Undiscovered Managers Behavioral Value
Willhite Institutional Consulting Group
This report is provided for informational purposes only. The information shown was obtained from sources believed to be reliable, the accuracy of which cannot be guaranteed. Account statements provided by UBS or other financial institutions are theofficial record of your holdings, balances, transactions and security values and are not amended or superseded by any of the information presented in this report. Information is current as of the date shown. Past performance is no guarantee of futurereturns. See IMPORTANT INFORMATION at end of report for details.
35

Standard Deviation17.0016.0015.0014.0013.0012.0011.0010.009.008.007.006.005.004.003.002.001.000.00-1.00-2.00
Rate of Return (%)
21.00
20.00
19.00
18.00
17.00
16.00
15.00
14.00
13.00
12.00
11.00
10.00
9.00
8.00
7.00
6.00
5.00
4.00
3.00
2.00
1.00
0.00
-1.00
-2.00
Return Sharpe Ratio Std Dev Alpha Beta R-Squared Info Ratio
Undisc Mgrs Sm Cap 17.85 1.23 14.28 -0.21 0.97 90.24 -0.20
Russell 2000 Value
Barclays Treasury Bill
Undisc Mgrs Sm Cap
More ReturnLess Risk
More ReturnMore Risk
Less ReturnLess Risk
Less ReturnMore Risk
Standard Deviation16.0015.0014.0013.0012.0011.0010.009.008.007.006.005.004.003.002.001.000.00-1.00-2.00
Rate of Return (%)
8.00
7.00
6.00
5.00
4.00
3.00
2.00
1.00
0.00
Return Sharpe Ratio Std Dev Alpha Beta R-Squared Info Ratio
Undisc Mgrs Sm Cap 7.42 0.54 13.21 2.76 0.91 88.97 0.48
Russell 2000 Value
Barclays Treasury Bill
Undisc Mgrs Sm Cap
More ReturnLess Risk
More ReturnMore Risk
Less ReturnLess Risk
Less ReturnMore Risk
26.98
21.58
16.19
10.79
5.40
Return Highest Value 26.11 First Quartile 18.82 Median Value 15.74 Third Quartile 13.23 Lowest Value 6.84 Mean 15.80
Value Rank Undisc Mgrs Sm Cap 17.85 32 Russell 2000 Value 18.81 25
10.62
5.31
0.00
-5.31
-10.62
-15.92
Alpha 6.66 0.57 -2.06 -5.10 -12.30 -2.28
Value Rank -0.21 32 0.00 28
1.38
1.18
0.98
0.79
0.59
Beta 0.70 0.91 0.98 1.07 1.40 0.99
Value Rank 0.97 52 1.00 42
21.66
18.57
15.47
12.38
9.28
Std Dev 22.27 15.47 14.23 13.27 11.22 14.60
Value Rank 14.28 47 14.05 55
98.65
90.43
82.21
73.99
65.77
R-Squared 98.26 95.61 92.67 87.51 70.64 90.87
Value Rank 90.24 65 100.00 1
1.91
1.52
1.14
0.76
0.38
Sharpe Ratio 1.77 1.29 1.07 0.90 0.41 1.07
Value Rank 1.23 33 1.32 23
Risk vs Reward
Multi-Statistic Quartile Chart - One Year
One Year Since Inception
Comparison Universe: Small Cap Value
Undiscovered Managers Behavioral Value Period Ending September 30, 2016
This report is provided for informational purposes only. The information shown was obtained from sources believed to be reliable, the accuracy of which cannot be guaranteed. Account statements provided by UBS or other financial institutions are theofficial record of your holdings, balances, transactions and security values and are not amended or superseded by any of the information presented in this report. Information is current as of the date shown. Past performance is no guarantee of futurereturns. See IMPORTANT INFORMATION at end of report for details.
36

Downside Capture Ratio (%)13012512011511010510095908580757065605550454035302520151050
Upside Cap
ture Ratio (%
)
130
120
110
100
90
80
70
60
50
40
30
20
10
0
1 2 3 4
6/2016-9/2016 12/2015-9/2016 9/2015-9/2016 4/2015-9/2016
Up Periods 3.00 8.00 10.00 12.00
Upside Capture ROR 7.20 17.93 30.73 32.17
Russell 2000 Value 8.87 23.80 34.45 35.74
% Of Capture 81.26 75.33 89.20 90.00
Down Periods 0.00 1.00 2.00 5.00
Downside Capture ROR N/A -5.24 -9.86 -16.27
Russell 2000 Value N/A -6.72 -11.64 -21.12
% Of Capture N/A 77.99 84.70 77.03
Outperforms InPos. & Neg. Periods
Underperforms In Neg. PeriodsOutperforms In Pos. Periods
Underperforms In Pos. PeriodsOutperforms In Neg. Periods
Underperforms InPos. & Neg. Periods
2
34
Capture Ratio Trend
Three Years Rolling Alpha
Lisle Woodridge FPD Pension Fund Period Ending September 30, 2016
This report is provided for informational purposes only. The information shown was obtained from sources believed to be reliable, the accuracy of which cannot be guaranteed. Account statements provided by UBS or other financial institutions are theofficial record of your holdings, balances, transactions and security values and are not amended or superseded by any of the information presented in this report. Information is current as of the date shown. Past performance is no guarantee of futurereturns. See IMPORTANT INFORMATION at end of report for details.
37
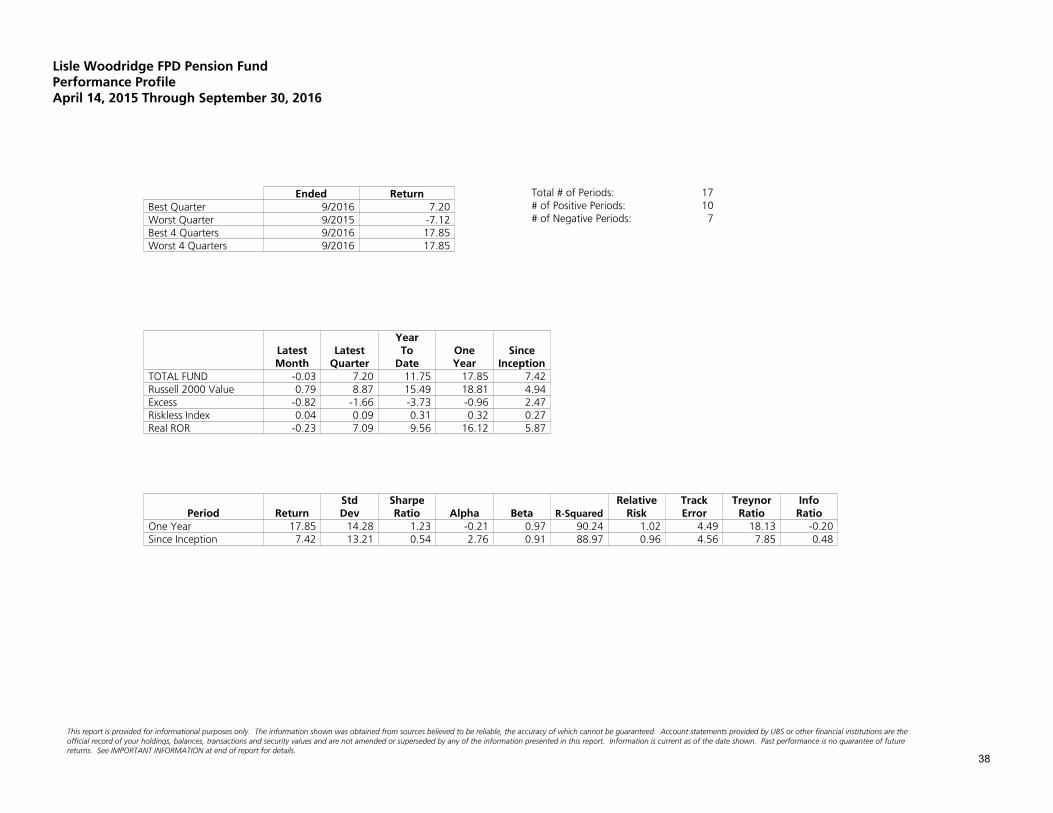
Ended ReturnBest Quarter 9/2016 7.20Worst Quarter 9/2015 -7.12Best 4 Quarters 9/2016 17.85Worst 4 Quarters 9/2016 17.85
Total # of Periods: 17# of Positive Periods: 10# of Negative Periods: 7
YearLatest Latest To One SinceMonth Quarter Date Year Inception
TOTAL FUND -0.03 7.20 11.75 17.85 7.42Russell 2000 Value 0.79 8.87 15.49 18.81 4.94Excess -0.82 -1.66 -3.73 -0.96 2.47Riskless Index 0.04 0.09 0.31 0.32 0.27Real ROR -0.23 7.09 9.56 16.12 5.87
Std Sharpe Relative Track Treynor InfoPeriod Return Dev Ratio Alpha Beta R-Squared Risk Error Ratio Ratio
One Year 17.85 14.28 1.23 -0.21 0.97 90.24 1.02 4.49 18.13 -0.20Since Inception 7.42 13.21 0.54 2.76 0.91 88.97 0.96 4.56 7.85 0.48
Lisle Woodridge FPD Pension FundPerformance ProfileApril 14, 2015 Through September 30, 2016
returns. See IMPORTANT INFORMATION at end of report for details.official record of your holdings, balances, transactions and security values and are not amended or superseded by any of the information presented in this report. Information is current as of the date shown. Past performance is no guarantee of future
This report is provided for informational purposes only. The information shown was obtained from sources believed to be reliable, the accuracy of which cannot be guaranteed. Account statements provided by UBS or other financial institutions are the
38
Please contact your UBS Institutional Consultant if you have any questions regarding this report, if your financial situation, individualneeds or investment objectives have changed, or if you would like to initiate or modify any investment restrictions on this account.Please note that you are also required to inform your Institutional Consultant, directly, of any changes in your financial condition,investment objectives or investment restrictions on your account.
Prepared for:Lisle Woodridge FPD Pension FundNovember 14, 2016
Prepared by:
Investment Performance
Period Ending September 30, 2016
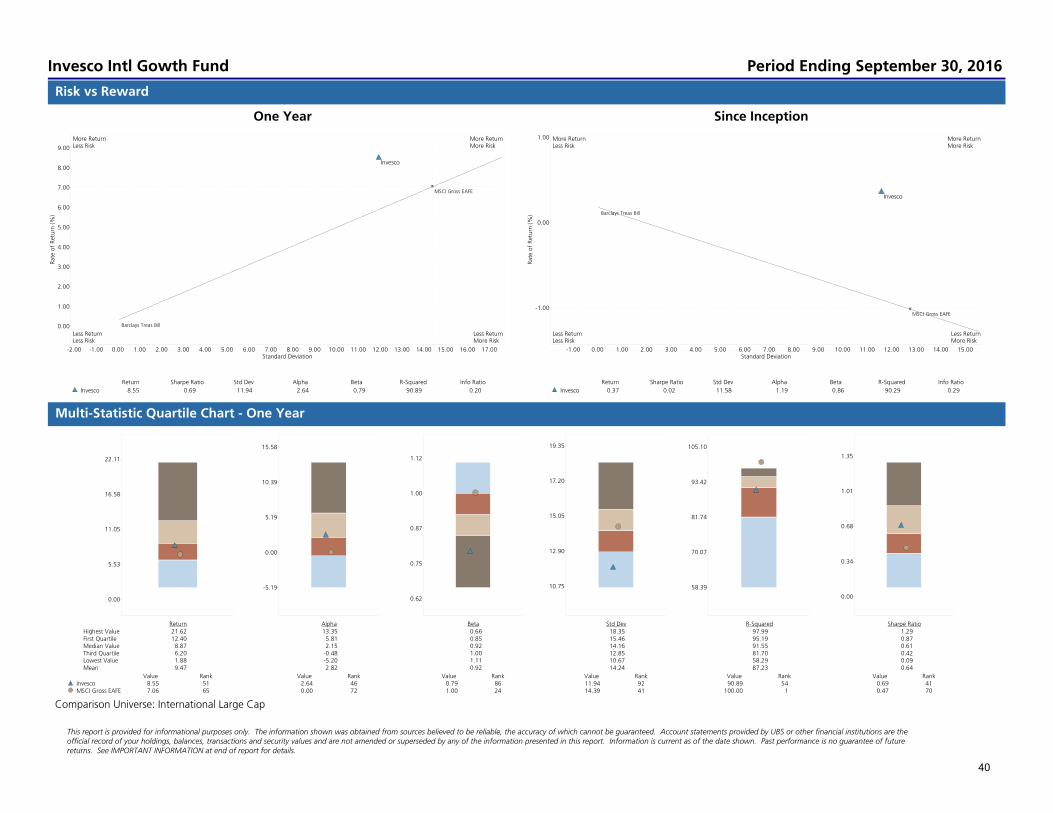
Invesco Intl Gowth Fund
Willhite Institutional Consulting Group
This report is provided for informational purposes only. The information shown was obtained from sources believed to be reliable, the accuracy of which cannot be guaranteed. Account statements provided by UBS or other financial institutions are theofficial record of your holdings, balances, transactions and security values and are not amended or superseded by any of the information presented in this report. Information is current as of the date shown. Past performance is no guarantee of futurereturns. See IMPORTANT INFORMATION at end of report for details.
39
Standard Deviation17.0016.0015.0014.0013.0012.0011.0010.009.008.007.006.005.004.003.002.001.000.00-1.00-2.00
Rate of Return (%)
9.00
8.00
7.00
6.00
5.00
4.00
3.00
2.00
1.00
0.00
Return Sharpe Ratio Std Dev Alpha Beta R-Squared Info Ratio
Invesco 8.55 0.69 11.94 2.64 0.79 90.89 0.20
MSCI Gross EAFE
Barclays Treas Bill
Invesco
More ReturnLess Risk
More ReturnMore Risk
Less ReturnLess Risk
Less ReturnMore Risk
Standard Deviation15.0014.0013.0012.0011.0010.009.008.007.006.005.004.003.002.001.000.00-1.00
Rate of Return (%)
1.00
0.00
-1.00
Return Sharpe Ratio Std Dev Alpha Beta R-Squared Info Ratio
Invesco 0.37 0.02 11.58 1.19 0.86 90.29 0.29
MSCI Gross EAFE
Barclays Treas Bill
Invesco
More ReturnLess Risk
More ReturnMore Risk
Less ReturnLess Risk
Less ReturnMore Risk
22.11
16.58
11.05
5.53
0.00
Return Highest Value 21.62 First Quartile 12.40 Median Value 8.87 Third Quartile 6.20 Lowest Value 1.88 Mean 9.47
Value Rank Invesco 8.55 51 MSCI Gross EAFE 7.06 65
15.58
10.39
5.19
0.00
-5.19
Alpha 13.35 5.81 2.15 -0.48 -5.20 2.82
Value Rank 2.64 46 0.00 72
1.12
1.00
0.87
0.75
0.62
Beta 0.66 0.85 0.92 1.00 1.11 0.92
Value Rank 0.79 86 1.00 24
19.35
17.20
15.05
12.90
10.75
Std Dev 18.35 15.46 14.16 12.85 10.67 14.24
Value Rank 11.94 92 14.39 41
105.10
93.42
81.74
70.07
58.39
R-Squared 97.99 95.19 91.55 81.70 58.29 87.23
Value Rank 90.89 54 100.00 1
1.35
1.01
0.68
0.34
0.00
Sharpe Ratio 1.29 0.87 0.61 0.42 0.09 0.64
Value Rank 0.69 41 0.47 70
Risk vs Reward
Multi-Statistic Quartile Chart - One Year
One Year Since Inception
Comparison Universe: International Large Cap
Invesco Intl Gowth Fund Period Ending September 30, 2016
This report is provided for informational purposes only. The information shown was obtained from sources believed to be reliable, the accuracy of which cannot be guaranteed. Account statements provided by UBS or other financial institutions are theofficial record of your holdings, balances, transactions and security values and are not amended or superseded by any of the information presented in this report. Information is current as of the date shown. Past performance is no guarantee of futurereturns. See IMPORTANT INFORMATION at end of report for details.
40

Downside Capture Ratio (%)13012512011511010510095908580757065605550454035302520151050
Upside Cap
ture Ratio (%
)
130
120
110
100
90
80
70
60
50
40
30
20
10
0
1 2 3 4
6/2016-9/2016 12/2015-9/2016 9/2015-9/2016 12/2013-9/2016
Up Periods 3.00 5.00 6.00 15.00
Upside Capture ROR 3.83 11.99 19.88 36.41
MSCI Gross EAFE 6.50 16.94 26.09 45.27
% Of Capture 58.88 70.79 76.20 80.44
Down Periods 0.00 4.00 6.00 18.00
Downside Capture ROR N/A -7.97 -9.45 -22.27
MSCI Gross EAFE N/A -12.60 -15.09 -28.10
% Of Capture N/A 63.27 62.63 79.27
Outperforms InPos. & Neg. Periods
Underperforms In Neg. PeriodsOutperforms In Pos. Periods
Underperforms In Pos. PeriodsOutperforms In Neg. Periods
Underperforms InPos. & Neg. Periods
2
3
4
Capture Ratio Trend
Three Years Rolling Alpha
Lisle Woodridge FPD Pension Fund Period Ending September 30, 2016
This report is provided for informational purposes only. The information shown was obtained from sources believed to be reliable, the accuracy of which cannot be guaranteed. Account statements provided by UBS or other financial institutions are theofficial record of your holdings, balances, transactions and security values and are not amended or superseded by any of the information presented in this report. Information is current as of the date shown. Past performance is no guarantee of futurereturns. See IMPORTANT INFORMATION at end of report for details.
41

Ended ReturnBest Quarter 6/2014 5.57Worst Quarter 9/2015 -9.97Best 4 Quarters 9/2016 8.55Worst 4 Quarters 9/2015 -7.63
Total # of Periods: 33# of Positive Periods: 17# of Negative Periods: 16
YearLatest Latest To One Two SinceMonth Quarter Date Year Years Inception
TOTAL FUND 0.28 3.83 3.06 8.55 0.13 0.37MSCI Gross EAFE 1.27 6.50 2.20 7.06 -0.90 -1.01Excess -0.99 -2.67 0.86 1.49 1.03 1.39Riskless Index 0.04 0.09 0.31 0.32 0.21 0.17Real ROR 0.08 3.72 1.02 6.93 -0.56 -0.89
Std Sharpe Relative Track Treynor InfoPeriod Return Dev Ratio Alpha Beta R-Squared Risk Error Ratio Ratio
One Year 8.55 11.94 0.69 2.64 0.79 90.89 0.83 4.70 10.40 0.20Two Years 0.13 11.62 -0.01 0.74 0.81 90.81 0.85 4.39 -0.10 0.15Since Inception 0.37 11.58 0.02 1.19 0.86 90.29 0.91 4.01 0.23 0.29
Lisle Woodridge FPD Pension FundPerformance ProfileDecember 31, 2013 Through September 30, 2016
returns. See IMPORTANT INFORMATION at end of report for details.official record of your holdings, balances, transactions and security values and are not amended or superseded by any of the information presented in this report. Information is current as of the date shown. Past performance is no guarantee of future
This report is provided for informational purposes only. The information shown was obtained from sources believed to be reliable, the accuracy of which cannot be guaranteed. Account statements provided by UBS or other financial institutions are the
42

Please contact your UBS Institutional Consultant if you have any questions regarding this report, if your financial situation, individualneeds or investment objectives have changed, or if you would like to initiate or modify any investment restrictions on this account.Please note that you are also required to inform your Institutional Consultant, directly, of any changes in your financial condition,investment objectives or investment restrictions on your account.
Prepared for:Lisle Woodridge FPD Pension FundNovember 14, 2016
Prepared by:
Investment Performance
Period Ending September 30, 2016
MFS International Value
Willhite Institutional Consulting Group
This report is provided for informational purposes only. The information shown was obtained from sources believed to be reliable, the accuracy of which cannot be guaranteed. Account statements provided by UBS or other financial institutions are theofficial record of your holdings, balances, transactions and security values and are not amended or superseded by any of the information presented in this report. Information is current as of the date shown. Past performance is no guarantee of futurereturns. See IMPORTANT INFORMATION at end of report for details.
43
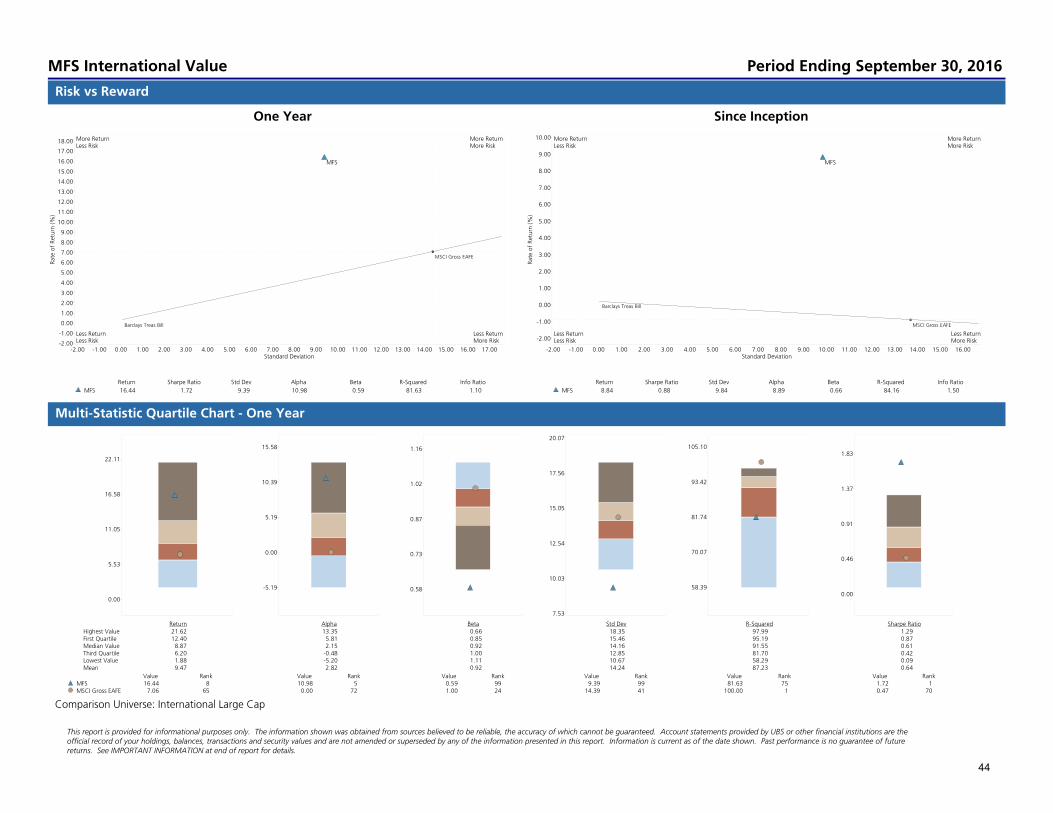
Standard Deviation17.0016.0015.0014.0013.0012.0011.0010.009.008.007.006.005.004.003.002.001.000.00-1.00-2.00
Rate of Return (%)
18.00
17.00
16.00
15.00
14.00
13.00
12.00
11.00
10.00
9.00
8.00
7.00
6.00
5.00
4.00
3.00
2.00
1.00
0.00
-1.00
-2.00
Return Sharpe Ratio Std Dev Alpha Beta R-Squared Info Ratio
MFS 16.44 1.72 9.39 10.98 0.59 81.63 1.10
MSCI Gross EAFE
Barclays Treas Bill
MFS
More ReturnLess Risk
More ReturnMore Risk
Less ReturnLess Risk
Less ReturnMore Risk
Standard Deviation16.0015.0014.0013.0012.0011.0010.009.008.007.006.005.004.003.002.001.000.00-1.00-2.00
Rate of Return (%)
10.00
9.00
8.00
7.00
6.00
5.00
4.00
3.00
2.00
1.00
0.00
-1.00
-2.00
Return Sharpe Ratio Std Dev Alpha Beta R-Squared Info Ratio
MFS 8.84 0.88 9.84 8.89 0.66 84.16 1.50
MSCI Gross EAFE
Barclays Treas Bill
MFS
More ReturnLess Risk
More ReturnMore Risk
Less ReturnLess Risk
Less ReturnMore Risk
22.11
16.58
11.05
5.53
0.00
Return Highest Value 21.62 First Quartile 12.40 Median Value 8.87 Third Quartile 6.20 Lowest Value 1.88 Mean 9.47
Value Rank MFS 16.44 8 MSCI Gross EAFE 7.06 65
15.58
10.39
5.19
0.00
-5.19
Alpha 13.35 5.81 2.15 -0.48 -5.20 2.82
Value Rank 10.98 5 0.00 72
1.16
1.02
0.87
0.73
0.58
Beta 0.66 0.85 0.92 1.00 1.11 0.92
Value Rank 0.59 99 1.00 24
20.07
17.56
15.05
12.54
10.03
7.53
Std Dev 18.35 15.46 14.16 12.85 10.67 14.24
Value Rank 9.39 99 14.39 41
105.10
93.42
81.74
70.07
58.39
R-Squared 97.99 95.19 91.55 81.70 58.29 87.23
Value Rank 81.63 75 100.00 1
1.83
1.37
0.91
0.46
0.00
Sharpe Ratio 1.29 0.87 0.61 0.42 0.09 0.64
Value Rank 1.72 1 0.47 70
Risk vs Reward
Multi-Statistic Quartile Chart - One Year
One Year Since Inception
Comparison Universe: International Large Cap
MFS International Value Period Ending September 30, 2016
This report is provided for informational purposes only. The information shown was obtained from sources believed to be reliable, the accuracy of which cannot be guaranteed. Account statements provided by UBS or other financial institutions are theofficial record of your holdings, balances, transactions and security values and are not amended or superseded by any of the information presented in this report. Information is current as of the date shown. Past performance is no guarantee of futurereturns. See IMPORTANT INFORMATION at end of report for details.
44

Downside Capture Ratio (%)13012512011511010510095908580757065605550454035302520151050
Upside Cap
ture Ratio (%
)
130
120
110
100
90
80
70
60
50
40
30
20
10
0
1 2 3 4
6/2016-9/2016 12/2015-9/2016 9/2015-9/2016 9/2014-9/2016
Up Periods 3.00 5.00 6.00 11.00
Upside Capture ROR 5.40 12.67 19.46 38.01
MSCI Gross EAFE 6.50 16.94 26.09 44.76
% Of Capture 82.96 74.78 74.60 84.92
Down Periods 0.00 4.00 6.00 13.00
Downside Capture ROR N/A -2.02 -2.53 -13.15
MSCI Gross EAFE N/A -12.60 -15.09 -30.11
% Of Capture N/A 16.03 16.76 43.69
Outperforms InPos. & Neg. Periods
Underperforms In Neg. PeriodsOutperforms In Pos. Periods
Underperforms In Pos. PeriodsOutperforms In Neg. Periods
Underperforms InPos. & Neg. Periods
2 3
4
Capture Ratio Trend
Three Years Rolling Alpha
Lisle Woodridge FPD Pension Fund Period Ending September 30, 2016
This report is provided for informational purposes only. The information shown was obtained from sources believed to be reliable, the accuracy of which cannot be guaranteed. Account statements provided by UBS or other financial institutions are theofficial record of your holdings, balances, transactions and security values and are not amended or superseded by any of the information presented in this report. Information is current as of the date shown. Past performance is no guarantee of futurereturns. See IMPORTANT INFORMATION at end of report for details.
45
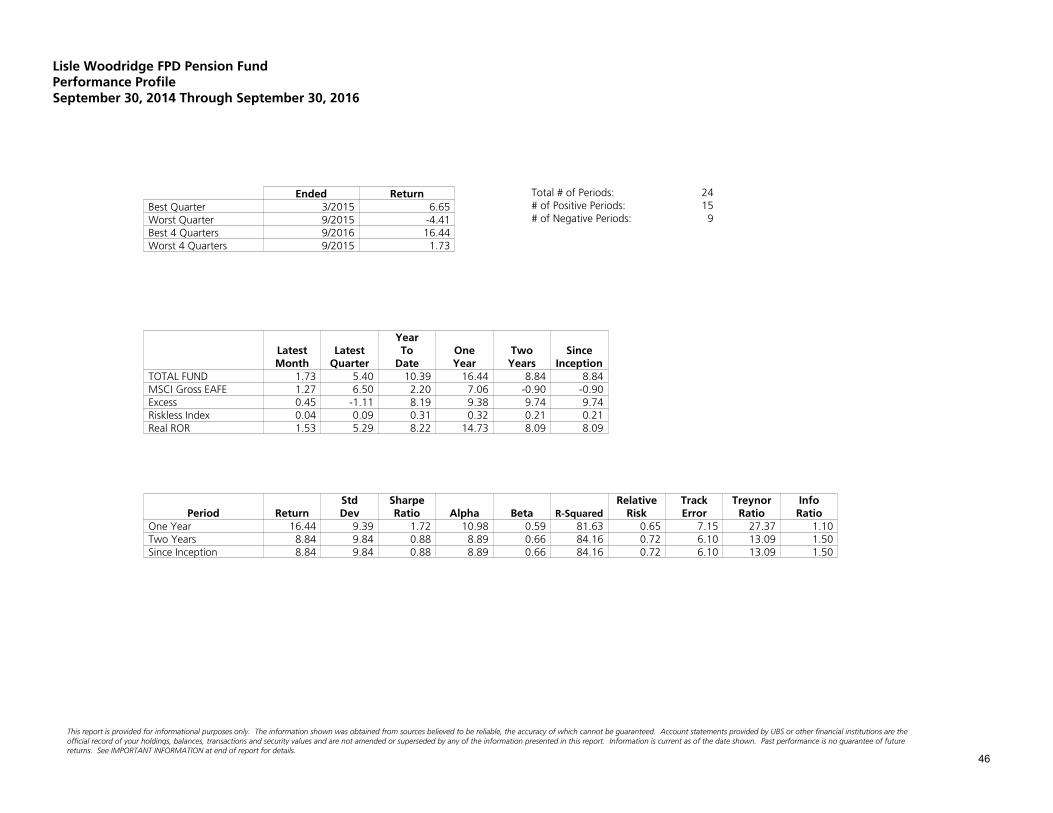
Ended ReturnBest Quarter 3/2015 6.65Worst Quarter 9/2015 -4.41Best 4 Quarters 9/2016 16.44Worst 4 Quarters 9/2015 1.73
Total # of Periods: 24# of Positive Periods: 15# of Negative Periods: 9
YearLatest Latest To One Two SinceMonth Quarter Date Year Years Inception
TOTAL FUND 1.73 5.40 10.39 16.44 8.84 8.84MSCI Gross EAFE 1.27 6.50 2.20 7.06 -0.90 -0.90Excess 0.45 -1.11 8.19 9.38 9.74 9.74Riskless Index 0.04 0.09 0.31 0.32 0.21 0.21Real ROR 1.53 5.29 8.22 14.73 8.09 8.09
Std Sharpe Relative Track Treynor InfoPeriod Return Dev Ratio Alpha Beta R-Squared Risk Error Ratio Ratio
One Year 16.44 9.39 1.72 10.98 0.59 81.63 0.65 7.15 27.37 1.10Two Years 8.84 9.84 0.88 8.89 0.66 84.16 0.72 6.10 13.09 1.50Since Inception 8.84 9.84 0.88 8.89 0.66 84.16 0.72 6.10 13.09 1.50
Lisle Woodridge FPD Pension FundPerformance ProfileSeptember 30, 2014 Through September 30, 2016
returns. See IMPORTANT INFORMATION at end of report for details.official record of your holdings, balances, transactions and security values and are not amended or superseded by any of the information presented in this report. Information is current as of the date shown. Past performance is no guarantee of future
This report is provided for informational purposes only. The information shown was obtained from sources believed to be reliable, the accuracy of which cannot be guaranteed. Account statements provided by UBS or other financial institutions are the
46
Please contact your UBS Institutional Consultant if you have any questions regarding this report, if your financial situation, individualneeds or investment objectives have changed, or if you would like to initiate or modify any investment restrictions on this account.Please note that you are also required to inform your Institutional Consultant, directly, of any changes in your financial condition,investment objectives or investment restrictions on your account.
Prepared for:Lisle Woodridge FPD Pension FundNovember 14, 2016
Prepared by:
Investment Performance
Period Ending September 30, 2016
Lazard EM
Willhite Institutional Consulting Group
This report is provided for informational purposes only. The information shown was obtained from sources believed to be reliable, the accuracy of which cannot be guaranteed. Account statements provided by UBS or other financial institutions are theofficial record of your holdings, balances, transactions and security values and are not amended or superseded by any of the information presented in this report. Information is current as of the date shown. Past performance is no guarantee of futurereturns. See IMPORTANT INFORMATION at end of report for details.
47
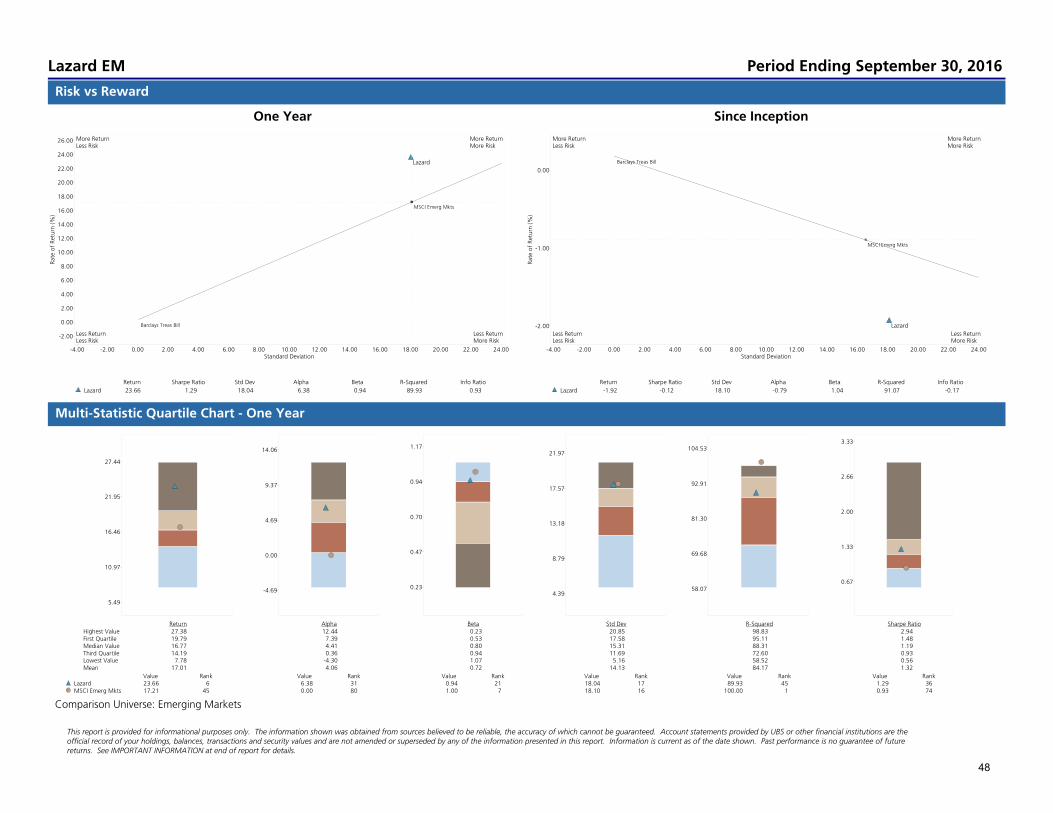
Standard Deviation24.0022.0020.0018.0016.0014.0012.0010.008.006.004.002.000.00-2.00-4.00
Rate of Return (%)
26.00
24.00
22.00
20.00
18.00
16.00
14.00
12.00
10.00
8.00
6.00
4.00
2.00
0.00
-2.00
Return Sharpe Ratio Std Dev Alpha Beta R-Squared Info Ratio
Lazard 23.66 1.29 18.04 6.38 0.94 89.93 0.93
MSCI Emerg Mkts
Barclays Treas Bill
Lazard
More ReturnLess Risk
More ReturnMore Risk
Less ReturnLess Risk
Less ReturnMore Risk
Standard Deviation24.0022.0020.0018.0016.0014.0012.0010.008.006.004.002.000.00-2.00-4.00
Rate of Return (%)
0.00
-1.00
-2.00
Return Sharpe Ratio Std Dev Alpha Beta R-Squared Info Ratio
Lazard -1.92 -0.12 18.10 -0.79 1.04 91.07 -0.17
MSCI Emerg Mkts
Barclays Treas Bill
Lazard
More ReturnLess Risk
More ReturnMore Risk
Less ReturnLess Risk
Less ReturnMore Risk
27.44
21.95
16.46
10.97
5.49
Return Highest Value 27.38 First Quartile 19.79 Median Value 16.77 Third Quartile 14.19 Lowest Value 7.78 Mean 17.01
Value Rank Lazard 23.66 6 MSCI Emerg Mkts 17.21 45
14.06
9.37
4.69
0.00
-4.69
Alpha 12.44 7.39 4.41 0.36 -4.30 4.06
Value Rank 6.38 31 0.00 80
1.17
0.94
0.70
0.47
0.23
Beta 0.23 0.53 0.80 0.94 1.07 0.72
Value Rank 0.94 21 1.00 7
21.97
17.57
13.18
8.79
4.39
Std Dev 20.85 17.58 15.31 11.69 5.16 14.13
Value Rank 18.04 17 18.10 16
104.53
92.91
81.30
69.68
58.07
R-Squared 98.83 95.11 88.31 72.60 58.52 84.17
Value Rank 89.93 45 100.00 1
3.33
2.66
2.00
1.33
0.67
Sharpe Ratio 2.94 1.48 1.19 0.93 0.56 1.32
Value Rank 1.29 36 0.93 74
Risk vs Reward
Multi-Statistic Quartile Chart - One Year
One Year Since Inception
Comparison Universe: Emerging Markets
Lazard EM Period Ending September 30, 2016
This report is provided for informational purposes only. The information shown was obtained from sources believed to be reliable, the accuracy of which cannot be guaranteed. Account statements provided by UBS or other financial institutions are theofficial record of your holdings, balances, transactions and security values and are not amended or superseded by any of the information presented in this report. Information is current as of the date shown. Past performance is no guarantee of futurereturns. See IMPORTANT INFORMATION at end of report for details.
48

Downside Capture Ratio (%)13012512011511010510095908580757065605550454035302520151050
Upside Cap
ture Ratio (%
)
130
120
110
100
90
80
70
60
50
40
30
20
10
0
1 2 3 4
6/2016-9/2016 12/2015-9/2016 9/2015-9/2016 12/2013-9/2016
Up Periods 3.00 6.00 7.00 18.00
Upside Capture ROR 8.88 35.15 44.71 57.42
MSCI Emerg Mkts 9.15 29.41 38.65 51.23
% Of Capture 97.05 119.51 115.68 112.09
Down Periods 0.00 3.00 5.00 15.00
Downside Capture ROR N/A -8.23 -14.55 -44.41
MSCI Emerg Mkts N/A -10.09 -15.47 -40.31
% Of Capture N/A 81.56 94.05 110.17
Outperforms InPos. & Neg. Periods
Underperforms In Neg. PeriodsOutperforms In Pos. Periods
Underperforms In Pos. PeriodsOutperforms In Neg. Periods
Underperforms InPos. & Neg. Periods
23
4
Capture Ratio Trend
Three Years Rolling Alpha
Lisle Woodridge FPD Pension Fund Period Ending September 30, 2016
This report is provided for informational purposes only. The information shown was obtained from sources believed to be reliable, the accuracy of which cannot be guaranteed. Account statements provided by UBS or other financial institutions are theofficial record of your holdings, balances, transactions and security values and are not amended or superseded by any of the information presented in this report. Information is current as of the date shown. Past performance is no guarantee of futurereturns. See IMPORTANT INFORMATION at end of report for details.
49
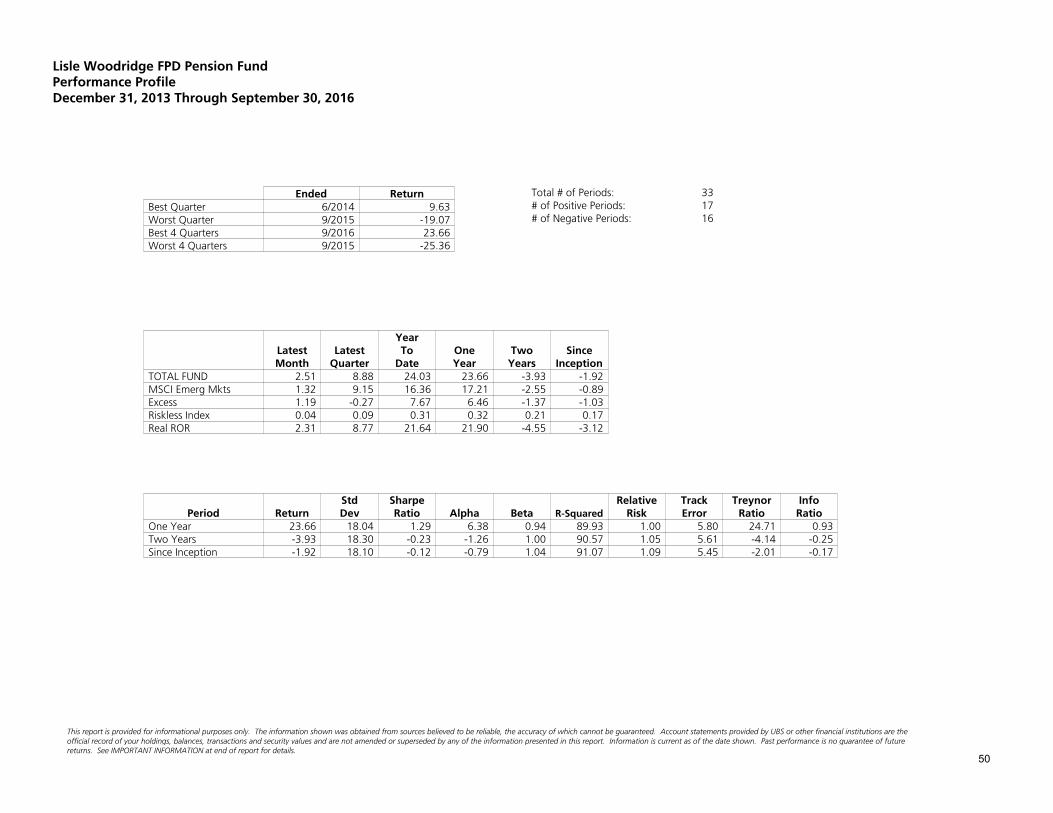
Ended ReturnBest Quarter 6/2014 9.63Worst Quarter 9/2015 -19.07Best 4 Quarters 9/2016 23.66Worst 4 Quarters 9/2015 -25.36
Total # of Periods: 33# of Positive Periods: 17# of Negative Periods: 16
YearLatest Latest To One Two SinceMonth Quarter Date Year Years Inception
TOTAL FUND 2.51 8.88 24.03 23.66 -3.93 -1.92MSCI Emerg Mkts 1.32 9.15 16.36 17.21 -2.55 -0.89Excess 1.19 -0.27 7.67 6.46 -1.37 -1.03Riskless Index 0.04 0.09 0.31 0.32 0.21 0.17Real ROR 2.31 8.77 21.64 21.90 -4.55 -3.12
Std Sharpe Relative Track Treynor InfoPeriod Return Dev Ratio Alpha Beta R-Squared Risk Error Ratio Ratio
One Year 23.66 18.04 1.29 6.38 0.94 89.93 1.00 5.80 24.71 0.93Two Years -3.93 18.30 -0.23 -1.26 1.00 90.57 1.05 5.61 -4.14 -0.25Since Inception -1.92 18.10 -0.12 -0.79 1.04 91.07 1.09 5.45 -2.01 -0.17
Lisle Woodridge FPD Pension FundPerformance ProfileDecember 31, 2013 Through September 30, 2016
returns. See IMPORTANT INFORMATION at end of report for details.official record of your holdings, balances, transactions and security values and are not amended or superseded by any of the information presented in this report. Information is current as of the date shown. Past performance is no guarantee of future
This report is provided for informational purposes only. The information shown was obtained from sources believed to be reliable, the accuracy of which cannot be guaranteed. Account statements provided by UBS or other financial institutions are the
50
Prepared for:Lisle Woodridge FPD Pension FundNovember 14, 2016
Prepared by:
Investment Performance
Period Ending September 30, 2016
iShares Core MSCI Emerging Market
Willhite Institutional Consulting Group
This report is provided for informational purposes only. The information shown was obtained from sources believed to be reliable, the accuracy of which cannot be guaranteed. Account statements provided by UBS or other financial institutions are theofficial record of your holdings, balances, transactions and security values and are not amended or superseded by any of the information presented in this report. Information is current as of the date shown. Past performance is no guarantee of futurereturns. See IMPORTANT INFORMATION at end of report for details.
51

Standard Deviation24.0022.0020.0018.0016.0014.0012.0010.008.006.004.002.000.00-2.00-4.00
Rate of Return (%)
19.00
18.00
17.00
16.00
15.00
14.00
13.00
12.00
11.00
10.00
9.00
8.00
7.00
6.00
5.00
4.00
3.00
2.00
1.00
0.00
-1.00
-2.00
Return Sharpe Ratio Std Dev Alpha Beta R-Squared Info Ratio
iShares Core MSCI EM 16.95 1.00 16.72 1.15 0.91 96.52 -0.15
MSCI Emerg Mkts
Barclays Treas Bill
iShares Core MSCI EM
More ReturnLess Risk
More ReturnMore Risk
Less ReturnLess Risk
Less ReturnMore Risk
Standard Deviation24.0022.0020.0018.0016.0014.0012.0010.008.006.004.002.000.00-2.00-4.00
Rate of Return (%)
1.00
0.00
-1.00
-2.00
-3.00
-4.00
-5.00
-6.00
-7.00
-8.00
Return Sharpe Ratio Std Dev Alpha Beta R-Squared Info Ratio
iShares Core MSCI EM -6.39 -0.37 17.80 0.02 0.92 96.84 0.12
MSCI Emerg Mkts
Barclays Treas Bill
iShares Core MSCI EM
More ReturnLess Risk
More ReturnMore Risk
Less ReturnLess Risk
Less ReturnMore Risk
27.44
21.95
16.46
10.97
5.49
Return Highest Value 27.38 First Quartile 19.79 Median Value 16.77 Third Quartile 14.19 Lowest Value 7.78 Mean 17.01
Value Rank iShares Core MSCI EM 16.95 47 MSCI Emerg Mkts 17.21 45
14.06
9.37
4.69
0.00
-4.69
Alpha 12.44 7.39 4.41 0.36 -4.30 4.06
Value Rank 1.15 69 0.00 80
1.17
0.94
0.70
0.47
0.23
Beta 0.23 0.53 0.80 0.94 1.07 0.72
Value Rank 0.91 32 1.00 7
21.97
17.57
13.18
8.79
4.39
Std Dev 20.85 17.58 15.31 11.69 5.16 14.13
Value Rank 16.72 35 18.10 16
104.53
92.91
81.30
69.68
58.07
R-Squared 98.83 95.11 88.31 72.60 58.52 84.17
Value Rank 96.52 17 100.00 1
3.33
2.66
2.00
1.33
0.67
Sharpe Ratio 2.94 1.48 1.19 0.93 0.56 1.32
Value Rank 1.00 66 0.93 74
Risk vs Reward
Multi-Statistic Quartile Chart - One Year
One Year Since Inception
Comparison Universe: Emerging Markets
iShares Core MSCI Emerging Market Period Ending September 30, 2016
This report is provided for informational purposes only. The information shown was obtained from sources believed to be reliable, the accuracy of which cannot be guaranteed. Account statements provided by UBS or other financial institutions are theofficial record of your holdings, balances, transactions and security values and are not amended or superseded by any of the information presented in this report. Information is current as of the date shown. Past performance is no guarantee of futurereturns. See IMPORTANT INFORMATION at end of report for details.
52

Downside Capture Ratio (%)13012512011511010510095908580757065605550454035302520151050
Upside Cap
ture Ratio (%
)
130
120
110
100
90
80
70
60
50
40
30
20
10
0
1 2 3 4
6/2016-9/2016 12/2015-9/2016 9/2015-9/2016 4/2015-9/2016
Up Periods 3.00 6.00 7.00 7.00
Upside Capture ROR 8.93 28.75 36.65 36.65
MSCI Emerg Mkts 9.15 29.41 38.65 38.65
% Of Capture 97.60 97.74 94.81 94.81
Down Periods 0.00 3.00 5.00 10.00
Downside Capture ROR N/A -9.27 -14.41 -33.36
MSCI Emerg Mkts N/A -10.09 -15.47 -34.95
% Of Capture N/A 91.84 93.18 95.45
Outperforms InPos. & Neg. Periods
Underperforms In Neg. PeriodsOutperforms In Pos. Periods
Underperforms In Pos. PeriodsOutperforms In Neg. Periods
Underperforms InPos. & Neg. Periods
23 4
Capture Ratio Trend
Three Years Rolling Alpha
Lisle Woodridge FPD Pension Fund Period Ending September 30, 2016
This report is provided for informational purposes only. The information shown was obtained from sources believed to be reliable, the accuracy of which cannot be guaranteed. Account statements provided by UBS or other financial institutions are theofficial record of your holdings, balances, transactions and security values and are not amended or superseded by any of the information presented in this report. Information is current as of the date shown. Past performance is no guarantee of futurereturns. See IMPORTANT INFORMATION at end of report for details.
53

Ended ReturnBest Quarter 9/2016 8.93Worst Quarter 9/2015 -15.96Best 4 Quarters 9/2016 16.95Worst 4 Quarters 9/2016 16.95
Total # of Periods: 17# of Positive Periods: 7# of Negative Periods: 10
YearLatest Latest To One SinceMonth Quarter Date Year Inception
TOTAL FUND 2.69 8.93 16.82 16.95 -6.39MSCI Emerg Mkts 1.32 9.15 16.36 17.21 -7.03Excess 1.37 -0.22 0.46 -0.25 0.63Riskless Index 0.04 0.09 0.31 0.32 0.27Real ROR 2.49 8.82 14.54 15.26 -7.76
Std Sharpe Relative Track Treynor InfoPeriod Return Dev Ratio Alpha Beta R-Squared Risk Error Ratio Ratio
One Year 16.95 16.72 1.00 1.15 0.91 96.52 0.92 3.54 18.34 -0.15Since Inception -6.39 17.80 -0.37 0.02 0.92 96.84 0.94 3.47 -7.22 0.12
Lisle Woodridge FPD Pension FundPerformance ProfileApril 14, 2015 Through September 30, 2016
returns. See IMPORTANT INFORMATION at end of report for details.official record of your holdings, balances, transactions and security values and are not amended or superseded by any of the information presented in this report. Information is current as of the date shown. Past performance is no guarantee of future
This report is provided for informational purposes only. The information shown was obtained from sources believed to be reliable, the accuracy of which cannot be guaranteed. Account statements provided by UBS or other financial institutions are the
54
Prepared for:Lisle Woodridge FPD Pension FundNovember 14, 2016
Prepared by:
Investment Performance
Period Ending September 30, 2016
Chilton REIT
Willhite Institutional Consulting Group
This report is provided for informational purposes only. The information shown was obtained from sources believed to be reliable, the accuracy of which cannot be guaranteed. Account statements provided by UBS or other financial institutions are theofficial record of your holdings, balances, transactions and security values and are not amended or superseded by any of the information presented in this report. Information is current as of the date shown. Past performance is no guarantee of futurereturns. See IMPORTANT INFORMATION at end of report for details.
55
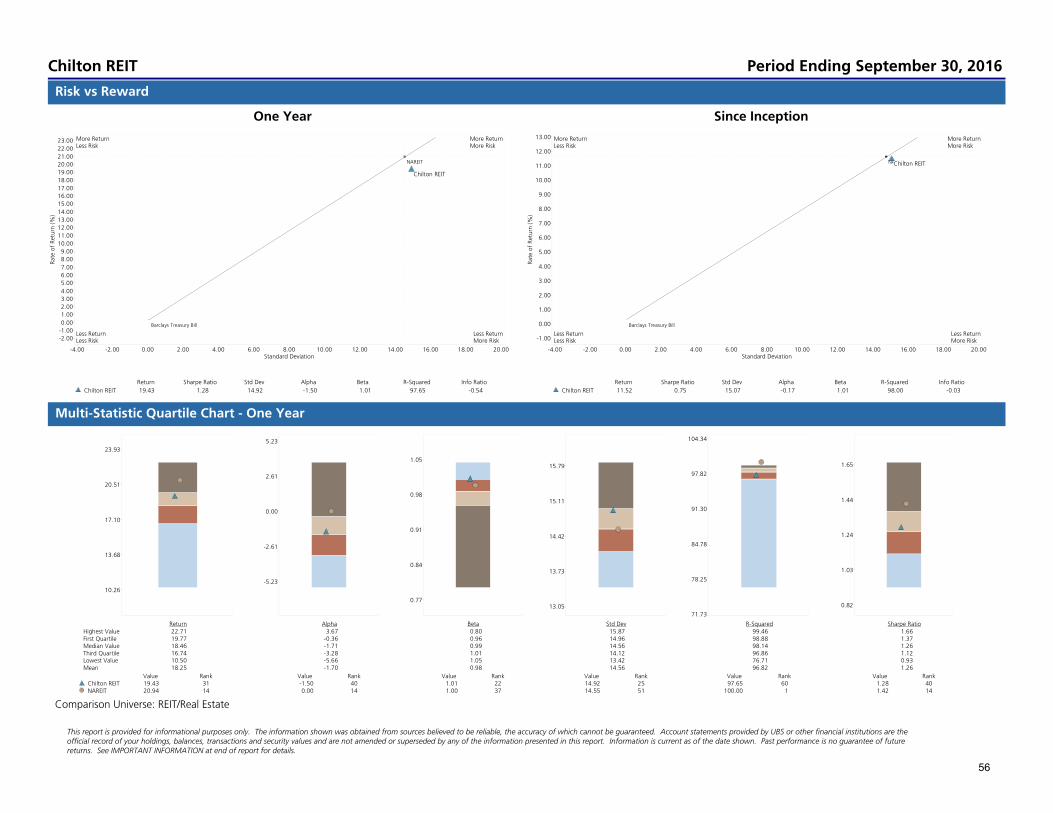
Standard Deviation20.0018.0016.0014.0012.0010.008.006.004.002.000.00-2.00-4.00
Rate of Return (%)
23.00
22.00
21.00
20.00
19.00
18.00
17.00
16.00
15.00
14.00
13.00
12.00
11.00
10.00
9.00
8.00
7.00
6.00
5.00
4.00
3.00
2.00
1.00
0.00
-1.00
-2.00
Return Sharpe Ratio Std Dev Alpha Beta R-Squared Info Ratio
Chilton REIT 19.43 1.28 14.92 -1.50 1.01 97.65 -0.54
NAREIT
Barclays Treasury Bill
Chilton REIT
More ReturnLess Risk
More ReturnMore Risk
Less ReturnLess Risk
Less ReturnMore Risk
Standard Deviation20.0018.0016.0014.0012.0010.008.006.004.002.000.00-2.00-4.00
Rate of Return (%)
13.00
12.00
11.00
10.00
9.00
8.00
7.00
6.00
5.00
4.00
3.00
2.00
1.00
0.00
-1.00
Return Sharpe Ratio Std Dev Alpha Beta R-Squared Info Ratio
Chilton REIT 11.52 0.75 15.07 -0.17 1.01 98.00 -0.03
NAREIT
Barclays Treasury Bill
Chilton REIT
More ReturnLess Risk
More ReturnMore Risk
Less ReturnLess Risk
Less ReturnMore Risk
23.93
20.51
17.10
13.68
10.26
Return Highest Value 22.71 First Quartile 19.77 Median Value 18.46 Third Quartile 16.74 Lowest Value 10.50 Mean 18.25
Value Rank Chilton REIT 19.43 31 NAREIT 20.94 14
5.23
2.61
0.00
-2.61
-5.23
Alpha 3.67 -0.36 -1.71 -3.28 -5.66 -1.70
Value Rank -1.50 40 0.00 14
1.05
0.98
0.91
0.84
0.77
Beta 0.80 0.96 0.99 1.01 1.05 0.98
Value Rank 1.01 22 1.00 37
15.79
15.11
14.42
13.73
13.05
Std Dev 15.87 14.96 14.56 14.12 13.42 14.56
Value Rank 14.92 25 14.55 51
104.34
97.82
91.30
84.78
78.25
71.73
R-Squared 99.46 98.88 98.14 96.86 76.71 96.82
Value Rank 97.65 60 100.00 1
1.65
1.44
1.24
1.03
0.82
Sharpe Ratio 1.66 1.37 1.26 1.12 0.93 1.26
Value Rank 1.28 40 1.42 14
Risk vs Reward
Multi-Statistic Quartile Chart - One Year
One Year Since Inception
Comparison Universe: REIT/Real Estate
Chilton REIT Period Ending September 30, 2016
This report is provided for informational purposes only. The information shown was obtained from sources believed to be reliable, the accuracy of which cannot be guaranteed. Account statements provided by UBS or other financial institutions are theofficial record of your holdings, balances, transactions and security values and are not amended or superseded by any of the information presented in this report. Information is current as of the date shown. Past performance is no guarantee of futurereturns. See IMPORTANT INFORMATION at end of report for details.
56

Downside Capture Ratio (%)13012512011511010510095908580757065605550454035302520151050
Upside Cap
ture Ratio (%
)
140
130
120
110
100
90
80
70
60
50
40
30
20
10
0
1 2 3 4
6/2016-9/2016 12/2015-9/2016 9/2015-9/2016 4/2015-9/2016
Up Periods 1.00 4.00 6.00 8.00
Upside Capture ROR 4.80 24.00 34.52 45.15
NAREIT 3.89 25.21 35.06 44.82
% Of Capture 123.51 95.20 98.46 100.75
Down Periods 2.00 5.00 6.00 9.00
Downside Capture ROR -5.22 -10.51 -11.21 -19.60
NAREIT -4.90 -10.30 -10.45 -19.32
% Of Capture 106.41 102.07 107.28 101.45
Outperforms InPos. & Neg. Periods
Underperforms In Neg. PeriodsOutperforms In Pos. Periods
Underperforms In Pos. PeriodsOutperforms In Neg. Periods
Underperforms InPos. & Neg. Periods
1
23
4
Capture Ratio Trend
Three Years Rolling Alpha
Lisle Woodridge FPD Pension Fund Period Ending September 30, 2016
This report is provided for informational purposes only. The information shown was obtained from sources believed to be reliable, the accuracy of which cannot be guaranteed. Account statements provided by UBS or other financial institutions are theofficial record of your holdings, balances, transactions and security values and are not amended or superseded by any of the information presented in this report. Information is current as of the date shown. Past performance is no guarantee of futurereturns. See IMPORTANT INFORMATION at end of report for details.
57

Ended ReturnBest Quarter 12/2015 7.63Worst Quarter 9/2016 -0.67Best 4 Quarters 9/2016 19.43Worst 4 Quarters 9/2016 19.43
Total # of Periods: 17# of Positive Periods: 9# of Negative Periods: 8
YearLatest Latest To One SinceMonth Quarter Date Year Inception
TOTAL FUND -1.76 -0.67 10.96 19.43 11.52NAREIT -1.48 -1.21 12.31 20.94 11.61Excess -0.28 0.54 -1.35 -1.51 -0.09Riskless Index 0.04 0.09 0.31 0.32 0.27Real ROR -1.96 -0.78 8.78 17.67 9.88
Std Sharpe Relative Track Treynor InfoPeriod Return Dev Ratio Alpha Beta R-Squared Risk Error Ratio Ratio
One Year 19.43 14.92 1.28 -1.50 1.01 97.65 1.03 2.30 18.85 -0.54Since Inception 11.52 15.07 0.75 -0.17 1.01 98.00 1.02 2.14 11.13 -0.03
Lisle Woodridge FPD Pension FundPerformance ProfileApril 7, 2015 Through September 30, 2016
returns. See IMPORTANT INFORMATION at end of report for details.official record of your holdings, balances, transactions and security values and are not amended or superseded by any of the information presented in this report. Information is current as of the date shown. Past performance is no guarantee of future
This report is provided for informational purposes only. The information shown was obtained from sources believed to be reliable, the accuracy of which cannot be guaranteed. Account statements provided by UBS or other financial institutions are the
58
Prepared for:Lisle Woodridge FPD Pension FundNovember 14, 2016
Prepared by:
Investment Performance
Period Ending September 30, 2016
Stonebridge Advisors
Willhite Institutional Consulting Group
This report is provided for informational purposes only. The information shown was obtained from sources believed to be reliable, the accuracy of which cannot be guaranteed. Account statements provided by UBS or other financial institutions are theofficial record of your holdings, balances, transactions and security values and are not amended or superseded by any of the information presented in this report. Information is current as of the date shown. Past performance is no guarantee of futurereturns. See IMPORTANT INFORMATION at end of report for details.
59
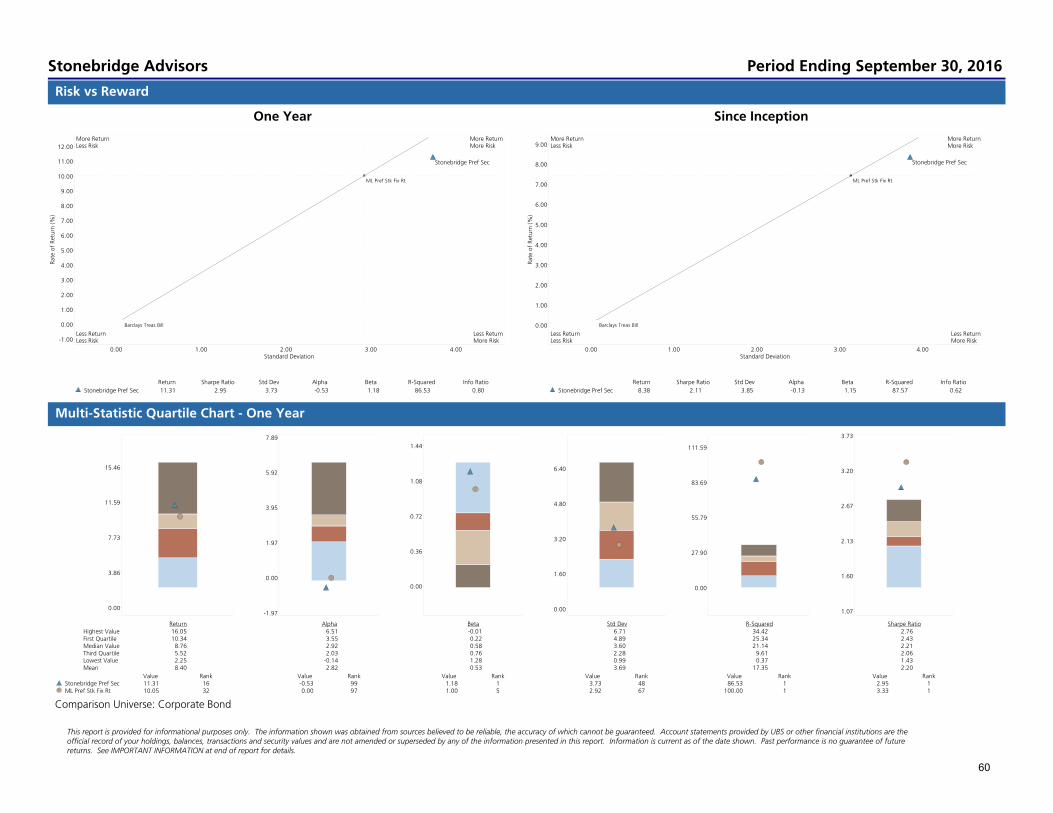
Standard Deviation4.003.002.001.000.00
Rate of Return (%)
12.00
11.00
10.00
9.00
8.00
7.00
6.00
5.00
4.00
3.00
2.00
1.00
0.00
-1.00
Return Sharpe Ratio Std Dev Alpha Beta R-Squared Info Ratio
Stonebridge Pref Sec 11.31 2.95 3.73 -0.53 1.18 86.53 0.80
ML Pref Stk Fix Rt
Barclays Treas Bill
Stonebridge Pref Sec
More ReturnLess Risk
More ReturnMore Risk
Less ReturnLess Risk
Less ReturnMore Risk
Standard Deviation4.003.002.001.000.00
Rate of Return (%)
9.00
8.00
7.00
6.00
5.00
4.00
3.00
2.00
1.00
0.00
Return Sharpe Ratio Std Dev Alpha Beta R-Squared Info Ratio
Stonebridge Pref Sec 8.38 2.11 3.85 -0.13 1.15 87.57 0.62
ML Pref Stk Fix Rt
Barclays Treas Bill
Stonebridge Pref Sec
More ReturnLess Risk
More ReturnMore Risk
Less ReturnLess Risk
Less ReturnMore Risk
15.46
11.59
7.73
3.86
0.00
Return Highest Value 16.05 First Quartile 10.34 Median Value 8.76 Third Quartile 5.52 Lowest Value 2.25 Mean 8.40
Value Rank Stonebridge Pref Sec 11.31 16 ML Pref Stk Fix Rt 10.05 32
7.89
5.92
3.95
1.97
0.00
-1.97
Alpha 6.51 3.55 2.92 2.03 -0.14 2.82
Value Rank -0.53 99 0.00 97
1.44
1.08
0.72
0.36
0.00
Beta -0.01 0.22 0.58 0.76 1.28 0.53
Value Rank 1.18 1 1.00 5
6.40
4.80
3.20
1.60
0.00
Std Dev 6.71 4.89 3.60 2.28 0.99 3.69
Value Rank 3.73 48 2.92 67
111.59
83.69
55.79
27.90
0.00
R-Squared 34.42 25.34 21.14 9.61 0.37 17.35
Value Rank 86.53 1 100.00 1
3.73
3.20
2.67
2.13
1.60
1.07
Sharpe Ratio 2.76 2.43 2.21 2.06 1.43 2.20
Value Rank 2.95 1 3.33 1
Risk vs Reward
Multi-Statistic Quartile Chart - One Year
One Year Since Inception
Comparison Universe: Corporate Bond
Stonebridge Advisors Period Ending September 30, 2016
This report is provided for informational purposes only. The information shown was obtained from sources believed to be reliable, the accuracy of which cannot be guaranteed. Account statements provided by UBS or other financial institutions are theofficial record of your holdings, balances, transactions and security values and are not amended or superseded by any of the information presented in this report. Information is current as of the date shown. Past performance is no guarantee of futurereturns. See IMPORTANT INFORMATION at end of report for details.
60

Downside Capture Ratio (%)2302202102001901801701601501401301201101009080706050403020100
Upside Cap
ture Ratio (%
)
140
130
120
110
100
90
80
70
60
50
40
30
20
10
0
1 2 3 4
6/2016-9/2016 12/2015-9/2016 9/2015-9/2016 4/2015-9/2016
Up Periods 2.00 6.00 9.00 12.00
Upside Capture ROR 2.63 9.78 13.78 15.76
ML Pref Stk Fix Rt 2.02 7.43 11.16 13.08
% Of Capture 130.09 131.58 123.50 120.56
Down Periods 1.00 3.00 3.00 5.00
Downside Capture ROR -0.65 -2.17 -2.17 -3.18
ML Pref Stk Fix Rt -0.79 -0.99 -0.99 -2.08
% Of Capture 81.94 218.16 218.16 152.61
Outperforms InPos. & Neg. Periods
Underperforms In Neg. PeriodsOutperforms In Pos. Periods
Underperforms In Pos. PeriodsOutperforms In Neg. Periods
Underperforms InPos. & Neg. Periods
1 2
34
Capture Ratio Trend
Three Years Rolling Alpha
Lisle Woodridge FPD Pension Fund Period Ending September 30, 2016
This report is provided for informational purposes only. The information shown was obtained from sources believed to be reliable, the accuracy of which cannot be guaranteed. Account statements provided by UBS or other financial institutions are theofficial record of your holdings, balances, transactions and security values and are not amended or superseded by any of the information presented in this report. Information is current as of the date shown. Past performance is no guarantee of futurereturns. See IMPORTANT INFORMATION at end of report for details.
61
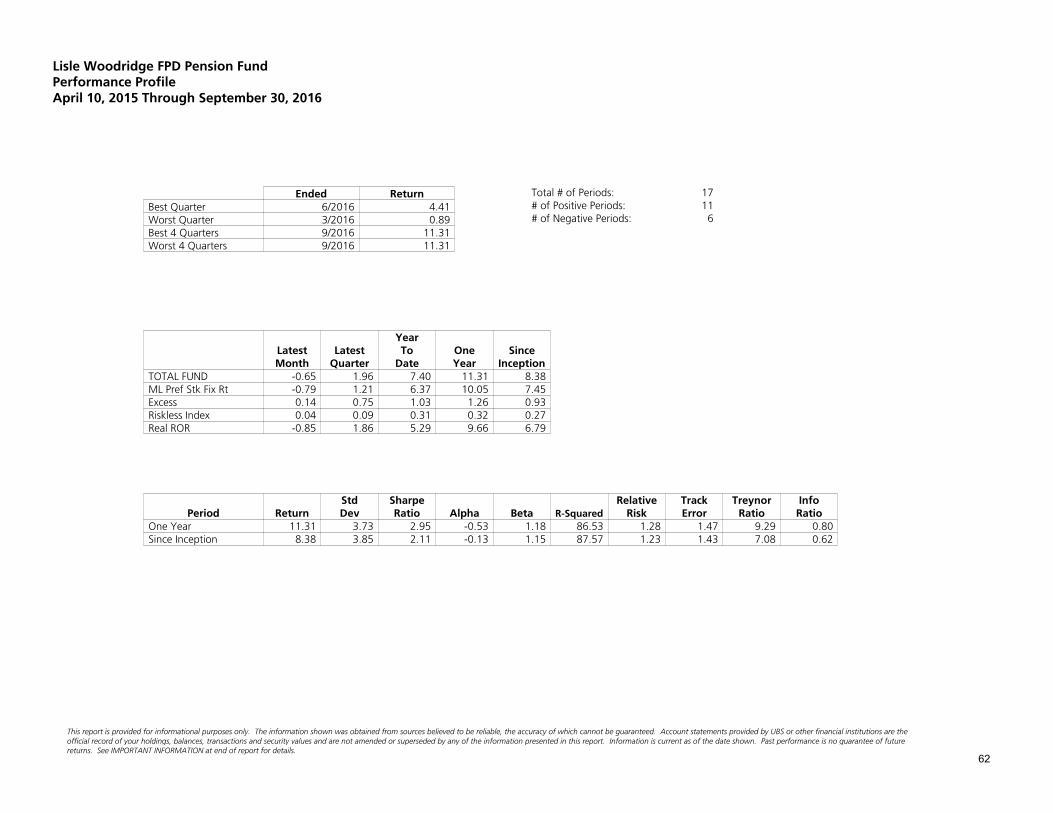
Ended ReturnBest Quarter 6/2016 4.41Worst Quarter 3/2016 0.89Best 4 Quarters 9/2016 11.31Worst 4 Quarters 9/2016 11.31
Total # of Periods: 17# of Positive Periods: 11# of Negative Periods: 6
YearLatest Latest To One SinceMonth Quarter Date Year Inception
TOTAL FUND -0.65 1.96 7.40 11.31 8.38ML Pref Stk Fix Rt -0.79 1.21 6.37 10.05 7.45Excess 0.14 0.75 1.03 1.26 0.93Riskless Index 0.04 0.09 0.31 0.32 0.27Real ROR -0.85 1.86 5.29 9.66 6.79
Std Sharpe Relative Track Treynor InfoPeriod Return Dev Ratio Alpha Beta R-Squared Risk Error Ratio Ratio
One Year 11.31 3.73 2.95 -0.53 1.18 86.53 1.28 1.47 9.29 0.80Since Inception 8.38 3.85 2.11 -0.13 1.15 87.57 1.23 1.43 7.08 0.62
Lisle Woodridge FPD Pension FundPerformance ProfileApril 10, 2015 Through September 30, 2016
returns. See IMPORTANT INFORMATION at end of report for details.official record of your holdings, balances, transactions and security values and are not amended or superseded by any of the information presented in this report. Information is current as of the date shown. Past performance is no guarantee of future
This report is provided for informational purposes only. The information shown was obtained from sources believed to be reliable, the accuracy of which cannot be guaranteed. Account statements provided by UBS or other financial institutions are the
62

Prepared for:Lisle Woodridge FPD Pension FundNovember 14, 2016
Prepared by:
Investment Performance
Period Ending September 30, 2016
Convertible Sec SPDR
Willhite Institutional Consulting Group
This report is provided for informational purposes only. The information shown was obtained from sources believed to be reliable, the accuracy of which cannot be guaranteed. Account statements provided by UBS or other financial institutions are theofficial record of your holdings, balances, transactions and security values and are not amended or superseded by any of the information presented in this report. Information is current as of the date shown. Past performance is no guarantee of futurereturns. See IMPORTANT INFORMATION at end of report for details.
63
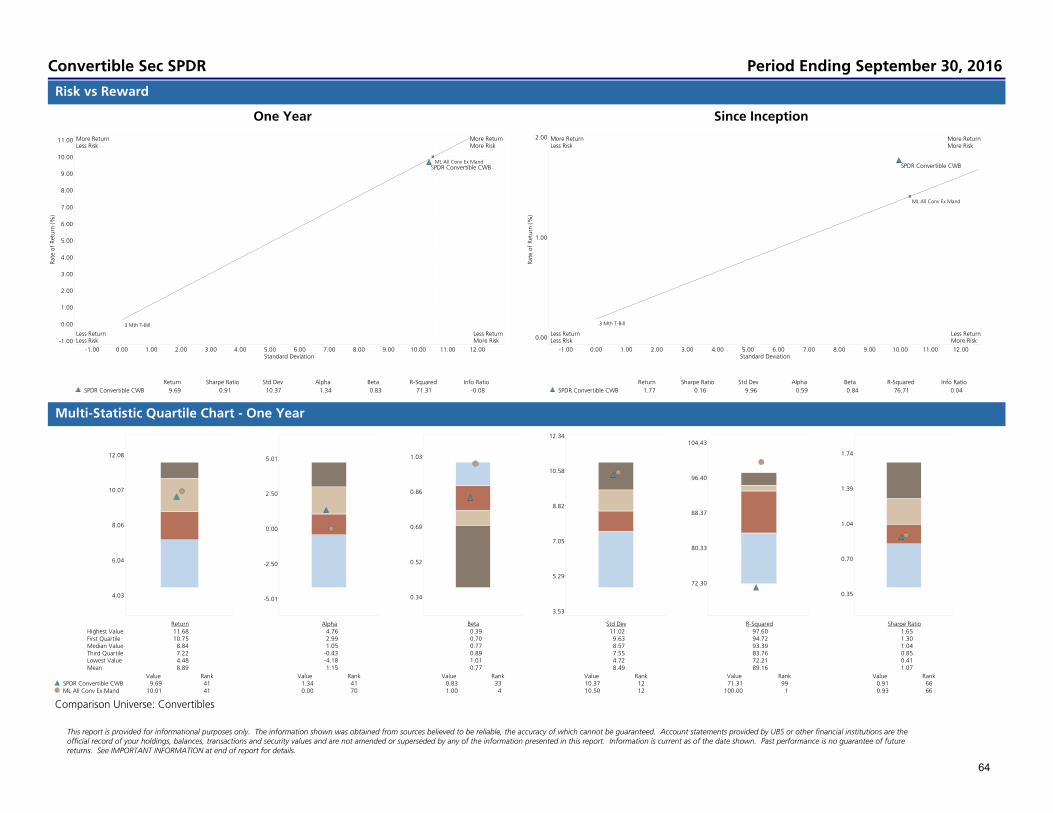
Standard Deviation12.0011.0010.009.008.007.006.005.004.003.002.001.000.00-1.00
Rate of Return (%)
11.00
10.00
9.00
8.00
7.00
6.00
5.00
4.00
3.00
2.00
1.00
0.00
-1.00
Return Sharpe Ratio Std Dev Alpha Beta R-Squared Info Ratio
SPDR Convertible CWB 9.69 0.91 10.37 1.34 0.83 71.31 -0.08
ML All Conv Ex Mand
3 Mth T-Bill
SPDR Convertible CWB
More ReturnLess Risk
More ReturnMore Risk
Less ReturnLess Risk
Less ReturnMore Risk
Standard Deviation12.0011.0010.009.008.007.006.005.004.003.002.001.000.00-1.00
Rate of Return (%)
2.00
1.00
0.00
Return Sharpe Ratio Std Dev Alpha Beta R-Squared Info Ratio
SPDR Convertible CWB 1.77 0.16 9.96 0.59 0.84 76.71 0.04
ML All Conv Ex Mand
3 Mth T-Bill
SPDR Convertible CWB
More ReturnLess Risk
More ReturnMore Risk
Less ReturnLess Risk
Less ReturnMore Risk
12.08
10.07
8.06
6.04
4.03
Return Highest Value 11.68 First Quartile 10.75 Median Value 8.84 Third Quartile 7.22 Lowest Value 4.48 Mean 8.89
Value Rank SPDR Convertible CWB 9.69 41 ML All Conv Ex Mand 10.01 41
5.01
2.50
0.00
-2.50
-5.01
Alpha 4.76 2.99 1.05 -0.43 -4.18 1.15
Value Rank 1.34 41 0.00 70
1.03
0.86
0.69
0.52
0.34
Beta 0.39 0.70 0.77 0.89 1.01 0.77
Value Rank 0.83 33 1.00 4
12.34
10.58
8.82
7.05
5.29
3.53
Std Dev 11.02 9.63 8.57 7.55 4.72 8.49
Value Rank 10.37 12 10.50 12
104.43
96.40
88.37
80.33
72.30
R-Squared 97.60 94.72 93.39 83.76 72.21 89.16
Value Rank 71.31 99 100.00 1
1.74
1.39
1.04
0.70
0.35
Sharpe Ratio 1.65 1.30 1.04 0.85 0.41 1.07
Value Rank 0.91 66 0.93 66
Risk vs Reward
Multi-Statistic Quartile Chart - One Year
One Year Since Inception
Comparison Universe: Convertibles
Convertible Sec SPDR Period Ending September 30, 2016
This report is provided for informational purposes only. The information shown was obtained from sources believed to be reliable, the accuracy of which cannot be guaranteed. Account statements provided by UBS or other financial institutions are theofficial record of your holdings, balances, transactions and security values and are not amended or superseded by any of the information presented in this report. Information is current as of the date shown. Past performance is no guarantee of futurereturns. See IMPORTANT INFORMATION at end of report for details.
64
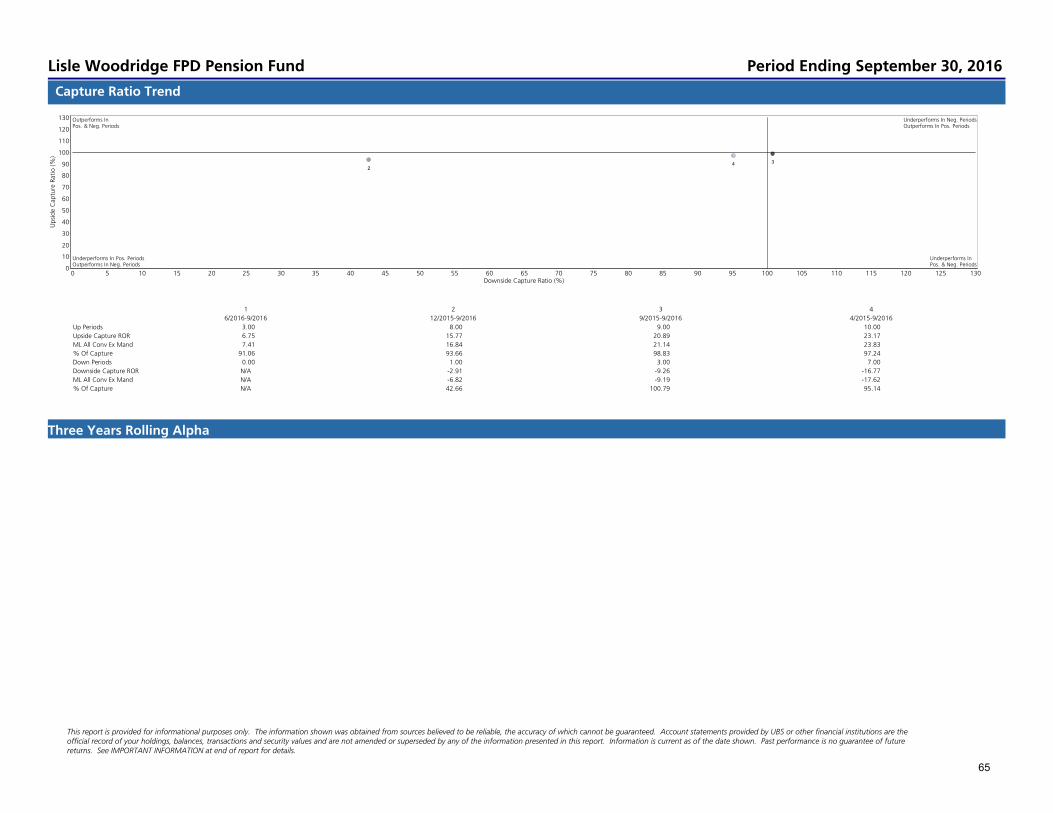
Downside Capture Ratio (%)13012512011511010510095908580757065605550454035302520151050
Upside Cap
ture Ratio (%
)
130
120
110
100
90
80
70
60
50
40
30
20
10
0
1 2 3 4
6/2016-9/2016 12/2015-9/2016 9/2015-9/2016 4/2015-9/2016
Up Periods 3.00 8.00 9.00 10.00
Upside Capture ROR 6.75 15.77 20.89 23.17
ML All Conv Ex Mand 7.41 16.84 21.14 23.83
% Of Capture 91.06 93.66 98.83 97.24
Down Periods 0.00 1.00 3.00 7.00
Downside Capture ROR N/A -2.91 -9.26 -16.77
ML All Conv Ex Mand N/A -6.82 -9.19 -17.62
% Of Capture N/A 42.66 100.79 95.14
Outperforms InPos. & Neg. Periods
Underperforms In Neg. PeriodsOutperforms In Pos. Periods
Underperforms In Pos. PeriodsOutperforms In Neg. Periods
Underperforms InPos. & Neg. Periods
2
34
Capture Ratio Trend
Three Years Rolling Alpha
Lisle Woodridge FPD Pension Fund Period Ending September 30, 2016
This report is provided for informational purposes only. The information shown was obtained from sources believed to be reliable, the accuracy of which cannot be guaranteed. Account statements provided by UBS or other financial institutions are theofficial record of your holdings, balances, transactions and security values and are not amended or superseded by any of the information presented in this report. Information is current as of the date shown. Past performance is no guarantee of futurereturns. See IMPORTANT INFORMATION at end of report for details.
65

Ended ReturnBest Quarter 9/2016 6.75Worst Quarter 9/2015 -5.32Best 4 Quarters 9/2016 9.69Worst 4 Quarters 9/2016 9.69
Total # of Periods: 17# of Positive Periods: 10# of Negative Periods: 7
YearLatest Latest To One SinceMonth Quarter Date Year Inception
TOTAL FUND 1.18 6.75 12.40 9.69 1.77ML All Conv Ex Mand 1.59 7.41 8.87 10.01 1.41Excess -0.40 -0.66 3.53 -0.31 0.36Riskless Index 0.02 0.08 0.22 0.25 0.19Real ROR 0.98 6.63 10.19 8.10 0.30
Std Sharpe Relative Track Treynor InfoPeriod Return Dev Ratio Alpha Beta R-Squared Risk Error Ratio Ratio
One Year 9.69 10.37 0.91 1.34 0.83 71.31 0.99 5.82 11.32 -0.08Since Inception 1.77 9.96 0.16 0.59 0.84 76.71 0.96 5.06 1.87 0.04
Lisle Woodridge FPD Pension FundPerformance ProfileApril 10, 2015 Through September 30, 2016
returns. See IMPORTANT INFORMATION at end of report for details.official record of your holdings, balances, transactions and security values and are not amended or superseded by any of the information presented in this report. Information is current as of the date shown. Past performance is no guarantee of future
This report is provided for informational purposes only. The information shown was obtained from sources believed to be reliable, the accuracy of which cannot be guaranteed. Account statements provided by UBS or other financial institutions are the
66

Prepared for:Lisle Woodridge FPD Pension FundNovember 14, 2016
Prepared by:
Investment Performance
Period Ending September 30, 2016
Wells Fargo Absolute Return
Willhite Institutional Consulting Group
This report is provided for informational purposes only. The information shown was obtained from sources believed to be reliable, the accuracy of which cannot be guaranteed. Account statements provided by UBS or other financial institutions are theofficial record of your holdings, balances, transactions and security values and are not amended or superseded by any of the information presented in this report. Information is current as of the date shown. Past performance is no guarantee of futurereturns. See IMPORTANT INFORMATION at end of report for details.
67
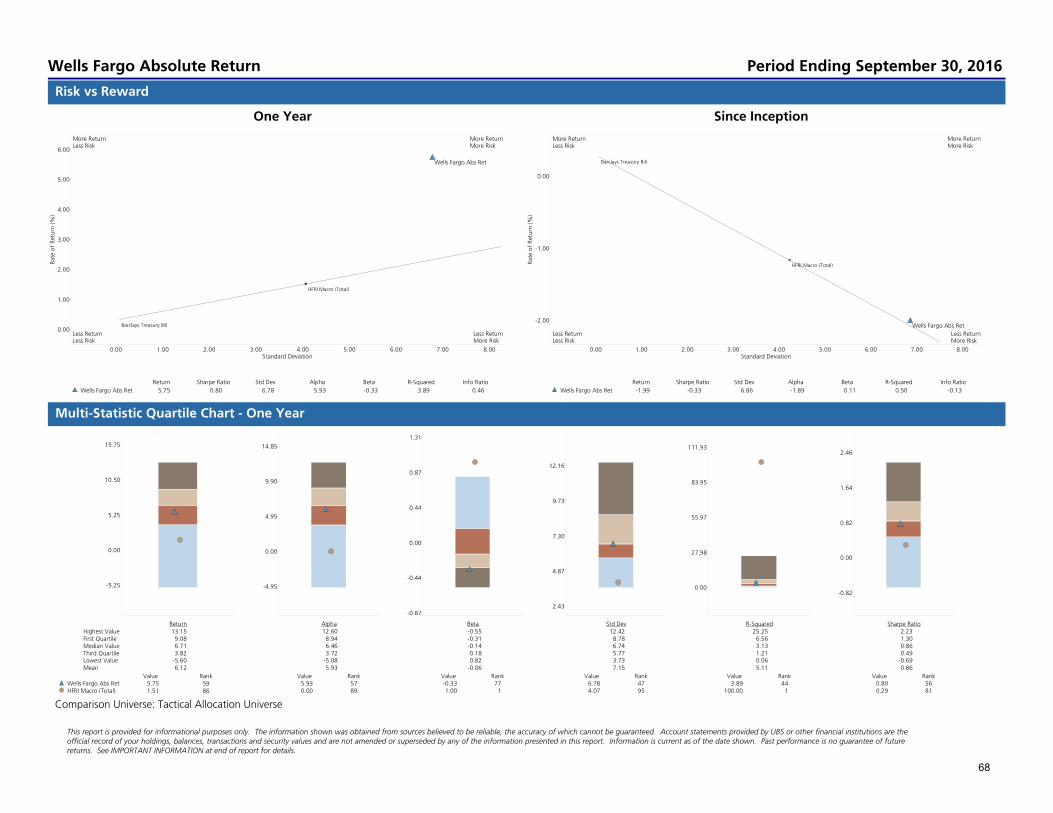
Standard Deviation8.007.006.005.004.003.002.001.000.00
Rate of Return (%)
6.00
5.00
4.00
3.00
2.00
1.00
0.00
Return Sharpe Ratio Std Dev Alpha Beta R-Squared Info Ratio
Wells Fargo Abs Ret 5.75 0.80 6.78 5.93 -0.33 3.89 0.46
HFRI Macro (Total)
Barclays Treasury Bill
Wells Fargo Abs Ret
More ReturnLess Risk
More ReturnMore Risk
Less ReturnLess Risk
Less ReturnMore Risk
Standard Deviation8.007.006.005.004.003.002.001.000.00
Rate of Return (%)
0.00
-1.00
-2.00
Return Sharpe Ratio Std Dev Alpha Beta R-Squared Info Ratio
Wells Fargo Abs Ret -1.99 -0.33 6.86 -1.89 0.11 0.50 -0.13
HFRI Macro (Total)
Barclays Treasury Bill
Wells Fargo Abs Ret
More ReturnLess Risk
More ReturnMore Risk
Less ReturnLess Risk
Less ReturnMore Risk
15.75
10.50
5.25
0.00
-5.25
Return Highest Value 13.15 First Quartile 9.08 Median Value 6.71 Third Quartile 3.82 Lowest Value -5.60 Mean 6.12
Value Rank Wells Fargo Abs Ret 5.75 59 HFRI Macro (Total) 1.51 86
14.85
9.90
4.95
0.00
-4.95
Alpha 12.60 8.94 6.46 3.72 -5.08 5.93
Value Rank 5.93 57 0.00 89
1.31
0.87
0.44
0.00
-0.44
-0.87
Beta -0.55 -0.31 -0.14 0.18 0.82 -0.06
Value Rank -0.33 77 1.00 1
12.16
9.73
7.30
4.87
2.43
Std Dev 12.42 8.78 6.74 5.77 3.73 7.15
Value Rank 6.78 47 4.07 95
111.93
83.95
55.97
27.98
0.00
R-Squared 25.25 6.56 3.13 1.21 0.06 5.11
Value Rank 3.89 44 100.00 1
2.46
1.64
0.82
0.00
-0.82
Sharpe Ratio 2.23 1.30 0.86 0.49 -0.69 0.86
Value Rank 0.80 56 0.29 81
Risk vs Reward
Multi-Statistic Quartile Chart - One Year
One Year Since Inception
Comparison Universe: Tactical Allocation Universe
Wells Fargo Absolute Return Period Ending September 30, 2016
This report is provided for informational purposes only. The information shown was obtained from sources believed to be reliable, the accuracy of which cannot be guaranteed. Account statements provided by UBS or other financial institutions are theofficial record of your holdings, balances, transactions and security values and are not amended or superseded by any of the information presented in this report. Information is current as of the date shown. Past performance is no guarantee of futurereturns. See IMPORTANT INFORMATION at end of report for details.
68
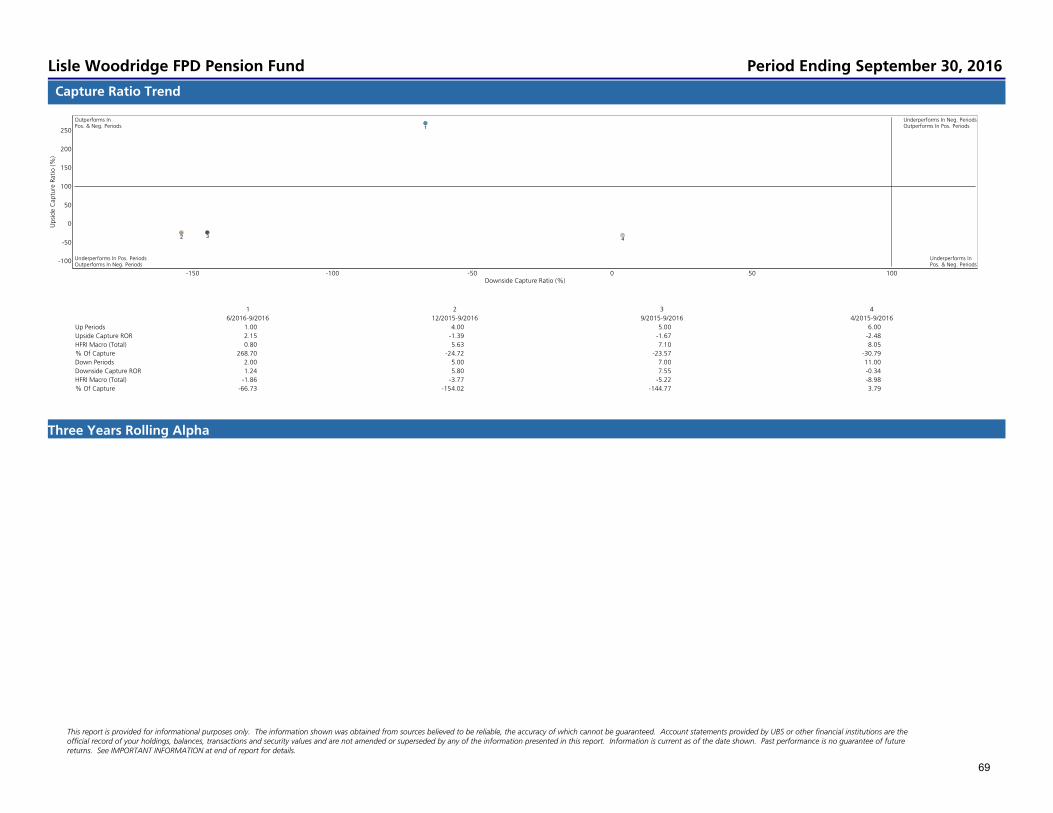
Downside Capture Ratio (%)100500-50-100-150
Upside Cap
ture Ratio (%
)
250
200
150
100
50
0
-50
-100
1 2 3 4
6/2016-9/2016 12/2015-9/2016 9/2015-9/2016 4/2015-9/2016
Up Periods 1.00 4.00 5.00 6.00
Upside Capture ROR 2.15 -1.39 -1.67 -2.48
HFRI Macro (Total) 0.80 5.63 7.10 8.05
% Of Capture 268.70 -24.72 -23.57 -30.79
Down Periods 2.00 5.00 7.00 11.00
Downside Capture ROR 1.24 5.80 7.55 -0.34
HFRI Macro (Total) -1.86 -3.77 -5.22 -8.98
% Of Capture -66.73 -154.02 -144.77 3.79
Outperforms InPos. & Neg. Periods
Underperforms In Neg. PeriodsOutperforms In Pos. Periods
Underperforms In Pos. PeriodsOutperforms In Neg. Periods
Underperforms InPos. & Neg. Periods
1
2 34
Capture Ratio Trend
Three Years Rolling Alpha
Lisle Woodridge FPD Pension Fund Period Ending September 30, 2016
This report is provided for informational purposes only. The information shown was obtained from sources believed to be reliable, the accuracy of which cannot be guaranteed. Account statements provided by UBS or other financial institutions are theofficial record of your holdings, balances, transactions and security values and are not amended or superseded by any of the information presented in this report. Information is current as of the date shown. Past performance is no guarantee of futurereturns. See IMPORTANT INFORMATION at end of report for details.
69
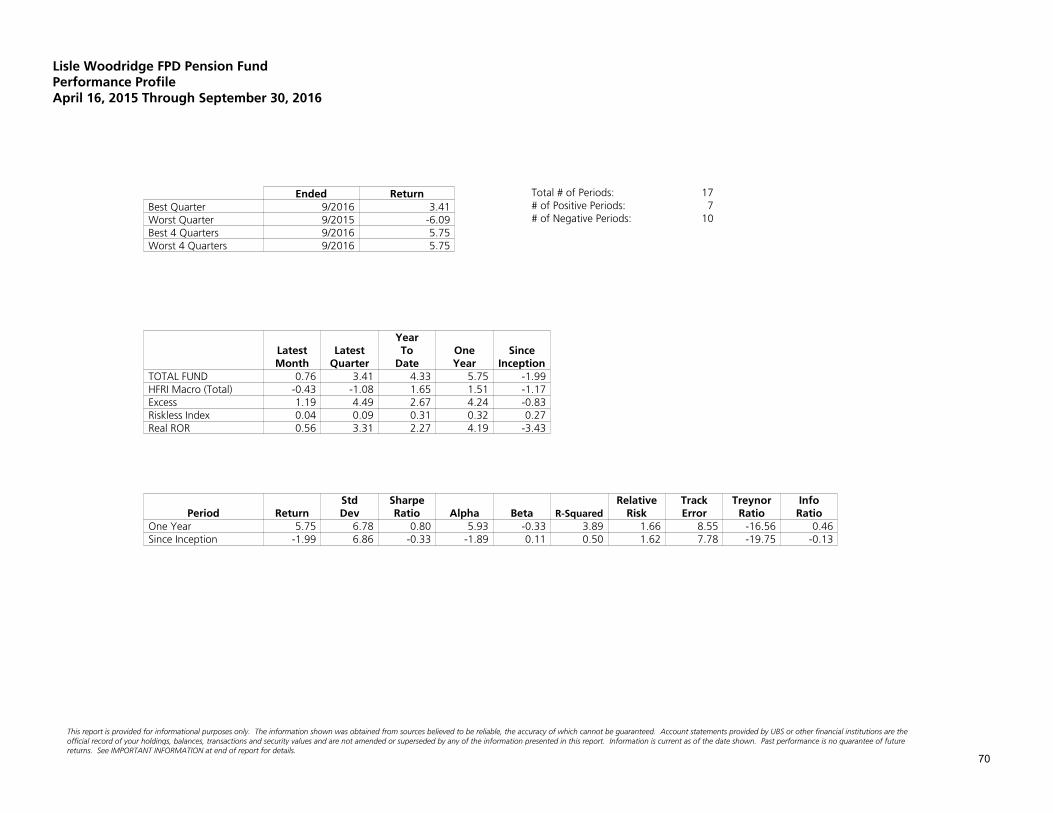
Ended ReturnBest Quarter 9/2016 3.41Worst Quarter 9/2015 -6.09Best 4 Quarters 9/2016 5.75Worst 4 Quarters 9/2016 5.75
Total # of Periods: 17# of Positive Periods: 7# of Negative Periods: 10
YearLatest Latest To One SinceMonth Quarter Date Year Inception
TOTAL FUND 0.76 3.41 4.33 5.75 -1.99HFRI Macro (Total) -0.43 -1.08 1.65 1.51 -1.17Excess 1.19 4.49 2.67 4.24 -0.83Riskless Index 0.04 0.09 0.31 0.32 0.27Real ROR 0.56 3.31 2.27 4.19 -3.43
Std Sharpe Relative Track Treynor InfoPeriod Return Dev Ratio Alpha Beta R-Squared Risk Error Ratio Ratio
One Year 5.75 6.78 0.80 5.93 -0.33 3.89 1.66 8.55 -16.56 0.46Since Inception -1.99 6.86 -0.33 -1.89 0.11 0.50 1.62 7.78 -19.75 -0.13
Lisle Woodridge FPD Pension FundPerformance ProfileApril 16, 2015 Through September 30, 2016
returns. See IMPORTANT INFORMATION at end of report for details.official record of your holdings, balances, transactions and security values and are not amended or superseded by any of the information presented in this report. Information is current as of the date shown. Past performance is no guarantee of future
This report is provided for informational purposes only. The information shown was obtained from sources believed to be reliable, the accuracy of which cannot be guaranteed. Account statements provided by UBS or other financial institutions are the
70

Prepared for:Lisle Woodridge FPD Pension FundNovember 14, 2016
Prepared by:
Investment Performance
Period Ending September 30, 2016
Bradford Marzec
Willhite Institutional Consulting Group
This report is provided for informational purposes only. The information shown was obtained from sources believed to be reliable, the accuracy of which cannot be guaranteed. Account statements provided by UBS or other financial institutions are theofficial record of your holdings, balances, transactions and security values and are not amended or superseded by any of the information presented in this report. Information is current as of the date shown. Past performance is no guarantee of futurereturns. See IMPORTANT INFORMATION at end of report for details.
71

Standard Deviation3.002.001.000.00
Rate of Return (%)
7.00
6.00
5.00
4.00
3.00
2.00
1.00
0.00
Return Sharpe Ratio Std Dev Alpha Beta R-Squared Info Ratio
Bradford Marzec 6.74 2.53 2.54 1.31 0.91 95.59 1.45
Barclays Govt/Credit
Barclays Treas Bill
Bradford Marzec
More ReturnLess Risk
More ReturnMore Risk
Less ReturnLess Risk
Less ReturnMore Risk
Standard Deviation3.002.001.000.00
Rate of Return (%)
5.00
4.00
3.00
2.00
1.00
0.00
Return Sharpe Ratio Std Dev Alpha Beta R-Squared Info Ratio
Bradford Marzec 4.56 1.60 2.68 0.93 0.94 96.77 1.42
Barclays Govt/Credit
Barclays Treas Bill
Bradford Marzec
More ReturnLess Risk
More ReturnMore Risk
Less ReturnLess Risk
Less ReturnMore Risk
8.97
7.48
5.98
4.49
2.99
1.50
Return Highest Value 7.88 First Quartile 5.55 Median Value 4.26 Third Quartile 3.75 Lowest Value 2.54 Mean 4.62
Value Rank Bradford Marzec 6.74 4 Barclays Govt/Credit 5.86 16
2.99
1.99
1.00
0.00
-1.00
Alpha 3.04 1.40 0.78 0.27 -0.51 0.91
Value Rank 1.31 28 0.00 85
0.99
0.79
0.60
0.40
0.20
Beta 0.29 0.49 0.64 0.74 0.94 0.62
Value Rank 0.91 1 1.00 1
3.61
3.01
2.41
1.81
1.20
Std Dev 3.38 2.25 1.91 1.65 1.23 1.96
Value Rank 2.54 8 2.72 4
110.94
92.45
73.96
55.47
36.98
R-Squared 97.59 92.08 82.68 62.54 33.96 75.47
Value Rank 95.59 8 100.00 1
3.36
2.88
2.40
1.92
1.44
Sharpe Ratio 3.11 2.45 2.20 1.98 1.40 2.21
Value Rank 2.53 19 2.04 69
Risk vs Reward
Multi-Statistic Quartile Chart - One Year
One Year Since Inception
Comparison Universe: Intermediate Investment Grade
Bradford Marzec Period Ending September 30, 2016
This report is provided for informational purposes only. The information shown was obtained from sources believed to be reliable, the accuracy of which cannot be guaranteed. Account statements provided by UBS or other financial institutions are theofficial record of your holdings, balances, transactions and security values and are not amended or superseded by any of the information presented in this report. Information is current as of the date shown. Past performance is no guarantee of futurereturns. See IMPORTANT INFORMATION at end of report for details.
72

Downside Capture Ratio (%)13012512011511010510095908580757065605550454035302520151050-5-10-15-20-25
Upside Cap
ture Ratio (%
)
140
130
120
110
100
90
80
70
60
50
40
30
20
10
0
1 2 3 4
6/2016-9/2016 12/2015-9/2016 9/2015-9/2016 4/2015-9/2016
Up Periods 1.00 6.00 7.00 9.00
Upside Capture ROR 0.99 7.16 7.22 8.78
Barclays Govt/Credit 0.80 7.10 7.10 8.64
% Of Capture 124.24 100.91 101.66 101.71
Down Periods 2.00 3.00 5.00 8.00
Downside Capture ROR -0.20 0.04 -0.44 -2.08
Barclays Govt/Credit -0.39 -0.41 -1.16 -2.94
% Of Capture 50.30 -8.63 38.23 70.98
Outperforms InPos. & Neg. Periods
Underperforms In Neg. PeriodsOutperforms In Pos. Periods
Underperforms In Pos. PeriodsOutperforms In Neg. Periods
Underperforms InPos. & Neg. Periods
1
2 3 4
Capture Ratio Trend
Three Years Rolling Alpha
Lisle Woodridge FPD Pension Fund Period Ending September 30, 2016
This report is provided for informational purposes only. The information shown was obtained from sources believed to be reliable, the accuracy of which cannot be guaranteed. Account statements provided by UBS or other financial institutions are theofficial record of your holdings, balances, transactions and security values and are not amended or superseded by any of the information presented in this report. Information is current as of the date shown. Past performance is no guarantee of futurereturns. See IMPORTANT INFORMATION at end of report for details.
73

Ended ReturnBest Quarter 3/2016 3.30Worst Quarter 12/2015 -0.42Best 4 Quarters 9/2016 6.74Worst 4 Quarters 9/2016 6.74
Total # of Periods: 17# of Positive Periods: 11# of Negative Periods: 6
YearLatest Latest To One SinceMonth Quarter Date Year Inception
TOTAL FUND -0.25 0.79 7.20 6.74 4.56Barclays Govt/Credit -0.19 0.40 6.66 5.86 3.82Excess -0.06 0.39 0.54 0.88 0.74Riskless Index 0.04 0.09 0.31 0.32 0.27Real ROR -0.45 0.69 5.09 5.17 3.02
Std Sharpe Relative Track Treynor InfoPeriod Return Dev Ratio Alpha Beta R-Squared Risk Error Ratio Ratio
One Year 6.74 2.54 2.53 1.31 0.91 95.59 0.93 0.57 7.06 1.45Since Inception 4.56 2.68 1.60 0.93 0.94 96.77 0.96 0.50 4.57 1.42
Lisle Woodridge FPD Pension FundPerformance ProfileApril 9, 2015 Through September 30, 2016
returns. See IMPORTANT INFORMATION at end of report for details.official record of your holdings, balances, transactions and security values and are not amended or superseded by any of the information presented in this report. Information is current as of the date shown. Past performance is no guarantee of future
This report is provided for informational purposes only. The information shown was obtained from sources believed to be reliable, the accuracy of which cannot be guaranteed. Account statements provided by UBS or other financial institutions are the
74

Please contact your UBS Institutional Consultant if you have any questions regarding this report, if your financial situation, individualneeds or investment objectives have changed, or if you would like to initiate or modify any investment restrictions on this account.Please note that you are also required to inform your Institutional Consultant, directly, of any changes in your financial condition,investment objectives or investment restrictions on your account.
Prepared for:Lisle Woodridge FPD Pension FundNovember 14, 2016
Prepared by:
Investment Performance
Period Ending September 30, 2016
PIA Fixed Income
Willhite Institutional Consulting Group
This report is provided for informational purposes only. The information shown was obtained from sources believed to be reliable, the accuracy of which cannot be guaranteed. Account statements provided by UBS or other financial institutions are theofficial record of your holdings, balances, transactions and security values and are not amended or superseded by any of the information presented in this report. Information is current as of the date shown. Past performance is no guarantee of futurereturns. See IMPORTANT INFORMATION at end of report for details.
75
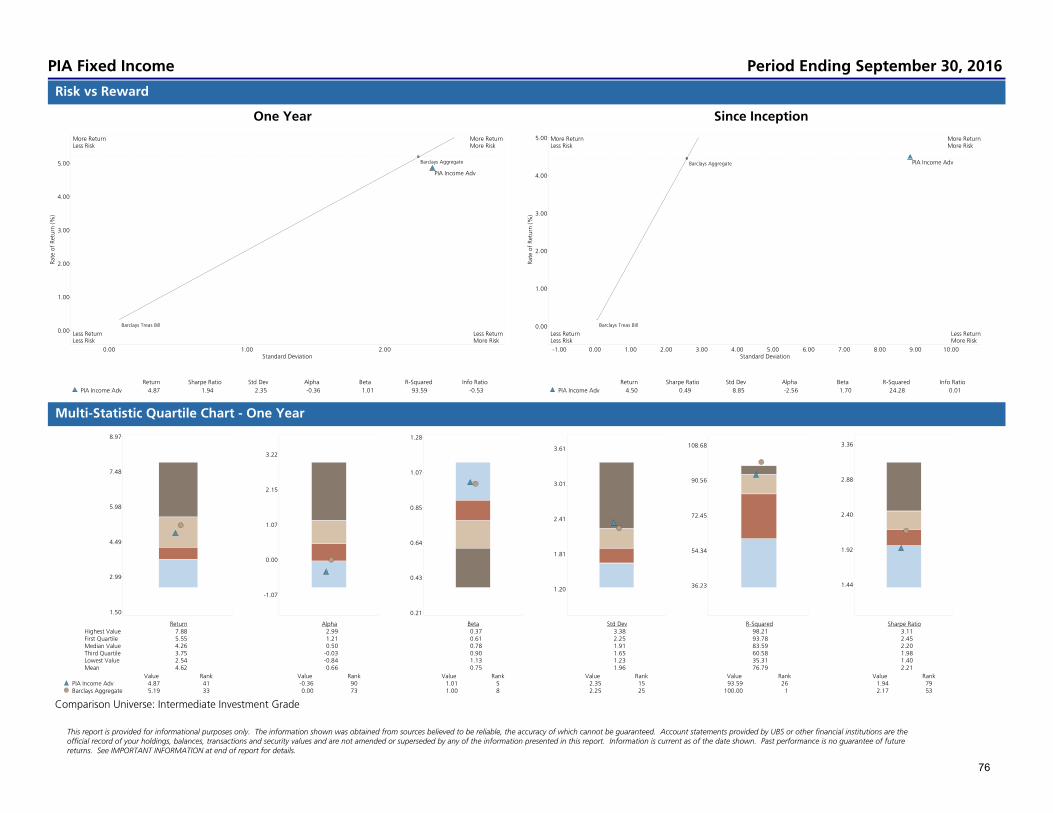
Standard Deviation2.001.000.00
Rate of Return (%)
5.00
4.00
3.00
2.00
1.00
0.00
Return Sharpe Ratio Std Dev Alpha Beta R-Squared Info Ratio
PIA Income Adv 4.87 1.94 2.35 -0.36 1.01 93.59 -0.53
Barclays Aggregate
Barclays Treas Bill
PIA Income Adv
More ReturnLess Risk
More ReturnMore Risk
Less ReturnLess Risk
Less ReturnMore Risk
Standard Deviation10.009.008.007.006.005.004.003.002.001.000.00-1.00
Rate of Return (%)
5.00
4.00
3.00
2.00
1.00
0.00
Return Sharpe Ratio Std Dev Alpha Beta R-Squared Info Ratio
PIA Income Adv 4.50 0.49 8.85 -2.56 1.70 24.28 0.01
Barclays Aggregate
Barclays Treas Bill
PIA Income Adv
More ReturnLess Risk
More ReturnMore Risk
Less ReturnLess Risk
Less ReturnMore Risk
8.97
7.48
5.98
4.49
2.99
1.50
Return Highest Value 7.88 First Quartile 5.55 Median Value 4.26 Third Quartile 3.75 Lowest Value 2.54 Mean 4.62
Value Rank PIA Income Adv 4.87 41 Barclays Aggregate 5.19 33
3.22
2.15
1.07
0.00
-1.07
Alpha 2.99 1.21 0.50 -0.03 -0.84 0.66
Value Rank -0.36 90 0.00 73
1.28
1.07
0.85
0.64
0.43
0.21
Beta 0.37 0.61 0.78 0.90 1.13 0.75
Value Rank 1.01 5 1.00 8
3.61
3.01
2.41
1.81
1.20
Std Dev 3.38 2.25 1.91 1.65 1.23 1.96
Value Rank 2.35 15 2.25 25
108.68
90.56
72.45
54.34
36.23
R-Squared 98.21 93.78 83.59 60.58 35.31 76.79
Value Rank 93.59 26 100.00 1
3.36
2.88
2.40
1.92
1.44
Sharpe Ratio 3.11 2.45 2.20 1.98 1.40 2.21
Value Rank 1.94 79 2.17 53
Risk vs Reward
Multi-Statistic Quartile Chart - One Year
One Year Since Inception
Comparison Universe: Intermediate Investment Grade
PIA Fixed Income Period Ending September 30, 2016
This report is provided for informational purposes only. The information shown was obtained from sources believed to be reliable, the accuracy of which cannot be guaranteed. Account statements provided by UBS or other financial institutions are theofficial record of your holdings, balances, transactions and security values and are not amended or superseded by any of the information presented in this report. Information is current as of the date shown. Past performance is no guarantee of futurereturns. See IMPORTANT INFORMATION at end of report for details.
76
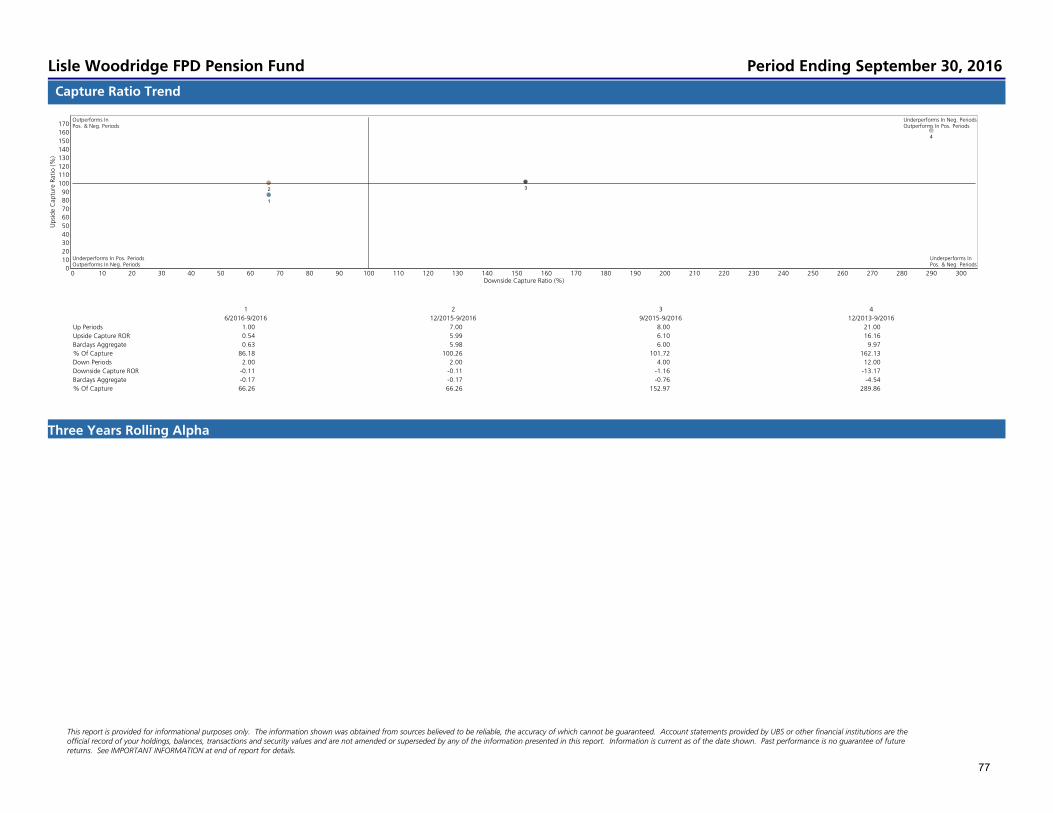
Downside Capture Ratio (%)3002902802702602502402302202102001901801701601501401301201101009080706050403020100
Upside Cap
ture Ratio (%
)
170
160
150
140
130
120
110
100
90
80
70
60
50
40
30
20
10
0
1 2 3 4
6/2016-9/2016 12/2015-9/2016 9/2015-9/2016 12/2013-9/2016
Up Periods 1.00 7.00 8.00 21.00
Upside Capture ROR 0.54 5.99 6.10 16.16
Barclays Aggregate 0.63 5.98 6.00 9.97
% Of Capture 86.18 100.26 101.72 162.13
Down Periods 2.00 2.00 4.00 12.00
Downside Capture ROR -0.11 -0.11 -1.16 -13.17
Barclays Aggregate -0.17 -0.17 -0.76 -4.54
% Of Capture 66.26 66.26 152.97 289.86
Outperforms InPos. & Neg. Periods
Underperforms In Neg. PeriodsOutperforms In Pos. Periods
Underperforms In Pos. PeriodsOutperforms In Neg. Periods
Underperforms InPos. & Neg. Periods
1
2 3
4
Capture Ratio Trend
Three Years Rolling Alpha
Lisle Woodridge FPD Pension Fund Period Ending September 30, 2016
This report is provided for informational purposes only. The information shown was obtained from sources believed to be reliable, the accuracy of which cannot be guaranteed. Account statements provided by UBS or other financial institutions are theofficial record of your holdings, balances, transactions and security values and are not amended or superseded by any of the information presented in this report. Information is current as of the date shown. Past performance is no guarantee of futurereturns. See IMPORTANT INFORMATION at end of report for details.
77

Ended ReturnBest Quarter 3/2016 3.09Worst Quarter 6/2015 -1.35Best 4 Quarters 9/2016 4.87Worst 4 Quarters 9/2015 3.12
Total # of Periods: 33# of Positive Periods: 22# of Negative Periods: 11
YearLatest Latest To One Two SinceMonth Quarter Date Year Years Inception
TOTAL FUND 0.12 0.43 5.87 4.87 3.99 4.50Barclays Aggregate -0.06 0.46 5.80 5.19 4.06 4.45Excess 0.18 -0.03 0.08 -0.32 -0.07 0.04Riskless Index 0.04 0.09 0.31 0.32 0.21 0.17Real ROR -0.08 0.33 3.79 3.32 3.25 3.16
Std Sharpe Relative Track Treynor InfoPeriod Return Dev Ratio Alpha Beta R-Squared Risk Error Ratio Ratio
One Year 4.87 2.35 1.94 -0.36 1.01 93.59 1.04 0.58 4.50 -0.53Two Years 3.99 2.64 1.43 -0.01 0.98 96.19 1.00 0.51 3.84 -0.14Since Inception 4.50 8.85 0.49 -2.56 1.70 24.28 3.43 7.90 2.54 0.01
Lisle Woodridge FPD Pension FundPerformance ProfileDecember 31, 2013 Through September 30, 2016
returns. See IMPORTANT INFORMATION at end of report for details.official record of your holdings, balances, transactions and security values and are not amended or superseded by any of the information presented in this report. Information is current as of the date shown. Past performance is no guarantee of future
This report is provided for informational purposes only. The information shown was obtained from sources believed to be reliable, the accuracy of which cannot be guaranteed. Account statements provided by UBS or other financial institutions are the
78

Prepared for:Lisle Woodridge FPD Pension FundNovember 14, 2016
Prepared by:
Investment Performance
Period Ending September 30, 2016
BlackRock Strategic Income Opportunities
Willhite Institutional Consulting Group
This report is provided for informational purposes only. The information shown was obtained from sources believed to be reliable, the accuracy of which cannot be guaranteed. Account statements provided by UBS or other financial institutions are theofficial record of your holdings, balances, transactions and security values and are not amended or superseded by any of the information presented in this report. Information is current as of the date shown. Past performance is no guarantee of futurereturns. See IMPORTANT INFORMATION at end of report for details.
79
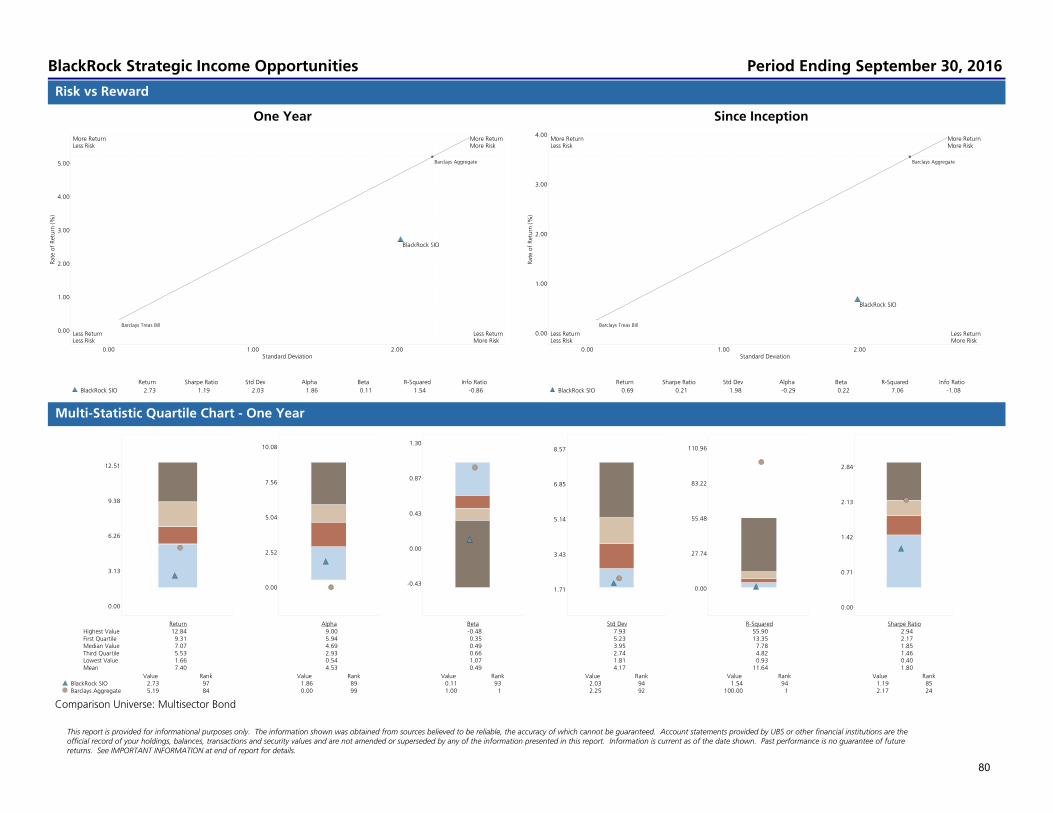
Standard Deviation2.001.000.00
Rate of Return (%)
5.00
4.00
3.00
2.00
1.00
0.00
Return Sharpe Ratio Std Dev Alpha Beta R-Squared Info Ratio
BlackRock SIO 2.73 1.19 2.03 1.86 0.11 1.54 -0.86
Barclays Aggregate
Barclays Treas Bill
BlackRock SIO
More ReturnLess Risk
More ReturnMore Risk
Less ReturnLess Risk
Less ReturnMore Risk
Standard Deviation2.001.000.00
Rate of Return (%)
4.00
3.00
2.00
1.00
0.00
Return Sharpe Ratio Std Dev Alpha Beta R-Squared Info Ratio
BlackRock SIO 0.69 0.21 1.98 -0.29 0.22 7.06 -1.08
Barclays Aggregate
Barclays Treas Bill
BlackRock SIO
More ReturnLess Risk
More ReturnMore Risk
Less ReturnLess Risk
Less ReturnMore Risk
12.51
9.38
6.26
3.13
0.00
Return Highest Value 12.84 First Quartile 9.31 Median Value 7.07 Third Quartile 5.53 Lowest Value 1.66 Mean 7.40
Value Rank BlackRock SIO 2.73 97 Barclays Aggregate 5.19 84
10.08
7.56
5.04
2.52
0.00
Alpha 9.00 5.94 4.69 2.93 0.54 4.53
Value Rank 1.86 89 0.00 99
1.30
0.87
0.43
0.00
-0.43
Beta -0.48 0.35 0.49 0.66 1.07 0.49
Value Rank 0.11 93 1.00 1
8.57
6.85
5.14
3.43
1.71
Std Dev 7.93 5.23 3.95 2.74 1.81 4.17
Value Rank 2.03 94 2.25 92
110.96
83.22
55.48
27.74
0.00
R-Squared 55.90 13.35 7.78 4.82 0.93 11.64
Value Rank 1.54 94 100.00 1
2.84
2.13
1.42
0.71
0.00
Sharpe Ratio 2.94 2.17 1.85 1.46 0.40 1.80
Value Rank 1.19 85 2.17 24
Risk vs Reward
Multi-Statistic Quartile Chart - One Year
One Year Since Inception
Comparison Universe: Multisector Bond
BlackRock Strategic Income Opportunities Period Ending September 30, 2016
This report is provided for informational purposes only. The information shown was obtained from sources believed to be reliable, the accuracy of which cannot be guaranteed. Account statements provided by UBS or other financial institutions are theofficial record of your holdings, balances, transactions and security values and are not amended or superseded by any of the information presented in this report. Information is current as of the date shown. Past performance is no guarantee of futurereturns. See IMPORTANT INFORMATION at end of report for details.
80

Downside Capture Ratio (%)100500-50-100-150-200-250-300-350-400
Upside Cap
ture Ratio (%
)
200
150
100
50
0
1 2 3 4
6/2016-9/2016 12/2015-9/2016 9/2015-9/2016 4/2015-9/2016
Up Periods 1.00 7.00 8.00 10.00
Upside Capture ROR 1.25 2.24 2.81 2.25
Barclays Aggregate 0.63 5.98 6.00 7.46
% Of Capture 198.14 37.55 46.93 30.19
Down Periods 2.00 2.00 4.00 7.00
Downside Capture ROR 0.63 0.63 -0.08 -1.25
Barclays Aggregate -0.17 -0.17 -0.76 -2.22
% Of Capture -366.14 -366.14 11.04 56.18
Outperforms InPos. & Neg. Periods
Underperforms In Neg. PeriodsOutperforms In Pos. Periods
Underperforms In Pos. PeriodsOutperforms In Neg. Periods
Underperforms InPos. & Neg. Periods
1
2
3
4
Capture Ratio Trend
Three Years Rolling Alpha
Lisle Woodridge FPD Pension Fund Period Ending September 30, 2016
This report is provided for informational purposes only. The information shown was obtained from sources believed to be reliable, the accuracy of which cannot be guaranteed. Account statements provided by UBS or other financial institutions are theofficial record of your holdings, balances, transactions and security values and are not amended or superseded by any of the information presented in this report. Information is current as of the date shown. Past performance is no guarantee of futurereturns. See IMPORTANT INFORMATION at end of report for details.
81
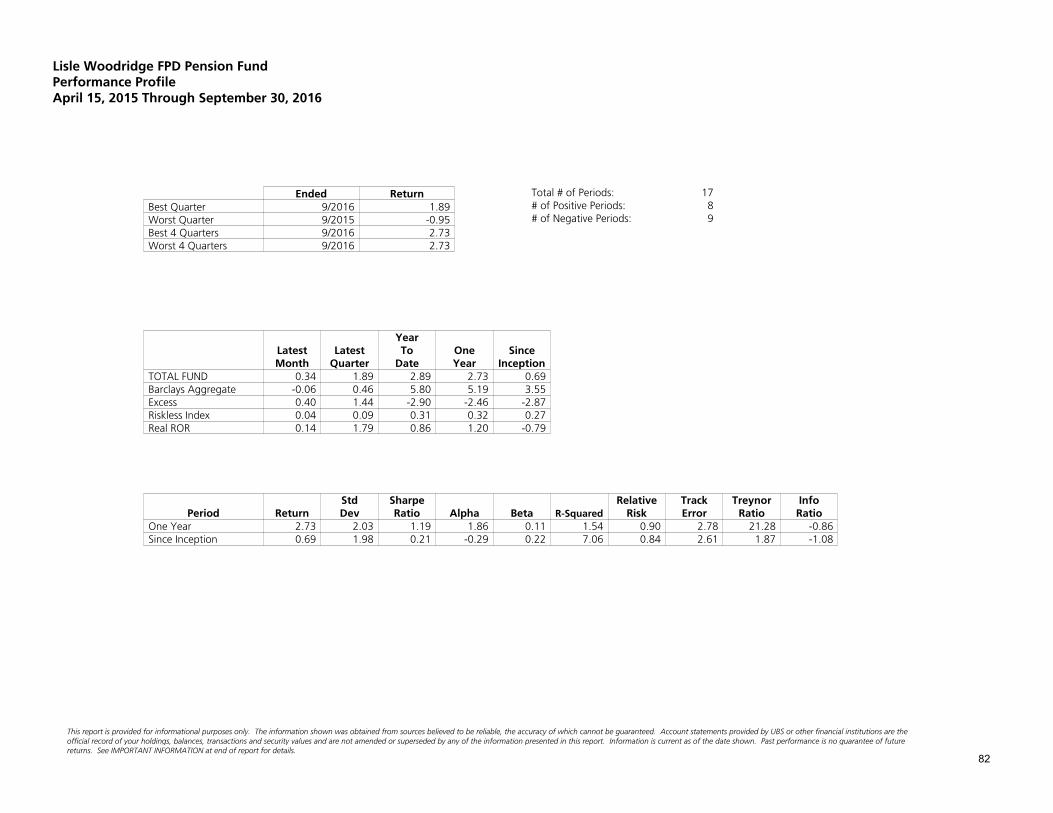
Ended ReturnBest Quarter 9/2016 1.89Worst Quarter 9/2015 -0.95Best 4 Quarters 9/2016 2.73Worst 4 Quarters 9/2016 2.73
Total # of Periods: 17# of Positive Periods: 8# of Negative Periods: 9
YearLatest Latest To One SinceMonth Quarter Date Year Inception
TOTAL FUND 0.34 1.89 2.89 2.73 0.69Barclays Aggregate -0.06 0.46 5.80 5.19 3.55Excess 0.40 1.44 -2.90 -2.46 -2.87Riskless Index 0.04 0.09 0.31 0.32 0.27Real ROR 0.14 1.79 0.86 1.20 -0.79
Std Sharpe Relative Track Treynor InfoPeriod Return Dev Ratio Alpha Beta R-Squared Risk Error Ratio Ratio
One Year 2.73 2.03 1.19 1.86 0.11 1.54 0.90 2.78 21.28 -0.86Since Inception 0.69 1.98 0.21 -0.29 0.22 7.06 0.84 2.61 1.87 -1.08
Lisle Woodridge FPD Pension FundPerformance ProfileApril 15, 2015 Through September 30, 2016
returns. See IMPORTANT INFORMATION at end of report for details.official record of your holdings, balances, transactions and security values and are not amended or superseded by any of the information presented in this report. Information is current as of the date shown. Past performance is no guarantee of future
This report is provided for informational purposes only. The information shown was obtained from sources believed to be reliable, the accuracy of which cannot be guaranteed. Account statements provided by UBS or other financial institutions are the
82
Prepared for:Lisle Woodridge FPD Pension FundNovember 14, 2016
Prepared by:
Investment Performance
Period Ending September 30, 2016
Pioneer Strategic Income Opportunities
Willhite Institutional Consulting Group
This report is provided for informational purposes only. The information shown was obtained from sources believed to be reliable, the accuracy of which cannot be guaranteed. Account statements provided by UBS or other financial institutions are theofficial record of your holdings, balances, transactions and security values and are not amended or superseded by any of the information presented in this report. Information is current as of the date shown. Past performance is no guarantee of futurereturns. See IMPORTANT INFORMATION at end of report for details.
83

Standard Deviation4.003.002.001.000.00
Rate of Return (%)
9.00
8.00
7.00
6.00
5.00
4.00
3.00
2.00
1.00
0.00
Return Sharpe Ratio Std Dev Alpha Beta R-Squared Info Ratio
Pioneer SIO 8.19 2.14 3.68 5.46 0.46 7.60 0.77
Barclays Aggregate
Barclays Treas Bill
Pioneer SIO
More ReturnLess Risk
More ReturnMore Risk
Less ReturnLess Risk
Less ReturnMore Risk
Standard Deviation4.003.002.001.000.00
Rate of Return (%)
4.00
3.00
2.00
1.00
0.00
Return Sharpe Ratio Std Dev Alpha Beta R-Squared Info Ratio
Pioneer SIO 4.01 1.02 3.66 1.85 0.58 13.81 0.12
Barclays Aggregate
Barclays Treas Bill
Pioneer SIO
More ReturnLess Risk
More ReturnMore Risk
Less ReturnLess Risk
Less ReturnMore Risk
12.51
9.38
6.26
3.13
0.00
Return Highest Value 12.84 First Quartile 9.31 Median Value 7.07 Third Quartile 5.53 Lowest Value 1.66 Mean 7.40
Value Rank Pioneer SIO 8.19 36 Barclays Aggregate 5.19 84
10.08
7.56
5.04
2.52
0.00
Alpha 9.00 5.94 4.69 2.93 0.54 4.53
Value Rank 5.46 32 0.00 99
1.30
0.87
0.43
0.00
-0.43
Beta -0.48 0.35 0.49 0.66 1.07 0.49
Value Rank 0.46 57 1.00 1
8.57
6.85
5.14
3.43
1.71
Std Dev 7.93 5.23 3.95 2.74 1.81 4.17
Value Rank 3.68 61 2.25 92
110.96
83.22
55.48
27.74
0.00
R-Squared 55.90 13.35 7.78 4.82 0.93 11.64
Value Rank 7.60 51 100.00 1
2.84
2.13
1.42
0.71
0.00
Sharpe Ratio 2.94 2.17 1.85 1.46 0.40 1.80
Value Rank 2.14 26 2.17 24
Risk vs Reward
Multi-Statistic Quartile Chart - One Year
One Year Since Inception
Comparison Universe: Multisector Bond
Pioneer Strategic Income Opportunities Period Ending September 30, 2016
This report is provided for informational purposes only. The information shown was obtained from sources believed to be reliable, the accuracy of which cannot be guaranteed. Account statements provided by UBS or other financial institutions are theofficial record of your holdings, balances, transactions and security values and are not amended or superseded by any of the information presented in this report. Information is current as of the date shown. Past performance is no guarantee of futurereturns. See IMPORTANT INFORMATION at end of report for details.
84

Downside Capture Ratio (%)100500-50-100-150-200-250-300-350-400-450-500-550-600-650-700-750-800-850
Upside Cap
ture Ratio (%
)
250
200
150
100
50
0
1 2 3 4
6/2016-9/2016 12/2015-9/2016 9/2015-9/2016 4/2015-9/2016
Up Periods 1.00 7.00 8.00 10.00
Upside Capture ROR 1.64 7.37 8.44 7.68
Barclays Aggregate 0.63 5.98 6.00 7.46
% Of Capture 258.96 123.31 140.77 102.96
Down Periods 2.00 2.00 4.00 7.00
Downside Capture ROR 1.28 1.28 -0.23 -1.81
Barclays Aggregate -0.17 -0.17 -0.76 -2.22
% Of Capture -739.25 -739.25 30.29 81.48
Outperforms InPos. & Neg. Periods
Underperforms In Neg. PeriodsOutperforms In Pos. Periods
Underperforms In Pos. PeriodsOutperforms In Neg. Periods
Underperforms InPos. & Neg. Periods
1
2
3
4
Capture Ratio Trend
Three Years Rolling Alpha
Lisle Woodridge FPD Pension Fund Period Ending September 30, 2016
This report is provided for informational purposes only. The information shown was obtained from sources believed to be reliable, the accuracy of which cannot be guaranteed. Account statements provided by UBS or other financial institutions are theofficial record of your holdings, balances, transactions and security values and are not amended or superseded by any of the information presented in this report. Information is current as of the date shown. Past performance is no guarantee of futurereturns. See IMPORTANT INFORMATION at end of report for details.
85
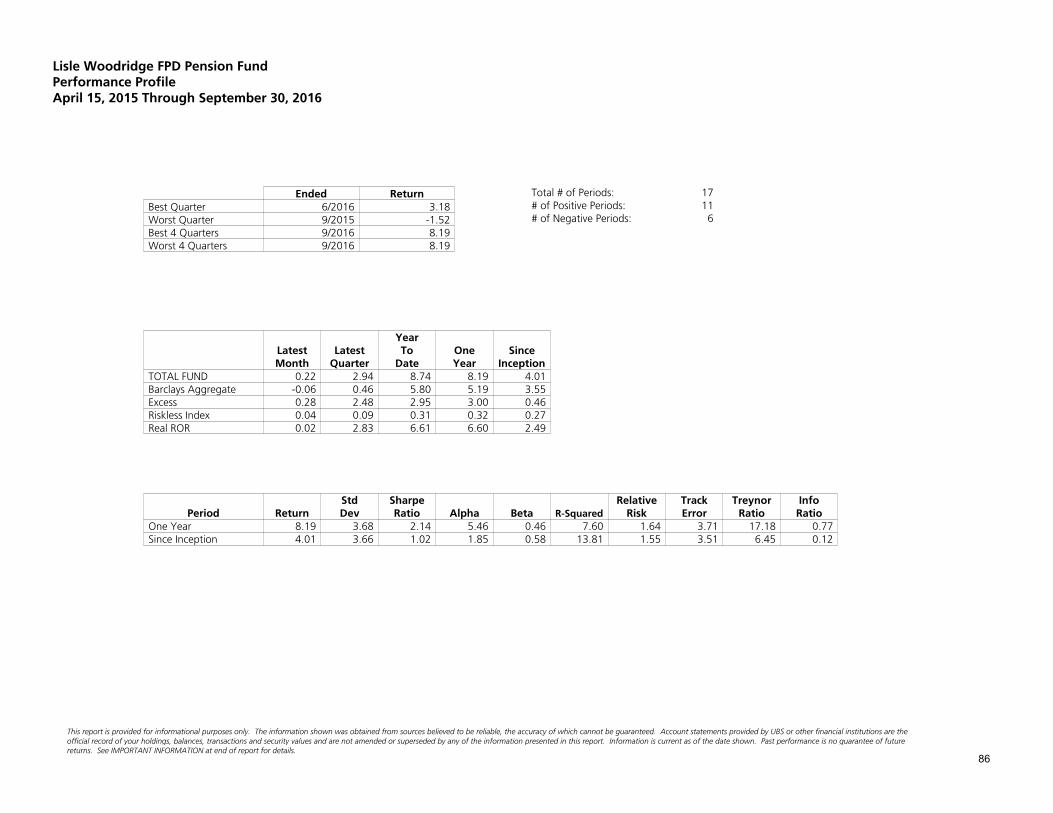
Ended ReturnBest Quarter 6/2016 3.18Worst Quarter 9/2015 -1.52Best 4 Quarters 9/2016 8.19Worst 4 Quarters 9/2016 8.19
Total # of Periods: 17# of Positive Periods: 11# of Negative Periods: 6
YearLatest Latest To One SinceMonth Quarter Date Year Inception
TOTAL FUND 0.22 2.94 8.74 8.19 4.01Barclays Aggregate -0.06 0.46 5.80 5.19 3.55Excess 0.28 2.48 2.95 3.00 0.46Riskless Index 0.04 0.09 0.31 0.32 0.27Real ROR 0.02 2.83 6.61 6.60 2.49
Std Sharpe Relative Track Treynor InfoPeriod Return Dev Ratio Alpha Beta R-Squared Risk Error Ratio Ratio
One Year 8.19 3.68 2.14 5.46 0.46 7.60 1.64 3.71 17.18 0.77Since Inception 4.01 3.66 1.02 1.85 0.58 13.81 1.55 3.51 6.45 0.12
Lisle Woodridge FPD Pension FundPerformance ProfileApril 15, 2015 Through September 30, 2016
returns. See IMPORTANT INFORMATION at end of report for details.official record of your holdings, balances, transactions and security values and are not amended or superseded by any of the information presented in this report. Information is current as of the date shown. Past performance is no guarantee of future
This report is provided for informational purposes only. The information shown was obtained from sources believed to be reliable, the accuracy of which cannot be guaranteed. Account statements provided by UBS or other financial institutions are the
86
Please contact your UBS Institutional Consultant if you have any questions regarding this report, if your financial situation, individualneeds or investment objectives have changed, or if you would like to initiate or modify any investment restrictions on this account.Please note that you are also required to inform your Institutional Consultant, directly, of any changes in your financial condition,investment objectives or investment restrictions on your account.
Prepared for:Lisle Woodridge FPD Pension FundNovember 14, 2016
Prepared by:
Investment Performance
Period Ending September 30, 2016
UBS Cash Account
Willhite Institutional Consulting Group
This report is provided for informational purposes only. The information shown was obtained from sources believed to be reliable, the accuracy of which cannot be guaranteed. Account statements provided by UBS or other financial institutions are theofficial record of your holdings, balances, transactions and security values and are not amended or superseded by any of the information presented in this report. Information is current as of the date shown. Past performance is no guarantee of futurereturns. See IMPORTANT INFORMATION at end of report for details.
87
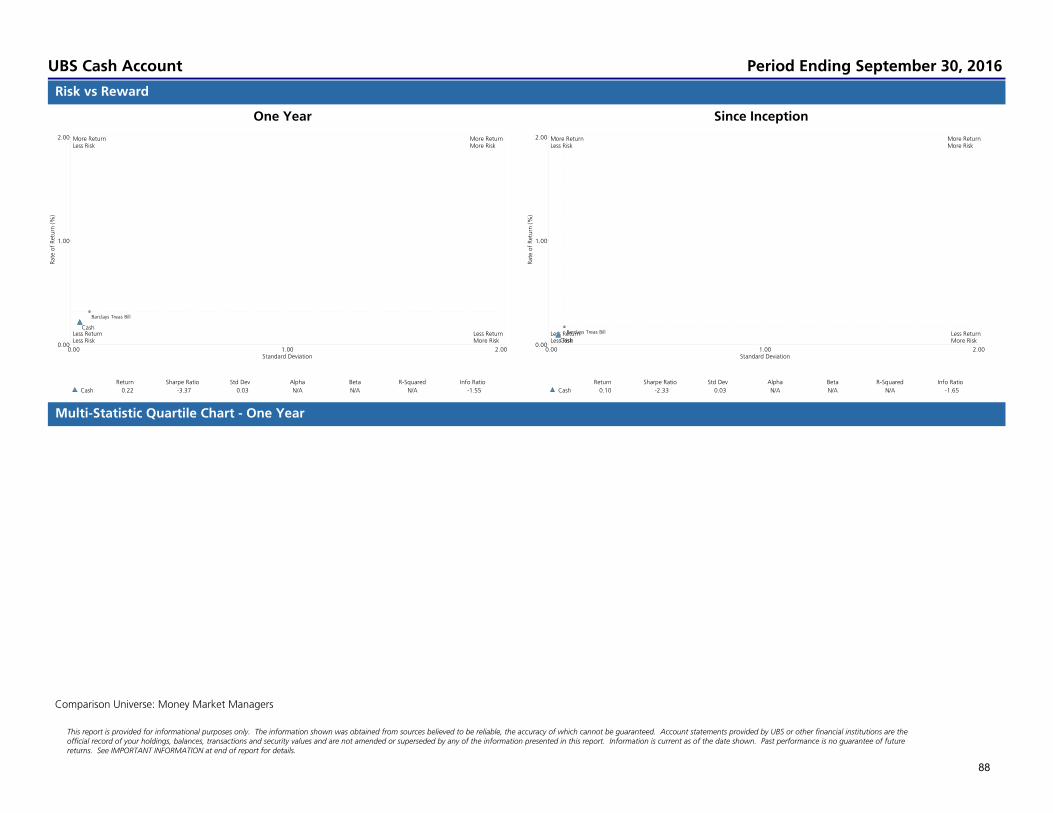
Standard Deviation2.001.000.00
Rate of Return (%)
2.00
1.00
0.00
Return Sharpe Ratio Std Dev Alpha Beta R-Squared Info Ratio
Cash 0.22 -3.37 0.03 N/A N/A N/A -1.55
Barclays Treas Bill
Cash
More ReturnLess Risk
More ReturnMore Risk
Less ReturnLess Risk
Less ReturnMore Risk
Standard Deviation2.001.000.00
Rate of Return (%)
2.00
1.00
0.00
Return Sharpe Ratio Std Dev Alpha Beta R-Squared Info Ratio
Cash 0.10 -2.33 0.03 N/A N/A N/A -1.65
Barclays Treas Bill
Cash
More ReturnLess Risk
More ReturnMore Risk
Less ReturnLess Risk
Less ReturnMore Risk
Risk vs Reward
Multi-Statistic Quartile Chart - One Year
One Year Since Inception
Comparison Universe: Money Market Managers
UBS Cash Account Period Ending September 30, 2016
This report is provided for informational purposes only. The information shown was obtained from sources believed to be reliable, the accuracy of which cannot be guaranteed. Account statements provided by UBS or other financial institutions are theofficial record of your holdings, balances, transactions and security values and are not amended or superseded by any of the information presented in this report. Information is current as of the date shown. Past performance is no guarantee of futurereturns. See IMPORTANT INFORMATION at end of report for details.
88
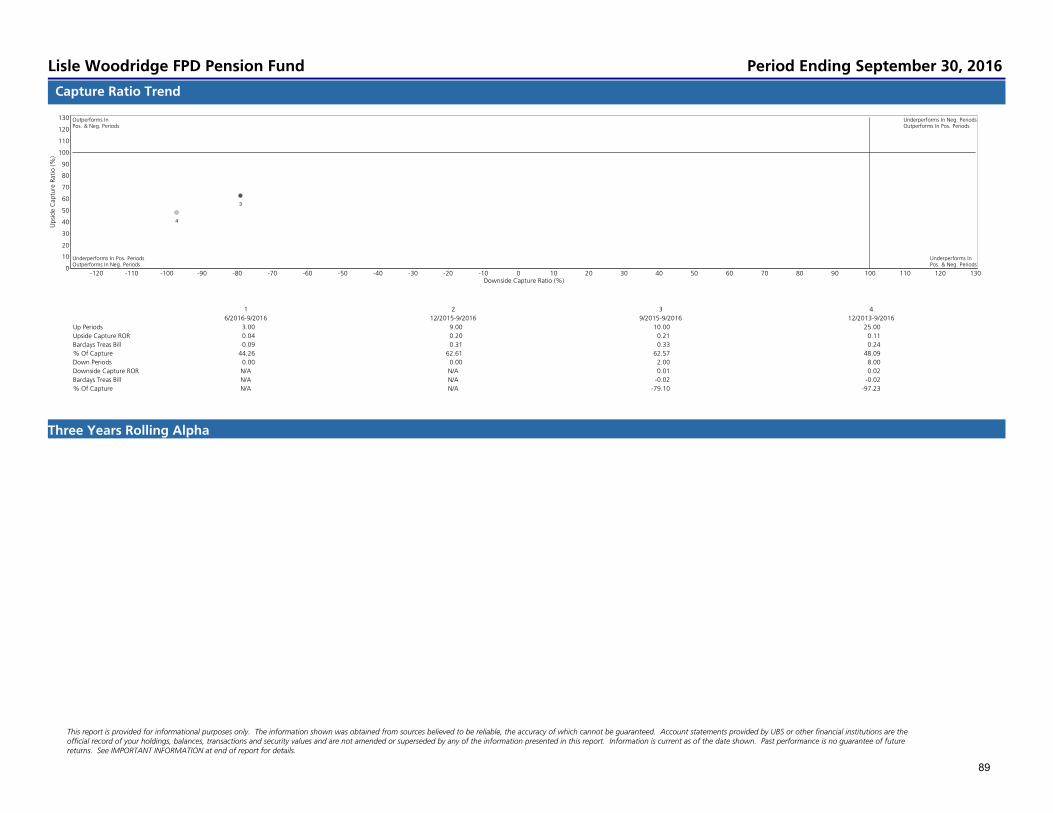
Downside Capture Ratio (%)1301201101009080706050403020100-10-20-30-40-50-60-70-80-90-100-110-120
Upside Cap
ture Ratio (%
)
130
120
110
100
90
80
70
60
50
40
30
20
10
0
1 2 3 4
6/2016-9/2016 12/2015-9/2016 9/2015-9/2016 12/2013-9/2016
Up Periods 3.00 9.00 10.00 25.00
Upside Capture ROR 0.04 0.20 0.21 0.11
Barclays Treas Bill 0.09 0.31 0.33 0.24
% Of Capture 44.26 62.61 62.57 48.09
Down Periods 0.00 0.00 2.00 8.00
Downside Capture ROR N/A N/A 0.01 0.02
Barclays Treas Bill N/A N/A -0.02 -0.02
% Of Capture N/A N/A -79.10 -97.23
Outperforms InPos. & Neg. Periods
Underperforms In Neg. PeriodsOutperforms In Pos. Periods
Underperforms In Pos. PeriodsOutperforms In Neg. Periods
Underperforms InPos. & Neg. Periods
3
4
Capture Ratio Trend
Three Years Rolling Alpha
Lisle Woodridge FPD Pension Fund Period Ending September 30, 2016
This report is provided for informational purposes only. The information shown was obtained from sources believed to be reliable, the accuracy of which cannot be guaranteed. Account statements provided by UBS or other financial institutions are theofficial record of your holdings, balances, transactions and security values and are not amended or superseded by any of the information presented in this report. Information is current as of the date shown. Past performance is no guarantee of futurereturns. See IMPORTANT INFORMATION at end of report for details.
89

Ended ReturnBest Quarter 6/2016 0.08Worst Quarter 3/2014 0.00Best 4 Quarters 9/2016 0.22Worst 4 Quarters 9/2015 0.03
Total # of Periods: 33# of Positive Periods: 33# of Negative Periods: 0
YearLatest Latest To One Two SinceMonth Quarter Date Year Years Inception
TOTAL FUND 0.02 0.04 0.20 0.22 0.13 0.10Barclays Treas Bill 0.04 0.09 0.31 0.32 0.21 0.17Excess -0.03 -0.05 -0.12 -0.10 -0.08 -0.08Riskless Index 0.04 0.09 0.31 0.32 0.21 0.17Real ROR -0.18 -0.06 -1.79 -1.28 -0.58 -1.18
Std Sharpe Relative Track Treynor InfoPeriod Return Dev Ratio Alpha Beta R-Squared Risk Error Ratio Ratio
One Year 0.22 0.03 -3.37 0.00 0.00 0.00 0.39 0.06 0.00 -1.55Two Years 0.13 0.03 -2.46 0.00 0.00 0.00 0.50 0.05 0.00 -1.57Since Inception 0.10 0.03 -2.33 0.00 0.00 0.00 0.53 0.05 0.00 -1.65
Lisle Woodridge FPD Pension FundPerformance ProfileDecember 31, 2013 Through September 30, 2016
returns. See IMPORTANT INFORMATION at end of report for details.official record of your holdings, balances, transactions and security values and are not amended or superseded by any of the information presented in this report. Information is current as of the date shown. Past performance is no guarantee of future
This report is provided for informational purposes only. The information shown was obtained from sources believed to be reliable, the accuracy of which cannot be guaranteed. Account statements provided by UBS or other financial institutions are the
90
IMPORTANT INFORMATION
This report is provided for informational purposes only, does not constitute an offer to buy or sell securities or investment products, does not constitute a recommendation that you buy, sell or hold securities or investment products,and is current as of the date shown. It may include information regarding your Institutional Consulting accounts held at various UBS entities including UBS Financial Services Inc., UBS Securities LLC and UBS AG (collectively, "UBS" or"UBS entities"), as well as accounts you hold at other financial institutions. Accounts included in this report are identified at the beginning of the report. Also, information may be shown for individual accounts or as one or morecombined portfolios; the accounts included in each portfolio are also identified at the beginning of the report.
Investment Monitoring: Neither UBS nor any of its employees will track or monitor specific investments you make to determine whether they complement your Investment Policy, unless the Plan has engaged UBS for such services.
Accounts and Assets Included: UBS account statements provide the official records of holdings, balances, transactions, and security values of assets held in UBS accounts and are not replaced, amended or superseded by any of theinformation presented in this report. If assets that you hold at other financial institutions are included in this report, they are being provided as part of your UBS IC Consulting Services Agreement or you have asked us to include thoseassets as an accommodation, but they are not included as part of your UBS IC Consulting Services Agreement with us. In either situation, the inclusion of those assets is based on information, including pricing and transactionalinformation, furnished to UBS. You should review the account statements and other documentation provided by other financial institutions for their record of holdings, balances, transactions, and security values of assets held in thoseaccounts, as well as notices, disclosures and other information important to you, and may also serve as a reference should questions arise regarding the accuracy of the information in this report. UBS Financial Services Inc. SIPCcoverage would only apply to those assets respectively held at UBS Financial Services Inc. You should contact your financial representative at any other financial institution where you hold an account to determine the availability ofSIPC coverage, if any. UBS has not verified and is not responsible for the accuracy or completeness of information regarding assets held at other financial institutions.
We require that you hold and purchase only eligible managed assets in your UBS advisory accounts. Please contact your UBS Institutional Consultant for a list of the eligible assets in your program. These reports may provideperformance information for eligible and ineligible assets in a fee-based program. Since ineligible assets are not considered fee-based program assets, the inclusion of such securities will distort the actual performance of your advisoryassets. As a result, the performance reflected in this report can vary substantially from the individual account performance reflected in the performance reports provided to you as part of those programs. For fee-based programs, feesare charged on the market value of eligible assets in the accounts and assessed quarterly in advance, prorated according to the number of calendar days in the billing period. Neither UBS nor your UBS Institutional Consultant will actas your investment adviser with respect to ineligible assets. The investment advisory programs and brokerage accounts we offer are separate and distinct and each is governed by different laws and separate contracts with you.
Unless you enter into a separate written contractual arrangement with UBS providing otherwise, you control the investment and reinvestment of the assets in any retirement account held with UBS and neither UBS nor your FinancialAdvisor has the authority or responsibility to act as a fiduciary or provide "investment advice" (as that term is defined in ERISA, the Internal Revenue Code or elsewhere) with respect to your assets.
Pricing of Securities: All securities held in UBS accounts are priced as of the end of the period shown unless otherwise noted and reflect the last recorded transaction of all listed securities, options and OTC NASDAQ securities, whenavailable. Less actively traded securities may be priced using a computerized valuation model and may not reflect an actual market price or value. To obtain current quotations, when available, contact your Institutional Consultant. CDprices may be derived using a computerized valuation model and therefore represent an estimated market value. Deposits or securities denominated in currencies other than U.S. dollars may be reflected at the exchange rate as of thedate of these reports. To obtain precise U.S. dollar values for these deposits or securities at a time before the date of these reports, contact your Institutional Consultant. Prices may or may not represent current or future market value.Every reasonable attempt has been made to accurately price securities; however, no warranty is made with respect to any security's price. Securities that have no readily available market value are displayed at the most recentlyobtainable price. Such pricing may affect the performance information provided in these reports. The services UBS provides to you may be based on and/or include information obtained from third-party sources. Assets held at otherfinancial institutions reflect the price provided by the respective institution or you. UBS will not independently verify pricing information obtained from third-party sources and cannot guarantee the accuracy of such third-partyinformation. If pricing is indicated as "NA", the required data for that field was not provided by the other financial institution or you; this will affect the performance information provided in these reports.
Performance Analytics: Unless otherwise noted, performance shown is based on Time Weighted Rate of Return. Periods greater than one year have been annualized, but annual performance may not represent a full calendar yeardepending on the inception date of the first account included in these reports. Standard deviations are shown only for periods of 12 months or longer. This report may reflect performance before the deduction of manager fees and itdoes reflect performance before the deduction of your UBS Institutional Consulting advisory fees. The payment of fees and expenses will reduce the performance of the account and the reduction in performance will have acumulative effect over time. The net effect of the payment of fees on the annualized performance, and the compounded or cumulative effect over time, is dependent on the amount of the fee and the account's investmentperformance. For example, an account that experiences an annual gross performance of 10% but incurs a 2.8% annual fee that is deducted quarterly on a prorated basis, will experience net annual performance of 7.1%, a reductionof 2.9% per year. Compounding will similarly affect the account's performance on a cumulative basis.
Performance information incorporates data as of the date your accounts became available for these reports, not as of your initial acquisition of a particular investment unless performance history is imported at client's request. Forreports that reflect combined account information, the Performance Start Date will be the earliest performance start date of any of the individual accounts selected for the consolidation time period. If an individual account'sperformance information is not available for a full reporting time period (month to date, quarter to date, year to date or performance to date), that account's information will only be included for the period when available. Forconsolidated accounts that include different account Performance Start Dates, the consolidated Additions/Withdrawals, Income Earned and Investment Appreciation/ Depreciation will include all activity that occurred during theconsolidated reporting time period. Accounts that hold or held insurance products will be reported on from the month end date of when insurance and annuity activity could be obtained from the carrier. To the extent that yourhistorical data contains a mixture of net and gross performance history related to manager or advisory fees, those distinctions will impact your performance reports to the extent that the different methods of reporting are blended.
Note that various factors, including unpriced securities and certain holdings, adjustments or activity may cause the results shown in this report to differ from actual performance (see the Performance Reconciliation Adjustments sectionfor detail on differences between your Custodial statement and information used to create this performance report). Note that these results may differ from other performance reports provided to you by UBS. Performance informationmay be impacted by the different ways each UBS entity or third party financial institution respectively records trade executions. Past performance is no guarantee of future results. Neither the UBS entities nor any of their respectiverepresentatives provide tax or legal advice. You must consult with your legal or tax advisors regarding your personal circumstances.
This report is provided for informational purposes only. The information shown was obtained from sources believed to be reliable, the accuracy of which cannot be guaranteed. Account statements provided by UBS or other financial institutions are theofficial record of your holdings, balances, transactions and security values and are not amended or superseded by any of the information presented in this report. Information is current as of the date shown. Past performance is no guarantee of futurereturns. See IMPORTANT INFORMATION at end of report for details.
91
Benchmark Index Information: For comparison purposes, these reports may contain a number of general broad market indices, which were selected to demonstrate the performance of broad market indicators that are readilyrecognized, rather than for direct performance comparisons, and do not reflect the performance of actual investments. Depending on your accounts' holdings and your investment objectives, these indices may not be an appropriatemeasure for comparison purposes, and are therefore presented for illustrative purposes only. The selection and use of benchmarks is not a promise or guarantee that your accounts will meet or exceed the stated benchmarks.Benchmark information is illustrative and relates to historical performance of market indexes and not the performance of actual investments. Indexes are not available for direct investment and reflect an unmanaged universe ofsecurities. Indices assume no management, custody, transaction fees or expenses that would lower the performance results, and assume reinvestment of dividends and capital gains. Information about indices is based on informationobtained from sources believed to be reliable, but no independent verification has been made. UBS does not guarantee the accuracy or completeness of any index information presented. Market index data is subject to review andrevision, and UBS reserves the right to substitute indices or display only those indices for which current updated information is available. Information regarding the indexes shown in this report can be found at the end of this report.
Risk Considerations: Some of the general risk considerations associated with the investment options included in this report are described below. The descriptions are not meant to be a complete list of all investment risks. For morecomplete information regarding fees, expenses, risks and restrictions associated with these investments please review the offering documents and marketing materials. Investors should consult their tax advisor about their specific taxsituation before investing in any securities. In addition, clients should familiarize themselves with the particular market risks and the other risks associated with the specific investment.All investments contain risk and may lose value.
Offshore Funds: Offshore mutual funds are not registered with the Securities and Exchange Commission and may not be sold to any person who is a citizen or resident of the United States.
Alternative Investments: Non-traditional asset classes are alternative investments that include hedge funds, private equity, and private real estate (collectively, non-traditional or alternative investments). These investments can besubject to substantial risks (including the risks associated with limited liquidity, the use of leverage, short-sales and concentrated positions), may involve complex tax structures and strategies, and may not be easily valued. The risks ofalternative investments should be carefully considered in light of your investment objectives, risk tolerance and net worth. Alternative investments are speculative and entail substantial risks, which may place your capital at risk.Alternative investments may not have been registered with the Securities and Exchange Commission or under any state securities laws. The market for such investments may be highly illiquid and subjectively valued, and these reportsprovide values for informational purposes only. Accuracy is not guaranteed. These values may differ substantially from prices, if any, at which a unit may be bought or sold and do not necessarily represent the value you would receivefrom the issuer upon liquidation. Issuer estimated values, if any, are generally updated on a regular (annual or semi-annual) basis and are supplied to us by the issuer, but may be calculated based on different information from what isused by third parties to derive their estimated values.
Fixed Income: Investing in the fixed income market is subject to risks including market, interest rate, issuer, credit, default and inflation risk. An investment in a portfolio may be worth more or less than its original cost whenredeemed. Derivatives may involve certain costs and risks such as liquidity, interest rate, market, credit, management, default risk, and the risk that the position could not be closed when most advantageous. Investing in derivativescould lose more than the amount invested.
Variable Annuities: A variable deferred annuity is a long-term financial product designed for retirement purposes. It is a contractual agreement in which payment(s) are made to an insurance company, which agrees to pay out anincome or a lump sum amount at a later date. There are fees and charges associated with a variable annuity contract, which include, but are not limited to, operations charges, sales and surrender charges, administrative fees, andadditional charges for optional benefits. Variable annuities are sold by prospectus and you should carefully consider important information on the subaccounts's investment objectives, risk, charges and expenses. Please read theprospectus and offering documents carefully before you invest. Your Financial Advisor can provide a copy of the prospectus. For current month-end returns: http://advisor.morningstar.com/familyinfo.asp.
Withdrawals from an annuity contract are taxable as ordinary income, not as capital gains and, if made prior to age 59 and 1/2, may be subject to an additional 10% federal income tax penalty. Withdrawals may also be subject tosurrender charges. Withdrawals will reduce the death benefit, living benefits and cash surrender value. For tax purposes, withdrawals will come from any gain in the contract first. Please see the prospectus for complete details.Amounts in the annuity's variable investment portfolios are subject to fluctuation in value and market risk, including loss of principal.
Unregistered group variable annuities and registered group variable annuities that are solely available for use in qualified plans are rated and ranked based on their position within the bell curve of the open end fund peer group (a.k.a.category), rather than the variable annuity subaccount peer group. These ratings and ranks are calculated by using an overlay of the open end fund peer group break points and therefore do not contribute to the category average ornumber of funds within the peer group.
For variable annuity subaccounts, standardized return is total return based on its inception date within the separate account and is adjusted to reflect recurring and non-recurring charges such as surrender fees, contract charges,maximum front-end load, maximum deferred load, maximum M&E risk charge, administration fees, and actual ongoing fund-level expenses. The benchmark used for each individual subaccount performance is an index that has beenassigned to the particular manager or fund.
Mutual Fund Performance Information: Mutual Funds are sold by prospectus and you should carefully consider important information on the fund's investment objectives, risk, charges and expenses. Please read the prospectusand offering documents carefully before you invest. Your UBS Institutional Consultant can provide a copy of the prospectus. For current month-end returns: http://advisor.morningstar.com/familyinfo.asp.
This analysis may incorporate mutual fund and exchange traded fund performance results. Analytics shown are calculated based on the fund's Net Asset Value, which may reflect the reinvestment of dividends and capital gains, as wellas the deduction of 12b-1 fees and fund internal expenses (e.g. fund management fees). The analytics do not reflect the deduction of the sales load, where applicable, the UBS Consulting fee(s), where applicable, or the impact oftaxes. Had the sales load, fee or taxes been included, the results used in this analysis would have been reduced.
Wilshire Trust Universe Comparison Service Information: These reports may contain comparative peer performance data provided by Wilshire Associates Incorporated (Wilshire®), entitled "Quartile Ranking Comparison." Outputwill be presented as a universe organized by asset type, plan type, plan size or other basis. Wilshire®, the Wilshire Trust Universe Comparison Service® and TUCS® are service marks of Wilshire Associates Incorporated and have beenlicensed for use by UBS Financial Services Inc. All content of TUCS is ©2016 Wilshire Associates Incorporated, all rights reserved.
Policy Index: A point of reference for evaluating a portfolio's investment performance. A policy Index can be comprised of single or multiple benchmarks (weighted blend). Portfolios with multiple benchmarks will be depicted with a
This report is provided for informational purposes only. The information shown was obtained from sources believed to be reliable, the accuracy of which cannot be guaranteed. Account statements provided by UBS or other financial institutions are theofficial record of your holdings, balances, transactions and security values and are not amended or superseded by any of the information presented in this report. Information is current as of the date shown. Past performance is no guarantee of futurereturns. See IMPORTANT INFORMATION at end of report for details.
92

description of benchmarks and weights that comprise the policy.
Gain/(Loss) Information: When data is available from UBS, estimated unrealized gains/losses are calculated for individual security lots. For assets transferred from another financial institution, gain/loss information will be reflectedonly for the period of time the assets have been held at UBS entities. For assets held at other financial institutions, information provided by that entity, if any, is reflected. Total realized gain/loss information may include calculationsbased upon non-UBS entities cost basis information. UBS Financial Services Inc. does not independently verify or guarantee the accuracy or validity of any information provided by sources other than UBS Financial Services Inc. Whenoriginal cost information is unavailable, gain/loss amounts will represent current market value and total gains/losses may be inaccurate. Date information for when a particular security was acquired, when available, appears on thesereports. When no acquisition date is provided for a security, these reports reflect "N/A" and omit this information. As a result, these figures may not be accurate and are provided for informational purposes only.
Interest and Dividend Income: When shown on this report, information does not reflect your account's tax status or reporting requirements. You should use only official IRS forms for tax reporting purposes. The classification ofprivate investment distributions can only be determined by referring to the official year-end tax-reporting document provided by the issuer.
Contributions and Withdrawals: When shown on a report, information regarding contributions and withdrawals may represent the net value of all cash and securities contributions and withdrawals, and may include program fees(including wrap fees) and other fees added to or subtracted from your accounts from the first day to the last day of the period covered by these reports. Program fees may be separately identified or included in withdrawals exceptwhen paid via an invoice or through a separate account billing arrangement.
Cash Flow: Cash Flow analysis is based on the historical dividend, coupon and interest payments you have received as of the Record Date in connection with the securities listed and assumes that you will continue to hold thesecurities for the periods for which cash flows are projected. This may or may not include principal paybacks for the securities listed. These potential cash flows are subject to change due to a variety of reasons, including but notlimited to, contractual provisions, changes in corporate policies, changes in the value of the underlying securities and interest rate fluctuations. The effect of a call on any security(s) and the consequential impact on its potential cashflow(s) is not reflected in this report. Payments that occur in the same month in which the report is generated -- but prior to the report run ("As of") date -- are not reflected in this report. In determining the potential cash flows, UBSrelies on information obtained from third party services it believes to be reliable but does not independently verify or guarantee the accuracy or validity of any information provided by third parties. Cash flows for mortgage-backed,asset-backed, factored, and other pass-through securities are based on the assumptions that the current face amount, principal pay-down, interest payment and payment frequency remain constant. Calculations may include principalpayments, are intended to be an estimate of future projected interest cash flows and do not in any way guarantee accuracy.
Important information about advisory & brokerage services: As a firm providing wealth management services to clients, we offer both investment advisory and brokerage services. These services are separate and distinct, differ inmaterial ways and are governed by different laws and separate contracts. For more information on the distinctions between our brokerage and investment advisory services, please speak with your Financial Advisor or visit our websiteat <http://ubs.com/workingwithus>.
While we strive to make sure the nature of our services is clear in the materials we publish, if at any time you would like clarification on the nature of your accounts or the services you are receiving, please speak with your UBSInstitutional Consultant.
This report is provided for informational purposes only. The information shown was obtained from sources believed to be reliable, the accuracy of which cannot be guaranteed. Account statements provided by UBS or other financial institutions are theofficial record of your holdings, balances, transactions and security values and are not amended or superseded by any of the information presented in this report. Information is current as of the date shown. Past performance is no guarantee of futurereturns. See IMPORTANT INFORMATION at end of report for details.
93
Calculation Definitions
Alpha: Alpha measures the difference between an investment's actual performance, and its expected performance as indicated by the returns of a selected market index. A positive Alpha indicates the risk-adjusted performance isabove that index. In calculating Alpha, Standard Deviation (total risk) is used as risk measure. Alpha is often used to judge the value added or subtracted by a manager.
Appreciation/Depreciation: Appreciation or Depreciation is the change in market value minus net cash flows. The value indicates by how much the portfolio value has changed due to changes in asset values. Appreciation would bean increase, Depreciation would be a decrease.
Average Exposure: Average Exposure is generally, the average allocation to a segment or an asset. Calculated as the beginning market value plus the weighted net cash flows as a percentage of the total portfolio market value.
Beta: Beta is defined as a Manager's sensitivity to market movements and is used to evaluate market related, or systematic risk. Beta is a measure of the linear relationship, over time, of the Manager's returns and those of theBenchmark. Beta is computed by regressing the Manager's excess returns over the risk free rate (cash proxy) against the excess returns of the Benchmark over the risk free rate. An investment that is as equally volatile as the marketwill have a Beta of 1.0; an investment half as volatile as the market will have a Beta of 0.5; and so on. Thus, Betas higher than 1.0 indicate that the fund is more volatile than the market.
Composite Benchmark: The Composite Benchmark is a weighted average benchmark based on the allocation of funds within each of the portfolios in the composite and the risk index assigned to each portfolio.
Correlation (R): The Correlation represents the degree to which investments move in tandem with one another and is a critical component of diversified portfolio construction. The Correlation varies between a minimum of -1 (movein opposite direction) and a maximum of 1 (completely correlated). Lower Correlations enhance diversification and lead to better risk-adjusted returns within diversified portfolios. An R of less than 0.3 is often considered lowCorrelation.
Current Yield: This measure looks at the current price of a bond instead of its face value and represents the return an investor would expect if he or she purchased the bond and held it for a year. This measure is not an accuratereflection of the actual return that an investor will receive in all cases because bond and stock prices are constantly changing due to market factors.
Distribution of Excess Returns: Distribution of Excess Returns displays an arrangement of statistical data that exhibits the frequency of occurrence of the investment's returns in excess of the selected Market Index.
Down Market (Mkt) Capture Ratio: Down Market Capture Ratio is a measure of an investment's performance in down markets relative to the market itself. A down market is one in which the market's return is less than zero. Thelower the investment's Down Market Capture Ratio, the better the investment protected capital during a market decline. A negative Down Market Capture Ratio indicates that an investment's returns rose while the market declined.
Downside Capture Return: The downside capture return is the cumulative performance of the portfolio in all periods during which the risk benchmark posted a negative return.
Downside Probability: The downside probability is the ratio of the number of periods during which the portfolio posted a negative return to the total number of periods under study. If, for example, during a 12 month span, theportfolio realized 5 months of negative returns, the downside probability would be equal to 5/12 or 42 percent. The sum of the downside and upside probabilities must equal 1.0. The downside probability does not consider the extentto which the portfolio will fail to exceed the target index. It merely considers the likelihood that the target will not be exceeded. It is important to bear in mind this point when comparing the downside probabilities of more than oneportfolio. It is not necessarily correct, for example, to deem portfolio A riskier than portfolio B simply because A has a higher downside probability.
Downside Risk (Semi Standard Deviation, Semi Std Dev, or Downside Deviation): Downside Risk only identifies volatility on the down side. Downside Risk measures the variability of returns below zero, whereas StandardDeviation attributes volatility in either direction to risk. The Downside Risk method calculates the deviations below zero for each observed return. Each time a return falls below zero, the sum is divided by the number of observationsand the square root is taken. This result is then shown on an annualized basis.
Dynamic Index: A weighted average blended benchmark of the risk indices assigned to each asset class, based on the asset allocation of the portfolio for a given period. The benchmark index weighting adjusts with changes to theasset allocation. A Dynamic Index should not be used when measuring against the client's Investment Policy Statement.
Effective Duration: A duration calculation for bonds with embedded options. Effective duration takes into account that expected cash flows will fluctuate as interest rates change.
Excess: Denotes that a statistic is being measured relative to the Market Index selected. The data set analyzed consists of the periodic differences between the investment's measure and the selected Market Index's definition.
Expense Ratio: Often referred to as the Net Expense Ratio, Morningstar pulls the net annual expense ratio from the fund's audited annual report. Annual-report expense ratios reflect the actual fees charged during a particular fiscalyear. The annual report expense ratio for a fund of funds is the wrap or sponsor fee only. The expense ratio expresses the percentage of assets deducted each fiscal year for fund expenses, including 12b-1 fees, management fees,administrative fees, operating costs, and all other asset-based costs incurred by the fund. Portfolio transaction fees, or brokerage costs, as well as initial or deferred sales charges are not included in the expense ratio. The expense ratio,which is deducted from the fund's average net assets, is accrued on a daily basis. If the fund's assets are small, its expense ratio can be quite high because the fund must meet its expenses from a restricted asset base. Conversely, asthe net assets of the fund grow, the expense percentage should ideally diminish as expenses are spread across the wider base. Funds may also opt to waive all or a portion of the expenses that make up their overall expense ratio.
Gross Dollar Weighted Return: Gross Dollar Weighted Return is the internal rate of return, excluding money manager fees.
Gross Expense Ratio: Represents the total gross expenses (net expenses with waivers added back in) divided by the fund's average net assets. If it is not equal to the net expense ratio, the gross expense ratio portrays the fund'sexpenses had the fund not waived a portion, or all, of its fees. Thus, to some degree, it is an indication of fee contracts. Some fee waivers have an expiration date; other waivers are in place indefinitely.
This report is provided for informational purposes only. The information shown was obtained from sources believed to be reliable, the accuracy of which cannot be guaranteed. Account statements provided by UBS or other financial institutions are theofficial record of your holdings, balances, transactions and security values and are not amended or superseded by any of the information presented in this report. Information is current as of the date shown. Past performance is no guarantee of futurereturns. See IMPORTANT INFORMATION at end of report for details.
94
Gross Time Weighted Return: Gross Time Weighted Return is the Modified Dietz return, excluding money manager fees.
Index Value: Index Value is the unit value series based on the return stream. It can be used to calculate rates of return between any two dates in the report.
Information Ratio: The Information Ratio is a measure of value added by an investment manager. It is the ratio of (annualized) excess return above the selected Market Index to (annualized) Tracking Error. Excess return is calculatedby linking the difference of the manager's return for each period minus the selected Market Index return for each period, then annualizing the result.
Manager Capture Ratio: The Manager Capture Ratio is manager return divided by the selected Market Index return. It shows what portion of the market performance was captured by the manager under certain market conditions:up market, down market, or both.
Market Experience: Market Experience is the presumable market value of the portfolio if it and its cash flows had grown at the policy index rate of return. It lets the reader know if active management has aided or hurt the portfolio.
Net Cash Flow: For the total portfolio, net cash flow is aggregate contributions minus aggregate withdrawals. At the asset class level, net cash flow is aggregate purchases minus aggregate sales minus aggregate income. It is used inthe numerator of the Modified Dietz return calculation. It is the same as "New Money" and "Flow".
Net Dollar Weighted Return: Net Dollar Weighted Returns is the internal rate of return, including money manager fees.
Net Time Weighted Return: Net Time Weighted Return is the Modified Dietz return, including money manager fees.
New Money: For the total portfolio, New Money is aggregate contributions minus aggregate withdrawals. At the asset class level, New Money is aggregate purchases minus aggregate sales minus aggregate income. It is used in thenumerator of the Modified Dietz return calculation. It is the same as "Net Cash Flow" and "Flow".
Policy Index: A point of reference for evaluating a portfolio's investment performance. A policy Index can be comprised of single or multiple benchmarks (weighted blend). Portfolios with multiple benchmarks will be depicted with adescription of benchmarks and weights that comprise the policy.
Rate of Return, ROR, Return %, ROI: All Return terms refer to the Modified Dietz return.
Relative Risk: Relative risk is simply the ratio of the standard deviation of the portfolio to the standard deviation of the risk index. The statistic reveals how much of the variation of the risk index is "shared" by the portfolio. A relativerisk of 1.0 indicates that the portfolio has the same level of return variability as the risk index. A relative risk of less than 1.0 indicates that the portfolio has shown a lower dispersion of returns than the index. A relative risk in excess of1.0 indicates that the portfolio returns have been more dispersed than those of the index.
Riskless Index: The theoretical rate of return of an investment with zero risk. The risk-free rate represents the interest an investor would expect from an absolutely risk-free investment over a specified period of time. The 3 monthT-Bill is the usual index used for riskless.
R-Squared (R2): The diversification measure R2 indicates the percentage of volatility in portfolio returns which can be "explained" by market volatility. This statistic indicates the degree to which the observed values of one variable,such as the returns of a managed portfolio, can be explained by, or are associated with the values of another variable, such as a Market Index. It is especially helpful in assessing how likely it is that Alpha and Beta are statisticallysignificant. The R2 values generally range from 0.0 to 1.0. An investment with an R2 of 1.0 is perfectly correlated with the market whereas an investment with an R2 of 0.0 will behave independently of the market. An R2 of 0.95, forexample, implies that 95% of the fluctuations in a portfolio are explained by fluctuations in the market.
Sector Allocations: The percentage a manager has allocated to specific economic sectors.
Sharpe Ratio: The Sharpe Ratio indicates the excess return per unit of total risk as measured by Standard Deviation. It is a ratio of the arithmetic average of excess returns over the risk free rate to the Standard Deviation. The SharpeRatio is a measure of the premium earned for the risk incurred by the portfolio.
Sortino Ratio: The Sortino Ratio is a measure of reward per unit of risk. With Sortino, the numerator (i.e., reward) is defined as the incremental compounded average return over the minimum acceptable return (MAR). Thedenominator (i.e., risk) is defined as the downside deviation of the returns below the MAR. Since the downside deviation is the standard deviation of those returns which fail to exceed the MAR, the result of the Sortino Ratio is ameasure of the average reward per unit of loss. As with Sharpe and Treynor, the Sortino Ratio only has value when it is used as the basis of comparison between portfolios. The higher the Sortino Ratio, the better.
Standard Deviation: A measure of the extent to which observations in a series vary from the arithmetic mean of the series. The Standard Deviation of a series of asset returns is a measure of volatility or risk of the asset.
Target Allocation: The Target Allocation is the allocation goal of the portfolio.
Tracking Error (Excess Standard Deviation): Tracking Error is a measure of how closely an investment's returns track the returns of the selected Market Index. It is the annualized Standard Deviation of the differences between theinvestment's and the associated index's returns. If an investment tracks its associated index closely, then Tracking Error will be low. If an investment tracks its associated index perfectly, then Tracking Error will be zero.
This report is provided for informational purposes only. The information shown was obtained from sources believed to be reliable, the accuracy of which cannot be guaranteed. Account statements provided by UBS or other financial institutions are theofficial record of your holdings, balances, transactions and security values and are not amended or superseded by any of the information presented in this report. Information is current as of the date shown. Past performance is no guarantee of futurereturns. See IMPORTANT INFORMATION at end of report for details.
95
Treynor Ratio: The Treynor Ratio is defined as the ratio of the manager's excess geometrically annualized return over the portfolio Beta. Excess returns are computed versus the cash index.
Up Market (Mkt) Capture Ratio: Up Market Capture Ratio is a measure of a product's performance in up markets relative to the market itself. An up market is one in which the market's return is greater than or equal to zero. Thehigher the investment's Up Market Capture Ratio, the better the investment capitalized on a rising market.
Upside Capture Return: The upside capture return is the cumulative performance of the portfolio in all periods during which the risk benchmark posted a positive return.
Upside Probability: The upside probability is the ratio of the number of periods during which the portfolio posted a positive return to the total number of periods under study. If, for example, during a 12 month span, the portfoliorealized 7 months of positive returns, the upside probability would be equal to 7/12 or 58 percent. The sum of upside and downside probabilities must equal 1.0.
Upside Uncertainty: Upside uncertainty measures the variability of portfolio returns that exceed a minimum acceptable return (MAR). Risk, in this instance, is defined as the likelihood that the MAR will not be achieved. Since thestatistic is defined as the variability of returns greater than the MAR, risk is not an issue. Thus, variability on the upside is referred to as uncertainty, not risk. The upside uncertainty is simply the standard deviation of those portfolioreturns that exceed the MAR. The larger the upside uncertainty, the better.
Weighted Average: This is a calculation that looks at the average for the statistic for each security weighted by the allocation by market value for each security.
Weighted Flow: The net cash flows weighted for the duration of the month during which the money manager had access to the funds. It is used in the denominator of the Modified Dietz rate of return calculation.
Yield: Yield refers to the yield to maturity.
YTD: Year to Date.
This report is provided for informational purposes only. The information shown was obtained from sources believed to be reliable, the accuracy of which cannot be guaranteed. Account statements provided by UBS or other financial institutions are theofficial record of your holdings, balances, transactions and security values and are not amended or superseded by any of the information presented in this report. Information is current as of the date shown. Past performance is no guarantee of futurereturns. See IMPORTANT INFORMATION at end of report for details.
96
Index Definitions
10-Year U.S. Treasury Index: A debt obligation issued by the U.S. Treasury with a term of 10 years.
Barclays Capital Global Aggregate X U.S.: An index consisting of all investment grade securities issued in different currencies and combining the Barclays Aggregate, Barclays Pan-European Aggregate and Barclays Global Treasuryindexes. The index also includes Eurodollar and Euro-Yen corporate bonds, Canadian government, agency and corporate securities and U.S. dollar investment grade, 144A securities.
Barclays Capital Global Emerging Markets: Tracks total returns of external-currency-denominated debt instruments of the emerging markets: Brady bonds, loans, Eurobonds, and U.S. dollar-denominated local market instruments.The index covers five regions: Americas, Europe, Asia, Middle East and Africa.
Barclays Capital Muni Bond Index: A capitalization-weighted bond index created by Barclays intended to be a representative of major municipal bonds of all quality ratings.
Barclays Capital U.S. Aggregate Index: Covers the U.S. dollar-denominated, investment grade, fixed rate, taxable bond market segment of SEC-registered securities and includes bonds from the U.S. Treasury, government-related,corporate, mortgage- and asset-backed and commercial mortgage-backed securities.
Barclays Capital U.S. Aggregate Government: Composed of the Barclays U.S. Treasury Bond Index (all public obligations of the U.S. Treasury, excluding flower bonds and foreign-targeted issues) and the Agency Bond Index (allpublicly issued debt of U.S. government agencies, quasi-federal corporations, and corporate debt guaranteed by the U.S. government).
Barclays Capital U.S. Aggregate High Yield: Covers the universe of fixed-rate, dollar-denominated, non-convertible, publicly issued, non-investment grade debt. Pay-in-kind (PIK) bonds, Eurobonds and debt issues from countriesdesignated as emerging markets (e.g., Argentina, Brazil, Venezuela, etc.) are excluded but Canadian bonds and SEC-registered global bonds of issuers in non-emerging countries are included. Original issue zeroes, step-up couponstructures and 144As are also included. Bonds must have at least one year to final maturity, at least $150 million par amount outstanding and be rated Ba1 or lower.
Barclays Capital U.S. Aggregate Investment Grade: Covers all publicly issued, fixed-rate, nonconvertible, investment grade corporate debt. Issues are rated at least Baa by Moody's Investors Service or BBB by Standard & Poor's.Total return comprises price appreciation / depreciation and income as a percentage of the original investment.
Barclays Capital U.S. Convertibles Composite: The Barclays Capital U.S. Convertible Bond Index represents the market of U.S. convertible bonds. Convertible bonds are bonds that can be exchanged, at the option of the holder, fora specific number of shares of the issuer's preferred stock or common stock.
Barclays Capital U.S. Treasury - Bills (1-3 months): Is a market value-weighted index of investment-grade fixed-rate public obligations of the U.S. Treasury with maturities of three months, excluding zero coupon strips.
Cambridge U.S. Private Equity: Based on returns data compiled on funds representing more than 70% of the total dollars raised by U.S. leveraged buyout funds, subordinated debt and special situation managers between1986-2008.
Cambridge U.S. Venture Capital Index: Based on returns data compiled for more than 75% of U.S., institutional venture capital assets between 1990-2008.
Dow Jones AIG Commodity Index: Composed of futures contracts on 20 physical commodities. It is composed of commodities traded on U.S. exchanges with the exception of nickel, aluminum and zinc. The Index relies primarily onliquidity data or the relative amount of trading activity to determine its weightings. All data used for both liquidity and production calculations are averaged for a five-year period.
HFRI Distressed & Restructuring: Equally weighted index of investment managers who employ an investment process focused on corporate fixed income instruments, primarily on corporate credit instruments of companies tradingat significant discounts to their value at issuance or obliged (par value) at maturity as a result of either formal bankruptcy proceeding or financial market perception of near-term proceedings. Distressed strategies employ primarily debt(greater than 60%) but also may maintain related equity exposure.
HFRI Equity Hedge: Equally weighted index of investment managers who employ equity hedge strategies, maintaining both long and short positions primarily in equity and equity derivative securities. Equity hedge managers wouldtypically maintain at least 50% exposure to, and may in some cases be entirely invested in, equities both long and short.
HFRI Event Driven: Equally weighted index of investment managers who maintain positions in companies currently or prospectively involved in corporate transactions of a wide variety including but not limited to mergers,restructurings, financial distress, tender offers, shareholder buybacks, debt exchanges, security issuance or other capital structure adjustments. Security types can range from most senior in the capital structure to most junior orsubordinated, and frequently involve additional derivative securities.
HFRI Fund of Funds Index: Fund of funds invested with multiple managers through funds or managed accounts. The strategy accesses a diversified pool of managers with the objective of lowering the risk of investing in one singlemanager. The fund of funds manager has discretion in choosing which strategies and managers to invest in the fund.
HFRI Fund Weighted Composite: An equally weighted return of all funds net of fees in the HFRI monthly indexes. Fund strategies include, but are not limited to: convertible arbitrage, distressed securities, emerging markets, equityhedge, equity market neutral, statistical arbitrage, event driven, macro, market timing, merger and risk arbitrage, relative value, short selling and sector funds.
HFRI Macro: Equally weighted index of investment managers which trade a broad range of strategies in which the investment process is predicated on movements in underlying economic variables and the impact these have onequity, fixed income, hard currency and commodity markets. Managers employ a variety of techniques, both discretionary and systematic analysis, combinations of top down and bottom up theses, quantitative and fundamental
This report is provided for informational purposes only. The information shown was obtained from sources believed to be reliable, the accuracy of which cannot be guaranteed. Account statements provided by UBS or other financial institutions are theofficial record of your holdings, balances, transactions and security values and are not amended or superseded by any of the information presented in this report. Information is current as of the date shown. Past performance is no guarantee of futurereturns. See IMPORTANT INFORMATION at end of report for details.
97
approaches and long- and short-term holding periods.
HFRI Relative Value: Equally weighted index of investment managers who maintain positions in which the investment thesis is predicated on realization of a valuation discrepancy in the relationship between multiple securities.Managers employ a variety of fundamental and quantitative techniques to establish investment theses, and security types range broadly across equity, fixed income, derivative or other security types.
JP Morgan Global Ex-U.S. Bond Index: Consists of regularly traded, fixed-rate domestic government debt instruments from 12 international bond markets. Countries included are Austria, Belgium, Canada, Denmark, France,Germany, Italy, Japan, the Netherlands, Spain, Sweden and the United Kingdom.
MSCI AC World Index ex USA: Consists of approximately 2,000 securities across 47 markets, with emerging markets representing approximately 18%. MSCI attempts to capture approximately 85% of the market capitalization ineach country.
MSCI EAFE Index (Europe, Australasia, Far East): A free float-adjusted market capitalization index that is designed to measure the equity market performance of developed markets, excluding the U.S. and Canada. As of June2007, the MSCI EAFE Index consisted of the following 21 developed market country indexes: Australia, Austria, Belgium, Denmark, Finland, France, Germany, Greece, Hong Kong, Ireland, Italy, Japan, the Netherlands, New Zealand,Norway, Portugal, Singapore, Spain, Sweden, Switzerland and the United Kingdom.
MSCI Emerging Markets Index: A free float-adjusted market capitalization index that is designed to measure equity market performance of emerging markets. As of November 2008, the MSCI Emerging Markets Index consisted ofthe following 24 emerging market country indexes: Argentina, Brazil, Chile, China, Colombia, Czech Republic, Egypt, Hungary, India, Indonesia, Israel, Korea, Malaysia, Mexico, Morocco, Pakistan, Peru, Philippines, Poland, Russia,South Africa, Taiwan, Thailand and Turkey.
MSCI Europe Index: A free float-adjusted market capitalization-weighted index that is designed to measure the equity market performance of the developed markets in Europe. As of June 2007, the MSCI Europe Index consisted ofthe following 16 developed market country indexes: Austria, Belgium, Denmark, Finland, France, Germany, Greece, Ireland, Italy, the Netherlands, Norway, Portugal, Spain, Sweden, Switzerland and the United Kingdom.
MSCI Japan Index: A free float-adjusted market capitalization-weighted index that is designed to measure the equity market performance of Japan.
NAREIT Index: Benchmarks the performance of the REIT industry since its inception in 1972. It was designed to provide a comprehensive assessment of overall industry performance. Some REITs available from over-the-countermarkets are not included due to the lack of real-time pricing.
NCREIF Property Index (NPI): A quarterly time series composite total rate of return measure of investment performance of a large pool of individual commercial real estate properties acquired in the private market for investmentpurposes only. All properties in the NPI have been acquired, at least in part, on behalf of tax-exempt institutional investors - the great majority being pension funds. As such, all properties are held in a fiduciary environment.
Russell 1000® Index: Measures the performance of the large-cap segment of the U.S. equity universe. It is a subset of the Russell 3000® Index and includes approximately 1000 of the largest securities based on a combination oftheir market cap and current index membership. The Russell 1000 represents approximately 92% of the U.S. market.
Russell 1000® Growth Index: Measures the performance of the large-cap growth segment of the U.S. equity universe. It includes those Russell 1000 companies with higher price-to-book ratios and higher forecasted growth values.
Russell 1000® Value Index: Measures the performance of the large-cap value segment of the U.S. equity universe. It includes those Russell 1000 companies with lower price-to-book ratios and lower expected growth values.
Russell 2000® Growth Index: Measures the performance of the small-cap growth segment of the U.S. equity universe. It includes those Russell 2000 companies with higher price-to-book ratios and higher forecasted growth values.
Russell 2000® Value Index: Measures the performance of the small-cap value segment of the U.S. equity universe. It includes those Russell 2000 companies with lower price-to-book ratios and lower forecasted growth values.
Russell Mid-Cap® Growth Index: Measures the performance of the mid-cap growth segment of the U.S. equity universe. It includes those Russell mid-cap companies with higher price-to-book ratios and higher forecasted growthvalues.
Russell Mid-Cap® Value Index: Measures the performance of the mid-cap value segment of the U.S. equity universe. It includes those Russell mid-cap companies with lower price-to-book ratios and lower forecasted growth values.
S&P 500 Index: Covers 500 large cap industrial, utility, transportation, and financial companies of the US markets. The index represents about 75% of NYSE market capitalization and 30% of NYSE issues. It is a capitalizationweighted index calculated on a total return basis with dividends reinvested.
TASS Index of CTAs: Is a dollar-weighted index based on historical managed futures performance of CTAs with established track records.
Source of FTSE Data: FTSE International Limited ("FTSE") © FTSE 2016. For important disclaimers in relation to FTSE Data please see the relevant attribution and disclaimer requirements at<http://www.ftse.com/About_Us/Legal/Attribution_Requirements.jsp>.
This report is provided for informational purposes only. The information shown was obtained from sources believed to be reliable, the accuracy of which cannot be guaranteed. Account statements provided by UBS or other financial institutions are theofficial record of your holdings, balances, transactions and security values and are not amended or superseded by any of the information presented in this report. Information is current as of the date shown. Past performance is no guarantee of futurereturns. See IMPORTANT INFORMATION at end of report for details.
98

©UBS 2016. The key symbol and UBS are among the registered and unregistered trademarks of UBS. All rights reserved. UBS Financial Services Inc. is a subsidiary of UBS AG. Member FINRA/SIPC.
UBS Financial Services Inc.www.ubs.com/financialservicesinc050707-1138
UBS Financial Services Inc. is a subsidiary of UBS AG.
99
Rebalancing
0
©UBS 2014. All rights reserved. UBS Financial Services Inc. is a subsidiary of UBS AG. Member FINRA/SIPC.
ubs.com/fs141022-1747-005

$0
11/15/2016 Current % Proposed Cash
Manager/Fund Balance of Managed Correction Balance New Balance New % Mgr Fee
Loomis Sayles Growth Fund $2,290,967 4.0% 3.9% $0 $2,290,967 3.9%
RNC Genter LCV High Dividend SMA $2,464,203 4.0% 4.2% $51,567 $2,464,203 4.2%
Invesco Equally Weighted S&P 500 Fund $3,416,316 5.0% 5.9% $1 $3,416,316 5.9%
Total US Large Cap $8,171,485 13.0% 14.0% ($596,000) $0 $51,568 $8,171,485 14.0%Undiscovered Managers Behavioral Value Fund $2,850,522 4.0% 4.9% ($220,000) $0 $2,630,522 4.5%
FMI Common Stock Fund $2,874,458 4.0% 4.9% ($240,000) $135 $2,634,458 4.5%
Total US Small/Mid Cap $5,724,980 8.0% 9.8% ($1,063,000) ($460,000) $135 $5,264,980 9.0%Invesco International Growth Fund $2,873,730 5.0% 4.9% $10 $2,873,730 4.9%
MFS International Value Fund $2,703,243 5.0% 4.6% $1 $2,703,243 4.6%
Lazard Emerging Markets Fund $2,390,740 4.0% 4.1% $1 $2,390,740 4.1%
iShares Core Emerging Market Equity $2,469,782 4.0% 4.2% $533 $2,469,782 4.2%
Total International Mkts $10,437,495 18.0% 17.9% $52,000 $0 $544 $10,437,495 17.9%Stonebridge Preferred SMA $1,750,746 3.0% 3.0% $83,032 $1,750,746 3.0%
SPDR Barclays Convertible ETF (CWB) $1,607,716 3.0% 2.8% ($10,000) $11,937 R $1,597,716 2.7%
Chilton REIT $1,527,085 2.5% 2.6% $340 $1,527,085 2.6%
Total Equity Diversifiers $4,885,546 8.5% 8.4% $68,000 ($10,000) $95,308 $4,875,546 8.4%
BlackRock Strategic Income Opps Fund $2,953,211 5.0% 5.1% ($65,000) $0 $2,888,211 5.0%
Pioneer Strategic Income Opps Fund $2,690,631 4.5% 4.6% ($65,000) $176 $2,625,631 4.5%
Total Fixed Income Diversifiers $5,643,842 9.5% 9.7% ($108,000) ($130,000) $176 $5,513,842 9.5%
Wells Fargo Absolute Return Fund $3,638,232 8.0% 6.2% $0 $3,638,232 6.2%
Total Tactical/Multi-Asset $3,638,232 8.0% 6.2% $1,024,000 $0 $0 $3,638,232 6.2%Bradford Marzec SMA $9,729,612 16.0% 16.7% $9,729,612 16.7%
Pacific Income SMA $9,742,093 16.0% 16.7% $9,742,093 16.7%
UBS Cash Account $302,382 3.0% 0.5% $600,000 $902,382 1.5%
Total Core Fixed Income $19,774,088 35.0% 33.9% $622,000 $600,000 $0 $20,374,088 35.0%$0 0.09% New FI/Cash: 35.0%
Total Managed Portfolio Value: $58,275,668Cash Surplus/(Deficit): ($582,618)
Statutory Fixed Income/Cash: 34.0%
Cash flow policy updated: January 2016
Monthly Contributions are approx: $68,000 Employee contributions are received at MB Financial Bank
Monthly Pension payouts are approx: $343,000 $295,000 is the amount that is wired to MB Financial Bank from UBS - starting July 2016
completeness. This report is intended to be an analysis and should not be relied upon for accuracy unless it conforms with the official records of the firm. Accordingly, you should
rely on the monthly statement as the official record of your valued UBS Financial Services, Inc. account.
Neutral Weight
Tactical Overweight
Tactical Underweight
Manager Change
The information and statistical data contained herein have been obtained from sources we believe reliable but are in no way warranted by us as to accuracy or
Rebalancing Worksheet
11/16/2016
Lisle Woodridge FPD Pension Fund
Rebalance
NeededIPS Target %
Key: