Embed Size (px)
Citation preview
1
Z Karim
Assessment of Investment and
Financial Flows to Adapt to the
Climate Change Effects in the
Agriculture Sector
United Nations Development Programme (UNDP)
August, 2011
Government of the People’s Republic of Bangladesh
UNDP Global Project: Capacity
Development for Policy Makers to Address Climate Change UNDP Global
Project
(Draft Final Report: Agriculture Sector) Capacity Development for Policy Makers
to Address Climate Change
2
Table of contents 1. Introduction ......................................................................................................................................... 3
1.1 Background ............................................................................................................................. 3
1.1.1 Previous Analyses Utilized ..................................................................................................... 3 1.1.2 Institutional Arrangements and Collaborations ....................................................................... 4
1.2.3 Basic Methodology and Key Terminology ............................................................................... 4 2. Scope, Data Inputs, and Scenarios .............................................................................................. 8
2.1 Sectoral Scope ......................................................................................................................... 8 2.2 Data Inputs and Scenarios ........................................................................................................ 8 2.2.1 Assessment Period and Cost Accounting Parameters .............................................................. 8
2.2.2 Analytical Approach .............................................................................................................. 8 2.2.3 The baseline scenario ............................................................................................................ 9
The demographic information ....................................................................................................... 9 Macroeconomic perspective ........................................................................................................ 10
Sectoral overview of agriculture ................................................................................................... 10 Current Food security situation .................................................................................................... 15
Some historical programmes for climate change adaptation in Bangladesh by GOB ........................ 16 Financial need assessment in National Adaptation Programme of Action (NAPA) ............................ 16
Current availability of financial resources by DPs:Pilot Programme for Climate Resilience (PPCR) .... 18 GOB initiatives for climate change adaptation .............................................................................. 19
Comprehensive Disaster Management Programme phase 2 (CMDP2) ............................................ 21
Base line IF, FF and O & M expenditures ....................................................................................... 21 2.2.4 Adaptation Scenario ........................................................................................................... 27
Scenario description .................................................................................................................... 27
Adaptation to climate change in agriculture of Bangladesh ............................................................ 28 3. Results ............................................................................................................................................... 34
3.1 Incremental Changes in IF, FF O&M Costs ............................................................................... 34
3.2 Policy implications ................................................................................................................. 41
Policy Implications: Mainstreaming Climate Change in Agricultural Sector Development ................. 44 3.3 Key Uncertainties and Methodological Limitations .................................................................. 50 4. References ......................................................................................................................................... 52
Annex 1 .................................................................................................................................................. 53
3
1. Introduction
The geographic location and geomorphologic condition of Bangladesh have made the
country one of the most vulnerable ones to climate change. Climate change vulnerabilities
affect all aspects of livelihood including food security, crops, livestock, fish, bio-diversity,
environment, water resources & ground water dependent irrigated agriculture, industry,
infrastructure, transport, navigation and public health. Floods, tropical cyclones, storm
surges and droughts are common threats to Bangladesh. Extreme flood frequency has
increased in the recent years. In the last twenty five years, Bangladesh has experienced six
severe floods. These happen in the months just before and after the monsoon. During recent
years cyclone Sidr (2007) and Aila (2009) hit the southern region of Bangladesh. Devastating
Sidr affected 33 districts and Aila affected 26 districts damaging around 9 million households
with huge loss of crops, livestock and fishery. They also made considerable damage to
infrastructures and coastal embankments. Bangladesh experienced moderate to severe
droughts in 1973, 1978, 1979, 1981, 1982, 1989, 1994, and 1995. The Fourth Assessment of
Intergovernmental Panel on Climate Change (IPCC) has also observed increased climate
variability and extreme events in Bangladesh. Rising global temperature are likely to increase
the frequency and intensity of cyclones in the Bay of Bengal as well as monsoon rainfall,
resulting in catastrophic floods in the Ganges–Brahmaputra-Meghna Basin. Sea level rise and
the consequent coastal flooding and saline intrusion into aquifers constitute serious threats.
The challenge of climate change will exacerbate by the fast growth rate and high density of
population. This will have large negative impact on people‘s livelihood and her prospect to
improve growth performance and reducing poverty.
1.1 Objectives
The objective of this report is therefore two fold. On the one hand, it develops technical
knowledge and methodologies to assist developing countries cost, prioritize and sequence
robust adaptation strategies of water sector into the development plans and budgets of
Bangladesh.
On the other hand, it intends to estimate the cost of adaptation for water sector in order to
inform the international community’s efforts on the additional resources needed to allow
developing countries adapt to climate change.
1.2 Background
1.2.1 Previous Analyses Utilized
A number of studies/analyses were utilized for the sectoral assessment. These are briefly
described below:
(i) Pilot Programme for Climate Resilience (PPCR)
During the first PPCR Joint MDB Mission held in February 2010, it was agreed with the
government of Bangladesh (GOB) that, the ADB and WB will support the MOEF in preparing
the draft Strategic Program for Climate Resilience (SPCR).
4
Preparation has involved desk study of existing development policies and strategies including
the Bangladesh Climate Change Strategy and Action Plan (BCCSAP), the revised National
Adaptation Program of Action (NAPA), the draft Strategy to ensure the Private Sector in
Climate Change Adaptation in Bangladesh, other relevant report, studies and policies on
climate change particularly for the coastal zone, and a stocking of planned and ongoing
climate change projects by GOB, MDBS, development partners, the private sector and NGOs.
During the MDB’s held various consultations and meetings with BWDB, DMB, BMD, MOFDM,
MOEF, LGED, FD, ERD, all government agencies associated with the PPCR process and
development partners. The output of that consultations is SPCR which presents a
comprehensive package of plans, programs and actions for climate resilience what can be
financed through PPCR, the government confirmed that priority interventions will be
channelled through MDBs (ADB, IFC and WB) in line with the program design.
(ii) Evaluation of the Implementation of the Paris Declaration (PD) and effectiveness of aid
utilization, Phase – II, Country Evaluation Bangladesh, 2010
The evaluation reports on the relevance of the PD in Bangladesh, progress of the PD
implementation towards attaining the expected intermediate outcomes since signing of the
Declaration in 2005 and PD’s influence on strengthening contribution of aid to sustainable
development results. The evaluation also includes studies on the implementation of the PD
in three selected sectors namely, Health, Transport, and Power and Energy and a cross
cutting issue- Climate Change.
(iv) Worked in synergy and complementary with the GOB planning process which includes
review and determining intervention areas from PRSP-I, NSAPR-II, Medium Term Budget
Framework (MTBF), GOB Perspective Plan 2010-2021(draft), concept note of GOB Sixth Five-
Year Plan 2011-2015 (through consultation with Planning Commission), Agricultural Sector
Review 2006 (GoB/FAO, 2006), National Food Policy Plan of Action (2008-2015), Utilized
Annual Development Programme (ADP) of GOB for cost analysis.
1.2.2 Institutional Arrangements and Collaborations
Data gathered from Ministry of Planning, Ministry of agriculture, Ministry of Fisheries and
Livestock, Ministry of Environment and Ministry of Water. These ministries have
programmes and information on investments in agricultural development and adaptation.
1.2.3Basic Methodology and Key Terminology
The methodology and reporting guidance provided in the UNDP User Guide on I&FF
Assessments has been used for this study. The methodology for I&FF assessments consists of
eight steps to be undertaken in agriculture sector assessment:
i. Establish key parameters of the assessment
• Define detailed scope of the sector
The agriculture sector can be broadly divided into different sub-sectors: crops, livestock, and
fishery. The base line scenarios of the sub-sectors were examined as: a) Current status of
5
crop productions: b) Current status of livestock productions and c) Current status of fishery
productions:
• Specify the assessment period and the reference year
The base line year is considered to be 2011. The assessment period is 2011- 2030. The
adaptation and incremental I&FF have been estimated for this period.
• Identify preliminary adaptation measures
• Select analytical approach.
ii. Compile historical Investment Flow (IF), Financial Flow (FF) and operation and
maintenance costs (O&M) data, subsidies and other input data for scenarios
iii. Defining baseline scenario
Described the socio-economic and technological change, national and sectoral plans, and
expected investments, given the current national and sectoral plans.
iv. Derive I&FF for baseline scenario
The base line scenario has been estimated excluding all adaptation investments due to
climate change considering ADP 2011-12. Annual investment requirement is estimated
considering base line investment and assuming a growth rate of 8% which is similar to GDP
growth rate.
v. Define the adaptation scenario
Described the socio-economic and technological change, adaptation measures and
investments, given the implementation of adaptation measures and estimated annual
investment for the adaptation scenario considering ADP 2011-12.
vi. Derive I&FF for adaptation scenario
Annual investment requirement is estimated considering base line investment and assuming
a growth rate of 8%.
vii. Calculate incremental I&FF needed for adaptation by subtracting I&FF values of
baseline scenario from values of adaptation scenario
viii. Assess policy implications
Different GOB policies affecting investments in the agriculture sector (crops, livestock,
fisheries, forestry) were examined to review implications. The chapter on policy implications
would mainly focus on policies that are useful to implement the results of the I&FF
assessment.
Key Terminology
The cost accounting parameters were distinguished between two distinct types of
investments: investment flows and financial flows:
An “Investment Flow” (IF) is the capital cost of a new physical asset with a life of more than
one year, such as the capital cost of a new agricultural irrigation system or flood control
embankments. Investment flows are limited to new physical assets because such
6
investments have climate change implications for the duration of the operating lives of the
facilities and equipment purchased.
A “Financial Flow” (FF) is an ongoing expenditure on programmatic measures; financial flows
encompass expenditures other than those for expansion or installation of new physical
assets. Examples of financial flows include expenditures for an agricultural extension
program for farmers, a malaria prevention program to distribute mosquito nets, or the
implementation of improved forest management techniques.
Other than this, “Operation and Maintenance Costs” are also separated from the IF and FF
flow enumeration. The O&M cost is the expenditure associated with the operation and
maintenance of the asset acquired. Examples include ongoing fixed and variable costs such
as salaries and raw materials.
Investment entity: An “investment entity” is the body or thing making the investment in the
asset. This study defines three types of investment entities: families, companies and
government.
Government: Governments are the national, provincial, county and local governments of a
country. Financial and non-financial corporation’s owned wholly or in part by governments,
such as public universities, research institutions and publicly held oil companies, utilities and
management of waters and forestry authorities belong to this category. Government entities
invest in physical assets and long-term programs and services that provide public benefits.
Corporations: The companies include both financial firms as non-financial businesses, and
organizations may be profit or non-profit. Financial firms are entities such as banks, credit
unions and insurance companies that provide financial services to non-financial business,
households and governments. The non-financial firms produce goods (such as fossil fuels,
electricity, food or wood). The non-governmental organizations are a kind of company of
non-profit. Firms invest in physical assets and programs. Their sources of investment funds
are from domestic sources and external sources and can be in the form of shares (shares in
domestic capital markets and FDI), debt (loans from commercial banks and bonds sold in
capital market), national government support (subsidies) or public foreign aid (in the form of
grants and loans conditional preference, known as ODA or ODA).
Households: Households are individuals or groups of people (e.g. families) acting as one unit
financially. Households invest in assets such as houses, farms, crop fields. It is assumed that
all their investment funds, including capital (savings), debt (borrowing from friends, family,
financial institutions) and government support in form of grants (that is to say-refundable
deductions tax, tax credits on purchases) are national funds, to simplify the estimation of
I&FF.
Scenario: A scenario is an internally consistent and plausible characterization of future
conditions over a specified period. For each sectoral assessment of I&FF for adaptation, it
must include a baseline scenario and an adaptation scenario for that sector.
7
Baseline Scenario: The baseline scenario describes the conditions of the status quo, that is
to say, this is a description of what will probably happen if no new policy measure to address
climate change is put in place.
Adaptation Scenario: The adaptation scenario includes measures to adapt to climate
change, that is to say, the adaptation scenario should describe the expected socio-economic
developments, technological change (if appropriate), new measures to adapt to climate
change and the expected investment in the sector given the implementation of adaptation
measures.
Assessment period: The evaluation period is the time horizon for assessment i.e. the
number of years.
Base year: The base year is the first year of the assessment period, that is to say the first
year of baseline, mitigation and adaptation. The base year should be a recent year for which
information on the I&FF and O&M is available so that the IF, FF and O&M costs for the first
year of these scenarios are all historical data. In fact, the reference year as the starting
waves of cost data for each scenario is based.
Discounting of future costs: We enumerated all costs valued in constant 2010 prices and
future costs were discounted at a rate of 5% for computation of present value.
8
2. Scope, Data Inputs, and Scenarios
2.1 Sectoral Scope
According to the Bangladesh Bureau of Statistics (2007) about one-fifth of populations are
hard core poor who consume less than 1805 kcal per capita per day (BBS, 2007). Bangladesh
had an estimated 40.2 million undernourished people in 2004-06. Food security worsens
with inter-year shortfall in food grain production caused by climatic variations and natural
disaster such as floods, tidal surge, drought, insects and pests attacks.
Bangladesh grows 46 economic crops of which rice are the dominant, producing more than
33 million tons annually. Besides, about 8.0 million metric tons of potato, 0.79 million metric
tons of oilseed and 0.66 million metric tons of pulses are produced. All these crops require
temperature between 18-25oC and are highly sensitive to fog, cloud and change in humidity.
Results from crop simulation studies examining climate change impacts on agriculture
showed a negative impact on crop productivity in Bangladesh.
Fisheries, livestock and forestry sectors are also largely affected by climate change
variability. The impact is aggravated by disaster, flood, rising salinity, changing course of the
rivers etc. It affects habitat’s alteration, fish reproduction, fish migration, natural fish
breeding and fish biology. Livestock production is also affected by the climate changes due
to reduction in the quality and availability of feed, water, increased diseases and other
environmental stresses.
As the country is located between the Himalayas and the Bay of Bengal and with three major
rivers converging on its territory, Bangladesh will remain prone to floods, torrential rains,
erosion, and severe cyclonic storms and tidal surge. The climate change induced devastating
events will worsen livelihood of people with increased poverty.
2.2 Data Inputs and Scenarios
2.2.1 Assessment Period and Cost Accounting Parameters
In this study, year 2010 is considered as baseline investment period. For future IF and FF
calculation, next 20 years (up to year 2030) have been considered as detail assessment
period.
The accounting units are U.S. dollars in 2005 constant values and a conversion rate of 1
USD=BDT 70 has been used.
2.2.2 Analytical Approach
The approach for calculating the additional investment needed is the approximation of
additional investment needed to equal marginal cost of adaptation to marginal avoided
damages. The base line scenario of investment in agriculture sector was assessed
considering ADP in 2010 without any climate change adaptation costs. Annual investment
requirement in agriculture sector of Bangladesh is estimated considering base line
investment and assuming a an annual growth rate of 8% (over the year 2012-2030) which is
9
similar to GDP growth rate. The baseline scenario reflects a continuation of current policies
and plans, i.e., a future till year 2030 when no new measures are taken to address climate
change (otherwise referred to as a “business as usual” scenario).
The adaptation scenario of investment in agriculture sector was assessed considering ADP in
2010 with inclusion of costs of all adaptation to climate change. Considering this as
adaptation costs projections has been made for the period 2012-30 with an annual growth
rate of 8% which is similar to GDP growth rate. The adaptation scenario till year 2030 reflects
new adaptation measures are taken in agriculture sector (an “adaptation scenario”).
The investment costs of the baseline and adaptation scenarios are then compared to
determine the changes in investments needed to mitigate or to adapt to the impacts to the
agriculture sector in Bangladesh.
2.2.3 Historical IF, FF, and O&M Data, and Subsidies
…
2.2.4 The baseline scenario
The demographic information
The baseline scenario describes the conditions of the status quo. In this respect, it reflects
the continuation of the historical trend of achieving the investment and financial flows
throughout the period used for the assessment (2005-2030).
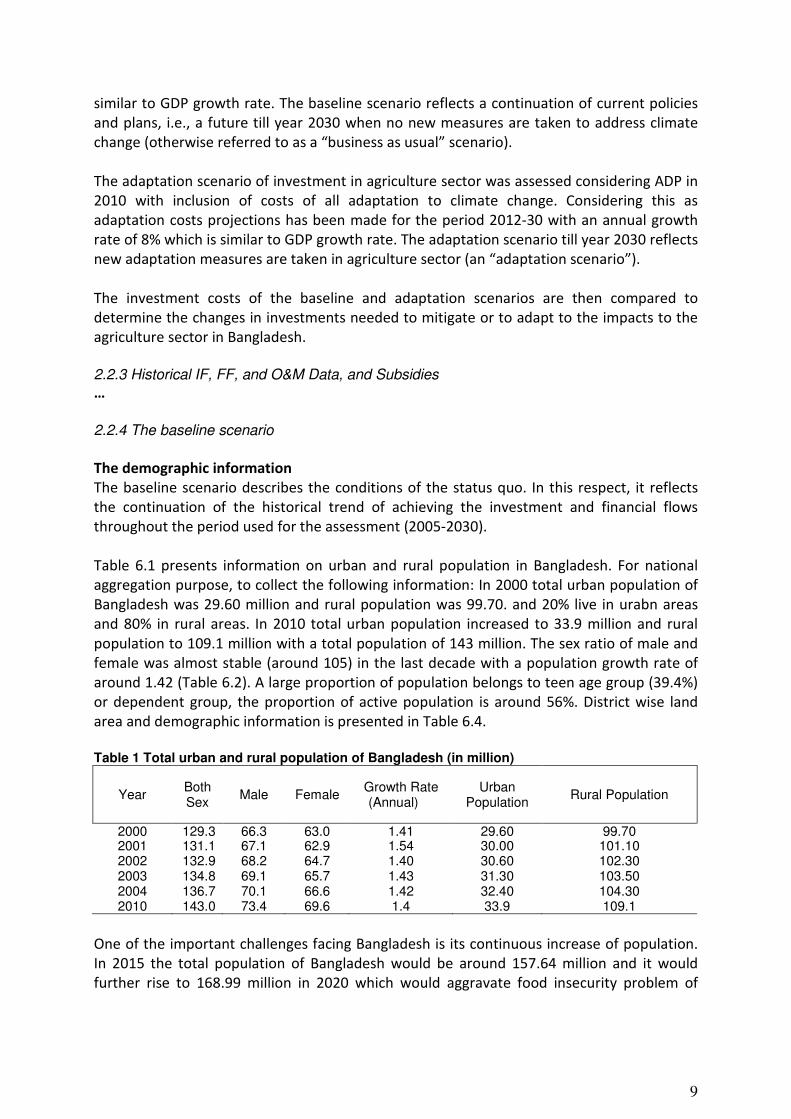
Table 6.1 presents information on urban and rural population in Bangladesh. For national
aggregation purpose, to collect the following information: In 2000 total urban population of
Bangladesh was 29.60 million and rural population was 99.70. and 20% live in urabn areas
and 80% in rural areas. In 2010 total urban population increased to 33.9 million and rural
population to 109.1 million with a total population of 143 million. The sex ratio of male and
female was almost stable (around 105) in the last decade with a population growth rate of
around 1.42 (Table 6.2). A large proportion of population belongs to teen age group (39.4%)
or dependent group, the proportion of active population is around 56%. District wise land
area and demographic information is presented in Table 6.4.
Table 1 Total urban and rural population of Bangladesh (in million)
Year Both Sex
Male Female Growth Rate (Annual)
Urban Population
Rural Population
2000 129.3 66.3 63.0 1.41 29.60 99.70 2001 131.1 67.1 62.9 1.54 30.00 101.10 2002 132.9 68.2 64.7 1.40 30.60 102.30 2003 134.8 69.1 65.7 1.43 31.30 103.50 2004 136.7 70.1 66.6 1.42 32.40 104.30 2010 143.0 73.4 69.6 1.4 33.9 109.1
One of the important challenges facing Bangladesh is its continuous increase of population.
In 2015 the total population of Bangladesh would be around 157.64 million and it would
further rise to 168.99 million in 2020 which would aggravate food insecurity problem of
10
Bangladesh. Bangladesh would face enormous challenges of increasing food production with
shrinking of crop lands and increased negative shocks of climate change.
In 2005, one quarter of the population resided in urban areas. By 2030, it is expected that 40
percent of the population will reside in cities and urban centers (UNFPA). One influencing
factor is the increase in population, which is projected to increase by approximately 40
million by 2030 (Table 2).
Table 2 Urban population as a percent of total population Year 1950 1960 1970 1980 1990 2000 2009 2015 2030
Urban population (%)
4.20 5.10 7.60 14.9 19.9 23.2 25.0 29.6 39.3
Source: UNFPA 2008
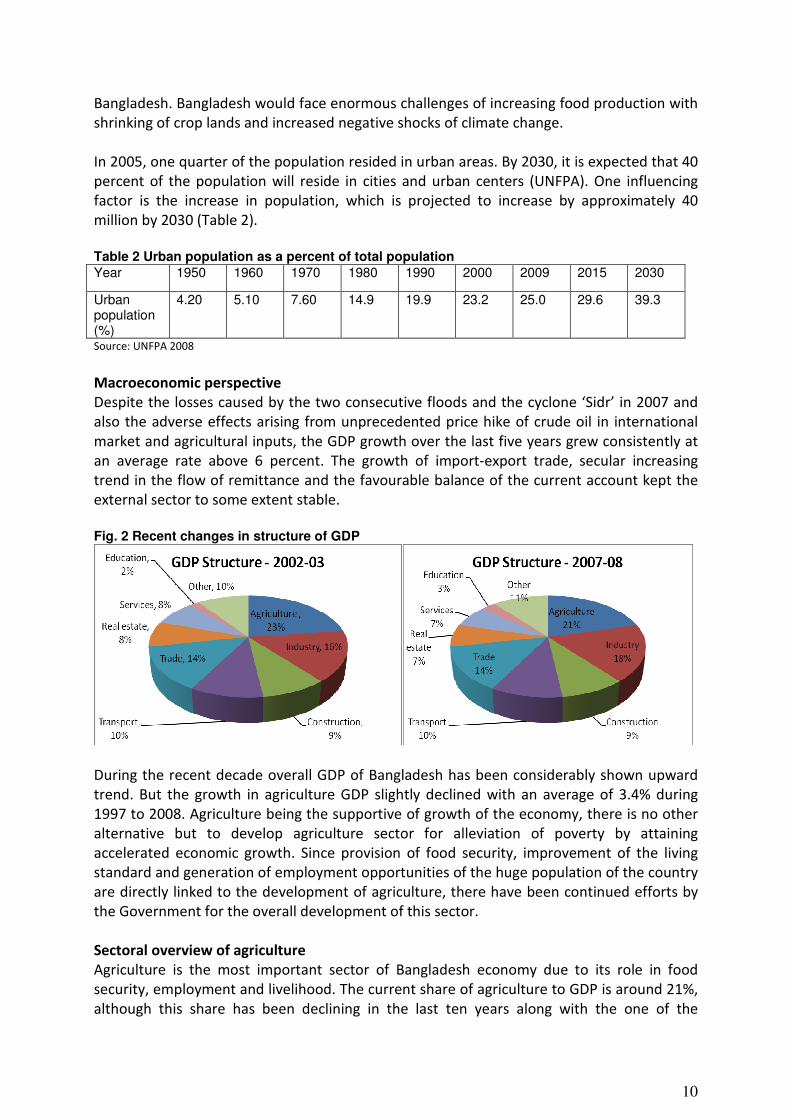
Macroeconomic perspective
Despite the losses caused by the two consecutive floods and the cyclone ‘Sidr’ in 2007 and
also the adverse effects arising from unprecedented price hike of crude oil in international
market and agricultural inputs, the GDP growth over the last five years grew consistently at
an average rate above 6 percent. The growth of import-export trade, secular increasing
trend in the flow of remittance and the favourable balance of the current account kept the
external sector to some extent stable.
Fig. 2 Recent changes in structure of GDP
During the recent decade overall GDP of Bangladesh has been considerably shown upward
trend. But the growth in agriculture GDP slightly declined with an average of 3.4% during
1997 to 2008. Agriculture being the supportive of growth of the economy, there is no other
alternative but to develop agriculture sector for alleviation of poverty by attaining
accelerated economic growth. Since provision of food security, improvement of the living
standard and generation of employment opportunities of the huge population of the country
are directly linked to the development of agriculture, there have been continued efforts by
the Government for the overall development of this sector.
Sectoral overview of agriculture
Agriculture is the most important sector of Bangladesh economy due to its role in food
security, employment and livelihood. The current share of agriculture to GDP is around 21%,
although this share has been declining in the last ten years along with the one of the
11
agricultural sub sectors’ (Table 1). Still more than 70% of the people in Bangladesh are
directly or indirectly employed in this sector.
The agriculture of Bangladesh is dominated by crops which accounts about half of total
agricultural GDP Fisheries & livestock are also important sub-sector contributing to
agricultural GDP (Table 3). It is important to note that in the recent decade the subsector of
livestock, forestry and fisheries had faster growth rate (Table 4). There are, however,
substantial year to year fluctuations in these rates and it is most pronounced in case of
crops.
Table 3.Contribution of agriculture to GDP (%) at constant prices (Base: 1995-96=100)
Sector/ Sub-Sector
Year
1999-00
2000-01
2001-02
2002-03
2003-04
2004-05
2005-06
2006-07
2007-08
Agriculture 25.58 25.03 23.99 23.47 23.08 22.28 21.85 21.37 20.88 A. Crops 14.59 14.7 13.75 13.43 13.23 12.51 12.28 12 11.7 B. Livestock 3.02 2.95 2.96 2.93 2.91 2.95 2.92 2.88 2.79 C. Forestry 1.88 1.87 1.88 1.86 1.83 1.82 1.79 1.76 1.75 D. Fishing 6.09 5.51 5.4 5.25 5.11 5 4.86 4.73 4.64
Source: Statistical Yearbook of Bangladesh 2007
Table 4.Growth rate of agriculture and its sub-sectors at constant price (Base: 1995-96=100)
Sector/ Sub-Sector
Year
1999-00
2000-01
2001-02
2002-03
2003-04
2004-05
2005-06
2006-07
2007-08
GDP growth rate 5.94 5.27 4.42 5.26 6.27 5.96 6.63 6.43 6.21 Agriculture 6.16 4.59 2.36 3.54 4.13 4.03 5.07 4.81 3.85 A. Crops 8.10 6.18 -2.39 2.88 4.27 0.15 5.03 4.43 3.44 B. Livestock 2.74 2.81 4.70 4.51 4.98 7.23 6.15 5.49 2.41 C. Forestry 4.94 4.85 4.91 4.43 4.18 5.09 5.18 5.24 5.42 D. Fishing 8.87 4.53 2.22 2.33 3.09 3.65 3.91 4.07 4.11
Source: Statistical Yearbook of Bangladesh 2007 & Statistical Pocket Book 2008
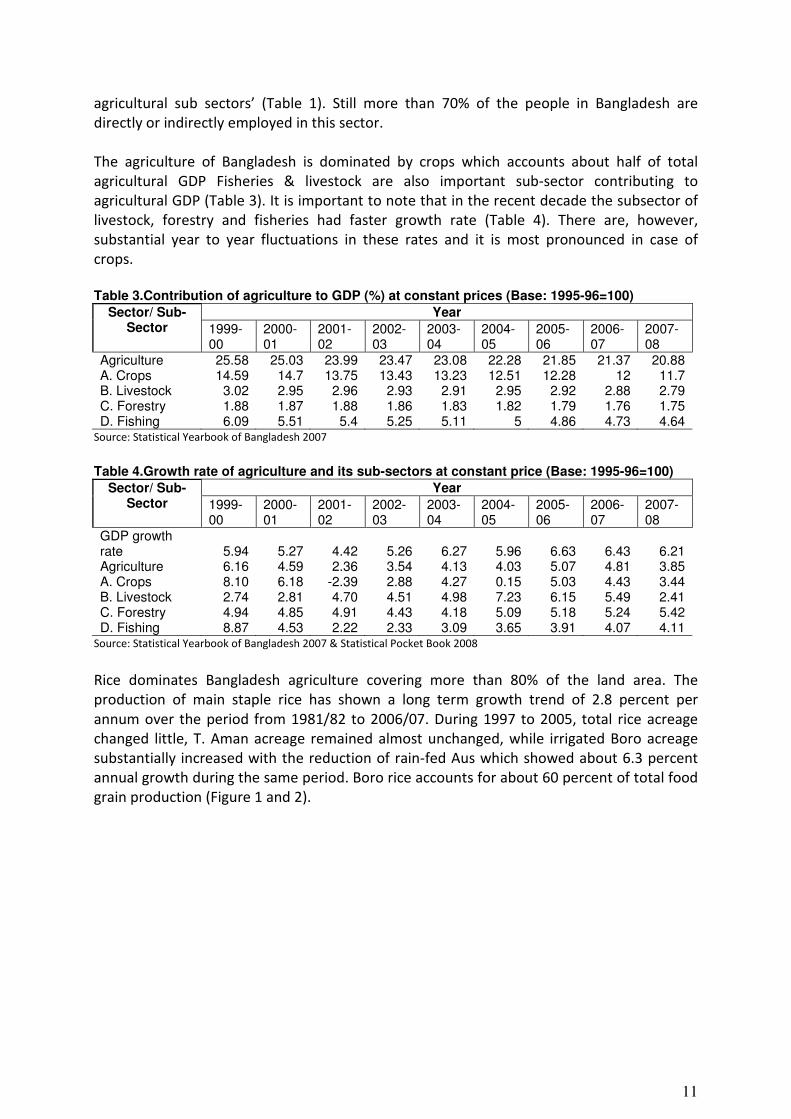
Rice dominates Bangladesh agriculture covering more than 80% of the land area. The
production of main staple rice has shown a long term growth trend of 2.8 percent per
annum over the period from 1981/82 to 2006/07. During 1997 to 2005, total rice acreage
changed little, T. Aman acreage remained almost unchanged, while irrigated Boro acreage
substantially increased with the reduction of rain-fed Aus which showed about 6.3 percent
annual growth during the same period. Boro rice accounts for about 60 percent of total food
grain production (Figure 1 and 2).
12
Figure 1. Rice acreage by season Figure 2. Rice output by season
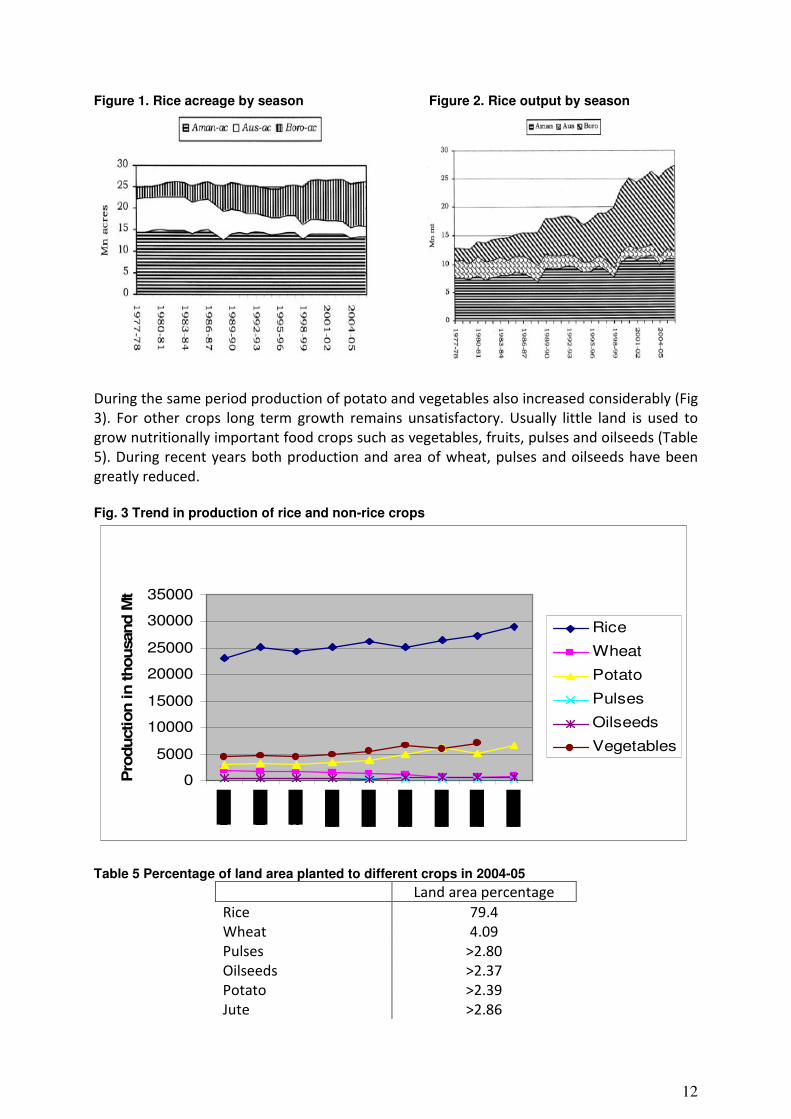
During the same period production of potato and vegetables also increased considerably (Fig
3). For other crops long term growth remains unsatisfactory. Usually little land is used to
grow nutritionally important food crops such as vegetables, fruits, pulses and oilseeds (Table
5). During recent years both production and area of wheat, pulses and oilseeds have been
greatly reduced.
Fig. 3 Trend in production of rice and non-rice crops
0
5000
10000
15000
20000
25000
30000
35000
Pro
duction in thousand M
t
Rice
Wheat
Potato
Pulses
Oilseeds
Vegetables
Table 5 Percentage of land area planted to different crops in 2004-05
Land area percentage
Rice 79.4
Wheat 4.09
Pulses >2.80
Oilseeds >2.37
Potato >2.39
Jute >2.86
13
Fruits >1.36
Sugar cane >1.15
Tea >0.39
Spices and condiments >2.21
Vegetable >2.14
During recent years both production and area of wheat, oilseed and pulses have greatly
reduced. The growth of pulses was only 0.3% while sugar was negative 1.2% other than rice
and potatoes all other crops showed the decline in growth rate (Table 6).
Table 6 Growth of non rice crops in Bangladesh during 1971 to 2007
Food Items Percent/Year
(1971-2007)
Wheat -2.9
Pulses 0.3
Oil crops 2.3
Potatoes 3.0
Vegetables 1.5
Sugar -1.2
Fish 2.5
Meat 2.3
Milk 2.3
Egg 4.0
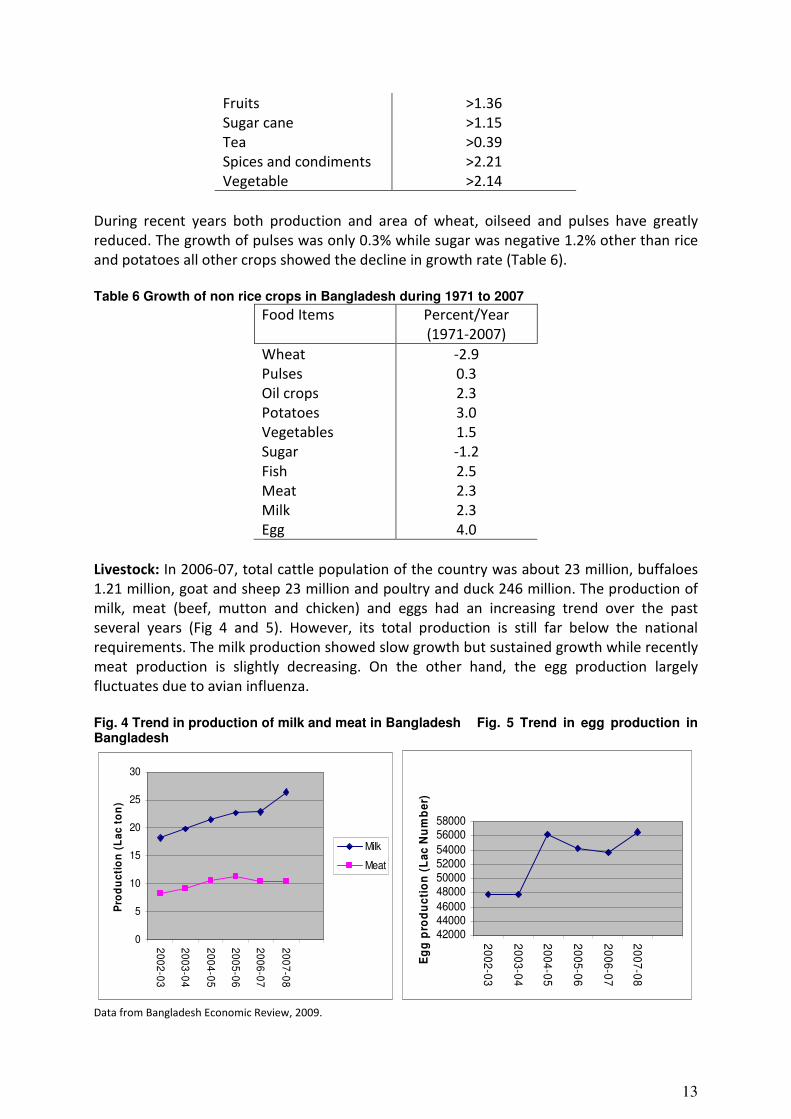
Livestock: In 2006-07, total cattle population of the country was about 23 million, buffaloes
1.21 million, goat and sheep 23 million and poultry and duck 246 million. The production of
milk, meat (beef, mutton and chicken) and eggs had an increasing trend over the past
several years (Fig 4 and 5). However, its total production is still far below the national
requirements. The milk production showed slow growth but sustained growth while recently
meat production is slightly decreasing. On the other hand, the egg production largely
fluctuates due to avian influenza.
Fig. 4 Trend in production of milk and meat in Bangladesh Fig. 5 Trend in egg production in Bangladesh
0
5
10
15
20
25
30
20
02
-03
20
03
-04
20
04
-05
20
05
-06
20
06
-07
20
07
-08
Pro
du
cti
on
(L
ac
to
n)
Milk
Meat
420004400046000
48000500005200054000
5600058000
20
02
-03
20
03
-04
20
04
-05
20
05
-06
20
06
-07
20
07
-08
Eg
g p
rod
uc
tio
n (
La
c N
um
be
r)
Data from Bangladesh Economic Review, 2009.
14
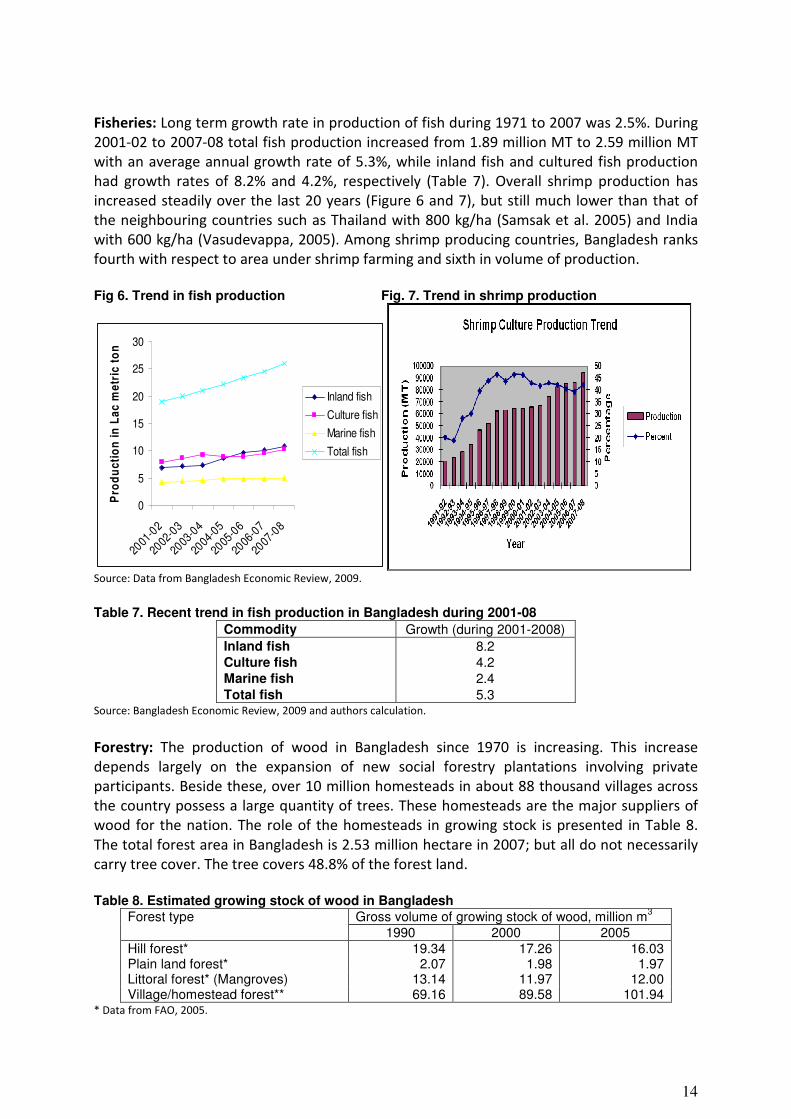
Fisheries: Long term growth rate in production of fish during 1971 to 2007 was 2.5%. During
2001-02 to 2007-08 total fish production increased from 1.89 million MT to 2.59 million MT
with an average annual growth rate of 5.3%, while inland fish and cultured fish production
had growth rates of 8.2% and 4.2%, respectively (Table 7). Overall shrimp production has
increased steadily over the last 20 years (Figure 6 and 7), but still much lower than that of
the neighbouring countries such as Thailand with 800 kg/ha (Samsak et al. 2005) and India
with 600 kg/ha (Vasudevappa, 2005). Among shrimp producing countries, Bangladesh ranks
fourth with respect to area under shrimp farming and sixth in volume of production.
Fig 6. Trend in fish production Fig. 7. Trend in shrimp production
0
5
10
15
20
25
30
2001
-02
2002
-03
2003
-04
2004
-05
2005
-06
2006
-07
2007
-08
Pro
du
cti
on
in
La
c m
etr
ic t
on
Inland fish
Culture fish
Marine fish
Total fish
Source: Data from Bangladesh Economic Review, 2009.
Table 7. Recent trend in fish production in Bangladesh during 2001-08
Commodity Growth (during 2001-2008)
Inland fish 8.2 Culture fish 4.2 Marine fish 2.4 Total fish 5.3
Source: Bangladesh Economic Review, 2009 and authors calculation.
Forestry: The production of wood in Bangladesh since 1970 is increasing. This increase
depends largely on the expansion of new social forestry plantations involving private
participants. Beside these, over 10 million homesteads in about 88 thousand villages across
the country possess a large quantity of trees. These homesteads are the major suppliers of
wood for the nation. The role of the homesteads in growing stock is presented in Table 8.
The total forest area in Bangladesh is 2.53 million hectare in 2007; but all do not necessarily
carry tree cover. The tree covers 48.8% of the forest land.
Table 8. Estimated growing stock of wood in Bangladesh
Forest type Gross volume of growing stock of wood, million m3
1990 2000 2005 Hill forest* 19.34 17.26 16.03 Plain land forest* 2.07 1.98 1.97 Littoral forest* (Mangroves) 13.14 11.97 12.00 Village/homestead forest** 69.16 89.58 101.94
* Data from FAO, 2005.
15
**Hammermaster data of 54.8 million m3 in 1981 with growth rate of 2.62 ( Choudhury and Hossain 2009 used to derive
the estimated data).
Current Food security situation
About 40% of Bangladesh’s total population are calorie poor, consuming less than 2122 kcal
per capita per day, while one-fifth of population are hard core poor who consume less than
1805 kcal per capita per day (BBS, 2007). According to SOFI 2009, Bangladesh has an
estimated 40.2 million undernourished people in 2004-061. One positive aspect is that the
proportion of undernourished in total population has declined from 36% in 1990-92 to 26%
in 2004-06. Out of a total of 336.6 people who are estimated to be undernourished in South
Asia, 12% comes from Bangladesh (India’s share is 75%). The most recent estimates
(Household Income Expenditure Survey – HIES, 2005) revised to up to 56 million (still 40% of
the population) the absolute number of undernourished people, those who fail to meet
minimum level of caloric consumption needs of 2122 Kcals/person/day. Within this
population 27 million are unable to consume 1805 Kcal/person/day and 11 million are below
the consumption level of 1600 Kcal/person/day.
Food security worsens with inter-year shortfall in food grain production caused by climatic
variations and natural disaster such as floods, tidal surge and insect and pest attacks.
Variations in food intake also exist between regions of the country, between adults and
children and between men and women at the household level.
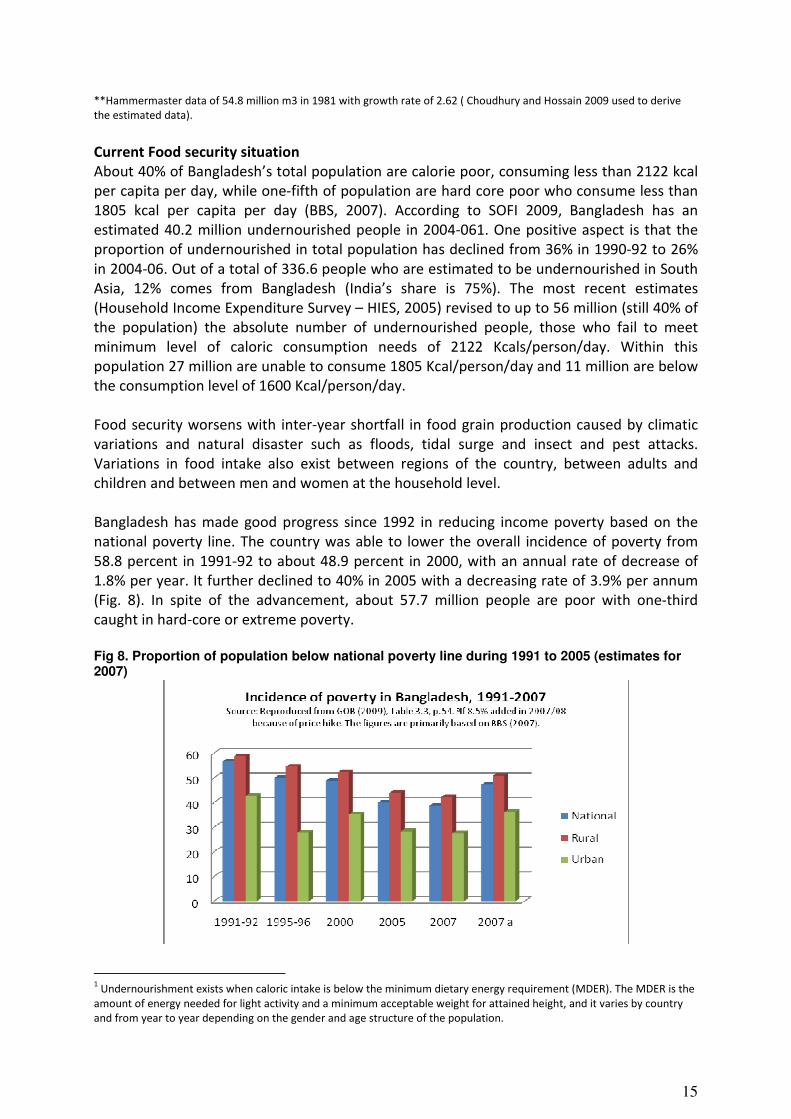
Bangladesh has made good progress since 1992 in reducing income poverty based on the
national poverty line. The country was able to lower the overall incidence of poverty from
58.8 percent in 1991-92 to about 48.9 percent in 2000, with an annual rate of decrease of
1.8% per year. It further declined to 40% in 2005 with a decreasing rate of 3.9% per annum
(Fig. 8). In spite of the advancement, about 57.7 million people are poor with one-third
caught in hard-core or extreme poverty.
Fig 8. Proportion of population below national poverty line during 1991 to 2005 (estimates for 2007)
1 Undernourishment exists when caloric intake is below the minimum dietary energy requirement (MDER). The MDER is the
amount of energy needed for light activity and a minimum acceptable weight for attained height, and it varies by country
and from year to year depending on the gender and age structure of the population.
16
Some historical programmes for climate change adaptation in Bangladesh by GOB
Since the 1970s, the Government of Bangladesh, with the support of development partners,
has invested in:
1. Flood management schemes to raise the agricultural productivity of many thousands
of km of low-lying rural areas and to protect them from extremely damaging severe
floods;
2. Flood protection and drainage schemes to protect urban areas from rainwater and
river flooding during the monsoon season;
3. Coastal embankment projects, involving over 6,000 km of embankments and polder
schemes, designed to raise agricultural productivity in coastal areas by preventing
tidal flooding and incursion of saline water;
4. Over 2,000 cyclone shelters to provide refuges for communities from storm surges
caused by tropical cyclones and 200 shelters from river floods;
5. Comprehensive disaster management projects, involving community-based
programmes and early warning systems for floods and cyclones;
6. Irrigation schemes to enable farmers to grow a dry season rice crop in areas subject
to heavy monsoon flooding and in other parts of the country, including drought-
prone areas;
7. Agricultural research programmes to develop saline, drought and flood-adapted high
yielding varieties of rice and other crops, based on the traditional varieties evolved
over centuries by Bangladeshi farmers;
8. Coastal 'greenbelt' projects, involving mangrove planting along nearly 9,000 km of
the shoreline.
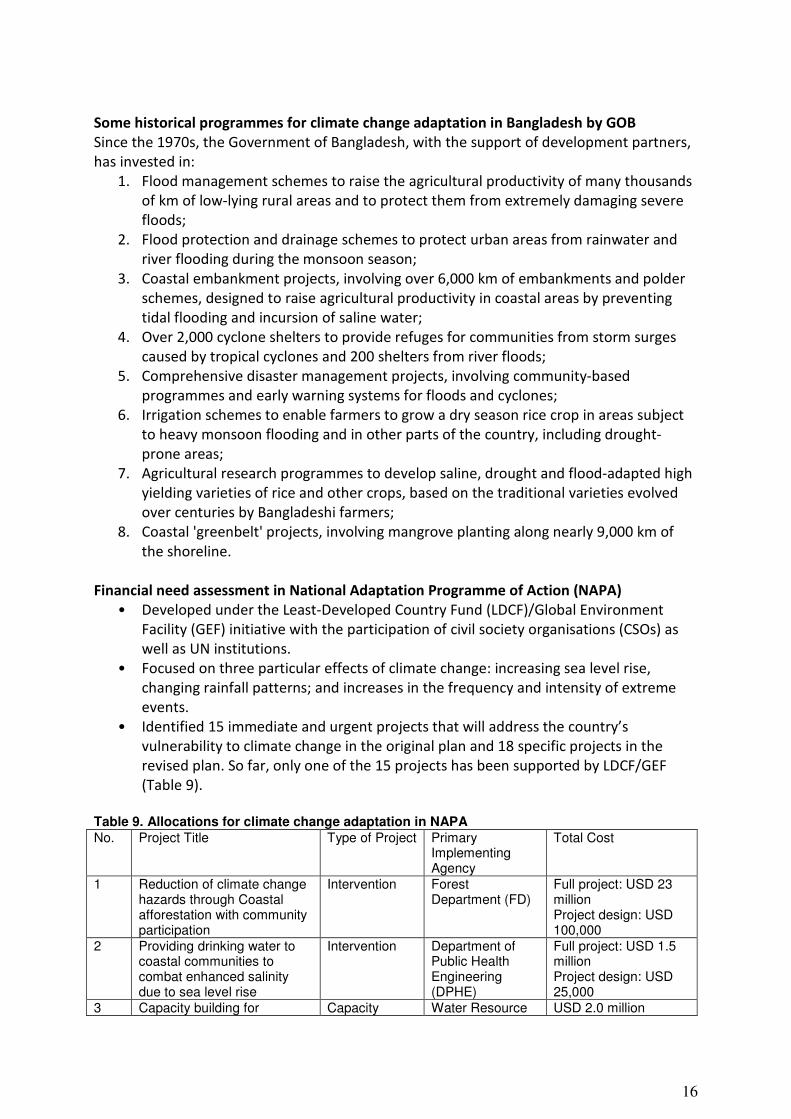
Financial need assessment in National Adaptation Programme of Action (NAPA)
• Developed under the Least-Developed Country Fund (LDCF)/Global Environment
Facility (GEF) initiative with the participation of civil society organisations (CSOs) as
well as UN institutions.
• Focused on three particular effects of climate change: increasing sea level rise,
changing rainfall patterns; and increases in the frequency and intensity of extreme
events.
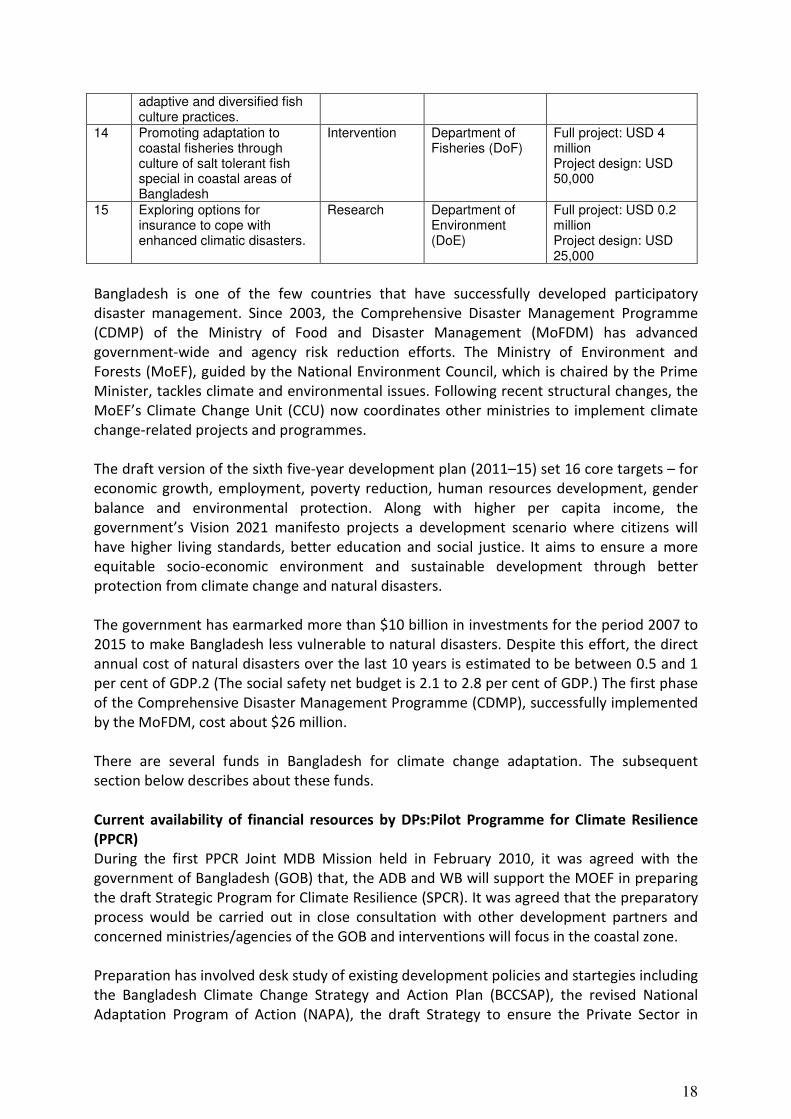
• Identified 15 immediate and urgent projects that will address the country’s
vulnerability to climate change in the original plan and 18 specific projects in the
revised plan. So far, only one of the 15 projects has been supported by LDCF/GEF
(Table 9).
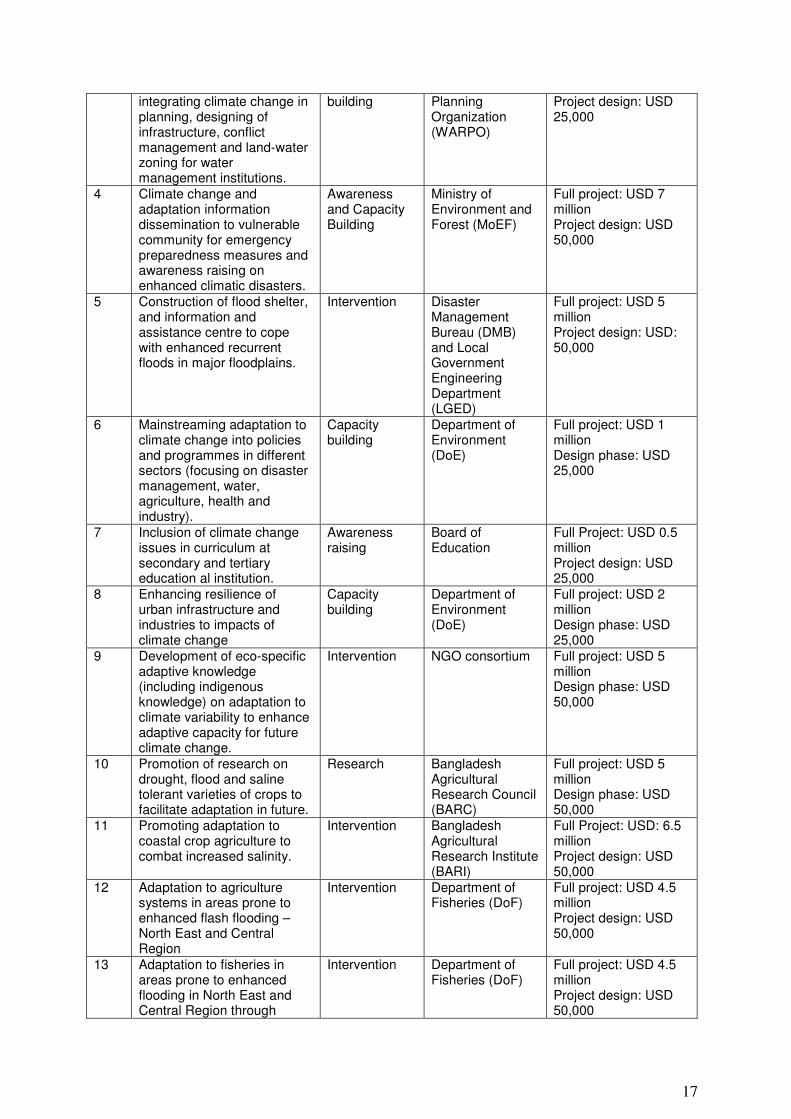
Table 9. Allocations for climate change adaptation in NAPA No. Project Title Type of Project Primary
Implementing Agency
Total Cost
1 Reduction of climate change hazards through Coastal afforestation with community participation
Intervention Forest Department (FD)
Full project: USD 23 million Project design: USD 100,000
2 Providing drinking water to coastal communities to combat enhanced salinity due to sea level rise
Intervention Department of Public Health Engineering (DPHE)
Full project: USD 1.5 million Project design: USD 25,000
3 Capacity building for Capacity Water Resource USD 2.0 million
17
integrating climate change in planning, designing of infrastructure, conflict management and land-water zoning for water management institutions.
building Planning Organization (WARPO)
Project design: USD 25,000
4 Climate change and adaptation information dissemination to vulnerable community for emergency preparedness measures and awareness raising on enhanced climatic disasters.
Awareness and Capacity Building
Ministry of Environment and Forest (MoEF)
Full project: USD 7 million Project design: USD 50,000
5 Construction of flood shelter, and information and assistance centre to cope with enhanced recurrent floods in major floodplains.
Intervention Disaster Management Bureau (DMB) and Local Government Engineering Department (LGED)
Full project: USD 5 million Project design: USD: 50,000
6 Mainstreaming adaptation to climate change into policies and programmes in different sectors (focusing on disaster management, water, agriculture, health and industry).
Capacity building
Department of Environment (DoE)
Full project: USD 1 million Design phase: USD 25,000
7 Inclusion of climate change issues in curriculum at secondary and tertiary education al institution.
Awareness raising
Board of Education
Full Project: USD 0.5 million Project design: USD 25,000
8 Enhancing resilience of urban infrastructure and industries to impacts of climate change
Capacity building
Department of Environment (DoE)
Full project: USD 2 million Design phase: USD 25,000
9 Development of eco-specific adaptive knowledge (including indigenous knowledge) on adaptation to climate variability to enhance adaptive capacity for future climate change.
Intervention NGO consortium Full project: USD 5 million Design phase: USD 50,000
10 Promotion of research on drought, flood and saline tolerant varieties of crops to facilitate adaptation in future.
Research Bangladesh Agricultural Research Council (BARC)
Full project: USD 5 million Design phase: USD 50,000
11 Promoting adaptation to coastal crop agriculture to combat increased salinity.
Intervention Bangladesh Agricultural Research Institute (BARI)
Full Project: USD: 6.5 million Project design: USD 50,000
12 Adaptation to agriculture systems in areas prone to enhanced flash flooding – North East and Central Region
Intervention Department of Fisheries (DoF)
Full project: USD 4.5 million Project design: USD 50,000
13 Adaptation to fisheries in areas prone to enhanced flooding in North East and Central Region through
Intervention Department of Fisheries (DoF)
Full project: USD 4.5 million Project design: USD 50,000
18
adaptive and diversified fish culture practices.
14 Promoting adaptation to coastal fisheries through culture of salt tolerant fish special in coastal areas of Bangladesh
Intervention Department of Fisheries (DoF)
Full project: USD 4 million Project design: USD 50,000
15 Exploring options for insurance to cope with enhanced climatic disasters.
Research Department of Environment (DoE)
Full project: USD 0.2 million Project design: USD 25,000
Bangladesh is one of the few countries that have successfully developed participatory
disaster management. Since 2003, the Comprehensive Disaster Management Programme
(CDMP) of the Ministry of Food and Disaster Management (MoFDM) has advanced
government-wide and agency risk reduction efforts. The Ministry of Environment and
Forests (MoEF), guided by the National Environment Council, which is chaired by the Prime
Minister, tackles climate and environmental issues. Following recent structural changes, the
MoEF’s Climate Change Unit (CCU) now coordinates other ministries to implement climate
change-related projects and programmes.
The draft version of the sixth five-year development plan (2011–15) set 16 core targets – for
economic growth, employment, poverty reduction, human resources development, gender
balance and environmental protection. Along with higher per capita income, the
government’s Vision 2021 manifesto projects a development scenario where citizens will
have higher living standards, better education and social justice. It aims to ensure a more
equitable socio-economic environment and sustainable development through better
protection from climate change and natural disasters.
The government has earmarked more than $10 billion in investments for the period 2007 to
2015 to make Bangladesh less vulnerable to natural disasters. Despite this effort, the direct
annual cost of natural disasters over the last 10 years is estimated to be between 0.5 and 1
per cent of GDP.2 (The social safety net budget is 2.1 to 2.8 per cent of GDP.) The first phase
of the Comprehensive Disaster Management Programme (CDMP), successfully implemented
by the MoFDM, cost about $26 million.
There are several funds in Bangladesh for climate change adaptation. The subsequent
section below describes about these funds.
Current availability of financial resources by DPs:Pilot Programme for Climate Resilience
(PPCR)
During the first PPCR Joint MDB Mission held in February 2010, it was agreed with the
government of Bangladesh (GOB) that, the ADB and WB will support the MOEF in preparing
the draft Strategic Program for Climate Resilience (SPCR). It was agreed that the preparatory
process would be carried out in close consultation with other development partners and
concerned ministries/agencies of the GOB and interventions will focus in the coastal zone.
Preparation has involved desk study of existing development policies and startegies including
the Bangladesh Climate Change Strategy and Action Plan (BCCSAP), the revised National
Adaptation Program of Action (NAPA), the draft Strategy to ensure the Private Sector in
19
Climate Change Adaptation in Bangladesh, other relevant report, studies and policies on
climate change particularly for the coastal zone, and a stocking of planned and ongoing
climate change projects by GOB, MDBS, development partners, the private sector and NGOs.
During the MDB’s held various consultations and meetings with BWDB, DMB, BMD, MOFDM,
MOEF, LGED, FD, ERD, all government agencies associated with the PPCR process and
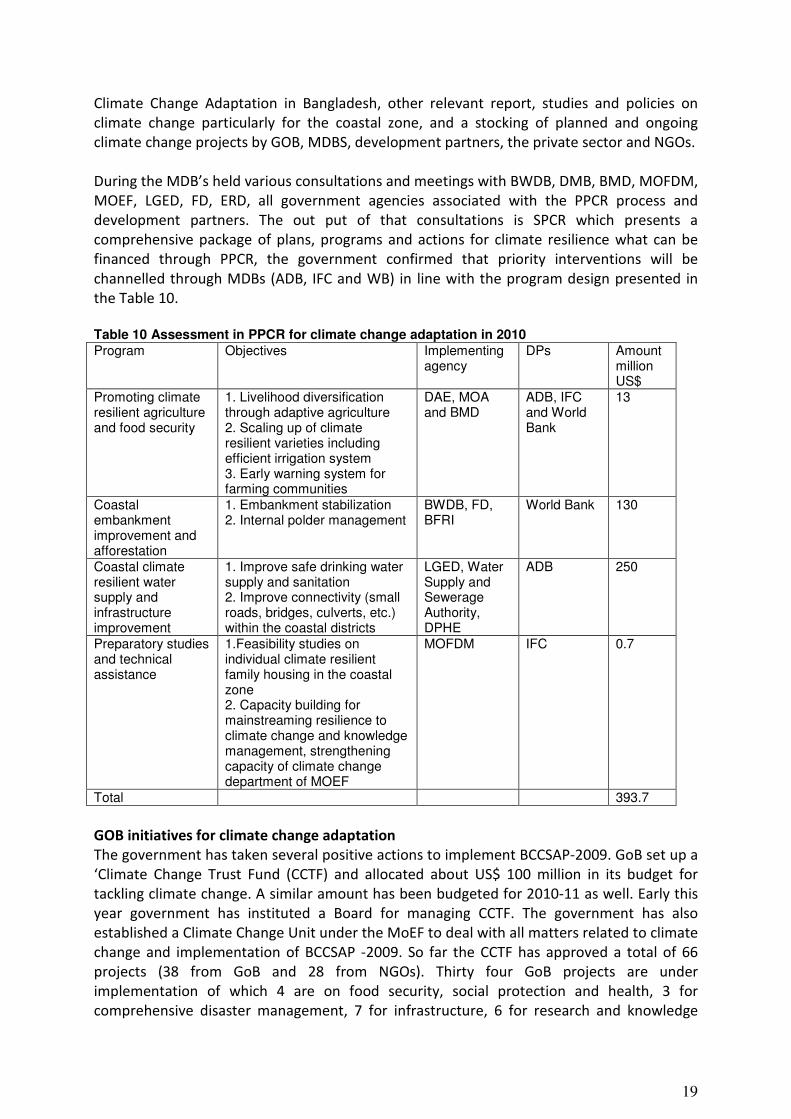
development partners. The out put of that consultations is SPCR which presents a
comprehensive package of plans, programs and actions for climate resilience what can be
financed through PPCR, the government confirmed that priority interventions will be
channelled through MDBs (ADB, IFC and WB) in line with the program design presented in
the Table 10.
Table 10 Assessment in PPCR for climate change adaptation in 2010 Program Objectives Implementing
agency DPs Amount
million US$
Promoting climate resilient agriculture and food security
1. Livelihood diversification through adaptive agriculture 2. Scaling up of climate resilient varieties including efficient irrigation system 3. Early warning system for farming communities
DAE, MOA and BMD
ADB, IFC and World Bank
13
Coastal embankment improvement and afforestation
1. Embankment stabilization 2. Internal polder management
BWDB, FD, BFRI
World Bank 130
Coastal climate resilient water supply and infrastructure improvement
1. Improve safe drinking water supply and sanitation 2. Improve connectivity (small roads, bridges, culverts, etc.) within the coastal districts
LGED, Water Supply and Sewerage Authority, DPHE
ADB 250
Preparatory studies and technical assistance
1.Feasibility studies on individual climate resilient family housing in the coastal zone 2. Capacity building for mainstreaming resilience to climate change and knowledge management, strengthening capacity of climate change department of MOEF
MOFDM IFC 0.7
Total 393.7
GOB initiatives for climate change adaptation
The government has taken several positive actions to implement BCCSAP-2009. GoB set up a
‘Climate Change Trust Fund (CCTF) and allocated about US$ 100 million in its budget for
tackling climate change. A similar amount has been budgeted for 2010-11 as well. Early this
year government has instituted a Board for managing CCTF. The government has also
established a Climate Change Unit under the MoEF to deal with all matters related to climate
change and implementation of BCCSAP -2009. So far the CCTF has approved a total of 66
projects (38 from GoB and 28 from NGOs). Thirty four GoB projects are under
implementation of which 4 are on food security, social protection and health, 3 for
comprehensive disaster management, 7 for infrastructure, 6 for research and knowledge
20
development and 6 for mitigation and low carbon development. The country has invested
heavily in adaptation measures such as flood management schemes, coastal embankments,
cyclone and flood shelters, as well as raising roads and highways and research and
development towards climate resilient farming. Over the last three decades Bangladesh has
developed some ability to manage disasters, in particular, floods and cyclones.
The governments of Bangladesh and the United Kingdom jointly organized a conference in
London in September 2008 to highlight the climate change vulnerability of Bangladesh and
need for international cooperation. In the London conference, a multi-donor trust fund for
climate change was proposed as a modality for the Development Partners (DPs) to support
Bangladesh in implementing the BCCSAP.
Following this, the Bangladesh Climate Change Resilience Fund with an amount of US$ 110
million with contribution from number of donors was set up in May 2010. The DFID has
committed US$86.7 million, Sweden US$11.5 million, Denmark US$1.6 million (DKK 10
million) and the EU US$10.4 million to BCCRF. No other DPs so far made any commitment to
the BCCRF. The World Bank Group and Asian Development Bank are processing a project
entitled the Pilot Programme for Climate Resilience (PPCR) for US$110 million from global
fund as part of the Climate Change Investment Fund. During recent years several DPs are
active and only now committing some resources, but mostly with Technical Assistance (TA)
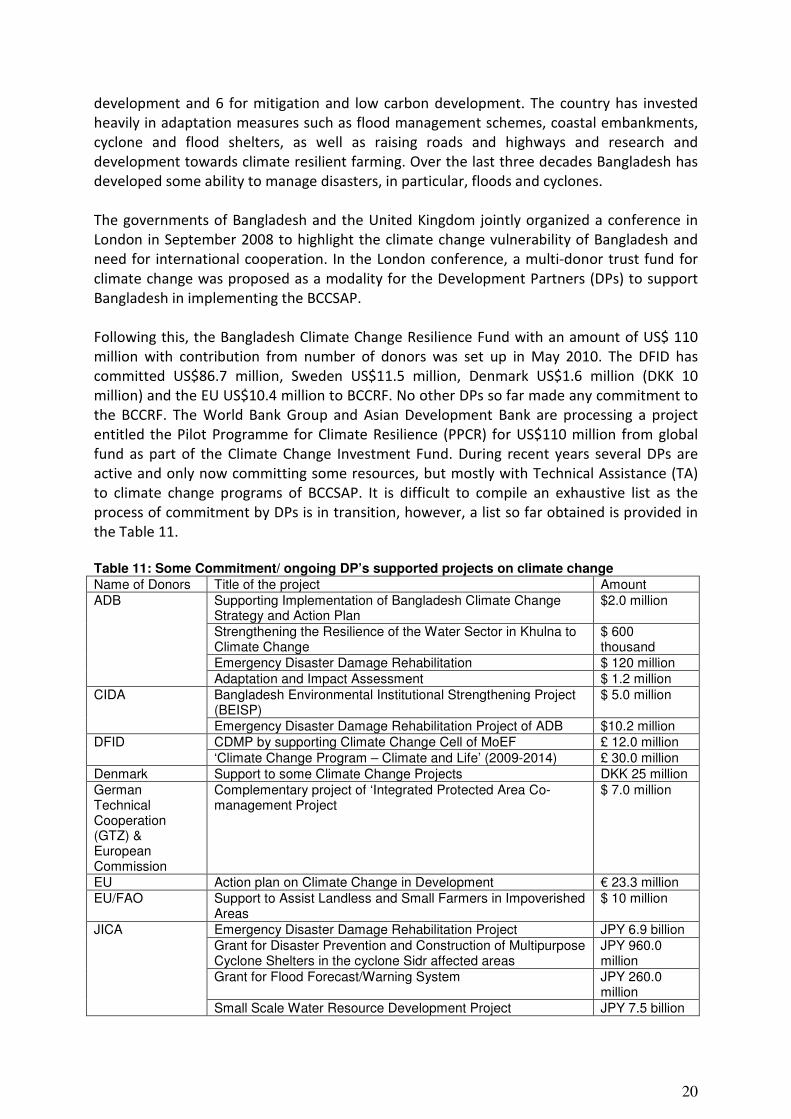
to climate change programs of BCCSAP. It is difficult to compile an exhaustive list as the
process of commitment by DPs is in transition, however, a list so far obtained is provided in
the Table 11.
Table 11: Some Commitment/ ongoing DP’s supported projects on climate change Name of Donors Title of the project Amount ADB Supporting Implementation of Bangladesh Climate Change
Strategy and Action Plan $2.0 million
Strengthening the Resilience of the Water Sector in Khulna to Climate Change
$ 600 thousand
Emergency Disaster Damage Rehabilitation $ 120 million Adaptation and Impact Assessment $ 1.2 million
CIDA Bangladesh Environmental Institutional Strengthening Project (BEISP)
$ 5.0 million
Emergency Disaster Damage Rehabilitation Project of ADB $10.2 million DFID CDMP by supporting Climate Change Cell of MoEF £ 12.0 million
‘Climate Change Program – Climate and Life’ (2009-2014) £ 30.0 million Denmark Support to some Climate Change Projects DKK 25 million German Technical Cooperation (GTZ) & European Commission
Complementary project of ‘Integrated Protected Area Co-management Project
$ 7.0 million
EU Action plan on Climate Change in Development € 23.3 million EU/FAO Support to Assist Landless and Small Farmers in Impoverished
Areas $ 10 million
JICA Emergency Disaster Damage Rehabilitation Project JPY 6.9 billion Grant for Disaster Prevention and Construction of Multipurpose Cyclone Shelters in the cyclone Sidr affected areas
JPY 960.0 million
Grant for Flood Forecast/Warning System JPY 260.0 million
Small Scale Water Resource Development Project JPY 7.5 billion
21
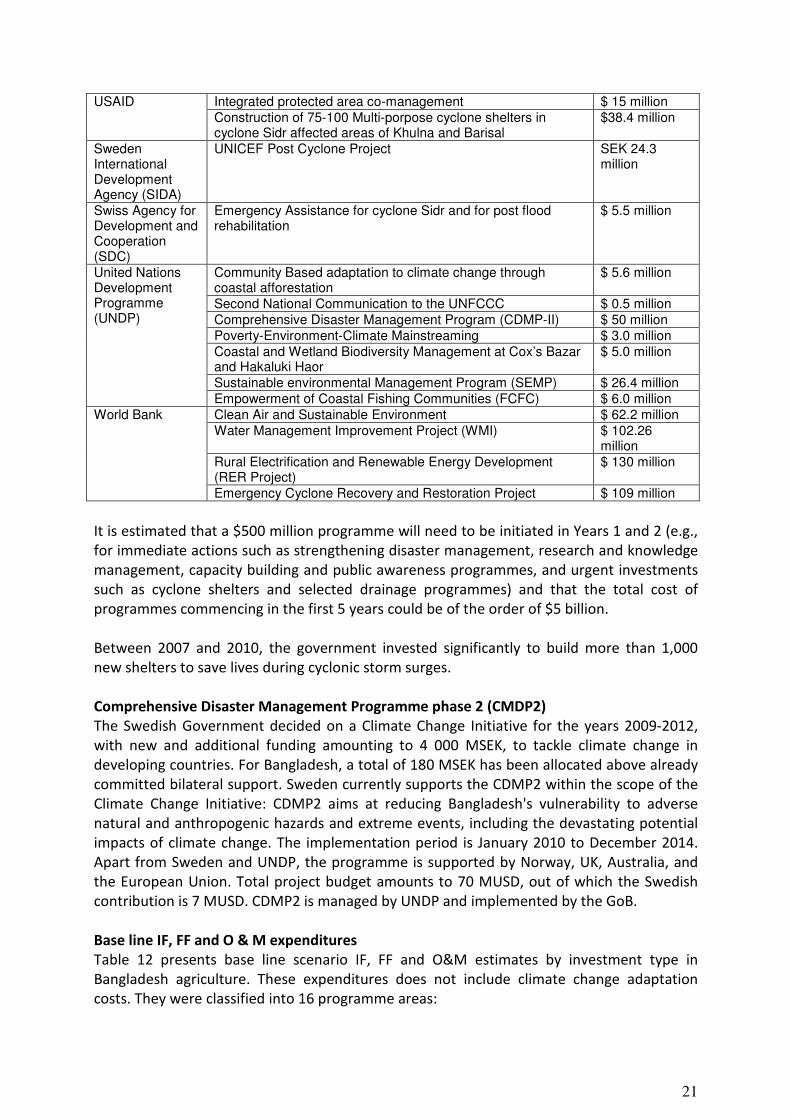
USAID Integrated protected area co-management $ 15 million Construction of 75-100 Multi-porpose cyclone shelters in cyclone Sidr affected areas of Khulna and Barisal
$38.4 million
Sweden International Development Agency (SIDA)
UNICEF Post Cyclone Project SEK 24.3 million
Swiss Agency for Development and Cooperation (SDC)
Emergency Assistance for cyclone Sidr and for post flood rehabilitation
$ 5.5 million
United Nations Development Programme (UNDP)
Community Based adaptation to climate change through coastal afforestation
$ 5.6 million
Second National Communication to the UNFCCC $ 0.5 million Comprehensive Disaster Management Program (CDMP-II) $ 50 million Poverty-Environment-Climate Mainstreaming $ 3.0 million Coastal and Wetland Biodiversity Management at Cox’s Bazar and Hakaluki Haor
$ 5.0 million
Sustainable environmental Management Program (SEMP) $ 26.4 million Empowerment of Coastal Fishing Communities (FCFC) $ 6.0 million
World Bank Clean Air and Sustainable Environment $ 62.2 million Water Management Improvement Project (WMI) $ 102.26
million Rural Electrification and Renewable Energy Development (RER Project)
$ 130 million
Emergency Cyclone Recovery and Restoration Project $ 109 million
It is estimated that a $500 million programme will need to be initiated in Years 1 and 2 (e.g.,
for immediate actions such as strengthening disaster management, research and knowledge
management, capacity building and public awareness programmes, and urgent investments
such as cyclone shelters and selected drainage programmes) and that the total cost of
programmes commencing in the first 5 years could be of the order of $5 billion.
Between 2007 and 2010, the government invested significantly to build more than 1,000
new shelters to save lives during cyclonic storm surges.
Comprehensive Disaster Management Programme phase 2 (CMDP2)
The Swedish Government decided on a Climate Change Initiative for the years 2009-2012,
with new and additional funding amounting to 4 000 MSEK, to tackle climate change in
developing countries. For Bangladesh, a total of 180 MSEK has been allocated above already
committed bilateral support. Sweden currently supports the CDMP2 within the scope of the
Climate Change Initiative: CDMP2 aims at reducing Bangladesh's vulnerability to adverse
natural and anthropogenic hazards and extreme events, including the devastating potential
impacts of climate change. The implementation period is January 2010 to December 2014.
Apart from Sweden and UNDP, the programme is supported by Norway, UK, Australia, and
the European Union. Total project budget amounts to 70 MUSD, out of which the Swedish
contribution is 7 MUSD. CDMP2 is managed by UNDP and implemented by the GoB.
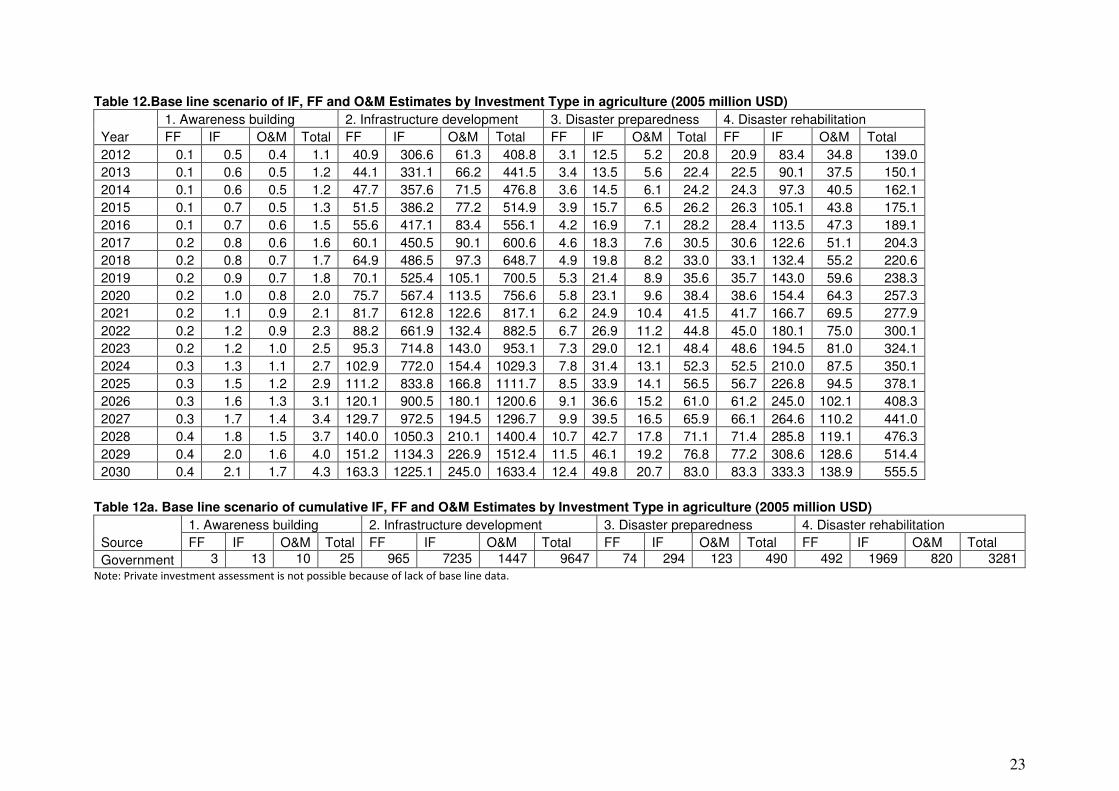
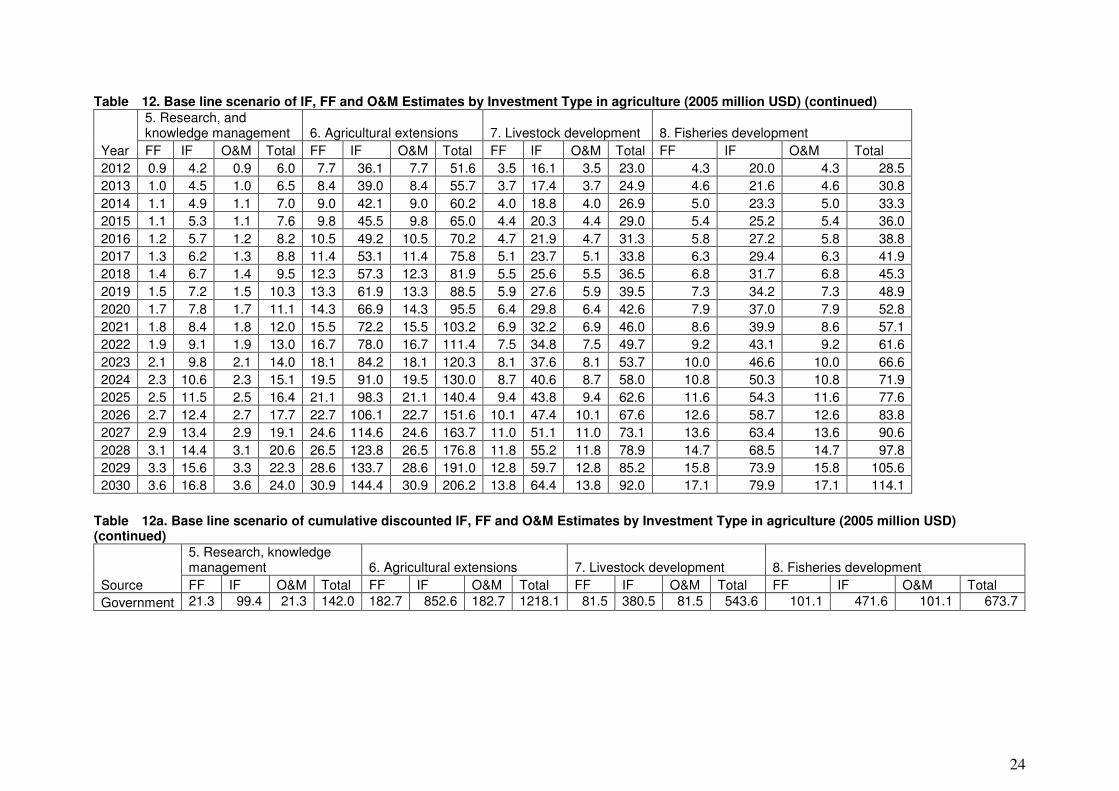
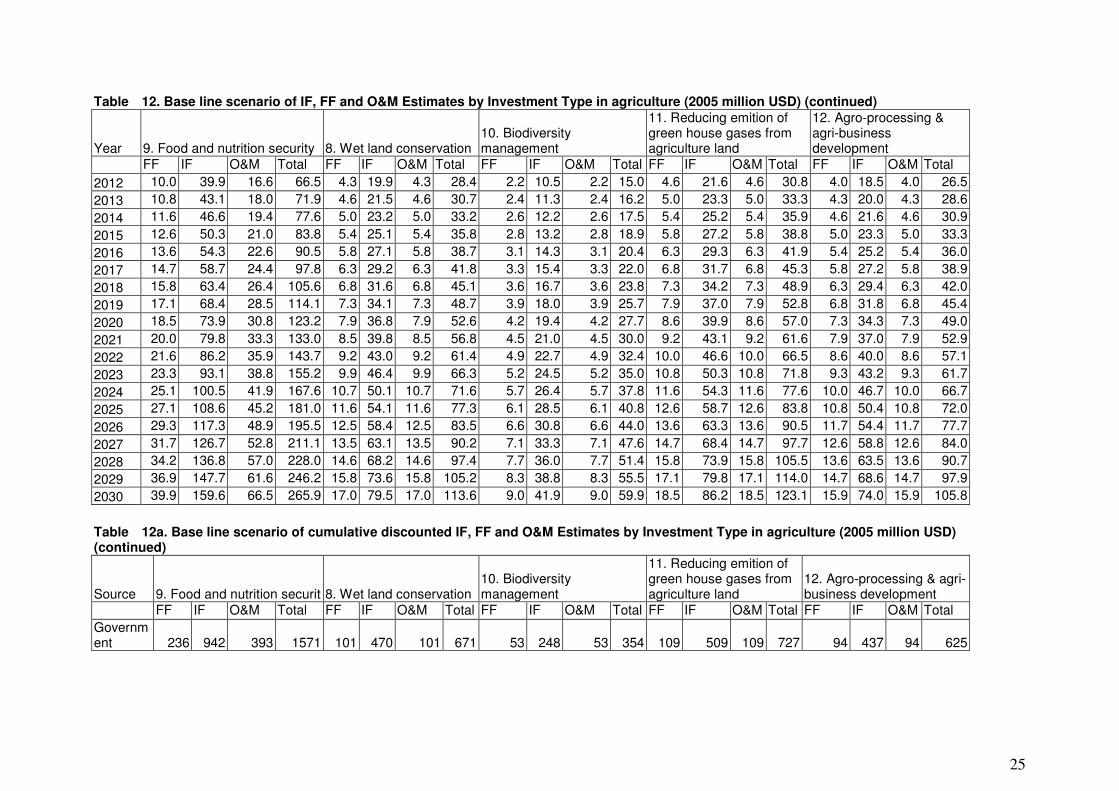
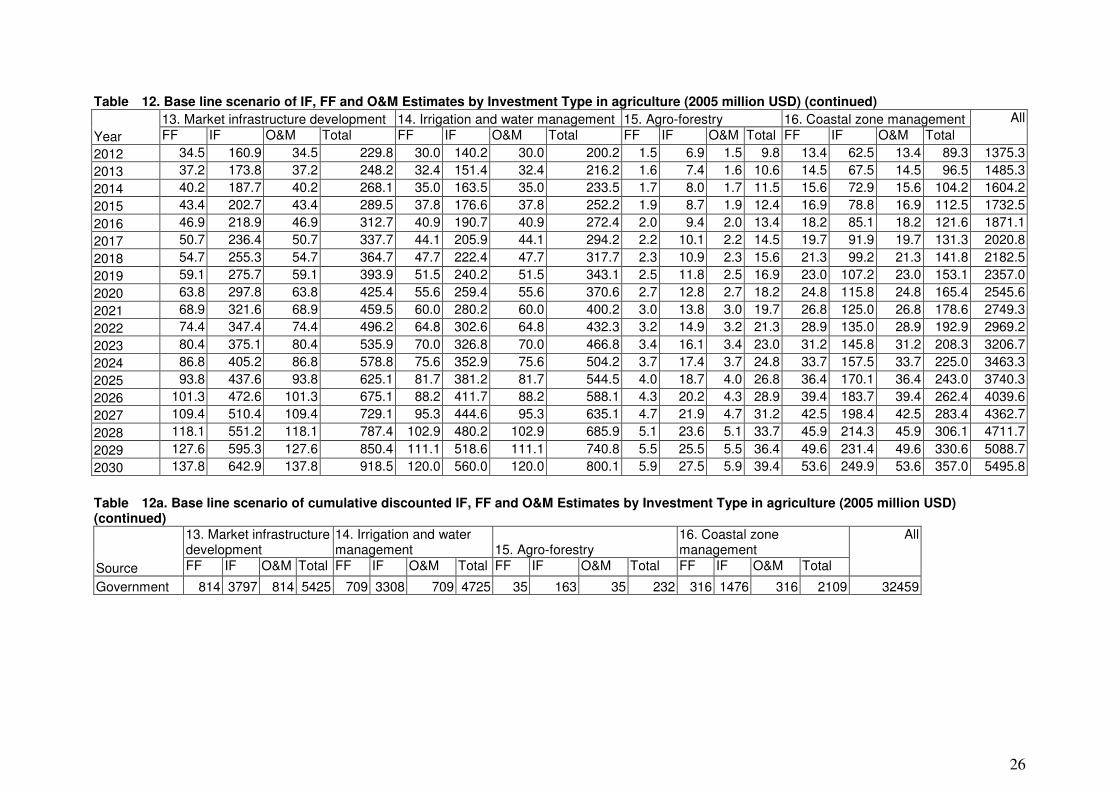
Base line IF, FF and O & M expenditures
Table 12 presents base line scenario IF, FF and O&M estimates by investment type in
Bangladesh agriculture. These expenditures does not include climate change adaptation
costs. They were classified into 16 programme areas:

22
1. Awareness building. 2. Infrastructure development, 3. Disaster preparedness, 4. Disaster
rehabilitation, 5. Research, Technology generation and knowledge management, 6.
Agricultural extensions, 7. Livestock development, 8. Fisheries development, 9. Food and
nutrition security, 8. Wet land conservation , 10. Biodiversity management, 11. Reducing
emition of green house gases from agriculture land, ,12. Agro-processing & agri-business
development, 13. Market infrastructure development, 14. Irrigation and water management,
15. Agro-forestry, 16. Coastal zone management.
23
Table 12.Base line scenario of IF, FF and O&M Estimates by Investment Type in agriculture (2005 million USD)
Year
1. Awareness building 2. Infrastructure development 3. Disaster preparedness 4. Disaster rehabilitation
FF IF O&M Total FF IF O&M Total FF IF O&M Total FF IF O&M Total
2012 0.1 0.5 0.4 1.1 40.9 306.6 61.3 408.8 3.1 12.5 5.2 20.8 20.9 83.4 34.8 139.0
2013 0.1 0.6 0.5 1.2 44.1 331.1 66.2 441.5 3.4 13.5 5.6 22.4 22.5 90.1 37.5 150.1
2014 0.1 0.6 0.5 1.2 47.7 357.6 71.5 476.8 3.6 14.5 6.1 24.2 24.3 97.3 40.5 162.1
2015 0.1 0.7 0.5 1.3 51.5 386.2 77.2 514.9 3.9 15.7 6.5 26.2 26.3 105.1 43.8 175.1
2016 0.1 0.7 0.6 1.5 55.6 417.1 83.4 556.1 4.2 16.9 7.1 28.2 28.4 113.5 47.3 189.1
2017 0.2 0.8 0.6 1.6 60.1 450.5 90.1 600.6 4.6 18.3 7.6 30.5 30.6 122.6 51.1 204.3
2018 0.2 0.8 0.7 1.7 64.9 486.5 97.3 648.7 4.9 19.8 8.2 33.0 33.1 132.4 55.2 220.6
2019 0.2 0.9 0.7 1.8 70.1 525.4 105.1 700.5 5.3 21.4 8.9 35.6 35.7 143.0 59.6 238.3
2020 0.2 1.0 0.8 2.0 75.7 567.4 113.5 756.6 5.8 23.1 9.6 38.4 38.6 154.4 64.3 257.3
2021 0.2 1.1 0.9 2.1 81.7 612.8 122.6 817.1 6.2 24.9 10.4 41.5 41.7 166.7 69.5 277.9
2022 0.2 1.2 0.9 2.3 88.2 661.9 132.4 882.5 6.7 26.9 11.2 44.8 45.0 180.1 75.0 300.1
2023 0.2 1.2 1.0 2.5 95.3 714.8 143.0 953.1 7.3 29.0 12.1 48.4 48.6 194.5 81.0 324.1
2024 0.3 1.3 1.1 2.7 102.9 772.0 154.4 1029.3 7.8 31.4 13.1 52.3 52.5 210.0 87.5 350.1
2025 0.3 1.5 1.2 2.9 111.2 833.8 166.8 1111.7 8.5 33.9 14.1 56.5 56.7 226.8 94.5 378.1
2026 0.3 1.6 1.3 3.1 120.1 900.5 180.1 1200.6 9.1 36.6 15.2 61.0 61.2 245.0 102.1 408.3
2027 0.3 1.7 1.4 3.4 129.7 972.5 194.5 1296.7 9.9 39.5 16.5 65.9 66.1 264.6 110.2 441.0
2028 0.4 1.8 1.5 3.7 140.0 1050.3 210.1 1400.4 10.7 42.7 17.8 71.1 71.4 285.8 119.1 476.3
2029 0.4 2.0 1.6 4.0 151.2 1134.3 226.9 1512.4 11.5 46.1 19.2 76.8 77.2 308.6 128.6 514.4
2030 0.4 2.1 1.7 4.3 163.3 1225.1 245.0 1633.4 12.4 49.8 20.7 83.0 83.3 333.3 138.9 555.5
Table 12a. Base line scenario of cumulative IF, FF and O&M Estimates by Investment Type in agriculture (2005 million USD)
Source
1. Awareness building 2. Infrastructure development 3. Disaster preparedness 4. Disaster rehabilitation
FF IF O&M Total FF IF O&M Total FF IF O&M Total FF IF O&M Total
Government 3 13 10 25 965 7235 1447 9647 74 294 123 490 492 1969 820 3281
Note: Private investment assessment is not possible because of lack of base line data.
24
Table 12. Base line scenario of IF, FF and O&M Estimates by Investment Type in agriculture (2005 million USD) (continued)
Year
5. Research, and knowledge management 6. Agricultural extensions 7. Livestock development 8. Fisheries development
FF IF O&M Total FF IF O&M Total FF IF O&M Total FF IF O&M Total
2012 0.9 4.2 0.9 6.0 7.7 36.1 7.7 51.6 3.5 16.1 3.5 23.0 4.3 20.0 4.3 28.5
2013 1.0 4.5 1.0 6.5 8.4 39.0 8.4 55.7 3.7 17.4 3.7 24.9 4.6 21.6 4.6 30.8
2014 1.1 4.9 1.1 7.0 9.0 42.1 9.0 60.2 4.0 18.8 4.0 26.9 5.0 23.3 5.0 33.3
2015 1.1 5.3 1.1 7.6 9.8 45.5 9.8 65.0 4.4 20.3 4.4 29.0 5.4 25.2 5.4 36.0
2016 1.2 5.7 1.2 8.2 10.5 49.2 10.5 70.2 4.7 21.9 4.7 31.3 5.8 27.2 5.8 38.8
2017 1.3 6.2 1.3 8.8 11.4 53.1 11.4 75.8 5.1 23.7 5.1 33.8 6.3 29.4 6.3 41.9
2018 1.4 6.7 1.4 9.5 12.3 57.3 12.3 81.9 5.5 25.6 5.5 36.5 6.8 31.7 6.8 45.3
2019 1.5 7.2 1.5 10.3 13.3 61.9 13.3 88.5 5.9 27.6 5.9 39.5 7.3 34.2 7.3 48.9
2020 1.7 7.8 1.7 11.1 14.3 66.9 14.3 95.5 6.4 29.8 6.4 42.6 7.9 37.0 7.9 52.8
2021 1.8 8.4 1.8 12.0 15.5 72.2 15.5 103.2 6.9 32.2 6.9 46.0 8.6 39.9 8.6 57.1
2022 1.9 9.1 1.9 13.0 16.7 78.0 16.7 111.4 7.5 34.8 7.5 49.7 9.2 43.1 9.2 61.6
2023 2.1 9.8 2.1 14.0 18.1 84.2 18.1 120.3 8.1 37.6 8.1 53.7 10.0 46.6 10.0 66.6
2024 2.3 10.6 2.3 15.1 19.5 91.0 19.5 130.0 8.7 40.6 8.7 58.0 10.8 50.3 10.8 71.9
2025 2.5 11.5 2.5 16.4 21.1 98.3 21.1 140.4 9.4 43.8 9.4 62.6 11.6 54.3 11.6 77.6
2026 2.7 12.4 2.7 17.7 22.7 106.1 22.7 151.6 10.1 47.4 10.1 67.6 12.6 58.7 12.6 83.8
2027 2.9 13.4 2.9 19.1 24.6 114.6 24.6 163.7 11.0 51.1 11.0 73.1 13.6 63.4 13.6 90.6
2028 3.1 14.4 3.1 20.6 26.5 123.8 26.5 176.8 11.8 55.2 11.8 78.9 14.7 68.5 14.7 97.8
2029 3.3 15.6 3.3 22.3 28.6 133.7 28.6 191.0 12.8 59.7 12.8 85.2 15.8 73.9 15.8 105.6
2030 3.6 16.8 3.6 24.0 30.9 144.4 30.9 206.2 13.8 64.4 13.8 92.0 17.1 79.9 17.1 114.1
Table 12a. Base line scenario of cumulative discounted IF, FF and O&M Estimates by Investment Type in agriculture (2005 million USD) (continued)
Source
5. Research, knowledge management 6. Agricultural extensions 7. Livestock development 8. Fisheries development
FF IF O&M Total FF IF O&M Total FF IF O&M Total FF IF O&M Total
Government 21.3 99.4 21.3 142.0 182.7 852.6 182.7 1218.1 81.5 380.5 81.5 543.6 101.1 471.6 101.1 673.7
25
Table 12. Base line scenario of IF, FF and O&M Estimates by Investment Type in agriculture (2005 million USD) (continued)
Year 9. Food and nutrition security 8. Wet land conservation 10. Biodiversity management
11. Reducing emition of green house gases from agriculture land
12. Agro-processing & agri-business development
FF IF O&M Total FF IF O&M Total FF IF O&M Total FF IF O&M Total FF IF O&M Total
2012 10.0 39.9 16.6 66.5 4.3 19.9 4.3 28.4 2.2 10.5 2.2 15.0 4.6 21.6 4.6 30.8 4.0 18.5 4.0 26.5
2013 10.8 43.1 18.0 71.9 4.6 21.5 4.6 30.7 2.4 11.3 2.4 16.2 5.0 23.3 5.0 33.3 4.3 20.0 4.3 28.6
2014 11.6 46.6 19.4 77.6 5.0 23.2 5.0 33.2 2.6 12.2 2.6 17.5 5.4 25.2 5.4 35.9 4.6 21.6 4.6 30.9
2015 12.6 50.3 21.0 83.8 5.4 25.1 5.4 35.8 2.8 13.2 2.8 18.9 5.8 27.2 5.8 38.8 5.0 23.3 5.0 33.3
2016 13.6 54.3 22.6 90.5 5.8 27.1 5.8 38.7 3.1 14.3 3.1 20.4 6.3 29.3 6.3 41.9 5.4 25.2 5.4 36.0
2017 14.7 58.7 24.4 97.8 6.3 29.2 6.3 41.8 3.3 15.4 3.3 22.0 6.8 31.7 6.8 45.3 5.8 27.2 5.8 38.9
2018 15.8 63.4 26.4 105.6 6.8 31.6 6.8 45.1 3.6 16.7 3.6 23.8 7.3 34.2 7.3 48.9 6.3 29.4 6.3 42.0
2019 17.1 68.4 28.5 114.1 7.3 34.1 7.3 48.7 3.9 18.0 3.9 25.7 7.9 37.0 7.9 52.8 6.8 31.8 6.8 45.4
2020 18.5 73.9 30.8 123.2 7.9 36.8 7.9 52.6 4.2 19.4 4.2 27.7 8.6 39.9 8.6 57.0 7.3 34.3 7.3 49.0
2021 20.0 79.8 33.3 133.0 8.5 39.8 8.5 56.8 4.5 21.0 4.5 30.0 9.2 43.1 9.2 61.6 7.9 37.0 7.9 52.9
2022 21.6 86.2 35.9 143.7 9.2 43.0 9.2 61.4 4.9 22.7 4.9 32.4 10.0 46.6 10.0 66.5 8.6 40.0 8.6 57.1
2023 23.3 93.1 38.8 155.2 9.9 46.4 9.9 66.3 5.2 24.5 5.2 35.0 10.8 50.3 10.8 71.8 9.3 43.2 9.3 61.7
2024 25.1 100.5 41.9 167.6 10.7 50.1 10.7 71.6 5.7 26.4 5.7 37.8 11.6 54.3 11.6 77.6 10.0 46.7 10.0 66.7
2025 27.1 108.6 45.2 181.0 11.6 54.1 11.6 77.3 6.1 28.5 6.1 40.8 12.6 58.7 12.6 83.8 10.8 50.4 10.8 72.0
2026 29.3 117.3 48.9 195.5 12.5 58.4 12.5 83.5 6.6 30.8 6.6 44.0 13.6 63.3 13.6 90.5 11.7 54.4 11.7 77.7
2027 31.7 126.7 52.8 211.1 13.5 63.1 13.5 90.2 7.1 33.3 7.1 47.6 14.7 68.4 14.7 97.7 12.6 58.8 12.6 84.0
2028 34.2 136.8 57.0 228.0 14.6 68.2 14.6 97.4 7.7 36.0 7.7 51.4 15.8 73.9 15.8 105.5 13.6 63.5 13.6 90.7
2029 36.9 147.7 61.6 246.2 15.8 73.6 15.8 105.2 8.3 38.8 8.3 55.5 17.1 79.8 17.1 114.0 14.7 68.6 14.7 97.9
2030 39.9 159.6 66.5 265.9 17.0 79.5 17.0 113.6 9.0 41.9 9.0 59.9 18.5 86.2 18.5 123.1 15.9 74.0 15.9 105.8
Table 12a. Base line scenario of cumulative discounted IF, FF and O&M Estimates by Investment Type in agriculture (2005 million USD) (continued)
Source 9. Food and nutrition securit 8. Wet land conservation 10. Biodiversity management
11. Reducing emition of green house gases from agriculture land
12. Agro-processing & agri-business development
FF IF O&M Total FF IF O&M Total FF IF O&M Total FF IF O&M Total FF IF O&M Total
Government 236 942 393 1571 101 470 101 671 53 248 53 354 109 509 109 727 94 437 94 625
26
Table 12. Base line scenario of IF, FF and O&M Estimates by Investment Type in agriculture (2005 million USD) (continued)
Year
13. Market infrastructure development 14. Irrigation and water management 15. Agro-forestry 16. Coastal zone management All
FF IF O&M Total FF IF O&M Total FF IF O&M Total FF IF O&M Total
2012 34.5 160.9 34.5 229.8 30.0 140.2 30.0 200.2 1.5 6.9 1.5 9.8 13.4 62.5 13.4 89.3 1375.3
2013 37.2 173.8 37.2 248.2 32.4 151.4 32.4 216.2 1.6 7.4 1.6 10.6 14.5 67.5 14.5 96.5 1485.3
2014 40.2 187.7 40.2 268.1 35.0 163.5 35.0 233.5 1.7 8.0 1.7 11.5 15.6 72.9 15.6 104.2 1604.2
2015 43.4 202.7 43.4 289.5 37.8 176.6 37.8 252.2 1.9 8.7 1.9 12.4 16.9 78.8 16.9 112.5 1732.5
2016 46.9 218.9 46.9 312.7 40.9 190.7 40.9 272.4 2.0 9.4 2.0 13.4 18.2 85.1 18.2 121.6 1871.1
2017 50.7 236.4 50.7 337.7 44.1 205.9 44.1 294.2 2.2 10.1 2.2 14.5 19.7 91.9 19.7 131.3 2020.8
2018 54.7 255.3 54.7 364.7 47.7 222.4 47.7 317.7 2.3 10.9 2.3 15.6 21.3 99.2 21.3 141.8 2182.5
2019 59.1 275.7 59.1 393.9 51.5 240.2 51.5 343.1 2.5 11.8 2.5 16.9 23.0 107.2 23.0 153.1 2357.0
2020 63.8 297.8 63.8 425.4 55.6 259.4 55.6 370.6 2.7 12.8 2.7 18.2 24.8 115.8 24.8 165.4 2545.6
2021 68.9 321.6 68.9 459.5 60.0 280.2 60.0 400.2 3.0 13.8 3.0 19.7 26.8 125.0 26.8 178.6 2749.3
2022 74.4 347.4 74.4 496.2 64.8 302.6 64.8 432.3 3.2 14.9 3.2 21.3 28.9 135.0 28.9 192.9 2969.2
2023 80.4 375.1 80.4 535.9 70.0 326.8 70.0 466.8 3.4 16.1 3.4 23.0 31.2 145.8 31.2 208.3 3206.7
2024 86.8 405.2 86.8 578.8 75.6 352.9 75.6 504.2 3.7 17.4 3.7 24.8 33.7 157.5 33.7 225.0 3463.3
2025 93.8 437.6 93.8 625.1 81.7 381.2 81.7 544.5 4.0 18.7 4.0 26.8 36.4 170.1 36.4 243.0 3740.3
2026 101.3 472.6 101.3 675.1 88.2 411.7 88.2 588.1 4.3 20.2 4.3 28.9 39.4 183.7 39.4 262.4 4039.6
2027 109.4 510.4 109.4 729.1 95.3 444.6 95.3 635.1 4.7 21.9 4.7 31.2 42.5 198.4 42.5 283.4 4362.7
2028 118.1 551.2 118.1 787.4 102.9 480.2 102.9 685.9 5.1 23.6 5.1 33.7 45.9 214.3 45.9 306.1 4711.7
2029 127.6 595.3 127.6 850.4 111.1 518.6 111.1 740.8 5.5 25.5 5.5 36.4 49.6 231.4 49.6 330.6 5088.7
2030 137.8 642.9 137.8 918.5 120.0 560.0 120.0 800.1 5.9 27.5 5.9 39.4 53.6 249.9 53.6 357.0 5495.8
Table 12a. Base line scenario of cumulative discounted IF, FF and O&M Estimates by Investment Type in agriculture (2005 million USD) (continued)
Source
13. Market infrastructure development
14. Irrigation and water management 15. Agro-forestry
16. Coastal zone management
All
FF IF O&M Total FF IF O&M Total FF IF O&M Total FF IF O&M Total
Government 814 3797 814 5425 709 3308 709 4725 35 163 35 232 316 1476 316 2109 32459
27
2.2.5 Adaptation Scenario
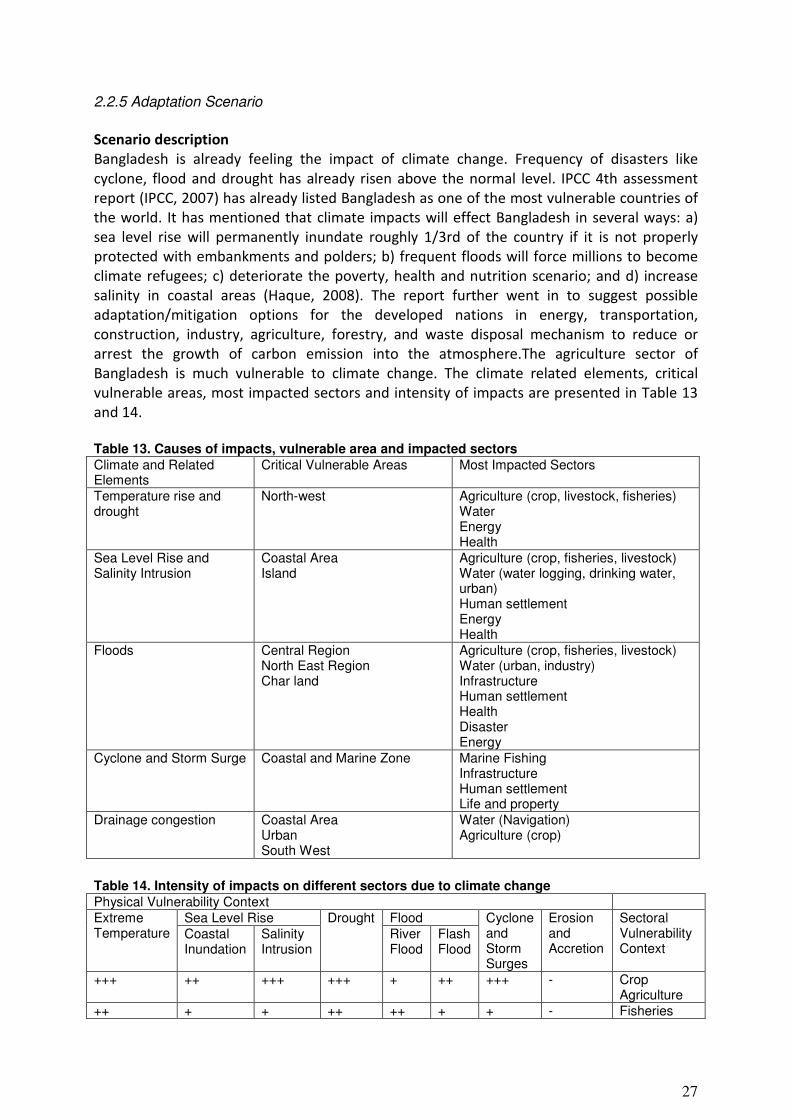
Scenario description
Bangladesh is already feeling the impact of climate change. Frequency of disasters like
cyclone, flood and drought has already risen above the normal level. IPCC 4th assessment
report (IPCC, 2007) has already listed Bangladesh as one of the most vulnerable countries of
the world. It has mentioned that climate impacts will effect Bangladesh in several ways: a)
sea level rise will permanently inundate roughly 1/3rd of the country if it is not properly
protected with embankments and polders; b) frequent floods will force millions to become
climate refugees; c) deteriorate the poverty, health and nutrition scenario; and d) increase
salinity in coastal areas (Haque, 2008). The report further went in to suggest possible
adaptation/mitigation options for the developed nations in energy, transportation,
construction, industry, agriculture, forestry, and waste disposal mechanism to reduce or
arrest the growth of carbon emission into the atmosphere.The agriculture sector of
Bangladesh is much vulnerable to climate change. The climate related elements, critical
vulnerable areas, most impacted sectors and intensity of impacts are presented in Table 13
and 14.
Table 13. Causes of impacts, vulnerable area and impacted sectors Climate and Related Elements
Critical Vulnerable Areas Most Impacted Sectors
Temperature rise and drought
North-west Agriculture (crop, livestock, fisheries) Water Energy Health
Sea Level Rise and Salinity Intrusion
Coastal Area Island
Agriculture (crop, fisheries, livestock) Water (water logging, drinking water, urban) Human settlement Energy Health
Floods Central Region North East Region Char land
Agriculture (crop, fisheries, livestock) Water (urban, industry) Infrastructure Human settlement Health Disaster Energy
Cyclone and Storm Surge Coastal and Marine Zone Marine Fishing Infrastructure Human settlement Life and property
Drainage congestion Coastal Area Urban South West
Water (Navigation) Agriculture (crop)
Table 14. Intensity of impacts on different sectors due to climate change Physical Vulnerability Context Extreme Temperature
Sea Level Rise Drought Flood Cyclone and Storm Surges
Erosion and Accretion
Sectoral Vulnerability Context
Coastal Inundation
Salinity Intrusion
River Flood
Flash Flood
+++ ++ +++ +++ + ++ +++ - Crop Agriculture
++ + + ++ ++ + + - Fisheries
28
++ ++ +++ - - + +++ - Livestock + ++ - - ++ + + +++ Infrastructure ++ +++ ++ - ++ + + - Industries ++ +++ +++ - ++ - + - Biodiversity +++ + +++ - ++ - ++ - Health - - - - - - +++ +++ Human
Settlement ++ + - - + - + - Energy
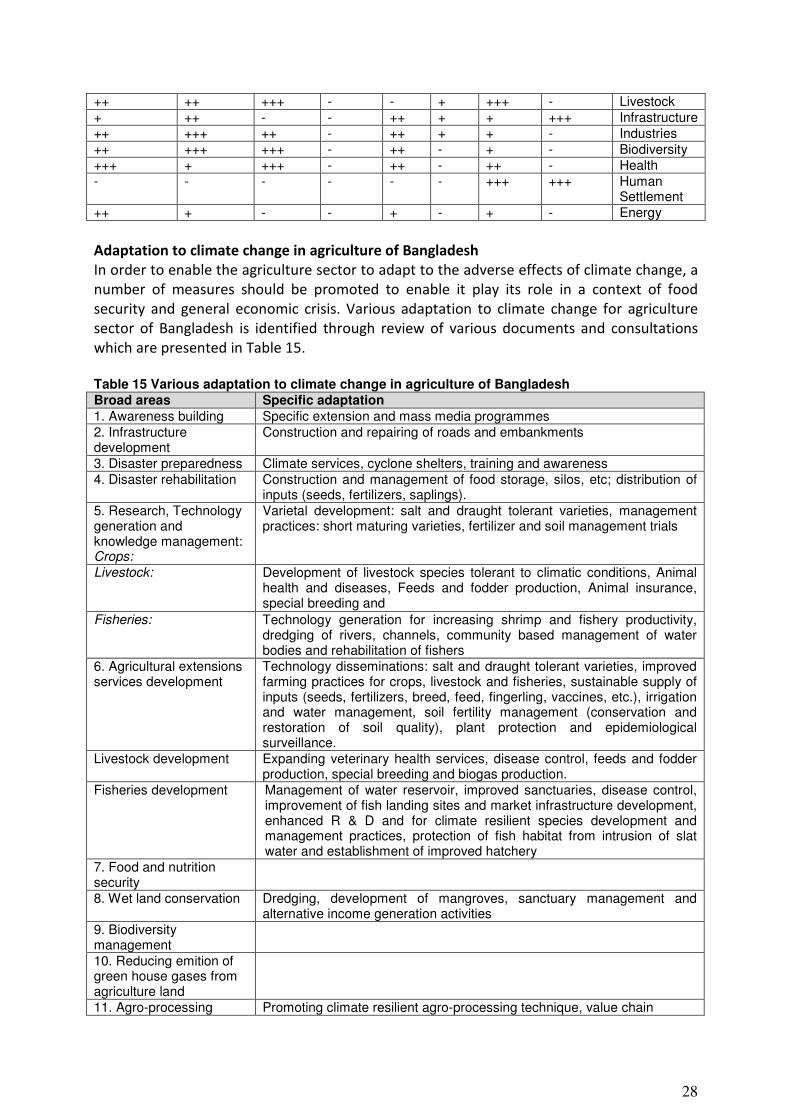
Adaptation to climate change in agriculture of Bangladesh
In order to enable the agriculture sector to adapt to the adverse effects of climate change, a
number of measures should be promoted to enable it play its role in a context of food
security and general economic crisis. Various adaptation to climate change for agriculture
sector of Bangladesh is identified through review of various documents and consultations
which are presented in Table 15.
Table 15 Various adaptation to climate change in agriculture of Bangladesh Broad areas Specific adaptation 1. Awareness building Specific extension and mass media programmes 2. Infrastructure development
Construction and repairing of roads and embankments
3. Disaster preparedness Climate services, cyclone shelters, training and awareness 4. Disaster rehabilitation Construction and management of food storage, silos, etc; distribution of
inputs (seeds, fertilizers, saplings). 5. Research, Technology generation and knowledge management: Crops:
Varietal development: salt and draught tolerant varieties, management practices: short maturing varieties, fertilizer and soil management trials
Livestock: Development of livestock species tolerant to climatic conditions, Animal health and diseases, Feeds and fodder production, Animal insurance, special breeding and
Fisheries: Technology generation for increasing shrimp and fishery productivity, dredging of rivers, channels, community based management of water bodies and rehabilitation of fishers
6. Agricultural extensions services development
Technology disseminations: salt and draught tolerant varieties, improved farming practices for crops, livestock and fisheries, sustainable supply of inputs (seeds, fertilizers, breed, feed, fingerling, vaccines, etc.), irrigation and water management, soil fertility management (conservation and restoration of soil quality), plant protection and epidemiological surveillance.
Livestock development Expanding veterinary health services, disease control, feeds and fodder production, special breeding and biogas production.
Fisheries development Management of water reservoir, improved sanctuaries, disease control, improvement of fish landing sites and market infrastructure development, enhanced R & D and for climate resilient species development and management practices, protection of fish habitat from intrusion of slat water and establishment of improved hatchery
7. Food and nutrition security
8. Wet land conservation Dredging, development of mangroves, sanctuary management and alternative income generation activities
9. Biodiversity management
10. Reducing emition of green house gases from agriculture land
11. Agro-processing Promoting climate resilient agro-processing technique, value chain
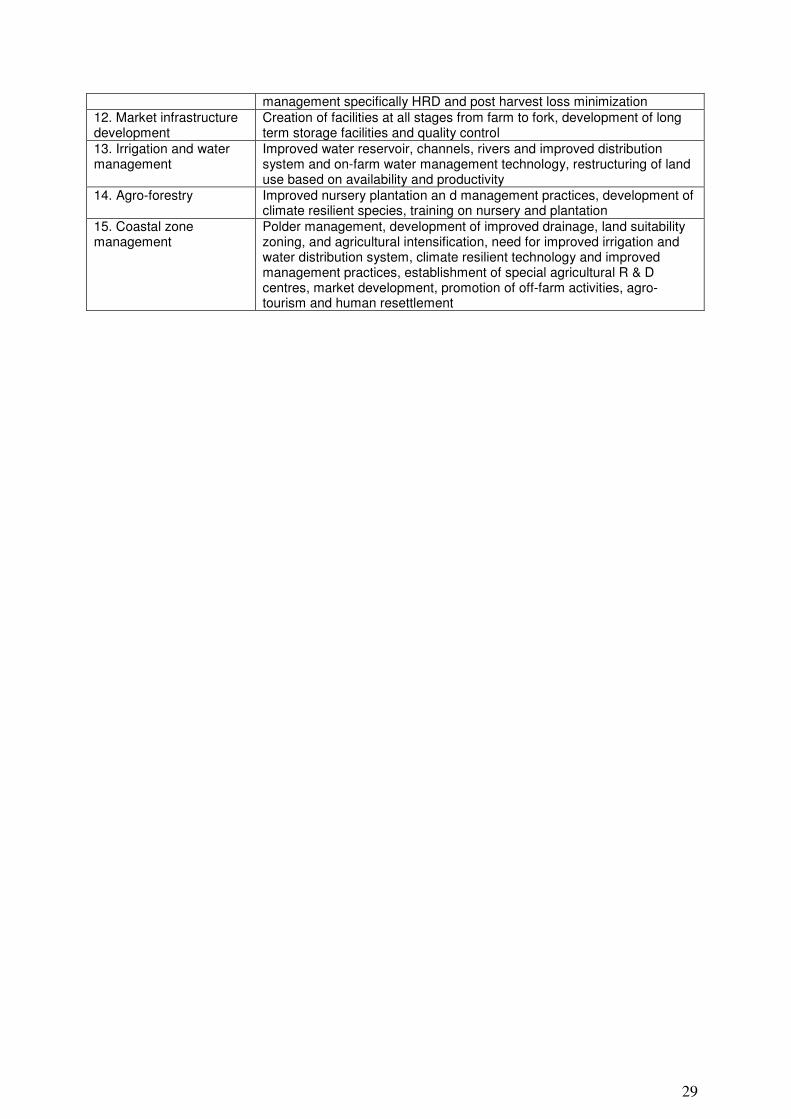
29
management specifically HRD and post harvest loss minimization 12. Market infrastructure development
Creation of facilities at all stages from farm to fork, development of long term storage facilities and quality control
13. Irrigation and water management
Improved water reservoir, channels, rivers and improved distribution system and on-farm water management technology, restructuring of land use based on availability and productivity
14. Agro-forestry Improved nursery plantation an d management practices, development of climate resilient species, training on nursery and plantation
15. Coastal zone management
Polder management, development of improved drainage, land suitability zoning, and agricultural intensification, need for improved irrigation and water distribution system, climate resilient technology and improved management practices, establishment of special agricultural R & D centres, market development, promotion of off-farm activities, agro-tourism and human resettlement
30
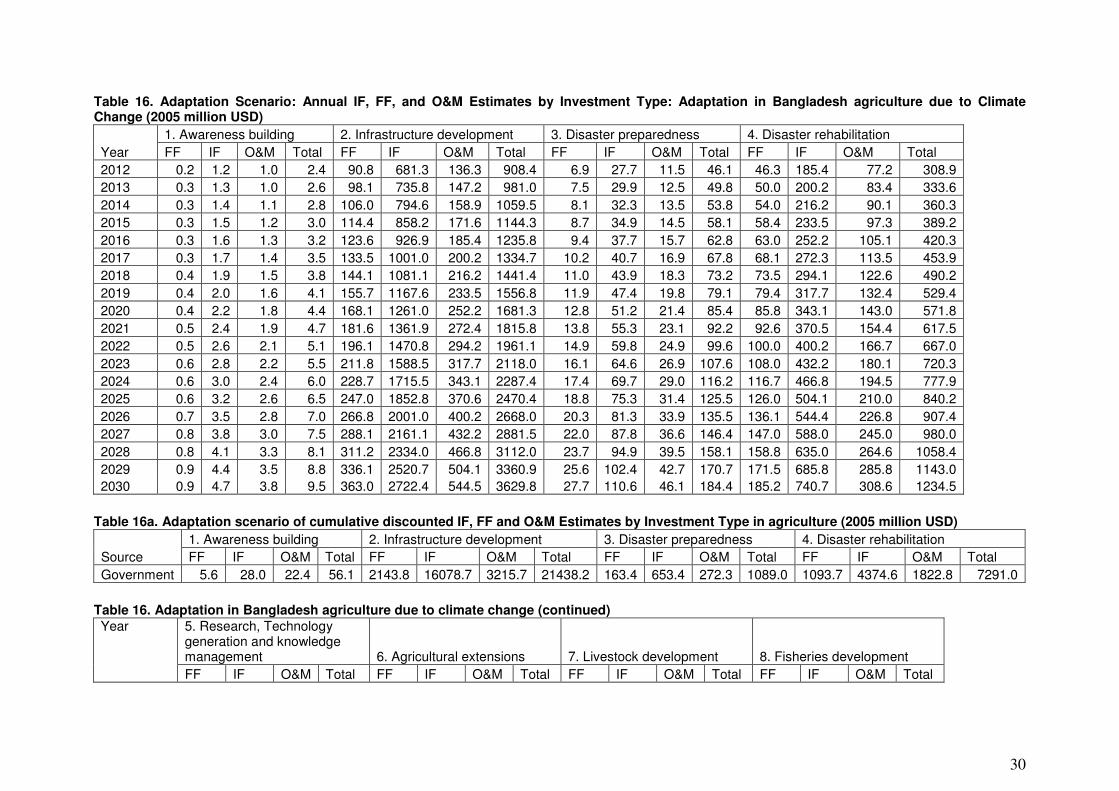
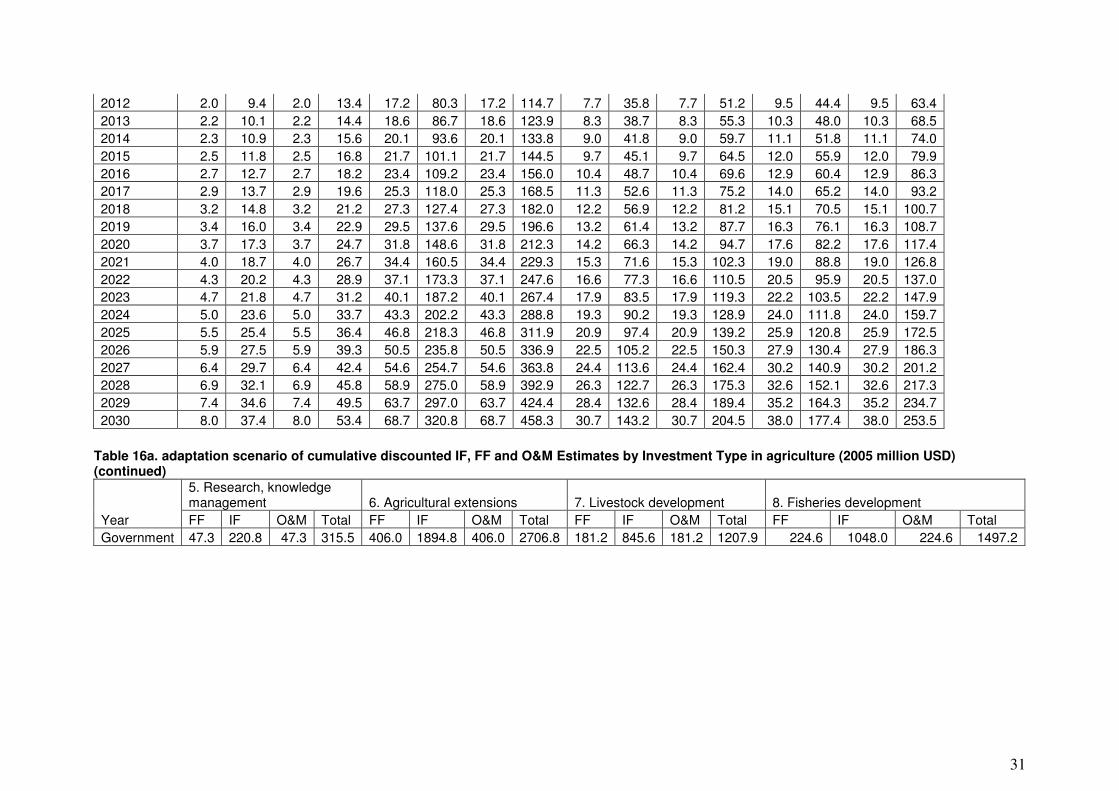
Table 16. Adaptation Scenario: Annual IF, FF, and O&M Estimates by Investment Type: Adaptation in Bangladesh agriculture due to Climate Change (2005 million USD)
Year
1. Awareness building 2. Infrastructure development 3. Disaster preparedness 4. Disaster rehabilitation
FF IF O&M Total FF IF O&M Total FF IF O&M Total FF IF O&M Total
2012 0.2 1.2 1.0 2.4 90.8 681.3 136.3 908.4 6.9 27.7 11.5 46.1 46.3 185.4 77.2 308.9
2013 0.3 1.3 1.0 2.6 98.1 735.8 147.2 981.0 7.5 29.9 12.5 49.8 50.0 200.2 83.4 333.6
2014 0.3 1.4 1.1 2.8 106.0 794.6 158.9 1059.5 8.1 32.3 13.5 53.8 54.0 216.2 90.1 360.3
2015 0.3 1.5 1.2 3.0 114.4 858.2 171.6 1144.3 8.7 34.9 14.5 58.1 58.4 233.5 97.3 389.2
2016 0.3 1.6 1.3 3.2 123.6 926.9 185.4 1235.8 9.4 37.7 15.7 62.8 63.0 252.2 105.1 420.3
2017 0.3 1.7 1.4 3.5 133.5 1001.0 200.2 1334.7 10.2 40.7 16.9 67.8 68.1 272.3 113.5 453.9
2018 0.4 1.9 1.5 3.8 144.1 1081.1 216.2 1441.4 11.0 43.9 18.3 73.2 73.5 294.1 122.6 490.2
2019 0.4 2.0 1.6 4.1 155.7 1167.6 233.5 1556.8 11.9 47.4 19.8 79.1 79.4 317.7 132.4 529.4
2020 0.4 2.2 1.8 4.4 168.1 1261.0 252.2 1681.3 12.8 51.2 21.4 85.4 85.8 343.1 143.0 571.8
2021 0.5 2.4 1.9 4.7 181.6 1361.9 272.4 1815.8 13.8 55.3 23.1 92.2 92.6 370.5 154.4 617.5
2022 0.5 2.6 2.1 5.1 196.1 1470.8 294.2 1961.1 14.9 59.8 24.9 99.6 100.0 400.2 166.7 667.0
2023 0.6 2.8 2.2 5.5 211.8 1588.5 317.7 2118.0 16.1 64.6 26.9 107.6 108.0 432.2 180.1 720.3
2024 0.6 3.0 2.4 6.0 228.7 1715.5 343.1 2287.4 17.4 69.7 29.0 116.2 116.7 466.8 194.5 777.9
2025 0.6 3.2 2.6 6.5 247.0 1852.8 370.6 2470.4 18.8 75.3 31.4 125.5 126.0 504.1 210.0 840.2
2026 0.7 3.5 2.8 7.0 266.8 2001.0 400.2 2668.0 20.3 81.3 33.9 135.5 136.1 544.4 226.8 907.4
2027 0.8 3.8 3.0 7.5 288.1 2161.1 432.2 2881.5 22.0 87.8 36.6 146.4 147.0 588.0 245.0 980.0
2028 0.8 4.1 3.3 8.1 311.2 2334.0 466.8 3112.0 23.7 94.9 39.5 158.1 158.8 635.0 264.6 1058.4
2029 0.9 4.4 3.5 8.8 336.1 2520.7 504.1 3360.9 25.6 102.4 42.7 170.7 171.5 685.8 285.8 1143.0
2030 0.9 4.7 3.8 9.5 363.0 2722.4 544.5 3629.8 27.7 110.6 46.1 184.4 185.2 740.7 308.6 1234.5
Table 16a. Adaptation scenario of cumulative discounted IF, FF and O&M Estimates by Investment Type in agriculture (2005 million USD)
Source
1. Awareness building 2. Infrastructure development 3. Disaster preparedness 4. Disaster rehabilitation
FF IF O&M Total FF IF O&M Total FF IF O&M Total FF IF O&M Total
Government 5.6 28.0 22.4 56.1 2143.8 16078.7 3215.7 21438.2 163.4 653.4 272.3 1089.0 1093.7 4374.6 1822.8 7291.0
Table 16. Adaptation in Bangladesh agriculture due to climate change (continued) Year 5. Research, Technology
generation and knowledge management 6. Agricultural extensions 7. Livestock development 8. Fisheries development
FF IF O&M Total FF IF O&M Total FF IF O&M Total FF IF O&M Total
31
2012 2.0 9.4 2.0 13.4 17.2 80.3 17.2 114.7 7.7 35.8 7.7 51.2 9.5 44.4 9.5 63.4
2013 2.2 10.1 2.2 14.4 18.6 86.7 18.6 123.9 8.3 38.7 8.3 55.3 10.3 48.0 10.3 68.5
2014 2.3 10.9 2.3 15.6 20.1 93.6 20.1 133.8 9.0 41.8 9.0 59.7 11.1 51.8 11.1 74.0
2015 2.5 11.8 2.5 16.8 21.7 101.1 21.7 144.5 9.7 45.1 9.7 64.5 12.0 55.9 12.0 79.9
2016 2.7 12.7 2.7 18.2 23.4 109.2 23.4 156.0 10.4 48.7 10.4 69.6 12.9 60.4 12.9 86.3
2017 2.9 13.7 2.9 19.6 25.3 118.0 25.3 168.5 11.3 52.6 11.3 75.2 14.0 65.2 14.0 93.2
2018 3.2 14.8 3.2 21.2 27.3 127.4 27.3 182.0 12.2 56.9 12.2 81.2 15.1 70.5 15.1 100.7
2019 3.4 16.0 3.4 22.9 29.5 137.6 29.5 196.6 13.2 61.4 13.2 87.7 16.3 76.1 16.3 108.7
2020 3.7 17.3 3.7 24.7 31.8 148.6 31.8 212.3 14.2 66.3 14.2 94.7 17.6 82.2 17.6 117.4
2021 4.0 18.7 4.0 26.7 34.4 160.5 34.4 229.3 15.3 71.6 15.3 102.3 19.0 88.8 19.0 126.8
2022 4.3 20.2 4.3 28.9 37.1 173.3 37.1 247.6 16.6 77.3 16.6 110.5 20.5 95.9 20.5 137.0
2023 4.7 21.8 4.7 31.2 40.1 187.2 40.1 267.4 17.9 83.5 17.9 119.3 22.2 103.5 22.2 147.9
2024 5.0 23.6 5.0 33.7 43.3 202.2 43.3 288.8 19.3 90.2 19.3 128.9 24.0 111.8 24.0 159.7
2025 5.5 25.4 5.5 36.4 46.8 218.3 46.8 311.9 20.9 97.4 20.9 139.2 25.9 120.8 25.9 172.5
2026 5.9 27.5 5.9 39.3 50.5 235.8 50.5 336.9 22.5 105.2 22.5 150.3 27.9 130.4 27.9 186.3
2027 6.4 29.7 6.4 42.4 54.6 254.7 54.6 363.8 24.4 113.6 24.4 162.4 30.2 140.9 30.2 201.2
2028 6.9 32.1 6.9 45.8 58.9 275.0 58.9 392.9 26.3 122.7 26.3 175.3 32.6 152.1 32.6 217.3
2029 7.4 34.6 7.4 49.5 63.7 297.0 63.7 424.4 28.4 132.6 28.4 189.4 35.2 164.3 35.2 234.7
2030 8.0 37.4 8.0 53.4 68.7 320.8 68.7 458.3 30.7 143.2 30.7 204.5 38.0 177.4 38.0 253.5
Table 16a. adaptation scenario of cumulative discounted IF, FF and O&M Estimates by Investment Type in agriculture (2005 million USD) (continued)
Year
5. Research, knowledge management 6. Agricultural extensions 7. Livestock development 8. Fisheries development
FF IF O&M Total FF IF O&M Total FF IF O&M Total FF IF O&M Total
Government 47.3 220.8 47.3 315.5 406.0 1894.8 406.0 2706.8 181.2 845.6 181.2 1207.9 224.6 1048.0 224.6 1497.2
32
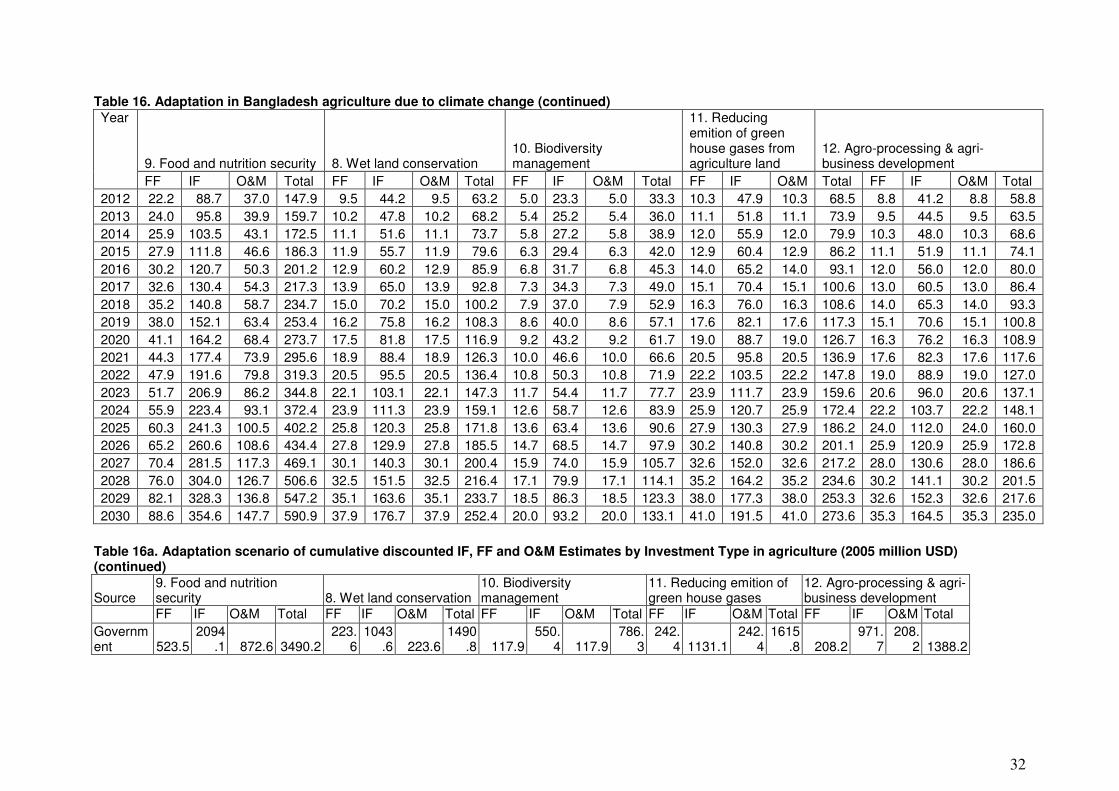
Table 16. Adaptation in Bangladesh agriculture due to climate change (continued) Year
9. Food and nutrition security 8. Wet land conservation 10. Biodiversity management
11. Reducing emition of green house gases from agriculture land
12. Agro-processing & agri-business development
FF IF O&M Total FF IF O&M Total FF IF O&M Total FF IF O&M Total FF IF O&M Total
2012 22.2 88.7 37.0 147.9 9.5 44.2 9.5 63.2 5.0 23.3 5.0 33.3 10.3 47.9 10.3 68.5 8.8 41.2 8.8 58.8
2013 24.0 95.8 39.9 159.7 10.2 47.8 10.2 68.2 5.4 25.2 5.4 36.0 11.1 51.8 11.1 73.9 9.5 44.5 9.5 63.5
2014 25.9 103.5 43.1 172.5 11.1 51.6 11.1 73.7 5.8 27.2 5.8 38.9 12.0 55.9 12.0 79.9 10.3 48.0 10.3 68.6
2015 27.9 111.8 46.6 186.3 11.9 55.7 11.9 79.6 6.3 29.4 6.3 42.0 12.9 60.4 12.9 86.2 11.1 51.9 11.1 74.1
2016 30.2 120.7 50.3 201.2 12.9 60.2 12.9 85.9 6.8 31.7 6.8 45.3 14.0 65.2 14.0 93.1 12.0 56.0 12.0 80.0
2017 32.6 130.4 54.3 217.3 13.9 65.0 13.9 92.8 7.3 34.3 7.3 49.0 15.1 70.4 15.1 100.6 13.0 60.5 13.0 86.4
2018 35.2 140.8 58.7 234.7 15.0 70.2 15.0 100.2 7.9 37.0 7.9 52.9 16.3 76.0 16.3 108.6 14.0 65.3 14.0 93.3
2019 38.0 152.1 63.4 253.4 16.2 75.8 16.2 108.3 8.6 40.0 8.6 57.1 17.6 82.1 17.6 117.3 15.1 70.6 15.1 100.8
2020 41.1 164.2 68.4 273.7 17.5 81.8 17.5 116.9 9.2 43.2 9.2 61.7 19.0 88.7 19.0 126.7 16.3 76.2 16.3 108.9
2021 44.3 177.4 73.9 295.6 18.9 88.4 18.9 126.3 10.0 46.6 10.0 66.6 20.5 95.8 20.5 136.9 17.6 82.3 17.6 117.6
2022 47.9 191.6 79.8 319.3 20.5 95.5 20.5 136.4 10.8 50.3 10.8 71.9 22.2 103.5 22.2 147.8 19.0 88.9 19.0 127.0
2023 51.7 206.9 86.2 344.8 22.1 103.1 22.1 147.3 11.7 54.4 11.7 77.7 23.9 111.7 23.9 159.6 20.6 96.0 20.6 137.1
2024 55.9 223.4 93.1 372.4 23.9 111.3 23.9 159.1 12.6 58.7 12.6 83.9 25.9 120.7 25.9 172.4 22.2 103.7 22.2 148.1
2025 60.3 241.3 100.5 402.2 25.8 120.3 25.8 171.8 13.6 63.4 13.6 90.6 27.9 130.3 27.9 186.2 24.0 112.0 24.0 160.0
2026 65.2 260.6 108.6 434.4 27.8 129.9 27.8 185.5 14.7 68.5 14.7 97.9 30.2 140.8 30.2 201.1 25.9 120.9 25.9 172.8
2027 70.4 281.5 117.3 469.1 30.1 140.3 30.1 200.4 15.9 74.0 15.9 105.7 32.6 152.0 32.6 217.2 28.0 130.6 28.0 186.6
2028 76.0 304.0 126.7 506.6 32.5 151.5 32.5 216.4 17.1 79.9 17.1 114.1 35.2 164.2 35.2 234.6 30.2 141.1 30.2 201.5
2029 82.1 328.3 136.8 547.2 35.1 163.6 35.1 233.7 18.5 86.3 18.5 123.3 38.0 177.3 38.0 253.3 32.6 152.3 32.6 217.6
2030 88.6 354.6 147.7 590.9 37.9 176.7 37.9 252.4 20.0 93.2 20.0 133.1 41.0 191.5 41.0 273.6 35.3 164.5 35.3 235.0
Table 16a. Adaptation scenario of cumulative discounted IF, FF and O&M Estimates by Investment Type in agriculture (2005 million USD) (continued)
Source 9. Food and nutrition security 8. Wet land conservation
10. Biodiversity management
11. Reducing emition of green house gases
12. Agro-processing & agri-business development
FF IF O&M Total FF IF O&M Total FF IF O&M Total FF IF O&M Total FF IF O&M Total
Government 523.5
2094.1 872.6 3490.2
223.6
1043.6 223.6
1490.8 117.9
550.4 117.9
786.3
242.4 1131.1
242.4
1615.8 208.2
971.7
208.2 1388.2
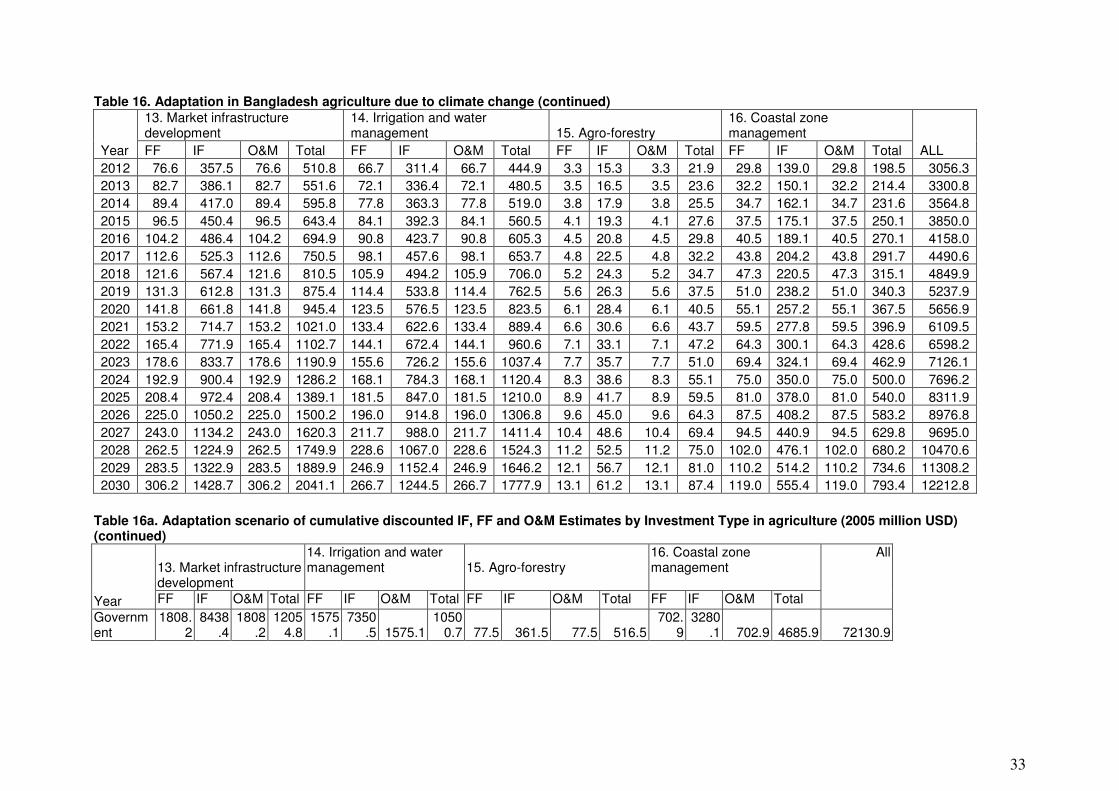
33
Table 16. Adaptation in Bangladesh agriculture due to climate change (continued)
Year
13. Market infrastructure development
14. Irrigation and water management 15. Agro-forestry
16. Coastal zone management
ALL FF IF O&M Total FF IF O&M Total FF IF O&M Total FF IF O&M Total
2012 76.6 357.5 76.6 510.8 66.7 311.4 66.7 444.9 3.3 15.3 3.3 21.9 29.8 139.0 29.8 198.5 3056.3
2013 82.7 386.1 82.7 551.6 72.1 336.4 72.1 480.5 3.5 16.5 3.5 23.6 32.2 150.1 32.2 214.4 3300.8
2014 89.4 417.0 89.4 595.8 77.8 363.3 77.8 519.0 3.8 17.9 3.8 25.5 34.7 162.1 34.7 231.6 3564.8
2015 96.5 450.4 96.5 643.4 84.1 392.3 84.1 560.5 4.1 19.3 4.1 27.6 37.5 175.1 37.5 250.1 3850.0
2016 104.2 486.4 104.2 694.9 90.8 423.7 90.8 605.3 4.5 20.8 4.5 29.8 40.5 189.1 40.5 270.1 4158.0
2017 112.6 525.3 112.6 750.5 98.1 457.6 98.1 653.7 4.8 22.5 4.8 32.2 43.8 204.2 43.8 291.7 4490.6
2018 121.6 567.4 121.6 810.5 105.9 494.2 105.9 706.0 5.2 24.3 5.2 34.7 47.3 220.5 47.3 315.1 4849.9
2019 131.3 612.8 131.3 875.4 114.4 533.8 114.4 762.5 5.6 26.3 5.6 37.5 51.0 238.2 51.0 340.3 5237.9
2020 141.8 661.8 141.8 945.4 123.5 576.5 123.5 823.5 6.1 28.4 6.1 40.5 55.1 257.2 55.1 367.5 5656.9
2021 153.2 714.7 153.2 1021.0 133.4 622.6 133.4 889.4 6.6 30.6 6.6 43.7 59.5 277.8 59.5 396.9 6109.5
2022 165.4 771.9 165.4 1102.7 144.1 672.4 144.1 960.6 7.1 33.1 7.1 47.2 64.3 300.1 64.3 428.6 6598.2
2023 178.6 833.7 178.6 1190.9 155.6 726.2 155.6 1037.4 7.7 35.7 7.7 51.0 69.4 324.1 69.4 462.9 7126.1
2024 192.9 900.4 192.9 1286.2 168.1 784.3 168.1 1120.4 8.3 38.6 8.3 55.1 75.0 350.0 75.0 500.0 7696.2
2025 208.4 972.4 208.4 1389.1 181.5 847.0 181.5 1210.0 8.9 41.7 8.9 59.5 81.0 378.0 81.0 540.0 8311.9
2026 225.0 1050.2 225.0 1500.2 196.0 914.8 196.0 1306.8 9.6 45.0 9.6 64.3 87.5 408.2 87.5 583.2 8976.8
2027 243.0 1134.2 243.0 1620.3 211.7 988.0 211.7 1411.4 10.4 48.6 10.4 69.4 94.5 440.9 94.5 629.8 9695.0
2028 262.5 1224.9 262.5 1749.9 228.6 1067.0 228.6 1524.3 11.2 52.5 11.2 75.0 102.0 476.1 102.0 680.2 10470.6
2029 283.5 1322.9 283.5 1889.9 246.9 1152.4 246.9 1646.2 12.1 56.7 12.1 81.0 110.2 514.2 110.2 734.6 11308.2
2030 306.2 1428.7 306.2 2041.1 266.7 1244.5 266.7 1777.9 13.1 61.2 13.1 87.4 119.0 555.4 119.0 793.4 12212.8
Table 16a. Adaptation scenario of cumulative discounted IF, FF and O&M Estimates by Investment Type in agriculture (2005 million USD) (continued)
Year
13. Market infrastructure development
14. Irrigation and water management
15. Agro-forestry
16. Coastal zone management
All
FF IF O&M Total FF IF O&M Total FF IF O&M Total FF IF O&M Total
Government
1808.2
8438.4
1808.2
12054.8
1575.1
7350.5 1575.1
10500.7 77.5 361.5 77.5 516.5
702.9
3280.1 702.9 4685.9 72130.9
34
3. Results 3.1 Incremental Changes in IF, FF O&M Costs
A total of USD 69.67 billion is estimated as incremental adaptation costing for major
investment components in the agriculture sector. Majority of the investment proportion is
planned to be invested for the infrastructure development (30%) followed by market
development (17%), irrigation and water management (15%), and others (14) (Fig. 8).
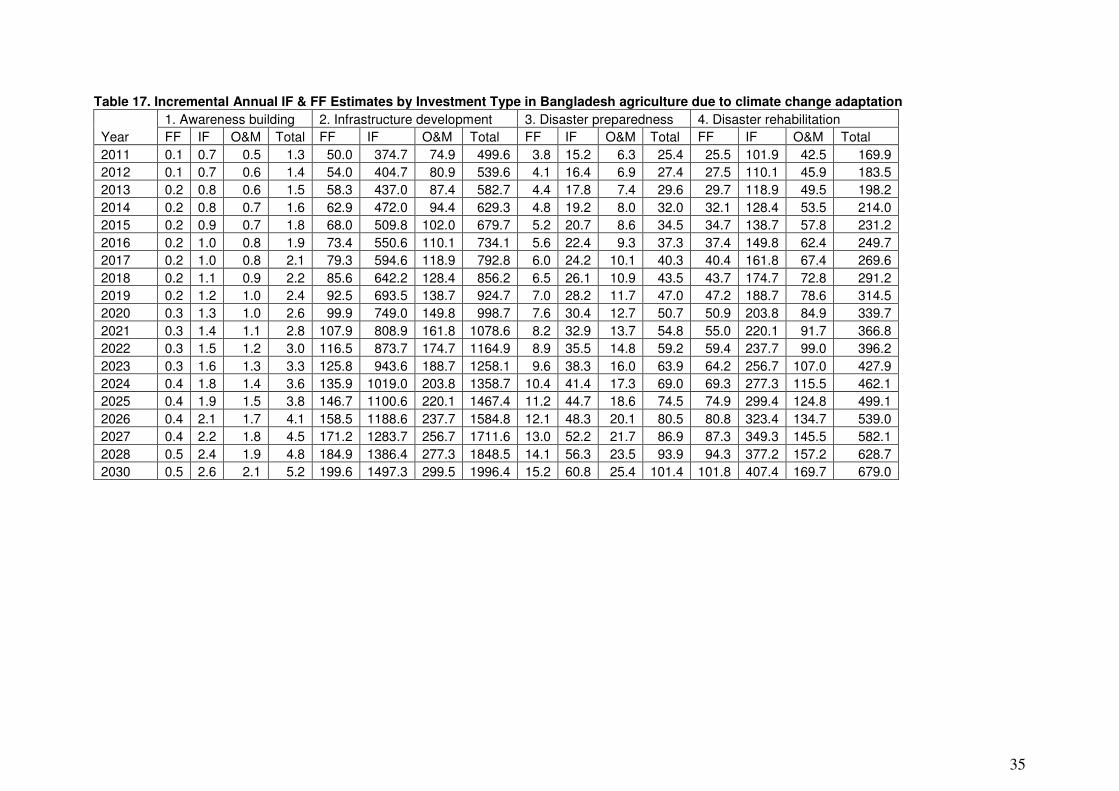
35
Table 17. Incremental Annual IF & FF Estimates by Investment Type in Bangladesh agriculture due to climate change adaptation
Year
1. Awareness building 2. Infrastructure development 3. Disaster preparedness 4. Disaster rehabilitation
FF IF O&M Total FF IF O&M Total FF IF O&M Total FF IF O&M Total
2011 0.1 0.7 0.5 1.3 50.0 374.7 74.9 499.6 3.8 15.2 6.3 25.4 25.5 101.9 42.5 169.9
2012 0.1 0.7 0.6 1.4 54.0 404.7 80.9 539.6 4.1 16.4 6.9 27.4 27.5 110.1 45.9 183.5
2013 0.2 0.8 0.6 1.5 58.3 437.0 87.4 582.7 4.4 17.8 7.4 29.6 29.7 118.9 49.5 198.2
2014 0.2 0.8 0.7 1.6 62.9 472.0 94.4 629.3 4.8 19.2 8.0 32.0 32.1 128.4 53.5 214.0
2015 0.2 0.9 0.7 1.8 68.0 509.8 102.0 679.7 5.2 20.7 8.6 34.5 34.7 138.7 57.8 231.2
2016 0.2 1.0 0.8 1.9 73.4 550.6 110.1 734.1 5.6 22.4 9.3 37.3 37.4 149.8 62.4 249.7
2017 0.2 1.0 0.8 2.1 79.3 594.6 118.9 792.8 6.0 24.2 10.1 40.3 40.4 161.8 67.4 269.6
2018 0.2 1.1 0.9 2.2 85.6 642.2 128.4 856.2 6.5 26.1 10.9 43.5 43.7 174.7 72.8 291.2
2019 0.2 1.2 1.0 2.4 92.5 693.5 138.7 924.7 7.0 28.2 11.7 47.0 47.2 188.7 78.6 314.5
2020 0.3 1.3 1.0 2.6 99.9 749.0 149.8 998.7 7.6 30.4 12.7 50.7 50.9 203.8 84.9 339.7
2021 0.3 1.4 1.1 2.8 107.9 808.9 161.8 1078.6 8.2 32.9 13.7 54.8 55.0 220.1 91.7 366.8
2022 0.3 1.5 1.2 3.0 116.5 873.7 174.7 1164.9 8.9 35.5 14.8 59.2 59.4 237.7 99.0 396.2
2023 0.3 1.6 1.3 3.3 125.8 943.6 188.7 1258.1 9.6 38.3 16.0 63.9 64.2 256.7 107.0 427.9
2024 0.4 1.8 1.4 3.6 135.9 1019.0 203.8 1358.7 10.4 41.4 17.3 69.0 69.3 277.3 115.5 462.1
2025 0.4 1.9 1.5 3.8 146.7 1100.6 220.1 1467.4 11.2 44.7 18.6 74.5 74.9 299.4 124.8 499.1
2026 0.4 2.1 1.7 4.1 158.5 1188.6 237.7 1584.8 12.1 48.3 20.1 80.5 80.8 323.4 134.7 539.0
2027 0.4 2.2 1.8 4.5 171.2 1283.7 256.7 1711.6 13.0 52.2 21.7 86.9 87.3 349.3 145.5 582.1
2028 0.5 2.4 1.9 4.8 184.9 1386.4 277.3 1848.5 14.1 56.3 23.5 93.9 94.3 377.2 157.2 628.7
2030 0.5 2.6 2.1 5.2 199.6 1497.3 299.5 1996.4 15.2 60.8 25.4 101.4 101.8 407.4 169.7 679.0
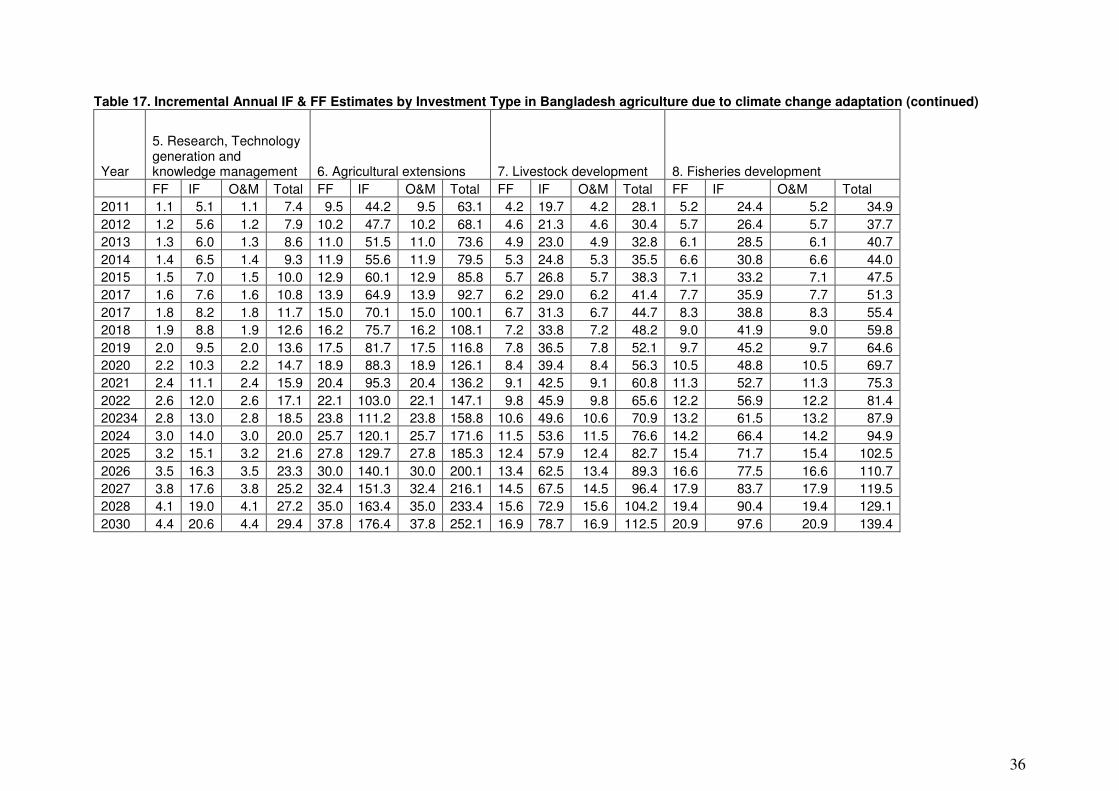
36
Table 17. Incremental Annual IF & FF Estimates by Investment Type in Bangladesh agriculture due to climate change adaptation (continued)
Year
5. Research, Technology generation and knowledge management 6. Agricultural extensions 7. Livestock development 8. Fisheries development
FF IF O&M Total FF IF O&M Total FF IF O&M Total FF IF O&M Total
2011 1.1 5.1 1.1 7.4 9.5 44.2 9.5 63.1 4.2 19.7 4.2 28.1 5.2 24.4 5.2 34.9
2012 1.2 5.6 1.2 7.9 10.2 47.7 10.2 68.1 4.6 21.3 4.6 30.4 5.7 26.4 5.7 37.7
2013 1.3 6.0 1.3 8.6 11.0 51.5 11.0 73.6 4.9 23.0 4.9 32.8 6.1 28.5 6.1 40.7
2014 1.4 6.5 1.4 9.3 11.9 55.6 11.9 79.5 5.3 24.8 5.3 35.5 6.6 30.8 6.6 44.0
2015 1.5 7.0 1.5 10.0 12.9 60.1 12.9 85.8 5.7 26.8 5.7 38.3 7.1 33.2 7.1 47.5
2017 1.6 7.6 1.6 10.8 13.9 64.9 13.9 92.7 6.2 29.0 6.2 41.4 7.7 35.9 7.7 51.3
2017 1.8 8.2 1.8 11.7 15.0 70.1 15.0 100.1 6.7 31.3 6.7 44.7 8.3 38.8 8.3 55.4
2018 1.9 8.8 1.9 12.6 16.2 75.7 16.2 108.1 7.2 33.8 7.2 48.2 9.0 41.9 9.0 59.8
2019 2.0 9.5 2.0 13.6 17.5 81.7 17.5 116.8 7.8 36.5 7.8 52.1 9.7 45.2 9.7 64.6
2020 2.2 10.3 2.2 14.7 18.9 88.3 18.9 126.1 8.4 39.4 8.4 56.3 10.5 48.8 10.5 69.7
2021 2.4 11.1 2.4 15.9 20.4 95.3 20.4 136.2 9.1 42.5 9.1 60.8 11.3 52.7 11.3 75.3
2022 2.6 12.0 2.6 17.1 22.1 103.0 22.1 147.1 9.8 45.9 9.8 65.6 12.2 56.9 12.2 81.4
20234 2.8 13.0 2.8 18.5 23.8 111.2 23.8 158.8 10.6 49.6 10.6 70.9 13.2 61.5 13.2 87.9
2024 3.0 14.0 3.0 20.0 25.7 120.1 25.7 171.6 11.5 53.6 11.5 76.6 14.2 66.4 14.2 94.9
2025 3.2 15.1 3.2 21.6 27.8 129.7 27.8 185.3 12.4 57.9 12.4 82.7 15.4 71.7 15.4 102.5
2026 3.5 16.3 3.5 23.3 30.0 140.1 30.0 200.1 13.4 62.5 13.4 89.3 16.6 77.5 16.6 110.7
2027 3.8 17.6 3.8 25.2 32.4 151.3 32.4 216.1 14.5 67.5 14.5 96.4 17.9 83.7 17.9 119.5
2028 4.1 19.0 4.1 27.2 35.0 163.4 35.0 233.4 15.6 72.9 15.6 104.2 19.4 90.4 19.4 129.1
2030 4.4 20.6 4.4 29.4 37.8 176.4 37.8 252.1 16.9 78.7 16.9 112.5 20.9 97.6 20.9 139.4
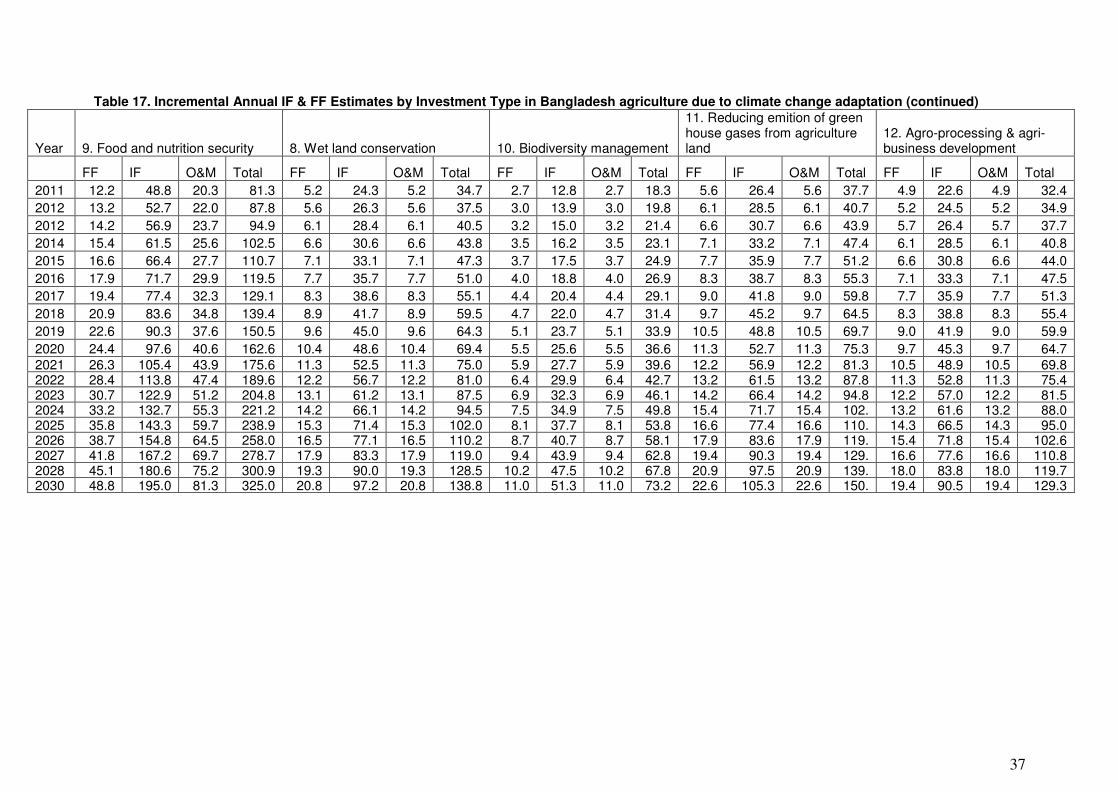
37
Table 17. Incremental Annual IF & FF Estimates by Investment Type in Bangladesh agriculture due to climate change adaptation (continued)
Year 9. Food and nutrition security 8. Wet land conservation 10. Biodiversity management
11. Reducing emition of green house gases from agriculture land
12. Agro-processing & agri-business development
FF IF O&M Total FF IF O&M Total FF IF O&M Total FF IF O&M Total FF IF O&M Total
2011 12.2 48.8 20.3 81.3 5.2 24.3 5.2 34.7 2.7 12.8 2.7 18.3 5.6 26.4 5.6 37.7 4.9 22.6 4.9 32.4
2012 13.2 52.7 22.0 87.8 5.6 26.3 5.6 37.5 3.0 13.9 3.0 19.8 6.1 28.5 6.1 40.7 5.2 24.5 5.2 34.9
2012 14.2 56.9 23.7 94.9 6.1 28.4 6.1 40.5 3.2 15.0 3.2 21.4 6.6 30.7 6.6 43.9 5.7 26.4 5.7 37.7
2014 15.4 61.5 25.6 102.5 6.6 30.6 6.6 43.8 3.5 16.2 3.5 23.1 7.1 33.2 7.1 47.4 6.1 28.5 6.1 40.8
2015 16.6 66.4 27.7 110.7 7.1 33.1 7.1 47.3 3.7 17.5 3.7 24.9 7.7 35.9 7.7 51.2 6.6 30.8 6.6 44.0
2016 17.9 71.7 29.9 119.5 7.7 35.7 7.7 51.0 4.0 18.8 4.0 26.9 8.3 38.7 8.3 55.3 7.1 33.3 7.1 47.5
2017 19.4 77.4 32.3 129.1 8.3 38.6 8.3 55.1 4.4 20.4 4.4 29.1 9.0 41.8 9.0 59.8 7.7 35.9 7.7 51.3
2018 20.9 83.6 34.8 139.4 8.9 41.7 8.9 59.5 4.7 22.0 4.7 31.4 9.7 45.2 9.7 64.5 8.3 38.8 8.3 55.4
2019 22.6 90.3 37.6 150.5 9.6 45.0 9.6 64.3 5.1 23.7 5.1 33.9 10.5 48.8 10.5 69.7 9.0 41.9 9.0 59.9
2020 24.4 97.6 40.6 162.6 10.4 48.6 10.4 69.4 5.5 25.6 5.5 36.6 11.3 52.7 11.3 75.3 9.7 45.3 9.7 64.7 2021 26.3 105.4 43.9 175.6 11.3 52.5 11.3 75.0 5.9 27.7 5.9 39.6 12.2 56.9 12.2 81.3 10.5 48.9 10.5 69.8 2022 28.4 113.8 47.4 189.6 12.2 56.7 12.2 81.0 6.4 29.9 6.4 42.7 13.2 61.5 13.2 87.8 11.3 52.8 11.3 75.4 2023 30.7 122.9 51.2 204.8 13.1 61.2 13.1 87.5 6.9 32.3 6.9 46.1 14.2 66.4 14.2 94.8 12.2 57.0 12.2 81.5 2024 33.2 132.7 55.3 221.2 14.2 66.1 14.2 94.5 7.5 34.9 7.5 49.8 15.4 71.7 15.4 102. 13.2 61.6 13.2 88.0 2025 35.8 143.3 59.7 238.9 15.3 71.4 15.3 102.0 8.1 37.7 8.1 53.8 16.6 77.4 16.6 110. 14.3 66.5 14.3 95.0 2026 38.7 154.8 64.5 258.0 16.5 77.1 16.5 110.2 8.7 40.7 8.7 58.1 17.9 83.6 17.9 119. 15.4 71.8 15.4 102.6 2027 41.8 167.2 69.7 278.7 17.9 83.3 17.9 119.0 9.4 43.9 9.4 62.8 19.4 90.3 19.4 129. 16.6 77.6 16.6 110.8 2028 45.1 180.6 75.2 300.9 19.3 90.0 19.3 128.5 10.2 47.5 10.2 67.8 20.9 97.5 20.9 139. 18.0 83.8 18.0 119.7 2030 48.8 195.0 81.3 325.0 20.8 97.2 20.8 138.8 11.0 51.3 11.0 73.2 22.6 105.3 22.6 150. 19.4 90.5 19.4 129.3
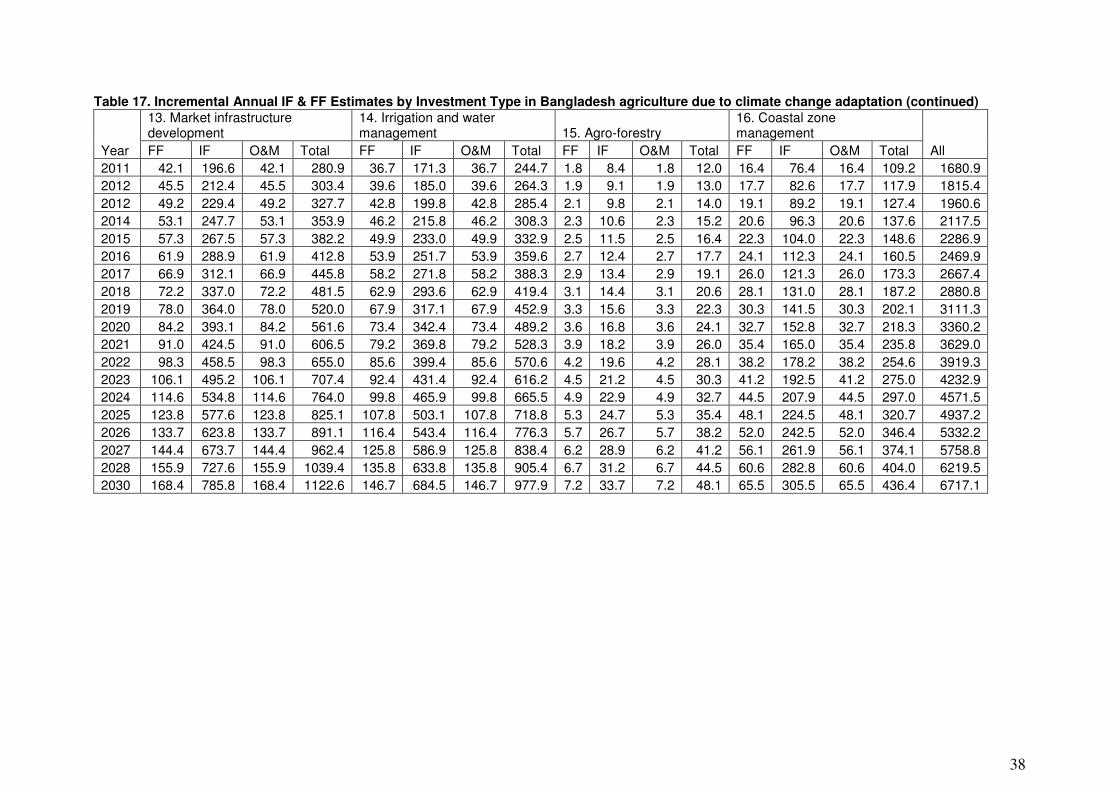
38
Table 17. Incremental Annual IF & FF Estimates by Investment Type in Bangladesh agriculture due to climate change adaptation (continued)
Year
13. Market infrastructure development
14. Irrigation and water management 15. Agro-forestry
16. Coastal zone management
All FF IF O&M Total FF IF O&M Total FF IF O&M Total FF IF O&M Total
2011 42.1 196.6 42.1 280.9 36.7 171.3 36.7 244.7 1.8 8.4 1.8 12.0 16.4 76.4 16.4 109.2 1680.9
2012 45.5 212.4 45.5 303.4 39.6 185.0 39.6 264.3 1.9 9.1 1.9 13.0 17.7 82.6 17.7 117.9 1815.4
2012 49.2 229.4 49.2 327.7 42.8 199.8 42.8 285.4 2.1 9.8 2.1 14.0 19.1 89.2 19.1 127.4 1960.6
2014 53.1 247.7 53.1 353.9 46.2 215.8 46.2 308.3 2.3 10.6 2.3 15.2 20.6 96.3 20.6 137.6 2117.5
2015 57.3 267.5 57.3 382.2 49.9 233.0 49.9 332.9 2.5 11.5 2.5 16.4 22.3 104.0 22.3 148.6 2286.9
2016 61.9 288.9 61.9 412.8 53.9 251.7 53.9 359.6 2.7 12.4 2.7 17.7 24.1 112.3 24.1 160.5 2469.9
2017 66.9 312.1 66.9 445.8 58.2 271.8 58.2 388.3 2.9 13.4 2.9 19.1 26.0 121.3 26.0 173.3 2667.4
2018 72.2 337.0 72.2 481.5 62.9 293.6 62.9 419.4 3.1 14.4 3.1 20.6 28.1 131.0 28.1 187.2 2880.8
2019 78.0 364.0 78.0 520.0 67.9 317.1 67.9 452.9 3.3 15.6 3.3 22.3 30.3 141.5 30.3 202.1 3111.3
2020 84.2 393.1 84.2 561.6 73.4 342.4 73.4 489.2 3.6 16.8 3.6 24.1 32.7 152.8 32.7 218.3 3360.2
2021 91.0 424.5 91.0 606.5 79.2 369.8 79.2 528.3 3.9 18.2 3.9 26.0 35.4 165.0 35.4 235.8 3629.0
2022 98.3 458.5 98.3 655.0 85.6 399.4 85.6 570.6 4.2 19.6 4.2 28.1 38.2 178.2 38.2 254.6 3919.3
2023 106.1 495.2 106.1 707.4 92.4 431.4 92.4 616.2 4.5 21.2 4.5 30.3 41.2 192.5 41.2 275.0 4232.9
2024 114.6 534.8 114.6 764.0 99.8 465.9 99.8 665.5 4.9 22.9 4.9 32.7 44.5 207.9 44.5 297.0 4571.5
2025 123.8 577.6 123.8 825.1 107.8 503.1 107.8 718.8 5.3 24.7 5.3 35.4 48.1 224.5 48.1 320.7 4937.2
2026 133.7 623.8 133.7 891.1 116.4 543.4 116.4 776.3 5.7 26.7 5.7 38.2 52.0 242.5 52.0 346.4 5332.2
2027 144.4 673.7 144.4 962.4 125.8 586.9 125.8 838.4 6.2 28.9 6.2 41.2 56.1 261.9 56.1 374.1 5758.8
2028 155.9 727.6 155.9 1039.4 135.8 633.8 135.8 905.4 6.7 31.2 6.7 44.5 60.6 282.8 60.6 404.0 6219.5
2030 168.4 785.8 168.4 1122.6 146.7 684.5 146.7 977.9 7.2 33.7 7.2 48.1 65.5 305.5 65.5 436.4 6717.1
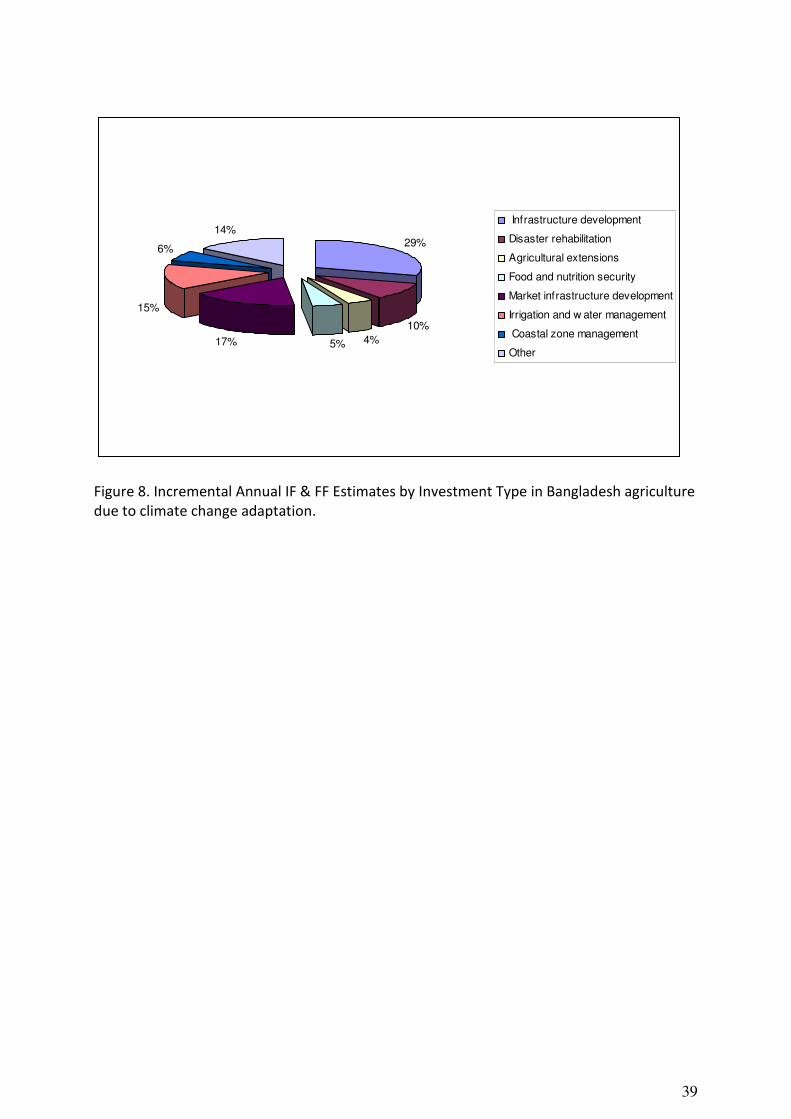
39
29%
10%
4%5%17%
15%
6%
14% Infrastructure development
Disaster rehabilitation
Agricultural extensions
Food and nutrition security
Market infrastructure development
Irrigation and w ater management
Coastal zone management
Other
Figure 8. Incremental Annual IF & FF Estimates by Investment Type in Bangladesh agriculture
due to climate change adaptation.
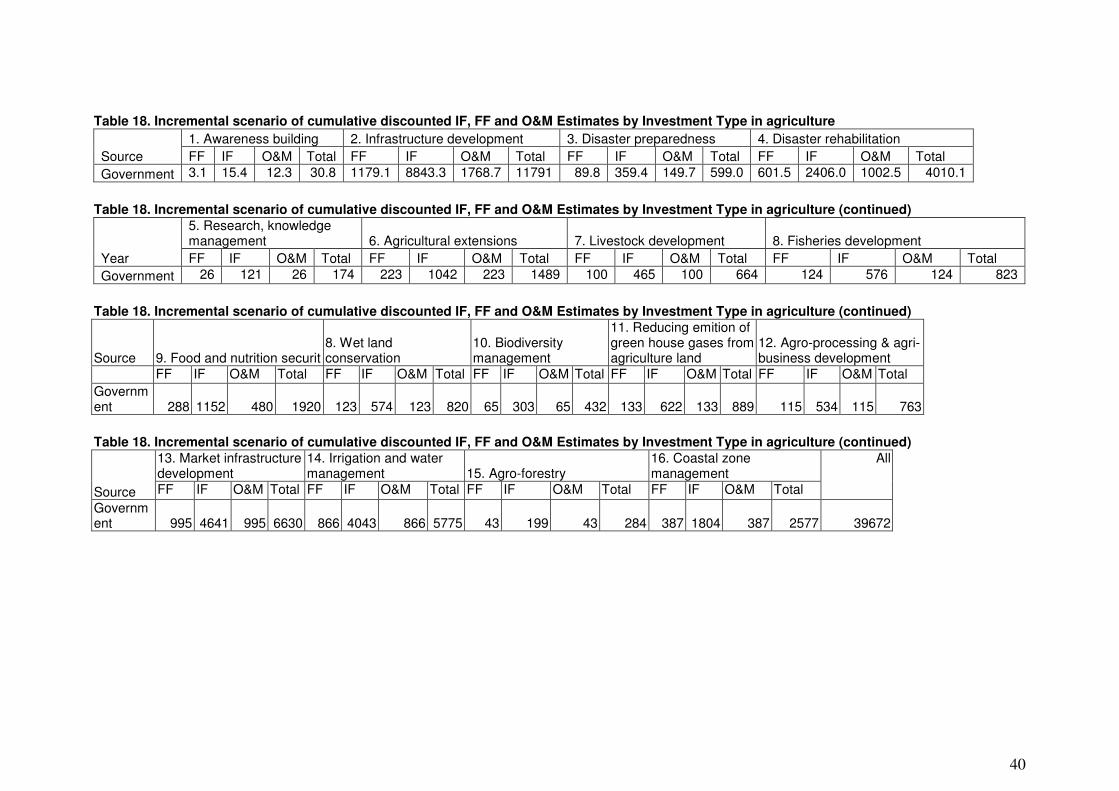
40
Table 18. Incremental scenario of cumulative discounted IF, FF and O&M Estimates by Investment Type in agriculture
Source
1. Awareness building 2. Infrastructure development 3. Disaster preparedness 4. Disaster rehabilitation
FF IF O&M Total FF IF O&M Total FF IF O&M Total FF IF O&M Total
Government 3.1 15.4 12.3 30.8 1179.1 8843.3 1768.7 11791 89.8 359.4 149.7 599.0 601.5 2406.0 1002.5 4010.1
Table 18. Incremental scenario of cumulative discounted IF, FF and O&M Estimates by Investment Type in agriculture (continued)
Year
5. Research, knowledge management 6. Agricultural extensions 7. Livestock development 8. Fisheries development
FF IF O&M Total FF IF O&M Total FF IF O&M Total FF IF O&M Total
Government 26 121 26 174 223 1042 223 1489 100 465 100 664 124 576 124 823
Table 18. Incremental scenario of cumulative discounted IF, FF and O&M Estimates by Investment Type in agriculture (continued)
Source 9. Food and nutrition securit 8. Wet land conservation
10. Biodiversity management
11. Reducing emition of green house gases from agriculture land
12. Agro-processing & agri-business development
FF IF O&M Total FF IF O&M Total FF IF O&M Total FF IF O&M Total FF IF O&M Total
Government 288 1152 480 1920 123 574 123 820 65 303 65 432 133 622 133 889 115 534 115 763
Table 18. Incremental scenario of cumulative discounted IF, FF and O&M Estimates by Investment Type in agriculture (continued)
Source
13. Market infrastructure development
14. Irrigation and water management 15. Agro-forestry
16. Coastal zone management
All
FF IF O&M Total FF IF O&M Total FF IF O&M Total FF IF O&M Total
Government 995 4641 995 6630 866 4043 866 5775 43 199 43 284 387 1804 387 2577 39672
41
3.2 Policy implications
Different National Policies directly address the agriculture sector and the inherent risk of
climate change. However, the GoB is aware of the importance of climate change and the
country’s historical sensitivity to climate variability in general as well as its vulnerability. But
certain policies exist that are concerned with adaptation and changes in I&FF in the
agriculture sector. The lists of the policies reviewed are:
• National agricultural policy, Ministry of Agriculture (MoA), 1999
• National water policy, Ministry of Water Resources (MoWR), 1999
• Environment policy, Ministry of Environment and Forest (MoEF), 1992
• Land use policy, Ministry of Land (MoL), 2001,
• Coastal zone policy, Ministry of Water Resources (MoWR), 2005
• National fisheries policy, (Ministry of Fisheries and Livestock (MoFL), 1998).
National Agriculture Policy (Ministry of Agriculture (MoA), 1999)
National Agriculture Policy (NAP) was developed by the Ministry of Agriculture with a view to
develop and sustain agricultural growth in such a way that it ensures the nation with a self-
sufficient reliable food security system. NAP 1999 or the New Agricultural Extension Policy
(NAEP) 1996 has no specific statement made on the issue of climate change and its impact
on agriculture. The National Agricultural Policy Draft 2009 specifically mentions the word
climate change as an environmental vulnerability.
Policy issues that indirectly correlate with climate change adaptation procedures:
i. The policy, under section 3.5, ensures supplementary irrigation in severe and
extremely severe drought affected areas, which is an adaptive measure against
climate induced variable rainfall and low surface flow. Also section 9.1 states target
oriented research and extension programmes will be conducted for region-wise
research on irrigate and rain-fed adaptation in Bangladesh agriculture.
National Water Policy (Ministry of Water Resources (MoWR), 1999)
The National Water Policy (NWP) is the first ever water policy document on water resources
management for the country pronounced in January 1999. The policy does not make any
specific statement on the issue of climate change and its impact on water resources.
Policy issues that indirectly consider the adverse effect of climate change on water
resources:
i. The Policy considers in the introduction common hydro-meteorological phenomena
like alternating flood and water scarcity during the wet and dry season, river
sedimentation and bank erosion as the most crucial challenges. Although not
mentioned, it is implicit that these events are anticipated to be aggravated by
climate change.
ii. The policy under section 4.6 concentrates on the issue of inland salinity intrusion
from sea in the southwest and considers that this intrusion is causing groundwater
to be unfit for consumption. Although the statement does not suggest any
adaptation policy, it indirectly infers the need for alternative sources of water supply
for the community. If proper adaptation and mitigation can be done in this respect it
will facilitate the task of reducing water related vulnerability due to climate change.
42
Policy issues that indirectly correlate with climate change adaptation and mitigation
procedures:
i. The section on River Basin Management (section 4.1) emphasizes on cooperation
with co-riparian countries. The policy renders importance in exchange of data of the
rivers between the sharing countries which might even help in flood forecasting in
the lower riparian regions. This is a positive approach in climate change adaptation
and mitigation system, as flood is one of the extremities or water related disaster
that might exaggerate due to climate change.
ii. The policy, under section 4.2, considers framing rules, procedures and guidelines for
combining water-use and land-use planning for agricultural purposes. Successful
implementation of this policy will help adaptation and mitigation in regards of
climate change if some additional concern for climate change induced extremes are
included and acted on.
iii. The policy, under section 4.2, highlights the importance of preparing and
implementing sub regional and local water-management plans in conformity with
NWMP. This increases the potential to work on climate related issues locally by both
NGOs and private sectors.
iv. The NWP highlights the necessity of undertaking comprehensive development and
management of the main rivers through a system of barrages and other structural
and non-structural measures under section 4.2.j. The policy also calls for developing
early warning and flood-proofing systems to manage flood and drought. The
statements facilitate further adaptation towards climate change as it safeguards the
people from the effect of the extremes like flood and drought which are bound to
increase in extent and frequency due to the climate variability and changes.
v. Section 4.3 of the policy states that the Government can redirect use (of water)
during periods of droughts, floods, cyclones, and other natural disasters. The
statement clearly creates the scope of emergency adaptation to climate change
related water shortage and climate extremity issues in the near future.
vi. The NWP calls for improvement of resource utilization through conjunctive use of all
forms of surface water and groundwater for irrigation and urban water supply under
section 4.7. It also promotes strengthening of crop diversification programmes for
efficient water utilization. This statement is a planned adaptation to safeguard crop
agriculture against the possible impacts of climate change.
vii. The policy under section 4.7 addresses the need for strengthening appropriate
monitoring organizations for tracking groundwater recharge, regulating surface and
groundwater use, and monitoring changes in surface and groundwater quality. Under
climate change induced low flow regime, there would be increased dependency on
groundwater and both irrigation and water supply in that case depends on
groundwater. Hence the statement prioritizes the need to manage groundwater
along with surface water which will help in tackling climate change.
viii. The policy states under section 4.9 that fisheries and wildlife are to receive due
emphasis in water resources planning in areas where their social impact is high. As
the Sundarbans is a hotspot for flora and fauna and a home to 7-8 million people, not
to mention its importance as a UNESCO world heritage site, its river system if gets
sufficient acknowledgement from the government according to the policy, it may
save the river system from the anticipated salinity intrusion that is occurring from sea
level rise and reduced dry season flow, all significant impacts of climate change.
43
ix. One of the most significant statements of the policy is under section 4.13 on the
preservation of haors, baors and beels and biodiversity. Natural water bodies such as
beels, haors, and baors will be preserved under this statement for maintaining the
aquatic environment, and developing dry season agriculture and wet season fish
habitat in them. Such a step is certainly advancement in preserving surface water as
streams and river flow which are assumed to decline during dry season due to
climate extremities and variability.
x. Section 4.15 considers development of a central database and management
information system (MIS) consolidating information from various data collection and
research agencies on the existing hydrological systems, supply and use of national
water resources, water quality, and the eco-system. This is a major step towards
advanced research that can incorporate climate related studies and technology
transfer.
Environment Policy, (Ministry of Environment and Forest (MoEF), 1992)
The Environmental Policy and Implementation Programme (EPIP) for Bangladesh were
pronounced by the Ministry of Environment and Forest in 1992 (MoEF, 1992). The policy
does not directly use the term climate change nor is any direct statement made on the effect
and consequences or adaptation procedures related to climate change in the context of
agriculture, water and environment.
Policy issues that indirectly consider the adverse effect of climate change on coastal areas:
Though climate change is not directly stated in the policy, consideration has been given in
the introductory section that frequent flooding, drought, cyclone, water surge etc. natural
calamity; preliminary symptoms of desertification in the northern zone of the country;
salinity intrusion in rivers; land erosion; rapid reduction of forest area; variable climatic and
weather condition and other environmental problems are observed throughout the country.
Policy issues that indirectly correlate with climate change adaptation procedures:
i. Section 3.5.3 states that flood controlling structures, embankment, channelization
and other local, regional and national level arrangements made for flood protection
should be environmentally sound. The policy also states that such flood mitigation
measures or interventions will be removed which have adverse environmental effect.
ii. Section 3.10 concentrates on coastal and marine ecosystem and the conservation
and development of its natural resources and biodiversity. This is an adaptive
measure to climate change related impacts on the coastal belt and marine
biodiversity.
Policy issues that indirectly correlate with climate change mitigation procedures:
i. An important mitigation step towards climate change is stated in section 3.2
which is to ban those industries which produce pollutant products or have such
production procedure that is polluting the nature.
Land Use Policy (Ministry of Land (MoL), 2001)
Bangladesh Land Use Policy 2001 is approved by the Ministry of Land of the GoB. The main
objectives of the land use policy are prevention of excessive land use due to the ever
increasing demand for crop production, maximum utilization of inlands and wetlands,
44
preservation of ‘Khas Lands’ and helping in reducing the number of landless people in
Bangladesh.
Policy issues that states the adverse effects of climate change
No specific statement considering the impact of climate change on the country or its
resources is made in the policy. But the importance of afforestation, environment and
mutual sustainability of land use and forest are focused upon in the policy.
Policy Issues that Indirectly Correlate with Climate Change Adaptation and Mitigation
Procedures:
i. Water bodies shall not be used in such way that it contradicts the fisheries
policy and still contribute in agricultural irrigation.
ii. Existing water bodies shall not be encroached for any other land use.
iii. Regular maintenance of the existing water bodies shall be confirmed.
iv. Embankments shall be made in a way that provides drainage facility and
water-logging does not occur within the enclosed area.
Policy Implications: Mainstreaming Climate Change in Agricultural Sector Development
From the above analysis, significant knowledge has been gathered as well as a number of
gaps have been identified which are listed below:
i. Bangladesh has already enacted its climate change strategy and action plan which
provides the principle guideline for adaptation and mitigation planning for
agriculture.
ii. Sectors in which mitigation and /or adaptation is required has already been identified
in NAPA and BCCSAP.
iii. Linkage of adaptation and mitigation activities with the national agricultural
development programmes and projects has started to be established. But for better
linkage, a road map for Bangladesh is required for mainstreaming climate change
considerations across all sectors and at all levels.
iv. National priority issues have been identified in the long-term, medium term and
short-term planning documents and to some extent climate change has been linked
with some issues. But efforts targeting toward adapt or to mitigate climate change
with overall objective of achieving the national priorities are yet to be achieved.
v. Some of the national policies have addressed climate change directly, but most of
them do not.
vi. The following gaps are identified in terms of mainstreaming climate change
considerations in the national development planning:
a) Currently, most policy responses continue to address climate change,
development, and disaster management independently;
b) There certainly remains a lack of interaction and institutional overlap among
policy makers; in other words, there is a need for more coordination across
different ministries;
c) There is a lack of comparison between the implications of different policy
interventions to adapt to climate change;
d) While many of the Climate Change adaptation policies are consistent with
traditional developmental policies (especially in areas of disaster reduction),
45
some Climate Change implications will require changes in policies and new
policy instruments, for which there is a considerable knowledge gap;
e) There is a lack in understanding synergies in and/or obstacles to simultaneous
progress in promoting enhanced adaptive capacity and sustainable
development;
f) There are gaps between spatially explicit analyses of vulnerability and
aggregate integrated assessment models; and
g) There are gaps in developing new decision support mechanisms that can
identify robust coping strategies in the face of the many critical climate
change uncertainties.
Coastal Zone Policy (Ministry of Water Resources (MoWR), 2005)
The Ministry of Water Resources developed the Coastal Zone Policy in 2005 which is of
immense importance as the agriculture and livelihoods of coastal zones greatly related to
climate change issues. Cyclones, storm surges, floods, drought, earthquakes, erosion, salinity
intrusion and arsenic contamination are some of the natural hazards that are frequent in
coastal zones. Lack of safe drinking water, overexploitation of natural resources, water
logging, river siltation and hill cutting also add to the vulnerabilities in agriculture. The
coastal zone of Bangladesh has diverse eco-systems: mangrove, marine, estuary, islands,
coral, sandy beaches and sand dunes. This part of the country has both a ‘world heritage
site’ and ‘ecologically critical areas’. The Coastal Zone policy and CDS (Coastal Development
Strategy) focus on these issues concentrating exclusively on climate change.
In section 1.1 of the policy, it is directly mentioned that the coastal area is vulnerable to risks
from climate change. In section 4.3 it is mentioned that the majority of households in this
area are vulnerable to climate change.
A complete section (Section 4.8.3) is devoted to climate change in coastal areas as well as
adaptation procedures and directly mentions adaptive measures towards sea level rise. The
section highlights the following:
i. Continuing existing institutional arrangements to monitor climate change
ii. Supporting the upgrading of technology and institutional strengthening for enhancing
the capacity to generate better data and more accurate long-term prediction and risk
related to climate change
iii. Implementing adaptive measures that are identified in relation to climate change and
coastal zone
iv. Maintaining sea-dykes along the coastline as first line of defense against predicted
sea-level rise
v. Making an institutional framework to monitor/detect sea level rise and planning to
cope with its impact.
Policy issues that indirectly correlate with climate change adaptation and mitigation
procedures:
i. Special measures will be taken to conserve and develop the natural environment of
the Sundarbans. This is a required step for safeguarding the Sundarbans against
possible climate change impacts.
46
ii. Measures will be taken for afforestation in the coastal areas including newly accreted
chars. This is a safeguard against water surge and other hazards that are common in
the coastal belt of Bangladesh and are extreme events that are likely to increase in
extent and frequency due to climate change.
iii. Salt-tolerant crop varieties will be developed and extended in the coastal belt which
is more of a direct approach against salinity intrusion due to reduced upstream flow
and sea level rise. Section 4.4.2 also suggests that adequate upland flow shall be
ensured in water channels to preserve the coastal estuary ecosystem threatened by
the intrusion of soil salinity from the sea. These are very positive measures against
salinity intrusion induced by climate change.
iv. The scope of irrigation facilities will be explored and extended in this area and
comprehensive water management for agriculture will be implemented which is a
must in the variable climatic conditions during climate change. It is also stated in the
policy that small water reservoirs shall be built to capture tidal water in order to
enhance minor irrigation in coastal areas.
v. As water scarcity is going to be a major problem in the overall variable rainfall,
salinity intrusion and sea level rise condition in the coastal area, appropriate water
management system stated in section 4.4.2 is of utmost importance. Polders utilizing
existing infrastructures will be established for freshwater storage and other water
utilization. Rainwater harvesting and conservation shall be promoted. Ponds and
tanks will be excavated for conservation of water. Step will be taken to ensure
sustainable use and management of ground water.
vi. Through its responsible agencies, the Government will properly plan and implement
schemes for reclamation of balanced land from the sea and rivers. This is a major
step towards the sea level rise issue as much of the land is supposed to go under
water due to the rise.
vii. Effective measures will be taken for protection against erosion and for rehabilitation
of the victims of erosion. Safety measures will be enhanced by combining cyclone
shelters, multi-purpose embankments, killas, road system and disaster warning
system. These are all protective measures even if indirectly, against climate change.
National Fisheries Policy (Ministry of Fisheries and Livestock (MoFL), 1998)
The National Fisheries Policy was developed by the Ministry of Fisheries and Livestock in
1998. The goal of the policy is to enhance the fisheries production along with poverty
alleviation through creating self-employment and improvement of socio- economic
conditions of the fishers. It also concentrates on the fulfillment of the demand for animal
protein and achievement of economic growth through earning foreign currency by exporting
fish and fisheries products.
Though the policy in its objectives pronounces ‘maintenance of ecological balance’ and
‘conservation of biodiversity’, it does not directly count ‘climate change’ as a threat to fish
resources. But the policy states that flood control, water drainage and construction of dam
and barrage in the irrigation projects without any proper EIA and installment of fish pass,
release of hazardous chemicals and poisonous substances from the slum area and different
industrial plants into the river and other water bodies, pollution of water using chemical
insecticides and fertilizers in the agricultural fields, reduction of water holding capacity of
rivers, beels and haors due to siltation, and harvesting of excessive amounts of fish to meet
47
the demand of growing populations are considered as the main reasons that might hamper
fish production in the country.
Policy issues that correlate with climate change adaptation and mitigation procedures
Climate change combat has various aspects, one is to reduce emission of GHG or mitigation
and another is to adapt with the changing climate. Securing our food sector is a challenging
but most crucial adaptation step towards climate change. Preservation and proper use of
fish resources is not only helpful for national development or environmental sustainability,
but also required to combat food crisis that may occur in near future due to the varying
climatic condition. Some points that would help the fish resources and water resources to
attain its ultimate sustainability are enlisted below:
i. The policy concentrates on conserving fish habitats from damage and taking
appropriate care during the implementation of all developmental activities such as
flood control, irrigation and drainage projects, agriculture, industries, road and urban
development projects.
ii. Jalmohals designated as fish sanctuaries will be transferred to the Directorate of
Fisheries according to the policy. For increased production and to conserve
biodiversity, some areas or the whole jalmohal will need to be converted into fish
sanctuaries.
iii. Fish culture will be initiated on a priority basis in lands where 50 cm of inundation is
available for a period of more than 3 months to increase fish industry.
iv. Surveys will be conducted of the water bodies, which become water-logged or closed
water bodies due to the flood control and irrigation projects to fulfill the possibility of
those water bodies for use in fish culture.
v. Lakes, beefs, ditches-canals and other open water bodes should not be completely
dewatered. Instead, water bodies like haors, baors and beels would be renovated for
fish culture and these water bodies would not be reduced in size.
vi. Integrated prawn and fish culture along with rice will be encouraged in brackish
water bodies. Measures will be taken to conserve biodiversity in the coastal region
and necessary steps will be taken to culture fish/shrimp along with rice crop.
Arrangements will be established within the polders (embankment) and flood control
projects to conserve wild life. Each polder will be coupled with arrangements for
fish/shrimp culture with rice either in concurrent or in rotational system.
vii. Expansion of shrimp culture in mangrove forest or destruction of mangrove forest
will be completely banned. In order to ensure ecological balance, tree plantation will
be encouraged in shrimp culture area.
viii. Harvest of fish and shrimp by the trawlers in the shallow coastal areas (within 40-
meter depth) will be banned.
ix. Appropriate preventive measures will be taken against dumping of hazardous
chemicals and atomic wastes into the sea. Discharge of harmful municipal and
industrial wastes directly into the water bodies will be considered a punishable crime
and measures will be taken to ban the use of harmful chemical substances and
insecticides in the agricultural fields.
x. Laws will be formulated to ban the disposal of any untreated industrial effluents into
the water bodies.
48
However, in order to implement the results of this analysis; the National Adaptation
Programme of Action (NAPA) and Bangladesh Climate Change Strategy and Action Plan
(BCCSAP) should be considered as base documents. According to BCCSAP; the prioritized
investment options which will supplement the implementation of results of this study are:
1. Improved crops and cropping systems
2. Improved irrigation and water management
3. Flood proofing
4. Early warning system
5. Improved O&M and upgrading of coastal embankments and polders.
The BCCSAP is an integral part of national development policies, plans and programmes
including the upcoming Sixth Five Year Plan. BCCSAP has highly encouraged further
investments in research on developing new varieties, construction of climate proof
infrastructures and capacity building of government, non-government and business actors.
NAPA document has encouraged investments in better access to agricultural services, social
protection measures, i.e. safety-nets, insurance and enhancing awareness, behavioral
changes and communication for climate related risks.
The Poverty Reduction Strategy Paper and The Perspective Plan (Vision 2021) are the other
two policy documents which may prove to be very effective for implementing the results of
this study since these two documents have made climate change as an integral part of policy
direction.
There are also some emerging needs of promotion of Public-Private Partnership (PPP),
subsidies in agricultural inputs and resources and need for a comprehensive database on
agriculture sector.
Besides the abovementioned areas; there are some other critical areas of climate friendly
investment options within the agricultural sector:
Key Finding 1: Need for mainstreaming of Climate Change into new Project Documents and
Policies, including institutional development and capacity building.
At present there is no TPP/DPP appraisal guideline. The responsible officers evaluate the
TPP/DPP with their own wisdom, knowledge and experiences. In general the evaluation is not
very intensive due to lack of appropriate guidelines and the evaluators need capacity to do
this. The evaluators assess/appraise the projects based on the TPP/DPP
completion/formulation “structure”. If the structure is followed well when completing the
TPP/DPP, the environmental risks are covered. But Climate Change risks and mitigation issues
are not reflected in the TPP/DPP.
Moreover, the mapping and review of policy documents revealed that, with the exception of
the National Agricultural Policy (2008, Draft Version), the policies in general do not pay
sufficient attention to potential impact from climate change hazards. Most of the existing
policies are including environmental concerns in relation to agricultural, fish or livestock
production. This is positive of course. But climate change hazards are strongly linked to
changes in the environment.
49
It is clear that many of the policy documents have been developed during a period where
environmental degradation from agricultural and fisheries production has been a main
concern. It is clearly a positive finding that environment aspects are being considered to such
large extent in existing policy documents and there seem to be a scope for using a similar
approach for projection of climate change risks into these policies.
Guidance for institutional development and capacity building are included in the policy
documents. Mainstreaming of climate change into institutions covered by the respective
policies should therefore be considered an integrated part of the policy development process.
Key finding 2: Need for revision of existing policies and guidelines in order to include climate
change risks.
Climatic hazards such as water logging/inundation and flooding are affecting crop agriculture,
fisheries and livestock. These risks also cause damage to rural infrastructure in terms of failure
of structures, erosion in embankment and roads and damage to road pavement. Although
environmental concerns and mitigation for roads construction are to some extent included,
existing policy and design criteria does not take into consideration the climate change risks.
Key finding 3: Need for strengthening of linkages between research institutions and farming
associations.
A large number of research projects and demonstrations are taking place all over Bangladesh.
A review of current procedures together with workshops and meetings with key stakeholders
from research and farming has revealed that there is limited coordination and knowledge
sharing taking place within and across researchers and farmer groups. Moreover, the yield
increases reported from the research stations are far from those registered at the farming
level.
Key finding 4: Need for more context specific approaches to climate change adaptation.
To date the analyzing of possible impacts of climate change in Bangladesh has been mainly
conceived at the macro level, partly due to data limitations and lack of systematic knowledge
of micro level conditions. Such a basis for adaptation work has its limitations, since each of the
agro ecosystems hides considerable local variation in the resource, which makes generalization
on technologies and management approaches hazardous.
As per today, there is therefore limited knowledge of which adaptation options that work best
under which conditions. Moreover, many ongoing community based adaptation projects have
a rather narrow and short term focus, which may not reflect the medium to longer term
perspectives on the impacts from climate change hazards.
Key finding 5: Need for more integration of Adaptation with Mitigation.
While most discussions of response to climate change in Bangladesh, focuses on adaptation
measures, little attempt is done to investigate how local mitigation measures could help to
50
offset negative impacts from, for instance, sea level rise. Likewise, existing policy documents
(including the National Agricultural Policy, 2008) and guidelines are not paying attention to the
potential benefit from a more strategic integration of mitigation with adaptation activities.
Key finding 6: Need for an integrated and strategic approach to livelihood development at
community level, considering the gradual changes in the environment caused by climate
factors. The impacts from climate change hazards are gradually changing the livelihood
conditions within many communities, including for crop and fish cultivation and livestock. For
instance, it is forecasted that as much as 30% of the current land area of Bangladesh may be
inundated as a result of sea level rise and impeded drainage, notably along the coast lines.
These changes may lead to need for new innovative and integrated approaches of how to
optimize utilization of land and water resources in the future. Such approach is currently not
integrated into the sector policy planning.
Key finding 7: Need for more widespread awareness raising on climate change at the farming
level. Although a number of community based adaptation projects spread all over the country
are including awareness raising and capacity building of farmers as part of their projects, there
seem to be a need for more widespread awareness raising initiatives across the farmers in the
country.
Within the AEC, training is being provided both to farmers and mass media on agricultural
issues, but not particular including climate change. It is reported that the TV media often lack
required professional skills to produce and present well-documented and informative
television programmes on climate change risks.
Key finding 8: Need for more and better knowledge sharing on climate change issues
A large number of community based adaptation projects are currently being implemented all
over Bangladesh. There is however no systematic overview off who is doing what - and what
is being done where. Likewise, knowledge sharing is fragmented and sporadic. Although, those
communities that are directly involved in the adaptation projects assumable are benefitting
from the interventions, the lack of any systematic knowledge sharing is increasing the
possibility for overlapping of activities and reducing the potentials for dissemination and
replication.
3.3 Key Uncertainties and Methodological Limitations
Global climate risks have now started to take concrete shapes and it is widely predicted that
Bangladesh is one of the country’s most vulnerable to climate change. Adaptation to climate
change risk will put additional strain on agricultural development efforts of Bangladesh. Only
the economic cost is expected to be much higher, even excluding the social and
environmental costs.
The study has opened a window to dive deeper into the issues of climate change with
respect to agriculture and environment. More integrated approach towards assessing
impacts of climate change may be a welcome attempt for the government as the challenge
51
has marked strokes on the economy through erratic extremes of hydro-meteorological
disasters in Bangladesh.
Major uncertainties of this study are:
• Cost calculations are more normative or judgmental rather than focusing on the
specificity. Thus the cost figures are subject to vary and need detail study for each
of the individual investment programmes prior to final implementation.
• Policy formulation phase will require further research on (i) change in climate change
adaptation needs, (ii) reforms in land and water use profiles, (iii) reconstitution of
terms of international trade with respect to abatement and adaptation costs and
benefits.
• A wider forum for brainstorming on these issues is urgent because the climate
change factors are incipient and impacts are undercutting our economic strength
in terms of drawing more and more resources to repair the severe dents.

52
4. References
please complete
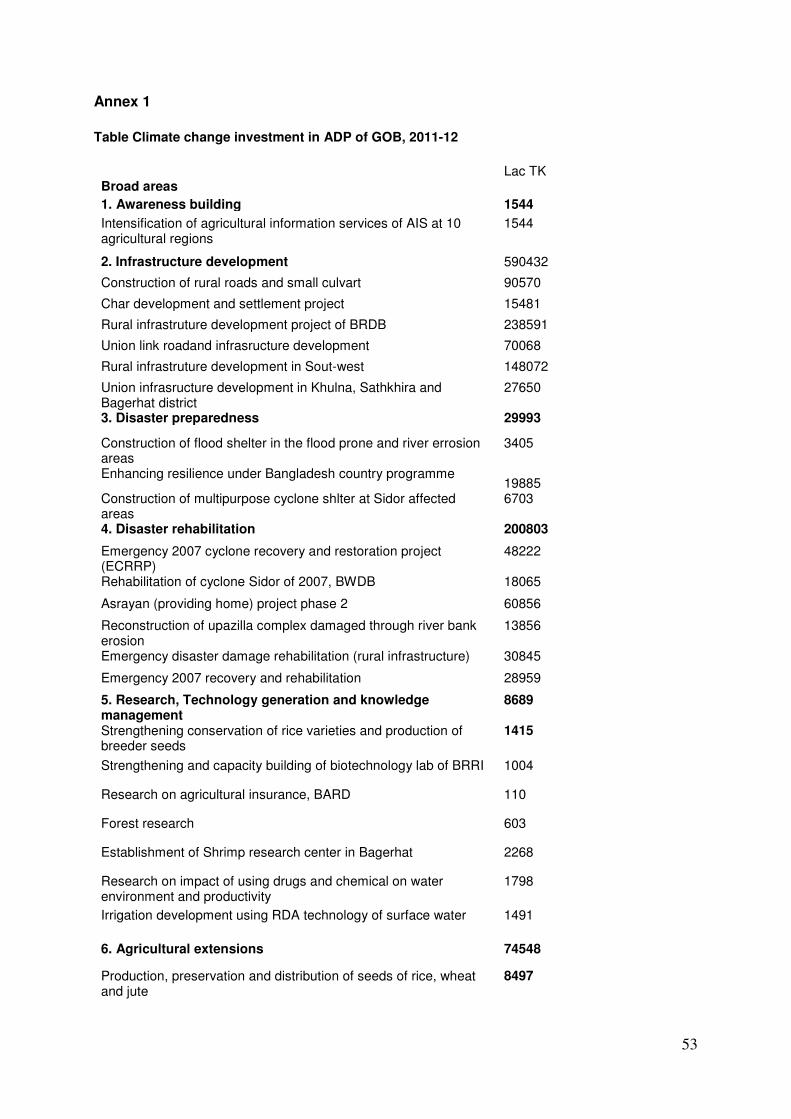
53
Annex 1
Table Climate change investment in ADP of GOB, 2011-12
Lac TK Broad areas
1. Awareness building 1544
Intensification of agricultural information services of AIS at 10 agricultural regions
1544
2. Infrastructure development 590432
Construction of rural roads and small culvart 90570
Char development and settlement project 15481
Rural infrastruture development project of BRDB 238591
Union link roadand infrasructure development 70068
Rural infrastruture development in Sout-west 148072
Union infrasructure development in Khulna, Sathkhira and Bagerhat district
27650
3. Disaster preparedness 29993
Construction of flood shelter in the flood prone and river errosion areas
3405
Enhancing resilience under Bangladesh country programme 19885
Construction of multipurpose cyclone shlter at Sidor affected areas
6703
4. Disaster rehabilitation 200803
Emergency 2007 cyclone recovery and restoration project (ECRRP)
48222
Rehabilitation of cyclone Sidor of 2007, BWDB 18065
Asrayan (providing home) project phase 2 60856
Reconstruction of upazilla complex damaged through river bank erosion
13856
Emergency disaster damage rehabilitation (rural infrastructure) 30845
Emergency 2007 recovery and rehabilitation 28959
5. Research, Technology generation and knowledge management
8689
Strengthening conservation of rice varieties and production of breeder seeds
1415
Strengthening and capacity building of biotechnology lab of BRRI 1004
Research on agricultural insurance, BARD 110
Forest research 603
Establishment of Shrimp research center in Bagerhat 2268
Research on impact of using drugs and chemical on water environment and productivity
1798
Irrigation development using RDA technology of surface water 1491
6. Agricultural extensions 74548
Production, preservation and distribution of seeds of rice, wheat and jute
8497
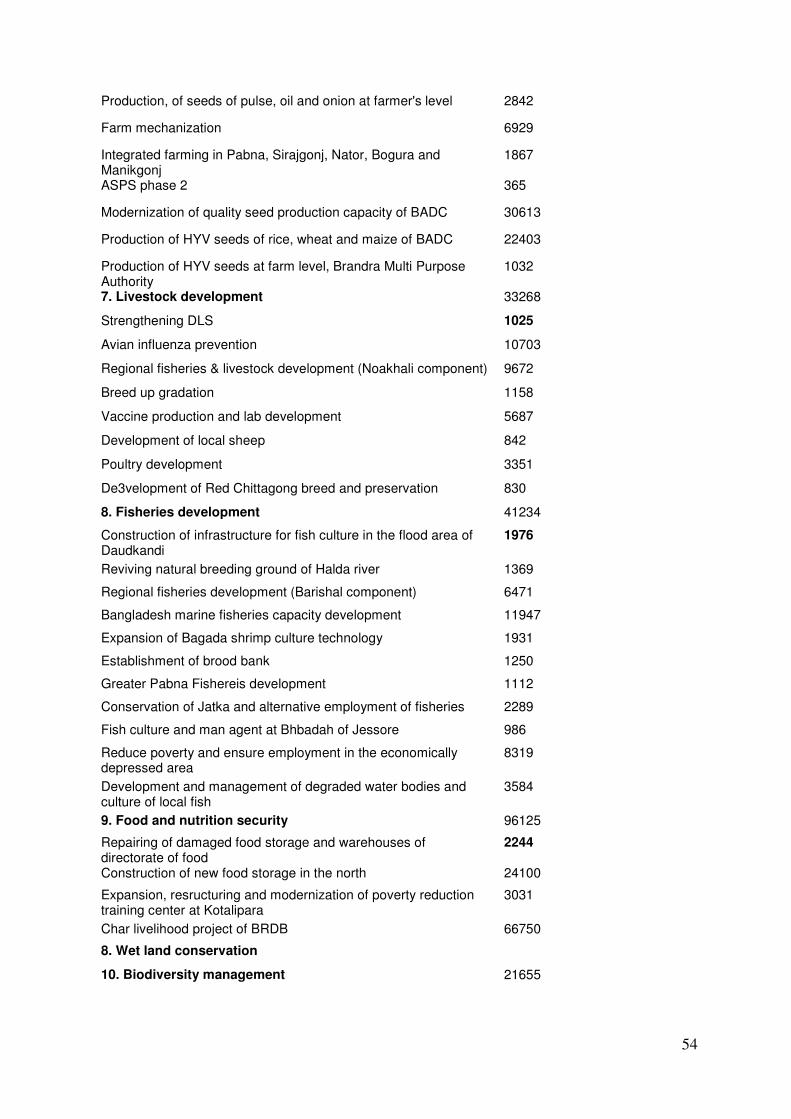
54
Production, of seeds of pulse, oil and onion at farmer's level 2842
Farm mechanization 6929
Integrated farming in Pabna, Sirajgonj, Nator, Bogura and Manikgonj
1867
ASPS phase 2 365
Modernization of quality seed production capacity of BADC 30613
Production of HYV seeds of rice, wheat and maize of BADC 22403
Production of HYV seeds at farm level, Brandra Multi Purpose Authority
1032
7. Livestock development 33268
Strengthening DLS 1025
Avian influenza prevention 10703
Regional fisheries & livestock development (Noakhali component) 9672
Breed up gradation 1158
Vaccine production and lab development 5687
Development of local sheep 842
Poultry development 3351
De3velopment of Red Chittagong breed and preservation 830
8. Fisheries development 41234
Construction of infrastructure for fish culture in the flood area of Daudkandi
1976
Reviving natural breeding ground of Halda river 1369
Regional fisheries development (Barishal component) 6471
Bangladesh marine fisheries capacity development 11947
Expansion of Bagada shrimp culture technology 1931
Establishment of brood bank 1250
Greater Pabna Fishereis development 1112
Conservation of Jatka and alternative employment of fisheries 2289
Fish culture and man agent at Bhbadah of Jessore 986
Reduce poverty and ensure employment in the economically depressed area
8319
Development and management of degraded water bodies and culture of local fish
3584
9. Food and nutrition security 96125
Repairing of damaged food storage and warehouses of directorate of food
2244
Construction of new food storage in the north 24100
Expansion, resructuring and modernization of poverty reduction training center at Kotalipara
3031
Char livelihood project of BRDB 66750
8. Wet land conservation
10. Biodiversity management 21655
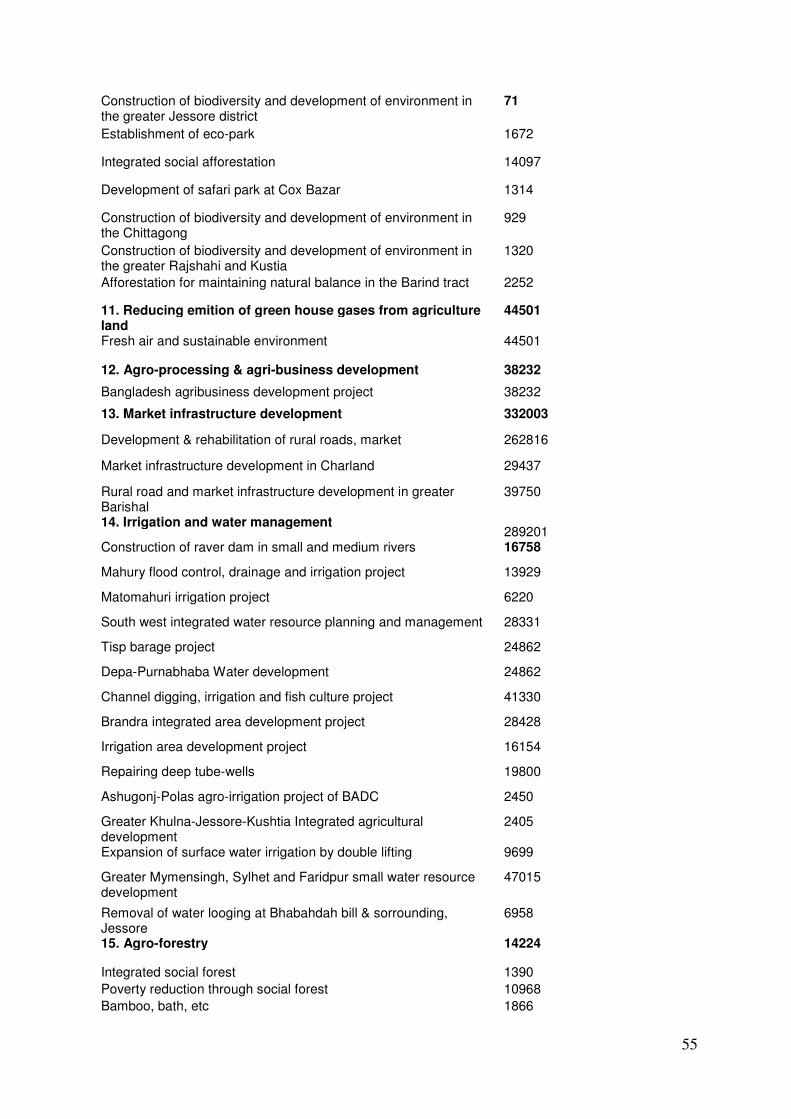
55
Construction of biodiversity and development of environment in the greater Jessore district
71
Establishment of eco-park 1672
Integrated social afforestation 14097
Development of safari park at Cox Bazar 1314
Construction of biodiversity and development of environment in the Chittagong
929
Construction of biodiversity and development of environment in the greater Rajshahi and Kustia
1320
Afforestation for maintaining natural balance in the Barind tract 2252
11. Reducing emition of green house gases from agriculture land
44501
Fresh air and sustainable environment 44501
12. Agro-processing & agri-business development 38232
Bangladesh agribusiness development project 38232
13. Market infrastructure development 332003
Development & rehabilitation of rural roads, market 262816
Market infrastructure development in Charland 29437
Rural road and market infrastructure development in greater Barishal
39750
14. Irrigation and water management 289201
Construction of raver dam in small and medium rivers 16758
Mahury flood control, drainage and irrigation project 13929
Matomahuri irrigation project 6220
South west integrated water resource planning and management 28331
Tisp barage project 24862
Depa-Purnabhaba Water development 24862
Channel digging, irrigation and fish culture project 41330
Brandra integrated area development project 28428
Irrigation area development project 16154
Repairing deep tube-wells 19800
Ashugonj-Polas agro-irrigation project of BADC 2450
Greater Khulna-Jessore-Kushtia Integrated agricultural development
2405
Expansion of surface water irrigation by double lifting 9699
Greater Mymensingh, Sylhet and Faridpur small water resource development
47015
Removal of water looging at Bhabahdah bill & sorrounding, Jessore
6958
15. Agro-forestry 14224
Integrated social forest 1390
Poverty reduction through social forest 10968
Bamboo, bath, etc 1866
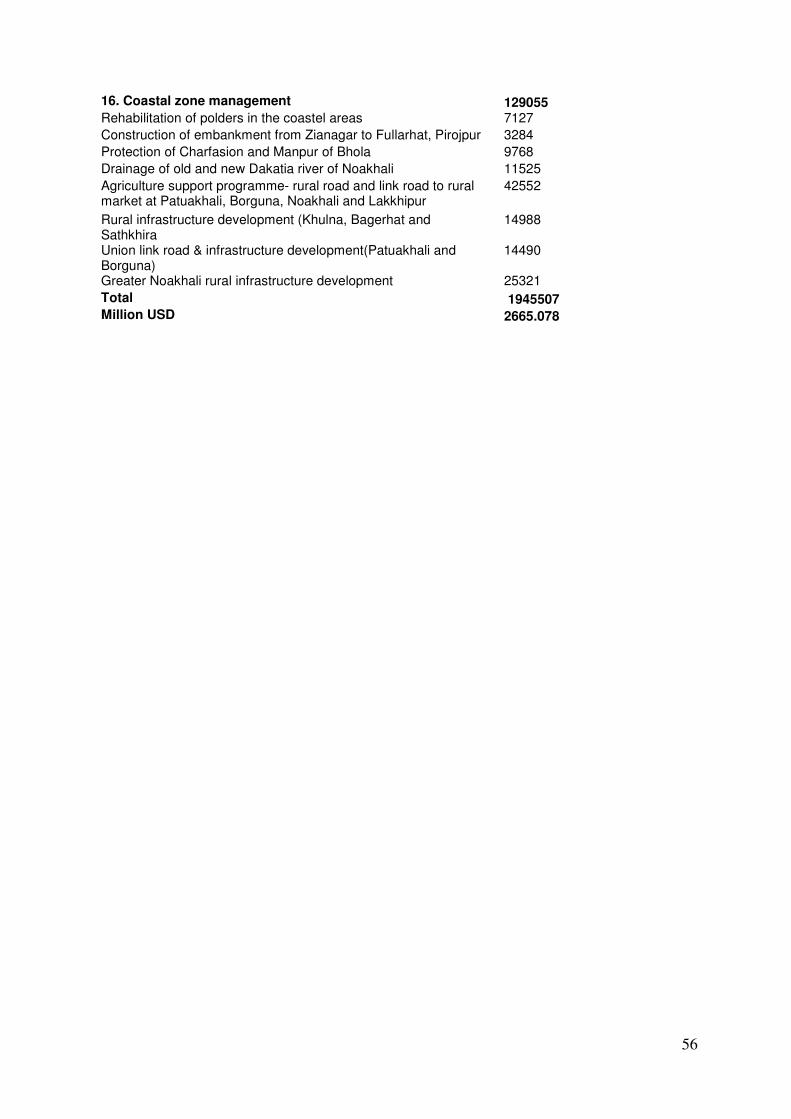
56
16. Coastal zone management 129055 Rehabilitation of polders in the coastel areas 7127
Construction of embankment from Zianagar to Fullarhat, Pirojpur 3284
Protection of Charfasion and Manpur of Bhola 9768
Drainage of old and new Dakatia river of Noakhali 11525
Agriculture support programme- rural road and link road to rural market at Patuakhali, Borguna, Noakhali and Lakkhipur
42552
Rural infrastructure development (Khulna, Bagerhat and Sathkhira
14988
Union link road & infrastructure development(Patuakhali and Borguna)
14490
Greater Noakhali rural infrastructure development 25321
Total 1945507 Million USD 2665.078
57
Case Study: Rice production
Investment and Financial Flows for Sustainable Agriculture under Climate Change
M. Asaduzzaman
Dhaka, November 11, 2011
58
Introduction
By now, it is well-established that Bangladesh will face many adverse impacts of climate
change (CC) although the quantification of the level of physical impacts (temperature rise,
precipitation changes, flooding, drought, heavy rains, sea level rise and salinity intrusion
inland, cyclone, coastal erosion) are not so well-calibrated. Given that these are the same
events which make agriculture a risky business at present, the increased frequency and the
intensity of these physical impacts of CC will make it riskier still. To make agriculture in
Bangladesh as resilient as possible to these changes and minimize the adverse impacts on
growth of agricultural output and stabilize it over time and space is a prime development
challenge. Meeting the challenge shall necessitate investment in specific areas as well as
other expenditures (financial flows). These investments may be by the public authorities, by
private economic agents (e.g., farm households) and private corporate bodies. The sources
of funding may be several such as government’s own resources, household and corporate
savings and credit from formal and informal sources. This case study tries to examine these
issues, as far as available information allow, to provide guidance to adaptation to climate
change for rice-based cropping system and allocate resources for financing such adaptation.
Key Parameters of the Assessment
Scope of the sector
Agriculture includes several sub-sectors which are crop cultivation, livestock, fisheries and
forestry. This case study focuses on rice-based cropping in Bangladesh. In terms of
investment entities, the public sector as well as households are analysed.
Assessment period and reference year
The reference year is 2005/06, the assessment period is 2005 to 2030. Accounting units are
given first in Bangladesh taka which is then converted into US$ at the average exchange rate
for the year specific year as reported by the Bangladesh Bank, the central bank of the
country.
Preliminary adaptation measures
The adaptation measures that have been identified under the Bangladesh NAPA included 15
project ideas. The 3 related to crop agriculture are:
• Promotion of research on drought, flood and saline tolerant varieties of crops to
facilitate adaptation in future
• Promoting adaptation to coastal crop agriculture to combat salinization through
maize production under Wet Bed No-tillage Method and Sorjan systems of cropping
in tidally flooded agro-ecosystem
• Adaptation to agriculture systems in areas prone to enhanced flash flooding–North
East and Central Region through No–tillage potato cultivation under water hyacinth
mulch in wet sown condition, and Vegetable Cultivation on Floating Bed Intervention.
The Bangladesh Climate Change Strategy and Action Plan (BCCSAP) 2009 has identified the
adaptation options in more detail. Note that the BCCSAP 2009 has grouped the adaptation,
mitigation and supporting related activities under six themes, several programmes under
each theme and several project ideas under each programme. Of them Theme 1 (Food
59
Security, Social Protection and Health) is most relevant for agricultural adaptation. So are
parts of several programmes under Theme 4 (Research and Knowledge Management).
Theme 5 on low carbon development and mitigation also includes programmes/project ideas
on agriculture. So does the Theme 6 on Capacity Development. These project ideas are given
below.
Theme 1. Food Security, Social Protection and Health
Programme 1.Institutional capacity and research towards climate resilient cultivars and their
Dissemination
Activity 1: Collection and documentation of local varieties of robust cultivars
Activity 2: Research to develop climate resilient varieties of rice (i.e., heat, drought, salinity
and submergence- tolerant varieties)
Activity 4: Field trials and dissemination to farmers of the local robust cultivars and the
newly developed varieties, in partnership with the extension service and NGOs
Activity 5. Strengthening the capacity of key research institutes and scientists
Programme 2. Development of climate resilient cropping systems
Activity1: Identify likely changes in agro-economic zones and probable climatic parameters
Activity 2: Develop climate resilient cropping patterns suited to different regions
Activity 3: Field level trials of climate resilient cropping patterns and associated water
management systems
Activity 4: Develop seed supply and extension mechanisms
Programme 3 Adaptation against drought
Activity 1 Prepare GIS maps of areas vulnerable to droughts
Activity 2: Develop and test adaptive measures in drought-prone areas by combining
appropriate cultivars, cropping patterns and land and water management practices, and
effective dissemination to farmers
Theme 4. Research and Knowledge Management
Programme 2. Climate change modelling at national and sub-national levels
Activities 1+2: Build capacity for construction of GCM models with small grids to obtain
regional variations in weather and building capacity to operate and update them
Activity 3: Collect additional field data for effective use of the calibrated models to predict
future climate change
Activity 4: Link up regional climate change models to generate better boundary conditions
Programme 3. Preparatory studies for adaptation against sea level rise (SLR) and its impacts
Activity 1: Setting up data collection network stations to monitor sea level rises and salinity
along with other appropriate hydro-meteorological data
Activity 2: Modelling the inundation and salinity impacts of SLR by specific time lines
Activity 3: Modelling and predicting the socio-economic and health impacts of SLR
Activity 4: Planning industrial relocation
Theme 5. Mitigation and Low Carbon Development
Programme 1 Improved energy efficiency in production and consumption of energy
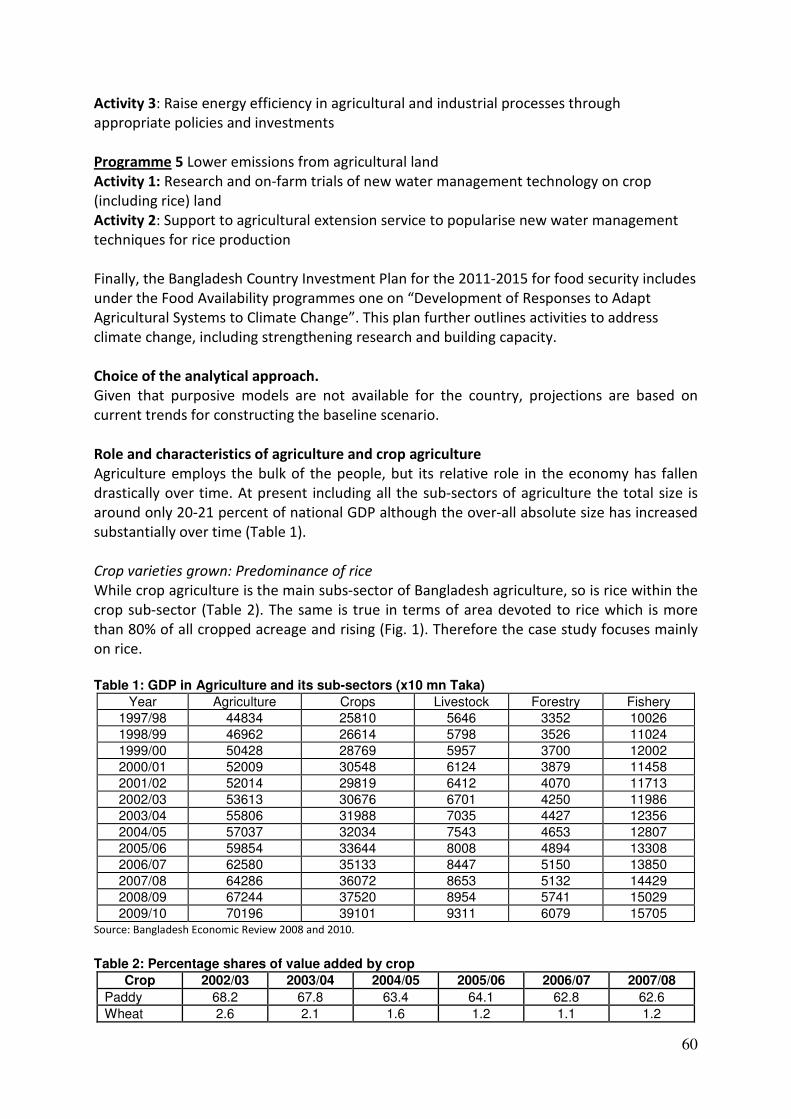
60
Activity 3: Raise energy efficiency in agricultural and industrial processes through
appropriate policies and investments
Programme 5 Lower emissions from agricultural land
Activity 1: Research and on-farm trials of new water management technology on crop
(including rice) land
Activity 2: Support to agricultural extension service to popularise new water management
techniques for rice production
Finally, the Bangladesh Country Investment Plan for the 2011-2015 for food security includes
under the Food Availability programmes one on “Development of Responses to Adapt
Agricultural Systems to Climate Change”. This plan further outlines activities to address
climate change, including strengthening research and building capacity.
Choice of the analytical approach.
Given that purposive models are not available for the country, projections are based on
current trends for constructing the baseline scenario.
Role and characteristics of agriculture and crop agriculture
Agriculture employs the bulk of the people, but its relative role in the economy has fallen
drastically over time. At present including all the sub-sectors of agriculture the total size is
around only 20-21 percent of national GDP although the over-all absolute size has increased
substantially over time (Table 1).
Crop varieties grown: Predominance of rice
While crop agriculture is the main subs-sector of Bangladesh agriculture, so is rice within the
crop sub-sector (Table 2). The same is true in terms of area devoted to rice which is more
than 80% of all cropped acreage and rising (Fig. 1). Therefore the case study focuses mainly
on rice.
Table 1: GDP in Agriculture and its sub-sectors (x10 mn Taka)
Year Agriculture Crops Livestock Forestry Fishery 1997/98 44834 25810 5646 3352 10026 1998/99 46962 26614 5798 3526 11024 1999/00 50428 28769 5957 3700 12002 2000/01 52009 30548 6124 3879 11458 2001/02 52014 29819 6412 4070 11713 2002/03 53613 30676 6701 4250 11986 2003/04 55806 31988 7035 4427 12356 2004/05 57037 32034 7543 4653 12807 2005/06 59854 33644 8008 4894 13308 2006/07 62580 35133 8447 5150 13850 2007/08 64286 36072 8653 5132 14429 2008/09 67244 37520 8954 5741 15029 2009/10 70196 39101 9311 6079 15705
Source: Bangladesh Economic Review 2008 and 2010.
Table 2: Percentage shares of value added by crop
Crop 2002/03 2003/04 2004/05 2005/06 2006/07 2007/08
Paddy 68.2 67.8 63.4 64.1 62.8 62.6
Wheat 2.6 2.1 1.6 1.2 1.1 1.2
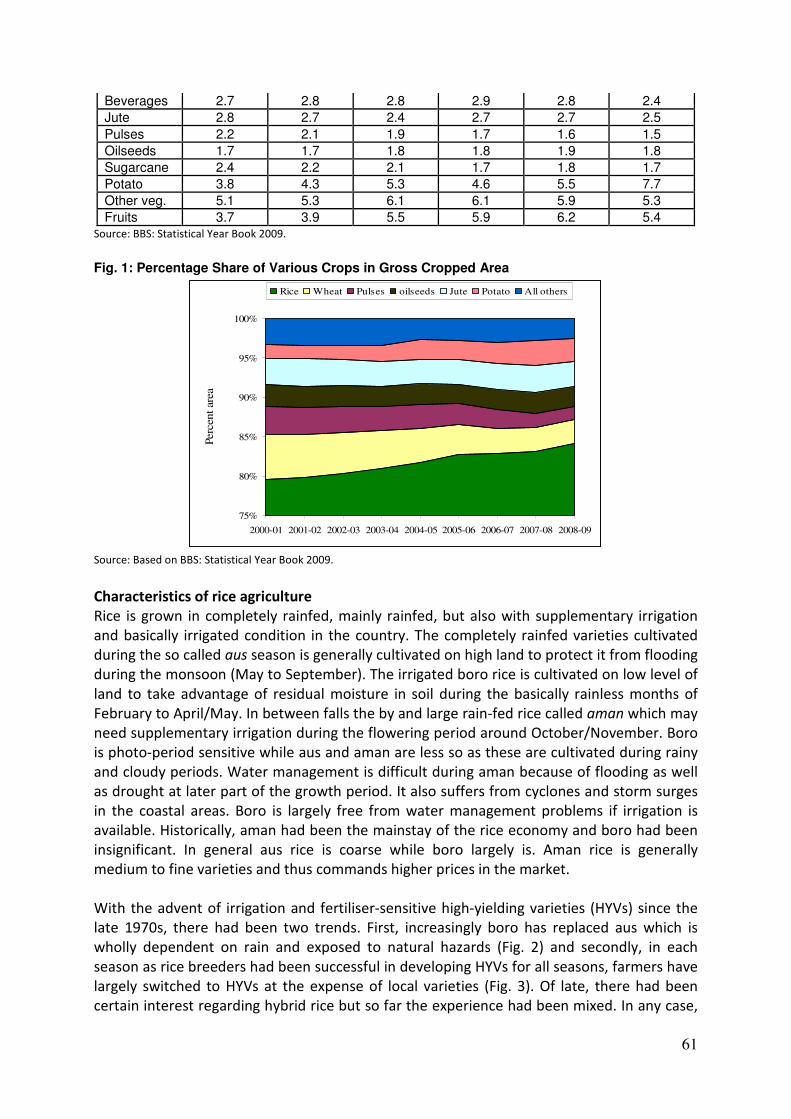
61
Beverages 2.7 2.8 2.8 2.9 2.8 2.4
Jute 2.8 2.7 2.4 2.7 2.7 2.5
Pulses 2.2 2.1 1.9 1.7 1.6 1.5
Oilseeds 1.7 1.7 1.8 1.8 1.9 1.8
Sugarcane 2.4 2.2 2.1 1.7 1.8 1.7
Potato 3.8 4.3 5.3 4.6 5.5 7.7
Other veg. 5.1 5.3 6.1 6.1 5.9 5.3
Fruits 3.7 3.9 5.5 5.9 6.2 5.4 Source: BBS: Statistical Year Book 2009.
Fig. 1: Percentage Share of Various Crops in Gross Cropped Area
75%
80%
85%
90%
95%
100%
2000-01 2001-02 2002-03 2003-04 2004-05 2005-06 2006-07 2007-08 2008-09
Perc
ent ar
ea
Rice Wheat Pulses oilseeds Jute Potato All others
Source: Based on BBS: Statistical Year Book 2009.
Characteristics of rice agriculture
Rice is grown in completely rainfed, mainly rainfed, but also with supplementary irrigation
and basically irrigated condition in the country. The completely rainfed varieties cultivated
during the so called aus season is generally cultivated on high land to protect it from flooding
during the monsoon (May to September). The irrigated boro rice is cultivated on low level of
land to take advantage of residual moisture in soil during the basically rainless months of
February to April/May. In between falls the by and large rain-fed rice called aman which may
need supplementary irrigation during the flowering period around October/November. Boro
is photo-period sensitive while aus and aman are less so as these are cultivated during rainy
and cloudy periods. Water management is difficult during aman because of flooding as well
as drought at later part of the growth period. It also suffers from cyclones and storm surges
in the coastal areas. Boro is largely free from water management problems if irrigation is
available. Historically, aman had been the mainstay of the rice economy and boro had been
insignificant. In general aus rice is coarse while boro largely is. Aman rice is generally
medium to fine varieties and thus commands higher prices in the market.
With the advent of irrigation and fertiliser-sensitive high-yielding varieties (HYVs) since the
late 1970s, there had been two trends. First, increasingly boro has replaced aus which is
wholly dependent on rain and exposed to natural hazards (Fig. 2) and secondly, in each
season as rice breeders had been successful in developing HYVs for all seasons, farmers have
largely switched to HYVs at the expense of local varieties (Fig. 3). Of late, there had been
certain interest regarding hybrid rice but so far the experience had been mixed. In any case,
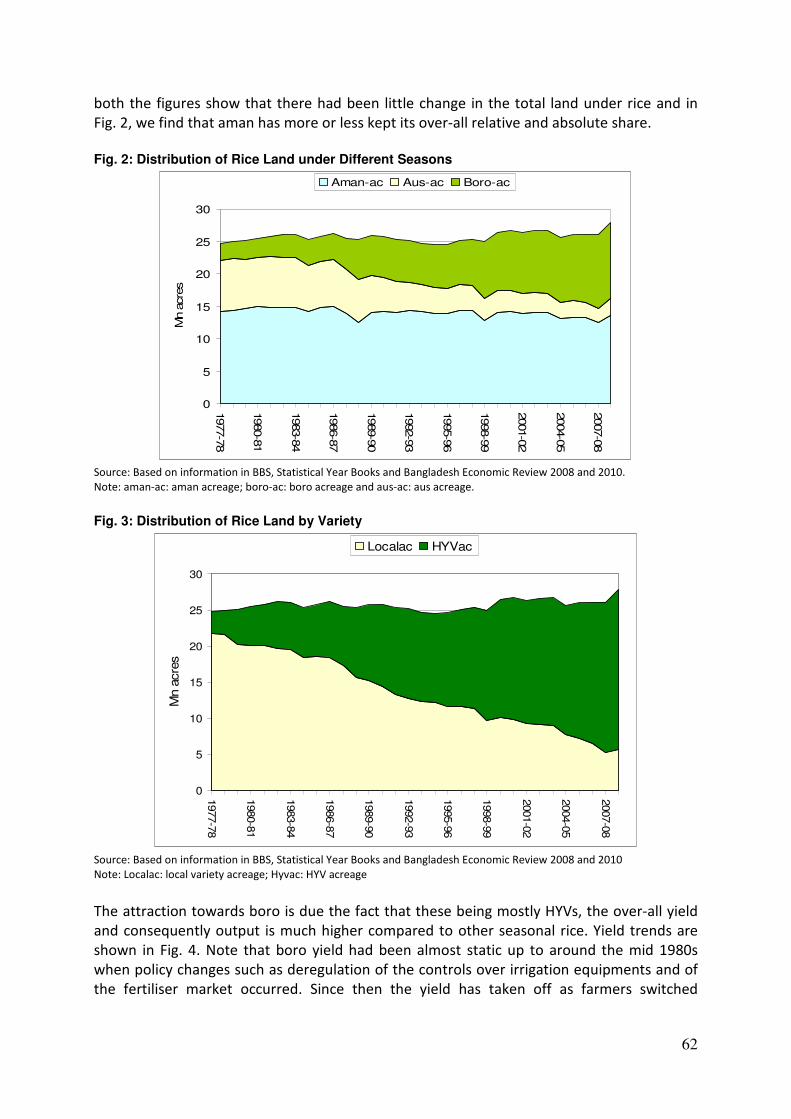
62
both the figures show that there had been little change in the total land under rice and in
Fig. 2, we find that aman has more or less kept its over-all relative and absolute share.
Fig. 2: Distribution of Rice Land under Different Seasons
0
5
10
15
20
25
30
1977-7
8
1980-8
1
1983-8
4
1986-8
7
1989-9
0
1992-9
3
1995-9
6
1998-9
9
2001-0
2
2004-0
5
2007-0
8
Mn a
cre
sAman-ac Aus-ac Boro-ac
Source: Based on information in BBS, Statistical Year Books and Bangladesh Economic Review 2008 and 2010.
Note: aman-ac: aman acreage; boro-ac: boro acreage and aus-ac: aus acreage.
Fig. 3: Distribution of Rice Land by Variety
0
5
10
15
20
25
301977-7
8
1980-8
1
1983-8
4
1986-8
7
1989-9
0
1992-9
3
1995-9
6
1998-9
9
2001-0
2
2004-0
5
2007-0
8M
n a
cre
s
Localac HYVac
Source: Based on information in BBS, Statistical Year Books and Bangladesh Economic Review 2008 and 2010
Note: Localac: local variety acreage; Hyvac: HYV acreage
The attraction towards boro is due the fact that these being mostly HYVs, the over-all yield
and consequently output is much higher compared to other seasonal rice. Yield trends are
shown in Fig. 4. Note that boro yield had been almost static up to around the mid 1980s
when policy changes such as deregulation of the controls over irrigation equipments and of
the fertiliser market occurred. Since then the yield has taken off as farmers switched
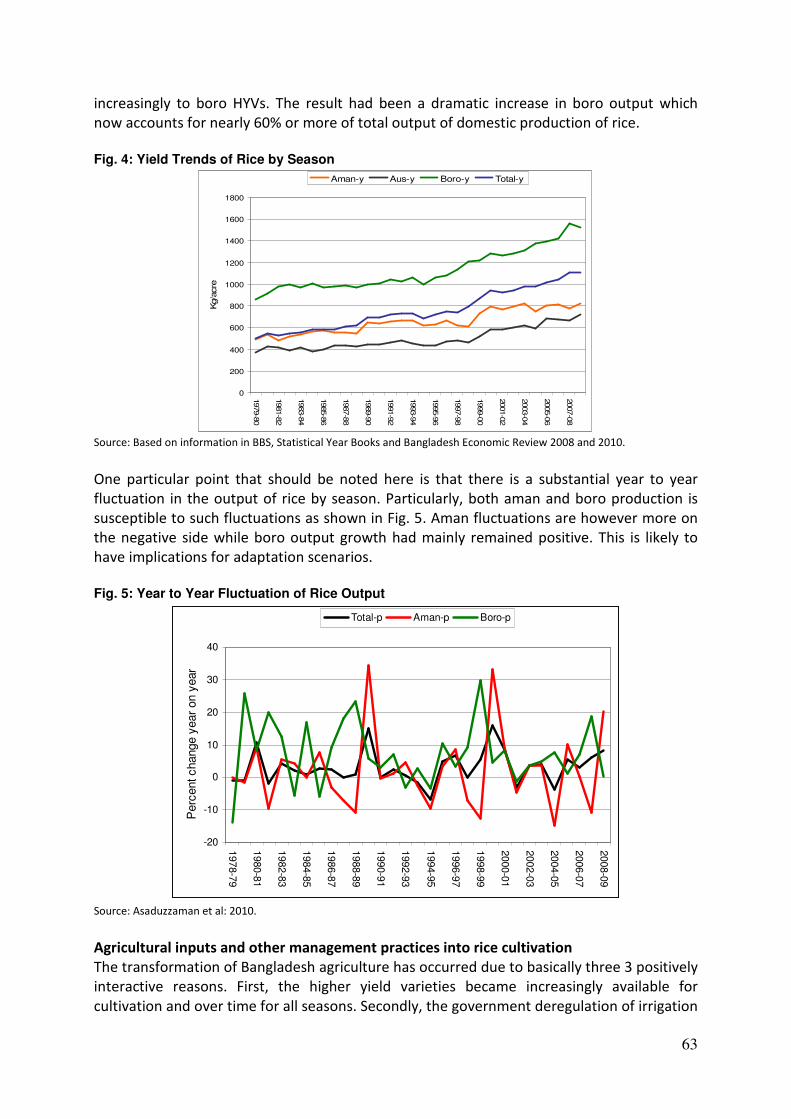
63
increasingly to boro HYVs. The result had been a dramatic increase in boro output which
now accounts for nearly 60% or more of total output of domestic production of rice.
Fig. 4: Yield Trends of Rice by Season
0
200
400
600
800
1000
1200
1400
1600
1800
1979-8
0
1981-8
2
1983-8
4
1985-8
6
1987-8
8
1989-9
0
1991-9
2
1993-9
4
1995-9
6
1997-9
8
1999-0
0
2001-0
2
2003-0
4
2005-0
6
2007-0
8Kg/a
cre
Aman-y Aus-y Boro-y Total-y
Source: Based on information in BBS, Statistical Year Books and Bangladesh Economic Review 2008 and 2010.
One particular point that should be noted here is that there is a substantial year to year
fluctuation in the output of rice by season. Particularly, both aman and boro production is
susceptible to such fluctuations as shown in Fig. 5. Aman fluctuations are however more on
the negative side while boro output growth had mainly remained positive. This is likely to
have implications for adaptation scenarios.
Fig. 5: Year to Year Fluctuation of Rice Output
-20
-10
0
10
20
30
40
1978-7
9
1980-8
1
1982-8
3
1984-8
5
1986-8
7
1988-8
9
1990-9
1
1992-9
3
1994-9
5
1996-9
7
1998-9
9
2000-0
1
2002-0
3
2004-0
5
2006-0
7
2008-0
9P
erc
ent change y
ear
on y
ear
Total-p Aman-p Boro-p
Source: Asaduzzaman et al: 2010.
Agricultural inputs and other management practices into rice cultivation
The transformation of Bangladesh agriculture has occurred due to basically three 3 positively
interactive reasons. First, the higher yield varieties became increasingly available for
cultivation and over time for all seasons. Secondly, the government deregulation of irrigation
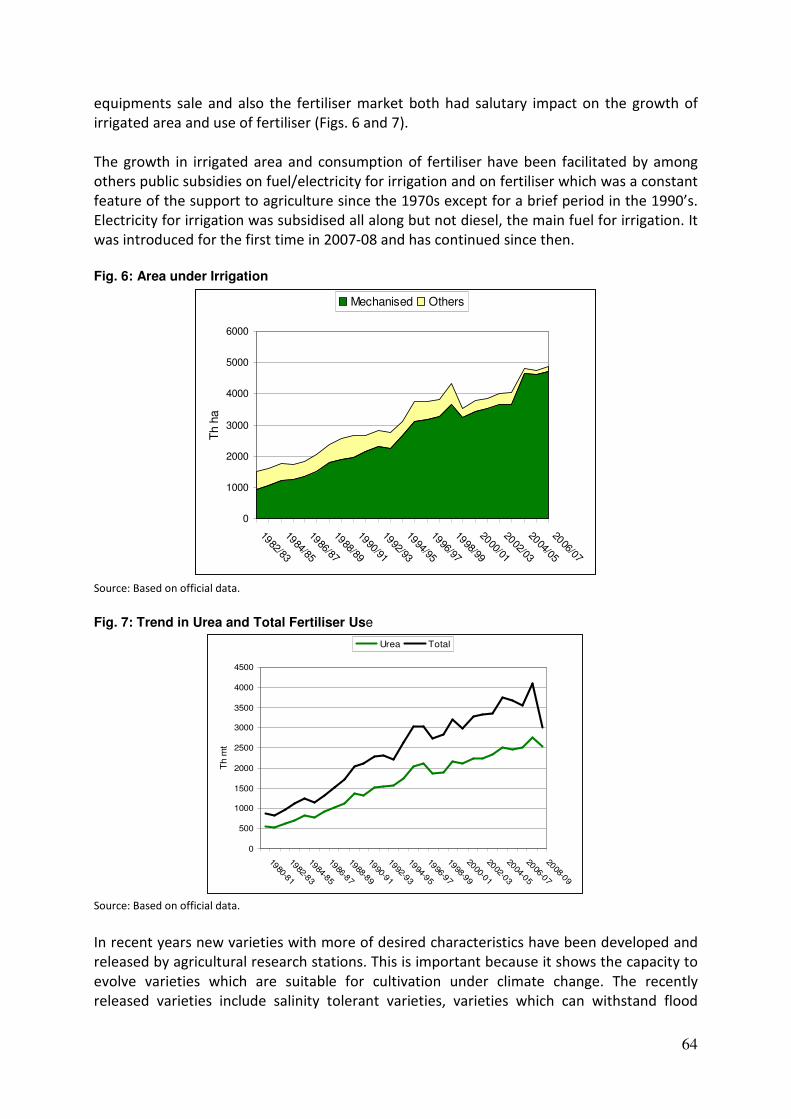
64
equipments sale and also the fertiliser market both had salutary impact on the growth of
irrigated area and use of fertiliser (Figs. 6 and 7).
The growth in irrigated area and consumption of fertiliser have been facilitated by among
others public subsidies on fuel/electricity for irrigation and on fertiliser which was a constant
feature of the support to agriculture since the 1970s except for a brief period in the 1990’s.
Electricity for irrigation was subsidised all along but not diesel, the main fuel for irrigation. It
was introduced for the first time in 2007-08 and has continued since then.
Fig. 6: Area under Irrigation
0
1000
2000
3000
4000
5000
6000
1982/83
1984/85
1986/87
1988/89
1990/91
1992/93
1994/95
1996/97
1998/99
2000/01
2002/03
2004/05
2006/07
Th h
a
Mechanised Others
Source: Based on official data.
Fig. 7: Trend in Urea and Total Fertiliser Use
0
500
1000
1500
2000
2500
3000
3500
4000
4500
1980-81
1982-83
1984-85
1986-87
1988-89
1990-91
1992-93
1994-95
1996-97
1998-99
2000-01
2002-03
2004-05
2006-07
2008-09
Th m
t
Urea Total
Source: Based on official data.
In recent years new varieties with more of desired characteristics have been developed and
released by agricultural research stations. This is important because it shows the capacity to
evolve varieties which are suitable for cultivation under climate change. The recently
released varieties include salinity tolerant varieties, varieties which can withstand flood
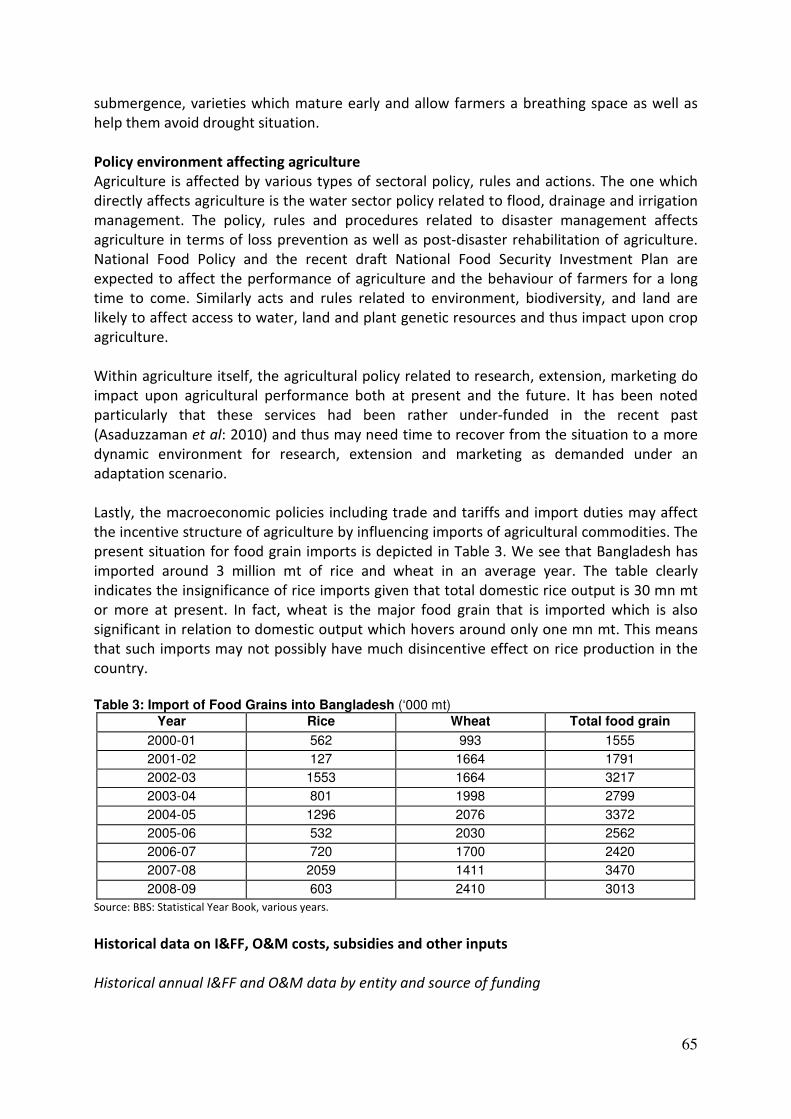
65
submergence, varieties which mature early and allow farmers a breathing space as well as
help them avoid drought situation.
Policy environment affecting agriculture
Agriculture is affected by various types of sectoral policy, rules and actions. The one which
directly affects agriculture is the water sector policy related to flood, drainage and irrigation
management. The policy, rules and procedures related to disaster management affects
agriculture in terms of loss prevention as well as post-disaster rehabilitation of agriculture.
National Food Policy and the recent draft National Food Security Investment Plan are
expected to affect the performance of agriculture and the behaviour of farmers for a long
time to come. Similarly acts and rules related to environment, biodiversity, and land are
likely to affect access to water, land and plant genetic resources and thus impact upon crop
agriculture.
Within agriculture itself, the agricultural policy related to research, extension, marketing do
impact upon agricultural performance both at present and the future. It has been noted
particularly that these services had been rather under-funded in the recent past
(Asaduzzaman et al: 2010) and thus may need time to recover from the situation to a more
dynamic environment for research, extension and marketing as demanded under an
adaptation scenario.
Lastly, the macroeconomic policies including trade and tariffs and import duties may affect
the incentive structure of agriculture by influencing imports of agricultural commodities. The
present situation for food grain imports is depicted in Table 3. We see that Bangladesh has
imported around 3 million mt of rice and wheat in an average year. The table clearly
indicates the insignificance of rice imports given that total domestic rice output is 30 mn mt
or more at present. In fact, wheat is the major food grain that is imported which is also
significant in relation to domestic output which hovers around only one mn mt. This means
that such imports may not possibly have much disincentive effect on rice production in the
country.
Table 3: Import of Food Grains into Bangladesh (‘000 mt)
Year Rice Wheat Total food grain
2000-01 562 993 1555
2001-02 127 1664 1791
2002-03 1553 1664 3217
2003-04 801 1998 2799
2004-05 1296 2076 3372
2005-06 532 2030 2562
2006-07 720 1700 2420
2007-08 2059 1411 3470
2008-09 603 2410 3013
Source: BBS: Statistical Year Book, various years.
Historical data on I&FF, O&M costs, subsidies and other inputs
Historical annual I&FF and O&M data by entity and source of funding
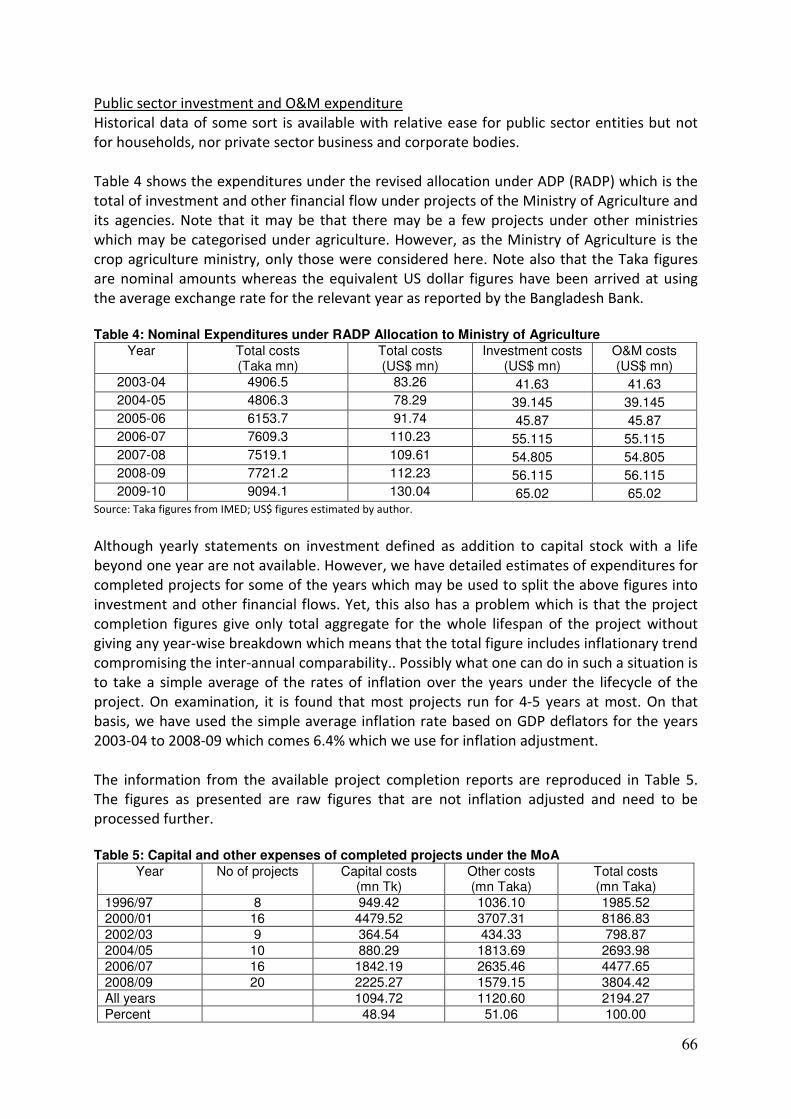
66
Public sector investment and O&M expenditure
Historical data of some sort is available with relative ease for public sector entities but not
for households, nor private sector business and corporate bodies.
Table 4 shows the expenditures under the revised allocation under ADP (RADP) which is the
total of investment and other financial flow under projects of the Ministry of Agriculture and
its agencies. Note that it may be that there may be a few projects under other ministries
which may be categorised under agriculture. However, as the Ministry of Agriculture is the
crop agriculture ministry, only those were considered here. Note also that the Taka figures
are nominal amounts whereas the equivalent US dollar figures have been arrived at using
the average exchange rate for the relevant year as reported by the Bangladesh Bank.
Table 4: Nominal Expenditures under RADP Allocation to Ministry of Agriculture
Year Total costs (Taka mn)
Total costs (US$ mn)
Investment costs (US$ mn)
O&M costs (US$ mn)
2003-04 4906.5 83.26 41.63 41.63 2004-05 4806.3 78.29 39.145 39.145 2005-06 6153.7 91.74 45.87 45.87 2006-07 7609.3 110.23 55.115 55.115 2007-08 7519.1 109.61 54.805 54.805 2008-09 7721.2 112.23 56.115 56.115 2009-10 9094.1 130.04 65.02 65.02
Source: Taka figures from IMED; US$ figures estimated by author.
Although yearly statements on investment defined as addition to capital stock with a life
beyond one year are not available. However, we have detailed estimates of expenditures for
completed projects for some of the years which may be used to split the above figures into
investment and other financial flows. Yet, this also has a problem which is that the project
completion figures give only total aggregate for the whole lifespan of the project without
giving any year-wise breakdown which means that the total figure includes inflationary trend
compromising the inter-annual comparability.. Possibly what one can do in such a situation is
to take a simple average of the rates of inflation over the years under the lifecycle of the
project. On examination, it is found that most projects run for 4-5 years at most. On that
basis, we have used the simple average inflation rate based on GDP deflators for the years
2003-04 to 2008-09 which comes 6.4% which we use for inflation adjustment.
The information from the available project completion reports are reproduced in Table 5.
The figures as presented are raw figures that are not inflation adjusted and need to be
processed further.
Table 5: Capital and other expenses of completed projects under the MoA
Year No of projects Capital costs (mn Tk)
Other costs (mn Taka)
Total costs (mn Taka)
1996/97 8 949.42 1036.10 1985.52 2000/01 16 4479.52 3707.31 8186.83 2002/03 9 364.54 434.33 798.87 2004/05 10 880.29 1813.69 2693.98 2006/07 16 1842.19 2635.46 4477.65 2008/09 20 2225.27 1579.15 3804.42 All years 1094.72 1120.60 2194.27 Percent 48.94 51.06 100.00
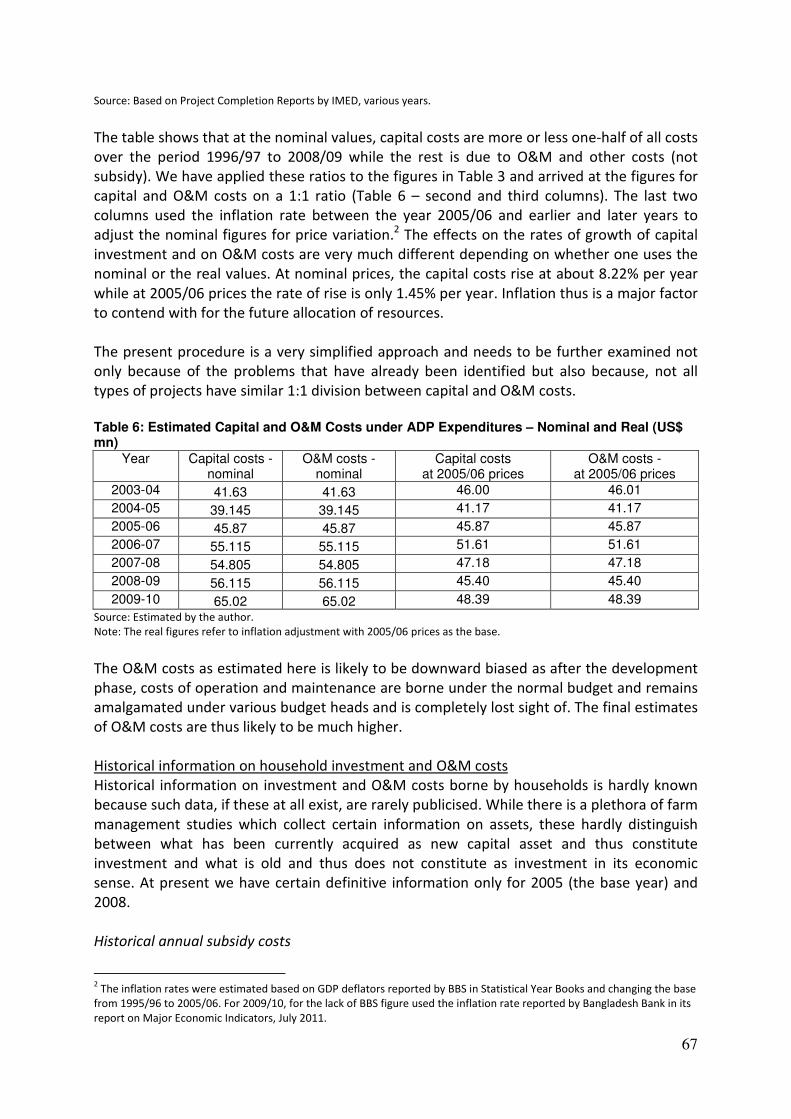
67
Source: Based on Project Completion Reports by IMED, various years.
The table shows that at the nominal values, capital costs are more or less one-half of all costs
over the period 1996/97 to 2008/09 while the rest is due to O&M and other costs (not
subsidy). We have applied these ratios to the figures in Table 3 and arrived at the figures for
capital and O&M costs on a 1:1 ratio (Table 6 – second and third columns). The last two
columns used the inflation rate between the year 2005/06 and earlier and later years to
adjust the nominal figures for price variation.2 The effects on the rates of growth of capital
investment and on O&M costs are very much different depending on whether one uses the
nominal or the real values. At nominal prices, the capital costs rise at about 8.22% per year
while at 2005/06 prices the rate of rise is only 1.45% per year. Inflation thus is a major factor
to contend with for the future allocation of resources.
The present procedure is a very simplified approach and needs to be further examined not
only because of the problems that have already been identified but also because, not all
types of projects have similar 1:1 division between capital and O&M costs.
Table 6: Estimated Capital and O&M Costs under ADP Expenditures – Nominal and Real (US$ mn)
Year Capital costs - nominal
O&M costs - nominal
Capital costs at 2005/06 prices
O&M costs - at 2005/06 prices
2003-04 41.63 41.63 46.00 46.01
2004-05 39.145 39.145 41.17 41.17
2005-06 45.87 45.87 45.87 45.87
2006-07 55.115 55.115 51.61 51.61
2007-08 54.805 54.805 47.18 47.18
2008-09 56.115 56.115 45.40 45.40
2009-10 65.02 65.02 48.39 48.39
Source: Estimated by the author.
Note: The real figures refer to inflation adjustment with 2005/06 prices as the base.
The O&M costs as estimated here is likely to be downward biased as after the development
phase, costs of operation and maintenance are borne under the normal budget and remains
amalgamated under various budget heads and is completely lost sight of. The final estimates
of O&M costs are thus likely to be much higher.
Historical information on household investment and O&M costs
Historical information on investment and O&M costs borne by households is hardly known
because such data, if these at all exist, are rarely publicised. While there is a plethora of farm
management studies which collect certain information on assets, these hardly distinguish
between what has been currently acquired as new capital asset and thus constitute
investment and what is old and thus does not constitute as investment in its economic
sense. At present we have certain definitive information only for 2005 (the base year) and
2008.
Historical annual subsidy costs
2 The inflation rates were estimated based on GDP deflators reported by BBS in Statistical Year Books and changing the base
from 1995/96 to 2005/06. For 2009/10, for the lack of BBS figure used the inflation rate reported by Bangladesh Bank in its
report on Major Economic Indicators, July 2011.
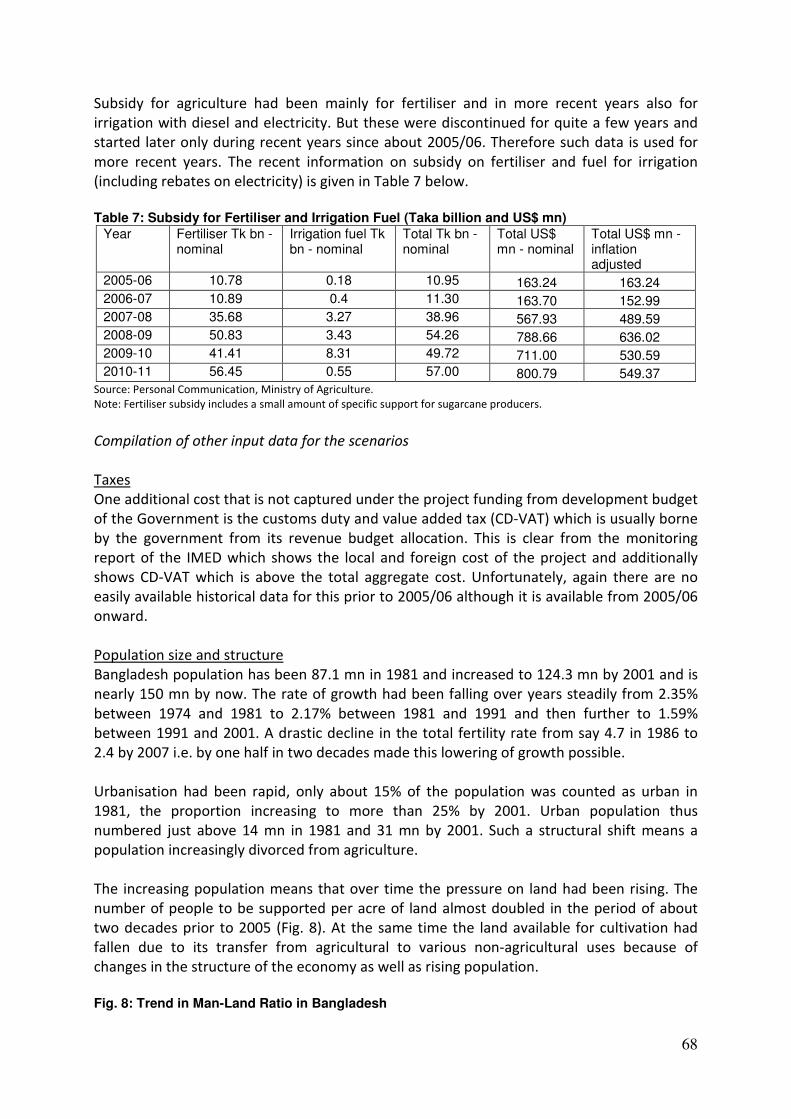
68
Subsidy for agriculture had been mainly for fertiliser and in more recent years also for
irrigation with diesel and electricity. But these were discontinued for quite a few years and
started later only during recent years since about 2005/06. Therefore such data is used for
more recent years. The recent information on subsidy on fertiliser and fuel for irrigation
(including rebates on electricity) is given in Table 7 below.
Table 7: Subsidy for Fertiliser and Irrigation Fuel (Taka billion and US$ mn)
Year Fertiliser Tk bn - nominal
Irrigation fuel Tk bn - nominal
Total Tk bn - nominal
Total US$ mn - nominal
Total US$ mn - inflation adjusted
2005-06 10.78 0.18 10.95 163.24 163.24 2006-07 10.89 0.4 11.30 163.70 152.99 2007-08 35.68 3.27 38.96 567.93 489.59 2008-09 50.83 3.43 54.26 788.66 636.02 2009-10 41.41 8.31 49.72 711.00 530.59 2010-11 56.45 0.55 57.00 800.79 549.37
Source: Personal Communication, Ministry of Agriculture.
Note: Fertiliser subsidy includes a small amount of specific support for sugarcane producers.
Compilation of other input data for the scenarios
Taxes
One additional cost that is not captured under the project funding from development budget
of the Government is the customs duty and value added tax (CD-VAT) which is usually borne
by the government from its revenue budget allocation. This is clear from the monitoring
report of the IMED which shows the local and foreign cost of the project and additionally
shows CD-VAT which is above the total aggregate cost. Unfortunately, again there are no
easily available historical data for this prior to 2005/06 although it is available from 2005/06
onward.
Population size and structure
Bangladesh population has been 87.1 mn in 1981 and increased to 124.3 mn by 2001 and is
nearly 150 mn by now. The rate of growth had been falling over years steadily from 2.35%
between 1974 and 1981 to 2.17% between 1981 and 1991 and then further to 1.59%
between 1991 and 2001. A drastic decline in the total fertility rate from say 4.7 in 1986 to
2.4 by 2007 i.e. by one half in two decades made this lowering of growth possible.
Urbanisation had been rapid, only about 15% of the population was counted as urban in
1981, the proportion increasing to more than 25% by 2001. Urban population thus
numbered just above 14 mn in 1981 and 31 mn by 2001. Such a structural shift means a
population increasingly divorced from agriculture.
The increasing population means that over time the pressure on land had been rising. The
number of people to be supported per acre of land almost doubled in the period of about
two decades prior to 2005 (Fig. 8). At the same time the land available for cultivation had
fallen due to its transfer from agricultural to various non-agricultural uses because of
changes in the structure of the economy as well as rising population.
Fig. 8: Trend in Man-Land Ratio in Bangladesh
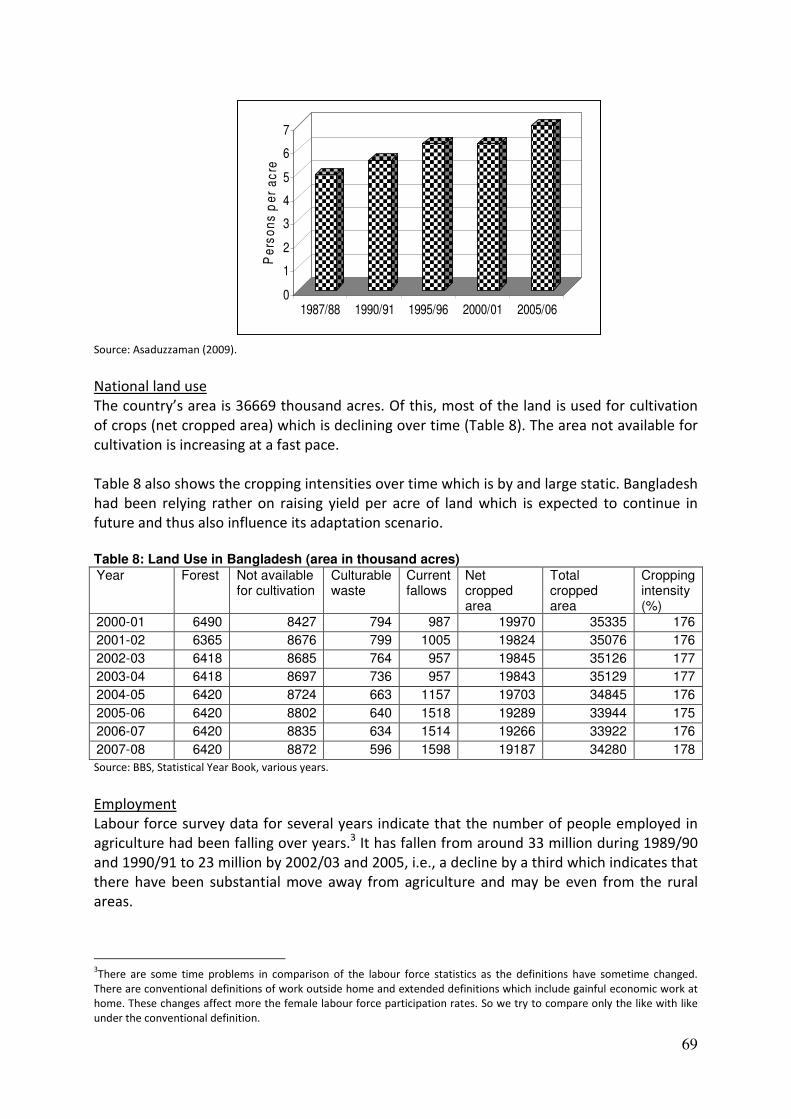
69
0
1
2
3
4
5
6
7
Pe
rso
ns
pe
r a
cre
1987/88 1990/91 1995/96 2000/01 2005/06
Source: Asaduzzaman (2009).
National land use
The country’s area is 36669 thousand acres. Of this, most of the land is used for cultivation
of crops (net cropped area) which is declining over time (Table 8). The area not available for
cultivation is increasing at a fast pace.
Table 8 also shows the cropping intensities over time which is by and large static. Bangladesh
had been relying rather on raising yield per acre of land which is expected to continue in
future and thus also influence its adaptation scenario.
Table 8: Land Use in Bangladesh (area in thousand acres) Year Forest Not available
for cultivation Culturable waste
Current fallows
Net cropped area
Total cropped area
Cropping intensity (%)
2000-01 6490 8427 794 987 19970 35335 176
2001-02 6365 8676 799 1005 19824 35076 176
2002-03 6418 8685 764 957 19845 35126 177
2003-04 6418 8697 736 957 19843 35129 177
2004-05 6420 8724 663 1157 19703 34845 176
2005-06 6420 8802 640 1518 19289 33944 175
2006-07 6420 8835 634 1514 19266 33922 176
2007-08 6420 8872 596 1598 19187 34280 178
Source: BBS, Statistical Year Book, various years.
Employment
Labour force survey data for several years indicate that the number of people employed in
agriculture had been falling over years.3 It has fallen from around 33 million during 1989/90
and 1990/91 to 23 million by 2002/03 and 2005, i.e., a decline by a third which indicates that
there have been substantial move away from agriculture and may be even from the rural
areas.
3There are some time problems in comparison of the labour force statistics as the definitions have sometime changed.
There are conventional definitions of work outside home and extended definitions which include gainful economic work at
home. These changes affect more the female labour force participation rates. So we try to compare only the like with like
under the conventional definition.
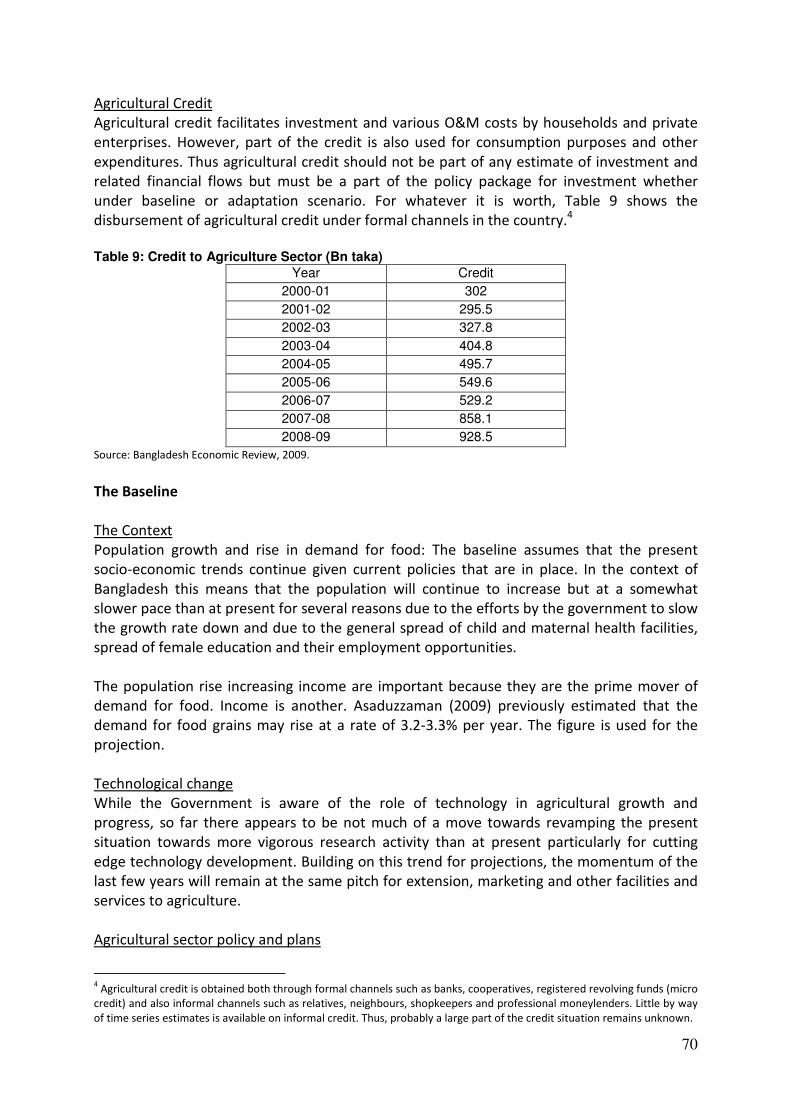
70
Agricultural Credit
Agricultural credit facilitates investment and various O&M costs by households and private
enterprises. However, part of the credit is also used for consumption purposes and other
expenditures. Thus agricultural credit should not be part of any estimate of investment and
related financial flows but must be a part of the policy package for investment whether
under baseline or adaptation scenario. For whatever it is worth, Table 9 shows the
disbursement of agricultural credit under formal channels in the country.4
Table 9: Credit to Agriculture Sector (Bn taka)
Year Credit
2000-01 302
2001-02 295.5
2002-03 327.8
2003-04 404.8
2004-05 495.7
2005-06 549.6
2006-07 529.2
2007-08 858.1
2008-09 928.5
Source: Bangladesh Economic Review, 2009.
The Baseline
The Context
Population growth and rise in demand for food: The baseline assumes that the present
socio-economic trends continue given current policies that are in place. In the context of
Bangladesh this means that the population will continue to increase but at a somewhat
slower pace than at present for several reasons due to the efforts by the government to slow
the growth rate down and due to the general spread of child and maternal health facilities,
spread of female education and their employment opportunities.
The population rise increasing income are important because they are the prime mover of
demand for food. Income is another. Asaduzzaman (2009) previously estimated that the
demand for food grains may rise at a rate of 3.2-3.3% per year. The figure is used for the
projection.
Technological change
While the Government is aware of the role of technology in agricultural growth and
progress, so far there appears to be not much of a move towards revamping the present
situation towards more vigorous research activity than at present particularly for cutting
edge technology development. Building on this trend for projections, the momentum of the
last few years will remain at the same pitch for extension, marketing and other facilities and
services to agriculture.
Agricultural sector policy and plans
4 Agricultural credit is obtained both through formal channels such as banks, cooperatives, registered revolving funds (micro
credit) and also informal channels such as relatives, neighbours, shopkeepers and professional moneylenders. Little by way
of time series estimates is available on informal credit. Thus, probably a large part of the credit situation remains unknown.
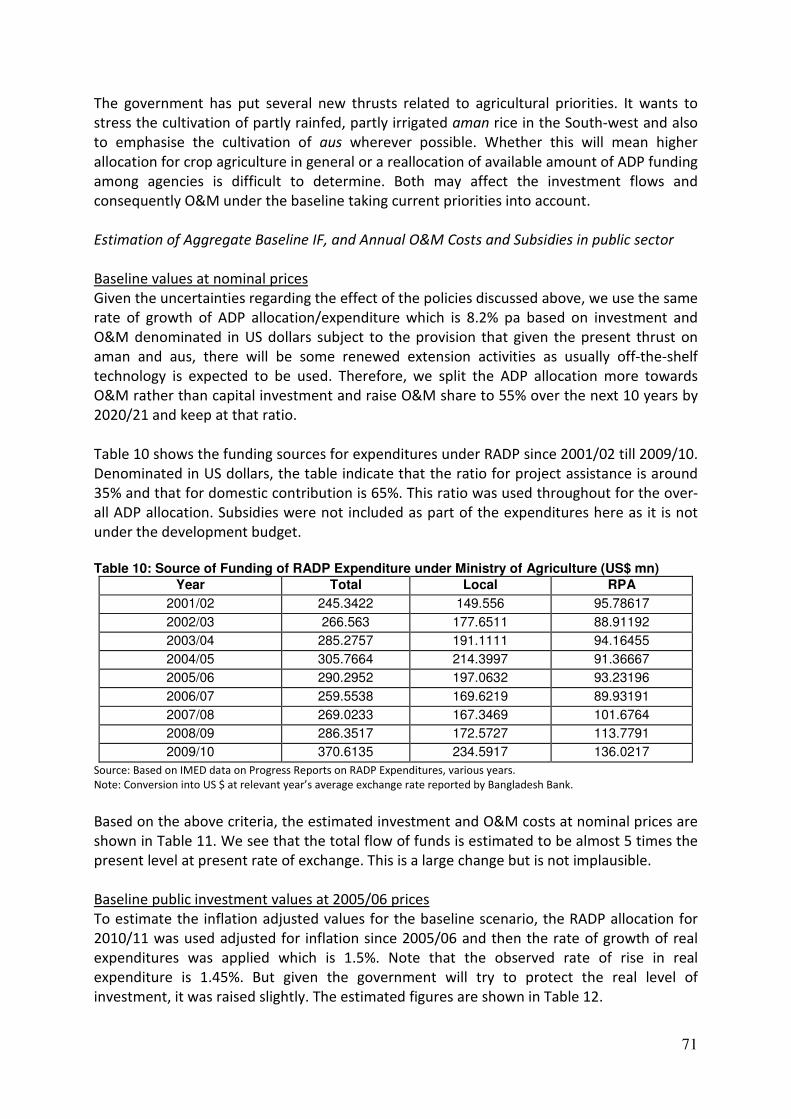
71
The government has put several new thrusts related to agricultural priorities. It wants to
stress the cultivation of partly rainfed, partly irrigated aman rice in the South-west and also
to emphasise the cultivation of aus wherever possible. Whether this will mean higher
allocation for crop agriculture in general or a reallocation of available amount of ADP funding
among agencies is difficult to determine. Both may affect the investment flows and
consequently O&M under the baseline taking current priorities into account.
Estimation of Aggregate Baseline IF, and Annual O&M Costs and Subsidies in public sector
Baseline values at nominal prices
Given the uncertainties regarding the effect of the policies discussed above, we use the same
rate of growth of ADP allocation/expenditure which is 8.2% pa based on investment and
O&M denominated in US dollars subject to the provision that given the present thrust on
aman and aus, there will be some renewed extension activities as usually off-the-shelf
technology is expected to be used. Therefore, we split the ADP allocation more towards
O&M rather than capital investment and raise O&M share to 55% over the next 10 years by
2020/21 and keep at that ratio.
Table 10 shows the funding sources for expenditures under RADP since 2001/02 till 2009/10.
Denominated in US dollars, the table indicate that the ratio for project assistance is around
35% and that for domestic contribution is 65%. This ratio was used throughout for the over-
all ADP allocation. Subsidies were not included as part of the expenditures here as it is not
under the development budget.
Table 10: Source of Funding of RADP Expenditure under Ministry of Agriculture (US$ mn)
Year Total Local RPA
2001/02 245.3422 149.556 95.78617
2002/03 266.563 177.6511 88.91192
2003/04 285.2757 191.1111 94.16455
2004/05 305.7664 214.3997 91.36667
2005/06 290.2952 197.0632 93.23196
2006/07 259.5538 169.6219 89.93191
2007/08 269.0233 167.3469 101.6764
2008/09 286.3517 172.5727 113.7791
2009/10 370.6135 234.5917 136.0217
Source: Based on IMED data on Progress Reports on RADP Expenditures, various years.
Note: Conversion into US $ at relevant year’s average exchange rate reported by Bangladesh Bank.
Based on the above criteria, the estimated investment and O&M costs at nominal prices are
shown in Table 11. We see that the total flow of funds is estimated to be almost 5 times the
present level at present rate of exchange. This is a large change but is not implausible.
Baseline public investment values at 2005/06 prices
To estimate the inflation adjusted values for the baseline scenario, the RADP allocation for
2010/11 was used adjusted for inflation since 2005/06 and then the rate of growth of real
expenditures was applied which is 1.5%. Note that the observed rate of rise in real
expenditure is 1.45%. But given the government will try to protect the real level of
investment, it was raised slightly. The estimated figures are shown in Table 12.
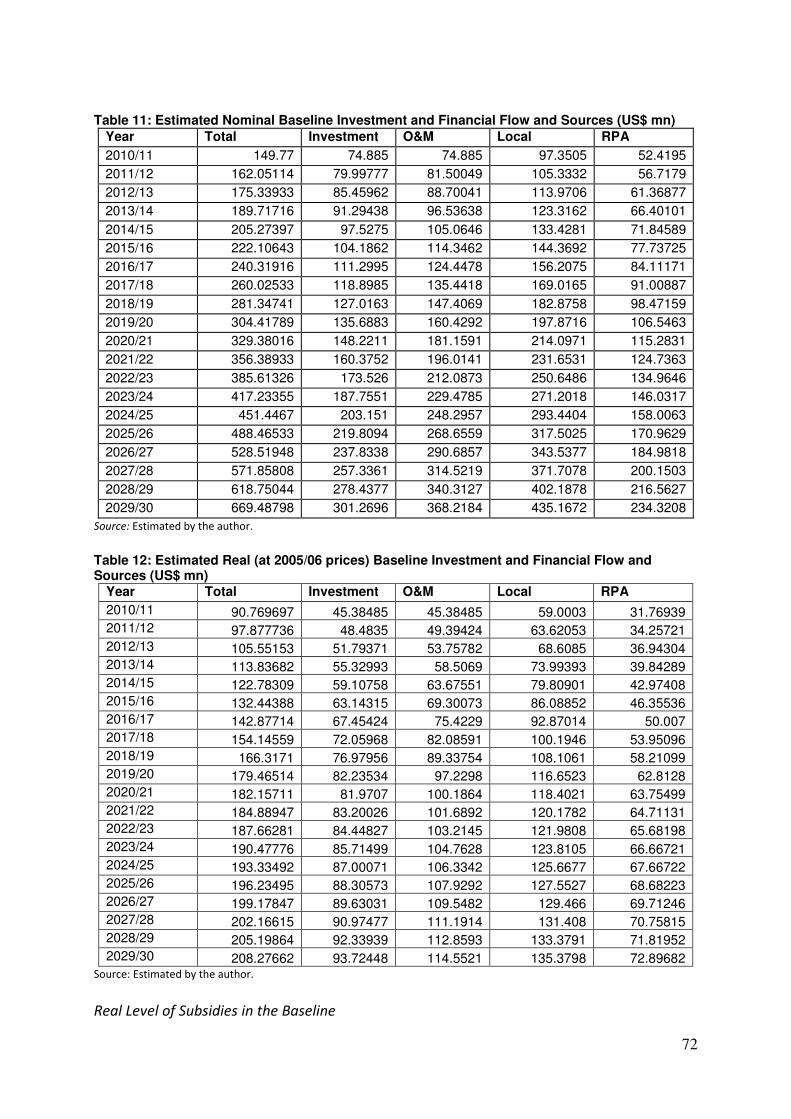
72
Table 11: Estimated Nominal Baseline Investment and Financial Flow and Sources (US$ mn)
Year Total Investment O&M Local RPA
2010/11 149.77 74.885 74.885 97.3505 52.4195
2011/12 162.05114 79.99777 81.50049 105.3332 56.7179
2012/13 175.33933 85.45962 88.70041 113.9706 61.36877
2013/14 189.71716 91.29438 96.53638 123.3162 66.40101
2014/15 205.27397 97.5275 105.0646 133.4281 71.84589
2015/16 222.10643 104.1862 114.3462 144.3692 77.73725
2016/17 240.31916 111.2995 124.4478 156.2075 84.11171
2017/18 260.02533 118.8985 135.4418 169.0165 91.00887
2018/19 281.34741 127.0163 147.4069 182.8758 98.47159
2019/20 304.41789 135.6883 160.4292 197.8716 106.5463
2020/21 329.38016 148.2211 181.1591 214.0971 115.2831
2021/22 356.38933 160.3752 196.0141 231.6531 124.7363
2022/23 385.61326 173.526 212.0873 250.6486 134.9646
2023/24 417.23355 187.7551 229.4785 271.2018 146.0317
2024/25 451.4467 203.151 248.2957 293.4404 158.0063
2025/26 488.46533 219.8094 268.6559 317.5025 170.9629
2026/27 528.51948 237.8338 290.6857 343.5377 184.9818
2027/28 571.85808 257.3361 314.5219 371.7078 200.1503
2028/29 618.75044 278.4377 340.3127 402.1878 216.5627
2029/30 669.48798 301.2696 368.2184 435.1672 234.3208
Source: Estimated by the author.
Table 12: Estimated Real (at 2005/06 prices) Baseline Investment and Financial Flow and Sources (US$ mn)
Year Total Investment O&M Local RPA
2010/11 90.769697 45.38485 45.38485 59.0003 31.76939 2011/12 97.877736 48.4835 49.39424 63.62053 34.25721 2012/13 105.55153 51.79371 53.75782 68.6085 36.94304 2013/14 113.83682 55.32993 58.5069 73.99393 39.84289 2014/15 122.78309 59.10758 63.67551 79.80901 42.97408 2015/16 132.44388 63.14315 69.30073 86.08852 46.35536 2016/17 142.87714 67.45424 75.4229 92.87014 50.007 2017/18 154.14559 72.05968 82.08591 100.1946 53.95096 2018/19 166.3171 76.97956 89.33754 108.1061 58.21099 2019/20 179.46514 82.23534 97.2298 116.6523 62.8128 2020/21 182.15711 81.9707 100.1864 118.4021 63.75499 2021/22 184.88947 83.20026 101.6892 120.1782 64.71131 2022/23 187.66281 84.44827 103.2145 121.9808 65.68198 2023/24 190.47776 85.71499 104.7628 123.8105 66.66721 2024/25 193.33492 87.00071 106.3342 125.6677 67.66722 2025/26 196.23495 88.30573 107.9292 127.5527 68.68223 2026/27 199.17847 89.63031 109.5482 129.466 69.71246 2027/28 202.16615 90.97477 111.1914 131.408 70.75815 2028/29 205.19864 92.33939 112.8593 133.3791 71.81952 2029/30 208.27662 93.72448 114.5521 135.3798 72.89682
Source: Estimated by the author.
Real Level of Subsidies in the Baseline
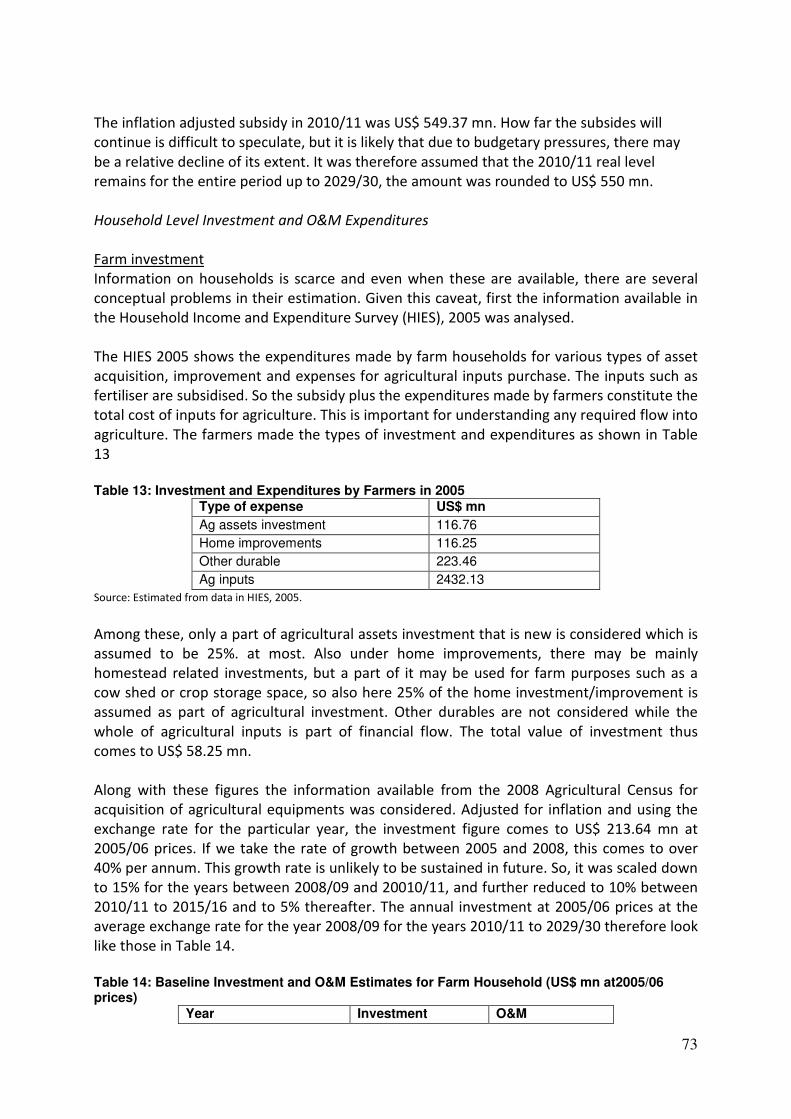
73
The inflation adjusted subsidy in 2010/11 was US$ 549.37 mn. How far the subsides will
continue is difficult to speculate, but it is likely that due to budgetary pressures, there may
be a relative decline of its extent. It was therefore assumed that the 2010/11 real level
remains for the entire period up to 2029/30, the amount was rounded to US$ 550 mn.
Household Level Investment and O&M Expenditures
Farm investment
Information on households is scarce and even when these are available, there are several
conceptual problems in their estimation. Given this caveat, first the information available in
the Household Income and Expenditure Survey (HIES), 2005 was analysed.
The HIES 2005 shows the expenditures made by farm households for various types of asset
acquisition, improvement and expenses for agricultural inputs purchase. The inputs such as
fertiliser are subsidised. So the subsidy plus the expenditures made by farmers constitute the
total cost of inputs for agriculture. This is important for understanding any required flow into
agriculture. The farmers made the types of investment and expenditures as shown in Table
13
Table 13: Investment and Expenditures by Farmers in 2005
Type of expense US$ mn
Ag assets investment 116.76
Home improvements 116.25
Other durable 223.46
Ag inputs 2432.13
Source: Estimated from data in HIES, 2005.
Among these, only a part of agricultural assets investment that is new is considered which is
assumed to be 25%. at most. Also under home improvements, there may be mainly
homestead related investments, but a part of it may be used for farm purposes such as a
cow shed or crop storage space, so also here 25% of the home investment/improvement is
assumed as part of agricultural investment. Other durables are not considered while the
whole of agricultural inputs is part of financial flow. The total value of investment thus
comes to US$ 58.25 mn.
Along with these figures the information available from the 2008 Agricultural Census for
acquisition of agricultural equipments was considered. Adjusted for inflation and using the
exchange rate for the particular year, the investment figure comes to US$ 213.64 mn at
2005/06 prices. If we take the rate of growth between 2005 and 2008, this comes to over
40% per annum. This growth rate is unlikely to be sustained in future. So, it was scaled down
to 15% for the years between 2008/09 and 20010/11, and further reduced to 10% between
2010/11 to 2015/16 and to 5% thereafter. The annual investment at 2005/06 prices at the
average exchange rate for the year 2008/09 for the years 2010/11 to 2029/30 therefore look
like those in Table 14.
Table 14: Baseline Investment and O&M Estimates for Farm Household (US$ mn at2005/06 prices)
Year Investment O&M
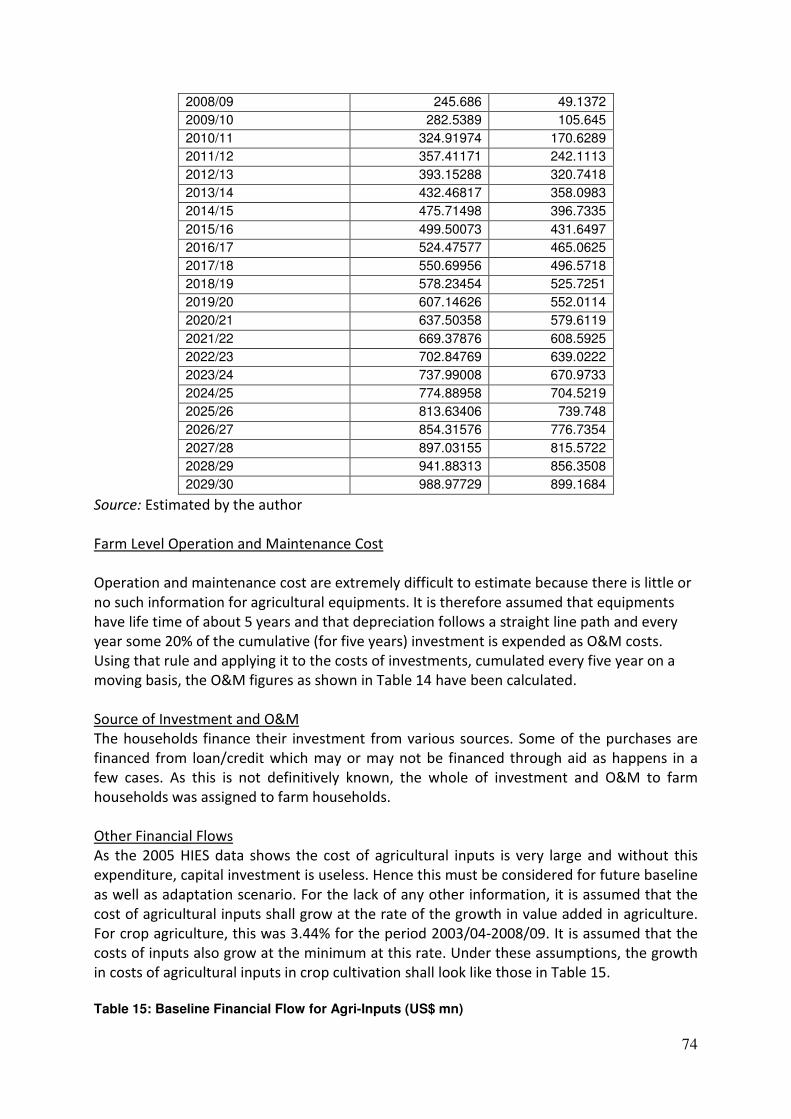
74
2008/09 245.686 49.1372
2009/10 282.5389 105.645
2010/11 324.91974 170.6289
2011/12 357.41171 242.1113
2012/13 393.15288 320.7418
2013/14 432.46817 358.0983
2014/15 475.71498 396.7335
2015/16 499.50073 431.6497
2016/17 524.47577 465.0625
2017/18 550.69956 496.5718
2018/19 578.23454 525.7251
2019/20 607.14626 552.0114
2020/21 637.50358 579.6119
2021/22 669.37876 608.5925
2022/23 702.84769 639.0222
2023/24 737.99008 670.9733
2024/25 774.88958 704.5219
2025/26 813.63406 739.748
2026/27 854.31576 776.7354
2027/28 897.03155 815.5722
2028/29 941.88313 856.3508
2029/30 988.97729 899.1684
Source: Estimated by the author
Farm Level Operation and Maintenance Cost
Operation and maintenance cost are extremely difficult to estimate because there is little or
no such information for agricultural equipments. It is therefore assumed that equipments
have life time of about 5 years and that depreciation follows a straight line path and every
year some 20% of the cumulative (for five years) investment is expended as O&M costs.
Using that rule and applying it to the costs of investments, cumulated every five year on a
moving basis, the O&M figures as shown in Table 14 have been calculated.
Source of Investment and O&M
The households finance their investment from various sources. Some of the purchases are
financed from loan/credit which may or may not be financed through aid as happens in a
few cases. As this is not definitively known, the whole of investment and O&M to farm
households was assigned to farm households.
Other Financial Flows
As the 2005 HIES data shows the cost of agricultural inputs is very large and without this
expenditure, capital investment is useless. Hence this must be considered for future baseline
as well as adaptation scenario. For the lack of any other information, it is assumed that the
cost of agricultural inputs shall grow at the rate of the growth in value added in agriculture.
For crop agriculture, this was 3.44% for the period 2003/04-2008/09. It is assumed that the
costs of inputs also grow at the minimum at this rate. Under these assumptions, the growth
in costs of agricultural inputs in crop cultivation shall look like those in Table 15.
Table 15: Baseline Financial Flow for Agri-Inputs (US$ mn)
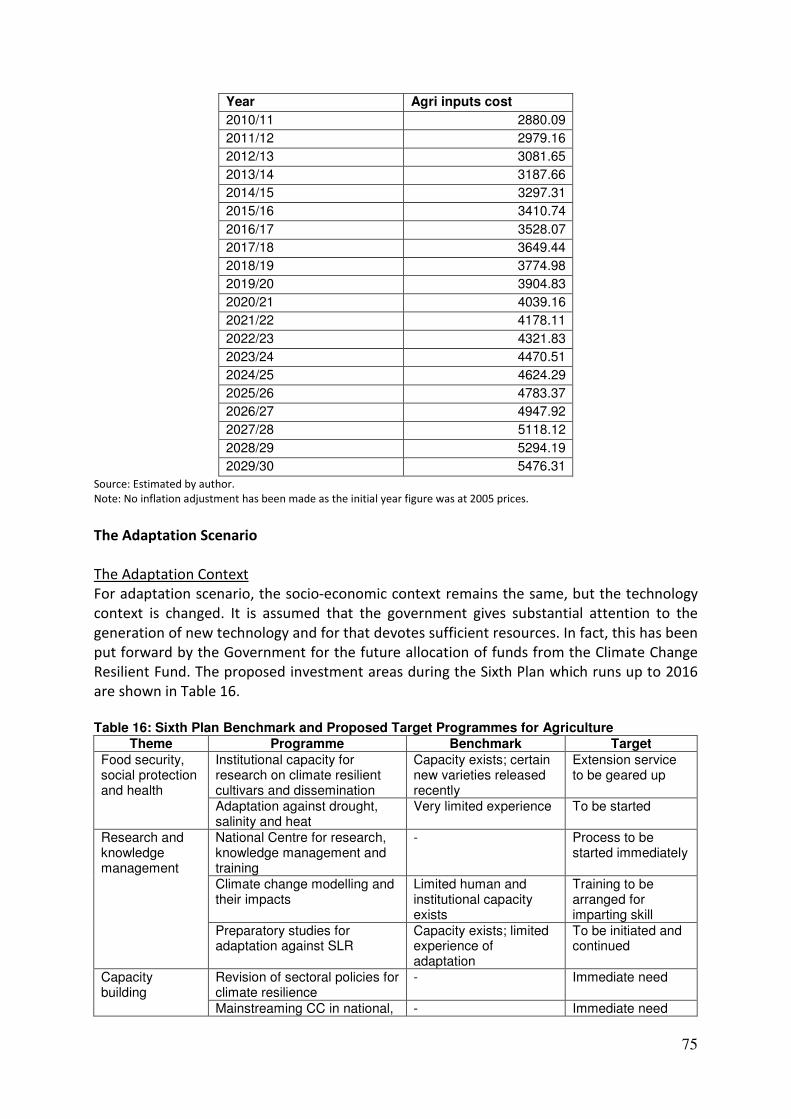
75
Year Agri inputs cost
2010/11 2880.09
2011/12 2979.16
2012/13 3081.65
2013/14 3187.66
2014/15 3297.31
2015/16 3410.74
2016/17 3528.07
2017/18 3649.44
2018/19 3774.98
2019/20 3904.83
2020/21 4039.16
2021/22 4178.11
2022/23 4321.83
2023/24 4470.51
2024/25 4624.29
2025/26 4783.37
2026/27 4947.92
2027/28 5118.12
2028/29 5294.19
2029/30 5476.31
Source: Estimated by author.
Note: No inflation adjustment has been made as the initial year figure was at 2005 prices.
The Adaptation Scenario
The Adaptation Context
For adaptation scenario, the socio-economic context remains the same, but the technology
context is changed. It is assumed that the government gives substantial attention to the
generation of new technology and for that devotes sufficient resources. In fact, this has been
put forward by the Government for the future allocation of funds from the Climate Change
Resilient Fund. The proposed investment areas during the Sixth Plan which runs up to 2016
are shown in Table 16.
Table 16: Sixth Plan Benchmark and Proposed Target Programmes for Agriculture
Theme Programme Benchmark Target Food security, social protection and health
Institutional capacity for research on climate resilient cultivars and dissemination
Capacity exists; certain new varieties released recently
Extension service to be geared up
Adaptation against drought, salinity and heat
Very limited experience To be started
Research and knowledge management
National Centre for research, knowledge management and training
- Process to be started immediately
Climate change modelling and their impacts
Limited human and institutional capacity exists
Training to be arranged for imparting skill
Preparatory studies for adaptation against SLR
Capacity exists; limited experience of adaptation
To be initiated and continued
Capacity building
Revision of sectoral policies for climate resilience
- Immediate need
Mainstreaming CC in national, - Immediate need
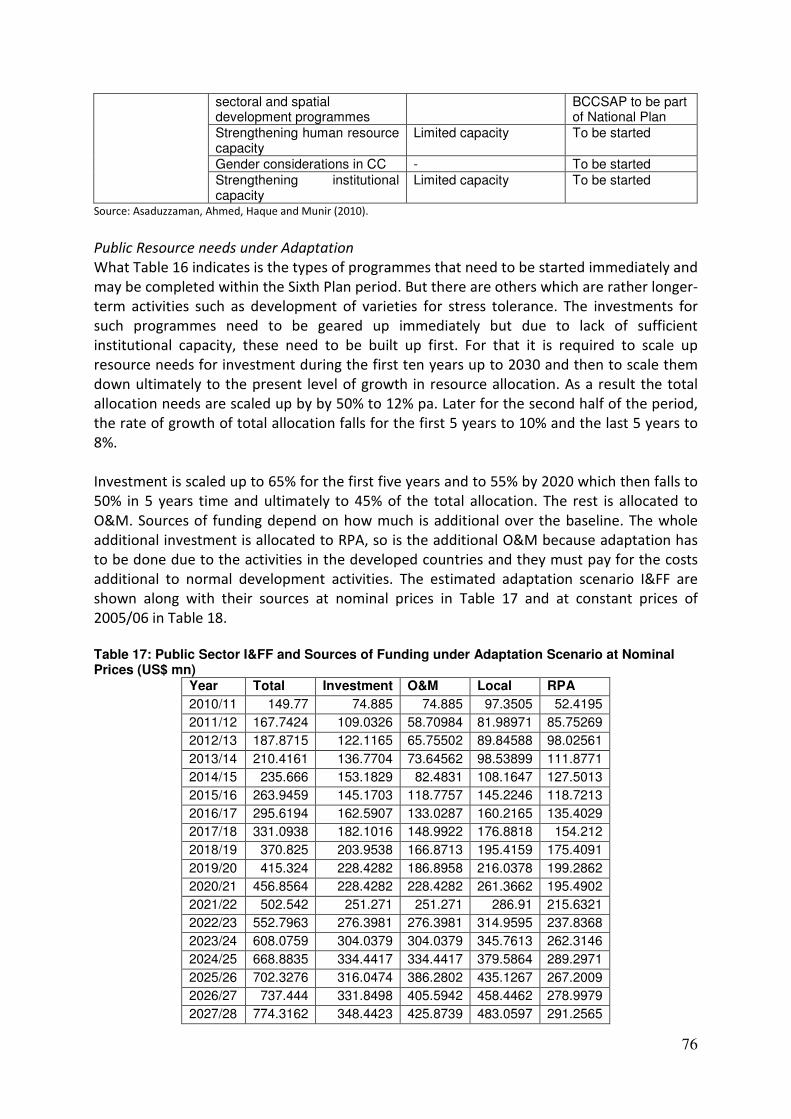
76
sectoral and spatial development programmes
BCCSAP to be part of National Plan
Strengthening human resource capacity
Limited capacity To be started
Gender considerations in CC - To be started Strengthening institutional capacity
Limited capacity To be started
Source: Asaduzzaman, Ahmed, Haque and Munir (2010).
Public Resource needs under Adaptation
What Table 16 indicates is the types of programmes that need to be started immediately and
may be completed within the Sixth Plan period. But there are others which are rather longer-
term activities such as development of varieties for stress tolerance. The investments for
such programmes need to be geared up immediately but due to lack of sufficient
institutional capacity, these need to be built up first. For that it is required to scale up
resource needs for investment during the first ten years up to 2030 and then to scale them
down ultimately to the present level of growth in resource allocation. As a result the total
allocation needs are scaled up by by 50% to 12% pa. Later for the second half of the period,
the rate of growth of total allocation falls for the first 5 years to 10% and the last 5 years to
8%.
Investment is scaled up to 65% for the first five years and to 55% by 2020 which then falls to
50% in 5 years time and ultimately to 45% of the total allocation. The rest is allocated to
O&M. Sources of funding depend on how much is additional over the baseline. The whole
additional investment is allocated to RPA, so is the additional O&M because adaptation has
to be done due to the activities in the developed countries and they must pay for the costs
additional to normal development activities. The estimated adaptation scenario I&FF are
shown along with their sources at nominal prices in Table 17 and at constant prices of
2005/06 in Table 18.
Table 17: Public Sector I&FF and Sources of Funding under Adaptation Scenario at Nominal Prices (US$ mn)
Year Total Investment O&M Local RPA
2010/11 149.77 74.885 74.885 97.3505 52.4195
2011/12 167.7424 109.0326 58.70984 81.98971 85.75269
2012/13 187.8715 122.1165 65.75502 89.84588 98.02561
2013/14 210.4161 136.7704 73.64562 98.53899 111.8771
2014/15 235.666 153.1829 82.4831 108.1647 127.5013
2015/16 263.9459 145.1703 118.7757 145.2246 118.7213
2016/17 295.6194 162.5907 133.0287 160.2165 135.4029
2017/18 331.0938 182.1016 148.9922 176.8818 154.212
2018/19 370.825 203.9538 166.8713 195.4159 175.4091
2019/20 415.324 228.4282 186.8958 216.0378 199.2862
2020/21 456.8564 228.4282 228.4282 261.3662 195.4902
2021/22 502.542 251.271 251.271 286.91 215.6321
2022/23 552.7963 276.3981 276.3981 314.9595 237.8368
2023/24 608.0759 304.0379 304.0379 345.7613 262.3146
2024/25 668.8835 334.4417 334.4417 379.5864 289.2971
2025/26 702.3276 316.0474 386.2802 435.1267 267.2009
2026/27 737.444 331.8498 405.5942 458.4462 278.9979
2027/28 774.3162 348.4423 425.8739 483.0597 291.2565
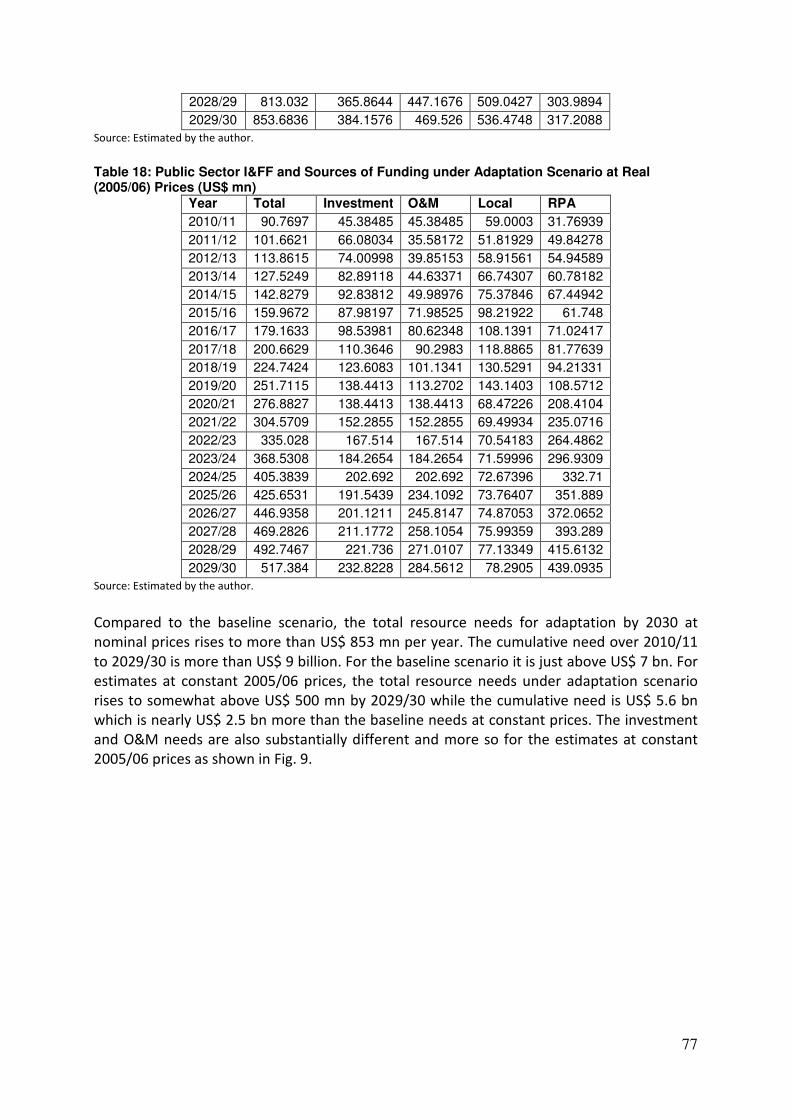
77
2028/29 813.032 365.8644 447.1676 509.0427 303.9894
2029/30 853.6836 384.1576 469.526 536.4748 317.2088
Source: Estimated by the author.
Table 18: Public Sector I&FF and Sources of Funding under Adaptation Scenario at Real (2005/06) Prices (US$ mn)
Year Total Investment O&M Local RPA
2010/11 90.7697 45.38485 45.38485 59.0003 31.76939
2011/12 101.6621 66.08034 35.58172 51.81929 49.84278
2012/13 113.8615 74.00998 39.85153 58.91561 54.94589
2013/14 127.5249 82.89118 44.63371 66.74307 60.78182
2014/15 142.8279 92.83812 49.98976 75.37846 67.44942
2015/16 159.9672 87.98197 71.98525 98.21922 61.748
2016/17 179.1633 98.53981 80.62348 108.1391 71.02417
2017/18 200.6629 110.3646 90.2983 118.8865 81.77639
2018/19 224.7424 123.6083 101.1341 130.5291 94.21331
2019/20 251.7115 138.4413 113.2702 143.1403 108.5712
2020/21 276.8827 138.4413 138.4413 68.47226 208.4104
2021/22 304.5709 152.2855 152.2855 69.49934 235.0716
2022/23 335.028 167.514 167.514 70.54183 264.4862
2023/24 368.5308 184.2654 184.2654 71.59996 296.9309
2024/25 405.3839 202.692 202.692 72.67396 332.71
2025/26 425.6531 191.5439 234.1092 73.76407 351.889
2026/27 446.9358 201.1211 245.8147 74.87053 372.0652
2027/28 469.2826 211.1772 258.1054 75.99359 393.289
2028/29 492.7467 221.736 271.0107 77.13349 415.6132
2029/30 517.384 232.8228 284.5612 78.2905 439.0935
Source: Estimated by the author.
Compared to the baseline scenario, the total resource needs for adaptation by 2030 at
nominal prices rises to more than US$ 853 mn per year. The cumulative need over 2010/11
to 2029/30 is more than US$ 9 billion. For the baseline scenario it is just above US$ 7 bn. For
estimates at constant 2005/06 prices, the total resource needs under adaptation scenario
rises to somewhat above US$ 500 mn by 2029/30 while the cumulative need is US$ 5.6 bn
which is nearly US$ 2.5 bn more than the baseline needs at constant prices. The investment
and O&M needs are also substantially different and more so for the estimates at constant
2005/06 prices as shown in Fig. 9.
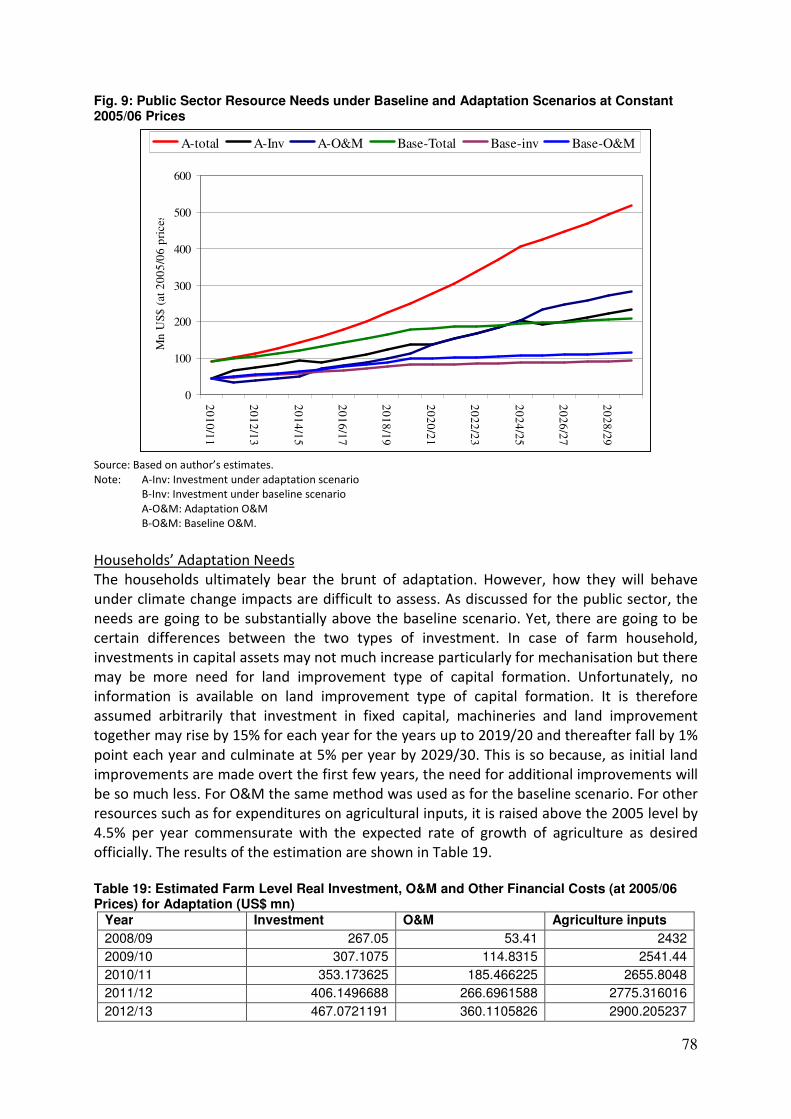
78
Fig. 9: Public Sector Resource Needs under Baseline and Adaptation Scenarios at Constant 2005/06 Prices
0
100
200
300
400
500
600
20
10
/11
20
12
/13
20
14
/15
20
16
/17
20
18
/19
20
20
/21
20
22
/23
20
24
/25
20
26
/27
20
28
/29
Mn
US
$ (
at 2
00
5/0
6 p
rice
s)
A-total A-Inv A-O&M Base-Total Base-inv Base-O&M
Source: Based on author’s estimates.
Note: A-Inv: Investment under adaptation scenario
B-Inv: Investment under baseline scenario
A-O&M: Adaptation O&M
B-O&M: Baseline O&M.
Households’ Adaptation Needs
The households ultimately bear the brunt of adaptation. However, how they will behave
under climate change impacts are difficult to assess. As discussed for the public sector, the
needs are going to be substantially above the baseline scenario. Yet, there are going to be
certain differences between the two types of investment. In case of farm household,
investments in capital assets may not much increase particularly for mechanisation but there
may be more need for land improvement type of capital formation. Unfortunately, no
information is available on land improvement type of capital formation. It is therefore
assumed arbitrarily that investment in fixed capital, machineries and land improvement
together may rise by 15% for each year for the years up to 2019/20 and thereafter fall by 1%
point each year and culminate at 5% per year by 2029/30. This is so because, as initial land
improvements are made overt the first few years, the need for additional improvements will
be so much less. For O&M the same method was used as for the baseline scenario. For other
resources such as for expenditures on agricultural inputs, it is raised above the 2005 level by
4.5% per year commensurate with the expected rate of growth of agriculture as desired
officially. The results of the estimation are shown in Table 19.
Table 19: Estimated Farm Level Real Investment, O&M and Other Financial Costs (at 2005/06 Prices) for Adaptation (US$ mn)
Year Investment O&M Agriculture inputs
2008/09 267.05 53.41 2432
2009/10 307.1075 114.8315 2541.44
2010/11 353.173625 185.466225 2655.8048
2011/12 406.1496688 266.6961588 2775.316016
2012/13 467.0721191 360.1105826 2900.205237
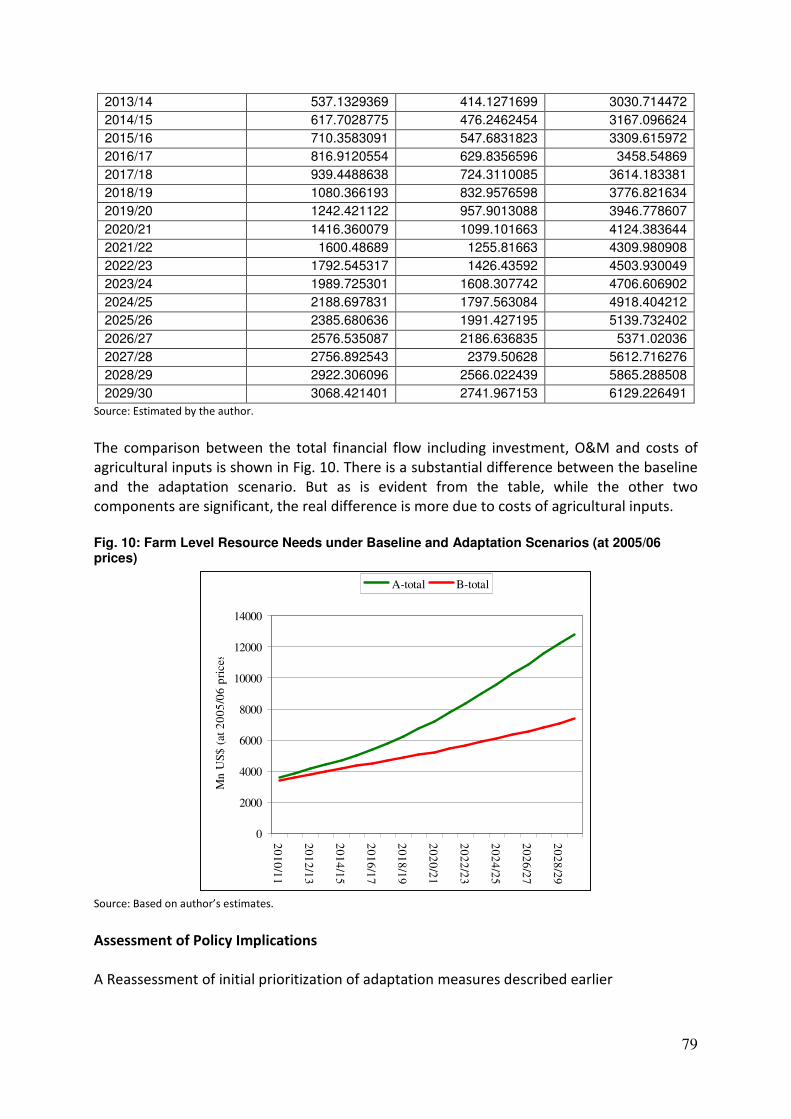
79
2013/14 537.1329369 414.1271699 3030.714472
2014/15 617.7028775 476.2462454 3167.096624
2015/16 710.3583091 547.6831823 3309.615972
2016/17 816.9120554 629.8356596 3458.54869
2017/18 939.4488638 724.3110085 3614.183381
2018/19 1080.366193 832.9576598 3776.821634
2019/20 1242.421122 957.9013088 3946.778607
2020/21 1416.360079 1099.101663 4124.383644
2021/22 1600.48689 1255.81663 4309.980908
2022/23 1792.545317 1426.43592 4503.930049
2023/24 1989.725301 1608.307742 4706.606902
2024/25 2188.697831 1797.563084 4918.404212
2025/26 2385.680636 1991.427195 5139.732402
2026/27 2576.535087 2186.636835 5371.02036
2027/28 2756.892543 2379.50628 5612.716276
2028/29 2922.306096 2566.022439 5865.288508
2029/30 3068.421401 2741.967153 6129.226491
Source: Estimated by the author.
The comparison between the total financial flow including investment, O&M and costs of
agricultural inputs is shown in Fig. 10. There is a substantial difference between the baseline
and the adaptation scenario. But as is evident from the table, while the other two
components are significant, the real difference is more due to costs of agricultural inputs.
Fig. 10: Farm Level Resource Needs under Baseline and Adaptation Scenarios (at 2005/06 prices)
0
2000
4000
6000
8000
10000
12000
14000
20
10
/11
20
12
/13
20
14
/15
20
16
/17
20
18
/19
20
20
/21
20
22
/23
20
24
/25
20
26
/27
20
28
/29
Mn
US
$ (
at 2
00
5/0
6 p
rice
s)
A-total B-total
Source: Based on author’s estimates.
Assessment of Policy Implications
A Reassessment of initial prioritization of adaptation measures described earlier
80
Many of the estimates may be quite sensitive to the assumptions made. Yet, this provides
certain lessons for prioritisation of allocation of resources. First, investments and O&M are
of similar importance. It was found to be true for projects evaluated officially and also as
estimated here. Thus capacity building and logistics for sustained efforts to make
investments pay is required. Note further that future subsidies have not been projected.
These may remain a major issue if farmers are to be encouraged to adopt new technology
under adaptation.
Second, for the farm household, investments, O&M and more particularly expenditures
related to other financial flows are extremely important both in case of baseline as well as
for adaptation. Particularly, here probably capital formation through land improvements
rather than the conventional capital acquisition is more important.
Identification of policy measures to encourage changes in I&FF for adaptation
Two types of policy recommendations follow from the above for the public sector. First,
there must be adequate attention to capacity building for investments but more so for O&M.
Particularly if these investments are made for generation of new technology and their
dissemination, O&M remains a major area for budgetary support. This is more so because if
support to agriculture in the form of subsidy is continued it may be unsustainable over the
long run, Hence rather than continuing with diffusion of old technology through subsidy, it
would be better to expend resources for developing new ones which may provide farmers
with more opportunities and flexibility. Such findings indicate the need for longer-run efforts
to contain the impact of climate change, rather than simply one-off investments.
The findings for farm household investments, O&M and other financial flows show that
attention should be paid more to the last category than others. In case of investments, if
these are non-equipment capital formation (e.g., land improvement), the role of the
community may be crucial for collective action for raising productivity of natural resources
such as land.
81
References
Asaduzzaman, M. Getting Agriculture Moving Again: Strategic Options for Post-HYV
Agriculture in Bangladesh, BIDS/BRAC monograph, 2009.
Asaduzzaman, M. et al, Investing in Crop Agriculture in Bangladesh for Higher Growth and
Productivity, and Adaptation to Climate Change, prepared for the Bangladesh Food
Security Investment Forum, Ministry of Food and Disaster Management, Government
of Bangladesh, May 2010.
Asaduzzaman, M., Ahsan Ahmed, A. K. M. Enamul Haque and Qamar Munir, Towards a
Climate Resilient and Climate Sensitive Development in Bangladesh, draft background
paper for the Planning Commission, 2009.
Asaduzzaman, M. and K. M. Nabiul Islam, Adequacy and Effectiveness of Fuel Subsidies to
the Poor Bangladeshi Farmers, submitted to the World Bank , May 2009.
Asaduzzaman, M., “Bangladesh: Facing Old Challenges in New Context” Chapter 2 in Thapa,
Gopal B. et al (ed.), Agricultural Transition in Asia: Trajectories and Challenges, AIT,
Bangkok, 2010.
Bangladesh Bank, Major Economic Indicators: Monthly Updates, various months and years.
BBS, Household Income and Expenditure Survey, 2005.
BBS, Agriculture Sample Survey of Bangladesh-2005.
BBS, Census of Agriculture 2008.
BBS, Census of Agriculture 2008, Agricultural Sample Survey 2008, Vol 3, 2011.
BBS, Census of Agriculture 2008, Vol IV – Analytical Report on the Census of Agriculture
2008.
BBS, Statistical Year book of Bangladesh, various years.
BBS, Report on Labour Force Survey 2005-06, 2008.
BBS, Report on Labour Force Survey 2002-03, 2004.
BBS, Report of the Labour Force Survey, Bangladesh, 1999/2000, 2002.
IMED, Annual Reports, various years (in Bengali).
Ministry of Environment and Forests, Bangladesh Climate Change Strategy and Action Plan,
2009.
Ministry of Environment and Forests, National Adaptation Programme of Action (NAPA):
Preparing for the Future, 2005.
Ministry of Finance, Bangladesh Economic Review, various years.
Ministry of Food and Disaster Management, Bangladesh Country Investment Plan, July 2011.