Embed Size (px)
Citation preview

FINANCIAL ANALYSIS SUMMARY
Mediterranean Maritime Hub Finance p.l.c.
FINANCIAL ANALYSIS SUMMARY
Mediterranean Maritime Hub Finance plc
26th June 2018

FINANCIAL ANALYSIS SUMMARY Mediterranean Maritime Hub Finance p.l.c.
1
The Directors
Mediterranean Maritime Hub Finance plc.
Head Office Building
Xatt il-Mollijiet, Mdina Road,
Marsa MRS 1152, Malta
26th June 2018
Dear Sirs,
In accordance with your instructions, and in line with the requirements of the Listing Authority Rules,
we have compiled the Financial Analysis Summary (the “FAS” or the “Analysis”) set out on the
following pages and which is being forwarded to you together with this letter.
The purpose of the financial analysis is that of summarising key financial data appertaining to
Mediterranean Maritime Hub Finance plc. (“the Issuer”) and MMH Holdings Limited (“the
Guarantor”).The data is derived from various sources or is based on our own computations as follows:
(a) The historical financial data for the three years ended 2015, 2016 and 2017 have been
extracted from the Issuer and the Guarantor audited statutory financial statements.
(b) The forecast data for the financial years ending 31st December 2018 have been provided by
Management.
(c) Our commentary on the results of the Issuer and the MMH Group of Companies (“the Group”)
and on their financial position is based on the explanations provided by Management.
(d) The ratios quoted in the FAS have been computed by us applying the definitions set out in the
“Glossary and Definitions” section of the Analysis.
(e) The principal relevant market players listed in the “Comparative Analysis” section of the
document have been identified by us. Relevant financial data in respect of competitors has
been extracted from public sources such as the web sites of the companies concerned or
financial statements filed with the Registrar of Companies.
The Analysis is meant to assist potential investors by summarising the more important financial data
set out in the annually published financial statements of the Issuer and Guarantor. The Analysis does
not contain all data that is relevant to potential investors and is meant to complement, and not
replace, the contents of the financial statements. The Analysis does not constitute an endorsement
by our firm of the purchases of the securities related to the Group and should not be interpreted as a
recommendation to invest in the securities issued by the Group. We shall not accept any liability for
any loss or damage arising out of the use of the Analysis. Potential investors are encouraged to seek
professional advice before investing in the Group’s securities.
Yours sincerely,
Nick Calamatta
Director

FINANCIAL ANALYSIS SUMMARY Mediterranean Maritime Hub Finance p.l.c.
2
Table of Contents
1. Information about the Issuer and Group ...................................................................................... 3
1.1 Issuer’s key activities ........................................................................................................ 3
1.2 Group Structure ............................................................................................................... 3
1.3 Group entities .................................................................................................................. 3
1.4 Directors and Executive Management ............................................................................. 4
1.5 Current shareholders ....................................................................................................... 5
2. Review of the business .................................................................................................................. 6
2.1 Core operating entities..................................................................................................... 6
2.2 Major Assets and Development Projects ......................................................................... 7
2.3 Project Development Update ........................................................................................... 8
3. Key Market Data ........................................................................................................................... 9
3.1 The Group’s Competitive Environment .......................................................................... 10
4. Performance Review and Projections ......................................................................................... 11
4.1 Income Statement - Guarantor ...................................................................................... 11
4.2 Balance Sheet - Guarantor ............................................................................................. 13
4.3 Cash Flow Statement - Guarantor .................................................................................. 15
4.4 Variance analysis - Guarantor ........................................................................................ 16
4.5 Income Statement - Issuer ............................................................................................. 17
4.6 Balance Sheet - Issuer .................................................................................................... 18
4.7 Cash flow Statement - Issuer .......................................................................................... 19
4.8 Variance analysis - Issuer................................................................................................ 19
5. Comparative Analysis .................................................................................................................. 20
6. Glossary and Definitions.............................................................................................................. 22

FINANCIAL ANALYSIS SUMMARY Mediterranean Maritime Hub Finance p.l.c.
3
1. Information about the Issuer and Group
1.1 Issuer’s key activities
Mediterranean Maritime Hub Finance Plc (“the Issuer”) was incorporated on 26th July 2016 and is a
fully owned subsidiary company of MMH Holdings Limited (“the Guarantor”). MMH Holdings Limited
(formerly Ablecare Oilfield Services Holdings Limited) was incorporated in Malta in 2008 and as the
holding company holds the shares in a number of subsidiary companies primarily operating in the
marine and oil and gas services sector (“the Group”).
1.2 Group Structure
1.3 Group entities
MMH Malta Limited
MMH Malta Limited focuses on the supply of tailor-made services supporting the oil and gas industry,
as well as marine services through its operation of the Mediterranean Maritime Hub. Its services are
mainly of an operational, logistical and maintenance nature, as may be required by oil drilling
companies and their support service providers referred to as the International Oil Companies or ‘IOC’s.
From January 2017 MMH Malta Limited took over the services previously offered by MMH People
Limited, which is now non-trading. Accordingly, MMH Malta Limited now also provides services of
recruitment, contracting and secondment of specialised maintenance personnel and related manning
logistical services for the oil and gas industry, together with the career planning and follow-up of the
same personnel.
MMH People Limited
MMH People Limited transferred its business to MMH Malta Limited in the beginning of 2017 and is
currently non-trading.
MMH Holdings Ltd (formerly
Ablecare Oilfield Services
Holdings Limited)
(Borrower and Guarantor)
60%
Mulberry
Insurance
Brokers Limited
99.99%
Abel Energy
Limited
99.99%
MMH People
Limited
99.99%
MMH
Academy
Limited
99.99%
Mediterranean
Maritime Hub Finance
plc. (Issuer)
Financing
Agreement
€12.95m
Financing
Agreement
€1.6m
99.99%
MMH Malta
Limited

FINANCIAL ANALYSIS SUMMARY Mediterranean Maritime Hub Finance p.l.c.
4
MMH Academy Limited
MMH Academy Limited’s objective is to provide education, training, conferences and related services
in the field of oil exploration and engineering.
Abel Energy Limited
Abel Energy Limited was set up to operate a vehicle fuel service station and related services including
a car wash, convenience store and cafeteria.
In 2015, the company acquired a fuel station licence in Malta and is now in the process of acquiring
property on which to operate a service station. In March 2016, the company submitted a request for
a development permit to the Planning Authority (PA) to build a fuel station at Maghtab, Naxxar. The
PA approved the permit during January 2018.
Mulberry Insurance Brokers Limited
Mulberry Insurance Brokers Limited (Mulberry) is a limited liability company registered on 4 December
2015. It is 60% owned by MMH Holdings Limited, with the remaining 40% owned by Primus V.M.
Limited, representing the shareholding interest of company employees. The company obtained an
insurance brokerage licence on 24 June 2016 and commenced operations immediately after.
1.4 Directors and Executive Management
During 2014, the Group employed an average number of 54 employees, increasing to 111 as at May
2018. New appointees were mainly recruited in operations and logistics, site management and site
surveillance, and engineering. As at May 2018, Engineering was the largest department carrying 24
employees, followed by Operations and Logistics (20 employees), and by Site Management and
Maintenance (13 employees) and Site Security (7 employees).
As the business continues to transform into a model where most services will increasingly be provided
in-house, the Group is streamlining its workforce in order to be better-equipped to provide one-stop-
shop services to its clients.
Board of Directors
The Board of Directors of the Issuer is composed of the following persons:
Name Designation
Paul Abela Chairman
Mr. Raymond Ciantar Deputy Chairperson
Ms Angelique Maggi Executive Director
Dr Michael Borg Costanzi Non-Executive Director
Mr Lino Casapinta Non-Executive Director
Mr Victor Denaro Non- Executive Director
FINANCIAL ANALYSIS SUMMARY Mediterranean Maritime Hub Finance p.l.c.
5
The board of Directors of the Guarantor consists of the following persons:
Name Designation
Mr. Paul Abela Chairman
Ms. Angelique Maggi Deputy Chairperson
Mr. Joseph Maggi Director – Quality & Planning
Mr. Raymond Ciantar Director & CFO
Mr. Duncan Brincat Director – Administration
With effect from 1st May, 2018, Mr. Joseph Maggi was appointed as Group CEO.
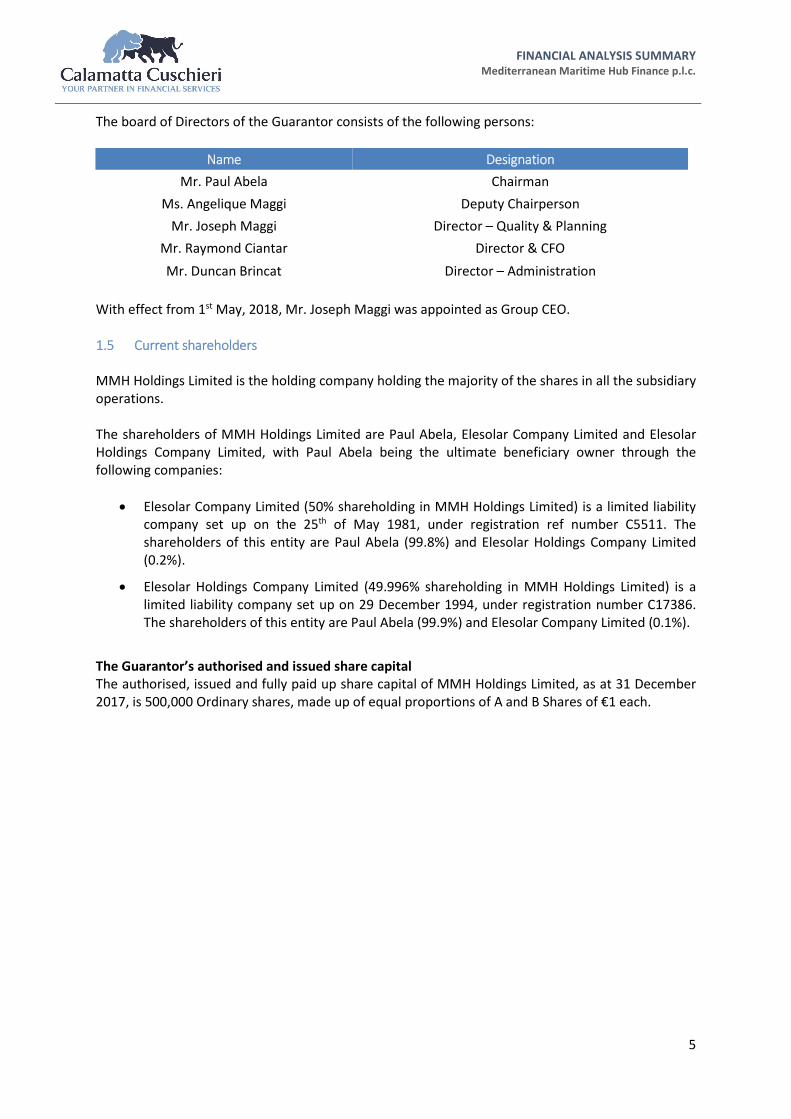
1.5 Current shareholders
MMH Holdings Limited is the holding company holding the majority of the shares in all the subsidiary
operations.
The shareholders of MMH Holdings Limited are Paul Abela, Elesolar Company Limited and Elesolar
Holdings Company Limited, with Paul Abela being the ultimate beneficiary owner through the
following companies:
Elesolar Company Limited (50% shareholding in MMH Holdings Limited) is a limited liability
company set up on the 25th of May 1981, under registration ref number C5511. The
shareholders of this entity are Paul Abela (99.8%) and Elesolar Holdings Company Limited
(0.2%).
Elesolar Holdings Company Limited (49.996% shareholding in MMH Holdings Limited) is a
limited liability company set up on 29 December 1994, under registration number C17386.
The shareholders of this entity are Paul Abela (99.9%) and Elesolar Company Limited (0.1%).
The Guarantor’s authorised and issued share capital
The authorised, issued and fully paid up share capital of MMH Holdings Limited, as at 31 December
2017, is 500,000 Ordinary shares, made up of equal proportions of A and B Shares of €1 each.

FINANCIAL ANALYSIS SUMMARY Mediterranean Maritime Hub Finance p.l.c.
6
2. Review of the business
The main business focus of the Group is that of providing a range of services to the marine and oil and
gas service sector through both the provision of manpower and technical personnel to offshore and
onshore oil well operators, as well as logistical support, yard operations, procurement and engineering
services to oil rigs service companies. As a key element of its services portfolio, the Group operates
the Mediterranean Maritime Hub in the innermost part of Valletta’s Grand Harbour, the inauguration
of which has allowed the Group to widen its range of marine-based services and products. The
Group’s portfolio of services is targeted at oil rigs and related operators in the Mediterranean region
and West Africa, as well as the supply of personnel to operators in the North Sea. The principal
business operations of the Group are provided by MMH Malta Limited.
During the first quarter of 2018 the Group set up a business development team to explore
diversification opportunities that would complement existing services being provided by the Hub.
Various opportunities have already been identified and are being assessed. The yachting industry has
been identified as such. The Group, through MMH Malta Limited, intends to offer maintenance and
upkeep services to yachts within the Hub. Management expects the Group to be fully operational
within this new segment by the end of 2018.
The Group’s track record is marked by the management team’s ability to forge ongoing business
relationships with key players in the oil and gas sector. Over time the Group has grown by increasingly
catering for a wider range of services to its clients. The management team has embarked on the next
phase of the business’s development and is currently expanding the physical facilities within the Hub,
enabling the Group to provide a wider range of services and reduce dependence on bought-out
subcontracted services.
2.1 Core operating entities
MMH Malta Limited specialises in the specific requirements of the oil and gas and marine sectors,
providing a wide range of services including rig agency and rig stop services, planning, project
recruitment, the contracting of pre-screened and pre-qualified personnel, training, logistics, facilities
provision, supply chain services and project management.
MMH Malta Limited’s key focus is on servicing the needs of oil drilling companies in the EMEA region
(Europe, Middle East and Africa region), and service providers thereto. The strength of MMH Malta
Limited’s provision of services is primarily owed to ongoing relationships, backed by vendor
agreements and Master Service Agreements (MSAs) with some of the world’s largest drilling
companies.
The facilities and support functions typically required to service rig stops comprise:
Quay - This is to facilitate berthing and mooring;
Yard area - This is to load, unload and store equipment and acts as an extension of the rig
deck;
Engineering workshop - To facilitate on-shore maintenance of equipment, prior to placing this
back onto the rig;
Procurement services/ ship chandler services - This comprises the procurement of all the
goods that may be required by the rig, which could range from the replacement of the items
required, such as machine parts, to motors and food supplies;

FINANCIAL ANALYSIS SUMMARY Mediterranean Maritime Hub Finance p.l.c.
7
Logistical support - This includes all types of logistics required by the rig, which could range
from Freeport services, customs declarations, permits, physical logistics including the sending
and receiving of rig equipment from hubs etc.; and
Provision of additional manpower - This involves the provision of personnel, often working
under the supervision of the Original Equipment Manufacturers. This service was formerly
provided by MMH People Limited, and was transferred to MMH Malta Limited in January
2017.
It may be noted that prior to the acquisition of the Hub for the purpose of servicing Malta based rig
stops, the Group made use of sub-contracted facilities from other local operators. For the purpose of
servicing non-Malta based rig stops, the Group will continue to make use of sub-contracted foreign
facilities as the need arises.
From January 2017 MMH Malta Limited is also offering the services previously offered by MMH People
Limited, which included handling human resources requirements for the offshore/onshore oilfield
industry, such as manpower planning, project recruitment, training, as well as provision and
contracting of pre-screened and qualified personnel. Logistics and travel administration are an integral
part of the service.
These services are to a large extent, driven by the same MSAs with oil drilling companies, however, it
has a somewhat wider geographic reach as it provides manpower to operations as far as the North
Sea and Africa.
2.2 Major Assets and Development Projects
In January 2015, the Group was selected as the preferred bidder for the concession, to be awarded by
the Government of Malta to rehabilitate the ex-Malta Shipbuilding site – now known as the
Mediterranean Maritime Hub (or the “Hub” or the “Site”).
The Group intends to invest a total of c. €55 million, in several phases, to rehabilitate the Site and fully
exploit it to its maximum potential as a maritime hub, with all the facilities that typically come with
this, including a dedicated rig servicing centre, facilities for support engineering services and also a
training centre.
The concession is for a period of 65 years under a title of temporary emphyteusis and consists of c.
169,000 square metres of land, mainly comprising:
Quays 2 and 3, including lay down area, storage yards, main entrance to Site and a warehouse
Quay 4 and 5, including yard space
Dock
Stand-alone external yards for open storage
Four hangars / shed space for engineering works and internal storage
Three main buildings which comprise warehouse space and space that could be converted
into office space, engineering workshops and additional storage space
Connecting road infrastructure
FINANCIAL ANALYSIS SUMMARY Mediterranean Maritime Hub Finance p.l.c.
8
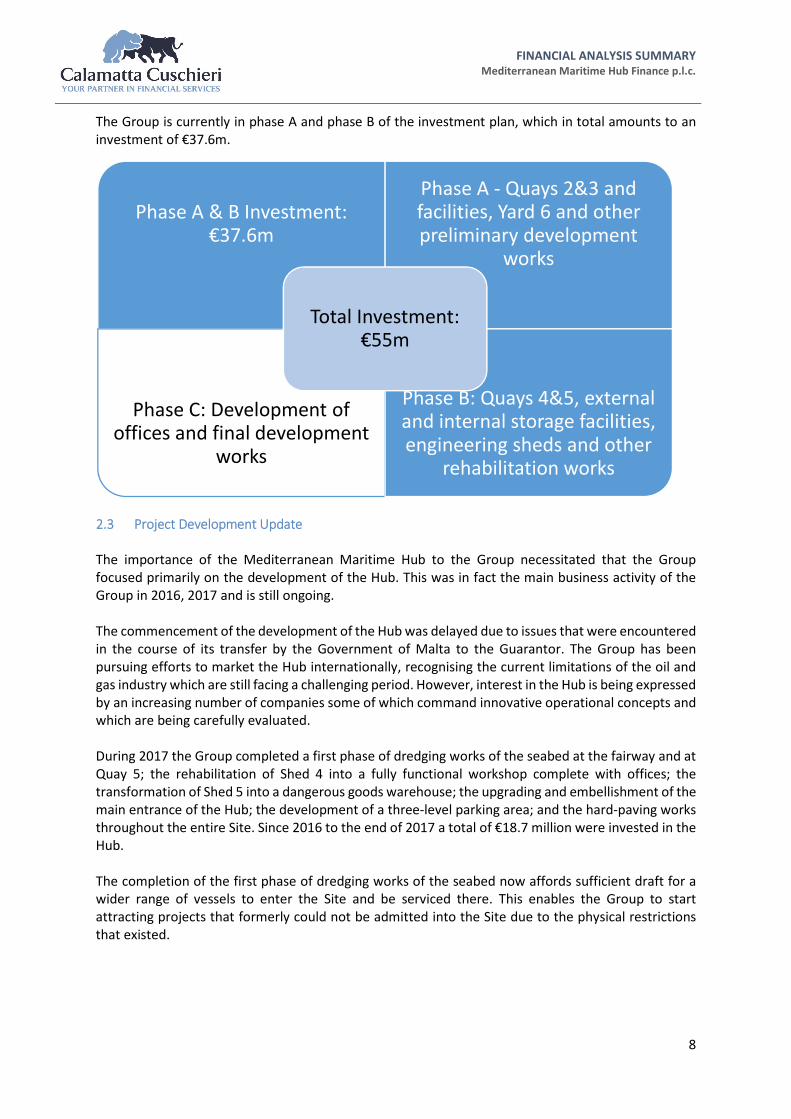
The Group is currently in phase A and phase B of the investment plan, which in total amounts to an
investment of €37.6m.
2.3 Project Development Update
The importance of the Mediterranean Maritime Hub to the Group necessitated that the Group
focused primarily on the development of the Hub. This was in fact the main business activity of the
Group in 2016, 2017 and is still ongoing.
The commencement of the development of the Hub was delayed due to issues that were encountered
in the course of its transfer by the Government of Malta to the Guarantor. The Group has been
pursuing efforts to market the Hub internationally, recognising the current limitations of the oil and
gas industry which are still facing a challenging period. However, interest in the Hub is being expressed
by an increasing number of companies some of which command innovative operational concepts and
which are being carefully evaluated.
During 2017 the Group completed a first phase of dredging works of the seabed at the fairway and at
Quay 5; the rehabilitation of Shed 4 into a fully functional workshop complete with offices; the
transformation of Shed 5 into a dangerous goods warehouse; the upgrading and embellishment of the
main entrance of the Hub; the development of a three-level parking area; and the hard-paving works
throughout the entire Site. Since 2016 to the end of 2017 a total of €18.7 million were invested in the
Hub.
The completion of the first phase of dredging works of the seabed now affords sufficient draft for a
wider range of vessels to enter the Site and be serviced there. This enables the Group to start
attracting projects that formerly could not be admitted into the Site due to the physical restrictions
that existed.
Phase A & B Investment: €37.6m
Phase A - Quays 2&3 and facilities, Yard 6 and other preliminary development
works
Phase C: Development of offices and final development
works
Phase B: Quays 4&5, external and internal storage facilities, engineering sheds and other
rehabilitation works
Total Investment: €55m

FINANCIAL ANALYSIS SUMMARY Mediterranean Maritime Hub Finance p.l.c.
9
Fuel station update
During January 2018, the Group obtained the approval from the Planning Authority for a development
permit to build a fuel station in Maghtab. Abel Energy Limited has now applied for an executable
permit in order to start the construction works. The Management expects the station to be
operational by June 2019.
3. Key Market Data
The main industry driver, directly impacting the operations of the Group is the price of oil. This has a
direct bearing on the extent of drilling operations carried out by International Oil Companies (IOCs)
and the number of rigs in operation, which in turn determines the demand for services provided by
the Group.
More specifically, when the oil price is high, IOCs may explore deposits that were previously deemed
too costly. However, when the price is low, investment in drilling and exploration could fall, which
would increase competition between suppliers and the decline of the number of oil rigs in operation.
Source: Baker Hughes Source: International Energy Agency
The offshore oil and gas industry is slowly emerging from a challenging period, which has seen the
industry as a whole having to transform itself in order to meet the rapidly-changing energy
requirements of the international market. As these challenges grow, the opportunities that they
present grow in tandem. Operators, service companies and major equipment manufacturers are
beginning to establish MSAs with potential suppliers in order to meet renewed expected growth. They
are also looking carefully to rationalize their operations into better strategically located and efficient
regional hubs.
It may be noted that the Brent Crude oil has been trading in a range of $54-$80 / barrel in the past
three years after a sharp drop off in 2014. As of Q2 2018, the Brent Crude oil was selling in a range of
$67-$80 / barrel. The Group is seeking to establish a broad range of MSAs with key potential client
companies, as well as strategic alliance partnerships with key supply chain entities. The location, site
size and facilities of the Mediterranean Maritime Hub offers clients with unique regional operational
flexibility. This applies to the oil and gas industry as well as to companies within the diverse maritime
-1%
1%
2%
3%
4%
5%
13.5
14.0
14.5
15.0
15.5
16.0
Europe Oil Demand
Million barrel per day Yearly Growth
0
20
40
60
80
100
120
140
160
180
Europe oil rig count

FINANCIAL ANALYSIS SUMMARY Mediterranean Maritime Hub Finance p.l.c.
10
industries. The industry is showing signs of an upward trend, although the political uncertainty in the
Middle East and the sustainability of a higher oil price remain a concern.
3.1 The Group’s Competitive Environment
To date the Group’s competitive environment has comprised local and foreign market players,
including local and foreign shipyards, local and foreign terminals, ship chandlers, ship agents, and
neighbouring countries with oil and gas pro-legislature, engineering facilities, and personnel
recruitment agencies.
As it transforms its business, the Group’s competitive strength will increasingly lie in the range of
services it provides, resulting in a one-stop shop for rigs within a cost effective, multi-faceted Hub in
the centre of the Mediterranean.
The Group is subject to regulation by the local transport regulator –Transport Malta. It is also regulated
by the SEC under the Foreign Corrupt Practices Act of 1977, a United States federal law known
primarily for two of its main provisions, one that addresses accounting transparency requirements
under the Securities Exchange Act of 1934 and another concerning bribery of foreign officials; as well
as the UK Bribery Act of 2010.
It is also an accredited member of the International Association of Drilling Contractors and is
ISO9001:2015 compliant, OHSAS 18001:2007 certified and 14001:2004 compliant. These certifications
demonstrate that the Group aims to ensure client satisfaction, that work is performed in a safe
environment, and with the least environmental impact possible.
0
20
40
60
80
100
120
Brent Crude Oil Price $

FINANCIAL ANALYSIS SUMMARY Mediterranean Maritime Hub Finance p.l.c.
11
4. Performance Review and Projections
All financial information presented in this section was derived from the audited accounts of the
Guarantor and the Issuer and from data provided by the Group. Forecasts are based on Management’s
projections for the coming year.
The Issuer was registered and incorporated on 26 July 2016 to issue the Bonds and loan the proceeds
to the Group. The Issuer did not conduct any business and has no trading record prior to the financial
year 2016. The Issuer’s function is solely to act as the financing vehicle for the Group, and as such does
not reflect the performance or financial position of the Group.
4.1 Income Statement - Guarantor
€ FY15A FY16A FY17A FY18F
Revenue 13,706,594 12,624,691 15,733,451 17,344,000
Operating costs (10,685,020) (10,984,560) (12,544,049) (12,760,000)
Distribution Costs (283,947) (254,339) (246,281) (246,000)
Administrative Expenses (1,910,929) (1,857,541) (2,184,900) (2,233,000)
Other Income - 97,526 82,332 -
Operating profit / (loss) 826,698 (374,223) 840,553 2,104,000
Depreciation 251,996 327,848 727,536 843,000
EBITDA 1,078,694 (46,375) 1,568,089 2,948,000
Finance Income 9,925 5,913 19,411 -
Finance Costs (130,827) (265,783) (755,373) (938,000)
Profit / (Loss) before tax 705,796 (634,093) 104,591 1,167,000
Tax credit / (expense) (275,393) 97,479 230,880 (224,000)
Profit / (Loss) for the year 430,403 (536,614) 335,471 943,000
Ratio analysis
Revenue growth n/a -8% 25% 10%
EBITDA margin 8% 0% 10% 17%
Operating margin 6% -3% 5% 12%
Net margin 3% -4% 2% 5%
Interest cover 8.25x -0.17x 2.08x 3.14x
Source: Audited Financial Statements and management information
The results for 2016 have been considerably impacted by the significant costs incurred on the
development of the Hub which did not generate any material revenue. The ground-rent incurred on
the Hub in 2016 alone amounted to €849,260, whilst the Site was still in development stage. The
results were also impacted by the increase in the costs involved to improve the management team in
its transition to meet industry requirements.
FY17 was a turning point for the Group in terms of financial results, with an improvement in the overall
performance of the Group after a challenging 2016. Revenue increased, coupled with increasing
profitability margins and ratios.
Revenue in 2017 increased to €15,733,451 (2016: €12,624,691), following a generally higher level of
operations, especially within the provision of technical personnel segment. Projected revenue for
FINANCIAL ANALYSIS SUMMARY Mediterranean Maritime Hub Finance p.l.c.
12
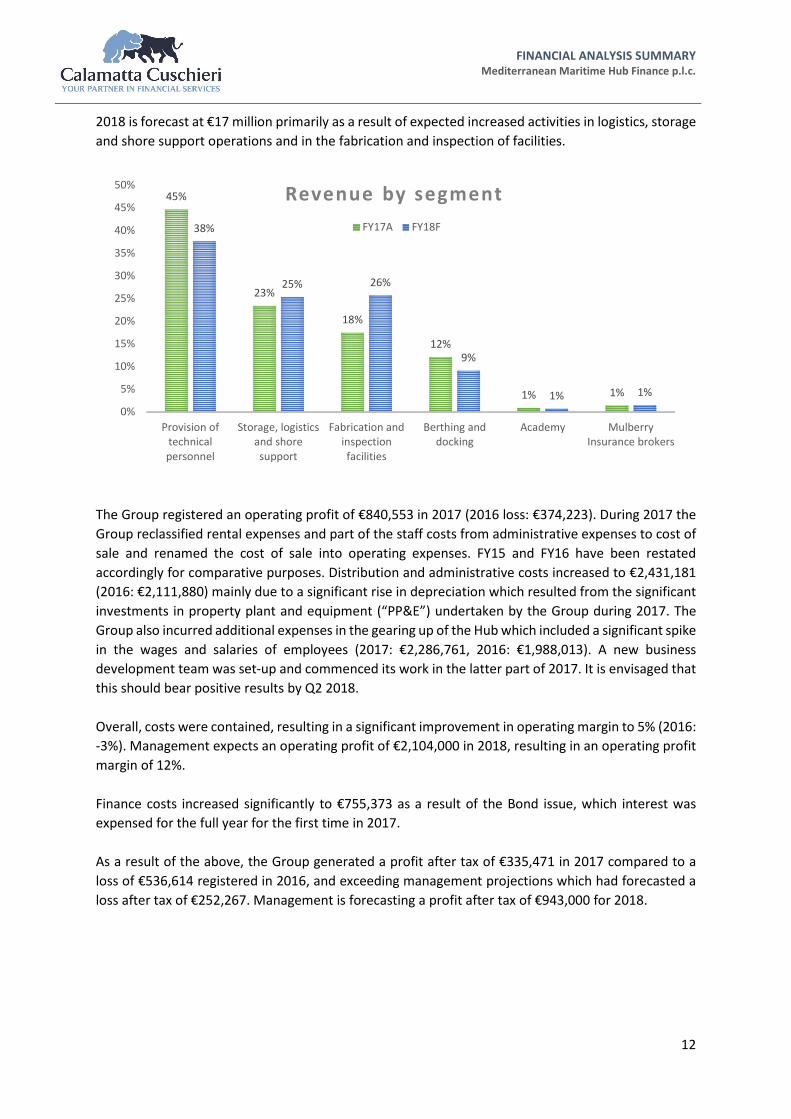
2018 is forecast at €17 million primarily as a result of expected increased activities in logistics, storage
and shore support operations and in the fabrication and inspection of facilities.
The Group registered an operating profit of €840,553 in 2017 (2016 loss: €374,223). During 2017 the
Group reclassified rental expenses and part of the staff costs from administrative expenses to cost of
sale and renamed the cost of sale into operating expenses. FY15 and FY16 have been restated
accordingly for comparative purposes. Distribution and administrative costs increased to €2,431,181
(2016: €2,111,880) mainly due to a significant rise in depreciation which resulted from the significant
investments in property plant and equipment (“PP&E”) undertaken by the Group during 2017. The
Group also incurred additional expenses in the gearing up of the Hub which included a significant spike
in the wages and salaries of employees (2017: €2,286,761, 2016: €1,988,013). A new business
development team was set-up and commenced its work in the latter part of 2017. It is envisaged that
this should bear positive results by Q2 2018.
Overall, costs were contained, resulting in a significant improvement in operating margin to 5% (2016:
-3%). Management expects an operating profit of €2,104,000 in 2018, resulting in an operating profit
margin of 12%.
Finance costs increased significantly to €755,373 as a result of the Bond issue, which interest was
expensed for the full year for the first time in 2017.
As a result of the above, the Group generated a profit after tax of €335,471 in 2017 compared to a
loss of €536,614 registered in 2016, and exceeding management projections which had forecasted a
loss after tax of €252,267. Management is forecasting a profit after tax of €943,000 for 2018.
45%
23%
18%
12%
1% 1%
38%
25% 26%
9%
1% 1%
0%
5%
10%
15%
20%
25%
30%
35%
40%
45%
50%
Provision of
technical
personnel
Storage, logistics
and shore
support
Fabrication and
inspection
facilities
Berthing and
docking
Academy Mulberry
Insurance brokers
Revenue by segment
FY17A FY18F

FINANCIAL ANALYSIS SUMMARY Mediterranean Maritime Hub Finance p.l.c.
13
4.2 Balance Sheet - Guarantor
€ FY15A FY16A FY17A FY18F
Assets
Non-current assets
Intangible assets 725,000 809,155 806,173 806,173
Property, plant and equipment 2,188,603 7,417,403 18,662,479 23,584,337
Trade and other receivables 766,702 1,181,375 853,711 853,711
Deferred tax assets 40,282 138,075 407,002 183,472
Total Non- current assets 3,720,587 9,546,008 20,729,365 25,427,693
Current Assets
Inventories 157,850 56,122 446,634 488,292
Trade and other receivables 3,344,519 5,132,560 6,756,096 5,549,675
Cash 2,587,222 8,196,303 1,343,882 126,866
Total current assets 6,089,591 13,384,985 8,546,612 6,164,834
Total assets 9,810,178 22,930,993 29,275,977 31,592,527
Equity and Liabilities
Share capital 500,000 500,000 500,000 500,000
Reporting currency conversion
reserve
(8,185) (71,628) (86,596) (86,596)
Other reserve 18,305 18,305 18,305 18,305
Retained earnings 4,513,423 3,978,921 4,305,357 5,228,606
Non-controlling interest - 37,888 46,923 66,668
Total equity 5,023,543 4,463,486 4,783,989 5,726,982
Liabilities
Non-current Liabilities
Borrowings 1,226,733 14,653,191 14,680,125 19,715,544
Trade and other payables 425,000 425,000 425,000 340,000
Deferred tax liability - - 1,664,860 1,625,577
Total non-current liabilities 1,651,733 15,078,191 16,769,985 21,681,121
Current Liabilities
Borrowings 607,695 263,059 200,058 800,000
Trade and other payables 1,777,174 2,638,776 7,161,699 3,222,644
Current tax liabilities 750,033 487,481 319,067 120,601
Other current liabilities - - 41179 41,179
Total current liabilities 3,134,902 3,389,316 7,722,003 4,184,424
Total liabilities 4,786,635 18,467,507 24,491,988 25,865,545
Total equity and liabilities 9,810,178 22,930,993 29,275,977 31,592,527
Ratio Analysis
Profitability
Return on Common Equity 9.0% -11.3% 7.3% 18%
Return on Assets 4.4% -2.3% 1.1% 3%
Solvency and liquidity
Net Debt / Total Equity -0.15x 1.51x 2.83x 3.56x
Total Liabilities / Total Assets 49% 81% 84% 82%
FINANCIAL ANALYSIS SUMMARY Mediterranean Maritime Hub Finance p.l.c.
14
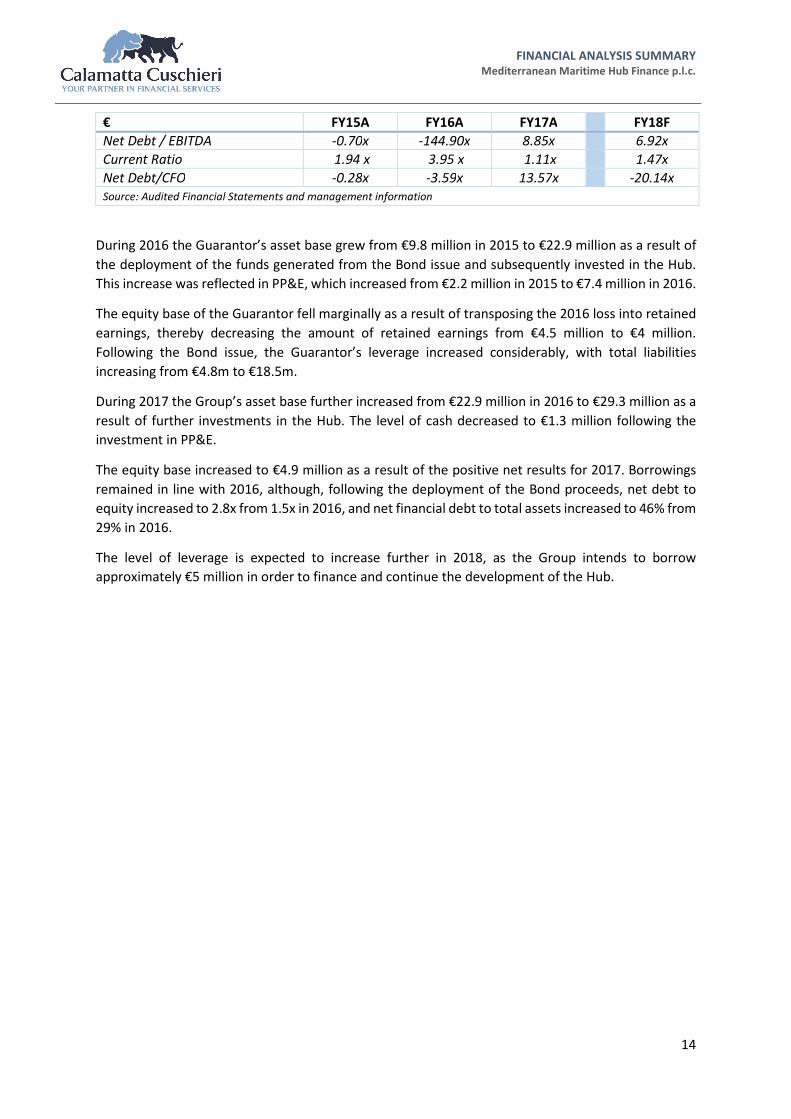
€ FY15A FY16A FY17A FY18F
Net Debt / EBITDA -0.70x -144.90x 8.85x 6.92x
Current Ratio 1.94 x 3.95 x 1.11x 1.47x
Net Debt/CFO -0.28x -3.59x 13.57x -20.14x
Source: Audited Financial Statements and management information
During 2016 the Guarantor’s asset base grew from €9.8 million in 2015 to €22.9 million as a result of
the deployment of the funds generated from the Bond issue and subsequently invested in the Hub.
This increase was reflected in PP&E, which increased from €2.2 million in 2015 to €7.4 million in 2016.
The equity base of the Guarantor fell marginally as a result of transposing the 2016 loss into retained
earnings, thereby decreasing the amount of retained earnings from €4.5 million to €4 million.
Following the Bond issue, the Guarantor’s leverage increased considerably, with total liabilities
increasing from €4.8m to €18.5m.
During 2017 the Group’s asset base further increased from €22.9 million in 2016 to €29.3 million as a
result of further investments in the Hub. The level of cash decreased to €1.3 million following the
investment in PP&E.
The equity base increased to €4.9 million as a result of the positive net results for 2017. Borrowings
remained in line with 2016, although, following the deployment of the Bond proceeds, net debt to
equity increased to 2.8x from 1.5x in 2016, and net financial debt to total assets increased to 46% from
29% in 2016.
The level of leverage is expected to increase further in 2018, as the Group intends to borrow
approximately €5 million in order to finance and continue the development of the Hub.
FINANCIAL ANALYSIS SUMMARY Mediterranean Maritime Hub Finance p.l.c.
15
4.3 Cash Flow Statement - Guarantor
€ FY15A FY16A FY17A FY18F
Cash flows from operating activities
Cash generated from operations /
(used in)
3,282,681 (1,349,202) 1,912,860 88,567
Finance income 9,925 5,913 19,411 -
Finance costs (130,827) (265,783) (728,439) (902,500)
Tax Paid (442,796) (262,866) (206,461) (198,466)
Net operating cash flows 2,718,983 (1,871,938) 997,371 (1,012,399)
Cash flows used in investing
activities
Purchase of intangible assets (725,000) (84,155) (17,311) -
Purchase of plant and equipment (1,946,133) (5,556,648) (9,514,802) (5,804,558)
Net cash used in investing activities (2,671,133) (5,640,803) (9,532,113) (5,804,558)
Cash flows from financing activities
Net Repayment/bank borrowings (358,709) (1,661,810) - -
Proceeds from bond issue - 15,000,000 - 5,000,000
Bond issue costs - (346,809) - -
Issue of shares in non-controlling
interest
- 40,000 - -
Proceeds from grants - - 1,745,322 -
Net cash (used in) / generated from
financing activities
(358,709) 13,031,381 1,745,322 5,000,000
Net movement in cash flows (310,859) 5,518,640 (6,789,420) (1,816,957)
Cash and cash equivalents at beg of
year
2,725,463 2,414,604 7,933,244 1,143,824
Cash and cash equivalents at end of
year
2,414,604 7,933,244 1,143,824 (673,133)
Source: Audited Financial Statements and management information
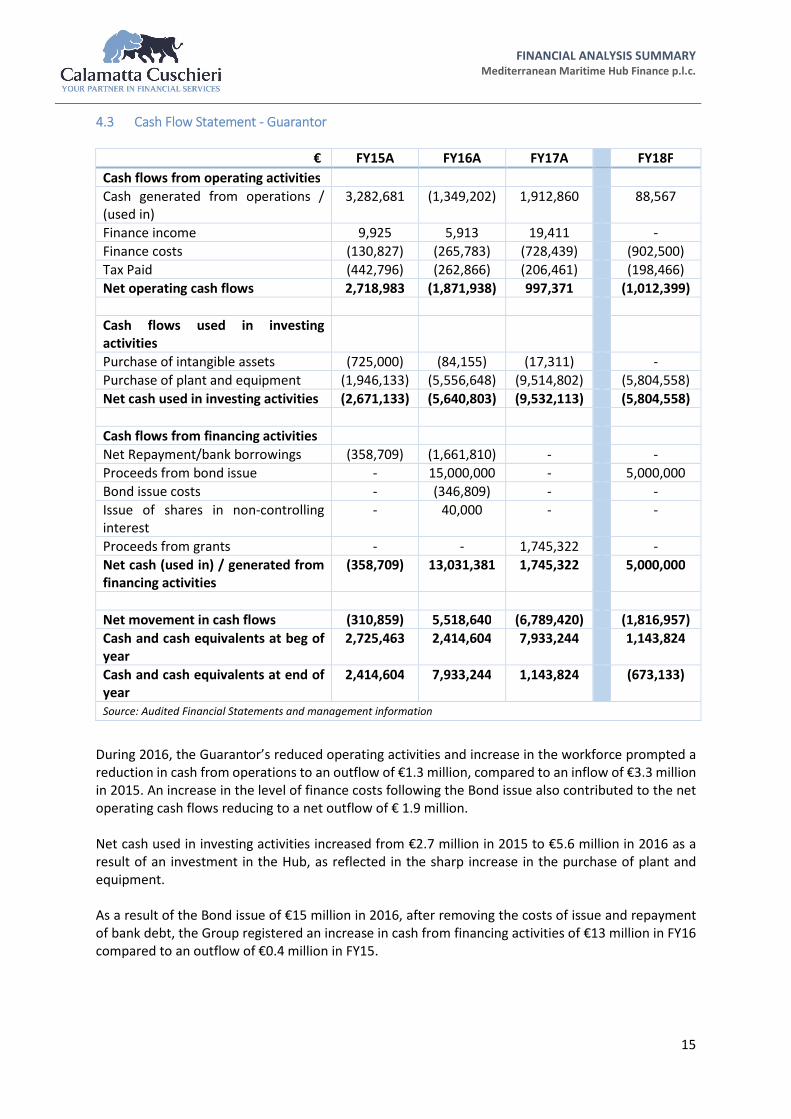
During 2016, the Guarantor’s reduced operating activities and increase in the workforce prompted a
reduction in cash from operations to an outflow of €1.3 million, compared to an inflow of €3.3 million
in 2015. An increase in the level of finance costs following the Bond issue also contributed to the net
operating cash flows reducing to a net outflow of € 1.9 million.
Net cash used in investing activities increased from €2.7 million in 2015 to €5.6 million in 2016 as a
result of an investment in the Hub, as reflected in the sharp increase in the purchase of plant and
equipment.
As a result of the Bond issue of €15 million in 2016, after removing the costs of issue and repayment
of bank debt, the Group registered an increase in cash from financing activities of €13 million in FY16
compared to an outflow of €0.4 million in FY15.

FINANCIAL ANALYSIS SUMMARY Mediterranean Maritime Hub Finance p.l.c.
16
During 2017 cash generated from operations returned to grow following the increase in turnover. This
resulted in a net inflow of €1 million compared to an outflow of €1.8 million in 2016, despite the
increase in finance costs following the Bond issue.
Cash used in investing activities increased to €9.5 million due to further investments in the Hub as
outlined in section 2.2 of the Analysis.
Cash from financing activities consisted of grants advanced by Malta Enterprise for the co-financing
of the capital expenditure of the Hub.
As a result of the above the Group’s cash and cash equivalent balance at the end of 2017 decreased
to €1.1 million from €7.9 million at the end of 2016.
Due to further capital investments expected for 2018 the Management forecast a negative cash
balance of €673K which is expected to be covered through a €2 million bank facility currently being
negotiated by the Guarantor with a local bank.
4.4 Variance analysis - Guarantor
€ FY17A FY17F Variance
Revenue 15,733,451 14,401,388 1,332,063
Operating expenses (12,544,049) (9,267,189) (3,276,860)
Gross Profit 3,189,402 5,134,200 (1,944,798)
Distribution Costs (246,281) (356,680) 110,399
Administrative Expenses (2,184,900) (5,194,901) 3,010,001
Other Income 82,332 789,021 (706,689)
Operating / profit 840,553 371,640 468,913
Finance Income 19,411 2,068 17,343
Finance Costs (755,373) (761,811) 6,438
Profit / (Loss) before tax 104,591 (388,103) 492,694
Tax credit 230,880 135,836 95,044
Profit / (Loss) for the year 335,471 (252,267) 587,738
Source: Audited Financial Statements and management information
FY17 revenue exceeded the forecasted revenue by €1.3 million due largely to a general increase in
activities and especially within the provision of manpower segment.
Operating costs and administrative expenses for 2017 were in line with the projections except for the
effect of the reclassification of administrative expenses into operating costs.
As a result of the above the Group generated a consolidated profit after tax of €335k as opposed to
an expected loss of €252k.
FINANCIAL ANALYSIS SUMMARY Mediterranean Maritime Hub Finance p.l.c.
17
4.5 Income Statement - Issuer
€ FY16A FY17A FY18F
Finance Income 206,783 877,625 877,625
Finance Costs (163,215) (746,934) (725,840)
Net Interest Income 43,568 130,691 151,785
Administrative Expenses (33,626) (67,810) (87,961)
Profit / (Loss) before tax 9,942 62,881 63,824
Tax expense (3,480) (22,008) (22,338)
Profit for the year 6,462 40,873 41,486
Ratio Analysis
Net interest margin 21.1% 14.9% 17.3%
Net profit margin 3.1% 4.7% 4.7%
Source: Audited Financial Statements and management information
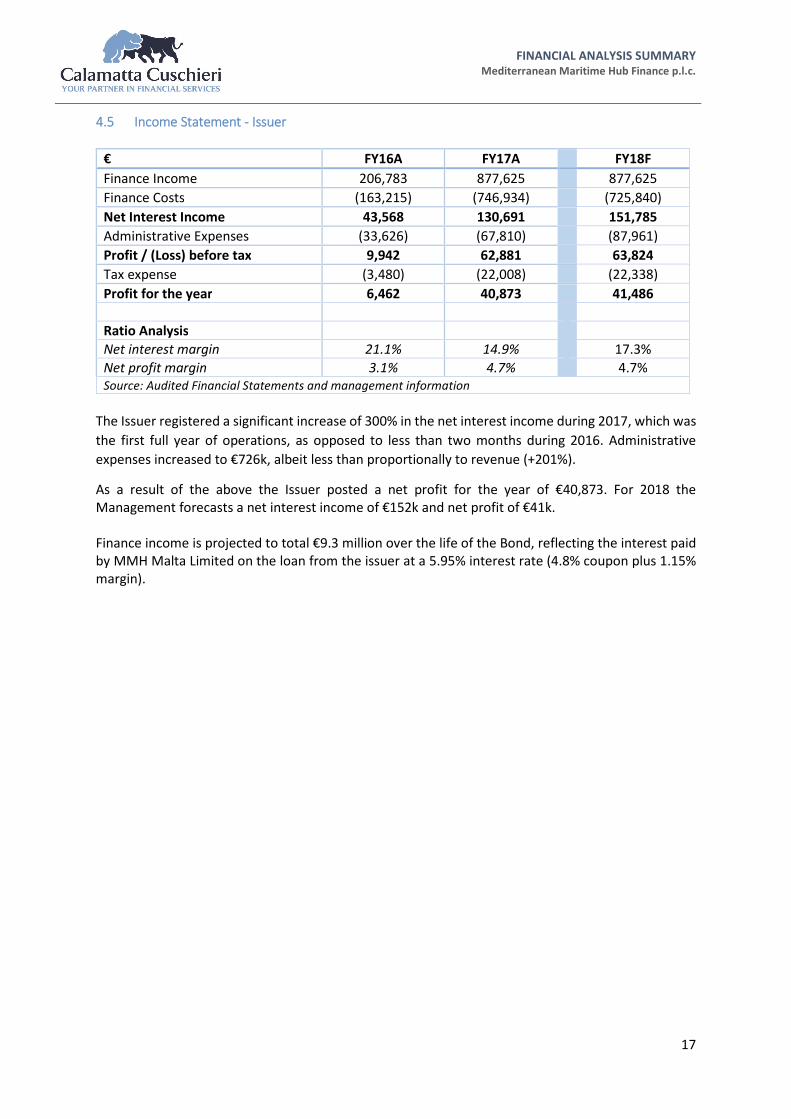
The Issuer registered a significant increase of 300% in the net interest income during 2017, which was
the first full year of operations, as opposed to less than two months during 2016. Administrative
expenses increased to €726k, albeit less than proportionally to revenue (+201%).
As a result of the above the Issuer posted a net profit for the year of €40,873. For 2018 the
Management forecasts a net interest income of €152k and net profit of €41k.
Finance income is projected to total €9.3 million over the life of the Bond, reflecting the interest paid
by MMH Malta Limited on the loan from the issuer at a 5.95% interest rate (4.8% coupon plus 1.15%
margin).
FINANCIAL ANALYSIS SUMMARY Mediterranean Maritime Hub Finance p.l.c.
18
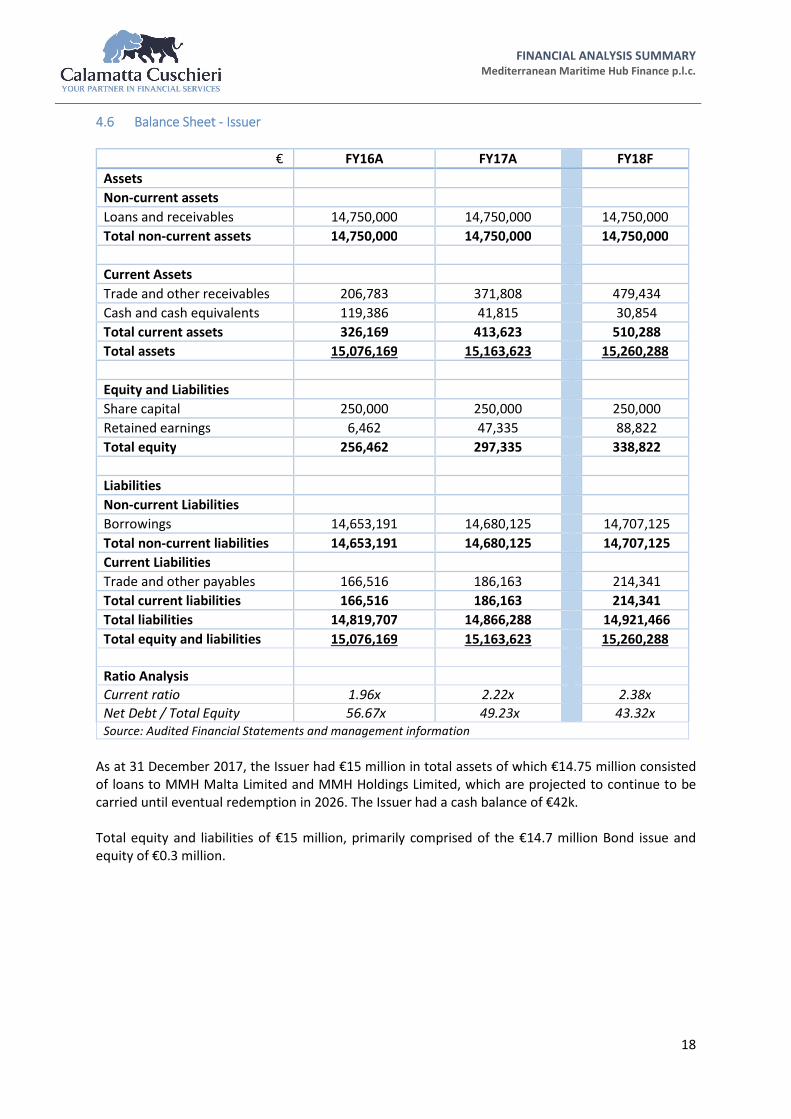
4.6 Balance Sheet - Issuer
€ FY16A FY17A FY18F
Assets
Non-current assets
Loans and receivables 14,750,000 14,750,000 14,750,000
Total non-current assets 14,750,000 14,750,000 14,750,000
Current Assets
Trade and other receivables 206,783 371,808 479,434
Cash and cash equivalents 119,386 41,815 30,854
Total current assets 326,169 413,623 510,288
Total assets 15,076,169 15,163,623 15,260,288
Equity and Liabilities
Share capital 250,000 250,000 250,000
Retained earnings 6,462 47,335 88,822
Total equity 256,462 297,335 338,822
Liabilities
Non-current Liabilities
Borrowings 14,653,191 14,680,125 14,707,125
Total non-current liabilities 14,653,191 14,680,125 14,707,125
Current Liabilities
Trade and other payables 166,516 186,163 214,341
Total current liabilities 166,516 186,163 214,341
Total liabilities 14,819,707 14,866,288 14,921,466
Total equity and liabilities 15,076,169 15,163,623 15,260,288
Ratio Analysis
Current ratio 1.96x 2.22x 2.38x
Net Debt / Total Equity 56.67x 49.23x 43.32x
Source: Audited Financial Statements and management information
As at 31 December 2017, the Issuer had €15 million in total assets of which €14.75 million consisted
of loans to MMH Malta Limited and MMH Holdings Limited, which are projected to continue to be
carried until eventual redemption in 2026. The Issuer had a cash balance of €42k.
Total equity and liabilities of €15 million, primarily comprised of the €14.7 million Bond issue and
equity of €0.3 million.

FINANCIAL ANALYSIS SUMMARY Mediterranean Maritime Hub Finance p.l.c.
19
4.7 Cash flow Statement - Issuer
€ FY16A FY17A FY18F
Cash flows from operating activities
Cash used in operations (26,426) (77,571) (10,961)
Net operating cash flows (26,426) (77,571) (10,961)
Cash flows used in investing activities
Proceeds of loans and receivables from
subsidiaries
(14,750,000) - -
Net cash used in investing activities (14,750,000) - -
Cash flows from financing activities
Issue of share capital 250,000 - -
Issue of €15,000,000 4.8% bonds 15,000,000 - -
Bond issue costs (354,188) - -
Net cash from financing activities 14,895,812 - -
Net movement in cash flows 119,386 (77,571) (10,961)
Cash and cash equivalents at beg of year - 119,386 41,815
Cash and cash equivalents at end of year 119,386 41,815 30,854
Source: Audited Financial Statements and management information
During FY17 the Issuer registered a net cash outflow generated from the operating activities of
€77,571. As a result, the net cash balance at the end of the financial year decreased to €41,815.
4.8 Variance analysis - Issuer
€ FY17A FY17F Variance
Finance Income 877,625 907,000 (29,375)
Finance Costs (746,934) (750,000) 3,066
Net Interest Income 130,691 157,000 (26,309)
Administrative Expenses (67,810) (140,000) 72,190
Profit / (Loss) before tax 62,881 17,000 45,881
Tax expense (22,008) (6,000) (16,008)
Profit for the year 40,873 11,000 29,873
Source: Audited Financial Statements and management information
The Issuer registered lower than expected administrative expenses as a result of lower Bond related
expenses. This resulted in a higher than expected profit after tax for the year 2017.
FINANCIAL ANALYSIS SUMMARY Mediterranean Maritime Hub Finance p.l.c.
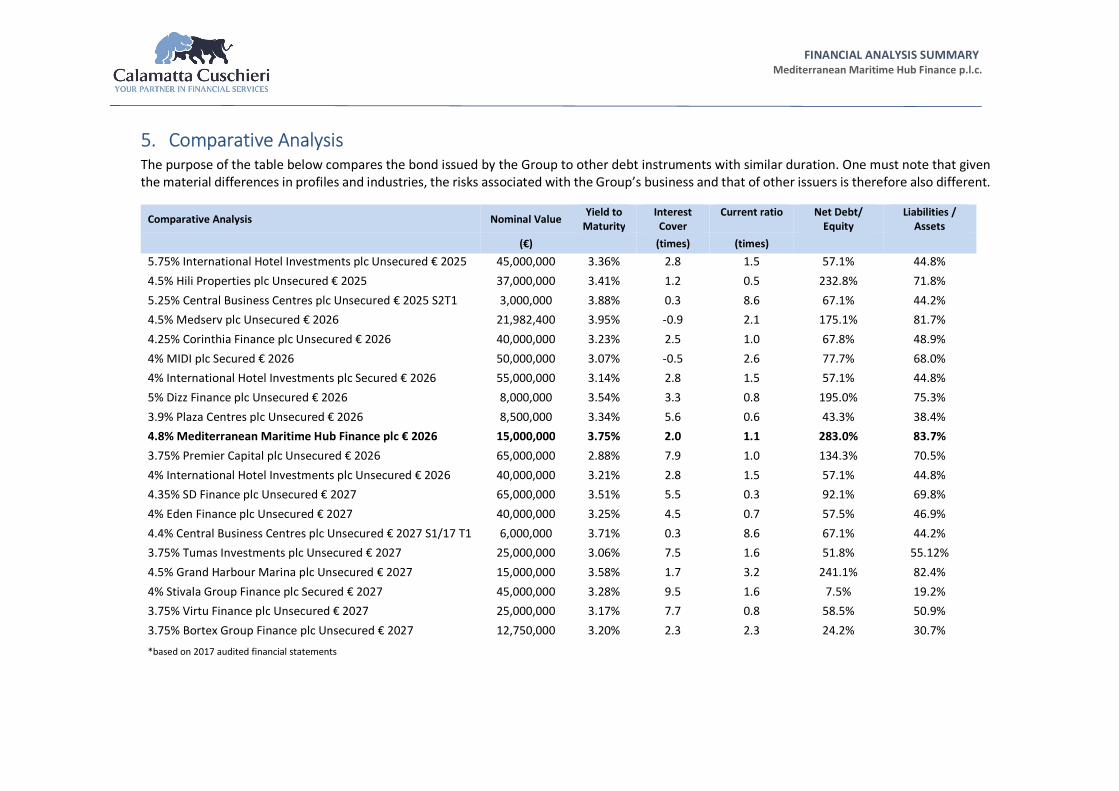
5. Comparative Analysis
The purpose of the table below compares the bond issued by the Group to other debt instruments with similar duration. One must note that given
the material differences in profiles and industries, the risks associated with the Group’s business and that of other issuers is therefore also different.
Comparative Analysis Nominal Value Yield to
Maturity
Interest
Cover
Current ratio Net Debt/
Equity
Liabilities /
Assets
(€) (times) (times)
5.75% International Hotel Investments plc Unsecured € 2025 45,000,000 3.36% 2.8 1.5 57.1% 44.8%
4.5% Hili Properties plc Unsecured € 2025 37,000,000 3.41% 1.2 0.5 232.8% 71.8%
5.25% Central Business Centres plc Unsecured € 2025 S2T1 3,000,000 3.88% 0.3 8.6 67.1% 44.2%
4.5% Medserv plc Unsecured € 2026 21,982,400 3.95% -0.9 2.1 175.1% 81.7%
4.25% Corinthia Finance plc Unsecured € 2026 40,000,000 3.23% 2.5 1.0 67.8% 48.9%
4% MIDI plc Secured € 2026 50,000,000 3.07% -0.5 2.6 77.7% 68.0%
4% International Hotel Investments plc Secured € 2026 55,000,000 3.14% 2.8 1.5 57.1% 44.8%
5% Dizz Finance plc Unsecured € 2026 8,000,000 3.54% 3.3 0.8 195.0% 75.3%
3.9% Plaza Centres plc Unsecured € 2026 8,500,000 3.34% 5.6 0.6 43.3% 38.4%
4.8% Mediterranean Maritime Hub Finance plc € 2026 15,000,000 3.75% 2.0 1.1 283.0% 83.7%
3.75% Premier Capital plc Unsecured € 2026 65,000,000 2.88% 7.9 1.0 134.3% 70.5%
4% International Hotel Investments plc Unsecured € 2026 40,000,000 3.21% 2.8 1.5 57.1% 44.8%
4.35% SD Finance plc Unsecured € 2027 65,000,000 3.51% 5.5 0.3 92.1% 69.8%
4% Eden Finance plc Unsecured € 2027 40,000,000 3.25% 4.5 0.7 57.5% 46.9%
4.4% Central Business Centres plc Unsecured € 2027 S1/17 T1 6,000,000 3.71% 0.3 8.6 67.1% 44.2%
3.75% Tumas Investments plc Unsecured € 2027 25,000,000 3.06% 7.5 1.6 51.8% 55.12%
4.5% Grand Harbour Marina plc Unsecured € 2027 15,000,000 3.58% 1.7 3.2 241.1% 82.4%
4% Stivala Group Finance plc Secured € 2027 45,000,000 3.28% 9.5 1.6 7.5% 19.2%
3.75% Virtu Finance plc Unsecured € 2027 25,000,000 3.17% 7.7 0.8 58.5% 50.9%
3.75% Bortex Group Finance plc Unsecured € 2027 12,750,000 3.20% 2.3 2.3 24.2% 30.7%
*based on 2017 audited financial statements

FINANCIAL ANALYSIS SUMMARY Mediterranean Maritime Hub Finance p.l.c.
As at 18th June 2018, the average spread over the Malta Government Stock (MGS) for corporates with
maturity range of seven-nine years was 238 basis points. The 4.8% MMHF Bond maturing on the
14/10/2026 was yielding 380 basis points to maturity and an equivalent spread of 269 basis points over
the current Malta Government Stock Yield with the same maturity.
4.8% MMH
0.0%
0.5%
1.0%
1.5%
2.0%
2.5%
3.0%
3.5%
4.0%
4.5%
13/05/2025 12/04/2026 07/10/2026 25/04/2027 23/08/2027
Yield Curve Analysis
Yield to Maturity Adj MGS Yield Spread

FINANCIAL ANALYSIS SUMMARY Mediterranean Maritime Hub Finance p.l.c.
22
6. Glossary and Definitions
Income Statement
Revenue Total revenue generated by the Group from its business activities during the
financial year, that is, the operations of BCT and EQR
Operating Expenses Operating expenses include the cost of terminal operations and
management expenses in maintaining the investment property of EQR.
EBITDA EBITDA is an abbreviation for earnings before interest, tax, depreciation and
amortisation. EBITDA can be used to analyse and compare profitability between
companies and industries because it eliminates the effects of financing and
accounting decisions.
Profit after tax Profit after tax is the profit made by the Group during the financial year both from
its operating as well as non-operating activities.
Profitability Ratios
Operating profit
margin
Operating profit margin is operating income or EBITDA as a percentage of total
revenue.
Net profit margin Net profit margin is profit after tax achieved during the financial year
expressed as a percentage of total revenue.
Profit before Tax (PBT) Profit before Tax is the profit is achieved during the financial year after deducting
all relevant expenses including interest expenses. This however does not include
tax expense.
Efficiency
Return on Equity Return on equity (ROE) measures the rate of return on the shareholders’ equity of
the owners of issued share capital, computed by dividing profit after tax by average
shareholders’ equity during the relevant financial year.
Return on capital
employed
Return on capital employed (ROCE) indicates the efficiency and profitability of a
company’s capital investments, estimated by dividing operating profit by capital
employed.
Return on Assets Return on assets (ROA) is computed by dividing profit after tax by total assets.
Equity Ratios
Earnings per share Earnings per share (EPS) is the amount of earnings per outstanding share of a
company’s share capital. It is computed by dividing net income available to equity
shareholders by total shares outstanding as at balance sheet date
Cash Flow Statement
Cash flow from
operating activities
Cash generated from the principal revenue-producing activities.
Cash flow from
investing activities
Cash generated from the activities dealing with the acquisition and disposal of long-
term assets and other investments.
Cash flow from
financing activities
Cash generated from the activities that result in change in share capital and
borrowings.
Balance Sheet
Non-current assets Non-current asset are the Group’s long-term investments, which full value will not
be realised within the accounting year. Non-current assets are capitalised rather
than expensed, meaning that the Group allocates the cost of the asset over the
number of years for which the asset will be in use, instead of allocating the entire
cost to the accounting year in which the asset was purchased. Such assets include

FINANCIAL ANALYSIS SUMMARY Mediterranean Maritime Hub Finance p.l.c.
23
intangible assets (goodwill on acquisition), investment properties, and property,
plant & equipment.
Current assets Current assets are all assets of the company, which are realisable within one year
from the balance sheet date. Such amounts include inventory, accounts receivable,
cash and bank balances.
Current liabilities All liabilities payable by the company within a period of one year from the balance
sheet date, and include accounts payable and short-term debt.
Net debt Borrowings before unamortised issue costs less cash and cash equivalents.
Non-current liabilities The company’s long-term financial obligations that are not due within the present
accounting year. The Company’s non-current liabilities include bank borrowings
and bonds.
Total equity Total equity includes share capital, reserves & other equity components, and
retained earnings.
Financial Strength Ratios
Liquidity ratio The liquidity ratio (also known as current ratio) is a financial ratio that measures
whether or not a company has enough resources to pay its debts over the next 12
months. It compares a company’s current assets to its current liabilities.
Interest cover The interest coverage ratio is calculated by dividing a company’s EBITDA of one
period by the company’s finance costs of the same period.
Gearing ratio The gearing ratio indicates the relative proportion of shareholders’ equity and debt
used to finance a company’s assets, and is calculated by dividing a company’s net
debt by net debt plus shareholders’ equity.