Embed Size (px)
Citation preview

1
Financial Analysis of California State University, Maritime
Howard BunsisProfessor of Accounting, Eastern Michigan University
Chair, AAUP Collective Bargaining CongressMarch 2014

2
Financial Condition of Cal Maritime –
Ratio Analysis

Three main topics:• CMA is financially in very good shape looking
at reserves , cash flows and revenues• In spite of that, they are spending their money
on things other than instruction and faculty.• CMA has enough money for equity 3, increase
in cruise salaries, increase in international program salaries, putting money into ship’s ventilation system, and other items.

4
Cal Maritime Net Asset DetailSource: CSU Audited Financial Statements
• The first two categories of net assets do not tell us anything about the financial health or flexibility of CSUM
• The latter two categories – expendable and unrestricted, tell us something, as they are the two components of reserves

5
Cal Maritime ReservesSource: CSU Audited financial Statements
6
Cal Maritime Reserves in Context
• For reserves, we need context: How large is $24.8 Million?• We compare reserves to total expenses, creating the primary reserve ratio,
which is defined as reserves over total expenses. Total expenses is a proxy for the size of the university
• The increase from 2012 to 2013 was due to increase in funds for the capital PA project
• Many also analyze the ratio using just unrestricted reserves in the numerator, which the last row reports
• What is a good primary reserve ratio? See next slide
Furlough Period
2009-10

7
Primary Reserve Ratio in Context

8
Data Behind Cash FlowsSources: CSU Audited Statements and IPEDS

9
Cash Flow Ratio in Context

10
Discussion of Cash Flows• The two strongest factors in concluding that Cal Maritime is in strong financial
position are the reserves and cash flows.• Operating cash flows considers:
– All cash in, from the state, tuition, grants, contracts,– Less all cash out, to employees, benefits, vendors, utilities
• In 2013, CSUM had over $7.3 million in operating cash flows; this is a large surplus in the context of the size of the institution.
• In years prior to 2012, cash flows have been strong as well.• The down year was 2009, which is expected.• The method used to estimate cash flows in 2009 and 2011 was very
conservative, and likely under-estimated operating cash flows in those years.• Bottom line: The administration is generating significant excess operating cash
flows every year, and we will see that the small amount of additional compensation requested for TSGB is well within the surpluses being generated.

11
What Do We Learn from the Ratios?
• The ratios tell us that up through 2013, Cal Maritime is in solid financial condition – and in better condition than the CSU System as a whole. This conclusion is based on solid reserves and very strong cash flows.
• Does this mean the administration should spend the reserves? No. Reserves are there for a rainy day, and there is a minimum level of reserves that should be kept (primary reserve ratio of 20%).
• Still, any claims that there is no money, or that we must make future cuts, are dubious at best.
• We will soon analyze what is happening going forward; but there definitely are sufficient resources for new projects and initiatives, as well as additional compensation for TSGB activities

12
Cal Maritime Revenue Analysis

13
Total Cal Maritime Revenues Over TimeSource: CSU Audited Financial Statements
Large increase in 2013 was mostly due to a large increase in tuition revenue

14
Percentage Change in State Appropriation: CSU System vs. Cal Maritime
Source: CSU Audited Financial Statements
• The changes for the entire system were more negative than for CSUM• Over the long term (2008 to 2013), the change for Maritime is actually
positive, versus -30% for the system as a whole

15
Priorities of the Administration:
Are They Being True to the Core Academic Mission?

16
CSUM Expense DistributionSource: OUS Audited Financial Statements
• Not even $1 of every $3 goes to instruction• The percent devoted to instruction has gone down over
time, including a large drop from 2012 to 2013

17
Cal Maritime Total Salaries and Benefits in Context: Source: IPEDS (Integrated Postsecondary Education Data System of the US Dept. of Education)
IPEDS data is only available through 2012
• For Cal Maritime, personnel costs are 53% of total expenses, down from 63% just 5 years ago
• There has been a much larger increase in benefits costs than in salary costs

18
Comparison of Top CSUM Administrative Salaries Over TimeSource: http://www.sacbee.com/statepay/#req=employee%2Ftop%2Fyear%3D2013
• In 2012, 13 administrators made more than $100,000 (the number would likely have been 15 if positions were filled all year)
• In 2013, 18 administrators made more than $100,000

Number of Employees, FTE BasisSource: http://www.calstate.edu/budget/final-budget-summaries/
19
• Number of management employees over the number of academic employees. We will compare this to the other CSU institutions
• It is not appropriate that this ratio is increasing over time

Enrollment Details: By Major 07-13Source: h J p://www.csum.edu/web/registrar/enrollment
20
Fall 2007 Fall 2008 Fall 2009 Fall 2010 Fall 2011 Fall 2012 Fall 2013Business Administration 83 67 68 101 116 137 142Facilities Engineering Tech 34 29 25 17 22 29 47Global Studies & Maritime Aff 77 107 102 112 102 112 127Marine Engineering Technology 157 141 155 166 165 199 193Marine Transportation 310 331 328 324 318 312 323Mechanical Engineering H License Track 131 135 144 114 133 155 206Mechanical Engineering H Unlicense Track 0 0 0 21 31 31 7Undeclared 35 1 1 2 2 1 1Undeclared (Cruise) 0 65 0 0 0 0 0Total 827 876 823 857 889 976 1,046
Changes, Fall 2007 to Fall 2013 Number Percent % of Total, Fall 13
Business Administration 59 71% 14%
• Marine Transportation is the
largest major
• ME grew largest in #
• Business grew largest in %
Facilities Engineering Tech 13 38% 4%Global Studies & Maritime Aff 50 65% 12%Marine Engineering Technology 36 23% 18%Marine Transportation 13 4% 31%
Mechanical Engineering H License Track 75 57% 20%All Other (27) 1%Total Change From 2007 to 2013 219 +26%

Instructi onal Salaries and Benefits Compared to Total Expenses per IPEDS
• That is right: Only 19.6 cents of every dollar goes to pay people who teach class
• When the 2013 IPEDS data gets reported in April of 2014. we will see if this 19.6% actually got lower
21
2008 2009 2010 2011 2012
Instruction Salaries+ Benefits
8,577,505 8,527,508 7,786,024 8,998,195 8,174,271
Total Cal Maritime Expenses
32,344,933 35,056,842 34,398,506 40,485,662 41,755,000
Instruction Salaries + Benefits as a % of Total Cal Maritime Expenses
26.5% 24.3% 22.6% 22.2% 19.6%

22
Percentage Change in the Number of Employees by Category: 2007-08 to 2013-14
Source: http://www.calstate.edu/budget/final-budget-summaries/

23
Ratio of Management Employees to Academic Employees, All CSU Institutions
Source: http://www.calstate.edu/budget/final-budget-summaries/

24
Data For Ratio of Management Employees to Academic Employees
Source: http://www.calstate.edu/budget/final-budget-summaries/
• Maritime is by far the smallest institution, and the ratio is going to be higher
• However, the number of upper level administrators seems high even for the size of Maritime; Stanislaus has only 16 more admins, but has 325 more academic instructors
25
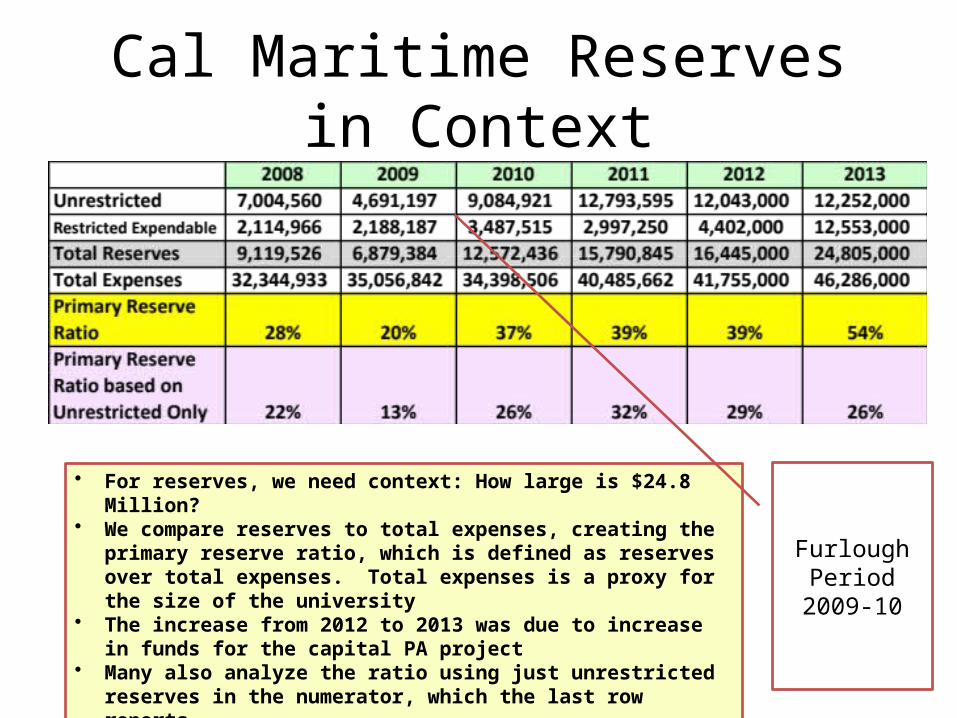
Cal Maritime 2013 Faculty Salaries vs. Peers- LevelsSources: AAUP Salary Survey and IPEDS
• Very few of the comparable institutions reported instructor and lecturer salaries; historically, that data has not been reliable, as different institutions use different definitions for those categories
• Ferris State and Galveston data is for the entire university

26
Cal Maritime Faculty Salaries vs. Peers - Changes from 2008 to 2013
Sources: AAUP Salary Survey and IPEDS

27
Discussion of Faculty Salaries• In terms of levels, salaries for Cal Maritime faculty have
not increased much over time. The associate professor salary in 2008 may be high, but Associates has not seen large increases over the last few years
• In terms of peers, Cal Maritime faculty are now middle of the pack, after having been significantly ahead of these peers just a few years ago. Given the cost of living in this area, and general inflation, faculty salaries have not done well over the last several years
• In general, efforts should be made to move faculty salaries to an appropriate place versus peers, and consider the cost of living generally and the cost of living in California versus other states. The resources exist for this to happen.

See The Report
• www.calfac.org\calmaritime

29
Conclusions
Priorities of the Administration
• Appropriation and enrollment in 2014 and 2015 are up for the CSU System, and state tax revenues are higher
• Despite a huge decline in the state appropriation, reserves and cash flows are very solid.
• Any claim of financial hardship are not supported by the evidence – CSUM is NOT BROKE!
• The number of Cal Maritime administrators has increased, especially when compared to faculty
• Pay for faculty is lagging peers
The Financial Condition of CSU System and the
State of CA
Financial Condition of Cal Maritime