Embed Size (px)
Citation preview

November 25, 2019EPS Holdings, Inc.
Chairman & CEOYan Hao
Financial Results Overviewfor the Fiscal Year Ended September 30, 2019 (FY2019)
EPS Holdings, Inc.

Contents
Copyright © 2019 EPS All rights reserved. 2
Overview for FY2019 Financial Results1FY2020 Full-Year Plan2
Revision of Mid-Term Business Plan3Shareholder Returns4

Copyright © 2019 EPS All rights reserved. 3
1 Overview for FY2019 Financial Results

Copyright © 2019 EPS All rights reserved. 4
FY2019: EPS Group Business Areas
EPS International HoldingsEPS EKISHIN, EPS (China)
EP-PharmaLine, ACM(CSO)
CRO
SMO
CSO
GlobalResearch
China
NRO
Others
EP-SOGO
EP-CRSU, EP-Techno
As of September 2019
EP Yamanashi3 Chinese data service companies
Notes: 1. From March 2019, AC MEDICAL has been included in the CRO and CSO segments due to an M&A deal.
2. From FY2019, former e-Trial has been reclassified from the CRO tothe NRO segment and was renamed as EP-Techno upon absorbingAll Right Technology in April 2019.
Chinese CRO operating companiesOther overseas operating companies
Shanghai Hua XinET MEDICAL TECHNOLOGY (SUZHOU) CO., LTD.
Other Chinese operating companies
EPS, ACM(CRO)
EPBiz (Shared Services)
Dom
esticBusiness
Overseas
Business
ES-Link
EPS Associate

Copyright © 2019 EPS All rights reserved.
FY2019 Consolidated Financial Results(¥million)
5
FY2018Results
FY2019 InitialForecast
FY2019 Revised Plan(Announced August 1)
FY2019Results
Percent Change vs
Initial Forecast
Percent Change vs
Revised Plan
Percent Change
YoY
Net Sales 65,769 72,000 68,100 69,009 -4.2% 1.3% 4.9%
OperatingIncome 7,193 7,200 5,700 6,279 -12.8% 10.2% -12.7%(Ratio) (10.9%) (10.0%) (8.4%) (9.1%)Recurring
Profit 7,436 7,350 5,800 6,271-14.7% 8.1% -15.7%
(Ratio) (11.3%) (10.2%) (8.5%) (9.1%)Profit
Attributable to
Owners ofParent
4,388 4,700 3,000 3,633-22.7% 21.1% -17.2%
(Ratio) (6.7%) (6.5%) (4.4%) (5.3%)

Copyright © 2019 EPS All rights reserved.
FY2019 Financial Results by Business Segment
6
FY2019 InitialForecast
FY2019Results
Percent Change vs
Initial Forecast
Percent Change vs
Revised Plan
Percent Change
YoY
Dom
estic
CRONet Sales 31,650 28,908 -8.7% 1.2% 0.3%Operating
Income (%) 6,300(19.9%) 5,031 (17.4%) -20.1% 2.3% -20.6%
SMONet Sales 14,300 14,339 0.3% 0.3% 0.3%Operating
Income (%) 1,450 (10.1%) 1,679 (11.7%) 15.8% 8.3% 32.3%
CSONet Sales 8,500 9,399 10.6% 0.7% 20.3%Operating
Income (%) 406 (4.8%) 489 (5.2%) 20.4% 1.9% 27.3%
NRONet Sales 6,000 5,829 -2.9% -1.2% 117.9%Operating
Income (%) 355 (5.9%) 428 (7.3%) 20.6% 7.0% 41.3%
Overseas
GRNet Sales 4,500 3,990 -11.3% 8.7% -19.3%Operating
Income (%) 10 (0.2%) -3 (-) - - -
ChinaNet Sales 11,280 11,543 2.3% -3.8% 4.1%Operating
Income (%) 130 (1.2%) 381 (3.3%) 193.1% -4.8% 214.9%Notes: 1. The CRO segment in the earnings report (kessan tanshin) includes the NRO segment.
2. The calculation of segment operating income(1) Does not include management advisory fees for the holding company, and (2) Includes amortization of goodwill and outsourcing expenses for shared services.
(¥million)

Copyright © 2019 EPS All rights reserved. 7
FY2019 Overview of Financial Results
Overview of Consolidated Financial Results
Net sales・ Net sales decreased by 4.2% as strong performance in CSO versus
the initial forecast was offset by a significant shortfall in CRO and GR
・ Net sales in GR were down year on year, mainly reflecting the impact of losing an order for a major project
・ Net sales in the other segments increased due to strong performance and the effect of M&As
Operating income・ Operating income was 12.8% lower than the initial forecast due to
a significant shortfall in CRO・ In other segments, operating income increased, generally
exceeding the forecast・ Year on year, operating income decreased, as strong performance
in other segments was unable to absorb the decrease in the CRO segment
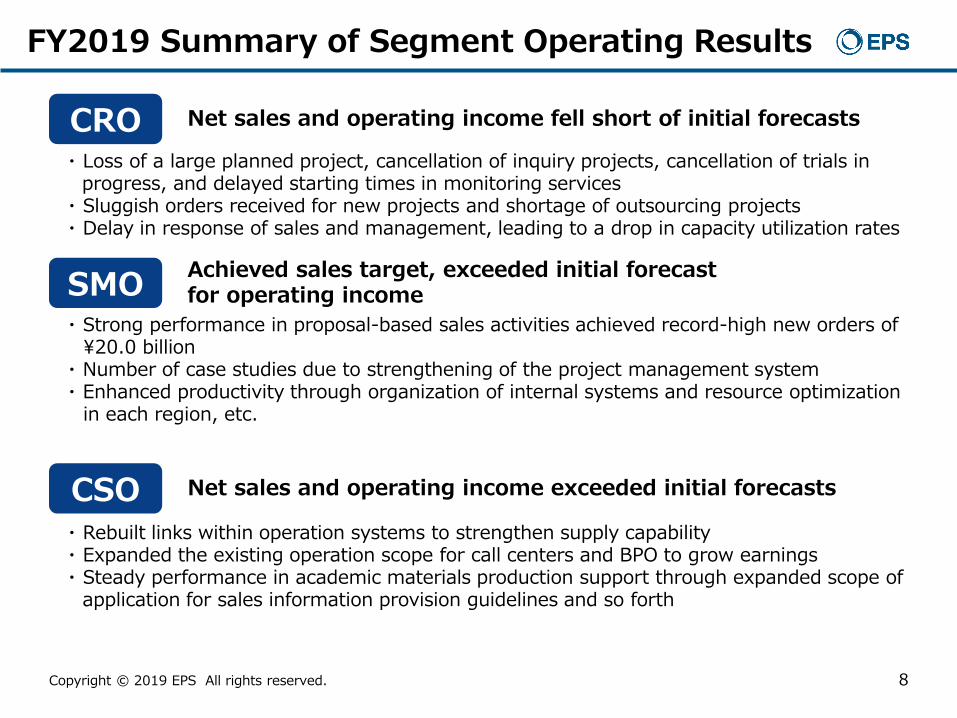
・ Rebuilt links within operation systems to strengthen supply capability・ Expanded the existing operation scope for call centers and BPO to grow earnings・ Steady performance in academic materials production support through expanded scope of
application for sales information provision guidelines and so forth
・ Strong performance in proposal-based sales activities achieved record-high new orders of¥20.0 billion
・ Number of case studies due to strengthening of the project management system・ Enhanced productivity through organization of internal systems and resource optimization
in each region, etc.
・ Loss of a large planned project, cancellation of inquiry projects, cancellation of trials inprogress, and delayed starting times in monitoring services
・ Sluggish orders received for new projects and shortage of outsourcing projects・ Delay in response of sales and management, leading to a drop in capacity utilization rates
Copyright © 2019 EPS All rights reserved. 8
FY2019 Summary of Segment Operating Results
CRO Net sales and operating income fell short of initial forecasts
SMO Achieved sales target, exceeded initial forecast for operating income
CSO Net sales and operating income exceeded initial forecasts

Copyright © 2019 EPS All rights reserved. 9
GR Net sales and operating income fell short of initial forecasts
・ Intensified competition with global CROs, loss of large projects, and delays in development・ Started rebuilding CRO business in China・ Reduced losses by optimizing other overseas bases
NRO Net sales slightly short of target, operating income exceeded initial forecast
・ Smaller scale clinical research projects and delays in progress of undertaken outsourcing projects
・ Maintained capacity utilization rates due to steady orders received for investigator-initiated clinical trials
・ In pharmaceutical IT, firm external sales of electronic data capture (EDC) systems such as e-Catch
Net sales and operating income exceeded initial forecasts
・ Strong sales in the pharmaceutical business・ Sales of medical devices grew with progress in opening up the market・ Organized the product portfolio and concentrated management resources on profitable
products
FY2019 Summary of Segment Operating Results
China

Copyright © 2019 EPS All rights reserved. 10
FY2019 Topics (M&A, Alliances)・CRO and CSO Acquisition of AC MEDICAL INC. (concluded on February 28, 2019)
For the purpose of expanding the Group’s customer base, enhancing resources, and sharing technological knowledgeAcquisition of AC MEDICAL as a company that provides services with high added value with the blending of human resources and IT
・NRO Acquisition of All Right Technology Inc. (concluded on November 1, 2018)
Integrated specialized clinical research services and medical IT services to build a platform to support next-generation pharmaceutical development
・Capital participation in CRO (TTC) for health foodsEntry into undeveloped clinical testing market for health foods, etc. Development of new customers (markets) and relationship building through sales activities targeting food-related companies
・EKISHIN Owned of Suzuken (Shenzhen) in the groupBuilt a value chain for spreading products made by Japanese pharmaceutical companies more efficiently and effectively in China by strengthening functions for academic sales promotion and distribution control in China
・GR Strategic partnership with George Clinical Pty Ltd (Australia)(April 2019)
Concluded a strategic partnership with George Clinical Pty Ltd to pursue strengthened supply capability and to expand orders in the Asia-Pacific region

Copyright © 2019 EPS All rights reserved. 11
2 FY2020 Full-Year Plan

Copyright © 2019 EPS All rights reserved. 12
FY2020: EPS Group Business Areas
EP Yamanashi3 Chinese data service companies
Chinese CRO operating companiesOther overseas operating companies
Notes: 1. EPS Associates merged with EPS International in October 20192. Suzuken (Shenzhen) was added from the current fiscal year
Shanghai Hua XinET MEDICAL TECHNOLOGY (SUZHOU) CO., LTD.Suzuken (Shenzhen)Other Chinese operating companies
(absorption-type merger with the former EPS Associates Co., Ltd.)
EPS International Holdings
EPS EKISHIN, EPS (China)
EP-PharmaLine, ACM(CRO: merger planned)
CRO
SMO
CSO
GlobalResearch
China
NRO
Others
EP-SOGO
EP-CRSU, EP-Techno
EPS, ACM(CRO: merger planned)
EPBiz (Shared Services)
Dom
esticBusiness
Overseas
Business
ES-Link

Copyright © 2019 EPS All rights reserved.
FY2020 Consolidated Annual Budget
13
FY2019Results
FY2020 Forecast
ChangeYoY
Percent Change YoY
Net Sales 69,009 72,500 3,491 5.1%
OperatingIncome 6,279 6,170
-109 -1.7%(Ratio) (9.1%) (8.5%)
RecurringProfit 6,271 6,320
49 0.8%(Ratio) (9.1%) (8.7%)
ProfitAttributable to
Owners ofParent
3,633 3,540-93 -2.6%
(Ratio) (5.3%) (4.9%)
(¥million)

Copyright © 2019 EPS All rights reserved.
FY2020 Annual Budget by Segment
14
(¥million)
FY2019Results
FY2020 Forecast ChangeYoY
Percent Change YoY
Dom
estic
CRONet Sales 28,908 28,600 -308 -1.1%Operating
Income (%) 5,031 (17.4%) 5,168 (18.1%) 137 2.7%
SMONet Sales 14,339 15,000 661 4.6%Operating
Income (%) 1,679 (11.7%) 1,757 (11.7%) 78 4.6%
CSONet Sales 9,399 10,800 1,401 14.9%Operating
Income (%) 489 (5.2%) 641 (5.9%) 152 31.1%
NRONet Sales 5,829 6,500 671 11.5%Operating
Income (%) 428 (7.3%) 450 (6.9%) 22 5.1%
Overseas
GRNet Sales 3,990 5,100 1,110 27.8%Operating
Income (%) -3 (-) 50 (1.0%) 53 -
ChinaNet Sales 11,543 12,000 457 4.0%Operating
Income (%) 381 (3.3%) 150 (1.3%) -231 -60.6%Notes: 1. The CRO segment in the earnings report (kessan tanshin) includes the NRO segment.
2. The calculation of segment operating income(1) Does not include management advisory fees for the holding company, and (2) Includes amortization of goodwill and outsourcing expenses for shared services.
3. EPS Associates that was in CRO in the previous fiscal year was transferred to GR

Copyright © 2019 EPS All rights reserved. 15
FY2020 Full-Year Plan Overview
1. Overview of the PlanNet Sales :Internal growth in each segment through strengthening sales capabilities
A decline in sales in the CRO segment is due to the impact of changes in its constituent companies (EPS Associates)
:Advance cost structure reforms in response to changes in the business environmentStrengthen management structure and execute upfront investments as neededPlan for level results year on year
Strengthen sales capability and promote cost management and operation streamliningEffective use of resources by executing regional strategies and facility strategiesIntegrate unique services and differentiate with other companies
Build a solid platform spanning Japan, Asia and China
Integrate specialized services and pharmaceutical IT services
Expand business platform for products businesses
CROSMOCSO
GRNRO
China
2. Overview for Each Segment
OperatingIncome

Copyright © 2019 EPS All rights reserved. 16
3 Revision of Mid-Term Business Plan

Copyright © 2019 EPS All rights reserved. 17
Revision of Mid-Term Business Plan(Consolidated)
(¥million)
First year
Second year
Third year
Fourthyear
Fifthyear
FY2017 FY2018 FY2019 FY2020 FY2021
Results Results Results Forecast for 2020/9
Initial forecast Revised plan
Net sale 60,482 65,769 69,009 72,500 100,000 80,000
Operatingincome 7,591 7,193 6,279 6,170 12,500 8,000
Operating Margin 12.6% 10.9% 9.1% 8.5% 12.5% 10.0%

Copyright © 2019 EPS All rights reserved. 18
Revision of Mid-Term Business Plan(By Segment)
Third year Fourth year Fifth yearFY2019 FY2020 FY2021
ResultsPercent Change
YoYForecast
Percent Change
YoYForecast
Percent Change
YoY
CRO 28,908 0.3% 28,600 -1.1% 30,000 4.9%
SMO 14,339 0.3% 15,000 4.6% 16,000 6.7%
CSO 9,399 20.3% 10,800 14.9% 12,500 15.7%
NRO 5,829 117.9% 6,500 11.5% 8,000 23.1%
GR 3,990 -19.3% 5,100 27.8% 6,500 27.5%
China 11,543 4.1% 12,000 4.0% 14,000 16.7%
(¥million)

Copyright © 2019 EPS All rights reserved. 19
Key Initiatives (1)
Expand and Strengthen Core Businesses
・ Proactive sales activities bringing together front line and management, segments and holding company
・ Front-line driven improvement of existing services and development of new products
・ Strengthen forecast and result management through links with front line
・ Promote project management leveragingGroup strengths
・ Rejuvenate and invigorate segment management teams

Copyright © 2019 EPS All rights reserved. 20
Key Initiatives (2)
Explore New Services and New Businesses
・ Commercialize high-end services, including formulating development plans
・ Develop new business model
・ Develop and create peripheral business through utilization of human resources
・ Build a collaboration network in the academic domain and digitalize clinical studies and clinical research
・ M&As and capital participation focused on business synergies

Copyright © 2019 EPS All rights reserved. 21
Key Initiatives (3)
Advance Platform Development inOverseas Business
GR・ Strengthen support systems for overseas clinical trials of Japanese
customers・ Support for Japanese market entry of overseas customers, particularly
ventures (including Chinese companies)・ Platform development for operations and management systems
China・ Stable operation of existing products businesses
(pharmaceuticals and medical devices)・ Evolve the specialist trading company concept to bridge the Japanese
and Chinese healthcare industries・ Build a joint management structure for Japan and China

Copyright © 2019 EPS All rights reserved. 22
Key Initiatives (4)
Establish Group Management Structure
・ Strengthen business management under “OneEPS” in the holding company
・ Reform cost structure and improve administration and management functionality through personnel system reforms and other means
・ Strengthen education of the next generation of management leaders
Copyright © 2019 EPS All rights reserved. 23
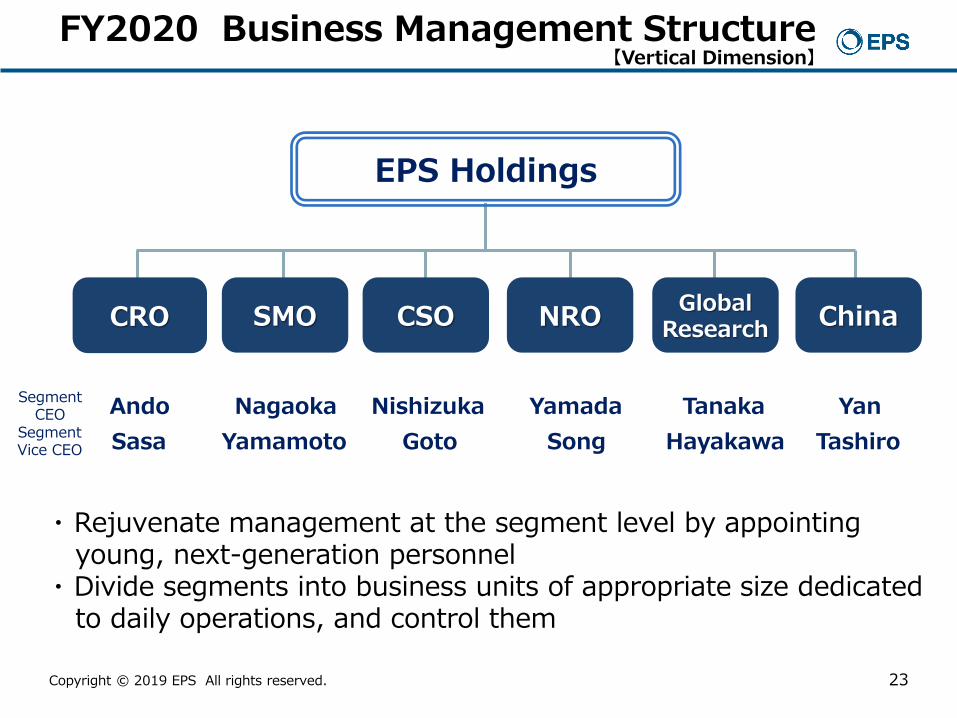
FY2020 Business Management Structure 【Vertical Dimension】
Ando Nagaoka Nishizuka Tanaka YanYamada
SMO CSO GlobalResearchNRO
EPS Holdings
SegmentCEO
ChinaCRO
・ Rejuvenate management at the segment level by appointing young, next-generation personnel
・ Divide segments into business units of appropriate size dedicated to daily operations, and control them
SegmentVice CEO Sasa Yamamoto Goto Song Hayakawa Tashiro
Copyright © 2019 EPS All rights reserved. 24
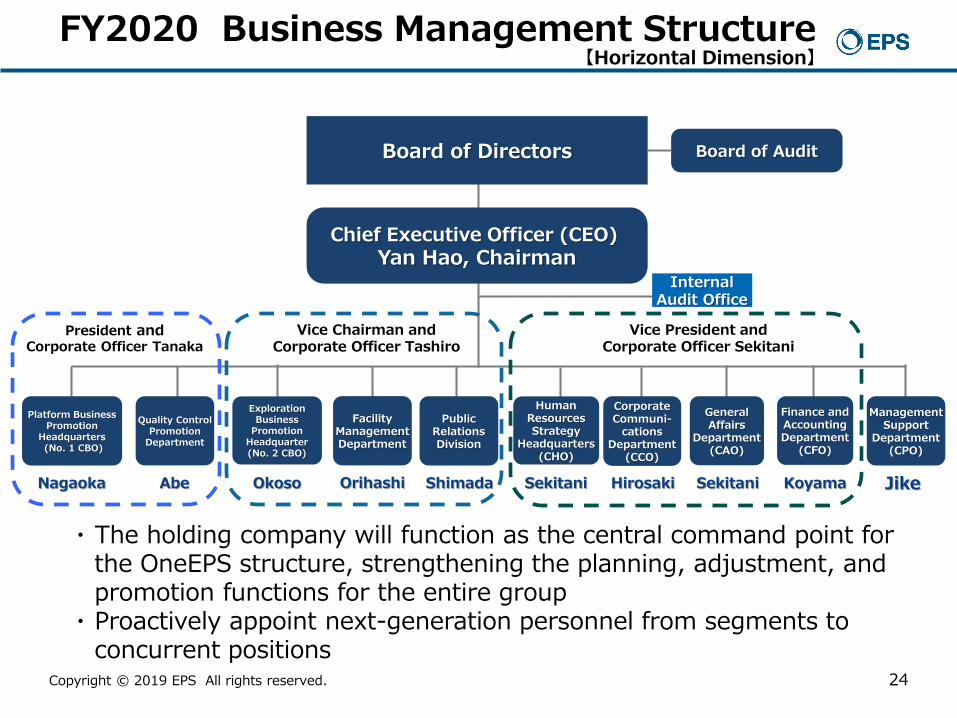
FY2020 Business Management Structure【Horizontal Dimension】
Board of Directors
Chief Executive Officer (CEO)Yan Hao, Chairman
Board of Audit
Platform BusinessPromotion
Headquarters(No. 1 CBO)
CorporateCommuni-
cationsDepartment
(CCO)
Quality ControlPromotion
Department
GeneralAffairs
Department(CAO)
InternalAudit Office
Nagaoka
FacilityManagementDepartment
HumanResourcesStrategy
Headquarters(CHO)
PublicRelationsDivision
・ The holding company will function as the central command point for the OneEPS structure, strengthening the planning, adjustment, and promotion functions for the entire group
・ Proactively appoint next-generation personnel from segments to concurrent positions
Okoso SekitaniHirosakiAbe Sekitani Koyama JikeOrihashi Shimada
Vice Chairman andCorporate Officer Tashiro
Vice President andCorporate Officer Sekitani
President andCorporate Officer Tanaka
Finance andAccountingDepartment
(CFO)
ManagementSupport
Department(CPO)
ExplorationBusiness
PromotionHeadquarter(No. 2 CBO)

Copyright © 2019 EPS All rights reserved. 25
Objectives of Vision30
1. Establish a position as a Solutions Provider in the Healthcare Industry (Solutions provided as infrastructure)
2. Build up business scale to compete effectively with the major global players and strengthen global business expansion
3. Extend independent and autonomous business management and promote Group management
4. Make the EPSWay transparent and instill it in the organization(build a corporate culture)
5. Nurture the next generation of management leaders

Copyright © 2019 EPS All rights reserved. 26
4 Shareholder Returns
Copyright © 2019 EPS All rights reserved. 27
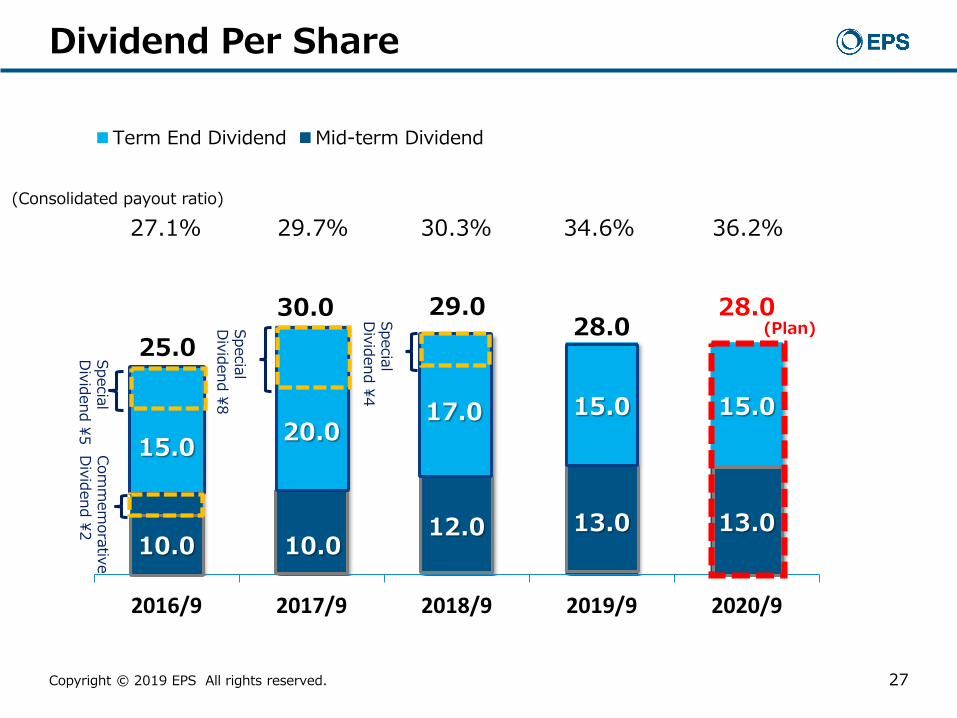
Dividend Per Share
10.0 10.0 12.0 13.0 13.0
15.0 20.0 17.0 15.0 15.0
25.0 30.0 29.0
28.0 28.0
¥0
¥10
¥20
¥30
¥40
¥50
2016/9 2017/9 2018/9 2019/9 2020/9
Term End Dividend Mid-term Dividend
Comm
emorative
Dividend ¥2
(Plan)
(Consolidated payout ratio)
27.1% 29.7% 30.3% 34.6% 36.2%
SpecialD
ividend ¥4
SpecialD
ividend ¥5
SpecialD
ividend ¥8

Copyright © 2019 EPS All rights reserved. 28
Total Return Ratio
684 1,122 1,385 1,323 1,250
1,011
1,988 2,790
0
500
1,000
1,500
2,000
2,500
3,000
3,500
4,000
4,500
Sep-15 Sep-16 2017年9月 2018年9月 2019年9月
Total dividend amountTreasury share repurchase
(¥million, ratio in %)
31.6%
53.8%
30.6%
75.5%
111.2%
2015/9 2016/9 2017/9 2018/9 2019/9

Copyright © 2019 EPS All rights reserved. 29
Thank you for your attention.
Please direct inquiries to Investor Relations, Finance and Accounting Department,
EPS Holdings, Inc.Phone: +81-3-5684-7873 / Email:[email protected]
EPS Holdings, Inc.

Disclaimer
Copyright © 2019 EPS All rights reserved. 30
The earnings forecasts and future predictions described in the document are made by our company based on the available information at the time of the creation of the document, and contain potential risks and uncertainties. Therefore, due to various factors such as changes in the business environment, it is possible that actual earnings results may differ greatly from the future outlook mentioned or described herein.
We have approached the creation of this document with caution, to ensure correctness. However, it is not a guarantee of completeness. Our company cannot be held liable for any problems or damages arising as a result of the information in this document. We appreciate your understanding.
■For inquiries about this documentInvestor Relations, Finance and Accounting Department, EPS Holdings, Inc.Phone: +81-3-5684-7873e-mail: [email protected]