Embed Size (px)
Citation preview
November 2003 Project No. 553-2867-007 (02/02)
Spokane River Hydroelectric Project FERC Project No. 2545
Rainbow Trout Spawning Survey, 2003 Final Report
Prepared for
Fisheries Work Group Spokane River Project Relicensing
Under Contract to
Avista Corporation 1411 Mission
Spokane, Washington
Prepared by
Parametrix 5808 Lake Washington Blvd N.E., Suite 200
Kirkland, WA 98033 (425) 822-8880
www.parametrix.com
Fisheries Work Group 553-2867-007 (02/02) Rainbow Trout Spawning Survey, 2003 – Final Report i November 2003
TABLE OF CONTENTS
1. INTRODUCTION.............................................................................................................................. 1-1 1.1 GENERAL PROJECT AND RELICENSING PROCESS INFORMATION .................... 1-1 1.2 STUDY SPECIFIC BACKGROUND INFORMATION ................................................... 1-1
2. GOAL AND OBJECTIVES .............................................................................................................. 2-1 3. METHODS........................................................................................................................................ 3-1 4. RESULTS......................................................................................................................................... 4-1
4.1 DISTRIBUTION OF RADIO-TAGGED FISH.................................................................. 4-1 4.1.1 Upper River Study Reach....................................................................................... 4-1 4.1.2 Lower River Study Reach ...................................................................................... 4-2
4.2 SPAWNING AREAS.......................................................................................................... 4-3 4.2.1 Upper River Study Reach....................................................................................... 4-4 4.2.2 Lower River Study Reach ...................................................................................... 4-7
4.3 SPAWNING PERIOD ........................................................................................................ 4-8 4.4 REDD COUNTS................................................................................................................. 4-8 4.5 FRY EMERGENCE.......................................................................................................... 4-11 4.6 REDD DE-WATERING ASSESSMENT......................................................................... 4-11
5. DISCUSSION ................................................................................................................................... 5-1 5.1 SPAWNING AREAS.......................................................................................................... 5-1 5.2 SPAWNING PERIOD ........................................................................................................ 5-1 5.3 REDD COUNTS................................................................................................................. 5-1 5.4 FRY EMERGENCE............................................................................................................ 5-4 5.5 REDD DE-WATERING ..................................................................................................... 5-5
6. REFERENCES................................................................................................................................. 6-1
APPENDICES
A Chronology of Spring 2003 Post Falls HED Operations B GPS Coordinates of Rainbow Trout Spawning Areas in the Spokane River, 2003 C Areas Surveyed for Spawning Habitat and Activity in 2003
TABLE OF CONTENTS (Continued)
Fisheries Work Group 553-2867-007 (02/02) Rainbow Trout Spawning Survey, 2003 – Final Report ii November 2003
LIST OF FIGURES
1 Project Area....................................................................................................................................... 1-2
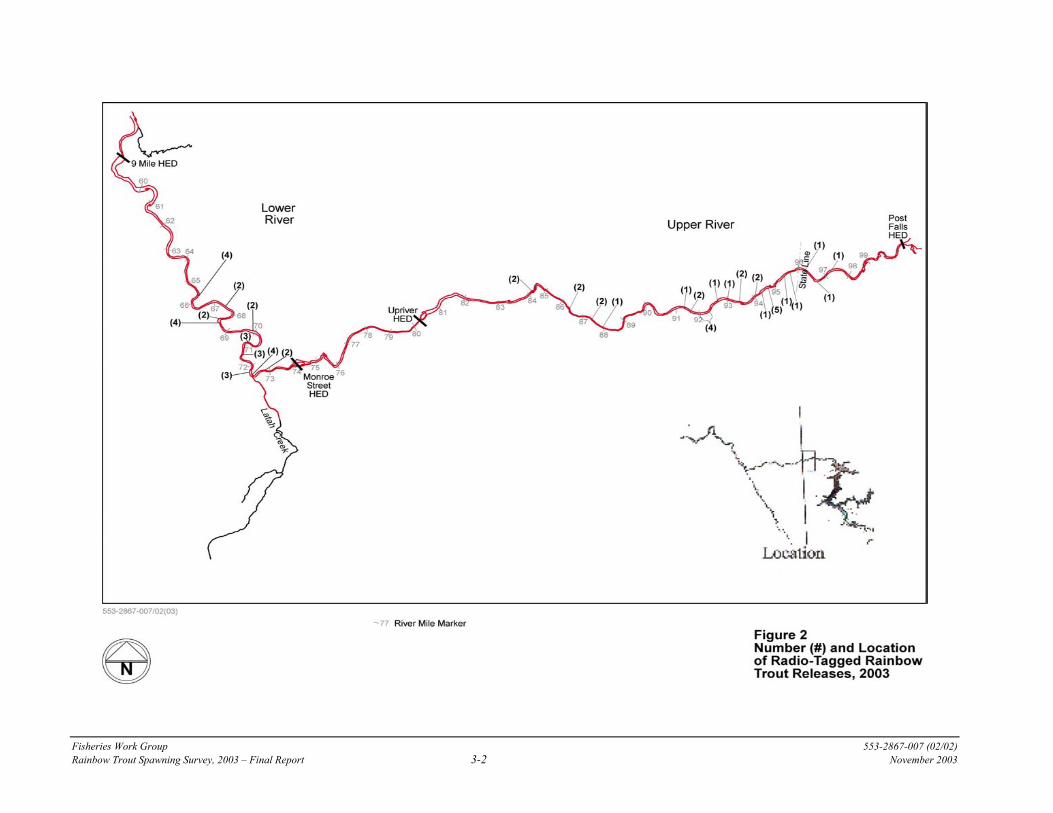
2 Number (#) and Location of Radio-Tagged Rainbow Trout Releases, 2003.................................... 3-2
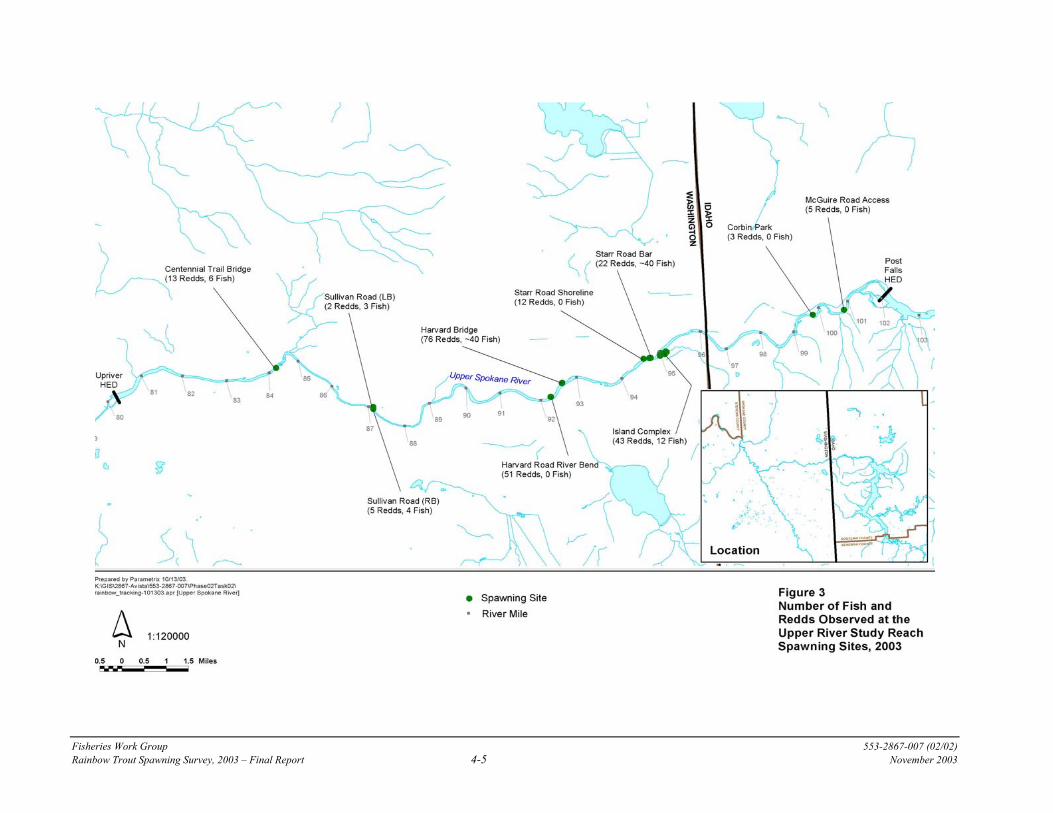
3 Identified Rainbow Trout Spawning Areas, 2003Number of Fish and Redds Observed at the Upper River Study Reach Spawning Sites, 2003 ........................................................................ 4-5
4 Number of Fish and Redds Observed at the Lower River Study Reach Spawning Sites, 2003........ 4-6
5 Spokane River Water Temperatures, 2003........................................................................................ 4-9
6 Distribution of Redds in Quarter-Mile Reaches of the Spokane River, 2003 ................................ 4-10
7 Spawning Period Flows in 2003, Compared to the 1995-2002 Average and Median Flows, Spokane River .......................................................................................................... 5-6
Cover Drawing: Camp on the Spokane River, September 6th, 1858, by Gustaue Sohon
LIST OF TABLES
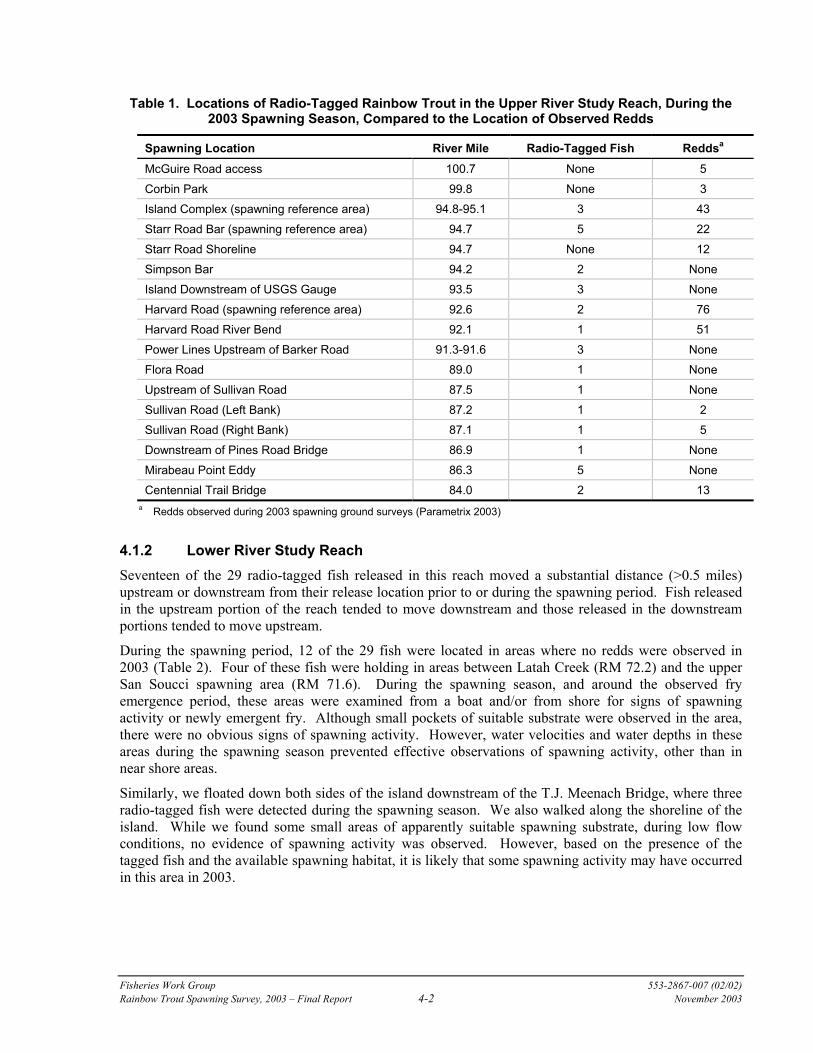
1 Locations of Radio-Tagged Rainbow Trout in the Upper River Study Reach, During the 2003 Spawning Season, Compared to the Location of Observed Redds ................................................... 4-2
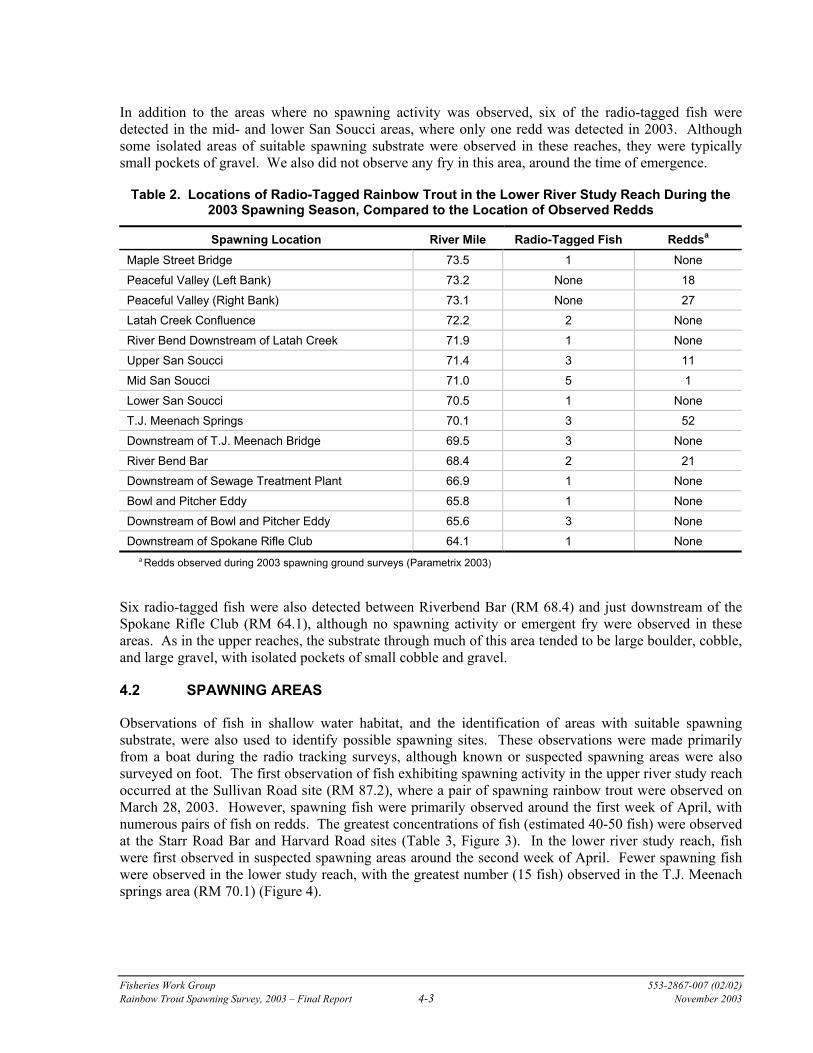
2 Locations of Radio-Tagged Rainbow Trout in the Lower River Study Reach During the 2003 Spawning Season, Compared to the Location of Observed Redds ................................................... 4-3
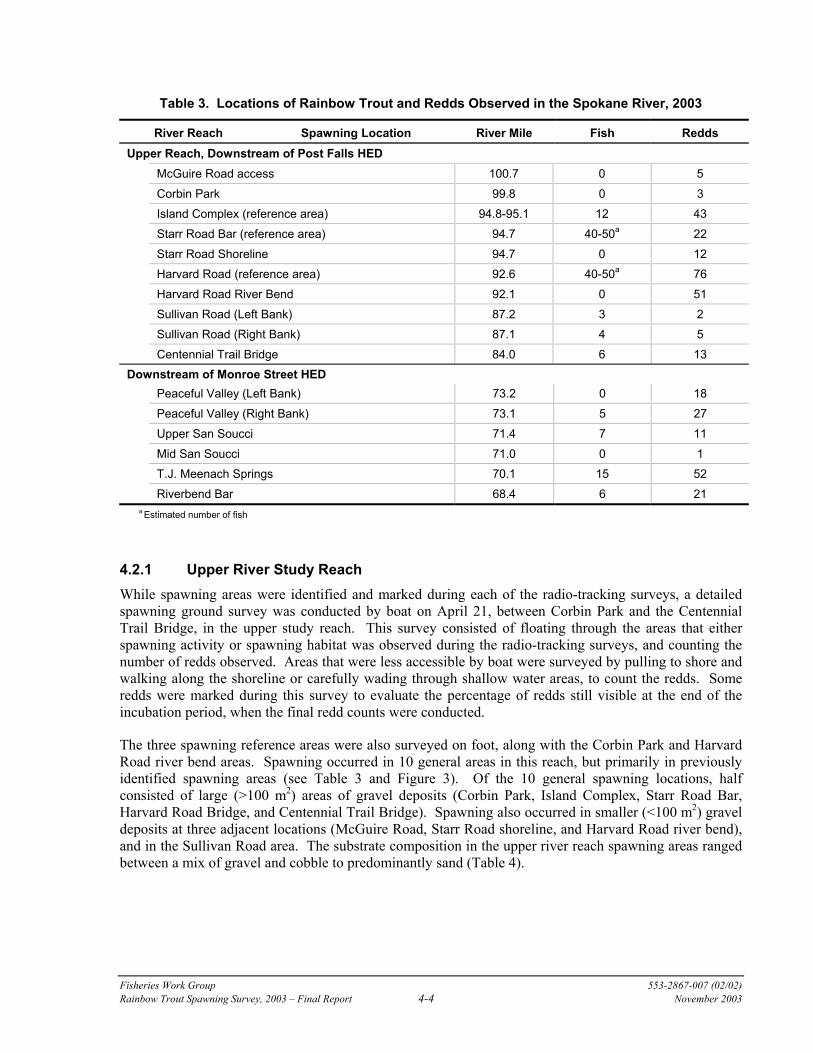
3 Locations of Rainbow Trout and Redds Observed in the Spokane River, 2003 ............................... 4-4 4 Characterization of the Substrate in the Primary Spawning Areas in the Spokane River, 2003 ...... 4-7 5 Comparison of Two Independent Redd Counts in the Three Established Rainbow Trout Spawning
Reference Areas in the Upper Spokane River Study Reach............................................................ 4-11 6 Depth of Various Rainbow Trout Redds Observed in the Upper and Lower River Study Reaches,
Spokane River, 2003 ....................................................................................................................... 4-12 7 Incidence of De-Watered Rainbow Trout Redds Observed in the Spokane River May 23, 24,
and 29, 2003 .................................................................................................................................... 4-13 8 Comparison of Spawning Locations and Number of Redds Observed in the
Upper Spokane River in 2003, with Those Observed in 1995 and 1996 .......................................... 5-2 9 Redd Counts in the Three Established Rainbow Trout Spawning Reference Areas in the
Upper River Reach, Conducted By Avista Personnel, 1995-2003.................................................... 5-2
Fisheries Work Group 553-2867-007 (02/02) Rainbow Trout Spawning Survey, 2003 – Final Report iii November 2003
ACRONYMS
ALP Alternative Licensing Procedures
Avista Avista Corporation
cfs Cubic feet per second
FERC Federal Energy Regulatory Commission
FWG Fisheries Work Group
HEDs Hydroelectric developments
PM&Es protection, mitigation and enhancement measures
RM River mile
Fisheries Work Group 553-2867-007 (02/02) Rainbow Trout Spawning Survey, 2003 – Final Report iv November 2003
SUMMARY
The Spokane River Hydroelectric Project (Spokane River Project, or Project) is owned and operated by Avista Corporation (Avista), pursuant to a license issued by the Federal Energy Regulatory Commission (FERC). The Project includes five distinct hydroelectric developments (HEDs) located along the Spokane River in northern Idaho and eastern Washington: Post Falls (located in Idaho), and Upper Falls, Monroe Street, Nine Mile, and Long Lake HEDs all located in Washington. This report provides results of the rainbow trout (Oncorhynchus mykiss) spawning survey being conducted under the direction of the Fisheries Work Group (FWG) to gather information concerning Project relicensing issues (i.e., related to seeking a new FERC license).
During certain times of the year, the Post Falls HED is able to directly influence Spokane River flows and the associated water level elevations in Coeur d’Alene Lake. At other times of the year, Post Falls HED either does not have the ability to substantially influence river flows, or is operated as a run-of-river project (i.e., outflow from the facility is equal to the inflow). Two substantial lengths of free-flowing river occur downstream of the Post Falls HED, one between Post Falls HED and the reservoir created by the Upriver Project (a City of Spokane project) and another downstream of the Monroe Street HED. For purposes of this study, these two areas are referred to as the upper or lower study reaches.
Previous studies indicate that rainbow trout typically spawn, eggs incubate, and fry emerge between April and June in the Upper Spokane River. This timing potentially overlaps with the time period that the Post Falls HED has the ability to control river flows in the downstream free-flowing reaches. Additional information concerning the distribution and extent of rainbow trout spawning was desired by the FWG to support developing appropriate protection, mitigation and enhancement measures (PM&Es) for the FERC relicensing process. In particular, there is limited information available concerning the distribution and extent of rainbow trout spawning activity in the free-flowing reach downstream of Monroe Street HED (i.e., lower study reach).
The primary objective of this study was to verify the overall distribution, extent, and timing of naturally spawning rainbow trout, as well as fry emergence timing in the free-flowing reaches of the Spokane River between the Post Falls and Nine Mile HEDs. We also characterized the habitat used for spawning, documented spawning activity within three previously established reference areas (i.e., Island Complex, Starr Road, Harvard Road sites), and identified potential effects of flow on redds and fry emergence.
Spawning areas were identified by walking or floating shoreline areas near suspected or known spawning sites, looking for areas with similar habitat characteristics as the known spawning areas, and looking for concentrations of fish (Appendix C). We also tracked radio-tagged adult rainbow trout, which were released as part of a separate rainbow trout movement and behavior evaluation, to help identify other possible spawning areas. Timing of emergence was determined by periodically walking along the spawning sites looking for the presence of fry, which tend to remain visible near redd sites for several days to a week after emergence from the gravel. After emergence was documented, an additional spawning ground survey was conducted in the two free-flowing study reaches. This late season survey consisted of searching for trout fry and counting all observed redds. The redd counts in the spawning reference areas were compared with counts from previous years, and to the results of an independent survey of these same areas in 2003 by Avista personnel. Observations of redd de-watering were made when river flows decreased after the spawning period. Some of the exposed redds were excavated to determine if eggs or fry were present.
Tracking 60 radio-tagged adult rainbow trout (as part of a separate study) during the spawning season was an effective way to identify spawning locations in the Spokane River, particularly in the lower river study reach (downstream of Monroe Street HED), where little is known about rainbow trout spawning behavior. Radio-tagged fish were located at most spawning areas utilized by rainbow trout in 2003, during the spawning season.
Fisheries Work Group 553-2867-007 (02/02) Rainbow Trout Spawning Survey, 2003 – Final Report v November 2003
Although the tagged fish were detected at most of the observed spawning sites, 15 of the 31 upper river study reach fish were located in areas where no redds were observed in 2003. We examined these areas for suitable spawning habitat, signs of spawning activity, and the occurrence of emergent fry near the end of the incubation period. However, the water tended to be too deep in many of these areas to adequately observe either the substrate characteristics or spawning fish during the spawning season. Subsequent observations during low flow conditions revealed pockets of gravel in some of these areas, potentially suitable for spawning, but no evidence that spawning had occurred in these areas in 2003.
Observations made during low flow conditions also indicated a relatively large gravel bar upstream of Barker Road, where three radio-tagged fish were holding during the spawning season. Based on the presence of the tagged fish, and the apparent availability of suitable spawning habitat, spawning may have occurred in this area in 2003. However, the water depth during the spawning period, prevented adequate observations of spawning activities, and we found no evidence of redds or newly emergent fry in this area in late May, when flows were lower.
Two other upper river reach areas, where tagged fish were holding during the spawning season (Simpson Bar and the island downstream of the USGS gauge), also contained suitable spawning habitat. These areas were relatively shallow allowing visual observations of both the substrate and spawning fish, even at the 10 kcfs or greater flows occurring during the spawning season. We examined these areas on foot, but found no evidence of spawning activity and no fry were observed in these areas at the time of emergence.
As in the upper river study reach, tagged fish were detected at most observed spawning areas in the lower river study reach during the spawning season. However, 12 of the 29 fish were located in areas where no redds were observed in 2003. Four of these fish were holding in areas between Latah Creek and the upper San Soucci spawning area. During the spawning season, and around the observed fry emergence period, these areas were examined from shore for signs of spawning activity or newly emergent fry. Although small pockets of suitable substrate were observed in the area, there were no obvious signs of spawning activity. However, water velocities and water depths in these areas during the spawning season prevented effective observations of spawning activity, other than in near shore areas.
Similarly, we floated down both sides of the island downstream of the T.J. Meenach Bridge, where three radio-tagged fish were detected during the spawning season. We also walked along the shoreline of the island. While we found some small areas of apparently suitable spawning substrate, during low flow conditions, no evidence of spawning activity was observed. However, based on the presence of the tagged fish and the available spawning habitat, it is likely that some spawning activity may have occurred in this area in 2003.
In addition to the areas where no spawning activity was observed, six of the radio-tagged fish were detected in the mid- and lower San Soucci areas, where only one redd was detected in 2003. Although some isolated areas of suitable spawning substrate were observed in these reaches, they were typically small pockets of gravel. We also did not observe any fry in this area, around the time of emergence.
Six radio-tagged fish were also detected in the area between just downstream of the Spokane Rifle Club and Riverbend Bar, while no spawning activity was observed in these areas. As in the upper reaches, the substrate through much of this area tended to be large boulder, cobble, and large gravel, with isolated pockets of small cobble and gravel.
The timing of spawning and fry emergence occurred at about the same time as in previous years in the upper river study reach, while the timing appeared to be about a week later in the lower river study reach. The first observation of spawning activity in the upper river study reach occurred as water temperature reached about 5° C, similar to observations in other years. The first signs of spawning in the lower river
Fisheries Work Group 553-2867-007 (02/02) Rainbow Trout Spawning Survey, 2003 – Final Report vi November 2003
reach were observed the second week of April, when water temperature was about 7° C. Water temperature remained below about 12° C throughout the spawning and incubation period.
We counted 232 redds in the upper river study reach (river mile [RM] 84 - 101.7), or about 13.6 redds per mile. Of these redds, 117 (50%) occurred in the three established spawning reference areas. In addition, approximately 88% of the redds occurred between RM 95.1 and RM 92.1 (which encompasses the three reference areas), similar to survey results in 1995 and 1996 (87% and 96%, respectively). The Harvard Road area (RM 92.6) had the highest redd count (76), which includes 52 redds in the established reference area and 24 redds in adjacent habitat. The next highest redd concentration (51 redds) was observed at the river bend downstream of Harvard Road, followed by 43 redds in the Island Complex reference area, and 22 redds in the Starr Road Bar reference site. The independent spawning ground surveys conducted by Avista personnel found a total of 121 redds in the three established spawning reference areas, compared to the 117 we observed. No new (unknown) spawning areas were identified in the upper river study reach.
A total of 130 redds were observed in the lower river study reach, or about 11.8 redds per mile. About 84% of redds occurred between RM 70 and RM 74. The T.J. Meenach springs area (RM 70.1) had the highest number of redds (52) observed in this study reach, while three other areas (Peaceful Valley right and left bank sites [RM 73.1 – 73.2] and the Riverbend Bar site [RM 68.4]) had 18 or more redds each.
Distinct differences in spawning habitat were observed between the upper and lower river study reaches. Spawning habitat in the upper river reach tended to be shallower and more spread out laterally in the river channel, compared to more defined and limited “pockets” of habitat used in the lower reach. Spawning habitat in the lower river was also frequently associated with inundated shoreline vegetation, and the habitat at the T.J. Meenach Springs location was unique in that it was located in a cut-bank area and on the outside of a river bend. Spawning in the upper river study reach occurred primarily at relatively large and shallow gravel bars, with little or no inundated vegetation. Substrate composition was similar in the spawning habitat utilized in the two study reaches, ranging between a gravel/cobble mix to predominantly sand.
Spring runoff conditions in 2003 resulted in higher discharge at Post Falls HED during the spawning period (i.e., approximately 8,000 to 15,000 cfs) than during the incubation period (Post Falls HED operations and flow conditions are explained in more detail in Appendix A). As a result, some redd de-watering was observed at nearly all of the spawning sites when flows dropped below 6,000 cfs. About 22.4% of the upper reach redds were exposed on May 23 and 24, at Post Falls HED discharge levels of between 5,065 and 5,175 cfs. The highest percentage of de-watered redds occurred at the Starr Road Shoreline site, where 75% (9 of 12 redds) were found exposed on May 23 (Post Falls HED discharge of 5,175 cfs). The greatest number of de-watered redds occurred at the Harvard Road (n=19) and at the Island Complex (n=17) sites. Fry stranding was also observed in the west channel at the Island Complex site, as flow through the channel ceased around May 23, with 5,175 cfs Post Falls HED discharge. About 10.8% of redds in the lower river reach were exposed on May 29, at flows of 5,850 cfs (measured at the USGS Spokane gauge). In the lower river study reach, the greatest number (6) and the highest percentage (54.5%) of de-watered redds occurred at the Upper San Soucci site (RM 71.4).
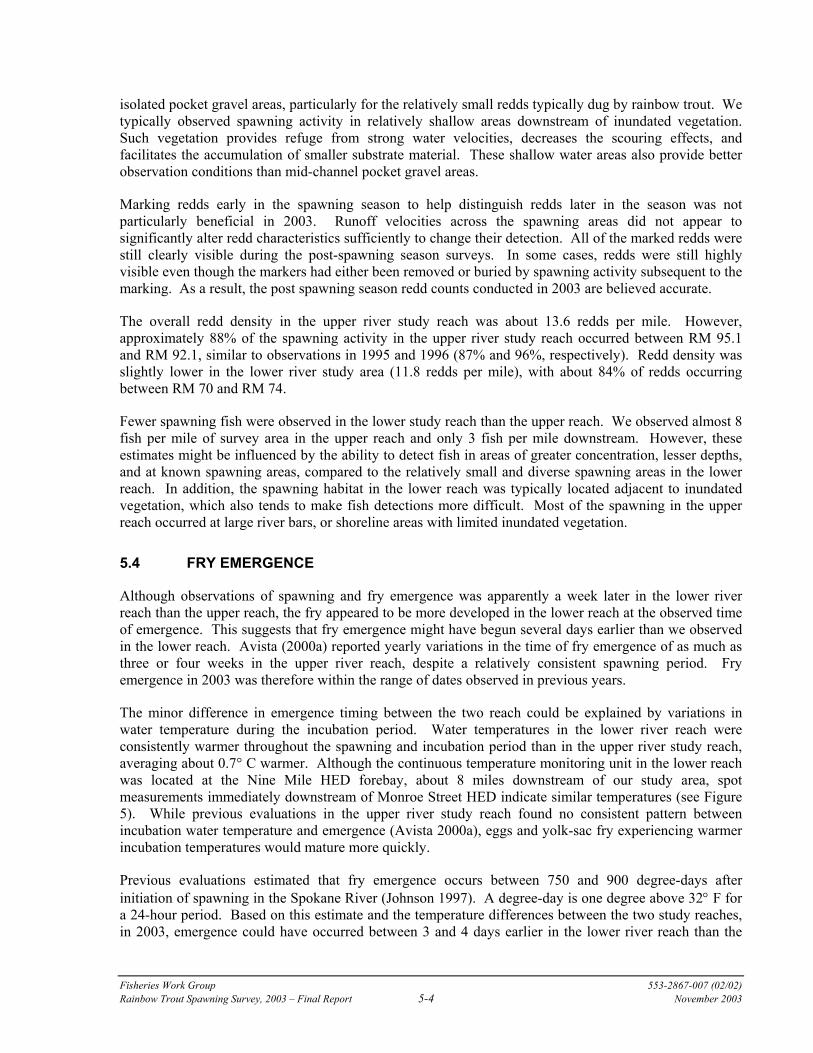
The first signs of fry emergence in the upper river study reach were observed on May 23 and 24, and on May 29 in the lower river study reach. This was similar to the apparent difference in spawning timing between the two study reaches. Fry in the upper reach appeared to be less developed at emergence, as indicated by the visible extension of the yolk-sac, compared the free swimming fry observed in the lower reach. This suggests that emergence might have occurred several days sooner in the lower river reach than observed. However, water temperatures averaged about 0.7° C higher throughout the spawning and incubation period in the lower river, compared to the upper reach, and likely resulted in faster incubation and fry development.
Fisheries Work Group 553-2867-007 (02/02) Rainbow Trout Spawning Survey, 2003 – Final Report 1-1 November 2003
1. INTRODUCTION
This report provides results and discussion of the rainbow trout (Oncorhynchus mykiss) spawning survey conducted in the Spokane River during the period of March 15 through May 29, 2003.
1.1 GENERAL PROJECT AND RELICENSING PROCESS INFORMATION
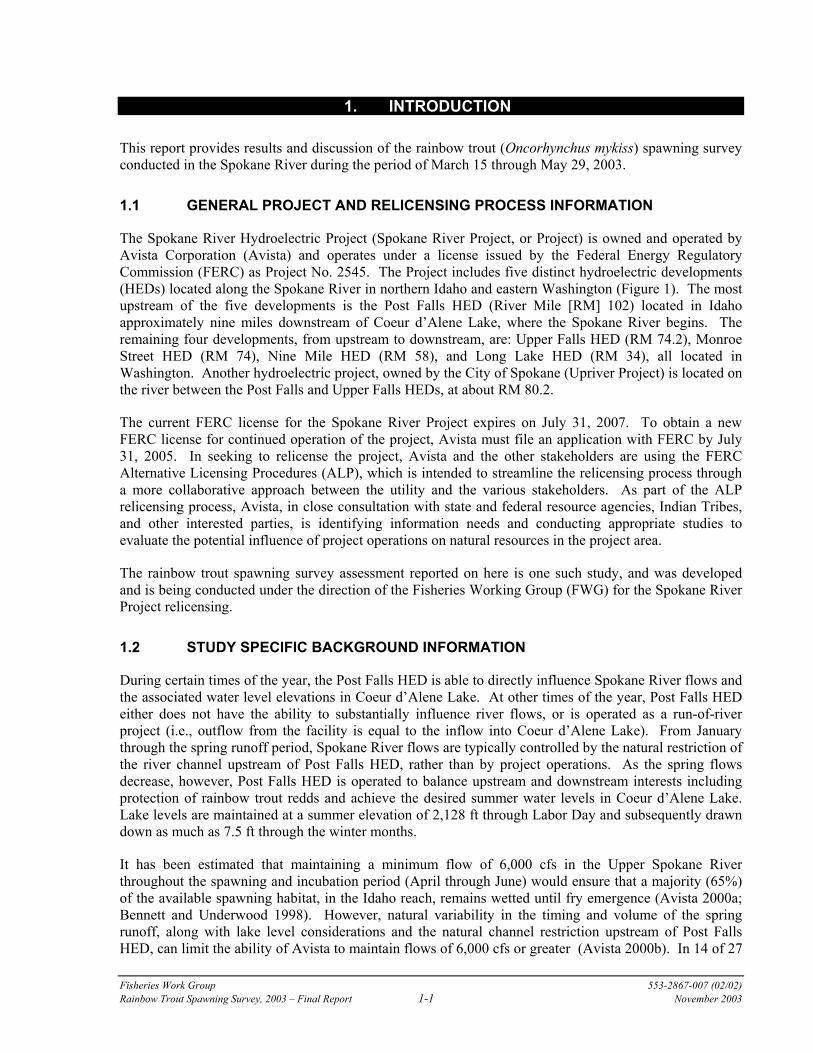
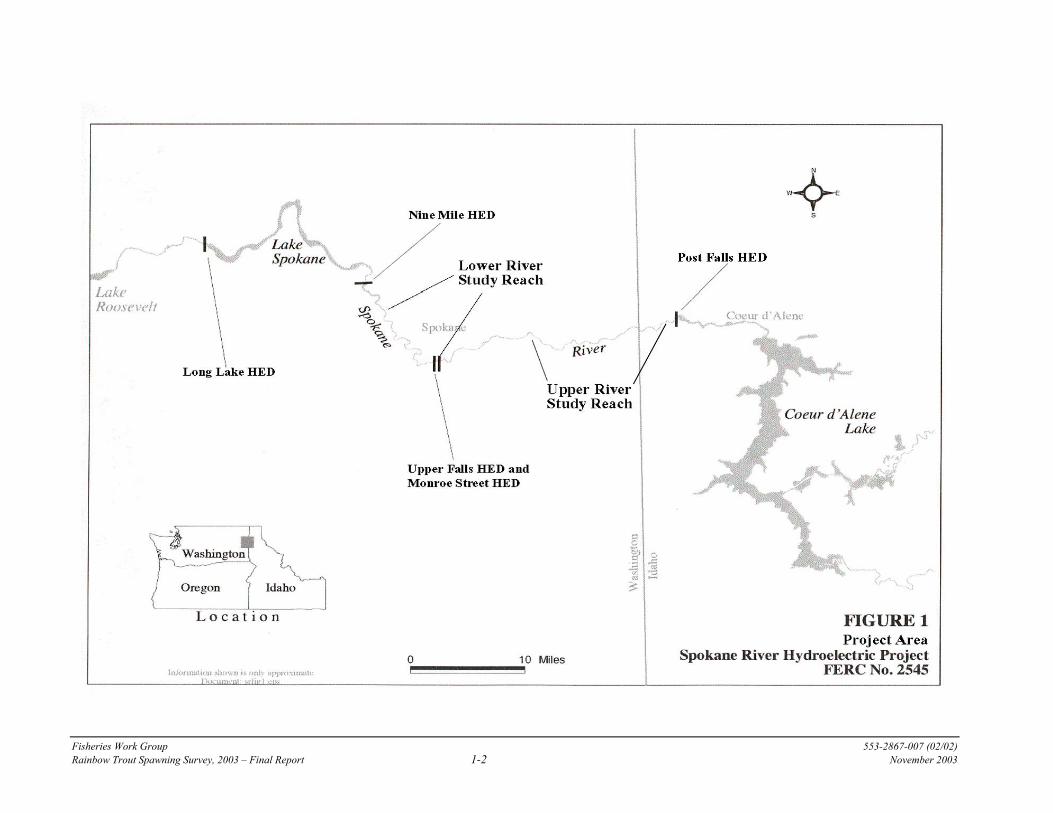
The Spokane River Hydroelectric Project (Spokane River Project, or Project) is owned and operated by Avista Corporation (Avista) and operates under a license issued by the Federal Energy Regulatory Commission (FERC) as Project No. 2545. The Project includes five distinct hydroelectric developments (HEDs) located along the Spokane River in northern Idaho and eastern Washington (Figure 1). The most upstream of the five developments is the Post Falls HED (River Mile [RM] 102) located in Idaho approximately nine miles downstream of Coeur d’Alene Lake, where the Spokane River begins. The remaining four developments, from upstream to downstream, are: Upper Falls HED (RM 74.2), Monroe Street HED (RM 74), Nine Mile HED (RM 58), and Long Lake HED (RM 34), all located in Washington. Another hydroelectric project, owned by the City of Spokane (Upriver Project) is located on the river between the Post Falls and Upper Falls HEDs, at about RM 80.2.
The current FERC license for the Spokane River Project expires on July 31, 2007. To obtain a new FERC license for continued operation of the project, Avista must file an application with FERC by July 31, 2005. In seeking to relicense the project, Avista and the other stakeholders are using the FERC Alternative Licensing Procedures (ALP), which is intended to streamline the relicensing process through a more collaborative approach between the utility and the various stakeholders. As part of the ALP relicensing process, Avista, in close consultation with state and federal resource agencies, Indian Tribes, and other interested parties, is identifying information needs and conducting appropriate studies to evaluate the potential influence of project operations on natural resources in the project area.
The rainbow trout spawning survey assessment reported on here is one such study, and was developed and is being conducted under the direction of the Fisheries Working Group (FWG) for the Spokane River Project relicensing.
1.2 STUDY SPECIFIC BACKGROUND INFORMATION
During certain times of the year, the Post Falls HED is able to directly influence Spokane River flows and the associated water level elevations in Coeur d’Alene Lake. At other times of the year, Post Falls HED either does not have the ability to substantially influence river flows, or is operated as a run-of-river project (i.e., outflow from the facility is equal to the inflow into Coeur d’Alene Lake). From January through the spring runoff period, Spokane River flows are typically controlled by the natural restriction of the river channel upstream of Post Falls HED, rather than by project operations. As the spring flows decrease, however, Post Falls HED is operated to balance upstream and downstream interests including protection of rainbow trout redds and achieve the desired summer water levels in Coeur d’Alene Lake. Lake levels are maintained at a summer elevation of 2,128 ft through Labor Day and subsequently drawn down as much as 7.5 ft through the winter months.
It has been estimated that maintaining a minimum flow of 6,000 cfs in the Upper Spokane River throughout the spawning and incubation period (April through June) would ensure that a majority (65%) of the available spawning habitat, in the Idaho reach, remains wetted until fry emergence (Avista 2000a; Bennett and Underwood 1998). However, natural variability in the timing and volume of the spring runoff, along with lake level considerations and the natural channel restriction upstream of Post Falls HED, can limit the ability of Avista to maintain flows of 6,000 cfs or greater (Avista 2000b). In 14 of 27
Fisheries Work Group 553-2867-007 (02/02) Rainbow Trout Spawning Survey, 2003 – Final Report 1-2 November 2003
1 Project Area
Fisheries Work Group 553-2867-007 (02/02) Rainbow Trout Spawning Survey, 2003 – Final Report 1-3 November 2003
years evaluated (1970-1996) inflows to Coeur d’Alene Lake dropped below 6,000 cfs between April 1 and June 30. In some years, reaching the summer water elevation target of 2,128 ft in Coeur d’Alene Lake by July 1 would not be feasible if the 6,000 cfs minimum flow was maintained downstream of Post Falls HED through July 1. In 10 of the 27 years examined, the lake levels would be 3 ft or more below the target elevation on July 1 if a 6,000 cfs minimum flow were maintained through June.
Previous studies indicate that rainbow trout typically spawn, incubate, and emerge between April and June, in the 18-mile free flowing reach downstream of Post Falls HED (Avista 2000a, Johnson 1997). This timing potentially overlaps with the time period that the Post Falls HED has the ability to control river flows. Other studies suggest that river flow is a key factor in rainbow trout fry recruitment each year (Bailey and Saltes 1982, Bennett and Underwood 1988, IDFG et al. 1990). Bennett and Underwood (1988) also suggested that variable and sometimes poor fry recruitment in the Upper Spokane River was an important element in the observed declines in the number of rainbow trout in the late 1980s and early 1990s. Population estimates declined from about 3,000 fish per mile in the mid-1980s (Bennett and Underwood 1988) to about 100 fish per mile in 1995 (Avista 2000b). River flows and water temperature conditions are believed to be important factors affecting fry recruitment success. In addition, little is known about the characteristics and flow needs associated with rainbow trout spawning and fry emergence in the free-flowing reach downstream of the Monroe Street HED.
In 1995, Avista began monitoring rainbow trout spawning activity and subsequent fry emergence timing in the free-flowing reach downstream of Post Falls HED, in cooperation with state and federal resource agencies. This information is used when considering options for operating Post Falls HED, in a manner that will benefit rainbow trout spawning and fry recruitment, while minimizing impacts to Coeur d’Alene Lake summer water levels. These monitoring efforts have primarily concentrated in three reference areas, where the majority of rainbow trout spawning is believed to occur. Extensive redd surveys in 1995 and 1996 suggested that between 87% and 96% of the spawning activity in the Upper Spokane River occurs in these reference areas (Avista 2000a). Although spawning also occurs in other areas of the Upper Spokane River, the relatively high concentration of activity in these reference areas was assumed to provide a good index of spawning activity and allows for year-to-year comparisons and assessments of long-term trends. In addition, knowing the location and distribution of redds at the reference sites each year is useful when determining appropriate operations at Post Falls HED.
The FWG reviewed the available information and agreed that rainbow trout is the primary fish of interest in the free-flowing reaches of the Spokane River. They also determined that additional information concerning the distribution, extent, and timing of rainbow trout spawning in the Spokane River was desired to support development of appropriate protection, mitigation and enhancement measures (PM&Es) for the FERC relicensing process. In particular, the FWG identified that there was very limited information concerning the distribution and extent of rainbow trout spawning activity in the free-flowing reach downstream of the Monroe Street HED. This interest in additional information and data concerning rainbow trout spawning and associated flow needs in the Spokane River eventually lead to the development and FWG approval of a study plan to assess the Habitat Use, Spawning Distribution and Movements of Rainbow Trout in the Spokane River (Avista 2003a). This report provides some of the results relative to that overall assessment.
The results of the rainbow trout spawning and fry emergence assessment will be used to select transect sites for a Fish Habitat Instream Flow Assessment, also being conducted as part of the Spokane River Project relicensing evaluations (Avista 2003b). The purpose of this assessment is to determine the suitable Spokane River instream flows for the Post Falls HED, as it relates to rainbow trout spawning, fry emergence, and summer rearing habitat and usage.

Fisheries Work Group 553-2867-007 (02/02) Rainbow Trout Spawning Survey, 2003 – Final Report 2-1 November 2003
2. GOAL AND OBJECTIVES
The goal of this study is to collect information concerning rainbow trout spawning and fry emergence in the Spokane River.
The primary objective of this study was to verify the overall distribution, extent, and timing of rainbow trout spawning and fry emergence in the two free-flowing reaches of the Spokane River occurring between Post Falls and Nine Mile HEDs (see Figure 1). Other study objectives were:
• document spawning activity within the previously established spawning reference areas downstream of the Post Falls HED, to verify that these areas continue to provide appropriate information for making operational decisions for Post Falls HED;
• identify other areas of spawning activity, and describe the general habitat characteristics, particularly in the free-flowing reach downstream of Monroe Street HED;
• document the timing of fry emergence; and
• identify the number of redds dewatered or stranded relative to the flows experienced in 2003.
Fisheries Work Group 553-2867-007 (02/02) Rainbow Trout Spawning Survey, 2003 – Final Report 3-1 November 2003
3. METHODS
Rainbow trout spawning in the Upper Spokane River typically begins in early April (Johnson 1997, Avista 1999). To verify the spawning timing in 2003, surveys of known spawning areas were conducted beginning in mid-March and continuing throughout the observed spawning period. Initial observations of spawning activity were made in the three previously established rainbow trout spawning reference areas, located between RM 92.6 and 95.1 (Johnson 1997, Avista 2000a). These initial observations were made, concurrently with ongoing surveys to track the movements and behavior of radio-tagged rainbow trout, to determine the appropriate time to conduct the spawning surveys for this study.
The results of the radio-tagging study will be presented in a separate report. However, because the radio-tagged fish were used to help identify possible spawning areas, a brief description of the release and subsequent locations for the tagged fish is provided here. A total of 60 adult rainbow trout were successfully collected and radio-tagged in the free-flowing reaches of the Project area prior to the initiation of spawning (Figure 2). Thirty-one radio-tagged fish were released in the upper river study reach, and 29 in the lower river study reach. The movements of these fish were identified through weekly or biweekly tracking surveys throughout the spawning period to identify potential spawning areas.
In addition to the locations of the radio-tagged fish, observations of sediment characteristics also provided information regarding potential spawning areas. Areas of suitably sized gravel substrate deposits were identified throughout the accessible free-flowing reaches of the river during the tracking surveys. These reaches extended from Corbin Park to Plantes Ferry (RM 93.6- 99.8) in the upper study reach, and Maple Street to Plese Flats (RM 73.3-63.0) in the lower river study reach. These substrate assessments were conducted primarily from the cataraft, although areas that could not be assessed from the water were examined on foot (Appendix C).
Much of the Spokane River channel is covered by large cobble to small boulder substrate, with apparently limited gravel deposits sufficient to support rainbow trout spawning. We examined both shorelines (typically on alternating tracking surveys) for areas likely to allow the accumulation of gravel. Areas ruled unlikely to hold suitable substrate were; rapids where turbulence and water velocities are excessive, straight slow moving runs where water velocities were insufficient and substrate was uniform and unsuitable (cobble or silt), and bedrock out-crop areas. Areas examined in greater detail typically possessed one or more of the following characteristics; river bends or islands, eddies, inundated or submerged vegetation (where reduced velocities can produce depositional areas), side channels, instream structures along shoreline (e.g., large boulders or bridge piers), and any visible gravel deposits. In the lower river study area, specific attention was also given to all areas containing inundated vegetation.
Areas with potentially suitable habitat were first observed from the cataraft. If the substrate could not be adequately characterized from the raft, we examined the area by walking along the shore or wading in shallow water areas. Areas with suitable spawning habitat were examined during subsequent radio telemetry tracking surveys, conducted during the spawning season, for the presence of fish and redds. If fish or redds were observed, the location was noted and the number of redds counted.
General fish spawning observations made during the fish tracking surveys were used to assess the peak spawning period and to determine the appropriate timing of the first of two extensive spawning ground surveys for this study. During the fish tracking surveys, the reference spawning areas were occasionally surveyed from a boat and/or by foot to determine the duration of spawning activity, through the observations of fish and redd construction activities. Observations of spawning behavior were also conducted at the Centennial Trail bridge site (RM 84.0), where the bridge provided a good observation platform, directly above a known spawning area.
Fisheries Work Group 553-2867-007 (02/02) Rainbow Trout Spawning Survey, 2003 – Final Report 3-2 November 2003
2 Number (#) and Location of Radio-Tagged Rainbow Trout Releases, 2003
Fisheries Work Group 553-2867-007 (02/02) Rainbow Trout Spawning Survey, 2003 – Final Report 3-3 November 2003
Manual radio tracking surveys conducted during the spawning period identified areas occupied by tagged fish, indicating possible spawning areas. Areas favored by tagged fish were typically examined for the presence of suitable habitat and active spawning, by pulling in to shore and walking along the shoreline areas. Areas too deep to observe from the boat or the shoreline were examined for suitable spawning habitat, signs of spawning activity, and for emergent fry when flows decreased in late May. Locating radio-tagged fish was particularly useful in the lower river reach (downstream of Monroe Street HED), because of the limited initial information concerning spawning areas in that reach.
A spawning ground survey in the free-flowing reaches below the Post Falls HED (upper river study reach, RM 84.0-101.7), and the Monroe Street HED (lower river study reach, RM 63-74) was conducted near the peak of spawning activity, based on spawning activity observed at the spawning reference areas. This survey was conducted primarily by boat, although areas of heavy spawning activity or braided channel areas were also surveyed on foot. Known or suspected spawning areas upstream of Corbin Park (RM 99.8) were surveyed on foot. Efforts to identify potential spawning areas consisted of tracking radio tagged fish, walking or floating shoreline areas near known or suspected spawning sites, looking for areas with similar habitat characteristics as the known spawning areas (i.e., suitable gravel substrate), and looking for concentrations of fish. The location of all observed adult rainbow trout and redds were recorded on field notes and marked on aerial photographs.
The criterion for identifying redds were the same as those used in previous studies in the project area (Johnson 1997 and Avista 2000a). Redds were considered to be areas where fish moved enough gravel to form a distinct depression in the substrate. Areas of disturbed gravel without a distinct depression were noted during the surveys, but not included in the redd counts. Some redds were marked with flagging attached to large washers to determine if redds visible early in the spawning period were still visible at the end of the spawning period. Flagging redds also provided a means of identifying redds that were dewatered when flows decreased. Depending on the time of the survey, attention was given to locate adult fish, redds, or recently emerged fry.
Timing of emergence was determined by periodically walking along the spawning sites looking for the presence of fry. Fry remain visible near redd sites for several days to a week after emergence from the gravel (Johnson 1997). Timing of emergence has been previously documented as occurring from mid-May through mid-June (Avista 2000a). In 2003, efforts to detect fry were initiated in early May. Spawning reference areas were used to determine the emergence timing in the upper river study reach, and areas of observed spawning activity in 2003 were periodically observed to determine fry emergence timing in the lower river study reach.
After fry emergence was documented at the known spawning areas, a second spawning ground survey conducted throughout the accessible free-flowing study reaches. During this survey, other potential spawning areas were examined for the presence of newly emergent fry. The presence of fry would suggest that successful spawning and incubation might have occurred in the area. This late season survey also included counting all observed redds. Known spawning areas, the locations where radio-tagged fish were located during the spawning season, and most of the areas where potential spawning habitat was observed were examined for the presence of newly emerged fry during this survey. If fry were observed, the surrounding area was inspected for evidence of spawning activity that may have produced the fry. The locations of all observed redds were identified by river mile, habitat features around the site, depth of redds (when accessible), and marked on aerial photographs. If numerous redds were present, markers were placed to differentiate individual redd sites. The total number of redds in each area was then documented. Redd counts in the spawning reference areas were compared with counts from previous years, and to the results of an independent survey of these areas in 2003 by Avista personnel.
Fisheries Work Group 553-2867-007 (02/02) Rainbow Trout Spawning Survey, 2003 – Final Report 3-4 November 2003
Redd de-watering was assessed by surveying known spawning areas for exposed or nearly exposed redds. The water depths were measured over some redds and some of the exposed redds were excavated to determine if eggs or fry were present. The number of redds dewatered or if stranding was observed was recorded.
Fisheries Work Group 553-2867-007 (02/02) Rainbow Trout Spawning Survey, 2003 – Final Report 4-1 November 2003
4. RESULTS
4.1 DISTRIBUTION OF RADIO-TAGGED FISH
Radio telemetry tracking efforts during the spawning period helped locate potential spawning or pre-spawning staging areas, warranting further investigation of these areas as part of this study. Tagged fish were detected in virtually all of the identified spawning areas, with the exception of the Idaho sites at Corbin Park and McGuire Road, and the Peaceful Valley access site downstream of Monroe Street HED. However, only three of the 31 fish tagged in the upper river study area were captured and released in the Idaho reach. Detailed descriptions of the movement patterns of the radio-tagged fish are presented in a separate report (Parametrix 2003).
4.1.1 Upper River Study Reach
Eleven of the 31 radio-tagged fish moved a substantial distance (>0.5 miles) downstream from their release location prior to or during the spawning period. Nine of these fish were released upstream of Harvard Road. Other tagged fish in the upper river reach tended to remain within close proximity of the release location, during the spawning period, occasionally moving up and downstream within a small range. During the spawning season, only 16 of the 31 upper river study reach fish were located in areas where redds were observed in 2003 (Table 1). Although we examined the other areas occupied by the radio-tagged fish for suitable spawning habitat, signs of spawning activity, and the occurrence of emergent fry near the end of the incubation period, none were observed. Five radio-tagged fish were located near the Mirabeau Point area, and one tagged fish each in the areas upstream of Sullivan Road and downstream of Pines Road. Although no spawning activity was observed in these areas, the water was typically too deep to adequately observe either the substrate characteristics or spawning fish during the spawning season. Subsequent observations during low flow conditions revealed pockets of gravel in these areas, which might be suitable for spawning. However, there were no signs that spawning had occurred in these areas by the time the flow conditions were suitable for observations (late May). We also observed no newly emergent fry in these areas, around the time that emergence was occurring in the known spawning areas.
Observations made during low flow conditions also indicated a relatively large gravel bar upstream of Barker Road (RM 91.1), in an area where three radio-tagged fish were holding during the spawning season. Based on the presence of the tagged fish, and the apparent availability of suitable spawning habitat, spawning may have occurred in this area in 2003. However, the water depths during the spawning period, prevented adequate observations of spawning activities, and we found no evidence of redds or newly emergent fry in this area in late May, when flows were lower.
Two other areas, where tagged fish were holding during the spawning season (Simpson Bar [RM 94.2] and the island downstream of the USGS gauge [RM 93.5]), also contained suitable spawning habitat. These areas were relatively shallow, even at the 10 kcfs or greater flows occurring during the spawning season, allowing adequate visual observations of both the substrate and spawning fish. As a result, we examined these areas on foot, but found no evidence of spawning activity. In addition, no fry were observed in these areas at the time of emergence.
Fisheries Work Group 553-2867-007 (02/02) Rainbow Trout Spawning Survey, 2003 – Final Report 4-2 November 2003
Table 1. Locations of Radio-Tagged Rainbow Trout in the Upper River Study Reach, During the 2003 Spawning Season, Compared to the Location of Observed Redds
Spawning Location River Mile Radio-Tagged Fish Reddsa
McGuire Road access 100.7 None 5 Corbin Park 99.8 None 3 Island Complex (spawning reference area) 94.8-95.1 3 43 Starr Road Bar (spawning reference area) 94.7 5 22 Starr Road Shoreline 94.7 None 12 Simpson Bar 94.2 2 None Island Downstream of USGS Gauge 93.5 3 None Harvard Road (spawning reference area) 92.6 2 76 Harvard Road River Bend 92.1 1 51 Power Lines Upstream of Barker Road 91.3-91.6 3 None Flora Road 89.0 1 None Upstream of Sullivan Road 87.5 1 None Sullivan Road (Left Bank) 87.2 1 2 Sullivan Road (Right Bank) 87.1 1 5 Downstream of Pines Road Bridge 86.9 1 None Mirabeau Point Eddy 86.3 5 None Centennial Trail Bridge 84.0 2 13
a Redds observed during 2003 spawning ground surveys (Parametrix 2003)
4.1.2 Lower River Study Reach Seventeen of the 29 radio-tagged fish released in this reach moved a substantial distance (>0.5 miles) upstream or downstream from their release location prior to or during the spawning period. Fish released in the upstream portion of the reach tended to move downstream and those released in the downstream portions tended to move upstream.
During the spawning period, 12 of the 29 fish were located in areas where no redds were observed in 2003 (Table 2). Four of these fish were holding in areas between Latah Creek (RM 72.2) and the upper San Soucci spawning area (RM 71.6). During the spawning season, and around the observed fry emergence period, these areas were examined from a boat and/or from shore for signs of spawning activity or newly emergent fry. Although small pockets of suitable substrate were observed in the area, there were no obvious signs of spawning activity. However, water velocities and water depths in these areas during the spawning season prevented effective observations of spawning activity, other than in near shore areas.
Similarly, we floated down both sides of the island downstream of the T.J. Meenach Bridge, where three radio-tagged fish were detected during the spawning season. We also walked along the shoreline of the island. While we found some small areas of apparently suitable spawning substrate, during low flow conditions, no evidence of spawning activity was observed. However, based on the presence of the tagged fish and the available spawning habitat, it is likely that some spawning activity may have occurred in this area in 2003.
Fisheries Work Group 553-2867-007 (02/02) Rainbow Trout Spawning Survey, 2003 – Final Report 4-3 November 2003
In addition to the areas where no spawning activity was observed, six of the radio-tagged fish were detected in the mid- and lower San Soucci areas, where only one redd was detected in 2003. Although some isolated areas of suitable spawning substrate were observed in these reaches, they were typically small pockets of gravel. We also did not observe any fry in this area, around the time of emergence.
Table 2. Locations of Radio-Tagged Rainbow Trout in the Lower River Study Reach During the 2003 Spawning Season, Compared to the Location of Observed Redds
Spawning Location River Mile Radio-Tagged Fish Reddsa
Maple Street Bridge 73.5 1 None Peaceful Valley (Left Bank) 73.2 None 18 Peaceful Valley (Right Bank) 73.1 None 27 Latah Creek Confluence 72.2 2 None River Bend Downstream of Latah Creek 71.9 1 None Upper San Soucci 71.4 3 11 Mid San Soucci 71.0 5 1 Lower San Soucci 70.5 1 None T.J. Meenach Springs 70.1 3 52 Downstream of T.J. Meenach Bridge 69.5 3 None River Bend Bar 68.4 2 21 Downstream of Sewage Treatment Plant 66.9 1 None Bowl and Pitcher Eddy 65.8 1 None Downstream of Bowl and Pitcher Eddy 65.6 3 None Downstream of Spokane Rifle Club 64.1 1 None
a Redds observed during 2003 spawning ground surveys (Parametrix 2003)
Six radio-tagged fish were also detected between Riverbend Bar (RM 68.4) and just downstream of the Spokane Rifle Club (RM 64.1), although no spawning activity or emergent fry were observed in these areas. As in the upper reaches, the substrate through much of this area tended to be large boulder, cobble, and large gravel, with isolated pockets of small cobble and gravel.
4.2 SPAWNING AREAS
Observations of fish in shallow water habitat, and the identification of areas with suitable spawning substrate, were also used to identify possible spawning sites. These observations were made primarily from a boat during the radio tracking surveys, although known or suspected spawning areas were also surveyed on foot. The first observation of fish exhibiting spawning activity in the upper river study reach occurred at the Sullivan Road site (RM 87.2), where a pair of spawning rainbow trout were observed on March 28, 2003. However, spawning fish were primarily observed around the first week of April, with numerous pairs of fish on redds. The greatest concentrations of fish (estimated 40-50 fish) were observed at the Starr Road Bar and Harvard Road sites (Table 3, Figure 3). In the lower river study reach, fish were first observed in suspected spawning areas around the second week of April. Fewer spawning fish were observed in the lower study reach, with the greatest number (15 fish) observed in the T.J. Meenach springs area (RM 70.1) (Figure 4).
Fisheries Work Group 553-2867-007 (02/02) Rainbow Trout Spawning Survey, 2003 – Final Report 4-4 November 2003
Table 3. Locations of Rainbow Trout and Redds Observed in the Spokane River, 2003
River Reach Spawning Location River Mile Fish Redds Upper Reach, Downstream of Post Falls HED McGuire Road access 100.7 0 5 Corbin Park 99.8 0 3 Island Complex (reference area) 94.8-95.1 12 43 Starr Road Bar (reference area) 94.7 40-50a 22 Starr Road Shoreline 94.7 0 12 Harvard Road (reference area) 92.6 40-50a 76 Harvard Road River Bend 92.1 0 51 Sullivan Road (Left Bank) 87.2 3 2 Sullivan Road (Right Bank) 87.1 4 5 Centennial Trail Bridge 84.0 6 13 Downstream of Monroe Street HED Peaceful Valley (Left Bank) 73.2 0 18 Peaceful Valley (Right Bank) 73.1 5 27 Upper San Soucci 71.4 7 11 Mid San Soucci 71.0 0 1 T.J. Meenach Springs 70.1 15 52 Riverbend Bar 68.4 6 21
a Estimated number of fish
4.2.1 Upper River Study Reach While spawning areas were identified and marked during each of the radio-tracking surveys, a detailed spawning ground survey was conducted by boat on April 21, between Corbin Park and the Centennial Trail Bridge, in the upper study reach. This survey consisted of floating through the areas that either spawning activity or spawning habitat was observed during the radio-tracking surveys, and counting the number of redds observed. Areas that were less accessible by boat were surveyed by pulling to shore and walking along the shoreline or carefully wading through shallow water areas, to count the redds. Some redds were marked during this survey to evaluate the percentage of redds still visible at the end of the incubation period, when the final redd counts were conducted.
The three spawning reference areas were also surveyed on foot, along with the Corbin Park and Harvard Road river bend areas. Spawning occurred in 10 general areas in this reach, but primarily in previously identified spawning areas (see Table 3 and Figure 3). Of the 10 general spawning locations, half consisted of large (>100 m2) areas of gravel deposits (Corbin Park, Island Complex, Starr Road Bar, Harvard Road Bridge, and Centennial Trail Bridge). Spawning also occurred in smaller (<100 m2) gravel deposits at three adjacent locations (McGuire Road, Starr Road shoreline, and Harvard Road river bend), and in the Sullivan Road area. The substrate composition in the upper river reach spawning areas ranged between a mix of gravel and cobble to predominantly sand (Table 4).
Fisheries Work Group 553-2867-007 (02/02) Rainbow Trout Spawning Survey, 2003 – Final Report 4-5 November 2003
3 Identified Rainbow Trout Spawning Areas, 2003Number of Fish and Redds Observed at the Upper River Study Reach Spawning Sites, 2003
Fisheries Work Group 553-2867-007 (02/02) Rainbow Trout Spawning Survey, 2003 – Final Report 4-6 November 2003
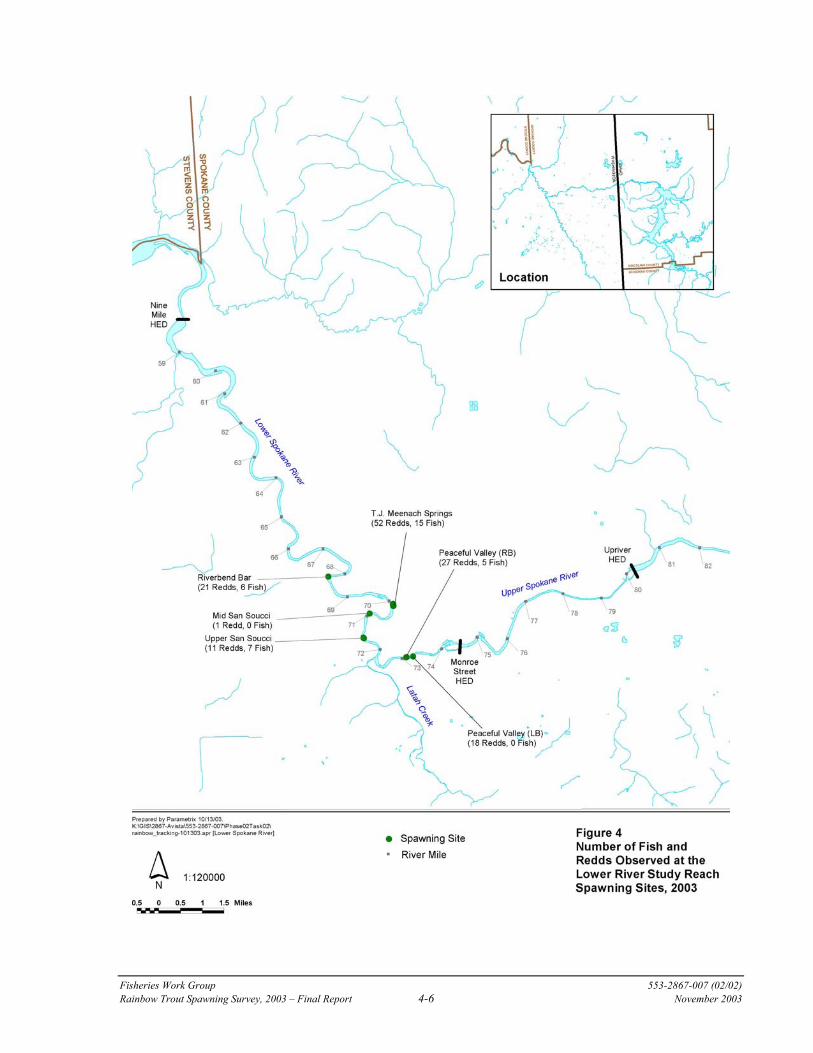
4 Number of Fish and Redds Observed at the Lower River Study Reach Spawning Sites, 2003
Fisheries Work Group 553-2867-007 (02/02) Rainbow Trout Spawning Survey, 2003 – Final Report 4-7 November 2003
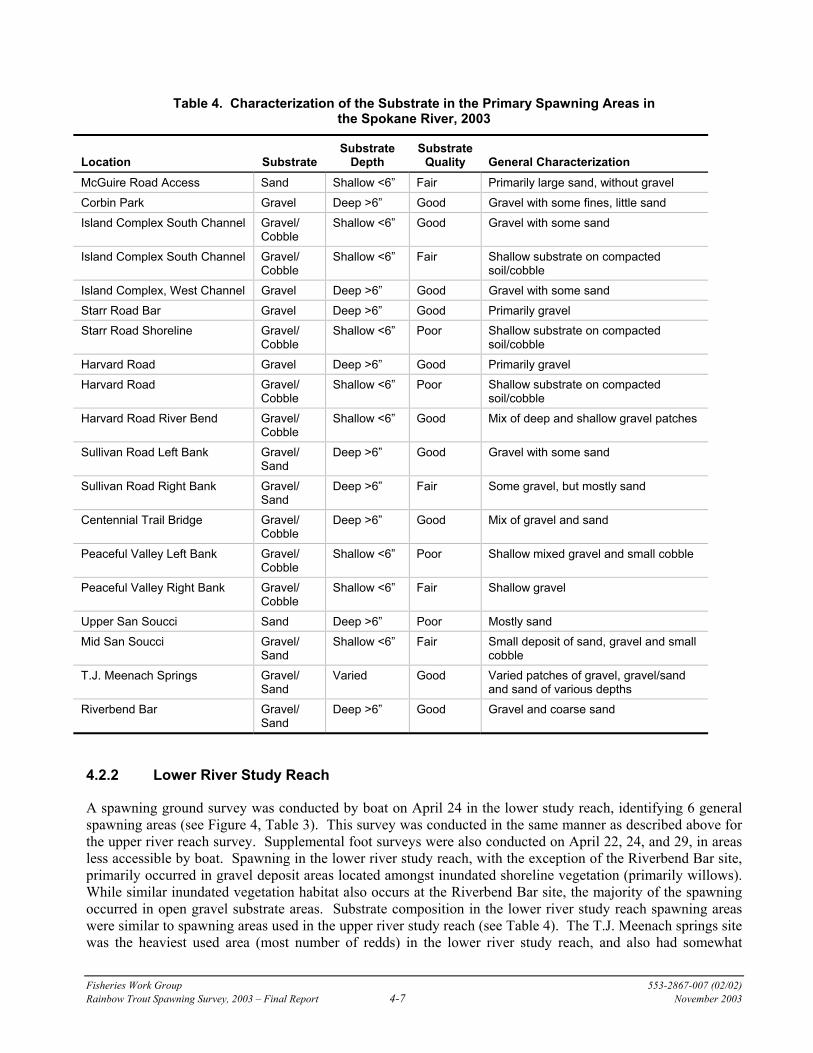
Table 4. Characterization of the Substrate in the Primary Spawning Areas in the Spokane River, 2003
Location Substrate Substrate
Depth Substrate
Quality General Characterization McGuire Road Access Sand Shallow <6” Fair Primarily large sand, without gravel Corbin Park Gravel Deep >6” Good Gravel with some fines, little sand Island Complex South Channel Gravel/
Cobble Shallow <6” Good Gravel with some sand
Island Complex South Channel Gravel/ Cobble
Shallow <6” Fair Shallow substrate on compacted soil/cobble
Island Complex, West Channel Gravel Deep >6” Good Gravel with some sand Starr Road Bar Gravel Deep >6” Good Primarily gravel Starr Road Shoreline Gravel/
Cobble Shallow <6” Poor Shallow substrate on compacted
soil/cobble Harvard Road Gravel Deep >6” Good Primarily gravel Harvard Road Gravel/
Cobble Shallow <6” Poor Shallow substrate on compacted
soil/cobble Harvard Road River Bend Gravel/
Cobble Shallow <6” Good Mix of deep and shallow gravel patches
Sullivan Road Left Bank Gravel/ Sand
Deep >6” Good Gravel with some sand
Sullivan Road Right Bank Gravel/ Sand
Deep >6” Fair Some gravel, but mostly sand
Centennial Trail Bridge Gravel/ Cobble
Deep >6” Good Mix of gravel and sand
Peaceful Valley Left Bank Gravel/ Cobble
Shallow <6” Poor Shallow mixed gravel and small cobble
Peaceful Valley Right Bank Gravel/ Cobble
Shallow <6” Fair Shallow gravel
Upper San Soucci Sand Deep >6” Poor Mostly sand Mid San Soucci Gravel/
Sand Shallow <6” Fair Small deposit of sand, gravel and small
cobble T.J. Meenach Springs Gravel/
Sand Varied Good Varied patches of gravel, gravel/sand
and sand of various depths Riverbend Bar Gravel/
Sand Deep >6” Good Gravel and coarse sand
4.2.2 Lower River Study Reach
A spawning ground survey was conducted by boat on April 24 in the lower study reach, identifying 6 general spawning areas (see Figure 4, Table 3). This survey was conducted in the same manner as described above for the upper river reach survey. Supplemental foot surveys were also conducted on April 22, 24, and 29, in areas less accessible by boat. Spawning in the lower river study reach, with the exception of the Riverbend Bar site, primarily occurred in gravel deposit areas located amongst inundated shoreline vegetation (primarily willows). While similar inundated vegetation habitat also occurs at the Riverbend Bar site, the majority of the spawning occurred in open gravel substrate areas. Substrate composition in the lower river study reach spawning areas were similar to spawning areas used in the upper river study reach (see Table 4). The T.J. Meenach springs site was the heaviest used area (most number of redds) in the lower river study reach, and also had somewhat
Fisheries Work Group 553-2867-007 (02/02) Rainbow Trout Spawning Survey, 2003 – Final Report 4-8 November 2003
unique habitat features. It is the only location within the two study reaches where spawning was observed on a cut-bank or outside portion of a river bend. Most of the redds at the T.J. Meenach springs location were in gravel deposits on the outside fringe of willows and debris collected along approximately 200 longitudinal ft of shoreline.
Multiple redds were observed in all but the Mid San Soucci area. Available habitat was heavily utilized in the T.J. Meenach springs area and both of the Peaceful Valley areas, although no redd superimposition was detected. The Riverbend Bar site was also well used for spawning, but at lower densities compared to other areas. The Mid San Soucci site was relatively small (<100 m2), with a limited amount of suitable sized substrate available (Eric Johnson, 2003 personal observation). The other spawning sites were typically 100 m2 or greater in size.
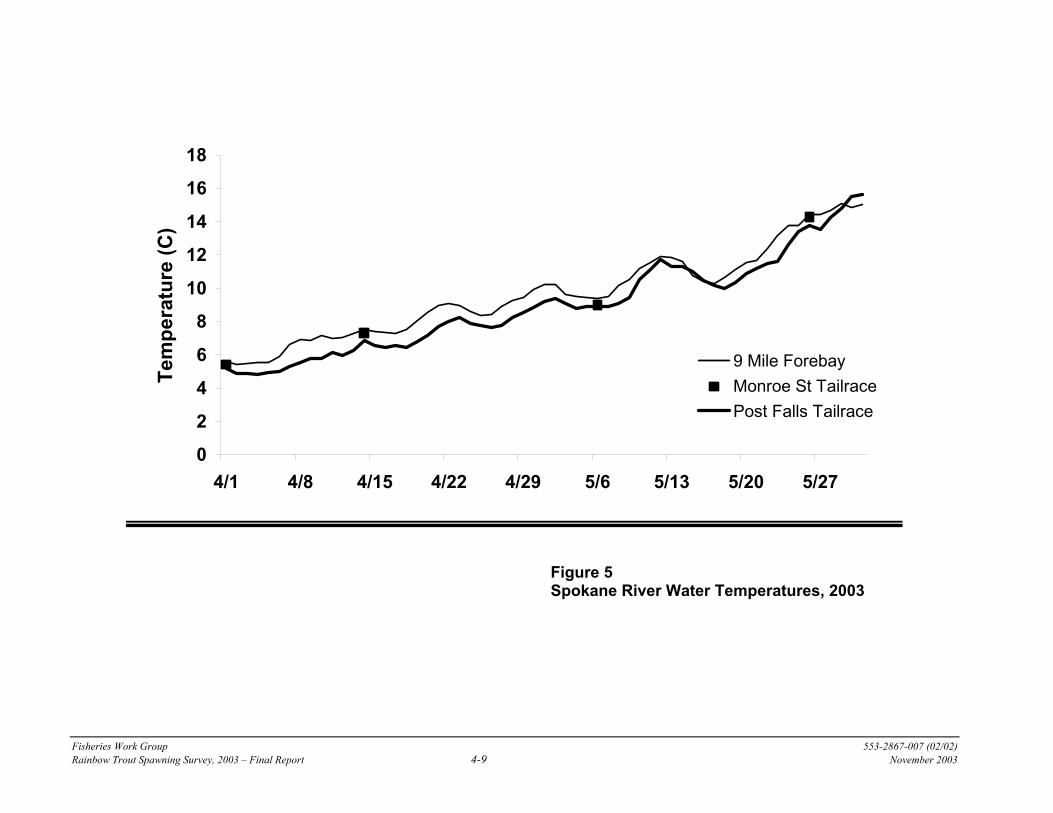
4.3 SPAWNING PERIOD The first spawning activity in the upper study reach was observed at the Sullivan Road left bank site (RM 87.2), when water temperature was about 5° C (Figure 5). However, the first substantial spawning activity in the upper study reach was observed on April 8. Numerous fish were observed on redds in each of the spawning reference areas during that survey, indicating that spawning likely began a few days prior. Numerous fish were again observed the week of April 16, but few fish were detected the following week (April 21).
No spawning activity was observed in the lower river study area until the second week of April (April 10). The first spawning activity was observed at the Upper San Soucci site, when water temperature was about 7° C (see Figure 5). Peak spawning activity occurred around April 19. During the April 19 and 22 surveys conducted by boat, numerous fish were observed on redds at the Peaceful Valley right bank, Upper San Soucci, and T.J. Meenach Springs sites. However, few fish were observed in the spawning areas by April 29.
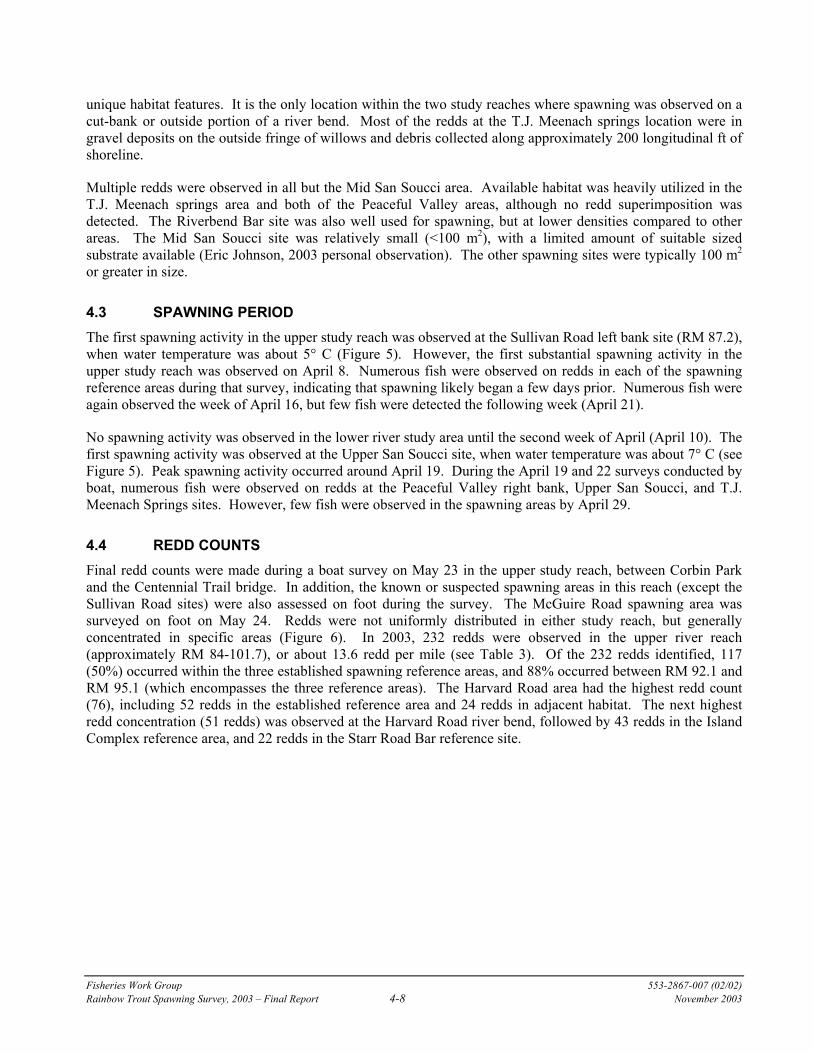
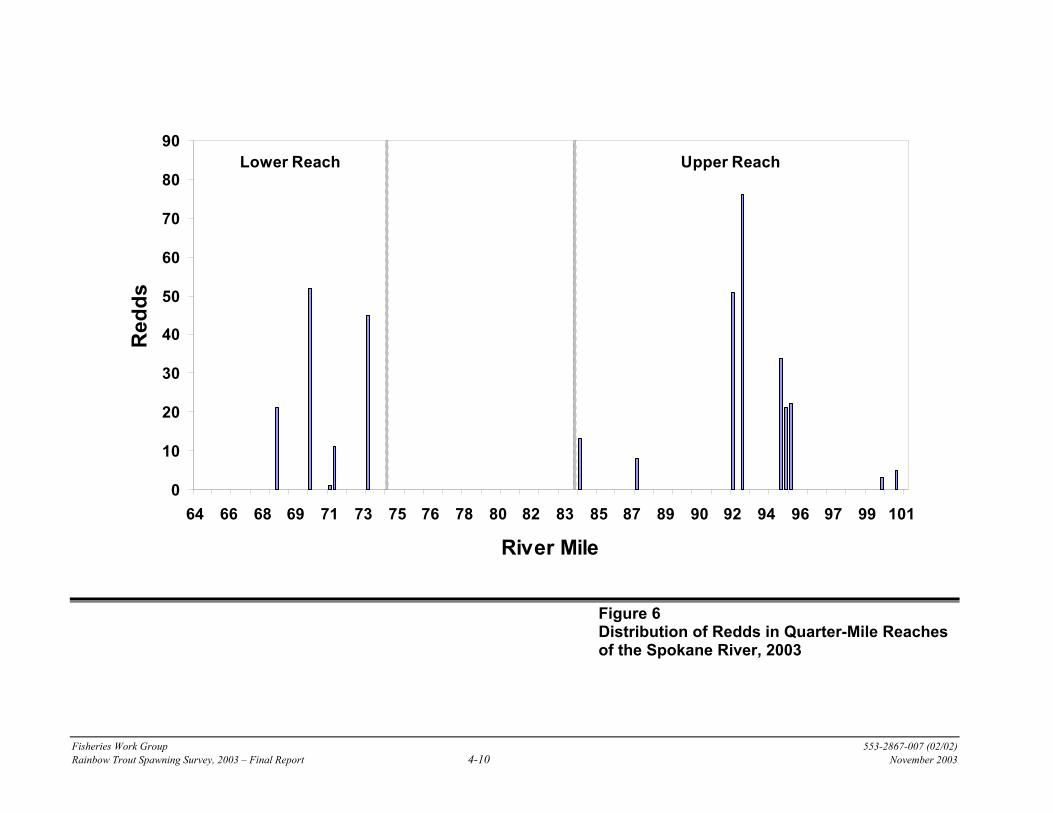
4.4 REDD COUNTS Final redd counts were made during a boat survey on May 23 in the upper study reach, between Corbin Park and the Centennial Trail bridge. In addition, the known or suspected spawning areas in this reach (except the Sullivan Road sites) were also assessed on foot during the survey. The McGuire Road spawning area was surveyed on foot on May 24. Redds were not uniformly distributed in either study reach, but generally concentrated in specific areas (Figure 6). In 2003, 232 redds were observed in the upper river reach (approximately RM 84-101.7), or about 13.6 redd per mile (see Table 3). Of the 232 redds identified, 117 (50%) occurred within the three established spawning reference areas, and 88% occurred between RM 92.1 and RM 95.1 (which encompasses the three reference areas). The Harvard Road area had the highest redd count (76), including 52 redds in the established reference area and 24 redds in adjacent habitat. The next highest redd concentration (51 redds) was observed at the Harvard Road river bend, followed by 43 redds in the Island Complex reference area, and 22 redds in the Starr Road Bar reference site.
Fisheries Work Group 553-2867-007 (02/02) Rainbow Trout Spawning Survey, 2003 – Final Report 4-9 November 2003
Figure 5 Spokane River Water Temperatures, 2003
0
2
4
6
8
10
12
14
16
18
4/1 4/8 4/15 4/22 4/29 5/6 5/13 5/20 5/27
Tem
pera
ture
(C)
9 Mile ForebayMonroe St TailracePost Falls Tailrace
Fisheries Work Group 553-2867-007 (02/02) Rainbow Trout Spawning Survey, 2003 – Final Report 4-10 November 2003
0
10
20
30
40
50
60
70
80
90
64 66 68 69 71 73 75 76 78 80 82 83 85 87 89 90 92 94 96 97 99 101
River Mile
Red
dsLower Reach Upper Reach
Figure 6 Distribution of Redds in Quarter-Mile Reaches of the Spokane River, 2003
Fisheries Work Group 553-2867-007 (02/02) Rainbow Trout Spawning Survey, 2003 – Final Report 4-11 November 2003
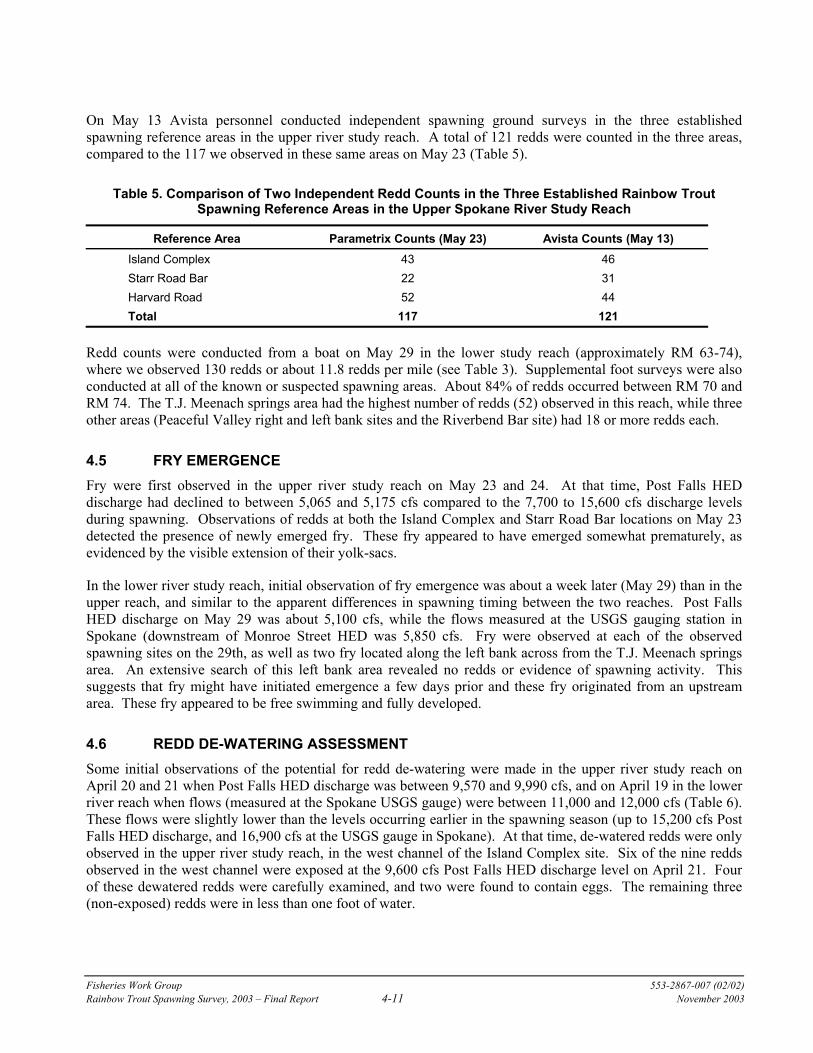
On May 13 Avista personnel conducted independent spawning ground surveys in the three established spawning reference areas in the upper river study reach. A total of 121 redds were counted in the three areas, compared to the 117 we observed in these same areas on May 23 (Table 5).
Table 5. Comparison of Two Independent Redd Counts in the Three Established Rainbow Trout Spawning Reference Areas in the Upper Spokane River Study Reach
Reference Area Parametrix Counts (May 23) Avista Counts (May 13) Island Complex 43 46 Starr Road Bar 22 31 Harvard Road 52 44 Total 117 121
Redd counts were conducted from a boat on May 29 in the lower study reach (approximately RM 63-74), where we observed 130 redds or about 11.8 redds per mile (see Table 3). Supplemental foot surveys were also conducted at all of the known or suspected spawning areas. About 84% of redds occurred between RM 70 and RM 74. The T.J. Meenach springs area had the highest number of redds (52) observed in this reach, while three other areas (Peaceful Valley right and left bank sites and the Riverbend Bar site) had 18 or more redds each.
4.5 FRY EMERGENCE Fry were first observed in the upper river study reach on May 23 and 24. At that time, Post Falls HED discharge had declined to between 5,065 and 5,175 cfs compared to the 7,700 to 15,600 cfs discharge levels during spawning. Observations of redds at both the Island Complex and Starr Road Bar locations on May 23 detected the presence of newly emerged fry. These fry appeared to have emerged somewhat prematurely, as evidenced by the visible extension of their yolk-sacs.
In the lower river study reach, initial observation of fry emergence was about a week later (May 29) than in the upper reach, and similar to the apparent differences in spawning timing between the two reaches. Post Falls HED discharge on May 29 was about 5,100 cfs, while the flows measured at the USGS gauging station in Spokane (downstream of Monroe Street HED was 5,850 cfs. Fry were observed at each of the observed spawning sites on the 29th, as well as two fry located along the left bank across from the T.J. Meenach springs area. An extensive search of this left bank area revealed no redds or evidence of spawning activity. This suggests that fry might have initiated emergence a few days prior and these fry originated from an upstream area. These fry appeared to be free swimming and fully developed.
4.6 REDD DE-WATERING ASSESSMENT Some initial observations of the potential for redd de-watering were made in the upper river study reach on April 20 and 21 when Post Falls HED discharge was between 9,570 and 9,990 cfs, and on April 19 in the lower river reach when flows (measured at the Spokane USGS gauge) were between 11,000 and 12,000 cfs (Table 6). These flows were slightly lower than the levels occurring earlier in the spawning season (up to 15,200 cfs Post Falls HED discharge, and 16,900 cfs at the USGS gauge in Spokane). At that time, de-watered redds were only observed in the upper river study reach, in the west channel of the Island Complex site. Six of the nine redds observed in the west channel were exposed at the 9,600 cfs Post Falls HED discharge level on April 21. Four of these dewatered redds were carefully examined, and two were found to contain eggs. The remaining three (non-exposed) redds were in less than one foot of water.
Fisheries Work Group 553-2867-007 (02/02) Rainbow Trout Spawning Survey, 2003 – Final Report 4-12 November 2003
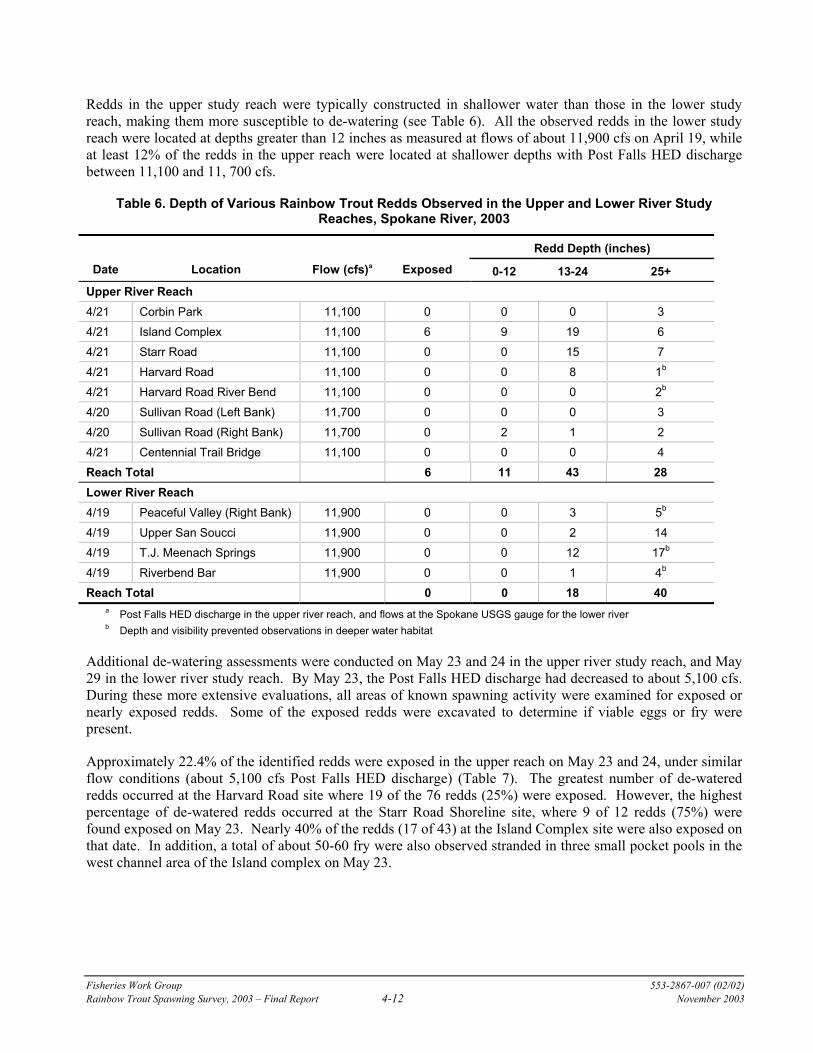
Redds in the upper study reach were typically constructed in shallower water than those in the lower study reach, making them more susceptible to de-watering (see Table 6). All the observed redds in the lower study reach were located at depths greater than 12 inches as measured at flows of about 11,900 cfs on April 19, while at least 12% of the redds in the upper reach were located at shallower depths with Post Falls HED discharge between 11,100 and 11, 700 cfs.
Table 6. Depth of Various Rainbow Trout Redds Observed in the Upper and Lower River Study Reaches, Spokane River, 2003
Redd Depth (inches) Date Location Flow (cfs)a Exposed 0-12 13-24 25+
Upper River Reach 4/21 Corbin Park 11,100 0 0 0 3 4/21 Island Complex 11,100 6 9 19 6 4/21 Starr Road 11,100 0 0 15 7 4/21 Harvard Road 11,100 0 0 8 1b
4/21 Harvard Road River Bend 11,100 0 0 0 2b 4/20 Sullivan Road (Left Bank) 11,700 0 0 0 3 4/20 Sullivan Road (Right Bank) 11,700 0 2 1 2 4/21 Centennial Trail Bridge 11,100 0 0 0 4 Reach Total 6 11 43 28 Lower River Reach 4/19 Peaceful Valley (Right Bank) 11,900 0 0 3 5b
4/19 Upper San Soucci 11,900 0 0 2 14 4/19 T.J. Meenach Springs 11,900 0 0 12 17b 4/19 Riverbend Bar 11,900 0 0 1 4b Reach Total 0 0 18 40
a Post Falls HED discharge in the upper river reach, and flows at the Spokane USGS gauge for the lower river b Depth and visibility prevented observations in deeper water habitat
Additional de-watering assessments were conducted on May 23 and 24 in the upper river study reach, and May 29 in the lower river study reach. By May 23, the Post Falls HED discharge had decreased to about 5,100 cfs. During these more extensive evaluations, all areas of known spawning activity were examined for exposed or nearly exposed redds. Some of the exposed redds were excavated to determine if viable eggs or fry were present.
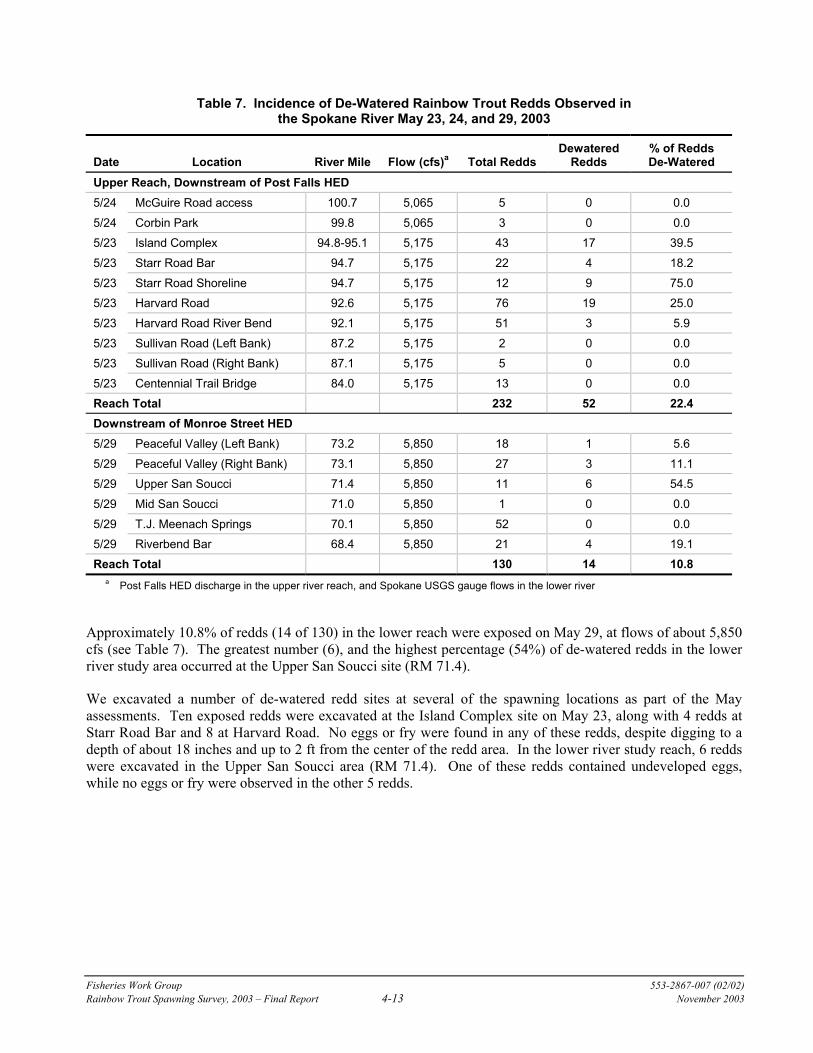
Approximately 22.4% of the identified redds were exposed in the upper reach on May 23 and 24, under similar flow conditions (about 5,100 cfs Post Falls HED discharge) (Table 7). The greatest number of de-watered redds occurred at the Harvard Road site where 19 of the 76 redds (25%) were exposed. However, the highest percentage of de-watered redds occurred at the Starr Road Shoreline site, where 9 of 12 redds (75%) were found exposed on May 23. Nearly 40% of the redds (17 of 43) at the Island Complex site were also exposed on that date. In addition, a total of about 50-60 fry were also observed stranded in three small pocket pools in the west channel area of the Island complex on May 23.
Fisheries Work Group 553-2867-007 (02/02) Rainbow Trout Spawning Survey, 2003 – Final Report 4-13 November 2003
Table 7. Incidence of De-Watered Rainbow Trout Redds Observed in the Spokane River May 23, 24, and 29, 2003
Date Location River Mile Flow (cfs)a Total Redds
Dewatered Redds
% of Redds De-Watered
Upper Reach, Downstream of Post Falls HED 5/24 McGuire Road access 100.7 5,065 5 0 0.0 5/24 Corbin Park 99.8 5,065 3 0 0.0 5/23 Island Complex 94.8-95.1 5,175 43 17 39.5 5/23 Starr Road Bar 94.7 5,175 22 4 18.2 5/23 Starr Road Shoreline 94.7 5,175 12 9 75.0 5/23 Harvard Road 92.6 5,175 76 19 25.0 5/23 Harvard Road River Bend 92.1 5,175 51 3 5.9 5/23 Sullivan Road (Left Bank) 87.2 5,175 2 0 0.0 5/23 Sullivan Road (Right Bank) 87.1 5,175 5 0 0.0 5/23 Centennial Trail Bridge 84.0 5,175 13 0 0.0 Reach Total 232 52 22.4 Downstream of Monroe Street HED 5/29 Peaceful Valley (Left Bank) 73.2 5,850 18 1 5.6 5/29 Peaceful Valley (Right Bank) 73.1 5,850 27 3 11.1 5/29 Upper San Soucci 71.4 5,850 11 6 54.5 5/29 Mid San Soucci 71.0 5,850 1 0 0.0 5/29 T.J. Meenach Springs 70.1 5,850 52 0 0.0 5/29 Riverbend Bar 68.4 5,850 21 4 19.1 Reach Total 130 14 10.8
a Post Falls HED discharge in the upper river reach, and Spokane USGS gauge flows in the lower river
Approximately 10.8% of redds (14 of 130) in the lower reach were exposed on May 29, at flows of about 5,850 cfs (see Table 7). The greatest number (6), and the highest percentage (54%) of de-watered redds in the lower river study area occurred at the Upper San Soucci site (RM 71.4).
We excavated a number of de-watered redd sites at several of the spawning locations as part of the May assessments. Ten exposed redds were excavated at the Island Complex site on May 23, along with 4 redds at Starr Road Bar and 8 at Harvard Road. No eggs or fry were found in any of these redds, despite digging to a depth of about 18 inches and up to 2 ft from the center of the redd area. In the lower river study reach, 6 redds were excavated in the Upper San Soucci area (RM 71.4). One of these redds contained undeveloped eggs, while no eggs or fry were observed in the other 5 redds.
Fisheries Work Group 553-2867-007 (02/02) Rainbow Trout Spawning Survey, 2003 – Final Report 5-1 November 2003
5. DISCUSSION
5.1 SPAWNING AREAS We observed distinct differences in spawning habitat between the upper and lower river study reaches in 2003. Spawning habitat in the upper river reach tended to be shallower and more spread out laterally in the river channel, compared to habitat used in the lower reach. Much of the spawning in the upper river reach occurred in relatively large gravel deposit areas downstream of the Washington-Idaho border. Spawning habitat in the lower river was typically deeper, and frequently associated with inundated shoreline vegetation. The spawning habitat at the T.J. Meenach springs location was unique in that it was located in a cut-bank area and on the outside of a river bend.
While the locations of the radio-tagged fish helped to identify some spawning areas, no spawning activity was observed at other locations. These other areas tended to be relatively deep-water sites, where visual observations were limited, particularly with the flow levels and turbidity occurring during the spawning season. Subsequent observations during low flow conditions identified some potential spawning habitat, but no signs of actual spawning activity. The depth and small pockets of potential spawning substrate at these sites might explain why spawning has not been documented in these areas in previous years although we were also not able to verify spawning in these areas in 2003.
5.2 SPAWNING PERIOD Previous monitoring efforts show that the majority of rainbow trout in the Upper Spokane River spawn during the first few weeks of April (Avista 2000a). These data also consistently indicate that the initiation of spawning typically occurs when water temperatures reach 4-5° C. Spawning timing in the upper river study reach in 2003 was similar to previous years, beginning around the first week in April and extending through the third week in April. The water temperature at the initiation of spawning was about 5°C, also similar to previous observations.
The data collected in 2003 indicate that spawning initiated about one week later downstream of Monroe Street, compared to the reach downstream of Post Falls HED, despite water temperatures of 5° C or higher after April 1. The initiation of spawning in the lower reach occurred at slightly higher water temperatures (approximately 7° C) than the upstream reach (4-5° C).
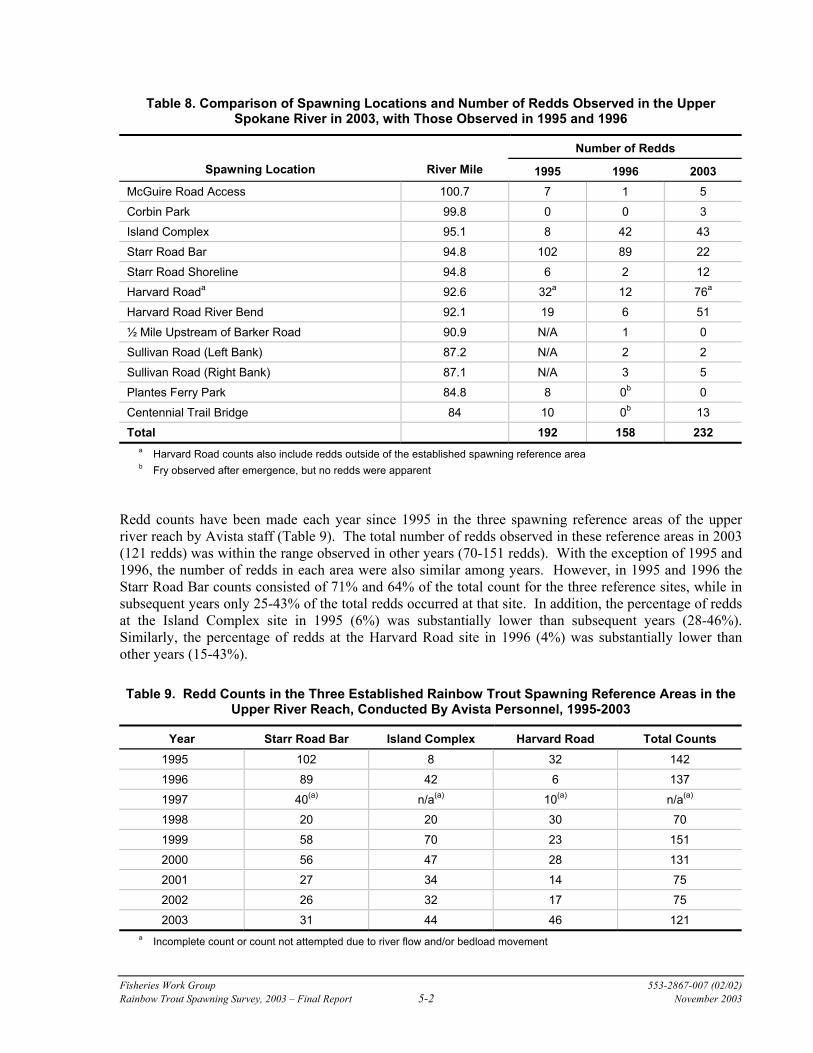
5.3 REDD COUNTS During the 2003 spawning season, 232 redds were detected in the free-flowing reach downstream of Post Falls HED. Previously in 1995 and 1996, the total numbers of redds in this reach were 192 and 158, respectively (Table 8). The surveys in 1995 were limited primarily to areas in Idaho identified by Bennett and Underwood (1988), and areas in Washington known to support spawning activity. More extensive surveys of potential spawning habitat were conducted in 1996. As a result, the extent of the1996 surveys was most similar to those conducted in 2003. The distribution of redds was similar for all three years with the exception of the spawning reference areas and the Harvard Road river bend. In 2003, the redd counts were substantially lower at the Starr Road Bar, and substantially higher at the river bend downstream of Harvard Road as compared to 1995 and 1996 results. However, in all three years between 87% and 96% of the spawning in the upper river reach occurred in the 3-mile reach between the Island Complex area (RM 95.1) and the Harvard Road river bend (RM 92.1).
Fisheries Work Group 553-2867-007 (02/02) Rainbow Trout Spawning Survey, 2003 – Final Report 5-2 November 2003
Table 8. Comparison of Spawning Locations and Number of Redds Observed in the Upper Spokane River in 2003, with Those Observed in 1995 and 1996
Number of Redds Spawning Location River Mile 1995 1996 2003
McGuire Road Access 100.7 7 1 5 Corbin Park 99.8 0 0 3 Island Complex 95.1 8 42 43 Starr Road Bar 94.8 102 89 22 Starr Road Shoreline 94.8 6 2 12 Harvard Roada 92.6 32a 12 76a
Harvard Road River Bend 92.1 19 6 51 ½ Mile Upstream of Barker Road 90.9 N/A 1 0 Sullivan Road (Left Bank) 87.2 N/A 2 2 Sullivan Road (Right Bank) 87.1 N/A 3 5 Plantes Ferry Park 84.8 8 0b 0 Centennial Trail Bridge 84 10 0b 13 Total 192 158 232
a Harvard Road counts also include redds outside of the established spawning reference area b Fry observed after emergence, but no redds were apparent
Redd counts have been made each year since 1995 in the three spawning reference areas of the upper river reach by Avista staff (Table 9). The total number of redds observed in these reference areas in 2003 (121 redds) was within the range observed in other years (70-151 redds). With the exception of 1995 and 1996, the number of redds in each area were also similar among years. However, in 1995 and 1996 the Starr Road Bar counts consisted of 71% and 64% of the total count for the three reference sites, while in subsequent years only 25-43% of the total redds occurred at that site. In addition, the percentage of redds at the Island Complex site in 1995 (6%) was substantially lower than subsequent years (28-46%). Similarly, the percentage of redds at the Harvard Road site in 1996 (4%) was substantially lower than other years (15-43%).
Table 9. Redd Counts in the Three Established Rainbow Trout Spawning Reference Areas in the Upper River Reach, Conducted By Avista Personnel, 1995-2003
Year Starr Road Bar Island Complex Harvard Road Total Counts 1995 102 8 32 142 1996 89 42 6 137 1997 40(a) n/a(a) 10(a) n/a(a) 1998 20 20 30 70 1999 58 70 23 151 2000 56 47 28 131 2001 27 34 14 75 2002 26 32 17 75 2003 31 44 46 121
a Incomplete count or count not attempted due to river flow and/or bedload movement
Fisheries Work Group 553-2867-007 (02/02) Rainbow Trout Spawning Survey, 2003 – Final Report 5-3 November 2003
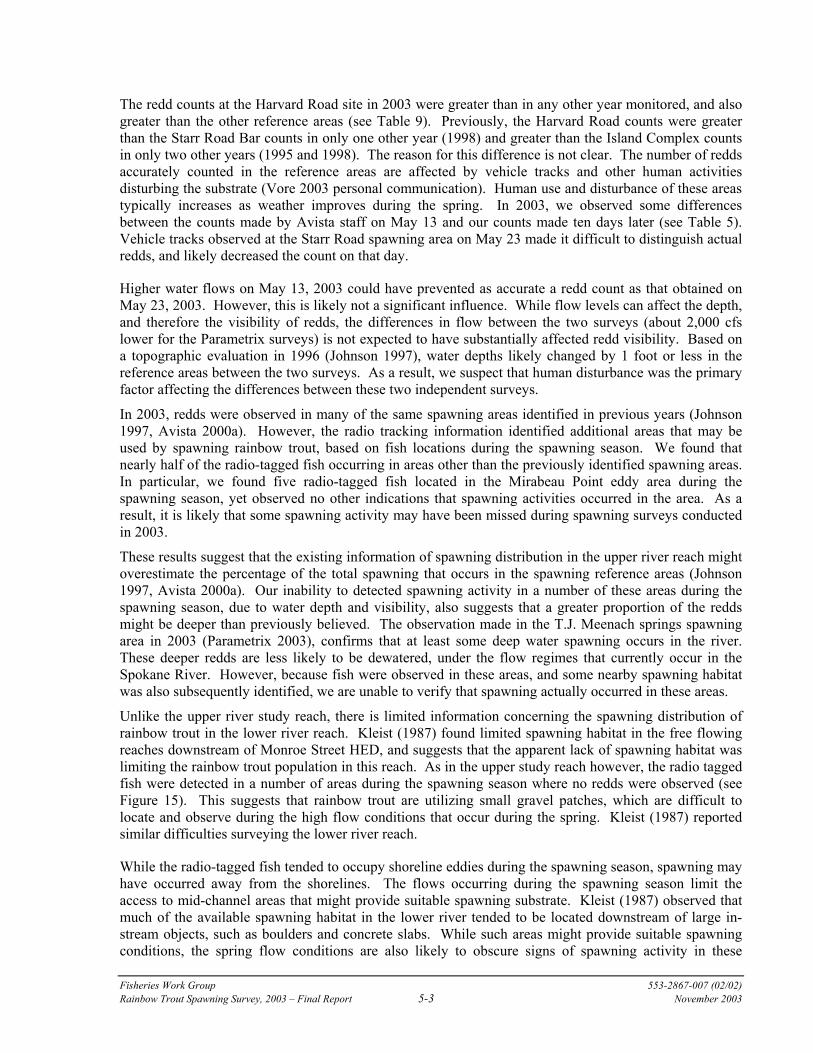
The redd counts at the Harvard Road site in 2003 were greater than in any other year monitored, and also greater than the other reference areas (see Table 9). Previously, the Harvard Road counts were greater than the Starr Road Bar counts in only one other year (1998) and greater than the Island Complex counts in only two other years (1995 and 1998). The reason for this difference is not clear. The number of redds accurately counted in the reference areas are affected by vehicle tracks and other human activities disturbing the substrate (Vore 2003 personal communication). Human use and disturbance of these areas typically increases as weather improves during the spring. In 2003, we observed some differences between the counts made by Avista staff on May 13 and our counts made ten days later (see Table 5). Vehicle tracks observed at the Starr Road spawning area on May 23 made it difficult to distinguish actual redds, and likely decreased the count on that day.
Higher water flows on May 13, 2003 could have prevented as accurate a redd count as that obtained on May 23, 2003. However, this is likely not a significant influence. While flow levels can affect the depth, and therefore the visibility of redds, the differences in flow between the two surveys (about 2,000 cfs lower for the Parametrix surveys) is not expected to have substantially affected redd visibility. Based on a topographic evaluation in 1996 (Johnson 1997), water depths likely changed by 1 foot or less in the reference areas between the two surveys. As a result, we suspect that human disturbance was the primary factor affecting the differences between these two independent surveys.
In 2003, redds were observed in many of the same spawning areas identified in previous years (Johnson 1997, Avista 2000a). However, the radio tracking information identified additional areas that may be used by spawning rainbow trout, based on fish locations during the spawning season. We found that nearly half of the radio-tagged fish occurring in areas other than the previously identified spawning areas. In particular, we found five radio-tagged fish located in the Mirabeau Point eddy area during the spawning season, yet observed no other indications that spawning activities occurred in the area. As a result, it is likely that some spawning activity may have been missed during spawning surveys conducted in 2003.
These results suggest that the existing information of spawning distribution in the upper river reach might overestimate the percentage of the total spawning that occurs in the spawning reference areas (Johnson 1997, Avista 2000a). Our inability to detected spawning activity in a number of these areas during the spawning season, due to water depth and visibility, also suggests that a greater proportion of the redds might be deeper than previously believed. The observation made in the T.J. Meenach springs spawning area in 2003 (Parametrix 2003), confirms that at least some deep water spawning occurs in the river. These deeper redds are less likely to be dewatered, under the flow regimes that currently occur in the Spokane River. However, because fish were observed in these areas, and some nearby spawning habitat was also subsequently identified, we are unable to verify that spawning actually occurred in these areas.
Unlike the upper river study reach, there is limited information concerning the spawning distribution of rainbow trout in the lower river reach. Kleist (1987) found limited spawning habitat in the free flowing reaches downstream of Monroe Street HED, and suggests that the apparent lack of spawning habitat was limiting the rainbow trout population in this reach. As in the upper study reach however, the radio tagged fish were detected in a number of areas during the spawning season where no redds were observed (see Figure 15). This suggests that rainbow trout are utilizing small gravel patches, which are difficult to locate and observe during the high flow conditions that occur during the spring. Kleist (1987) reported similar difficulties surveying the lower river reach.
While the radio-tagged fish tended to occupy shoreline eddies during the spawning season, spawning may have occurred away from the shorelines. The flows occurring during the spawning season limit the access to mid-channel areas that might provide suitable spawning substrate. Kleist (1987) observed that much of the available spawning habitat in the lower river tended to be located downstream of large in-stream objects, such as boulders and concrete slabs. While such areas might provide suitable spawning conditions, the spring flow conditions are also likely to obscure signs of spawning activity in these
Fisheries Work Group 553-2867-007 (02/02) Rainbow Trout Spawning Survey, 2003 – Final Report 5-4 November 2003
isolated pocket gravel areas, particularly for the relatively small redds typically dug by rainbow trout. We typically observed spawning activity in relatively shallow areas downstream of inundated vegetation. Such vegetation provides refuge from strong water velocities, decreases the scouring effects, and facilitates the accumulation of smaller substrate material. These shallow water areas also provide better observation conditions than mid-channel pocket gravel areas.
Marking redds early in the spawning season to help distinguish redds later in the season was not particularly beneficial in 2003. Runoff velocities across the spawning areas did not appear to significantly alter redd characteristics sufficiently to change their detection. All of the marked redds were still clearly visible during the post-spawning season surveys. In some cases, redds were still highly visible even though the markers had either been removed or buried by spawning activity subsequent to the marking. As a result, the post spawning season redd counts conducted in 2003 are believed accurate.
The overall redd density in the upper river study reach was about 13.6 redds per mile. However, approximately 88% of the spawning activity in the upper river study reach occurred between RM 95.1 and RM 92.1, similar to observations in 1995 and 1996 (87% and 96%, respectively). Redd density was slightly lower in the lower river study area (11.8 redds per mile), with about 84% of redds occurring between RM 70 and RM 74.
Fewer spawning fish were observed in the lower study reach than the upper reach. We observed almost 8 fish per mile of survey area in the upper reach and only 3 fish per mile downstream. However, these estimates might be influenced by the ability to detect fish in areas of greater concentration, lesser depths, and at known spawning areas, compared to the relatively small and diverse spawning areas in the lower reach. In addition, the spawning habitat in the lower reach was typically located adjacent to inundated vegetation, which also tends to make fish detections more difficult. Most of the spawning in the upper reach occurred at large river bars, or shoreline areas with limited inundated vegetation.
5.4 FRY EMERGENCE
Although observations of spawning and fry emergence was apparently a week later in the lower river reach than the upper reach, the fry appeared to be more developed in the lower reach at the observed time of emergence. This suggests that fry emergence might have begun several days earlier than we observed in the lower reach. Avista (2000a) reported yearly variations in the time of fry emergence of as much as three or four weeks in the upper river reach, despite a relatively consistent spawning period. Fry emergence in 2003 was therefore within the range of dates observed in previous years.
The minor difference in emergence timing between the two reach could be explained by variations in water temperature during the incubation period. Water temperatures in the lower river reach were consistently warmer throughout the spawning and incubation period than in the upper river study reach, averaging about 0.7° C warmer. Although the continuous temperature monitoring unit in the lower reach was located at the Nine Mile HED forebay, about 8 miles downstream of our study area, spot measurements immediately downstream of Monroe Street HED indicate similar temperatures (see Figure 5). While previous evaluations in the upper river study reach found no consistent pattern between incubation water temperature and emergence (Avista 2000a), eggs and yolk-sac fry experiencing warmer incubation temperatures would mature more quickly.
Previous evaluations estimated that fry emergence occurs between 750 and 900 degree-days after initiation of spawning in the Spokane River (Johnson 1997). A degree-day is one degree above 32° F for a 24-hour period. Based on this estimate and the temperature differences between the two study reaches, in 2003, emergence could have occurred between 3 and 4 days earlier in the lower river reach than the
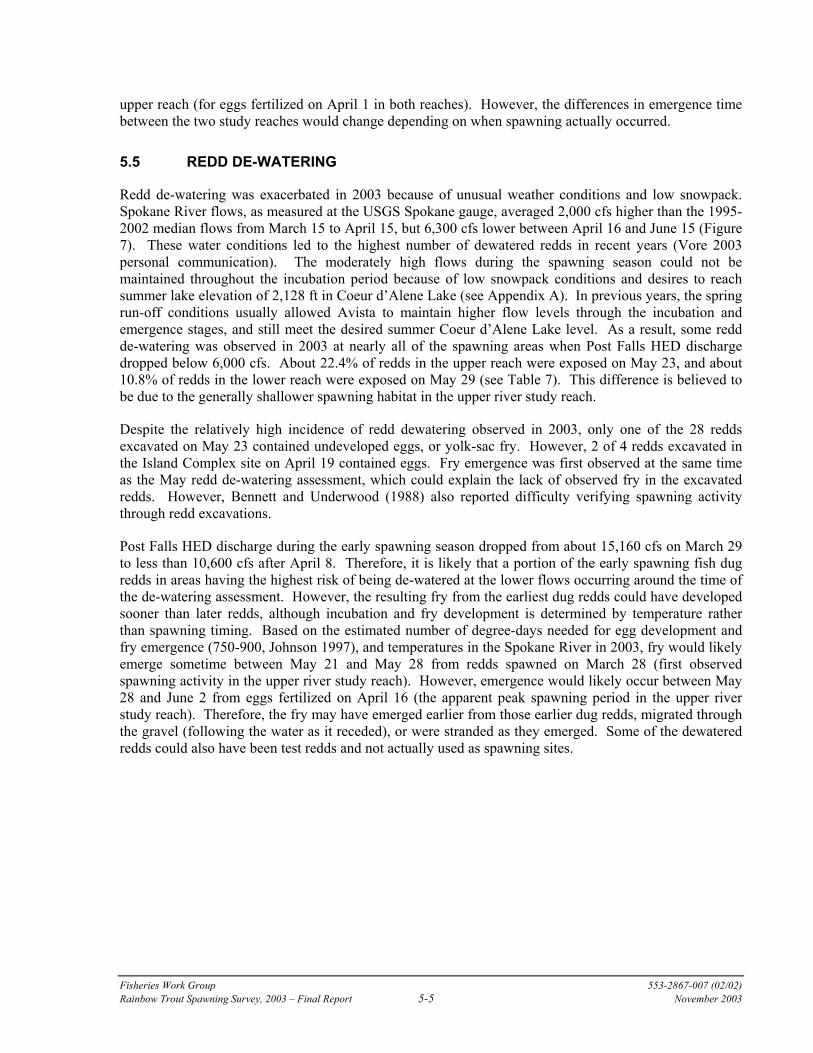
Fisheries Work Group 553-2867-007 (02/02) Rainbow Trout Spawning Survey, 2003 – Final Report 5-5 November 2003
upper reach (for eggs fertilized on April 1 in both reaches). However, the differences in emergence time between the two study reaches would change depending on when spawning actually occurred.
5.5 REDD DE-WATERING
Redd de-watering was exacerbated in 2003 because of unusual weather conditions and low snowpack. Spokane River flows, as measured at the USGS Spokane gauge, averaged 2,000 cfs higher than the 1995-2002 median flows from March 15 to April 15, but 6,300 cfs lower between April 16 and June 15 (Figure 7). These water conditions led to the highest number of dewatered redds in recent years (Vore 2003 personal communication). The moderately high flows during the spawning season could not be maintained throughout the incubation period because of low snowpack conditions and desires to reach summer lake elevation of 2,128 ft in Coeur d’Alene Lake (see Appendix A). In previous years, the spring run-off conditions usually allowed Avista to maintain higher flow levels through the incubation and emergence stages, and still meet the desired summer Coeur d’Alene Lake level. As a result, some redd de-watering was observed in 2003 at nearly all of the spawning areas when Post Falls HED discharge dropped below 6,000 cfs. About 22.4% of redds in the upper reach were exposed on May 23, and about 10.8% of redds in the lower reach were exposed on May 29 (see Table 7). This difference is believed to be due to the generally shallower spawning habitat in the upper river study reach.
Despite the relatively high incidence of redd dewatering observed in 2003, only one of the 28 redds excavated on May 23 contained undeveloped eggs, or yolk-sac fry. However, 2 of 4 redds excavated in the Island Complex site on April 19 contained eggs. Fry emergence was first observed at the same time as the May redd de-watering assessment, which could explain the lack of observed fry in the excavated redds. However, Bennett and Underwood (1988) also reported difficulty verifying spawning activity through redd excavations.
Post Falls HED discharge during the early spawning season dropped from about 15,160 cfs on March 29 to less than 10,600 cfs after April 8. Therefore, it is likely that a portion of the early spawning fish dug redds in areas having the highest risk of being de-watered at the lower flows occurring around the time of the de-watering assessment. However, the resulting fry from the earliest dug redds could have developed sooner than later redds, although incubation and fry development is determined by temperature rather than spawning timing. Based on the estimated number of degree-days needed for egg development and fry emergence (750-900, Johnson 1997), and temperatures in the Spokane River in 2003, fry would likely emerge sometime between May 21 and May 28 from redds spawned on March 28 (first observed spawning activity in the upper river study reach). However, emergence would likely occur between May 28 and June 2 from eggs fertilized on April 16 (the apparent peak spawning period in the upper river study reach). Therefore, the fry may have emerged earlier from those earlier dug redds, migrated through the gravel (following the water as it receded), or were stranded as they emerged. Some of the dewatered redds could also have been test redds and not actually used as spawning sites.
Fisheries Work Group 553-2867-007 (02/02) Rainbow Trout Spawning Survey, 2003 – Final Report 5-6 November 2003
0
5000
10000
15000
20000
25000
3/15 3/22 3/29 4/5 4/12 4/19 4/26 5/3 5/10 5/17 5/24 5/31 6/7 6/14
Flow
(cfs
)
2003 Spokane Gauge1995- 2003 Median2003 Post Falls Discharge
Figure 7 Spawning Period Flows in 2003, Compared to the 1995-2002 Average and Median Flows, Spokane River
Fisheries Work Group 553-2867-007 (02/02) Rainbow Trout Spawning Survey, 2003 – Final Report 6-1 November 2003
6. REFERENCES
Avista Corporation (Avista). 2000a. 1997-1999 Upper Spokane River Rainbow Trout Spawning and Fry Emergence Study. Report prepared by Avista Corporation, Spokane, Washington.
Avista Corporation (Avista). 2000b. Evaluation of Increased Minimum Flow at the Post Falls Hydroelectric Facility. Report prepared by Avista Corporation, Spokane, Washington.
Avista Corporation (Avista). 2003a. Habitat Use, Spawning Distribution and Movements of Rainbow Trout in the Spokane River, Final Study Plan. Study plan prepared for the Spokane River Hydroelectric Project relicensing Fisheries Work Group and Avista Corporation, Spokane, Washington.
Avista Corporation (Avista). 2003b. Fish Habitat Instream Flow Assessment, Final Study Plan. Study plan prepared for the Spokane River Hydroelectric Project relicensing Fisheries Work Group and Avista Corporation, Spokane, Washington.
Bailey, G.C. and J. Saltes. 1982. Fishery Assessment of the Upper Spokane River. State of Washington, Water Research Center, Washington State University, Pullman. Washington.
Bennett, D.H. and T.J. Underwood. 1988. Population Dynamics and Factors Affecting Rainbow Trout (Salmo gairdneri) in the Spokane River, Idaho. Department of Fish and Wildlife Resources, College of Forestry, Wildlife, and Range Sciences, University of Idaho, Moscow, Idaho.
Idaho Department of Fish and Game, Washington Department of Fish and Wildlife, and Washington Water Power. 1990. Unpublished study. Spokane River Fishery Evaluation.
Johnson, E. 1997. Upper Spokane River Rainbow Trout Spawning and Emergence Study for 1995 and 1996. Report prepared for the Spokane River Management Team. Avista Corporation (formerly Washington Water Power). Spokane, Washington.
Kleist, T. 1987. An Evaluation of the Fisheries Potential of the Lower Spokane River: Monroe Street Dam to Nine Mile Falls Dam. The Washington Water Power Company, Spokane, Washington.
Scott, W.B., and E.J. Crossman. 1973. Freshwater fishes of Canada. Fisheries Research Board of Canada. Ottawa, Canada.
Vore, T. 2003. Personal communication of September 3, 2003. Biologist, Avista Corporation, Spokane, Washington.
APPENDIX A
Chronology of Spring 2003 Post Falls HED Operations
Environmental Affairs DATE: October 6, 2003
TO: Fisheries Work Group
FROM: Tim Vore
SUBJECT: Chronology of Spring 2003 Post Falls HED Operations
Recent comments on the draft Rainbow Trout Spawning Survey 2003 indicate additional information concerning the 2003 operation of the Post Falls HED might be helpful. The following information provides some of the reasons behind the decisions made this spring concerning the operation of the Post Falls HED. I will be suggesting that Parametrix reference this memo in their report where they refer to this spring’s river flows and the “limitations” of Project operations.
Background Each year, we have coordinated an open consultation with the Washington Department of Fish and Wildlife (WDFW), Idaho Fish and Game (IDFG), and Avista’s hydro operations staff concerning Post Falls HED operation, snowpack and runoff conditions, and the status of rainbow trout redds and fry emergence. This coordination provides the flexibility to balance operations with the upstream and downstream interests, and the varying flow, trout spawning, and fry emergence conditions that occur each year. Weather conditions, snow pack, FERC license requirements, flooding concerns, interests for a stable summer lake level, fish spawning concerns, power demands, and other considerations create very unique challenges when determining how to best operate the Spokane River Project during and immediately following spring runoff.
Avista does not have the legal ability to cause upstream water levels above 2,128 ft. This condition necessitates careful consideration each spring before Avista begins to control Coeur d’Alene Lake levels. Once the threat of upstream flooding has passed, Avista then balances the downstream interests and fishery needs with the potentially competing objectives for upstream summer pool levels.
In most years, The Post Falls HED turbines and spill gates are open and exert no control over upstream water levels or downstream flows during the late-winter and/or spring runoff period. During these years, the natural restriction in the lake outlet and inflow conditions determine lake water levels and river flows (above and below Post Falls HED). Each year, decisions are made about how to best provide downstream flows to protect trout redds, minimize the potential for upstream flooding in the event of additional rain and/or snowmelt, and still achieve the normal summer lake elevation of 2,128 ft.
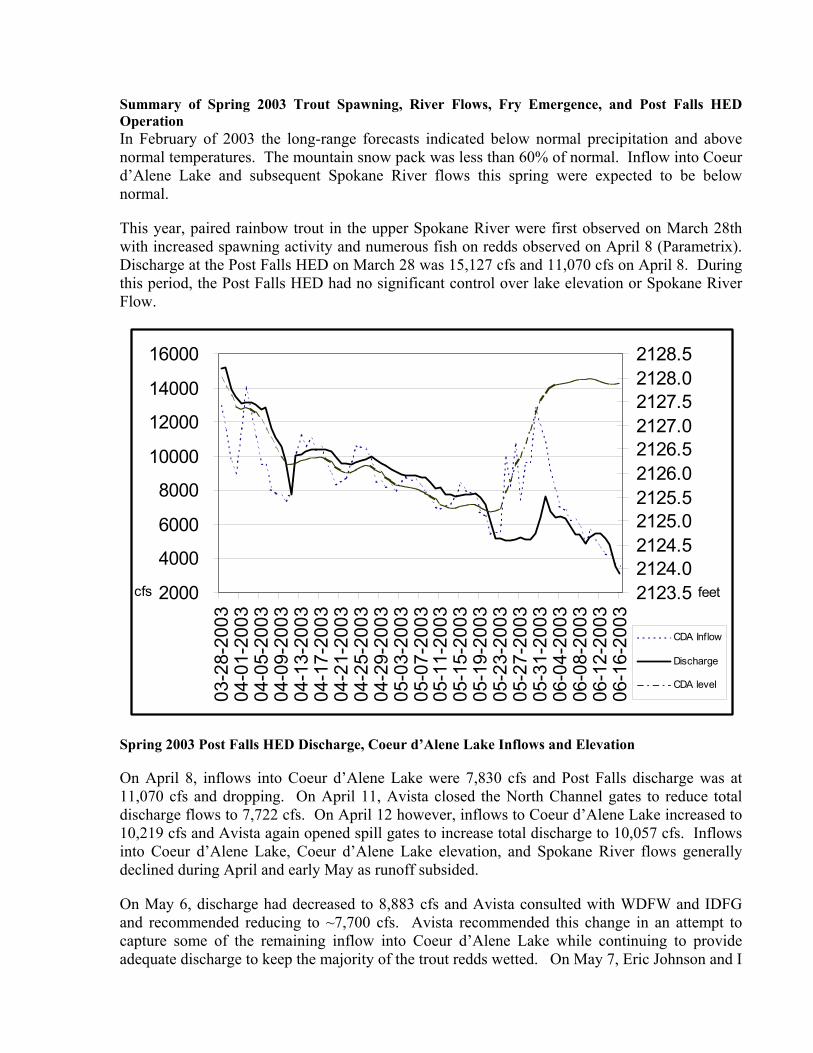
Summary of Spring 2003 Trout Spawning, River Flows, Fry Emergence, and Post Falls HED Operation In February of 2003 the long-range forecasts indicated below normal precipitation and above normal temperatures. The mountain snow pack was less than 60% of normal. Inflow into Coeur d’Alene Lake and subsequent Spokane River flows this spring were expected to be below normal.
This year, paired rainbow trout in the upper Spokane River were first observed on March 28th with increased spawning activity and numerous fish on redds observed on April 8 (Parametrix). Discharge at the Post Falls HED on March 28 was 15,127 cfs and 11,070 cfs on April 8. During this period, the Post Falls HED had no significant control over lake elevation or Spokane River Flow.
Spring 2003 Post Falls HED Discharge, Coeur d’Alene Lake Inflows and Elevation
On April 8, inflows into Coeur d’Alene Lake were 7,830 cfs and Post Falls discharge was at 11,070 cfs and dropping. On April 11, Avista closed the North Channel gates to reduce total discharge flows to 7,722 cfs. On April 12 however, inflows to Coeur d’Alene Lake increased to 10,219 cfs and Avista again opened spill gates to increase total discharge to 10,057 cfs. Inflows into Coeur d’Alene Lake, Coeur d’Alene Lake elevation, and Spokane River flows generally declined during April and early May as runoff subsided.
On May 6, discharge had decreased to 8,883 cfs and Avista consulted with WDFW and IDFG and recommended reducing to ~7,700 cfs. Avista recommended this change in an attempt to capture some of the remaining inflow into Coeur d’Alene Lake while continuing to provide adequate discharge to keep the majority of the trout redds wetted. On May 7, Eric Johnson and I
2000
4000
6000
8000
10000
12000
14000
16000
03-2
8-20
0304
-01-
2003
04-0
5-20
0304
-09-
2003
04-1
3-20
0304
-17-
2003
04-2
1-20
0304
-25-
2003
04-2
9-20
0305
-03-
2003
05-0
7-20
0305
-11-
2003
05-1
5-20
0305
-19-
2003
05-2
3-20
0305
-27-
2003
05-3
1-20
0306
-04-
2003
06-0
8-20
0306
-12-
2003
06-1
6-20
03cfs 2123.5
2124.02124.52125.02125.52126.02126.52127.02127.52128.02128.5
feet
CDA Inflow
Discharge
CDA level
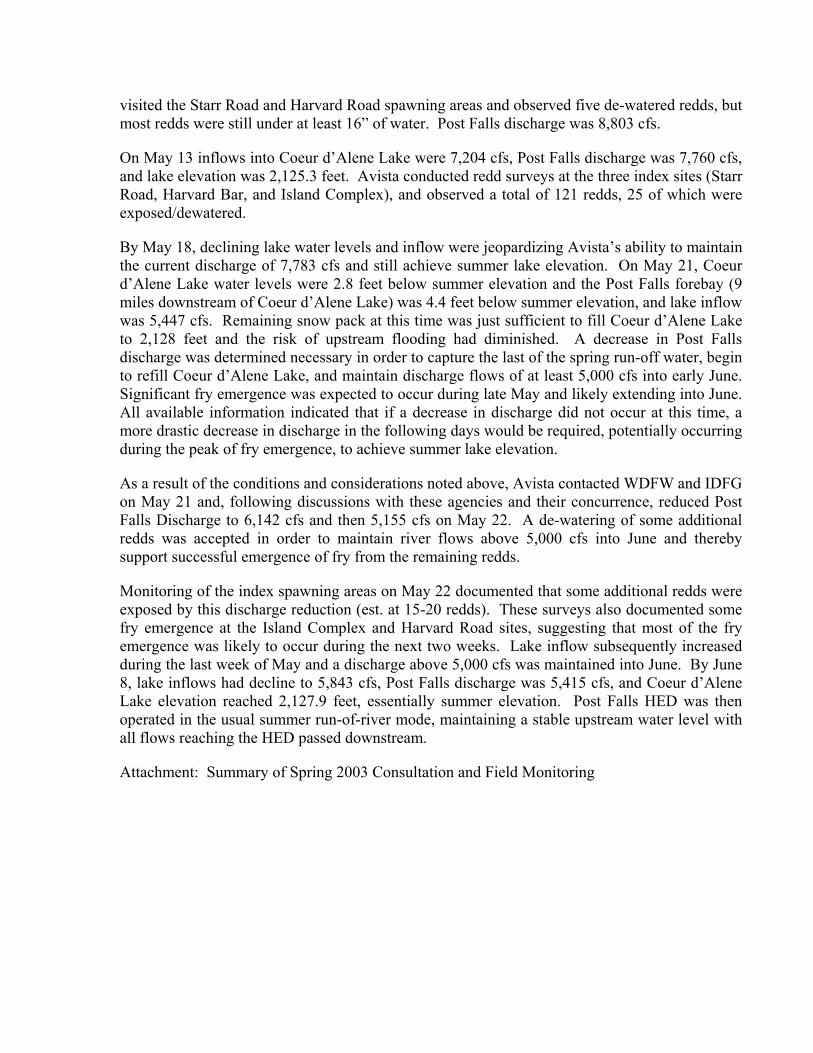
visited the Starr Road and Harvard Road spawning areas and observed five de-watered redds, but most redds were still under at least 16” of water. Post Falls discharge was 8,803 cfs.
On May 13 inflows into Coeur d’Alene Lake were 7,204 cfs, Post Falls discharge was 7,760 cfs, and lake elevation was 2,125.3 feet. Avista conducted redd surveys at the three index sites (Starr Road, Harvard Bar, and Island Complex), and observed a total of 121 redds, 25 of which were exposed/dewatered.
By May 18, declining lake water levels and inflow were jeopardizing Avista’s ability to maintain the current discharge of 7,783 cfs and still achieve summer lake elevation. On May 21, Coeur d’Alene Lake water levels were 2.8 feet below summer elevation and the Post Falls forebay (9 miles downstream of Coeur d’Alene Lake) was 4.4 feet below summer elevation, and lake inflow was 5,447 cfs. Remaining snow pack at this time was just sufficient to fill Coeur d’Alene Lake to 2,128 feet and the risk of upstream flooding had diminished. A decrease in Post Falls discharge was determined necessary in order to capture the last of the spring run-off water, begin to refill Coeur d’Alene Lake, and maintain discharge flows of at least 5,000 cfs into early June. Significant fry emergence was expected to occur during late May and likely extending into June. All available information indicated that if a decrease in discharge did not occur at this time, a more drastic decrease in discharge in the following days would be required, potentially occurring during the peak of fry emergence, to achieve summer lake elevation.
As a result of the conditions and considerations noted above, Avista contacted WDFW and IDFG on May 21 and, following discussions with these agencies and their concurrence, reduced Post Falls Discharge to 6,142 cfs and then 5,155 cfs on May 22. A de-watering of some additional redds was accepted in order to maintain river flows above 5,000 cfs into June and thereby support successful emergence of fry from the remaining redds.
Monitoring of the index spawning areas on May 22 documented that some additional redds were exposed by this discharge reduction (est. at 15-20 redds). These surveys also documented some fry emergence at the Island Complex and Harvard Road sites, suggesting that most of the fry emergence was likely to occur during the next two weeks. Lake inflow subsequently increased during the last week of May and a discharge above 5,000 cfs was maintained into June. By June 8, lake inflows had decline to 5,843 cfs, Post Falls discharge was 5,415 cfs, and Coeur d’Alene Lake elevation reached 2,127.9 feet, essentially summer elevation. Post Falls HED was then operated in the usual summer run-of-river mode, maintaining a stable upstream water level with all flows reaching the HED passed downstream.
Attachment: Summary of Spring 2003 Consultation and Field Monitoring
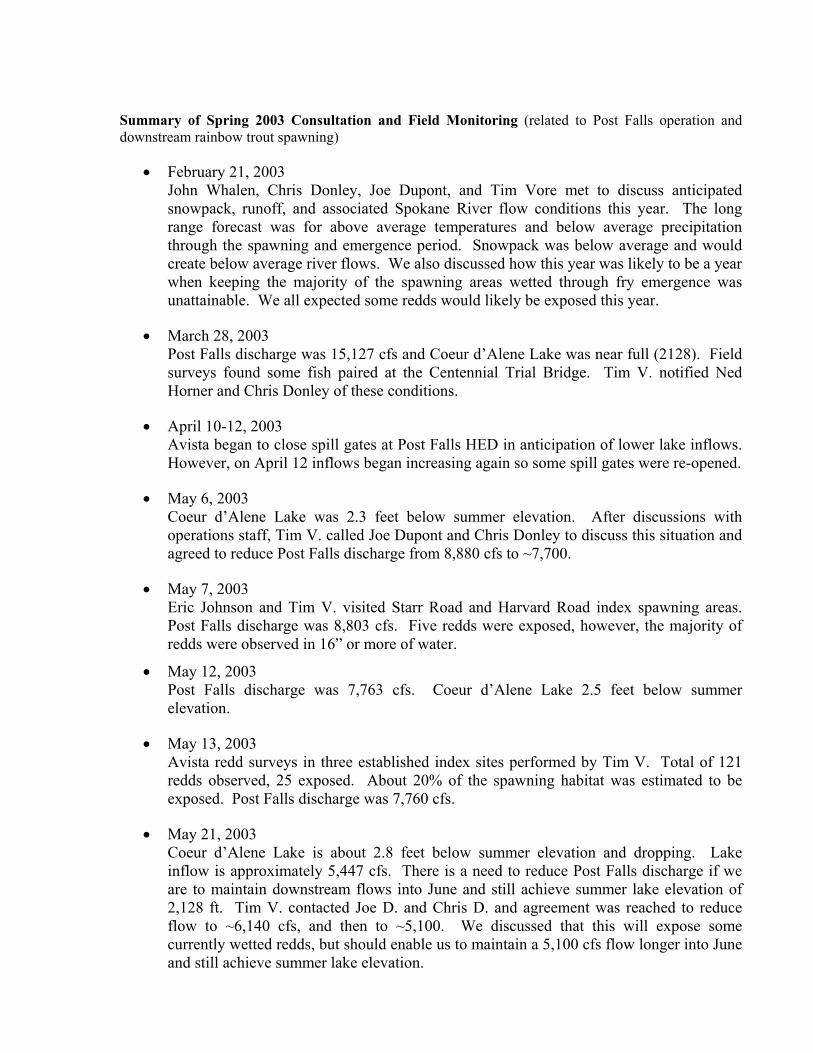
Summary of Spring 2003 Consultation and Field Monitoring (related to Post Falls operation and downstream rainbow trout spawning)
• February 21, 2003 John Whalen, Chris Donley, Joe Dupont, and Tim Vore met to discuss anticipated snowpack, runoff, and associated Spokane River flow conditions this year. The long range forecast was for above average temperatures and below average precipitation through the spawning and emergence period. Snowpack was below average and would create below average river flows. We also discussed how this year was likely to be a year when keeping the majority of the spawning areas wetted through fry emergence was unattainable. We all expected some redds would likely be exposed this year.
• March 28, 2003 Post Falls discharge was 15,127 cfs and Coeur d’Alene Lake was near full (2128). Field surveys found some fish paired at the Centennial Trial Bridge. Tim V. notified Ned Horner and Chris Donley of these conditions.
• April 10-12, 2003 Avista began to close spill gates at Post Falls HED in anticipation of lower lake inflows. However, on April 12 inflows began increasing again so some spill gates were re-opened.
• May 6, 2003 Coeur d’Alene Lake was 2.3 feet below summer elevation. After discussions with operations staff, Tim V. called Joe Dupont and Chris Donley to discuss this situation and agreed to reduce Post Falls discharge from 8,880 cfs to ~7,700.
• May 7, 2003 Eric Johnson and Tim V. visited Starr Road and Harvard Road index spawning areas. Post Falls discharge was 8,803 cfs. Five redds were exposed, however, the majority of redds were observed in 16” or more of water.
• May 12, 2003 Post Falls discharge was 7,763 cfs. Coeur d’Alene Lake 2.5 feet below summer elevation.
• May 13, 2003 Avista redd surveys in three established index sites performed by Tim V. Total of 121 redds observed, 25 exposed. About 20% of the spawning habitat was estimated to be exposed. Post Falls discharge was 7,760 cfs.
• May 21, 2003 Coeur d’Alene Lake is about 2.8 feet below summer elevation and dropping. Lake inflow is approximately 5,447 cfs. There is a need to reduce Post Falls discharge if we are to maintain downstream flows into June and still achieve summer lake elevation of 2,128 ft. Tim V. contacted Joe D. and Chris D. and agreement was reached to reduce flow to ~6,140 cfs, and then to ~5,100. We discussed that this will expose some currently wetted redds, but should enable us to maintain a 5,100 cfs flow longer into June and still achieve summer lake elevation.

• May 22, 2003 Post Falls discharge was at about 5,155 cfs. Field surveys found some fry emerging at the Island Complex and Harvard Road. Some additional redds (15-20) were observed de-watered.
• Late-May to mid-June 2003 Increased lake inflows allowed for maintaining or exceeding the 5,000 cfs discharge into mid-June and also achieving the summer lake elevation.
APPENDIX B
GPS Coordinates of Rainbow Trout Spawning Areas in the Spokane River, 2003
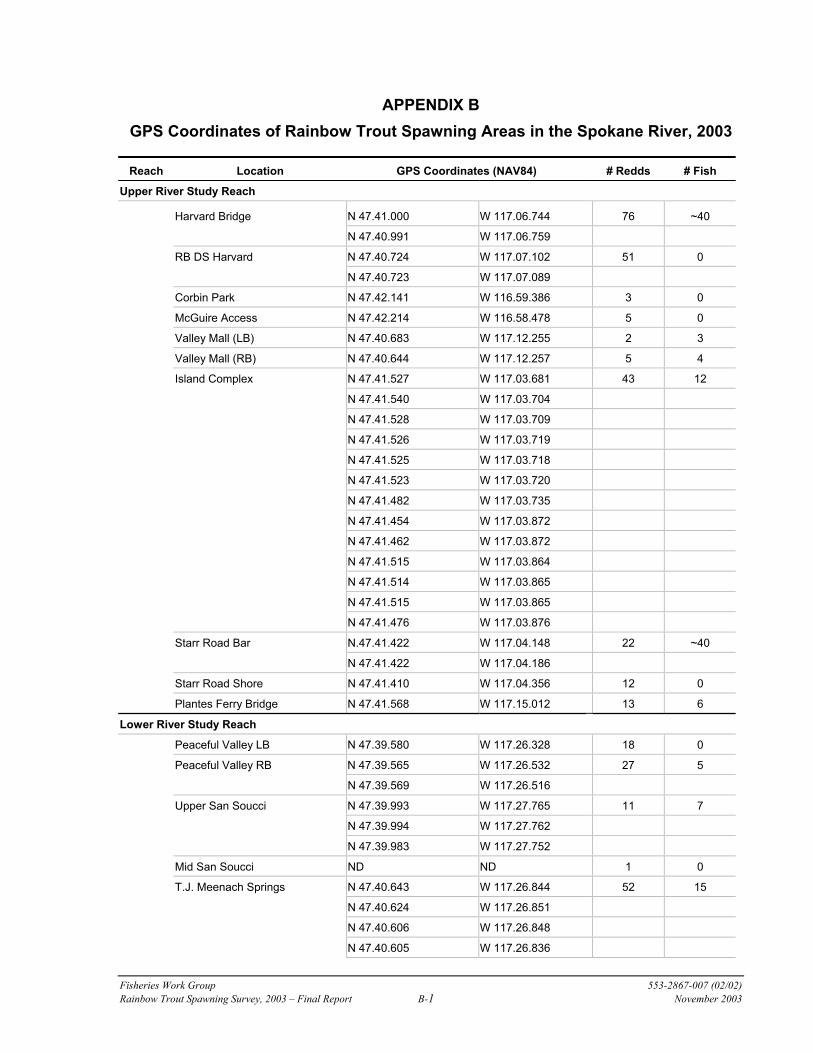
Fisheries Work Group 553-2867-007 (02/02) Rainbow Trout Spawning Survey, 2003 – Final Report B-1 November 2003
APPENDIX B GPS Coordinates of Rainbow Trout Spawning Areas in the Spokane River, 2003
Reach Location GPS Coordinates (NAV84) # Redds # Fish
Upper River Study Reach
Harvard Bridge N 47.41.000 W 117.06.744 76 ~40
N 47.40.991 W 117.06.759
RB DS Harvard N 47.40.724 W 117.07.102 51 0
N 47.40.723 W 117.07.089
Corbin Park N 47.42.141 W 116.59.386 3 0
McGuire Access N 47.42.214 W 116.58.478 5 0
Valley Mall (LB) N 47.40.683 W 117.12.255 2 3
Valley Mall (RB) N 47.40.644 W 117.12.257 5 4
Island Complex N 47.41.527 W 117.03.681 43 12
N 47.41.540 W 117.03.704
N 47.41.528 W 117.03.709
N 47.41.526 W 117.03.719
N 47.41.525 W 117.03.718
N 47.41.523 W 117.03.720
N 47.41.482 W 117.03.735
N 47.41.454 W 117.03.872
N 47.41.462 W 117.03.872
N 47.41.515 W 117.03.864
N 47.41.514 W 117.03.865
N 47.41.515 W 117.03.865
N 47.41.476 W 117.03.876
Starr Road Bar N.47.41.422 W 117.04.148 22 ~40
N 47.41.422 W 117.04.186
Starr Road Shore N 47.41.410 W 117.04.356 12 0
Plantes Ferry Bridge N 47.41.568 W 117.15.012 13 6
Lower River Study Reach
Peaceful Valley LB N 47.39.580 W 117.26.328 18 0
Peaceful Valley RB N 47.39.565 W 117.26.532 27 5
N 47.39.569 W 117.26.516
Upper San Soucci N 47.39.993 W 117.27.765 11 7
N 47.39.994 W 117.27.762
N 47.39.983 W 117.27.752
Mid San Soucci ND ND 1 0
T.J. Meenach Springs N 47.40.643 W 117.26.844 52 15
N 47.40.624 W 117.26.851
N 47.40.606 W 117.26.848
N 47.40.605 W 117.26.836
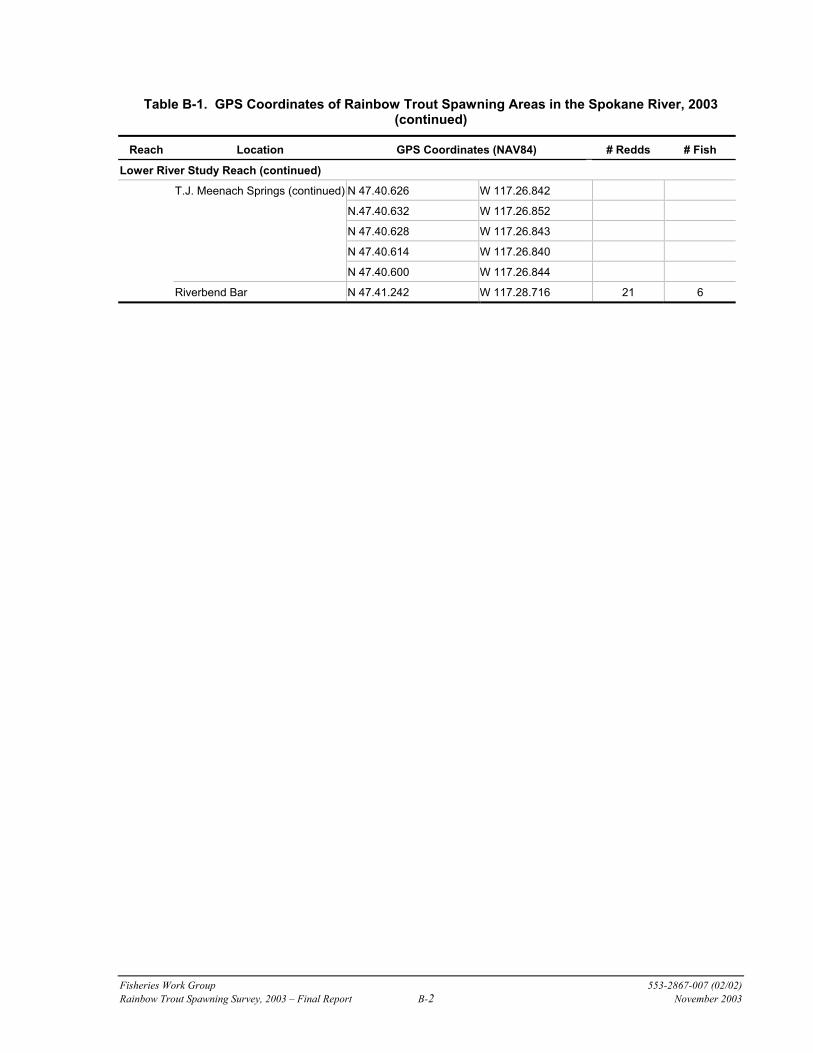
Table B-1. GPS Coordinates of Rainbow Trout Spawning Areas in the Spokane River, 2003 (continued)
Fisheries Work Group 553-2867-007 (02/02) Rainbow Trout Spawning Survey, 2003 – Final Report B-2 November 2003
Reach Location GPS Coordinates (NAV84) # Redds # Fish
Lower River Study Reach (continued)
T.J. Meenach Springs (continued) N 47.40.626 W 117.26.842
N.47.40.632 W 117.26.852
N 47.40.628 W 117.26.843
N 47.40.614 W 117.26.840
N 47.40.600 W 117.26.844
Riverbend Bar N 47.41.242 W 117.28.716 21 6

APPENDIX C
Areas Surveyed for Spawning Habitat and Activity in 2003
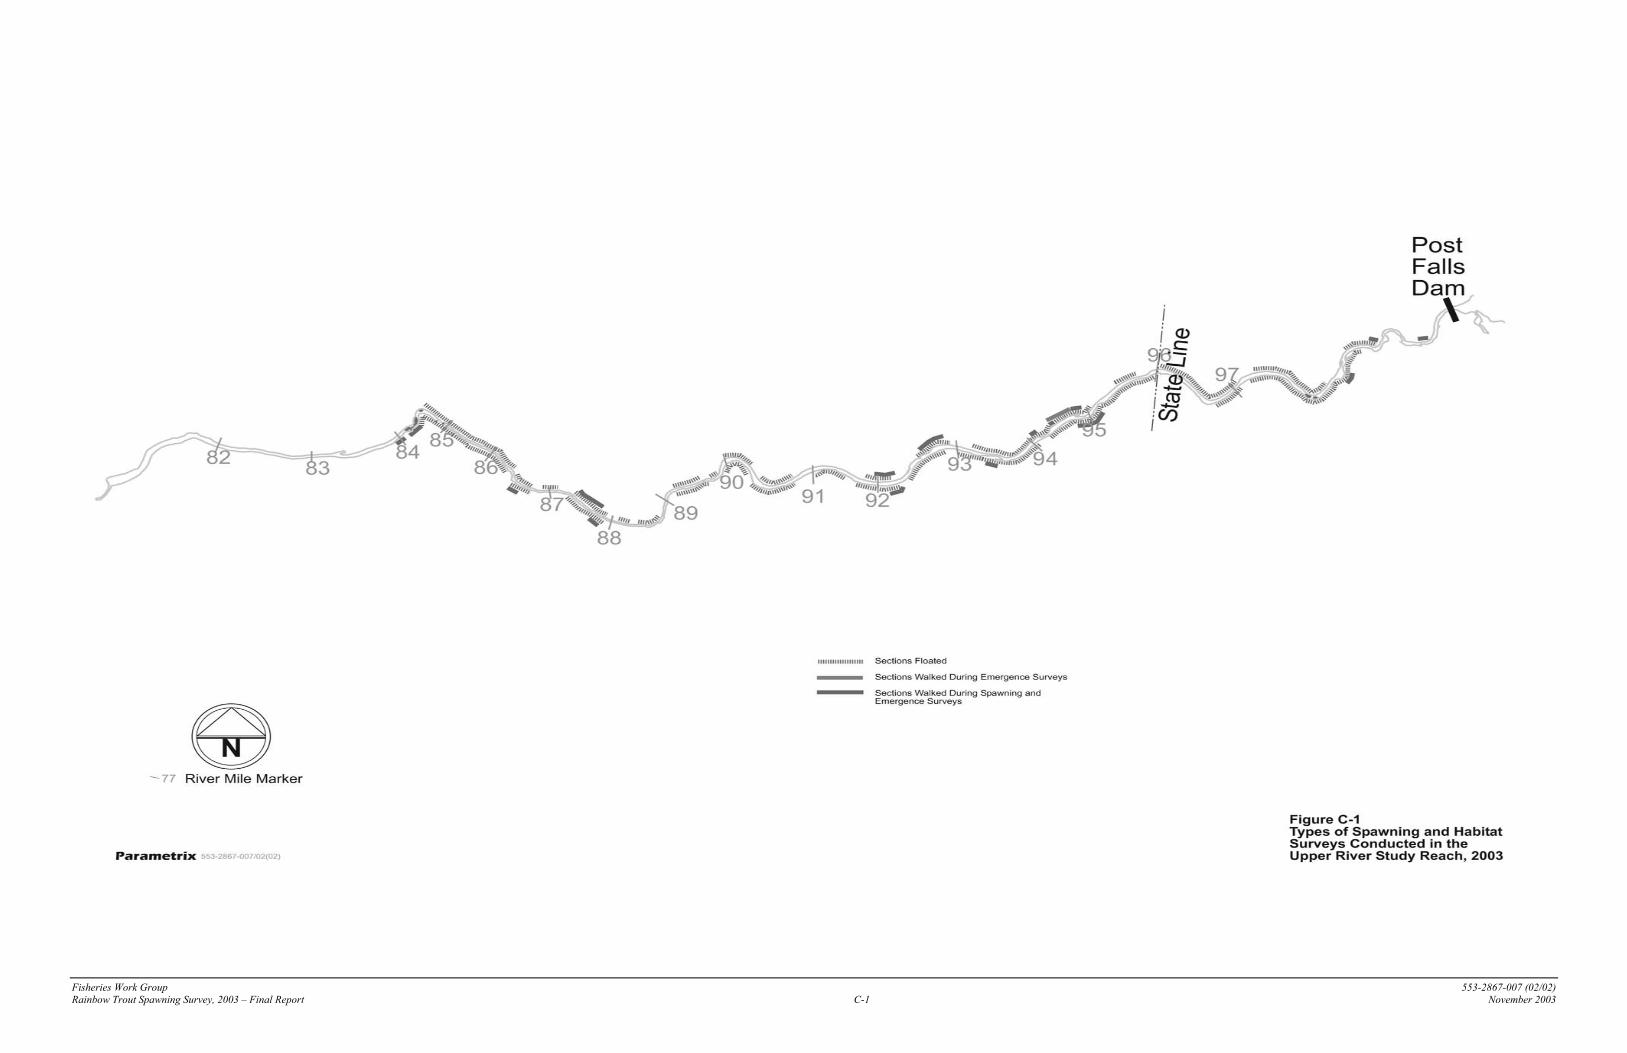
Fisheries Work Group 553-2867-007 (02/02) Rainbow Trout Spawning Survey, 2003 – Final Report C-1 November 2003
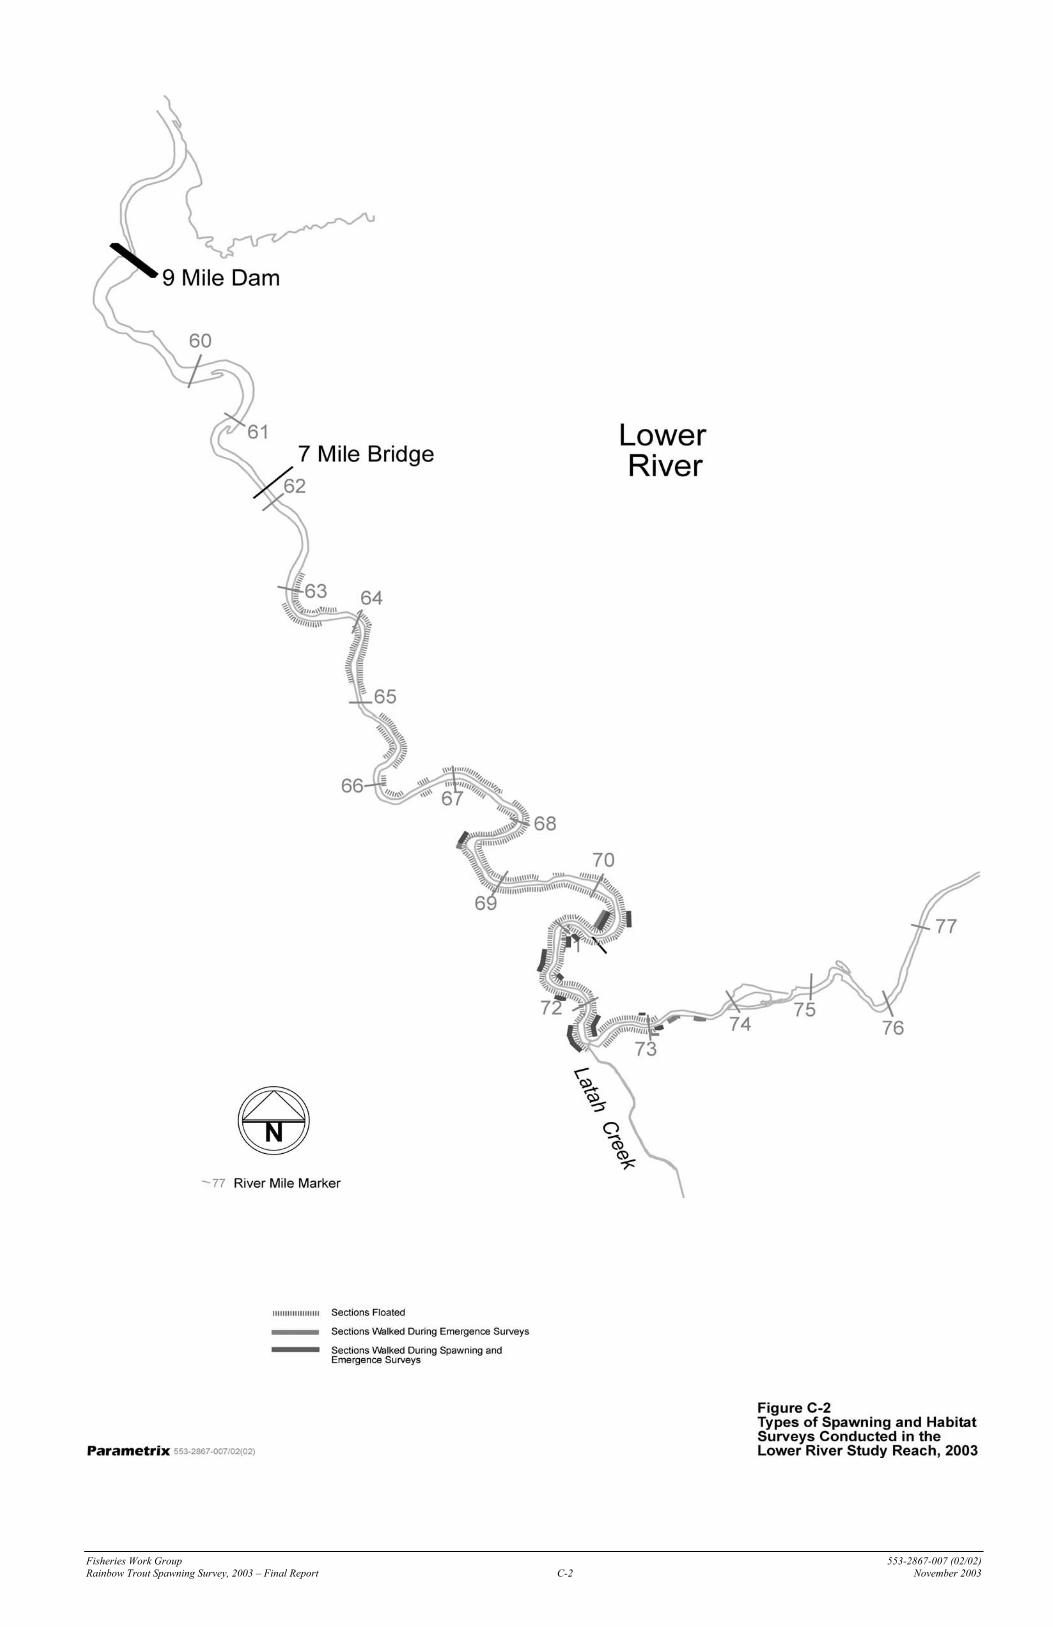
Fisheries Work Group 553-2867-007 (02/02) Rainbow Trout Spawning Survey, 2003 – Final Report C-2 November 2003