Embed Size (px)
Citation preview

SPAWNING AND EARLY LIFE-HISTORY CHARACTERISTICS OF
BULL TROUT IN A HEADWATER-LAKE ECOSYSTEM
by
Lora Beth Tennant
A thesis submitted in partial fulfillment of the requirements for the degree
of
Master of Science
in
Fish and Wildlife Management
MONTANA STATE UNIVERSITY Bozeman, Montana
May 2010

©COPYRIGHT
by
Lora Beth Tennant
2010
All Rights Reserved

ii
APPROVAL
of a thesis submitted by
Lora Beth Tennant
This thesis has been read by each member of the thesis committee and has been found to be satisfactory regarding content, English usage, format, citation, bibliographic style, and consistency and is ready for submission to the Division of Graduate Education.
Dr. Christopher S. Guy, Committee Chair
Dr. Robert E. Gresswell, Committee Co-chair
Approved for the Department of Ecology
Dr. David W. Roberts, Department Head
Approved for the Division of Graduate Education
Dr. Carl A. Fox

iii
STATEMENT OF PERMISSION TO USE
In presenting this thesis in partial fulfillment of the requirements for a
master’s degree at Montana State University, I agree that the Library shall make it
available to borrowers under rules of the Library.
If I have indicated my intention to copyright this thesis by including a
copyright notice page, copying is allowable only for scholarly purposes, consistent with
“fair use” as prescribed in the U.S. Copyright Law. Requests for permission for extended
quotation from or reproduction of this thesis in whole or in parts may be granted
only by the copyright holder.
Lora Beth Tennant May 2010

iv
ACKNOWLEDGMENTS
There are many people and agencies that have provided support for this research.
The Glacier Fund and the National Park Service provided funding and field
accommodations. Casey Smith, Amber Steed, and Jan Boyer provided technical
assistance while in the field. Bill Michels, Chris Downs, Regi Altop, and Scott
Emmerich helped with logistical field planning. Josh Joubert and Tim Sullivan
transported gear with the help of several mule strings.
Bob Gresswell, Christopher Guy, and Wyatt Cross provided intellectual
stimulation and mentorship. They also reined me back in when I was too far off in left
field. Lynn Digennaro made project finances easy. My fellow graduate students
provided perspective, suggestions, and distraction.
My family provided unwavering support. I am particularly thankful to my parents
and sisters for stimulating my interest in the environment by providing me a childhood
full of evening fishing trips, walks in the woods, picnics in the mountains, and
encouraging a curious kid to play outside. However, they now wonder if I will ever grow
up. I also thank my many friends I have made since I moved to Bozeman, they will make
it hard to leave.
An additional and very special thank you goes to Mike Meeuwig. Mike has
unselfishly provided hours upon hours of analytical consultation. Beyond just talking
shop, he is always up for an afternoon walk, backpack in the desert, or a powder day at
Bridger Bowl. I can’t thank him enough.
v
TABLE OF CONTENTS
1. INTRODUCTION ........................................................................................................ 1
2. METHODS ................................................................................................................... 7
Study Area .................................................................................................................... 7 Temperature and Discharge .......................................................................................... 9 Physical Habitat Characteristics ................................................................................... 9 Spatial Distribution of Bull Trout Redds .................................................................... 10 Subadult Bull Trout Presence and Distribution .......................................................... 13
3. RESULTS ................................................................................................................... 16
Physical Habitat Characteristics ................................................................................. 16 Spatial Distribution of Bull Trout Redds .................................................................... 17 Subadult Bull Trout Presence and Distribution .......................................................... 21
4. DISCUSSION ............................................................................................................. 27
REFERENCES ................................................................................................................. 33
APPENDICES .................................................................................................................. 40
APPENDIX A: 2008 Stream Segment and Reach Geospatial Coordinates .............. 41 APPENDIX B: 2008 Physical Habitat Characteristics .............................................. 43 APPENDIX C: 2008 Bull Trout Redd Counts .......................................................... 55 APPENDIX D: 2008 Subadult Bull Trout Surveys ................................................... 59 APPENDIX E: 2007 Bull Trout Redd Counts ........................................................... 63 APPENDIX F: 2007 Subadult Bull Trout Surveys ................................................... 65
vi
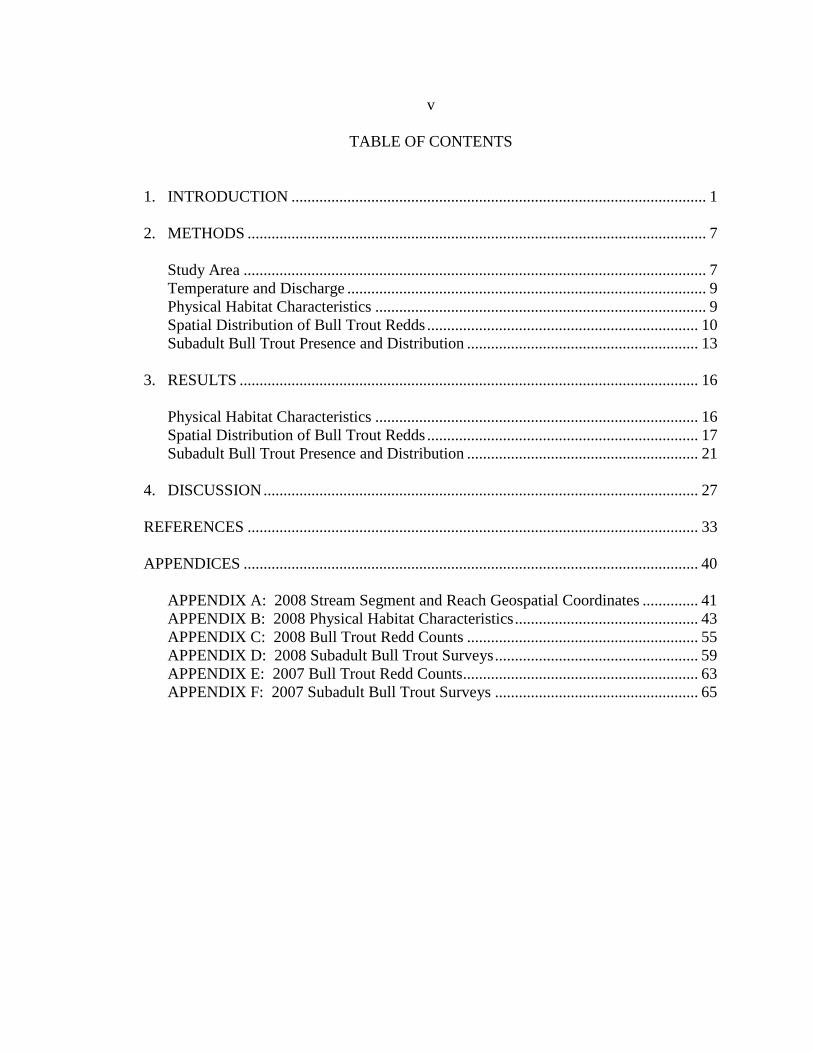
LIST OF TABLES Table Page 1. Subadult bull trout presence model number and the variables in the model for 11
combinations of variables used to examine subadult bull trout occurrence within tributaries to Quartz Lake, Glacier National Park, Montana.. .................................... 15
2. Mean (±95% CL) habitat unit abiotic characteristic by stream segment sampled in Glacier National Park, Montana. Biotic characteristic totals by stream segment sampled in Glacier National Park, Montana. Lower Quartz Creek included Quartz Creek from the inlet of Quartz Lake to the confluence of Quartz and Rainbow creeks and upper Quartz Creek included Quartz Creek upstream from the confluence of Quartz and Rainbow creeks to a putative fish barrier.. ........................ 17
3. Subadult bull trout presence model rank, model number, Akaike’s Information Criterion adjusted for small sample size (AICc), AICc differences (ΔAICc), and evidence ratio (w1/ w2) for comparing models used to examine abiotic effects on subadult bull trout occurrence in the Quartz Lake drainage, Glacier National Park, Montana.. ........................................................................................................... 25
4. Subadult bull trout presence model rank, model number, model parameters, parameter estimates, parameter estimate standard errors, parameter estimate P-values, and model R2 values used to examine abiotic effects on subadult bull trout occurrence in the Quartz Lake drainage, Glacier National Park, Montana.. ...... 26

vii
LIST OF FIGURES Figure Page 1. Study area and stream segment designations in Glacier National Park, Montana.
Stream segment designations (lower Quartz Creek, upper Quartz Creek, and Rainbow Creek) were based on stream hydrology and order.. ..................................... 8
2. Index reach designated for bull trout redd surveys in the study area, Glacier National Park, Montana.. ............................................................................................ 11
3. Discharge, water temperature, and number of new bull trout redds in the Quartz Creek redd survey index reach upstream of Quartz Lake, Glacier National Park, Montana.. .................................................................................................................... 18
4. Distance of each bull trout redd from the Quartz Lake inlet and its associated date of detection in the Quartz Creek redd survey index reach upstream of Quartz Lake, Glacier National Park, Montana. The confluence of Quartz and Rainbow creeks occurs at 1303 m. ........................................................................................................ 19
5. Bull trout redd accumulation (cumulative frequency of redds as a function of distance) in lower Quartz Creek (0 to 1303 m from the Quartz Lake inlet) and Rainbow Creek (1303 to 3265 m from the Quartz Lake inlet), Glacier National Park, Montana. The confluence of Quartz and Rainbow creeks occurs at 1303 m.. . 20
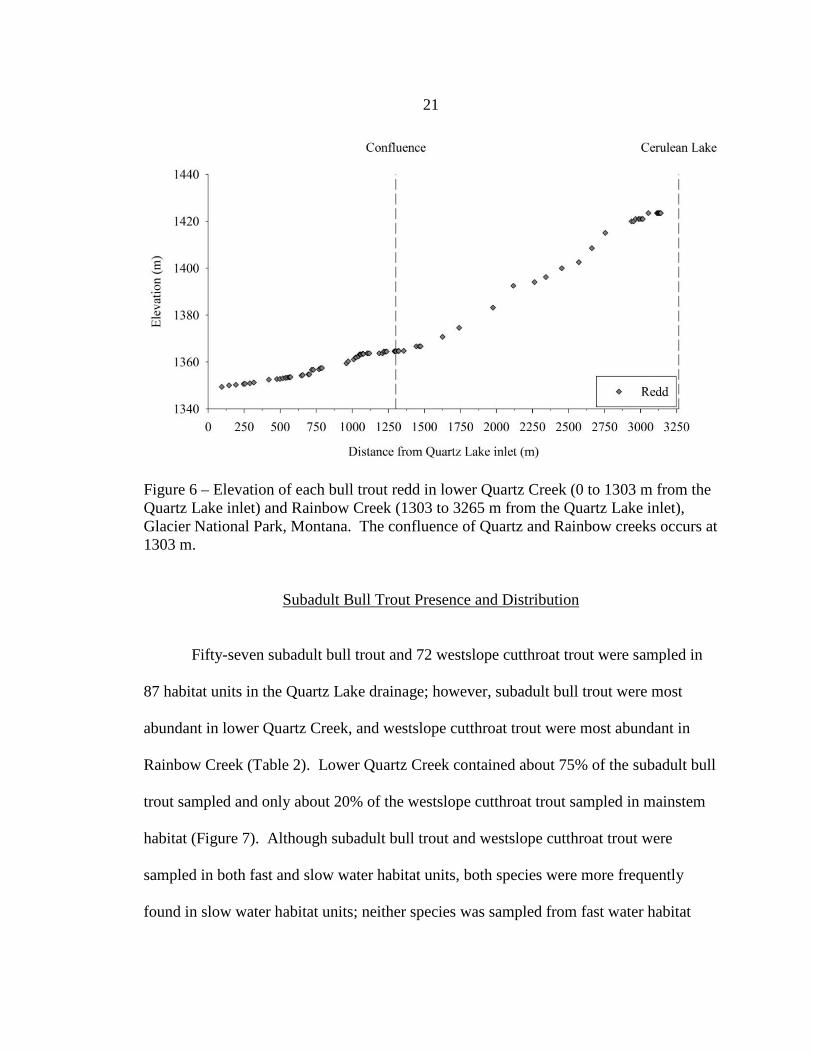
6. Elevation of each bull trout redd in lower Quartz Creek (0 to 1303 m from the Quartz Lake inlet) and Rainbow Creek (1303 to 3265 m from the Quartz Lake inlet), Glacier National Park, Montana. The confluence of Quartz and Rainbow creeks occurs at 1303 m.. ............................................................................................ 21
7. Cumulative frequency of subadult bull trout and westslope cutthroat trout in mainstem habitat in lower Quartz Creek (0 to 1303 m from the Quartz Lake inlet) and Rainbow Creek (1303 to 3265 m from the Quartz Lake inlet), Glacier National Park, Montana. The confluence of Quartz and Rainbow creeks occurs at 1303 m..................................................................................................................... 22
8. Frequency of stream segments and habitat unit types with (a) subadult bull trout present and absent and (b) westslope cutthroat trout present and absent. Stream segments refer to lower Quartz Creek (LQC), upper Quartz Creek (UQC), and Rainbow Creek (RBC). Habitat unit types refer to slow water habitat units (-S; i.e., pools or glides) and fast water habitat units (-F; i.e., riffles or rapids). ........ 23
9. Length-frequency histogram of subadult bull trout sampled within the Quartz Lake drainage, Glacier National Park, Montana. ........................................................ 24
viii
ABSTRACT
Bull trout Salvelinus confluentus are in decline throughout their native range. Interaction with nonnative species is considered to be one of the drivers of bull trout decline. Bull trout exhibit a variety of life-history strategies and lacustrine-adfluvial bull trout seem to be particularly susceptible to population decline when nonnative lake trout S. namaycush invade or are introduced into lakes where bull trout are the dominant salmonid. Quartz Lake in Glacier National Park, Montana, provided a unique opportunity to gather information on the spawning and early life-history characteristics of a bull trout population prior to anticipated declines in bull trout abundance due to lake trout invasion. The objectives of this study were (1) to characterize the spatial and temporal dynamics of bull trout spawning migrations and associate areas of high redd accumulation to abiotic factors, and (2) to quantify the influence of abiotic factors on the distribution of subadult bull trout in tributary streams of Quartz Lake. Stream surveys were conducted to quantify physical habitat characteristics in the study area, backpack electrofishing was used to sample subadult bull trout rearing in lake tributaries, and redd surveys were used to investigate the spatial and temporal trends in the accumulation of bull trout redds. Bull trout redds and subadult bull trout were found throughout the study area; however, bull trout spawning and rearing appeared to be concentrated in lower Quartz Creek. This area was low gradient, and there was a high percent of gravel and cobble substrates. Bull trout spawning began in late September, peaked in early October, and concluded in mid-October. These data provide important information on bull trout life-history in headwater lakes and provide biologists with baseline data that will be useful for assessing the effects of lake trout suppression efforts that began in 2009.

1
INTRODUCTION
The introduction of fishes into areas outside of their native ranges has occurred
for thousands of years (Li and Moyle 1999). Many of these introductions have
historically occurred with the intention of enhancing recreational fishing; however, a
result of these introductions is often a reduction in native species biodiversity (Lodge
1993; Knapp et al. 2001) through predation and competition (Vander Zanden et al. 1999),
and loss of genetic diversity (Ferguson 1990). For example, the abundance of yellow
legged frog Rana mucosa is less where fish have been introduced compared to fishless
water bodies (Knapp and Matthews 2000). Additionally, the introduction of rainbow
trout Oncorhynchus mykiss into cutthroat trout O. clarkii habitat has been shown to
reduce the genetic integrity of westslope cutthroat trout O. c. lewisi (Muhlfeld et al. 2009)
and Yellowstone cutthroat trout O. c. bouvieri (Kruse et al. 2000) populations due to
hybridization.
A substantial proportion of natural resource management is currently focused on
restoration activities. However, information on ecological conditions prior to ecosystem
perturbations is useful for managing ecological systems for the present and future
(Landres et al. 1999). Therefore, effective restoration is aided by reference or baseline
data to define restoration benchmarks, determine restoration-site potential, and evaluate
restoration efforts (White and Walker 1997). Baseline data need to incorporate the
composition, structure, dynamics, and spatial context of a species or ecosystem (White
and Walker 1997). Furthermore, accurate baseline data for species at all life-history
stages are important in restoration and recovery (Pauly 1995; White and Walker 1997),

2 especially if the species is threatened or endangered. Site- or population-specific baseline
data may be particularly useful for conservation and recovery efforts aimed at species
that exhibit species-level variability in ecological characteristics, life-history strategies, or
evolutionary histories.
One species that may benefit from site-specific or population-specific baseline
data is the bull trout Salvelinus confluentus. Bull trout is a species of char endemic to
western North America. The historic distribution of bull trout includes coldwater habitats
in northern California and Nevada, east of the Continental Divide in Idaho, Montana, and
a small portion of Wyoming, throughout the majority of Oregon and Washington, and
north into British Columbia and Alberta (McPhail and Baxter 1996). Bull trout are also
present in the foothills on the east side of the Continental Divide in northwest Montana.
Bull trout exhibit variability in ecological and life-history characteristics
throughout their range. For example, both migratory (potamodromous and anadromous)
and non-migratory (resident) life-history strategies have been documented, and
potamodromous bull trout exhibit fluvial, fluvial-adfluvial, lacustrine-adfluvial, or
allacustrine migration patterns (terminology follows Varley and Gresswell 1988;
Northcote 1997). Variation in life-history strategies can arise from spatial, seasonal, and
ontogenetic separation of optimal habitats for growth, survival, and reproduction
(Northcote 1984).
Bull trout spawn in the autumn, and changes in river discharge, water
temperature, and declining photoperiod coincide with bull trout spawning migrations
(Fraley and Shepard 1989; Brenkman et al. 2001). However, spawning migrations by

3 adfluvial bull trout may begin as early as April and can entail migratory distances > 250
km (Fraley and Shepard 1989). Bull trout redds are often constructed in areas of low
stream gradient and abundant gravel substrate (Fraley and Shepard 1989).
Length-frequency data for subadult bull trout from the Flathead River Basin
suggest that bull trout are approximately 50-70 mm at age 1, 100-120 mm at age 2, and
150-170 mm at age 3 (Pratt 1992). Migratory forms of subadult (i.e., sexually immature)
bull trout emigrate from natal tributaries to larger rivers and lakes primarily at age 2
(Fraley and Shepard 1989; Pratt 1992); however, a large number of age-0 bull trout may
emigrate in association with spring runoff and warming water temperatures in some
systems (e.g., McPhail and Murray 1979; Downs et al. 2006). Subadult bull trout in natal
tributaries are positively related to pool habitat (Saffel and Scarnecchia 1995), cover
(Bonneau and Scarnecchia 1998), and areas of low gradient (Rich et al. 2003).
Additionally, subadult bull trout are found to be negatively related to fine sediment
(Dambacher and Jone 1997; Thurow 2006).
Although bull trout were historically widespread in western North America, this
species was listed as threatened in the Columbia River drainage under the U.S.
Endangered Species Act in 1998 following population declines throughout the historic
range. Bull trout populations may be negatively affected by habitat alterations, such as
fragmentation caused by dams, dewatering, and elevated temperatures (Nelson et al.
2002), and global climate change is predicted to result in broad-scale decreases in
suitable habitat for bull trout (Rieman et al. 2007). However, nonnative species may
negatively influence bull trout populations (Rieman and McIntyre 1995) even where

4 anthropogenic habitat alterations have been limited (e.g., protected lands such as state
and federal parks and wilderness preserves).
The introduction of lake trout S. namaycush into Flathead Lake, Montana, in 1905
(Spencer et al. 1991) poses a threat to lacustrine-adfluvial bull trout populations. For
example, lake trout have been shown to negatively affect bull trout populations in as little
as 20 to 30 years (Donald and Alger 1993; Fredenberg 2002; Martinez et al. 2009), and
the ongoing spread of lake trout in the Flathead River drainage has resulted in
colonization and establishment of lake trout in the majority of lakes on the west side of
the Continental Divide in Glacier National Park, Montana. Furthermore, lacustrine-
adfluvial bull trout occupying headwater lakes in Glacier National Park may exhibit life-
history characteristics that differ from bull trout in larger systems. For example, redd
survey data suggests that individuals from these lakes frequently migrate only a few
kilometers upstream to reach the natal spawning grounds (Meeuwig and Guy 2007),
spawning generally occurs over a short period of time, and postspawning adults return
directly to the lake. Additionally, subadult bull trout may emigrate from natal rearing
habitats at earlier ages than observed in larger lake-river systems because of the harsh
summer and winter conditions found in high elevation systems in Glacier National Park
(e.g., Meeuwig 2008). Therefore, site-specific baseline data may be necessary to
document potentially novel life-history characteristics and to provide a benchmark for
bull trout conservation and recovery efforts within Glacier National Park.
Bull trout research and monitoring in Glacier National Park has primarily focused
on adult and sexually immature fish susceptible to sampling with gillnets in lacustrine
5 environments (e.g., Fredenberg 2002; Dux 2005; Meeuwig 2008; Meeuwig et al. 2008;
Meeuwig et al. in press). Consequently, data regarding spawning dynamics of lacustrine-
adfluvial bull trout and life-history characteristics and habitat requirements of subadult
bull trout in natal habitats are lacking, and baseline data for use in conservation and
recovery planning are generally limited to historical accounts (e.g., Schultz 1941; Morton
1968).
Quartz Lake is currently a site of bull trout conservation priority in Glacier
National Park. Prior to 2005, Quartz Lake, a natural headwater lake without road access,
was the fourth largest lake in the Columbia River Basin without introduced salmonids
(W. Fredenberg, USFWS, personal communication). Lake trout were first documented
by anglers in Quartz Lake in July 2005. Gill-net surveys conducted during 2005 and
2006, and bull trout redd surveys conducted in 2004 through 2006 indicated that bull
trout were still abundant in Quartz Lake and that the relative abundance of lake trout was
low compared to other lake trout invaded systems in Glacier National Park (Meeuwig and
Guy 2007; Meeuwig et al. 2008). Therefore, the lake provided an opportunity to gain
information on a system of conservation concern prior to population level declines in bull
trout that have been observed in other systems (e.g., Donald and Alger 1993; Fredenberg
2002). Additionally, an experimental lake trout suppression effort began in Quartz Lake
during the autumn of 2009 (C. Downs, USNPS, personal communication); consequently,
data gathered from the current study will be directly applicable to evaluate bull trout
conservation efforts. Therefore, the objectives of this study were (1) to characterize the
spatial and temporal dynamics of bull trout spawning migrations and associate areas of

6 high redd accumulation to abiotic factors and (2) to quantify the influence of abiotic and
biotic factors on the distribution of subadult bull trout in tributary streams to Quartz
Lake.

7
METHODS
Study Area
The study system included portions of the drainage network upstream of Quartz
Lake. Quartz Lake is located in the North Fork Flathead River drainage on the west side
of the Continental Divide in Glacier National Park. Quartz Lake has a surface area of
352 ha, maximum length of 4.8 km, and maximum depth of about 83 m, and is situated in
a glacially carved basin that is primarily fed by snow and glacial meltwater. Quartz
Creek, the main tributary to the lake, flows about 7 km (stream length) from the outlet of
Gyrfalcon Lake to Quartz Lake. Rainbow Creek drains Cerulean Lake and flows
downstream about 2 km (stream length) from the outlet of Cerulean Lake before entering
Quartz Creek approximately 1.3 km upstream from Quartz Lake. Data collection focused
on Quartz Creek from the inlet of Quartz Lake upstream to a putative fish barrier and
Rainbow Creek from its confluence with Quartz Creek upstream to the outlet of Cerulean
Lake (hereafter referred to as the Quartz Lake drainage; Figure 1).
The Quartz Lake drainage was partitioned into three stream segments based on
stream hydrology and stream order (Figure 1). Lower Quartz Creek included contiguous
mainstem and side channel habitat between the inlet of Quartz Lake and the confluence
of Quartz and Rainbow creeks. Upper Quartz Creek extended between the confluence of
Quartz and Rainbow creeks and the putative fish barrier on Quartz Creek, and Rainbow
Creek included contiguous mainstem and side channel habitat between the confluence of
Quartz and Rainbow creeks and the outlet of Cerulean Lake (Figure 1). All sampling

8 occurred during the summer and autumn of 2008.
Figure 1 - Study area and stream segment designations in Glacier National Park, Montana. Stream segment designations (lower Quartz Creek, upper Quartz Creek, and Rainbow Creek) were based on stream hydrology and order.
Cerulean Lake
Quartz Lake
Lower Quartz Creek
Upper Quartz Creek
Rainbow Creek
9
Temperature and Discharge
Water temperature (°C) was monitored with a temperature data logger (Onset
Computer Corporation, Bourne, Massachusetts) that was anchored to the substrate in the
stream channel immediately upstream of the inlet of Quartz Lake. Stream temperature
was recorded every 2 h from August 5 through October 11.
Stage (water height, m) was monitored with a data-logging staff gauge (TruTrack,
Ltd., New Zealand; Model WT-HR) that was placed in lower Quartz Creek in a low-
velocity area next to the stream bank. Stage was recorded every 2 h from August 5
through October 11, except during the period of September 16-23 when no data were
recorded because of equipment failure. The staff gauge was relocated and reinstalled on
September 24.
Stream discharge (m3/s) was measured biweekly from August 5 through October
11 at a site in Quartz Creek downstream of the staff gauge to develop a stage–discharge
relationship (Buchanan and Somers 1969). Discharge was calculated from stream
velocity (m/s) measurements taken at 60% of the stream depth at each 0.2 m increment
across the stream channel (Gallagher and Stevenson 1999). Stage-discharge relationships
were established using simple linear regression (initial gauge site: R2 = 0.99; relocated
gauge site: R2 = 0.95).
Physical Habitat Characteristics
Physical habitat surveys (modified from Gresswell et al. 2006) were conducted
from August 7 through August 13 throughout the Quartz Lake drainage. Habitat units

10 were identified starting at the inlet of Quartz Lake and proceeded upstream. Each habitat
unit in both mainstem and side channel areas was classified as a pool, riffle, glide, or
rapid (Bisson et al. 1982).
Length (nearest 0.1 m) of each habitat unit was measured, and maximum wetted
width (nearest 0.5 m) was visually estimated. Actual maximum wetted width (nearest 0.1
m) was measured every tenth habitat unit, and a correction factor for visual estimates was
established using simple linear regression (R2 = 0.94; Hankin and Reeves 1988).
Maximum depth (nearest 0.1 m) was measured in each pool using a surveying rod.
Substrate composition in each habitat unit was visually estimated as percent silt, sand,
gravel, cobble, boulder, and bedrock (Moore et al. 2002). Cover type was visually
estimated for each habitat unit as the percent of the habitat unit occupied by large woody
debris, boulder, alcove, overhanging vegetation, and backwater (Kaufmann et al. 1999).
Undercut bank was measured as the percent of the habitat unit bank with an undercut
greater than 0.2 m. Physical habitat characteristics in both mainstem and side channel
habitat units were averaged by stream segment and 95% confidence intervals were used
to evaluate differences in mean habitat characteristics among stream segments.
Spatial Distribution of Bull Trout Redds
Temporal variations in the occurrence of spawning were assessed with redd
surveys conducted every other day from September 16 through October 11. If a survey
was precluded because of inclement weather, it was conducted on the next suitable day.
Redd surveys occurred in a section of Quartz and Rainbow creeks that had previously
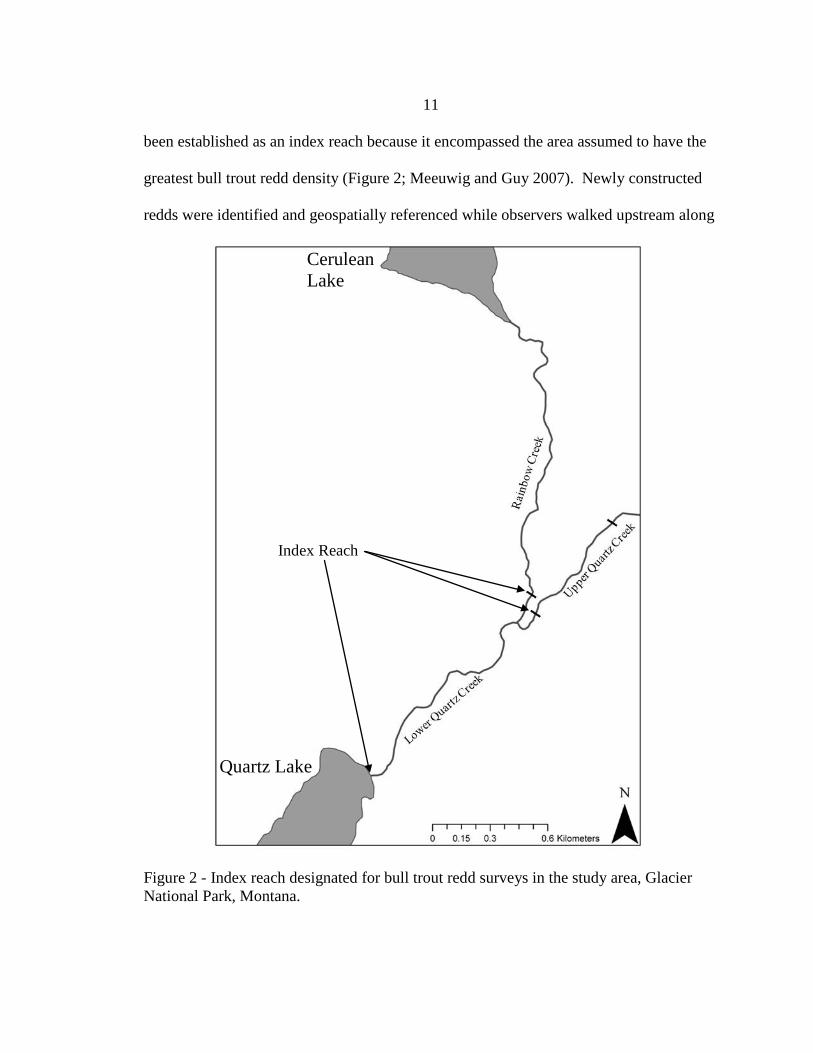
11 been established as an index reach because it encompassed the area assumed to have the
greatest bull trout redd density (Figure 2; Meeuwig and Guy 2007). Newly constructed
redds were identified and geospatially referenced while observers walked upstream along
Figure 2 - Index reach designated for bull trout redd surveys in the study area, Glacier National Park, Montana.
Cerulean Lake
Quartz Lake
Index Reach
12 the stream channel on each survey day. A brightly painted washer was placed in close
proximity to newly identified redds to avoid double counting redds. Habitat units that
contained at least one redd were marked by attaching flagging to nearby vegetation.
Each subsequent observation of a new redd in the same habitat unit was recorded on the
flagging.
In order to assess the spatial distribution of redds in the Quartz Lake drainage,
redd surveys were conducted on October 1 and October 11 in Rainbow Creek upstream
of the index reach to the outlet of Cerulean Lake and on October 6 in upper Quartz Creek
upstream of the index reach to the putative fish barrier (Figure 2). Referencing and
identification procedures were the same as those used for the index reach.
Geospatial coordinates of redd locations were integrated with a National
Agriculture Imagery Program Orthoimagery layer (NAIP; UTM projected coordinate
system, NAD 1983) and a digital elevation model (DEM; NAD 1983) of the study area
using ArcGIS 9 software (Environmental Systems Research Institute, Inc., Reading,
California; ArcMap Version 9.2). The elevation (m) of each redd and stream distance
(m) of each redd from the inlet of Quartz Lake were measured using ArcGIS 9. Water
temperature, discharge, and the number of new redds per survey were plotted by survey
day to investigate variation in these parameters at the beginning, peak, and end of the
spawning period. Redd locations, measured as the distance from the inlet of Quartz
Lake, were plotted by survey day to investigate temporal and longitudinal trends in redd
accumulation.

13
Redd data gathered outside of the index reach were combined with redd data from
the index reach to estimate total redd accumulation and spatial distribution of redds. The
cumulative frequency of redds was plotted as a function of the distance from the inlet of
Quartz Lake to evaluate longitudinal trends in redd accumulation. Elevation of each redd
was plotted as a function of distance from the inlet of Quartz Lake to investigate the
change in elevation associated with redd location. Physical habitat characteristics
measured in lower Quartz Creek, upper Quartz Creek, and Rainbow Creek were
compared to the number of redds identified in each stream segment to investigate the
relationship between stream habitat and redd abundance.
Subadult Bull Trout Presence and Distribution
Single-pass backpack electrofishing was used to determine the distribution of
subadult bull trout throughout the Quartz Lake drainage. Sampling for subadult bull trout
occurred August 14 through 28 at base flow and prior to movement of adult bull trout
into the Quartz Lake drainage to spawn.
Electrofishing locations were selected using a systematic sampling design with
two random starting points (Hansen et al. 2007). Pools and glides were grouped as slow
water habitat units, and riffles and rapids were grouped as fast water habitat units (Arend
1999). Every fourth slow water unit and every fifth fast water unit were sampled for
subadult bull trout. Habitat units selected for electrofishing were geospatially referenced
and marked with a unique identifier during physical habitat surveys. All salmonids (i.e.,
bull trout and westslope cutthroat trout) sampled during electrofishing were identified to

14 species, measured for total length (nearest mm total length), and returned to the habitat
unit where they were collected.
A length-frequency histogram was used to estimate age structure of subadult bull
trout. Subadult bull trout and westslope cutthroat trout occurrence (i.e., presence or
absence) was designated for each habitat unit sampled. Occurrence was plotted as a
function of habitat unit type (i.e., slow water or fast water) by stream segment for both
species. The cumulative frequency of subadult bull trout and westslope cutthroat trout
was plotted as a function of the distance from the inlet of Quartz Lake to evaluate
differences in the distributions of these species in mainstem habitat in lower Quartz
Creek and Rainbow Creek.
Subadult bull trout presence and abiotic habitat unit characteristics were examined
using 11 competing multiple logistic regression models (Table 1). All models included
the explanatory variables unit type (i.e., slow water or fast water) and stream gradient
(Table 1) because of their assumed importance in predicting subadult bull trout presence.
Additional explanatory variables included coarse substrate (i.e., the sum of percent
gravel, cobble, and boulder), width (i.e., habitat unit maximum wetted width), percent
large woody debris, and percent undercut bank (Table 1). Stream gradient was estimated
at 100-m intervals starting at the beginning of each stream segment using ArcGIS 9
software. All habitat units located in the 100-m interval were assigned the resulting
gradient value. Competing models were ranked based on Akaike’s Information Criterion
(Akaike 1973) adjusted for small sample size (AICc; Hurvich and Tsai 1989) using
Program R, Version 2.8.1, package qpcR (Spiess and Ritz 2009). Delta (Δ) AICc values

15 were calculated and models with ΔAICc values ≤ 2.0 were considered for inferences
(Burnham and Anderson 2002). Model parameter estimates and adjusted coefficients of
determination (Nagelkerke 1991) were estimated in Program R (Version 2.8.1), using
package Design (Harrell 2008).
Table 1 – Subadult bull trout presence model number and the variables in the model for 11 combinations of variables used to examine subadult bull trout occurrence within tributaries to Quartz Lake, Glacier National Park, Montana.
Model Explanatory variables in model
1 Unit type, gradient, coarse substrate, width, large woody debris, undercut bank
2 Unit type, gradient, coarse substrate, width, large woody debris 3 Unit type, gradient, coarse substrate, width, undercut bank 4 Unit type, gradient, coarse substrate, width 5 Unit type, gradient, coarse substrate, large woody debris 6 Unit type, gradient, coarse substrate, undercut bank 7 Unit type, gradient, coarse substrate 8 Unit type, gradient, width 9 Unit type, gradient, large woody debris
10 Unit type, gradient, undercut bank 11 Unit type, gradient

16
RESULTS
Physical Habitat Characteristics
Mainstem and side channel habitat were present in lower Quartz Creek and
Rainbow Creek; only mainstem habitat was present in upper Quartz Creek. Side channel
habitat units comprised 71 of 142 (50.0%) habitat units in lower Quartz Creek and 31 of
140 (22.1%) habitat units in Rainbow Creek. Habitat unit length, maximum wetted
width, and maximum pool depth were similar among stream segments with the exception
that the maximum wetted width of upper Quartz Creek was less than that of lower Quartz
Creek and Rainbow Creek (Table 2). The dominant substrate type among stream
segments was either gravel or cobble (Table 2). Additionally, lower Quartz Creek had
the greatest percent of sand (19.5%), and Rainbow Creek had the greatest percent of
boulder substrate (29.5%; Table 2). A low percentage of silt and bedrock substrate was
documented in all three stream segments (Table 2). Large woody debris and undercut
banks were the most common cover types in all stream segments; other cover types were
rare. Undercut bank was the most common cover type in lower and upper Quartz Creek
(18.6% and 22.8% respectively; Table 2). Rainbow Creek had the least amount of cover
present among stream segments (<10.2% for each cover type measured; Table 2).
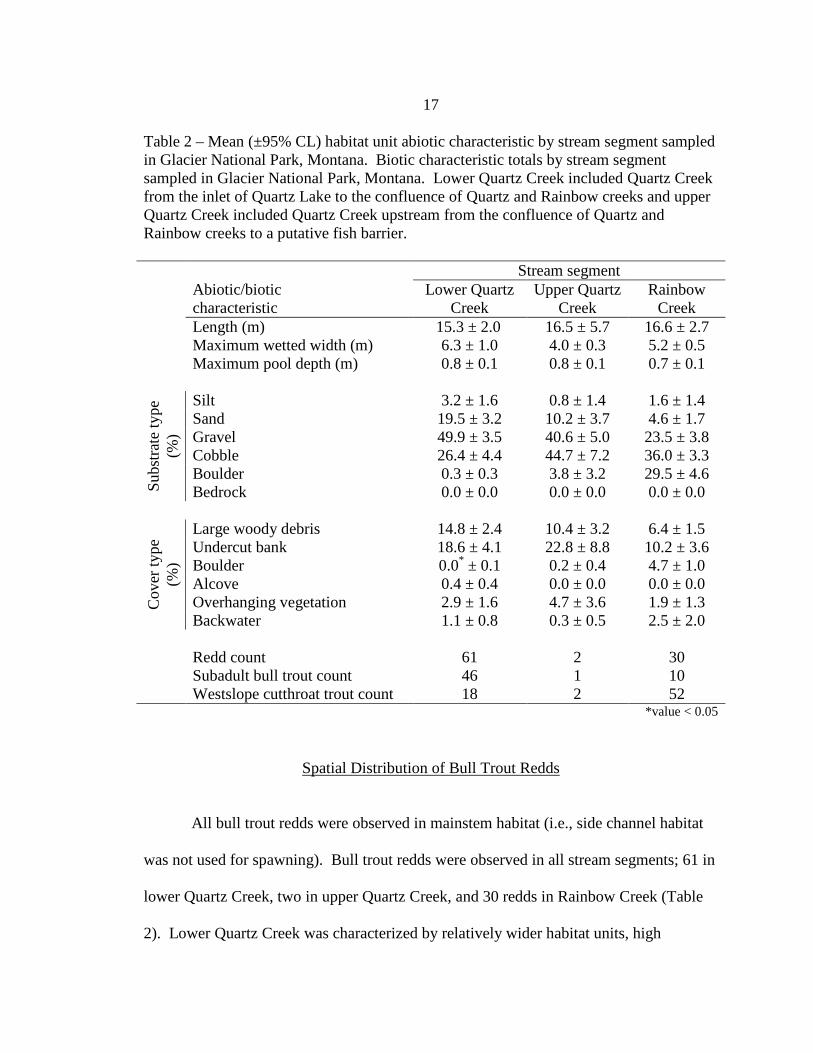
17 Table 2 – Mean (±95% CL) habitat unit abiotic characteristic by stream segment sampled in Glacier National Park, Montana. Biotic characteristic totals by stream segment sampled in Glacier National Park, Montana. Lower Quartz Creek included Quartz Creek from the inlet of Quartz Lake to the confluence of Quartz and Rainbow creeks and upper Quartz Creek included Quartz Creek upstream from the confluence of Quartz and Rainbow creeks to a putative fish barrier. Stream segment Abiotic/biotic
characteristic Lower Quartz
Creek Upper Quartz
Creek Rainbow
Creek
Length (m) 15.3 ± 2.0 16.5 ± 5.7 16.6 ± 2.7 Maximum wetted width (m) 6.3 ± 1.0 4.0 ± 0.3 5.2 ± 0.5 Maximum pool depth (m) 0.8 ± 0.1 0.8 ± 0.1 0.7 ± 0.1
Subs
trate
type
(%
)
Silt 3.2 ± 1.6 0.8 ± 1.4 1.6 ± 1.4 Sand 19.5 ± 3.2 10.2 ± 3.7 4.6 ± 1.7 Gravel 49.9 ± 3.5 40.6 ± 5.0 23.5 ± 3.8 Cobble 26.4 ± 4.4 44.7 ± 7.2 36.0 ± 3.3 Boulder 0.3 ± 0.3 3.8 ± 3.2 29.5 ± 4.6 Bedrock 0.0 ± 0.0 0.0 ± 0.0 0.0 ± 0.0
Cov
er ty
pe
(%)
Large woody debris 14.8 ± 2.4 10.4 ± 3.2 6.4 ± 1.5 Undercut bank 18.6 ± 4.1 22.8 ± 8.8 10.2 ± 3.6 Boulder 0.0* ± 0.1 0.2 ± 0.4 4.7 ± 1.0 Alcove 0.4 ± 0.4 0.0 ± 0.0 0.0 ± 0.0 Overhanging vegetation 2.9 ± 1.6 4.7 ± 3.6 1.9 ± 1.3 Backwater 1.1 ± 0.8 0.3 ± 0.5 2.5 ± 2.0
Redd count 61 2 30 Subadult bull trout count 46 1 10 Westslope cutthroat trout count 18 2 52 *value < 0.05
Spatial Distribution of Bull Trout Redds
All bull trout redds were observed in mainstem habitat (i.e., side channel habitat
was not used for spawning). Bull trout redds were observed in all stream segments; 61 in
lower Quartz Creek, two in upper Quartz Creek, and 30 redds in Rainbow Creek (Table
2). Lower Quartz Creek was characterized by relatively wider habitat units, high
18 percentages of sand, gravel, and cobble substrate types and high percentages of large
woody debris and undercut bank cover types (Table 2). Upper Quartz Creek was
characterized by significantly narrower habitat units, high percentages of gravel and
cobble substrate types, and a high percent of undercut bank cover type (Table 2).
Rainbow Creek was characterized by moderately wide habitat units, high percentages of
gravel, cobble, and boulder substrate types, and relatively low percentages of cover
(Table 2).
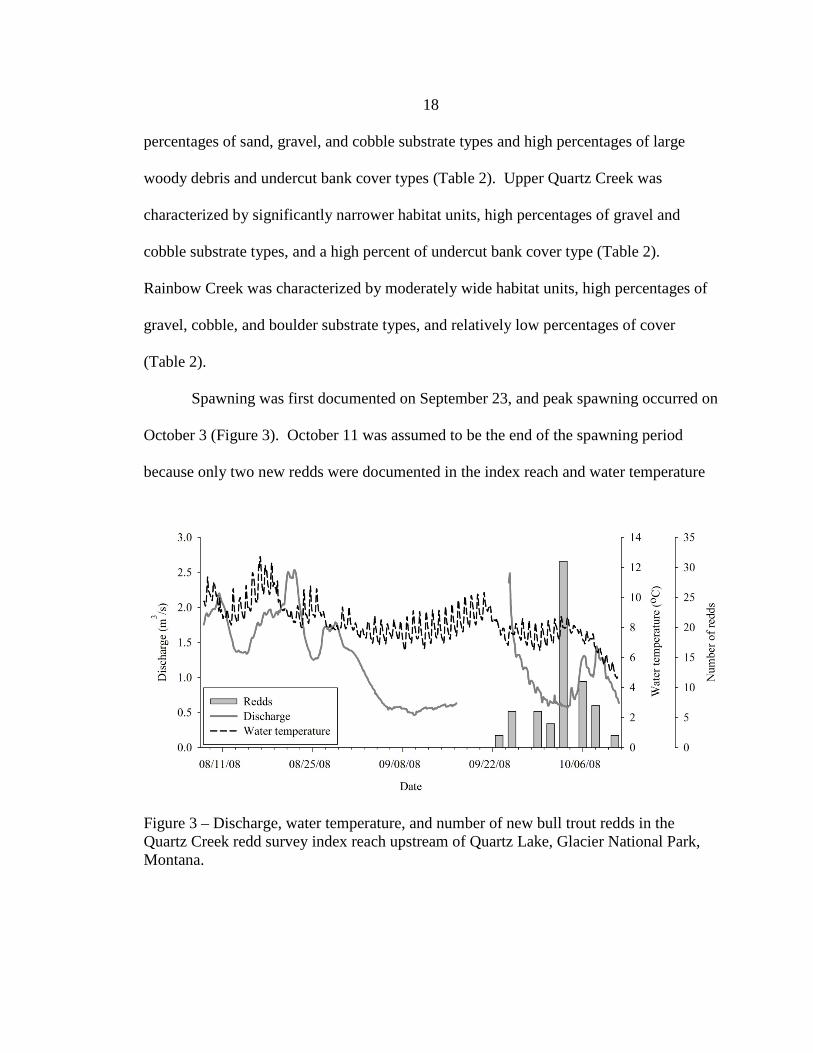
Spawning was first documented on September 23, and peak spawning occurred on
October 3 (Figure 3). October 11 was assumed to be the end of the spawning period
because only two new redds were documented in the index reach and water temperature
Figure 3 – Discharge, water temperature, and number of new bull trout redds in the Quartz Creek redd survey index reach upstream of Quartz Lake, Glacier National Park, Montana.

19 was below 6°C near the inlet of Quartz Lake (Figure 3). The assumed last date of
spawning was preceded by two days of inclement weather that were unsuitable for lake
travel, and previous surveys indicated that spawning activity was decreasing.
The number of new redds observed varied with time; however, there was no
apparent relationship between the number of new redds and the distance from Quartz
Lake (i.e., the number of redds did not increase upstream with time; Figure 4).
Figure 4 – Distance of each bull trout redd from the Quartz Lake inlet and its associated date of detection in the Quartz Creek redd survey index reach upstream of Quartz Lake, Glacier National Park, Montana. The confluence of Quartz and Rainbow creeks occurs at 1303 m.
Ninety-eight percent of all redds (91 of 93) were located in lower Quartz Creek and
Rainbow Creek; lower Quartz Creek contained 65% of redds (61 of 91) detected in these
two segments (Table 2; Figure 5). Only two redds were located in upper Quartz Creek.
Fourteen redds were observed within about 450 m of the outlet of Cerulean Lake;
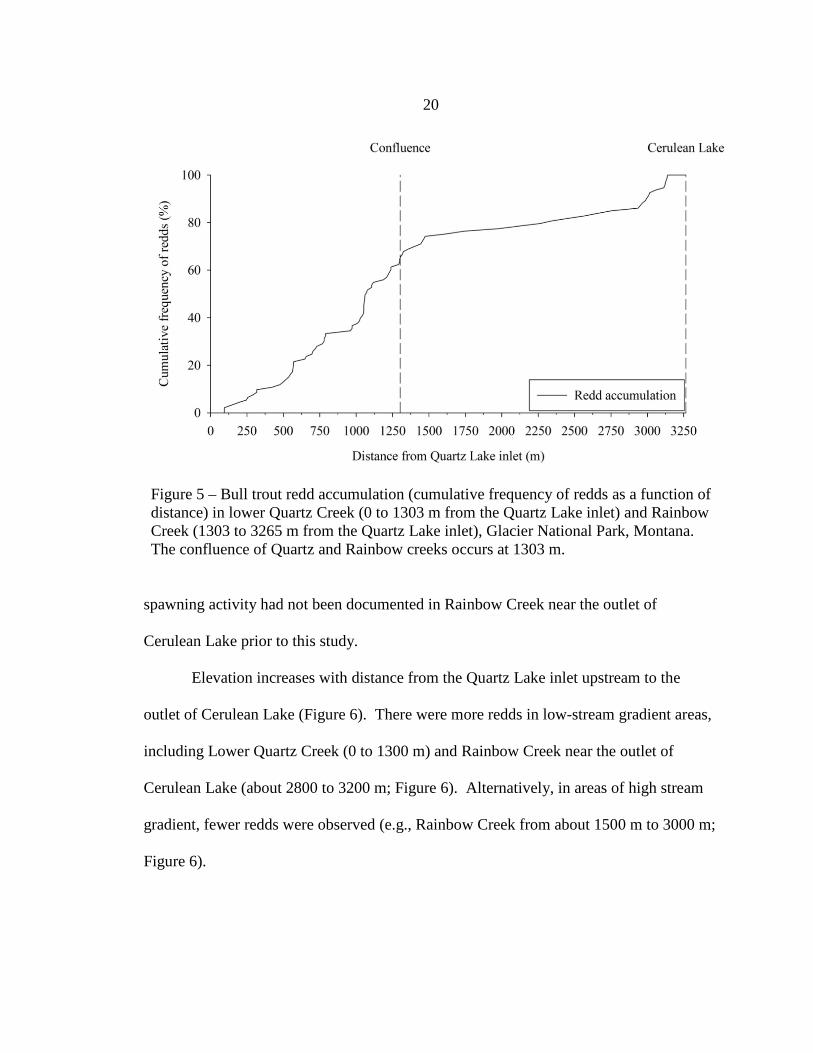
20
Figure 5 – Bull trout redd accumulation (cumulative frequency of redds as a function of distance) in lower Quartz Creek (0 to 1303 m from the Quartz Lake inlet) and Rainbow Creek (1303 to 3265 m from the Quartz Lake inlet), Glacier National Park, Montana. The confluence of Quartz and Rainbow creeks occurs at 1303 m.
spawning activity had not been documented in Rainbow Creek near the outlet of
Cerulean Lake prior to this study.
Elevation increases with distance from the Quartz Lake inlet upstream to the
outlet of Cerulean Lake (Figure 6). There were more redds in low-stream gradient areas,
including Lower Quartz Creek (0 to 1300 m) and Rainbow Creek near the outlet of
Cerulean Lake (about 2800 to 3200 m; Figure 6). Alternatively, in areas of high stream
gradient, fewer redds were observed (e.g., Rainbow Creek from about 1500 m to 3000 m;
Figure 6).
21
Figure 6 – Elevation of each bull trout redd in lower Quartz Creek (0 to 1303 m from the Quartz Lake inlet) and Rainbow Creek (1303 to 3265 m from the Quartz Lake inlet), Glacier National Park, Montana. The confluence of Quartz and Rainbow creeks occurs at 1303 m.
Subadult Bull Trout Presence and Distribution
Fifty-seven subadult bull trout and 72 westslope cutthroat trout were sampled in
87 habitat units in the Quartz Lake drainage; however, subadult bull trout were most
abundant in lower Quartz Creek, and westslope cutthroat trout were most abundant in
Rainbow Creek (Table 2). Lower Quartz Creek contained about 75% of the subadult bull
trout sampled and only about 20% of the westslope cutthroat trout sampled in mainstem
habitat (Figure 7). Although subadult bull trout and westslope cutthroat trout were
sampled in both fast and slow water habitat units, both species were more frequently
found in slow water habitat units; neither species was sampled from fast water habitat

22 units in upper Quartz Creek (Figure 8 a and b).
Subadult bull trout varied in length from 44 to 167 mm. At least two age groups
of subadult bull trout were present within the Quartz Lake drainage as evidence by two
distinct peaks (40-65 mm and 95-125 mm) in the length-frequency histogram (Figure 9).
These groups are likely age-0 and age-1 fish based on data from bull trout populations in
the Flathead River Basin (Fraley and Shepard 1989).
Figure 7 – Cumulative frequency of subadult bull trout and westslope cutthroat trout in mainstem habitat in lower Quartz Creek (0 to 1303 m from the Quartz Lake inlet) and Rainbow Creek (1303 to 3265 m from the Quartz Lake inlet), Glacier National Park, Montana. The confluence of Quartz and Rainbow creeks occurs at 1303 m.

23 a
b
Figure 8 - Frequency of stream segments and habitat unit types with (a) subadult bull trout present and absent and (b) westslope cutthroat trout present and absent. Stream segments refer to lower Quartz Creek (LQC), upper Quartz Creek (UQC), and Rainbow Creek (RBC). Habitat unit types refer to slow water habitat units (-S; i.e., pools or glides) and fast water habitat units (-F; i.e., riffles or rapids).

24
Figure 9 – Length-frequency histogram of subadult bull trout sampled within the Quartz Lake drainage, Glacier National Park, Montana.
Three of the 11 subadult bull trout presence models were considered for inference
(Table 3). All models considered had ΔAICc values of ≤ 2.0, except the third ranked
model which had a ΔAICc value of 2.01, but this model was considered because the
associated ΔAICc value was within 0.01 of the 2.0 limit (Table 3). The most likely model
of subadult bull trout presence suggested that subadult bull trout presence is best
explained by the variables unit type (i.e., slow water or fast water) and gradient (stream
gradient) which were included in all competing models, and the addition of coarse
substrate (sum of percent gravel, cobble, and boulder) and width (habitat unit maximum

25 wetted width; Table 3). The other models considered for inference included similar
explanatory variables, with the inclusion of large woody debris in the third ranked model
(Table 3). The evidence ratio (w1/ wj) suggests the highest ranked model was 1.37 times
more likely than the second ranked model and 2.73 times more likely than the third
ranked model (Table 3). Parameter estimates from multiple logistic regression analysis
for each model suggest that gradient and coarse substrate are negatively associated with
subadult bull trout presence; whereas, unit type, width, and large woody debris are
positively associated with subadult bull trout presence (Table 4). However, the variables
included in the top ranked models accounted for a relatively low proportion of the
variability in bull trout presence; Nagelkerke’s adjusted R2 = 0.21 for the first and third
ranked models and R2 = 0.17 for the second ranked model (Table 4).
Table 3 – Subadult bull trout presence model rank, model number, Akaike’s Information Criterion adjusted for small sample size (AICc), AICc differences (ΔAICc), and evidence ratio (w1/ wj) for comparing models used to examine abiotic effects on subadult bull trout occurrence in the Quartz Lake drainage, Glacier National Park, Montana. Rank Model Explanatory variables in model AICc ΔAICc w1/ wj
1 4 Unit type, gradient, coarse substrate, width 113.97 0.0 2 8 Unit type, gradient, width 114.60 0.63 1.37 3 2 Unit type, gradient, coarse substrate, width,
large woody debris 115.98 2.01 2.73

26 Table 4 – Subadult bull trout presence model rank, model number, model parameters, parameter estimates, parameter estimate standard errors, parameter estimate P-values, and model R2 values used to examine abiotic effects on subadult bull trout occurrence in the Quartz Lake drainage, Glacier National Park, Montana. Rank Model Model parameter Parameter estimate Standard error P-value R2
1 4 Intercept 0.020 1.369 0.988 0.21 Unit type = slow
water 0.081 0.531 0.879
Gradient -3.090 11.671 0.791 Coarse substrate -0.024 0.015 0.097 Width 0.311 0.105 0.003 2 8 Intercept -1.955 0.739 0.008 0.17 Unit type = slow
water 0.383 0.496 0.440
Gradient -8.596 11.111 0.439 Width 0.274 0.097 0.005 3 2 Intercept -0.471 1.584 0.766 0.21 Unit type = slow
water 0.023 0.543 0.966
Gradient -1.759 11.927 0.883 Coarse substrate -0.021 0.015 0.158 Width 0.328 0.111 0.003 Large woody debris 0.014 0.024 0.549

27
DISCUSSION
Lacustrine-adfluvial bull trout occupy numerous headwater lakes in Glacier
National Park. Results of this study provide important new information pertaining to the
spawning and rearing characteristics of lacustrine-adfluvial bull trout in the Quartz Lake
drainage upstream of Quartz Lake. Prior to this study, there was a lack of data detailing
the spatial and temporal distribution of bull trout redds and the spatial distribution and
habitat association of subadult bull trout rearing in tributary streams in headwater lake
habitat.
Bull trout redds were present throughout the Quartz Lake drainage; however, the
highest number of redds were observed in lower Quartz Creek. These data suggest that
lower Quartz Creek provides the best spawning habitat within the Quartz Lake drainage.
High percentages of gravel and cobble substrate types and relatively low stream gradient
characterize lower Quartz Creek. Similarly, bull trout throughout the Flathead River
drainage spawn in areas characterized by gravel substrate, low compaction, and low
gradient; additionally, spawning sites are generally located close to cover in areas with
groundwater influence (Fraley and Shepard 1989). Although, groundwater influence was
not measured in the Quartz Lake drainage, it is suspected that groundwater exchange
plays an important role in bull trout spawning site selection (Baxter and Hauer 2000) and
egg and fry survival (Baxter and McPhail 1999). In the Quartz Lake drainage, distance
of redds from cover was not directly measured in the field, but numerous redds were
found within close proximity to large woody debris or overhanging vegetation, which is
consistent with previous findings (McPhail and Murray 1979; Fraley and Shepard 1989).

28
Rainbow Creek is about 660 m longer than lower Quartz Creek; however, there
were fewer redds located in Rainbow Creek than in lower Quartz Creek. The majority of
redds in Rainbow Creek were located within about 275 m of the confluence of Quartz
Creek and Rainbow Creek, or within about 450 m of the outlet of Cerulean Lake. These
areas were characterized by relatively low stream gradient and a high percentage of
gravel and cobble substrate. The remaining redds in Rainbow Creek were observed in a
1200 m stream section characterized by relatively higher gradients and a greater percent
of boulder substrate. Individual redds in this section were located in slow water habitat
units (e.g., pools) with gravel and cobble substrate. These patterns further suggest that
bull trout within the Quartz Lake drainage are selecting areas of lower gradient with high
percentages of gravel and cobble substrate.
Upper Quartz Creek was also characterized by high percentages of gravel and
cobble substrate, but only two redds were observed in this stream segment. It was
apparent that a large portion of the stream channel in this stream segment was recently
affected by flood or debris flow, and a new channel was developing. In 2004, redds were
observed in the old stream channel adjacent to the current one (Meeuwig and Guy 2007).
If this recent disturbance is related to a reduced level of bull trout spawning activity in
upper Quartz Creek, it is possible that spawning activity will increase if the new channel
stabilizes in future years.
Spawning commenced once water temperatures were continuously less than 9°C,
and water temperatures were 5-6°C by the time spawning was considered to be complete.
However, there were periods of time prior to the initiation of bull trout spawning when
29 water temperature were less than 9°C for a few days before increasing above 9°C, and
bull trout spawning did not commence. This pattern suggests that water temperature may
not be the only cue for commencement of bull trout spawning. This finding is consistent
with previous studies that suggest the initiation of spawning is related to a complex
interaction of photoperiod, stream discharge, and water temperature (Fraley and Shepard
1989; Brenkman et al. 2001). Unfortunately, stream discharge data were unavailable at
the time when bull trout commenced spawning in the Quartz Lake drainage.
Westslope cutthroat trout also are found within the Quartz Lake drainage. The
native distributions of bull trout and westslope cutthroat trout species overlap, and
westslope cutthroat trout occur sympatrically with bull trout in portions of the Flathead
River drainage in northwest Montana (Fredenberg 1997). Subadult bull trout and
westslope cutthroat trout were present in each stream segment, but both species were rare
in upper Quartz Creek. Evaluation of cumulative frequency data for both species in
mainstem habitat in lower Quartz Creek and Rainbow Creek indicates that the abundance
of these species may be negatively related. For example, the majority of subadult bull
trout sampled occupied habitat units in lower Quartz Creek, but the majority of westslope
cutthroat trout sampled occupied habitat units in Rainbow Creek. Therefore, this may be
indicative of habitat partitioning or variability in preference for particular microhabitat by
each species (e.g., Nakano et al. 1998).
Subadult bull trout were sampled in both slow water and fast water habitat units in
Quartz Lake drainage; they occurred most frequently in slow water habitat units in lower
Quartz Creek. Apparently, subadult bull trout are selecting for habitat types with low

30 water velocities, such as pool habitat. Similar relationships have been observed in other
studies. For example, in the Clearwater River drainage, Idaho, subadult bull trout were
generally associated with low water velocities (Spangler and Scarnecchia 2001), and in
the Flathead River system, subadult bull trout used pools more frequently than runs,
riffles, or pocket water (Fraley and Shepard 1989).
Length-frequency data suggest that two distinct age classes of subadult bull trout
(most likely age 0 and age 1) were present within the Quartz Lake drainage, and only two
individuals with total lengths of 151 and 167 mm appear to be older than age 1.
Electrofishing is generally biased towards sampling larger fish (Reynolds 1996);
therefore, the assessment of subadult bull trout length-frequency in the Quartz Lake
drainage is probably reliable. In the larger streams of the Flathead River drainage,
subadult bull trout remain in tributaries for 1-3 years before emigrating to mainstem
Flathead River habitats (Fraley and Shepard 1989), but in Trestle Creek, a tributary to
Lake Pend Oreille, Idaho, thousands of age-0 bull trout emigrated during high spring
flows (Downs et al. 2006).
Research suggests that subadult bull trout are often found in close proximity to
the streambed (Polacek and James 2003). Additionally, a large majority of studies that
investigated subadult bull trout habitat associations conclude that pool or low water
velocity habitat (Fraley and Shepard 1989; Bonneau and Scarnecchia 1998; Thurow
2006) and cover such as large woody debris (Dambacher and Jones 1997; Muhlfeld and
Marotz 2005) or undercut bank (Dambacher and Jones 1997) are important at this life-
history stage. Subadult bull trout are also reported to have a positive relationship with
31 coarse substrates (Dambacher and Jones 1997; Muhlfeld and Marotz 2005; Thurow
2006).
In the present study, subadult bull trout presence was positively related to slow
water habitat units and habitat unit maximum wetted width, and negatively related to
stream gradient and coarse substrate. While sampling, subadult bull trout were frequently
observed in low gradient areas with large woody debris, and large woody debris was
included as a predictor variable in the third highest ranked model explaining subadult bull
trout presence. Similarly, bull trout presence was positively related to large woody debris
and channel width in the Bitterroot River drainage (Rich et al. 2003). In that same study,
bull trout presence was negatively related to gradient (Rich et al. 2003). Coarse
substrate, in the previously mentioned studies, had a positive relationship with subadult
bull trout presence; however, the opposite was suggested by the present study. For the
model selection and multiple logistic regression analyses, coarse substrate was defined as
the sum of percent gravel, cobble, and boulder for reasons pertaining to model simplicity;
this may mask untested relationships between subadult bull trout and each individual
substrate type.
Three statistical models were identified as having the greatest support given the
data. However, evaluation of the selected models with multiple logistic regression
revealed that the selected models explained a relatively small proportion of the variability
in subadult bull trout presence. Regardless of the relatively poor model fit, patterns in the
presence of subadult bull trout and the distribution and accumulation of bull trout redds
were very similar. The majority of bull trout redds and subadult bull trout were found in

32 lower Quartz Creek, suggesting that this stream segment is important for both spawning
and rearing. Characteristics of this stream segment that likely make it productive for bull
trout spawning included low gradient and high percentages of gravel and cobble
substrates, and likely groundwater exchange. However, it is not clear from the multiple
logistic regression models what physical habitat characteristics are most important for
subadult bull trout at the habitat unit scale.
Information is lacking on spawning and early life-history characteristics of bull
trout occupying headwater-lake ecosystems. This study helped “fill a gap” in what is
known about these headwater-lake bull trout populations, and it identified areas of adult
and subadult bull trout use in tributaries to Quartz Lake, which provides information that
will allow Glacier National Park biologists to better manage and monitor bull trout in the
Quartz Lake. Additionally, the data presented here may be used as a benchmark for
management and restoration goals following mitigation or removal of threats posed by
the presence of nonnative lake trout in Quartz Lake. The information gathered from this
study may also be applicable for restoration efforts in other headwater lake systems
within Glacier National Park and the surrounding area.

33
REFERENCES
34 Akaike, H. 1973. Information theory as an extension of the maximum likelihood
principle. Pages 267-281 in B. N. Petrov and F. Csaki, editors. Second International Symposium on Information Theory. Akademiai Kiado, Budapest.
Arend, K. K. 1999. Macrohabitat identification. Pages 75-93 in M. B. Bain and N. J. Stevenson, editors. Aquatic habitat assessment: common methods. American Fisheries Society, Bethesda, Maryland.
Baxter, C. V., and F. R. Hauer. 2000. Geomorphology, hyporheic exchange, and selection of spawning habitat by bull trout (Salvelinus confluentus). Canadian Journal of Fisheries and Aquatic Sciences 57:1470-1481.
Baxter, C. V., and J. D. McPhail. 1999. The influence of red site selection, groundwater upwelling, and over-winter incubation temperature on survival of bull trout (Salvelinus confluentus) from egg to alevin. Canadian Journal of Zoology 77:1233-1239.
Bisson, P. A., J. L. Nielsen, R. A. Palmasono, and L. E. Grove. 1982. A system of naming habitat types in small streams, with examples of habitat utilization by salmonids during low streamflow: acquisition and utilization of aquatic habitat inventory information. Pages 62-73 in N. B. Armantrout, editor. American Fisheries Society, Western Division, Bethesda, Maryland.
Brenkman, S. J., G. L. Larson, and R. E. Gresswell. 2001. Spawning migration of lacustrine-adfluvial bull trout in a natural area. Transactions of the American Fisheries Society 130:981-987.
Bonneau, J. L., and D. L. Scarnecchia. 1998. Seasonal and diel changes in habitat use by juvenile bull trout (Salvelinus confluentus) and cutthroat trout (Oncorhynchus clarki) in a mountain stream. Canadian Journal of Zoology 76:783-790.
Buchanan, T. J., and W. P. Somers. 1969. Discharge measurements at gaging stations. U.S. Geological Survey, Washington, D.C.
Burnham, K. P., and D. R. Anderson. 2002. Model selection and multimodel inference: a practical information-theoretic approach, 2nd edition. Springer Science+Business Media, LLc, New York.
Dambacher J. M., and K. K. Jones. 1997. Stream habitat of juvenile bull trout populations in Oregon and benchmarks for habitat quality. Pages 353–360 in W. C. Mackay, M. K. Brewin, and M. Monita, editors. Friends of the bull trout conference proceedings, Bull Trout Task Force (Alberta), Trout Unlimited Canada, Calgary.
Donald, D. B., and D. J. Alger. 1993. Geographic distribution, species displacement, and niche overlap for lake trout and bull trout in mountain lakes. Canadian
35
Journal of Zoology 71:238-247.
Downs, C. C., D. H. Horan, E. Morgan-Harris, and R. Jakubowski. 2006. Spawning demographics and juvenile dispersal of an adfluvial bull trout population in Trestle Creek, Idaho. North American Journal of Fisheries Management 26:190-200.
Dux, A. M. 2005. Distribution and population characteristics of lake trout in Lake McDonald, Glacier National Park: implications for suppression. Montana State University, Bozeman.
Fraley, J. J., and B. B. Shepard. 1989. Life history, ecology, and population status of migratory bull trout (Salvelinus confluentus) in the Flathead Lake and River System, Montana. Northwest Science 63:133-143.
Fredenberg, W. 1997. Observation from a basinwide sampling program for juvenile adfluvial bull trout. Pages 261–268 in W. C. Mackay, M. K. Brewin, and M. Monita, editors. Friends of the bull trout conference proceedings, Bull Trout Task Force (Alberta), Trout Unlimited Canada, Calgary.
Fredenberg, W. 2002. Further evidence that lake trout displace bull trout in mountain lakes. Intermountain Journal of Sciences 8:143-152.
Ferguson, M. M. 1990. The genetic impact of introduced fishes on native species. Canadian Journal of Zoology 68:1053-1057.
Gallagher, A. S., and N. J. Stevenson. 1999. Streamflow. Pages 149-157 in M. B. Bain and N. J. Stevenson, editors. Aquatic habitat assessment: common methods. American Fisheries Society, Bethesda, Maryland.
Gresswell, R. E., C. E. Torgersen, D. S. Bateman, T. J. Guy, S. R. Hendricks, and J. E. B. Wofford. 2006. A spatially explicit approach for evaluating relationships among coastal cutthroat trout, habitat, and disturbance in small Oregon streams. American Fisheries Society Symposium 48:457-471.
Hankin, D. G., and G. H. Reeves. 1988. Estimating total fish abundance and total habitat area in small streams based on visual estimation methods. Canadian Journal of Fisheries and Aquatic Sciences 45:834-844.
Hansen, M. J., T. D. Beard Jr., and D. B. Hayes. 2007. Sampling and experimental design. Pages 51-120 in C. S. Guy and M. L. Brown, editors. Analysis and interpretation of freshwater fisheries data. American Fisheries Society, Bethesda, Maryland.
Harrell, Jr., F. E. 2008. Design: Design Package. R Package Version 2.1-2. http://biostat.mc.vanderbilt.edu/s/Design, http://biostat.mc.vanderbilt.edu/rms.
36 Hurvich, D. W., and A. R. Templeton. 1989. Regression and time series model selection
in small samples. Biometrika 76:297-307.
Kaufmann, P.R, P. Levine, E.G. Robison, C. Seeliger, and D.V. Peck. 1999. Quantifying physical habitat in wadeable streams. EPA/620/R-99/003. U.S. Environmental Protection Agency, Washington, D.C.
Knapp, R. A., and K. R. Matthews. 2000. Non-native fish introductions and the decline of the mountain yellow-legged frog from within protected areas. Conservation Biology 14:428-438.
Knapp, R. A., P. S. Corn, and D. E. Schindler. 2001. The introduction of nonnative fish into wilderness lakes: good intentions, conflicting mandates, and unintended consequences. Ecosystems 4:275-278.
Kruse, C. G., W. A. Hubert, and F. J. Rahel. 2000. Status of Yellowstone cutthroat trout in Wyoming waters. North American Journal of Fisheries Management 20:693-705.
Landres, P. B., P. Morgan, and F. J. Swanson. 1999. Overview of the use of natural variability concepts in managing ecological systems. Ecological Applications 9:1179-1188.
Li, H.W., and P.B. Moyle. 1999. Management of introduced fishes. Pages 345-374 in C.C. Kohler and W.A. Hubert, editors. Inland fisheries management in North America, 2nd edition. American Fisheries Society, Bethesda, Maryland.
Lodge, D. M. 1993. Biological invasions: lessons for ecology. Trends in Ecology and Evolution 8: 133-136.
Martinez, P. J., P. E. Bigelow, M. A. Deleray, W. A. Fredenberg, B. S. Hansen, N. J. Horner, S. K. Lehr, R. W. Schneidervin, S. A. Tolentino, A. Viola. 2009. Western lake trout woes. Fisheries 34:424-442.
McPhail, J. D., and C. B. Murray. 1979. The early life-history and ecology of Dolly Varden (Salvelinus malma) in the upper Arrow Lakes. Report to BCHydro and Ministry of Environment, Fisheries Branch, Nelson, British Columbia.
McPhail, J. D., and J. S. Baxter. 1996. A review of bull trout (Salvelinus confluentus) life-history and habitat use in relation to compensation and improvement opportunities. British Columbia Environment, Fisheries Branch, Fisheries Management Report No. 104, 35 p.
Meeuwig, M. H. 2008. Ecology of lacustrine-adfluvial bull trout populations in an interconnected system of natural lakes. Montana State University, Bozeman.

37 Meeuwig, M. H., and C. S. Guy. 2007. Evaluation and action plan for protection of 15
threatened adfluvial populations of bull trout in Glacier National Park, Montana. Final Scientific Report prepared for US Fish and Wildlife Service.
Meeuwig, M. H., C. S. Guy, and W. A. Fredenberg. 2008. Influence of landscape characteristics on fish species richness among lakes of Glacier National Park, Montana. Intermountain Journal of Sciences 14:1-16.
Meeuwig, M.H., C.S. Guy, and W.A. Fredenberg. In review. Use of cover habitat by bull trout Salvelinus confluentus and lake trout Salvelinus namaycush in a laboratory environment. Environmental Biology of Fishes.
Morton, W. M. 1968. A review of all fishery data obtained from waters of the North
Fork Fishery Management Unit for the fifty-year period from 1916 through 1966. Glacier National Park, Montana. Review report No. 8. USDI Fish and Wildlife Service, Portland, OR.
Moore, K., K. K. Jones, and J. Dambacher, 2002. Methods for stream habitat surveys aquatic inventories project. Natural Production Program, Oregon Department of Fish and Wildlife, Corvallis, Oregon. http://oregonstate.edu/Dept/ODFW/ freshwater /inventory/pdffiles/habmethod.pdf, accessed February 2010.
Muhlfeld, C. C., S. T. Kalinowski, T. E. McMahon, M. L. Taper, S. Painter, R. F. Leary, and F. W. Allendorf. 2009. Hybridization rapidly reduces fitness of a native trout in the wild. Biology Letters 5:328-331.
Muhlfeld, C. C., and B. Marotz. 2005. Seasonal movement and habitat use by subadult bull trout in the Upper Flathead River System, Montana. North American Journal of Fisheries Management 25:797-810.
Nagelkerke, N. J. D. 1991. A note on a general definition of the coefficient of determination. Biometrika 78:691-692.
Nakano, S., S. Kitano, K. Nakai, and K. D. Fausch. 1998. Competitive interactions for foraging microhabitat among introduced brook charr, Salvelinus fontinalis, and native bull charr, S. confluentus, and westslope cutthroat trout, Oncorhynchus clarki lewisi, in a Montana stream.
Nelson, M. L., T. E. McMahon, and R. F. Thurow. 2002. Decline of the migratory form in bull charr, Salvelinus confluentus, and implications for conservation. Environmental Biology of Fishes 64:321-332.
Northcote, T. G. 1984. Mechanisms of fish migration in rivers. Pages 317-355 in J. D. McCleave, J. J. Dodson, and W. H. Neill, editors. Mechanisms of migration in fishes. Plenum Press. New York.
38 Northcote, T. T. 1997. Potamodromy in Salmonidae – living and moving in the fast
lane. North American Journal of Fisheries Management 17:1029-1045.
Pauly, D. 1995. Anecdotes and the shifting baseline syndrome of fisheries. Trends in Ecology and Evolution 10:430.
Polacek, M. C., and P. W. James. 2003. Diel microhabitat use of age-0 bull trout in Indian Creek, Washington. Ecology of Freshwater Fish 12:81-86.
Pratt, K. L. 1992. A review of bull trout life history. Pages 5-9 in P. J. Howell and D. V. Buchanan, editors. Proceedings of the Gearhart Mountain bull trout workshop. Oregon Chapter of the American Fisheries Society, Corvallis, Oregon.
R Development Core Team. 2008. R: A language and environment for statistical computing. R Foundation for Statistical Computing,Vienna, Austria. ISBN 3-900051-07-0, URL http://www.R-project.org.
Reynolds, J. B. 1996. Electrofishing. Pages 221-253 in B. R. Murphy and D. W. Willis, editors. Fisheries techniques, 2nd edition. American Fisheries Society, Bethesda, Maryland.
Rich, C. F., T. E. McMahon, B. E. Rieman, and W. L. Thompson. 2003. Local-habitat, watershed, and biotic features associated with bull trout occurrence in Montana stream. Transactions of the American Fisheries Society 132:1053-1064.
Rieman, B. E., and J. D. McIntyre. 1995. Occurrence of bull trout in naturally fragmented habitat patches of varied size. Transactions of the American Fisheries Society 124:285–296.
Rieman, B. E., and D. L. Myers. 1997. Use of redd counts to detect trends in bull trout (Salvelinus confluentus) populations. Conservation Biology 11:1015–1018.
Rieman, B. E., D. Isaak, S. Adams, D. Horan, D. Nagel, C. Luce, and D. Myers. 2007. Anticipated climate warming effects on bull trout habitats and populations across the interior Columbia River basin. Transactions of the American Fisheries Society 136:1552-1565.
Saffel, P. D., and D. L. Scarnecchia. 1995. Habitat use by juvenile bull trout in belt-series geology watersheds of northern Idaho. Northwest Science 69:304-316.
Schultz, L. P. 1941. Fishes of Glacier National Park, Montana. Conservation Bulletin No. 22, US Department of the Interior, National Park Service, Washington, DC.
Spangler, R. E., and D. L. Scarnecchia. 2001. Summer and fall microhabitat utilization of juvenile bull trout and cutthroat trout in a wilderness stream, Idaho. Hydrobiologia 452:145-154.

39 Spencer, C. N., B. R. McClelland, and J. A. Stanford. 1991. Shrimp stocking, salmon
collapse, and eagle displacement. BioScience 41:14-21.
Spiess, A. N., and C. Ritz. 2009. qpcR: Modelling and analysis of real-time PCR data. R package version 1.1-8.
Thurow, R. F. 2006. Habitat utilization and diel behavior of juvenile bull trout (Salvelinus confluentus) at the onset of winter. Ecology of Freshwater Fish 6:1-7.
Vander Zanden, M. J., J. M. Casselman, and J. B. Rasmussen. Stable isotope evidence for the food web consequences of species invasions in lakes. Nature 401:464-467.
Varley, J. D., and R. E. Gresswell. 1988. Ecology, status, and management of the Yellowstone cutthroat trout. Pages 13-24 in R. E. Gresswell, editor. Status and management of interior stocks of cutthroat trout. American Fisheries Society, Symposium 4. Bethesda, Maryland.
White, P. S., and J. L. Walker. 1997. Approximating nature’s variation: selecting and using reference information in restoration ecology. Restoration Ecology 5:338-349.

40
APPENDICES

41
APPENDIX A
2008 STREAM SEGMENT AND REACH GEOSPATIAL COORDINATES

42 Appendix A – Stream reach geospatial coordinates (UTM) for 2008 in Lower Quartz Creek (LQC), Upper Quartz Creek (UQC), and Rainbow Creek (RNB), tributaries to Quartz Lake, Glacier National Park, Montana.
Start End
Segment Reach Easting UTM
Northing UTM Easting UTM
Northing UTM
LQC 1 715387 5414702 715564 5415000 LQC 2 715564 5415000 715767 5415197 LQC 3 715767 5415197 715989 5415268 LQC 4 715989 5415268 716123 5415505 UQC 5 716123 5415505 716258 5415553 UQC 6 716258 5415553 716274 5415631 UQC 7 716274 5415631 716487 5415842 UQC 8 716487 5415842 716559 5415954 RNB 9 716559 5415954 716193 5415611 RNB 10 716193 5415611 716215 5415715 RNB 11 716215 5415715 716227 5416780 RNB 12 716227 5416780 716275 5416965 RNB 13 716275 5416965 716115 5417072

43
APPENDIX B
2008 PHYSICAL HABITAT CHARACTERISTICS

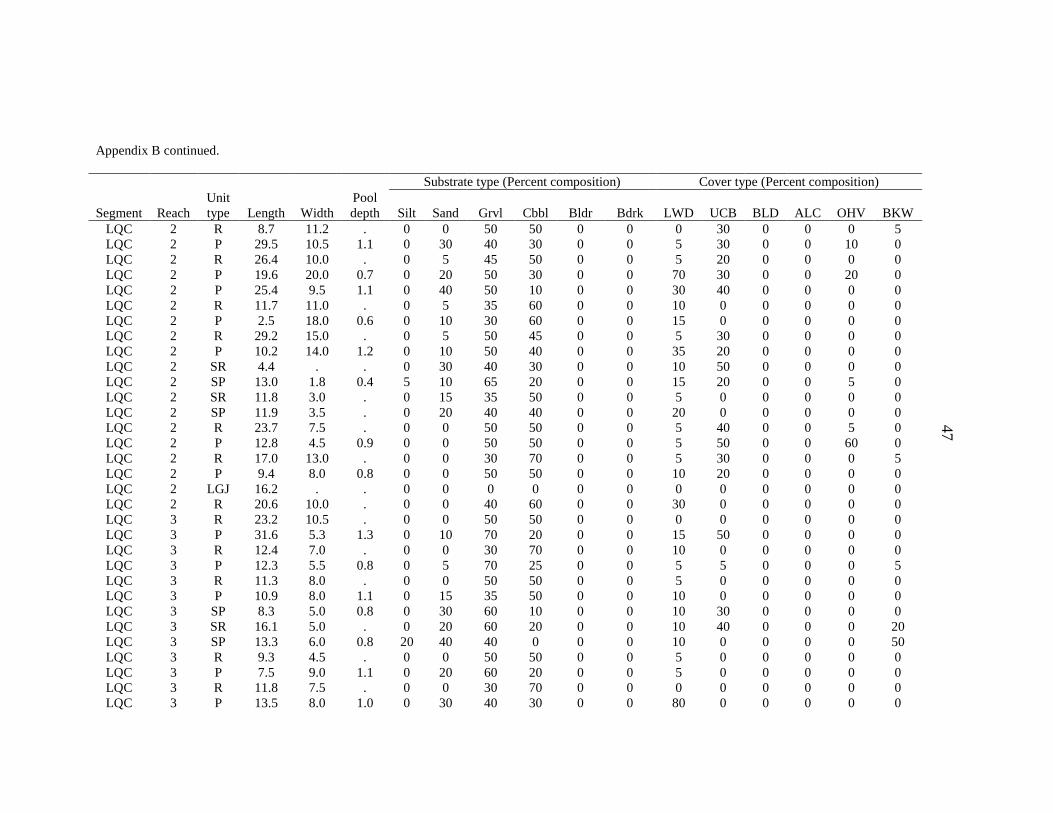
Appendix B – Physical habitat measured in 2008 for Lower Quartz Creek (LQC), Upper Quartz Creek (UQC), and Rainbow Creek (RNB), tributaries to Quartz Lake, Glacier National Park, Montana. Grvl = Gravel, Cbbl = Cobble, Bldr = Boulder, Bdrk = Bedrock, LWD = large woody debris, UCB = undercut bank, BLD = boulder, ALC = alcove, OHV = overhanging vegetation, BKW = backwater, P = pool, R = riffle, G = glide, C = rapid, S- = side channel, LGJ = log jam. Subtrate type (Percent composition) Cover type (Percent composition) Segment Reach
Unit type Length Width
Pool depth Silt Sand Grvl Cbbl Bldr Bdrk LWD UCB BLD ALC OHV BKW
LQC 1 P 27.8 11.7 1.1 0 30 70 0 0 0 25 0 0 0 0 5 LQC 1 P 9.4 4.9 0.9 0 40 60 0 0 0 10 0 0 0 0 0 LQC 1 P 29.8 22.0 1.0 0 10 90 0 0 0 40 0 0 0 0 5 LQC 1 R 11.9 12.9 . 0 10 40 50 0 0 5 0 0 0 0 0 LQC 1 P 33.6 6.3 1.1 0 5 70 25 0 0 5 25 0 0 0 0 LQC 1 R 35.0 9.8 . 0 5 45 50 0 0 10 0 0 25 0 0 LQC 1 P 15.2 9.1 1.2 0 15 85 0 0 0 5 0 0 0 0 0 LQC 1 SP 18.6 3.7 0.7 10 40 50 0 0 0 0 0 0 20 15 0 LQC 1 SR 16.0 5.2 . 0 5 95 0 0 0 0 0 0 0 0 0 LQC 1 SP 7.3 3.7 0.5 0 45 55 0 0 0 10 0 0 0 0 0 LQC 1 SR 9.1 1.8 . 0 5 95 0 0 0 0 0 0 0 0 0 LQC 1 SP 14.0 2.6 0.4 0 50 50 0 0 0 0 5 0 0 5 0 LQC 1 R 29.7 10.7 . 0 10 45 45 0 0 0 0 0 0 0 15 LQC 1 P 6.9 8.2 . 0 0 50 50 0 0 20 0 0 0 0 0 LQC 1 R 22.7 7.9 . 0 10 45 45 0 0 5 0 0 5 0 0 LQC 1 P 10.0 12.7 0.7 0 40 60 0 0 0 15 0 0 0 0 10 LQC 1 R 10.9 9.0 . 0 0 50 50 0 0 10 0 0 0 0 0 LQC 1 P 12.3 10.1 0.8 0 0 50 50 0 0 15 0 0 0 0 0 LQC 1 R 7.9 15.5 . 0 0 40 60 0 0 0 0 0 0 0 5 LQC 1 P 4.7 8.4 0.9 5 10 60 25 0 0 20 0 0 0 0 0 LQC 1 R 5.9 10.6 . 0 0 0 100 0 0 20 0 0 0 0 0 LQC 1 P 11.0 9.9 0.8 0 5 45 50 0 0 5 75 0 0 0 0 LQC 1 R 19.8 6.1 . 0 10 40 50 0 0 20 5 0 0 0 10 LQC 1 P 11.8 6.9 1.0 5 5 70 20 0 0 20 50 0 0 0 0 LQC 1 P 14.0 4.5 0.7 0 10 60 30 0 0 15 50 0 0 0 0 LQC 1 R 7.5 6.5 . 0 0 30 70 0 0 10 0 0 0 0 0 LQC 1 P 5.9 3.5 0.8 0 30 70 0 0 0 30 0 0 0 0 0 LQC 1 R 6.2 5.0 . 0 0 50 50 0 0 10 0 0 0 0 0
44
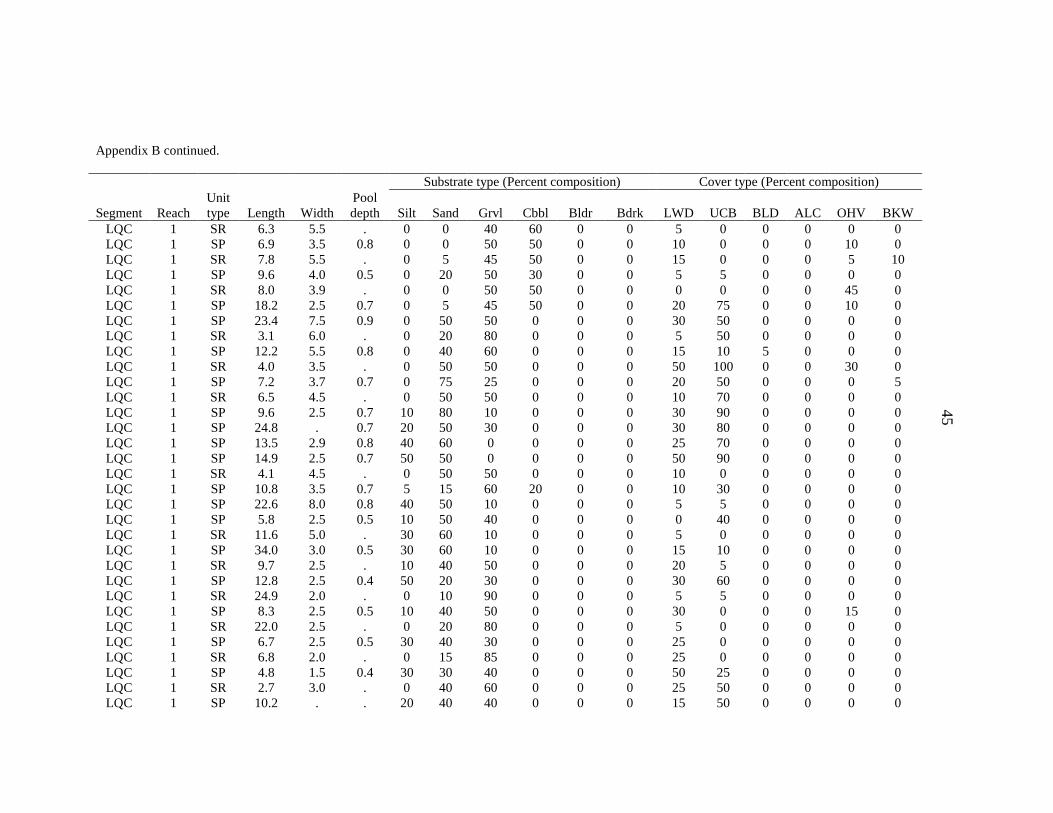
Appendix B continued. Substrate type (Percent composition) Cover type (Percent composition)
Segment Reach
Unit type Length Width
Pool depth Silt Sand Grvl Cbbl Bldr Bdrk LWD UCB BLD ALC OHV BKW
LQC 1 SR 6.3 5.5 . 0 0 40 60 0 0 5 0 0 0 0 0 LQC 1 SP 6.9 3.5 0.8 0 0 50 50 0 0 10 0 0 0 10 0 LQC 1 SR 7.8 5.5 . 0 5 45 50 0 0 15 0 0 0 5 10 LQC 1 SP 9.6 4.0 0.5 0 20 50 30 0 0 5 5 0 0 0 0 LQC 1 SR 8.0 3.9 . 0 0 50 50 0 0 0 0 0 0 45 0 LQC 1 SP 18.2 2.5 0.7 0 5 45 50 0 0 20 75 0 0 10 0 LQC 1 SP 23.4 7.5 0.9 0 50 50 0 0 0 30 50 0 0 0 0 LQC 1 SR 3.1 6.0 . 0 20 80 0 0 0 5 50 0 0 0 0 LQC 1 SP 12.2 5.5 0.8 0 40 60 0 0 0 15 10 5 0 0 0 LQC 1 SR 4.0 3.5 . 0 50 50 0 0 0 50 100 0 0 30 0 LQC 1 SP 7.2 3.7 0.7 0 75 25 0 0 0 20 50 0 0 0 5 LQC 1 SR 6.5 4.5 . 0 50 50 0 0 0 10 70 0 0 0 0 LQC 1 SP 9.6 2.5 0.7 10 80 10 0 0 0 30 90 0 0 0 0 LQC 1 SP 24.8 . 0.7 20 50 30 0 0 0 30 80 0 0 0 0 LQC 1 SP 13.5 2.9 0.8 40 60 0 0 0 0 25 70 0 0 0 0 LQC 1 SP 14.9 2.5 0.7 50 50 0 0 0 0 50 90 0 0 0 0 LQC 1 SR 4.1 4.5 . 0 50 50 0 0 0 10 0 0 0 0 0 LQC 1 SP 10.8 3.5 0.7 5 15 60 20 0 0 10 30 0 0 0 0 LQC 1 SP 22.6 8.0 0.8 40 50 10 0 0 0 5 5 0 0 0 0 LQC 1 SP 5.8 2.5 0.5 10 50 40 0 0 0 0 40 0 0 0 0 LQC 1 SR 11.6 5.0 . 30 60 10 0 0 0 5 0 0 0 0 0 LQC 1 SP 34.0 3.0 0.5 30 60 10 0 0 0 15 10 0 0 0 0 LQC 1 SR 9.7 2.5 . 10 40 50 0 0 0 20 5 0 0 0 0 LQC 1 SP 12.8 2.5 0.4 50 20 30 0 0 0 30 60 0 0 0 0 LQC 1 SR 24.9 2.0 . 0 10 90 0 0 0 5 5 0 0 0 0 LQC 1 SP 8.3 2.5 0.5 10 40 50 0 0 0 30 0 0 0 15 0 LQC 1 SR 22.0 2.5 . 0 20 80 0 0 0 5 0 0 0 0 0 LQC 1 SP 6.7 2.5 0.5 30 40 30 0 0 0 25 0 0 0 0 0 LQC 1 SR 6.8 2.0 . 0 15 85 0 0 0 25 0 0 0 0 0 LQC 1 SP 4.8 1.5 0.4 30 30 40 0 0 0 50 25 0 0 0 0 LQC 1 SR 2.7 3.0 . 0 40 60 0 0 0 25 50 0 0 0 0 LQC 1 SP 10.2 . . 20 40 40 0 0 0 15 50 0 0 0 0
45

Appendix B continued. Substrate type (Percent composition) Cover type (Percent composition)
Segment Reach
Unit type Length Width
Pool depth Silt Sand Grvl Cbbl Bldr Bdrk LWD UCB BLD ALC OHV BKW
LQC 1 SR 4.2 2.0 . 0 50 50 0 0 0 20 25 0 0 0 0 LQC 1 SP 5.2 2.0 0.4 0 30 70 0 0 0 30 50 0 0 0 0 LQC 1 SR 3.9 3.1 . 0 30 70 0 0 0 25 50 0 0 0 0 LQC 1 SP 8.9 3.5 0.8 0 50 50 0 0 0 30 80 0 0 0 0 LQC 1 SR 2.3 2.0 . 0 20 80 0 0 0 30 0 0 0 0 0 LQC 1 SP 11.0 3.0 0.5 0 50 50 0 0 0 20 40 0 0 0 0 LQC 1 SR 2.9 2.5 . 0 0 100 0 0 0 0 0 0 0 40 0 LQC 1 SP 19.5 4.0 0.5 10 20 70 0 0 0 20 50 0 0 0 0 LQC 1 SP 12.4 5.0 0.4 0 20 80 0 0 0 5 0 0 0 0 0 LQC 1 SR 14.7 3.5 . 0 5 95 0 0 0 10 0 0 0 0 0 LQC 1 SP 28.8 4.0 0.8 5 45 50 0 0 0 15 20 0 0 0 0 LQC 1 SR 3.4 2.0 . 0 10 90 0 0 0 5 0 0 0 0 0 LQC 1 SP 5.5 2.3 0.3 0 50 50 0 0 0 25 10 0 0 0 0 LQC 1 SR 7.3 1.5 . 0 50 50 0 0 0 15 30 0 0 0 0 LQC 1 SP 6.7 2.0 0.5 10 60 30 0 0 0 10 10 0 0 0 0 LQC 1 SR 19.2 1.0 . 0 30 70 0 0 0 10 0 0 0 0 0 LQC 1 SP 7.6 2.0 0.3 0 10 90 0 0 0 10 0 0 0 0 0 LQC 1 SR 38.5 2.0 . 0 10 90 0 0 0 10 0 0 0 0 0 LQC 1 SP 15.6 1.5 0.3 0 10 90 0 0 0 10 20 0 0 0 0 LQC 1 SR 10.0 1.0 . 0 10 90 0 0 0 10 40 0 0 0 0 LQC 1 SG 17.2 4.5 0.5 0 10 60 30 0 0 20 0 0 0 0 0 LQC 1 SP 20.7 5.0 0.7 0 30 70 0 0 0 5 10 0 0 0 0 LQC 1 SR 25.7 3.6 . 0 10 50 40 0 0 5 50 0 0 15 0 LQC 1 SR 5.6 2.0 . 0 10 90 0 0 0 0 0 0 0 0 0 LQC 1 SP 34.5 3.5 0.7 0 50 50 0 0 0 15 50 0 0 5 0 LQC 2 P 8.2 6.5 1.1 0 30 30 40 0 0 10 5 0 0 50 0 LQC 2 R 6.9 7.0 . 0 0 30 70 0 0 5 0 0 0 0 0 LQC 2 P 20.6 8.0 1.3 0 20 50 30 0 0 5 30 0 0 0 0 LQC 2 R 8.8 8.0 . 0 0 30 70 0 0 5 50 0 0 0 0 LQC 2 P 7.7 17.0 1.5 5 30 35 30 0 0 20 30 0 0 0 0 LQC 2 R 11.7 5.5 . 0 0 30 70 0 0 0 0 0 0 0 0 LQC 2 P 14.4 5.5 1.0 0 5 50 45 0 0 20 0 0 0 0 10
46
Appendix B continued. Substrate type (Percent composition) Cover type (Percent composition)
Segment Reach
Unit type Length Width
Pool depth Silt Sand Grvl Cbbl Bldr Bdrk LWD UCB BLD ALC OHV BKW
LQC 2 R 8.7 11.2 . 0 0 50 50 0 0 0 30 0 0 0 5 LQC 2 P 29.5 10.5 1.1 0 30 40 30 0 0 5 30 0 0 10 0 LQC 2 R 26.4 10.0 . 0 5 45 50 0 0 5 20 0 0 0 0 LQC 2 P 19.6 20.0 0.7 0 20 50 30 0 0 70 30 0 0 20 0 LQC 2 P 25.4 9.5 1.1 0 40 50 10 0 0 30 40 0 0 0 0 LQC 2 R 11.7 11.0 . 0 5 35 60 0 0 10 0 0 0 0 0 LQC 2 P 2.5 18.0 0.6 0 10 30 60 0 0 15 0 0 0 0 0 LQC 2 R 29.2 15.0 . 0 5 50 45 0 0 5 30 0 0 0 0 LQC 2 P 10.2 14.0 1.2 0 10 50 40 0 0 35 20 0 0 0 0 LQC 2 SR 4.4 . . 0 30 40 30 0 0 10 50 0 0 0 0 LQC 2 SP 13.0 1.8 0.4 5 10 65 20 0 0 15 20 0 0 5 0 LQC 2 SR 11.8 3.0 . 0 15 35 50 0 0 5 0 0 0 0 0 LQC 2 SP 11.9 3.5 . 0 20 40 40 0 0 20 0 0 0 0 0 LQC 2 R 23.7 7.5 . 0 0 50 50 0 0 5 40 0 0 5 0 LQC 2 P 12.8 4.5 0.9 0 0 50 50 0 0 5 50 0 0 60 0 LQC 2 R 17.0 13.0 . 0 0 30 70 0 0 5 30 0 0 0 5 LQC 2 P 9.4 8.0 0.8 0 0 50 50 0 0 10 20 0 0 0 0 LQC 2 LGJ 16.2 . . 0 0 0 0 0 0 0 0 0 0 0 0 LQC 2 R 20.6 10.0 . 0 0 40 60 0 0 30 0 0 0 0 0 LQC 3 R 23.2 10.5 . 0 0 50 50 0 0 0 0 0 0 0 0 LQC 3 P 31.6 5.3 1.3 0 10 70 20 0 0 15 50 0 0 0 0 LQC 3 R 12.4 7.0 . 0 0 30 70 0 0 10 0 0 0 0 0 LQC 3 P 12.3 5.5 0.8 0 5 70 25 0 0 5 5 0 0 0 5 LQC 3 R 11.3 8.0 . 0 0 50 50 0 0 5 0 0 0 0 0 LQC 3 P 10.9 8.0 1.1 0 15 35 50 0 0 10 0 0 0 0 0 LQC 3 SP 8.3 5.0 0.8 0 30 60 10 0 0 10 30 0 0 0 0 LQC 3 SR 16.1 5.0 . 0 20 60 20 0 0 10 40 0 0 0 20 LQC 3 SP 13.3 6.0 0.8 20 40 40 0 0 0 10 0 0 0 0 50 LQC 3 R 9.3 4.5 . 0 0 50 50 0 0 5 0 0 0 0 0 LQC 3 P 7.5 9.0 1.1 0 20 60 20 0 0 5 0 0 0 0 0 LQC 3 R 11.8 7.5 . 0 0 30 70 0 0 0 0 0 0 0 0 LQC 3 P 13.5 8.0 1.0 0 30 40 30 0 0 80 0 0 0 0 0
47

Appendix B continued. Substrate type (Percent composition) Cover type (Percent composition)
Segment Reach
Unit type Length Width
Pool depth Silt Sand Grvl Cbbl Bldr Bdrk LWD UCB BLD ALC OHV BKW
LQC 3 R 7.7 6.0 . 0 0 20 80 0 0 0 0 0 0 30 0 LQC 3 P 9.8 7.0 1.1 0 20 30 50 0 0 0 0 0 0 30 0 LQC 3 R 63.0 13.5 . 0 10 45 45 0 0 5 0 0 0 0 0 LQC 3 P 9.3 5.5 1.0 0 10 45 45 0 0 40 10 0 0 0 0 LQC 3 R 52.0 4.4 . 0 0 30 70 0 0 20 0 0 0 0 0 LQC 4 P 15.4 6.0 1.1 0 20 40 40 0 0 30 50 0 0 0 0 LQC 4 C 74.1 10.5 . 0 0 30 50 20 0 0 0 0 0 0 0 LQC 4 P 22.0 7.3 . 0 20 50 30 0 0 10 40 0 0 0 0 LQC 4 C 40.2 14.0 . 0 0 10 80 10 0 70 0 0 0 0 0 LQC 4 P 13.6 16.0 0.9 0 10 50 40 0 0 40 0 0 0 0 0 LQC 4 C 35.0 7.0 . 0 0 20 70 10 0 10 0 0 0 0 0 LQC 4 P 19.2 6.5 1.0 0 5 55 40 0 0 5 50 0 0 0 0 LQC 4 R 65.1 7.0 . 0 0 20 80 0 0 5 0 0 0 0 0 LQC 4 P 7.4 3.0 1.0 0 0 50 50 0 0 50 50 0 0 0 0 LQC 4 R 21.5 7.0 . 0 0 50 50 0 0 10 5 0 0 10 0 LQC 4 P 12.4 5.5 1.2 0 5 50 45 0 0 5 20 0 0 0 0 UQC 5 R 16.6 4.0 . 0 0 30 70 0 0 5 10 0 0 0 0 UQC 5 P 10.2 3.3 0.7 0 20 40 40 0 0 5 80 0 0 0 0 UQC 5 R 66.2 3.5 . 0 10 30 60 0 0 25 30 0 0 0 0 UQC 5 P 5.0 4.5 0.7 0 10 20 70 0 0 40 50 0 0 0 0 UQC 5 R 6.6 5.5 . 0 0 20 80 0 0 5 30 0 0 0 0 UQC 5 P 12.8 4.0 0.7 0 25 50 25 0 0 5 40 0 0 0 0 UQC 5 R 2.4 5.0 . 0 0 50 50 0 0 0 20 0 0 0 0 UQC 5 P 15.8 5.5 0.9 5 20 60 15 0 0 10 0 0 0 50 0 UQC 5 R 19.4 4.0 . 0 0 40 60 0 0 5 0 0 0 0 0 UQC 5 P 4.6 4.5 1.0 0 0 50 50 0 0 5 20 0 0 0 0 UQC 6 R 41.1 4.3 . 0 10 40 50 0 0 10 10 0 0 0 0 UQC 6 P 10.8 3.5 0.7 0 20 50 30 0 0 15 30 0 0 0 0 UQC 6 R 6.7 4.0 . 0 5 20 75 0 0 0 20 0 0 10 0 UQC 6 P 3.9 3.5 0.7 0 30 70 0 0 0 20 90 0 0 0 0 UQC 6 R 18.8 3.5 . 0 10 20 70 0 0 10 0 0 0 0 5 UQC 6 P 6.1 9.0 0.8 0 30 50 20 0 0 10 70 0 0 20 0
48
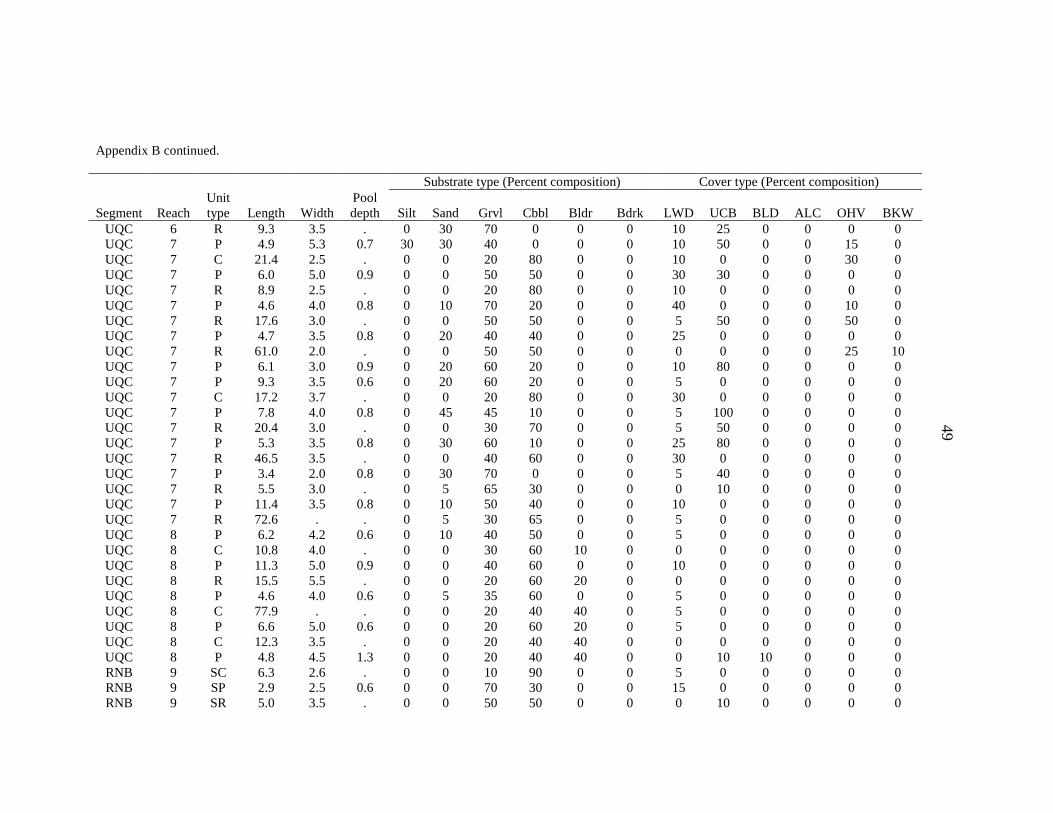
Appendix B continued. Substrate type (Percent composition) Cover type (Percent composition)
Segment Reach
Unit type Length Width
Pool depth Silt Sand Grvl Cbbl Bldr Bdrk LWD UCB BLD ALC OHV BKW
UQC 6 R 9.3 3.5 . 0 30 70 0 0 0 10 25 0 0 0 0 UQC 7 P 4.9 5.3 0.7 30 30 40 0 0 0 10 50 0 0 15 0 UQC 7 C 21.4 2.5 . 0 0 20 80 0 0 10 0 0 0 30 0 UQC 7 P 6.0 5.0 0.9 0 0 50 50 0 0 30 30 0 0 0 0 UQC 7 R 8.9 2.5 . 0 0 20 80 0 0 10 0 0 0 0 0 UQC 7 P 4.6 4.0 0.8 0 10 70 20 0 0 40 0 0 0 10 0 UQC 7 R 17.6 3.0 . 0 0 50 50 0 0 5 50 0 0 50 0 UQC 7 P 4.7 3.5 0.8 0 20 40 40 0 0 25 0 0 0 0 0 UQC 7 R 61.0 2.0 . 0 0 50 50 0 0 0 0 0 0 25 10 UQC 7 P 6.1 3.0 0.9 0 20 60 20 0 0 10 80 0 0 0 0 UQC 7 P 9.3 3.5 0.6 0 20 60 20 0 0 5 0 0 0 0 0 UQC 7 C 17.2 3.7 . 0 0 20 80 0 0 30 0 0 0 0 0 UQC 7 P 7.8 4.0 0.8 0 45 45 10 0 0 5 100 0 0 0 0 UQC 7 R 20.4 3.0 . 0 0 30 70 0 0 5 50 0 0 0 0 UQC 7 P 5.3 3.5 0.8 0 30 60 10 0 0 25 80 0 0 0 0 UQC 7 R 46.5 3.5 . 0 0 40 60 0 0 30 0 0 0 0 0 UQC 7 P 3.4 2.0 0.8 0 30 70 0 0 0 5 40 0 0 0 0 UQC 7 R 5.5 3.0 . 0 5 65 30 0 0 0 10 0 0 0 0 UQC 7 P 11.4 3.5 0.8 0 10 50 40 0 0 10 0 0 0 0 0 UQC 7 R 72.6 . . 0 5 30 65 0 0 5 0 0 0 0 0 UQC 8 P 6.2 4.2 0.6 0 10 40 50 0 0 5 0 0 0 0 0 UQC 8 C 10.8 4.0 . 0 0 30 60 10 0 0 0 0 0 0 0 UQC 8 P 11.3 5.0 0.9 0 0 40 60 0 0 10 0 0 0 0 0 UQC 8 R 15.5 5.5 . 0 0 20 60 20 0 0 0 0 0 0 0 UQC 8 P 4.6 4.0 0.6 0 5 35 60 0 0 5 0 0 0 0 0 UQC 8 C 77.9 . . 0 0 20 40 40 0 5 0 0 0 0 0 UQC 8 P 6.6 5.0 0.6 0 0 20 60 20 0 5 0 0 0 0 0 UQC 8 C 12.3 3.5 . 0 0 20 40 40 0 0 0 0 0 0 0 UQC 8 P 4.8 4.5 1.3 0 0 20 40 40 0 0 10 10 0 0 0 RNB 9 SC 6.3 2.6 . 0 0 10 90 0 0 5 0 0 0 0 0 RNB 9 SP 2.9 2.5 0.6 0 0 70 30 0 0 15 0 0 0 0 0 RNB 9 SR 5.0 3.5 . 0 0 50 50 0 0 0 10 0 0 0 0
49

Appendix B continued. Substrate type (Percent composition) Cover type (Percent composition)
Segment Reach
Unit type Length Width
Pool depth Silt Sand Grvl Cbbl Bldr Bdrk LWD UCB BLD ALC OHV BKW
RNB 9 C 9.6 4.0 . 0 0 10 80 0 0 5 0 0 0 0 0 RNB 9 P 12.1 5.0 0.7 0 25 35 35 5 0 10 5 5 0 0 0 RNB 9 C 64.9 4.0 . 0 0 10 70 20 0 10 0 5 0 0 0 RNB 9 SR 26.6 . . 0 0 50 50 0 0 5 0 0 0 0 0 RNB 9 SP 6.6 . 0.4 0 25 65 10 0 0 30 25 0 0 0 0 RNB 9 SR 15.8 2.5 . 0 0 50 50 0 0 10 0 0 0 20 0 RNB 9 SP 1.9 2.5 0.3 0 20 50 30 0 0 20 0 0 0 0 0 RNB 9 SR 19.6 2.6 . 0 0 50 50 0 0 10 50 0 0 5 0 RNB 9 SP 5.7 1.5 0.6 0 10 50 40 0 0 5 50 0 0 50 0 RNB 9 SR 6.3 1.5 . 0 0 20 80 0 0 0 5 0 0 0 0 RNB 9 SP 4.8 2.5 0.4 0 10 60 30 0 0 25 0 0 0 0 0 RNB 9 SR 3.4 3.5 . 0 0 100 0 0 0 0 90 0 0 0 100 RNB 9 SP 5.4 2.5 0.5 10 10 40 40 0 0 5 0 0 0 0 70 RNB 9 SR 3.9 2.0 . 0 0 30 70 0 0 5 0 0 0 0 50 RNB 9 SP 31.6 3.0 0.6 10 50 20 20 0 0 20 50 0 0 0 20 RNB 9 SR 15.8 1.5 . 0 0 50 50 0 0 10 80 0 0 0 20 RNB 9 SP 4.6 2.0 0.3 0 30 60 10 0 0 0 50 0 0 0 20 RNB 9 SC 10.2 1.0 . 0 0 50 50 0 0 0 80 0 0 0 0 RNB 9 SP 4.2 2.0 0.6 70 30 0 0 0 0 40 0 0 0 0 0 RNB 9 SR 5.3 1.5 . 60 40 0 0 0 0 25 0 0 0 0 0 RNB 9 SP 4.1 2.0 0.5 30 30 40 0 0 0 50 0 0 0 0 0 RNB 9 SR 43.5 . . 0 0 0 0 0 0 0 0 0 0 0 0 RNB 9 SR 11.5 2.5 . 0 0 30 70 0 0 5 0 0 0 0 0 RNB 9 SP 10.0 2.5 0.6 10 70 20 0 0 0 25 90 0 0 0 0 RNB 9 SP 6.5 2.0 0.5 0 10 80 10 0 0 10 50 0 0 50 0 RNB 9 LGJ 16.0 . . 0 0 0 0 0 0 0 0 0 0 0 0 RNB 9 P 10.7 5.0 0.8 0 10 45 45 0 0 15 50 0 0 5 0 RNB 9 SP 16.5 2.5 0.9 0 0 0 0 0 0 5 100 0 0 50 0 RNB 9 SC 22.7 . . 0 0 0 0 0 0 0 0 0 0 0 0 RNB 9 R 6.0 2.7 . 0 0 20 80 0 0 0 0 0 0 0 0 RNB 9 LGJ 10.6 . . 0 0 0 0 0 0 0 0 0 0 0 0 RNB 10 R 42.2 8.0 . 0 0 60 40 0 0 0 0 0 0 20 0
50
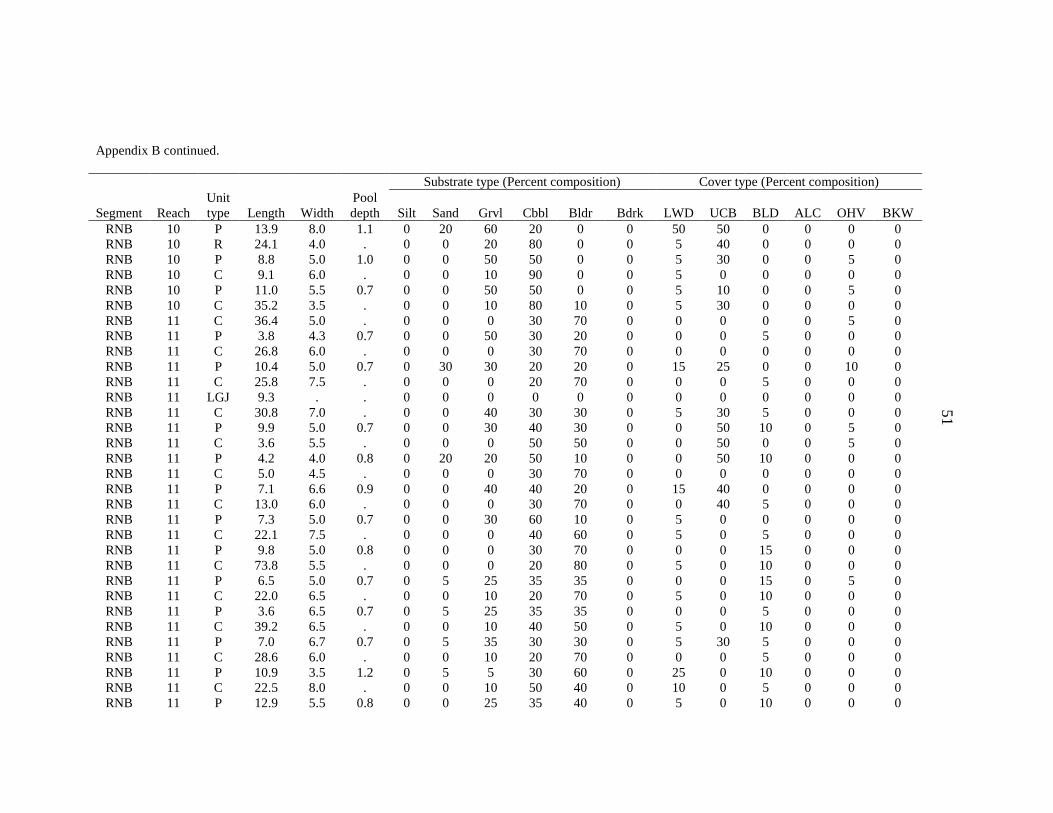
Appendix B continued. Substrate type (Percent composition) Cover type (Percent composition)
Segment Reach
Unit type Length Width
Pool depth Silt Sand Grvl Cbbl Bldr Bdrk LWD UCB BLD ALC OHV BKW
RNB 10 P 13.9 8.0 1.1 0 20 60 20 0 0 50 50 0 0 0 0 RNB 10 R 24.1 4.0 . 0 0 20 80 0 0 5 40 0 0 0 0 RNB 10 P 8.8 5.0 1.0 0 0 50 50 0 0 5 30 0 0 5 0 RNB 10 C 9.1 6.0 . 0 0 10 90 0 0 5 0 0 0 0 0 RNB 10 P 11.0 5.5 0.7 0 0 50 50 0 0 5 10 0 0 5 0 RNB 10 C 35.2 3.5 . 0 0 10 80 10 0 5 30 0 0 0 0 RNB 11 C 36.4 5.0 . 0 0 0 30 70 0 0 0 0 0 5 0 RNB 11 P 3.8 4.3 0.7 0 0 50 30 20 0 0 0 5 0 0 0 RNB 11 C 26.8 6.0 . 0 0 0 30 70 0 0 0 0 0 0 0 RNB 11 P 10.4 5.0 0.7 0 30 30 20 20 0 15 25 0 0 10 0 RNB 11 C 25.8 7.5 . 0 0 0 20 70 0 0 0 5 0 0 0 RNB 11 LGJ 9.3 . . 0 0 0 0 0 0 0 0 0 0 0 0 RNB 11 C 30.8 7.0 . 0 0 40 30 30 0 5 30 5 0 0 0 RNB 11 P 9.9 5.0 0.7 0 0 30 40 30 0 0 50 10 0 5 0 RNB 11 C 3.6 5.5 . 0 0 0 50 50 0 0 50 0 0 5 0 RNB 11 P 4.2 4.0 0.8 0 20 20 50 10 0 0 50 10 0 0 0 RNB 11 C 5.0 4.5 . 0 0 0 30 70 0 0 0 0 0 0 0 RNB 11 P 7.1 6.6 0.9 0 0 40 40 20 0 15 40 0 0 0 0 RNB 11 C 13.0 6.0 . 0 0 0 30 70 0 0 40 5 0 0 0 RNB 11 P 7.3 5.0 0.7 0 0 30 60 10 0 5 0 0 0 0 0 RNB 11 C 22.1 7.5 . 0 0 0 40 60 0 5 0 5 0 0 0 RNB 11 P 9.8 5.0 0.8 0 0 0 30 70 0 0 0 15 0 0 0 RNB 11 C 73.8 5.5 . 0 0 0 20 80 0 5 0 10 0 0 0 RNB 11 P 6.5 5.0 0.7 0 5 25 35 35 0 0 0 15 0 5 0 RNB 11 C 22.0 6.5 . 0 0 10 20 70 0 5 0 10 0 0 0 RNB 11 P 3.6 6.5 0.7 0 5 25 35 35 0 0 0 5 0 0 0 RNB 11 C 39.2 6.5 . 0 0 10 40 50 0 5 0 10 0 0 0 RNB 11 P 7.0 6.7 0.7 0 5 35 30 30 0 5 30 5 0 0 0 RNB 11 C 28.6 6.0 . 0 0 10 20 70 0 0 0 5 0 0 0 RNB 11 P 10.9 3.5 1.2 0 5 5 30 60 0 25 0 10 0 0 0 RNB 11 C 22.5 8.0 . 0 0 10 50 40 0 10 0 5 0 0 0 RNB 11 P 12.9 5.5 0.8 0 0 25 35 40 0 5 0 10 0 0 0
51
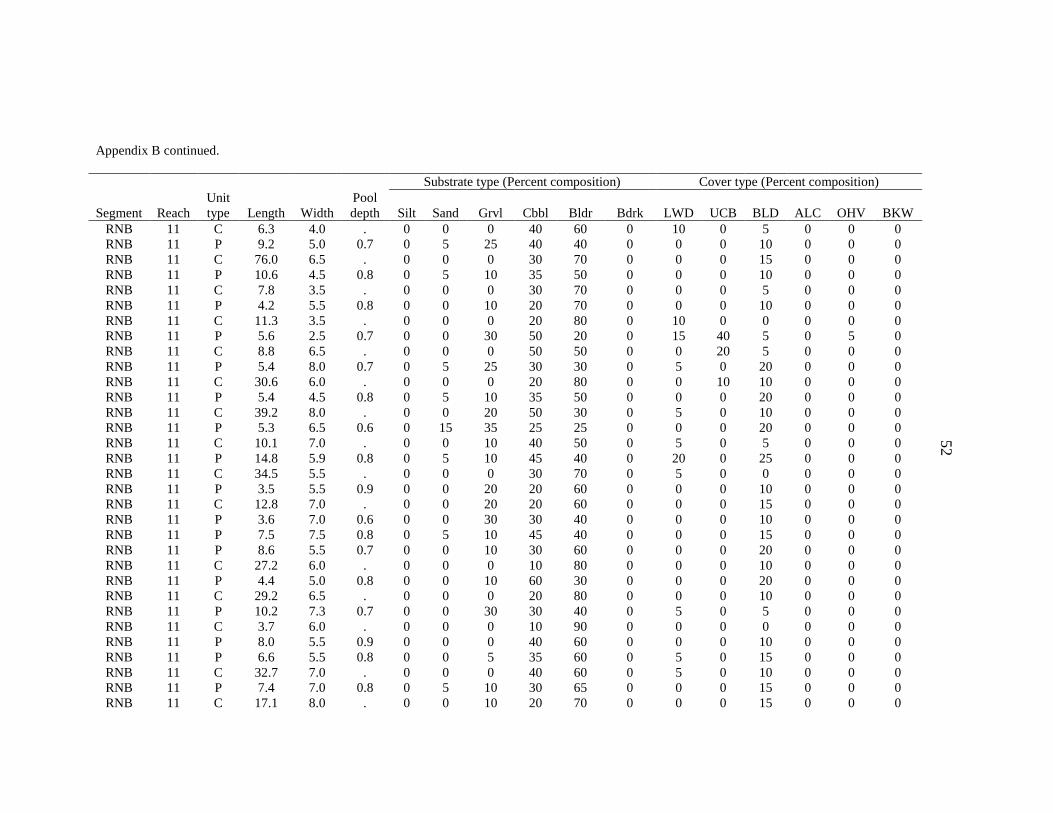
Appendix B continued. Substrate type (Percent composition) Cover type (Percent composition)
Segment Reach
Unit type Length Width
Pool depth Silt Sand Grvl Cbbl Bldr Bdrk LWD UCB BLD ALC OHV BKW
RNB 11 C 6.3 4.0 . 0 0 0 40 60 0 10 0 5 0 0 0 RNB 11 P 9.2 5.0 0.7 0 5 25 40 40 0 0 0 10 0 0 0 RNB 11 C 76.0 6.5 . 0 0 0 30 70 0 0 0 15 0 0 0 RNB 11 P 10.6 4.5 0.8 0 5 10 35 50 0 0 0 10 0 0 0 RNB 11 C 7.8 3.5 . 0 0 0 30 70 0 0 0 5 0 0 0 RNB 11 P 4.2 5.5 0.8 0 0 10 20 70 0 0 0 10 0 0 0 RNB 11 C 11.3 3.5 . 0 0 0 20 80 0 10 0 0 0 0 0 RNB 11 P 5.6 2.5 0.7 0 0 30 50 20 0 15 40 5 0 5 0 RNB 11 C 8.8 6.5 . 0 0 0 50 50 0 0 20 5 0 0 0 RNB 11 P 5.4 8.0 0.7 0 5 25 30 30 0 5 0 20 0 0 0 RNB 11 C 30.6 6.0 . 0 0 0 20 80 0 0 10 10 0 0 0 RNB 11 P 5.4 4.5 0.8 0 5 10 35 50 0 0 0 20 0 0 0 RNB 11 C 39.2 8.0 . 0 0 20 50 30 0 5 0 10 0 0 0 RNB 11 P 5.3 6.5 0.6 0 15 35 25 25 0 0 0 20 0 0 0 RNB 11 C 10.1 7.0 . 0 0 10 40 50 0 5 0 5 0 0 0 RNB 11 P 14.8 5.9 0.8 0 5 10 45 40 0 20 0 25 0 0 0 RNB 11 C 34.5 5.5 . 0 0 0 30 70 0 5 0 0 0 0 0 RNB 11 P 3.5 5.5 0.9 0 0 20 20 60 0 0 0 10 0 0 0 RNB 11 C 12.8 7.0 . 0 0 20 20 60 0 0 0 15 0 0 0 RNB 11 P 3.6 7.0 0.6 0 0 30 30 40 0 0 0 10 0 0 0 RNB 11 P 7.5 7.5 0.8 0 5 10 45 40 0 0 0 15 0 0 0 RNB 11 P 8.6 5.5 0.7 0 0 10 30 60 0 0 0 20 0 0 0 RNB 11 C 27.2 6.0 . 0 0 0 10 80 0 0 0 10 0 0 0 RNB 11 P 4.4 5.0 0.8 0 0 10 60 30 0 0 0 20 0 0 0 RNB 11 C 29.2 6.5 . 0 0 0 20 80 0 0 0 10 0 0 0 RNB 11 P 10.2 7.3 0.7 0 0 30 30 40 0 5 0 5 0 0 0 RNB 11 C 3.7 6.0 . 0 0 0 10 90 0 0 0 0 0 0 0 RNB 11 P 8.0 5.5 0.9 0 0 0 40 60 0 0 0 10 0 0 0 RNB 11 P 6.6 5.5 0.8 0 0 5 35 60 0 5 0 15 0 0 0 RNB 11 C 32.7 7.0 . 0 0 0 40 60 0 5 0 10 0 0 0 RNB 11 P 7.4 7.0 0.8 0 5 10 30 65 0 0 0 15 0 0 0 RNB 11 C 17.1 8.0 . 0 0 10 20 70 0 0 0 15 0 0 0
52

Appendix B continued. Substrate type (Percent composition) Cover type (Percent compostion)
Segment Reach
Unit type Length Width
Pool depth Silt Sand Grvl Cbbl Bldr Bdrk LWD UCB BLD ALC OHV BKW
RNB 11 P 4.2 5.0 0.8 0 0 0 30 70 0 0 0 5 0 0 0 RNB 11 C 6.2 6.0 . 0 0 10 30 60 0 0 0 0 0 0 0 RNB 11 P 8.8 5.5 0.6 0 0 5 50 45 0 0 0 5 0 0 0 RNB 11 C 50.0 8.3 . 0 0 20 40 40 0 20 0 0 0 0 5 RNB 11 P 10.7 5.5 0.9 0 5 10 50 35 0 0 0 5 0 5 20 RNB 11 C 14.5 6.5 . 0 0 0 30 70 0 0 0 5 0 0 0 RNB 11 P 8.1 5.5 0.6 0 0 20 30 50 0 0 0 5 0 0 0 RNB 11 C 99.0 7.0 . 0 0 20 30 50 0 5 5 10 0 0 0 RNB 11 P 12.0 6.5 0.8 0 10 25 25 40 0 0 0 10 0 0 0 RNB 11 C 12.4 6.0 . 0 0 0 40 60 0 0 0 5 0 0 0 RNB 11 P 8.4 4.5 0.7 0 0 5 30 6.5 0 0 0 5 0 0 0 RNB 11 C 30.2 7.0 . 0 0 30 40 30 0 0 30 5 0 0 0 RNB 11 P 8.5 5.0 0.9 0 10 10 40 40 0 0 0 5 0 0 0 RNB 11 C 7.6 9.0 . 0 0 0 60 40 0 5 0 0 0 0 0 RNB 11 P 5.3 5.5 0.7 0 10 30 30 30 0 10 0 5 0 0 0 RNB 11 C 22.4 7.5 . 0 0 30 70 0 0 5 0 0 0 0 0 RNB 12 P 5.6 4.5 0.8 0 0 50 50 0 0 20 0 0 0 0 0 RNB 12 R 20.2 9.0 . 0 0 60 20 20 0 5 5 5 0 0 0 RNB 12 P 7.0 5.0 1.2 0 0 20 50 30 0 20 0 15 0 0 0 RNB 12 P 8.5 5.0 1.1 0 0 0 50 50 0 10 0 20 0 0 0 RNB 12 C 9.3 5.0 . 0 0 0 50 50 0 0 0 0 0 0 0 RNB 12 P 5.0 6.0 0.7 0 10 40 50 0 0 0 0 10 0 0 0 RNB 12 C 24.0 7.0 . 0 0 10 40 50 0 5 0 5 0 0 0 RNB 12 P 8.9 5.5 0.8 0 10 10 40 40 0 5 0 5 0 0 0 RNB 12 C 50.0 5.7 . 0 0 20 60 20 0 5 0 5 0 0 0 RNB 12 P 8.1 6.0 0.7 0 0 40 30 30 0 0 0 5 0 0 0 RNB 12 C 66.9 7.0 . 0 0 30 40 30 0 5 0 5 0 5 0 RNB 12 P 2.6 10.0 0.5 0 0 0 50 50 0 20 0 0 0 0 0 RNB 12 P 15.9 6.5 0.9 0 0 70 20 10 0 10 0 0 0 0 30 RNB 13 R 57.4 7.0 . 0 0 30 65 5 0 10 10 0 0 0 0 RNB 13 P 8.4 4.5 0.8 0 0 50 50 0 0 0 0 0 0 5 0 RNB 13 R 23.8 4.0 . 0 0 25 50 25 0 10 0 0 0 0 0
53

Appendix B continued. Substrate type (Percent composition) Cover type (Percent composition)
Segment Reach
Unit type Length Width
Pool depth Silt Sand Grvl Cbbl Bldr Bdrk LWD UCB BLD ALC OHV BKW
RNB 13 P 15.2 6.5 0.7 0 20 25 35 20 0 5 0 0 0 0 0 RNB 13 R 37.9 6.8 . 0 0 30 70 0 0 5 30 0 0 0 10 RNB 13 P 22.5 5.5 0.9 0 10 50 40 0 0 10 0 0 0 0 0 RNB 13 SP 12.6 4.0 0.7 10 10 80 0 0 0 10 0 0 0 0 0 RNB 13 SR 7.8 4.0 . 0 0 100 0 0 0 10 0 0 0 0 0 RNB 13 SP 22.4 3.5 0.7 0 20 60 20 0 0 5 20 0 0 0 0 RNB 13 SR 16.4 . . 0 20 50 25 5 0 20 0 0 0 0 0 RNB 13 R 37.8 8.5 . 0 0 45 45 10 0 10 0 5 0 0 0 RNB 13 P 24.7 8.0 1.0 20 0 20 40 20 0 10 0 0 0 0 0
54

APPENDIX C
2008 BULL TROUT REDD COUNTS
55

Appendix C – Bull trout redd location in 2008 for Lower Quartz Creek (LQC), Upper Quartz Creek (UQC), and Rainbow Creek (RNB), tributaries to Quartz Lake, Glacier National Park, Montana.
Redd Segment Reach Easting UTM Northing UTM R01 LQC 2 715703 5415091 R02 LQC 2 715710 5415097 R03 LQC 2 715627 5415056 R04 LQC 4 716127 5415507 R05 RNB 9 716146 5415511 R06 RNB 10 716211 5415646 R07 UQC 5 716235 5415540 R08 LQC 4 716041 5415303 R09 LQC 1 715435 5414718 R10 LQC 1 715513 5414888 R11 LQC 1 715500 5414881 R12 LQC 2 715686 5415082 R13 LQC 4 716036 5415471 R14 LQC 4 716057 5415487 R15 LQC 1 715455 5414742 R16 LQC 4 716059 5415329 R17 LQC 4 716054 5415447 R18 RNB 9 716150 5415511 R19 RNB 11 716193 5415777 R20 RNB 11 716245 5416215 R21 RNB 11 716290 5416605 R22 RNB 11 716291 5416696 R23 RNB 12 716261 5416913 R24 RNB 12 716277 5416959 R25 RNB 13 716221 5416970 R26 RNB 13 716160 5416992 R27 RNB 13 716145 5417002 R28 RNB 13 716144 5416999 R29 LQC 2 715686 5415071 R30 LQC 2 715740 5415172 R31 LQC 3 715767 5415200 R32 LQC 3 715774 5415233 R33 LQC 3 715810 5415247 R34 LQC 3 715819 5415256 R35 LQC 3 715821 5415258 R36 LQC 3 715830 5415264 R37 LQC 4 715992 5415269 R38 LQC 4 716023 5415297 R39 LQC 4 716039 5415299
56

Appendix C continued.
Redd Segment Reach Easting UTM Northing UTM R40 LQC 4 716051 5415324 R41 LQC 4 716052 5415324 R42 LQC 4 716054 5415323 R43 LQC 4 716047 5415317 R44 LQC 4 716050 5415325 R45 LQC 4 716053 5415329 R46 LQC 4 716054 5415325 R47 LQC 4 716052 5415331 R48 LQC 4 716047 5415348 R49 LQC 4 716049 5415342 R50 LQC 4 716079 5415371 R51 LQC 4 716070 5415373 R52 LQC 4 716069 5415386 R53 LQC 4 716059 5415474 R54 LQC 4 716072 5415487 R55 LQC 4 716069 5415488 R56 LQC 4 716120 5415500 R57 LQC 4 716130 5415510 R58 UQC 5 716215 5415500 R59 RNB 10 716205 5415638 R60 LQC 1 715463 5414740 R61 LQC 1 715499 5414829 R62 LQC 1 715522 5414919 R63 LQC 1 715537 5414944 R64 LQC 1 715536 5414946 R65 LQC 2 715585 5415032 R66 LQC 2 715649 5415063 R67 LQC 2 715705 5415096 R68 LQC 2 715737 5415162 R69 LQC 3 715767 5415226 R70 RNB 10 716192 5415621 R71 LQC 2 715668 5415066 R72 LQC 2 715700 5415099 R73 LQC 2 715701 5415094 R74 LQC 3 715766 5415204 R75 LQC 3 715982 5415264 R76 LQC 4 716124 5415508 R77 LQC 3 715830 5415258 R78 LQC 4 715993 5415271 R79 RNB 9 716170 5415539 R80 RNB 11 716174 5415880
57
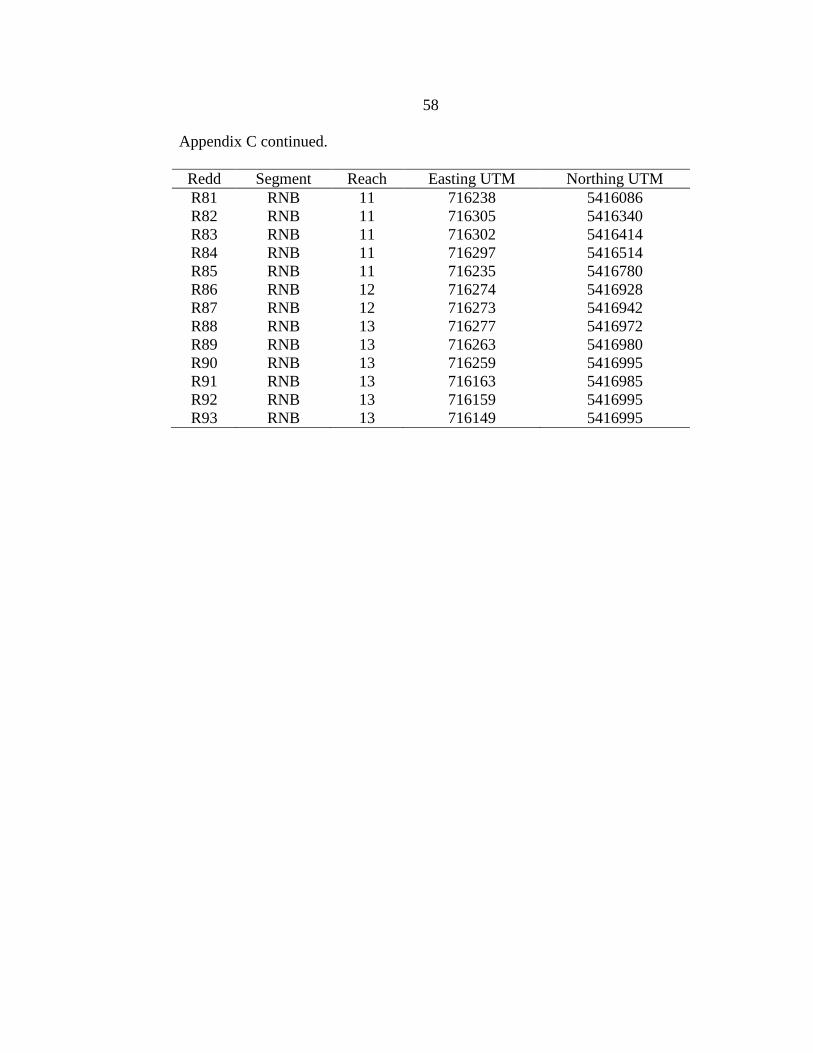
Appendix C continued.
Redd Segment Reach Easting UTM Northing UTM R81 RNB 11 716238 5416086 R82 RNB 11 716305 5416340 R83 RNB 11 716302 5416414 R84 RNB 11 716297 5416514 R85 RNB 11 716235 5416780 R86 RNB 12 716274 5416928 R87 RNB 12 716273 5416942 R88 RNB 13 716277 5416972 R89 RNB 13 716263 5416980 R90 RNB 13 716259 5416995 R91 RNB 13 716163 5416985 R92 RNB 13 716159 5416995 R93 RNB 13 716149 5416995
58

APPENDIX D
2008 SUBADULT BULL TROUT SURVEYS
59

Appendix D – Subadult bull trout (BLT) electrofishing survey species counts and catch per unit effort (C/f ; number per minute) for each survey location in 2008 in Lower Quartz Creek (LQC), Upper Quartz Creek (UQC), and Rainbow Creek (RNB), tributaries to Quartz Lake, Glacier National Park, Montana. Efish unit = electrofishing unit number, S = slow water unit, F = fast water unit, WCT = westslope cutthroat trout.
Efish unit
Segment
Reach
Unit type
Easting UTM
Northing UTM
BLT count
BLT C/f
WCT count
WCT C/f
1 LQC 1 S 715461 5414756 4 0.22 2 0.11 2 LQC 1 F 715476 5414762 0 0.00 0 0.00 3 LQC 1 S 715491 5414794 1 0.25 0 0.00 4 LQC 1 F 715502 5414832 1 0.14 0 0.00 5 LQC 1 S 715510 5414872 2 0.33 0 0.00 6 LQC 1 S 715516 5414894 0 0.00 0 0.00 7 LQC 1 S 715553 5414982 0 0.00 0 0.00 8 LQC 1 F 715545 5414983 0 0.00 0 0.00 9 LQC 1 S 715524 5414940 0 0.00 0 0.00 10 LQC 1 F 715526 5414955 1 0.39 0 0.00 11 LQC 1 S 715510 5414842 0 0.00 0 0.00 12 LQC 1 S 715514 5414858 1 0.25 0 0.00 13 LQC 1 S 715560 5414992 0 0.00 1 0.24 14 LQC 1 S 715382 5414763 1 0.13 1 0.13 15 LQC 1 F 715448 5414761 1 0.54 0 0.00 16 LQC 1 S 715426 5414815 2 0.69 1 0.35 17 LQC 1 F 715438 5414827 0 0.00 0 0.00 18 LQC 1 S 715436 5414824 0 0.00 1 0.34 19 LQC 1 S 715464 5414879 3 0.60 1 0.20 20 LQC 1 S 715433 5414815 1 0.34 0 0.00 21 LQC 1 F 715458 5414851 0 0.00 0 0.00 22 LQC 1 F 715462 5414864 0 0.00 0 0.00 23 LQC 1 S 715483 5414851 0 0.00 0 0.00 24 LQC 1 S 715485 5414896 3 0.40 0 0.00 25 LQC 2 S 715581 5415018 3 0.23 0 0.00 26 LQC 2 F 715587 5415020 1 0.45 0 0.00 27 LQC 2 S 715608 5415048 3 0.24 0 0.00 28 LQC 2 F 715685 5415073 0 0.00 0 0.00 29 LQC 2 S 715710 5415111 3 0.38 2 0.25 30 LQC 2 S 715733 5415138 2 0.36 0 0.00 31 LQC 3 F 715769 5415219 0 0.00 0 0.00 32 LQC 3 S 715772 5415220 2 0.27 0 0.00 33 LQC 3 S 715797 5415246 0 0.00 0 0.00 34 LQC 3 F 715802 5415251 1 0.32 0 0.00 35 LQC 3 S 715860 5415234 2 0.53 0 0.00 36 LQC 3 S 715932 5415259 1 0.18 1 0.18
60

Appendix D continued.
Efish unit
Segment
Reach
Unit type
Easting UTM
Northing UTM
BLT count
BLT C/f
WCT count
WCT C/f
37 LQC 4 S 716049 5415431 1 0.17 5 0.87 38 LQC 4 F 716053 5415449 3 0.49 0 0.00 39 LQC 4 F 716099 5415497 1 0.34 3 1.01 40 LQC 4 S 716123 5415506 2 0.43 0 0.00 41 UQC 5 S 716235 5415525 0 0.00 0 0.00 42 UQC 5 S 716250 5415556 0 0.00 0 0.00 43 UQC 6 F 716254 5415594 0 0.00 0 0.00 44 UQC 7 F 716282 5415625 0 0.00 0 0.00 45 UQC 7 S 716302 5415637 0 0.00 0 0.00 46 UQC 7 S 716303 5415638 1 0.64 0 0.00 47 UQC 7 S 716402 5415730 0 0.00 0 0.00 48 UQC 7 S 716450 5415756 0 0.00 0 0.00 49 UQC 7 F 716459 5415758 0 0.00 0 0.00 50 UQC 8 F 716494 5415863 0 0.00 0 0.00 51 UQC 8 S 716546 5415942 0 0.00 1 0.28 52 UQC 8 S 716559 5415953 0 0.00 1 0.64 53 RNB 9 F 716095 5415510 0 0.00 0 0.00 54 RNB 9 S 716122 5415512 0 0.00 0 0.00 55 RNB 9 S 716117 5415527 0 0.00 0 0.00 56 RNB 9 F 716111 5415535 0 0.00 0 0.00 57 RNB 9 S 716160 5415579 0 0.00 0 0.00 58 RNB 9 S 716177 5415565 0 0.00 1 0.27 59 RNB 9 F 716189 5415585 0 0.00 0 0.00 60 RNB 10 F 716213 5415650 0 0.00 0 0.00 61 RNB 10 S 716222 5415674 0 0.00 0 0.00 62 RNB 10 S 716210 5415683 0 0.00 1 0.15 63 RNB 11 F 716188 5415856 0 0.00 0 0.00 64 RNB 11 S 716177 5415847 1 0.19 2 0.39 65 RNB 11 S 716172 5415879 0 0.00 1 0.27 66 RNB 11 F 716167 5415875 1 0.10 2 0.21 67 RNB 11 S 716213 5416077 0 0.00 0 0.00 68 RNB 11 S 716239 5416099 1 0.14 1 0.14 69 RNB 11 F 716249 5416115 1 0.05 2 0.10 70 RNB 11 F 716250 5416230 0 0.00 0 0.00 71 RNB 11 S 716250 5416228 0 0.00 1 0.32 72 RNB 11 S 716286 5416262 0 0.00 1 0.29 73 RNB 11 S 716324 5416393 1 0.31 4 1.25 74 RNB 11 S 716323 5416397 1 0.21 2 0.42 75 RNB 11 F 716312 5416431 1 0.14 3 0.41 76 RNB 11 S 716308 5416501 0 0.00 1 0.40
61

Appendix D continued.
Efish unit
Segment
Reach
Unit type
Easting UTM
Northing UTM
BLT count
BLT C/f
WCT count
WCT C/f
77 RNB 11 F 716307 5416504 1 0.15 8 1.23 78 RNB 11 S 716294 5416522 0 0.00 0 0.00 79 RNB 11 S 716274 5416718 0 0.00 2 0.83 80 RNB 11 S 716252 5416746 0 0.00 0 0.00 81 RNB 11 F 716249 5416754 0 0.00 2 0.69 82 RNB 12 F 716253 5416828 0 0.00 2 0.83 83 RNB 12 S 716250 5416831 0 0.00 0 0.00 84 RNB 12 S 716272 5416845 2 0.46 2 0.46 85 RNB 13 S 716182 5416965 0 0.00 8 1.21 86 RNB 13 S 716150 5417005 0 0.00 6 0.51 87 RNB 13 F 716161 5416993 0 0.00 0 0.00
62

APPENDIX E
2007 BULL TROUT REDD COUNTS
63
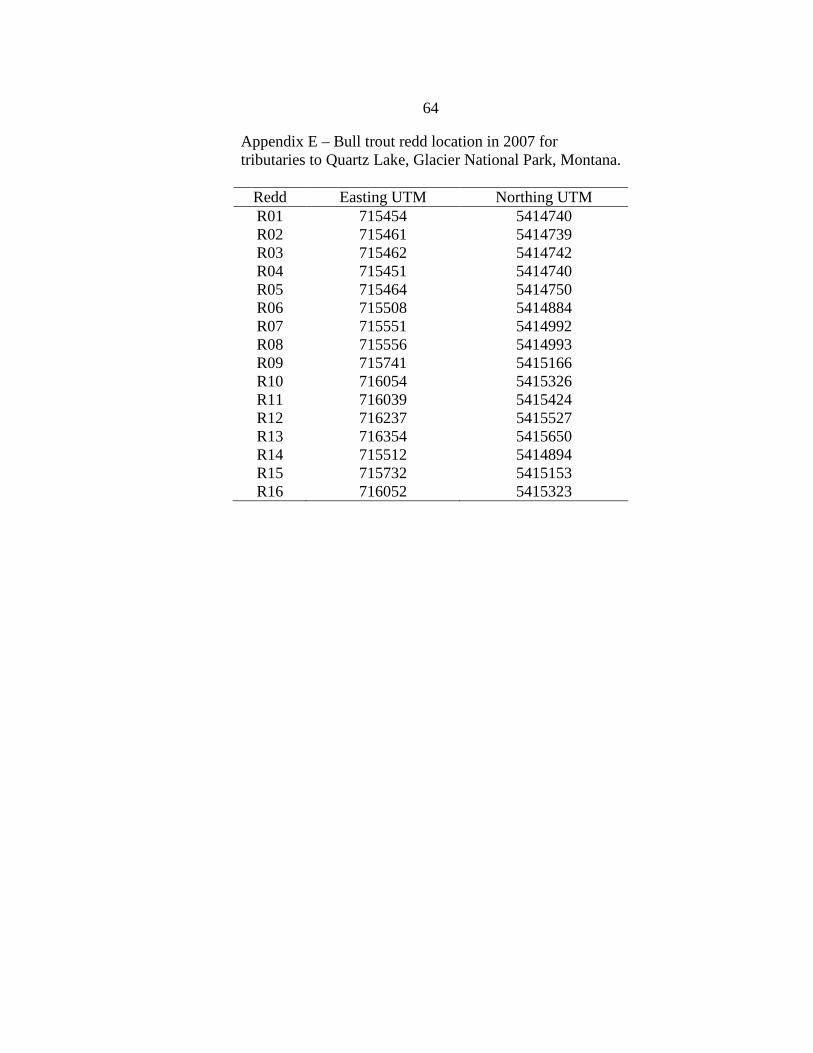
Appendix E – Bull trout redd location in 2007 for tributaries to Quartz Lake, Glacier National Park, Montana.
Redd Easting UTM Northing UTM R01 715454 5414740 R02 715461 5414739 R03 715462 5414742 R04 715451 5414740 R05 715464 5414750 R06 715508 5414884 R07 715551 5414992 R08 715556 5414993 R09 715741 5415166 R10 716054 5415326 R11 716039 5415424 R12 716237 5415527 R13 716354 5415650 R14 715512 5414894 R15 715732 5415153 R16 716052 5415323
64

APPENDIX F
2007 SUBADULT BULL TROUT SURVEYS
65
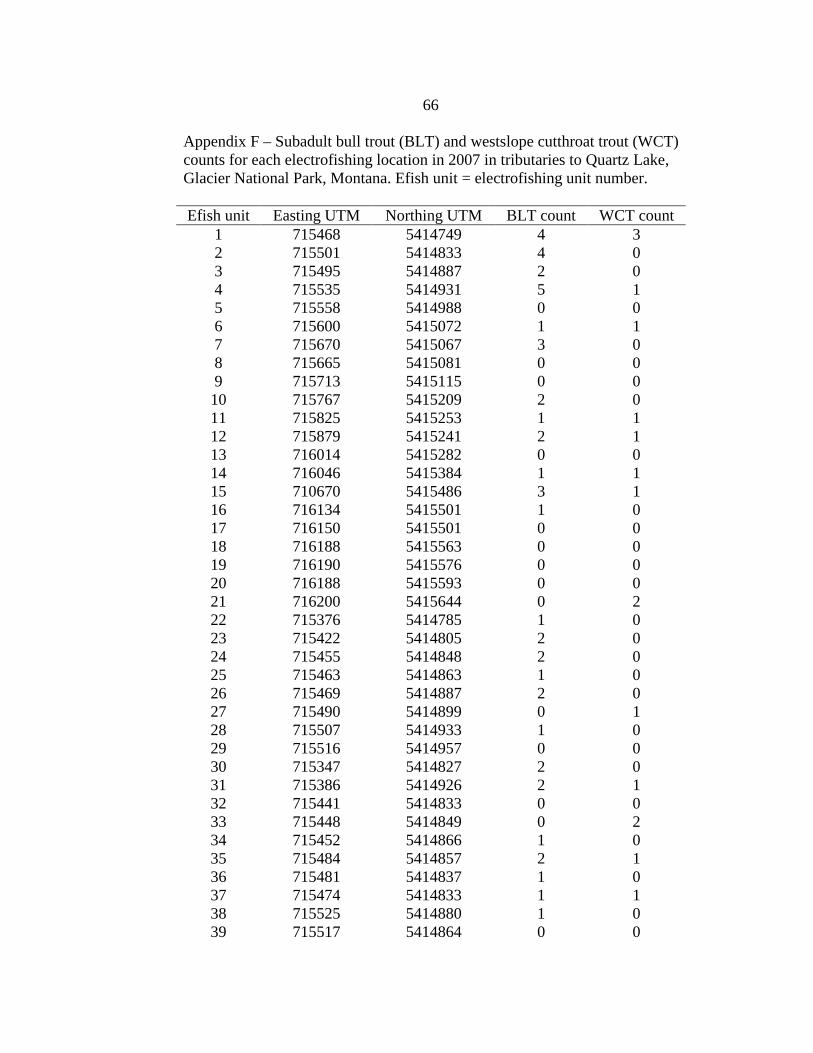
Appendix F – Subadult bull trout (BLT) and westslope cutthroat trout (WCT) counts for each electrofishing location in 2007 in tributaries to Quartz Lake, Glacier National Park, Montana. Efish unit = electrofishing unit number.
Efish unit Easting UTM Northing UTM BLT count WCT count
1 715468 5414749 4 3 2 715501 5414833 4 0 3 715495 5414887 2 0 4 715535 5414931 5 1 5 715558 5414988 0 0 6 715600 5415072 1 1 7 715670 5415067 3 0 8 715665 5415081 0 0 9 715713 5415115 0 0 10 715767 5415209 2 0 11 715825 5415253 1 1 12 715879 5415241 2 1 13 716014 5415282 0 0 14 716046 5415384 1 1 15 710670 5415486 3 1 16 716134 5415501 1 0 17 716150 5415501 0 0 18 716188 5415563 0 0 19 716190 5415576 0 0 20 716188 5415593 0 0 21 716200 5415644 0 2 22 715376 5414785 1 0 23 715422 5414805 2 0 24 715455 5414848 2 0 25 715463 5414863 1 0 26 715469 5414887 2 0 27 715490 5414899 0 1 28 715507 5414933 1 0 29 715516 5414957 0 0 30 715347 5414827 2 0 31 715386 5414926 2 1 32 715441 5414833 0 0 33 715448 5414849 0 2 34 715452 5414866 1 0 35 715484 5414857 2 1 36 715481 5414837 1 0 37 715474 5414833 1 1 38 715525 5414880 1 0 39 715517 5414864 0 0
66
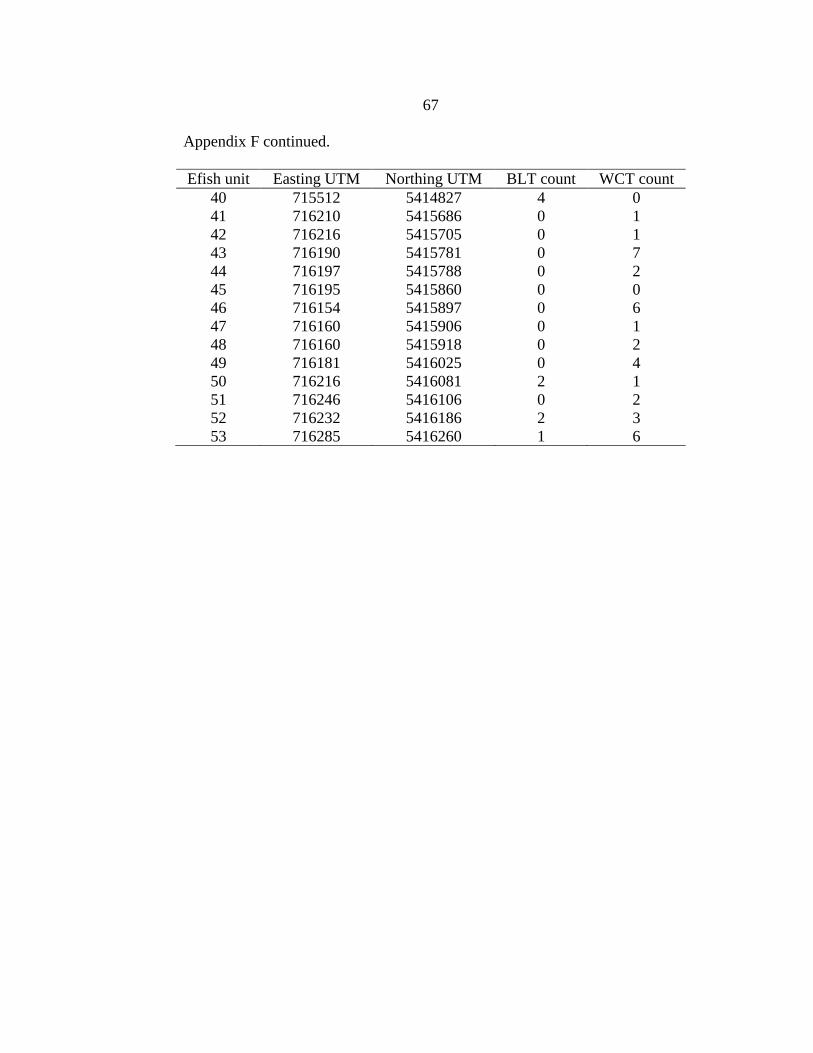
Appendix F continued.
Efish unit Easting UTM Northing UTM BLT count WCT count 40 715512 5414827 4 0 41 716210 5415686 0 1 42 716216 5415705 0 1 43 716190 5415781 0 7 44 716197 5415788 0 2 45 716195 5415860 0 0 46 716154 5415897 0 6 47 716160 5415906 0 1 48 716160 5415918 0 2 49 716181 5416025 0 4 50 716216 5416081 2 1 51 716246 5416106 0 2 52 716232 5416186 2 3 53 716285 5416260 1 6
67