Embed Size (px)
Citation preview
Republic of the Philippines Department of Energy
Final Report on
the Data Collection Survey on
Utilization of Clean Alternative Energy in the Republic of the Philippines
March 2012
JAPAN INTERNATIONAL COOPERATION AGENCY
MITSUBISHI RESEARCH INSTITUTE, INC. OSAKA GAS CO., LTD.
NIPPON STEEL ENGINEERING CO., LTD. THE INSTITUTE OF ENERGY ECONOMICS, JAPAN
ILD
CR(5) 12-031

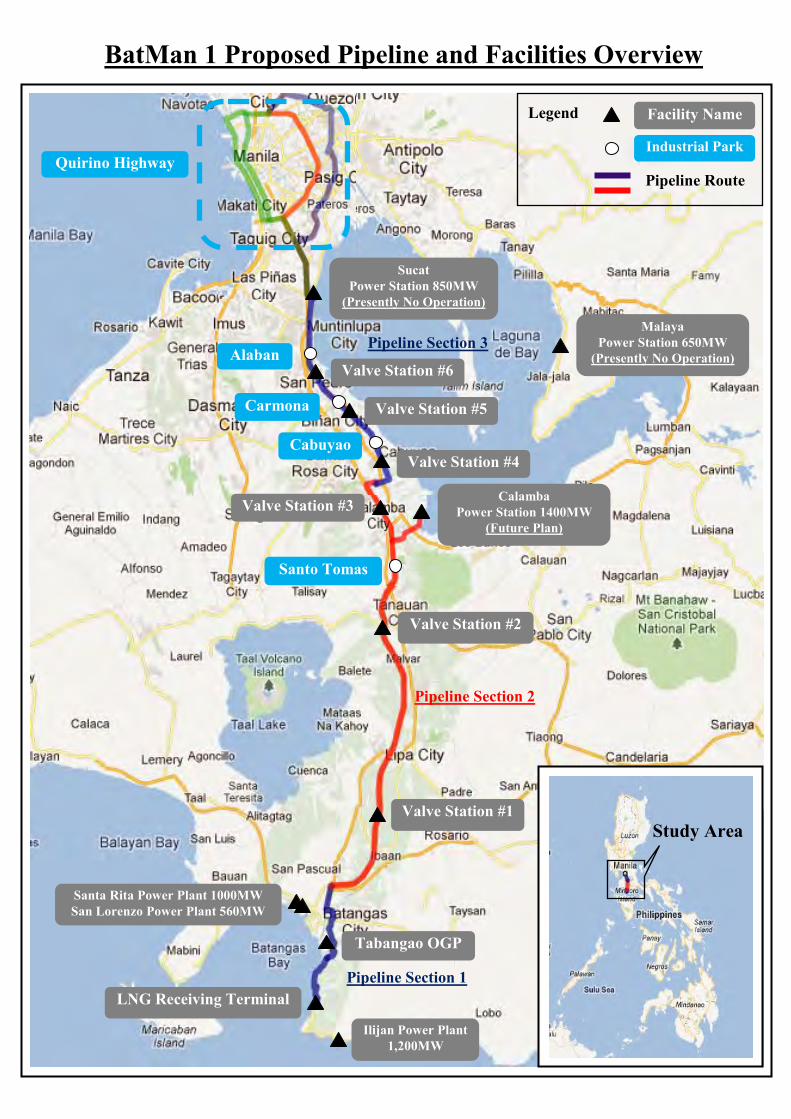
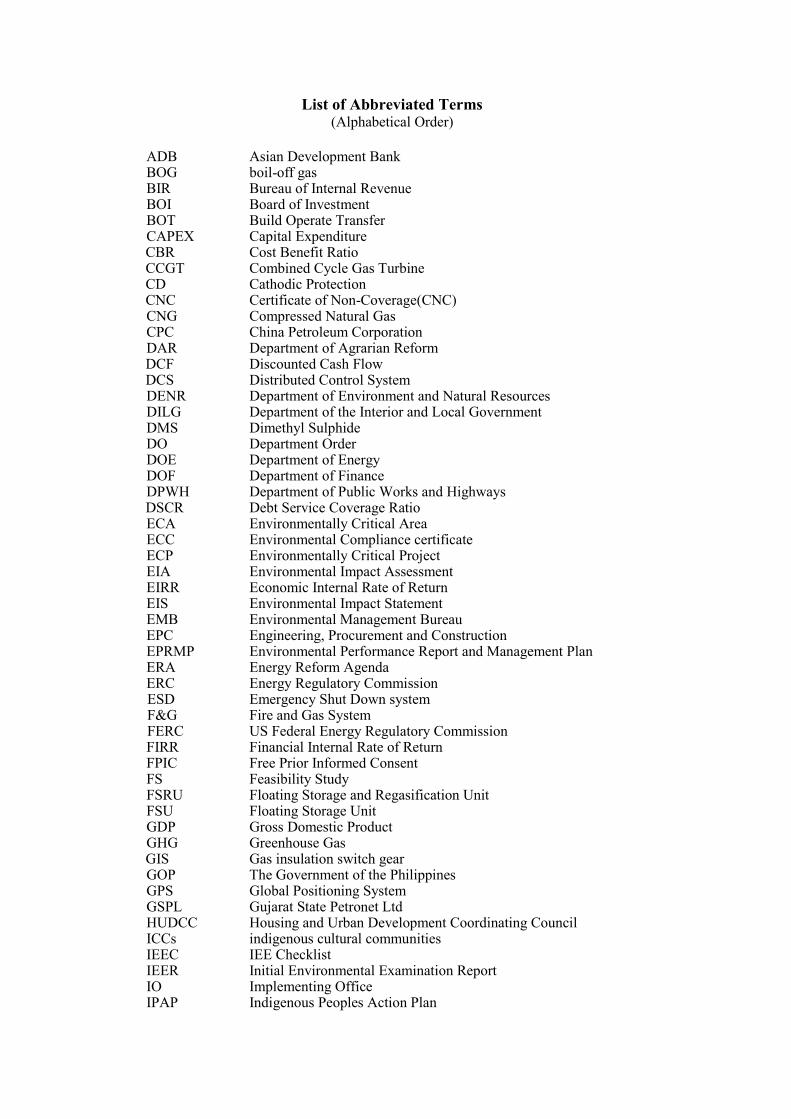
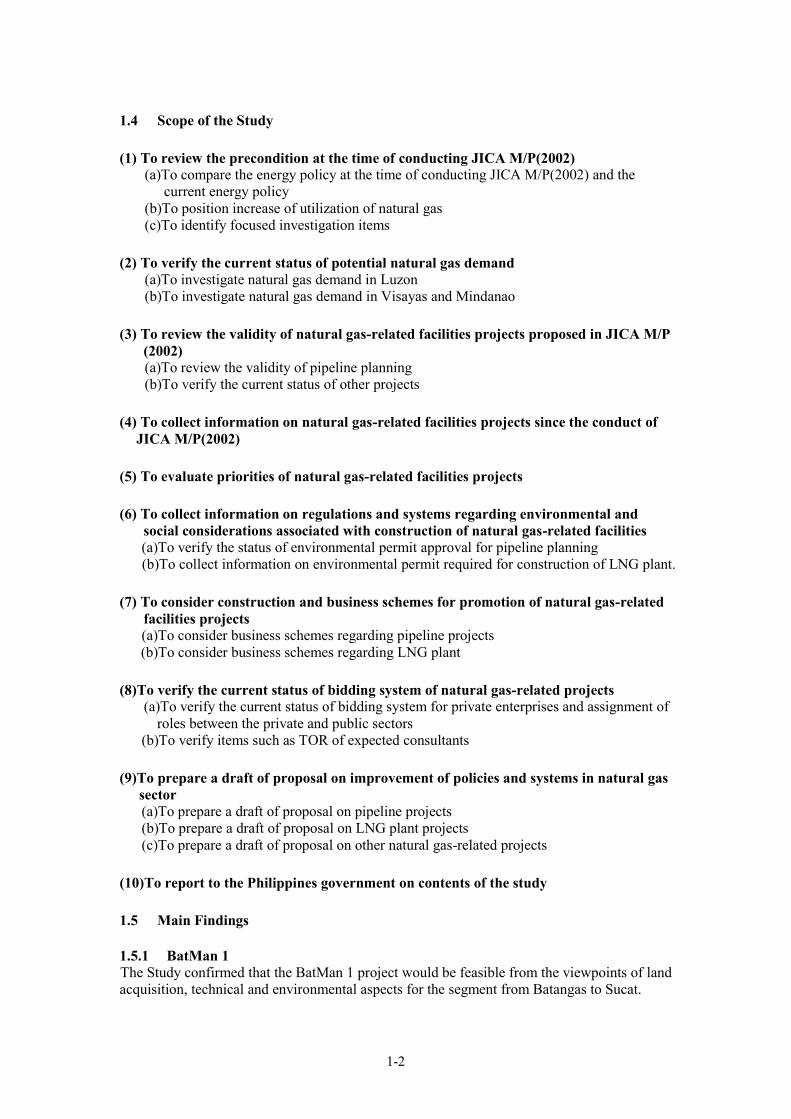
BatMan 1 Proposed Pipeline and Facilities Overview
LNG Receiving Terminal
Tabangao OGP
Alabang
Carmona
Cabuyao
Study Area
Facility Name
Industrial Park
Legend
Pipeline Section 3
Pipeline Section 1
Pipeline Section 2
Pipeline Route
Malaya Power Station 650MW
(Presently No Operation)
Ilijan Power Plant 1,200MW
Santa Rita Power Plant 1000MW San Lorenzo Power Plant 560MW
Valve Station #1
Valve Station #2
Valve Station #4
Valve Station #5
Valve Station #6
Santo Tomas
Calamba Power Station 1400MW
(Future Plan) Valve Station #3
Sucat Power Station 850MW
(Presently No Operation)
Quirino Highway
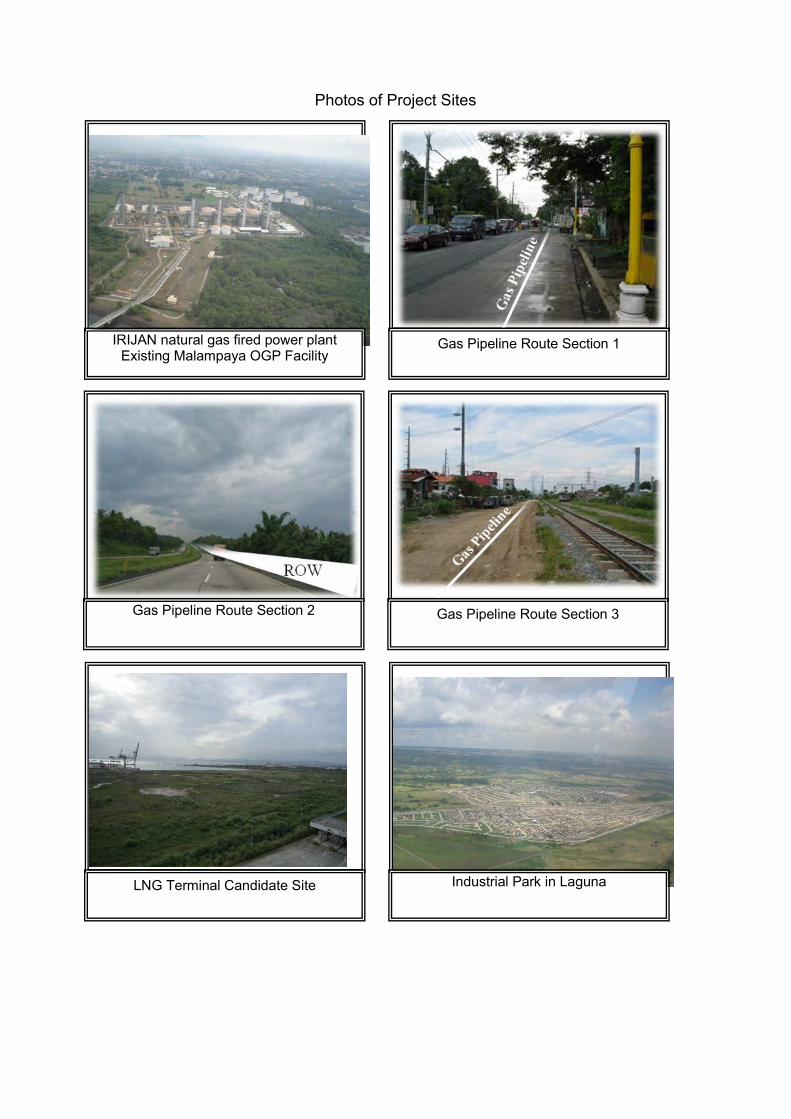
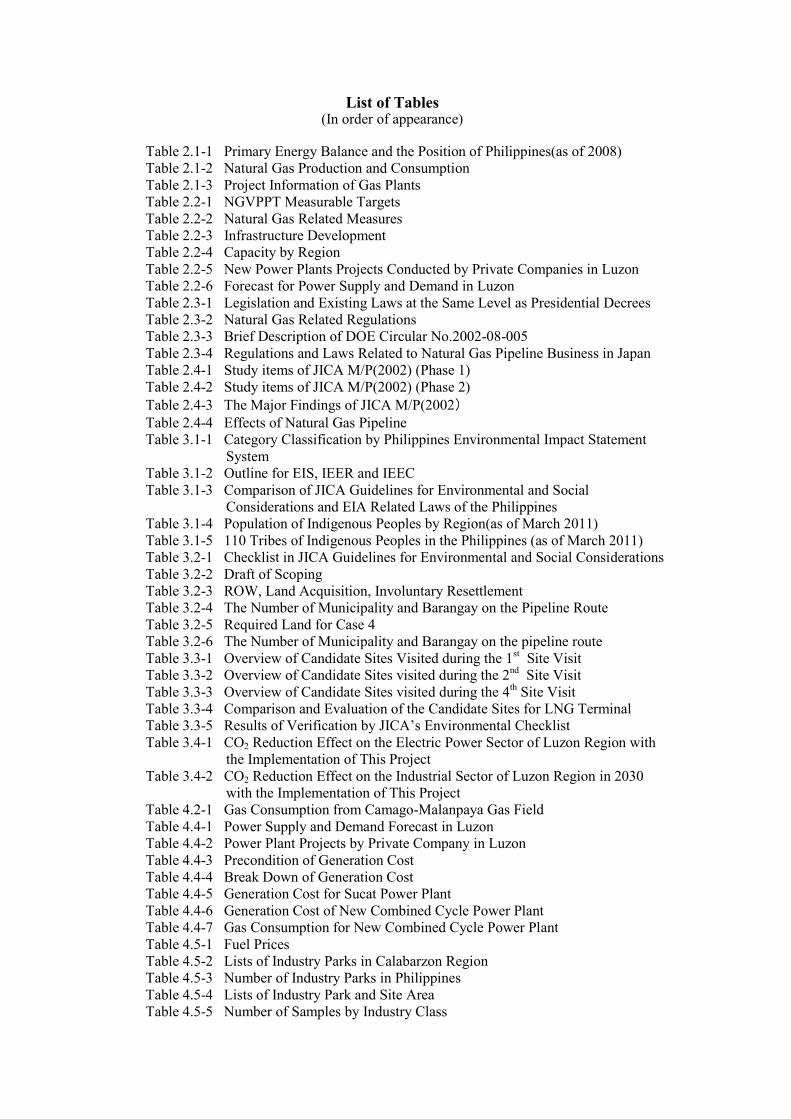
Photos of Project Sites
Gas Pipeline Route Section 2
Gas Pipeline Route Section 3
Please convert to JPEG file
LNG Terminal Candidate Site
Please convert to JPEG file
Industrial Park in Laguna
Please convert to JPEG file
IRIJAN natural gas fired power plant Existing Malampaya OGP Facility
Gas Pipeline Route Section 1
Table of Contents
Chapter 1 Introduction ................................................................................................................ 1-1
1.1 Background .................................................................................................................. 1-1 1.2 Objective ...................................................................................................................... 1-1 1.3 Study Area .................................................................................................................... 1-1 1.4 Scope of the Study ....................................................................................................... 1-2 1.5 Main Findings .............................................................................................................. 1-2
Chapter 2 Natural Gas Utilization Policy and Regulatory Framework .................................. 2-1 2.1 Current Situation of Natural Gas Production and Consumption .................................. 2-1 2.2 Outline of the Current Energy Policy ........................................................................... 2-5 2.3 Outline of the Existing Regulatory Framework ......................................................... 2-14 2.4 Review of JICA M/P (2002) and Necessity of Development of Natural Gas
Infrastructure .............................................................................................................. 2-22 Chapter 3 Confirmation of Basic Information on Regulation and System for Environmental
and Social Considerations .......................................................................................... 3-1 3.1 Regulations and System For Environmental and Social Considerations relevant to This
Project .......................................................................................................................... 3-1 3.2 Environmental and Social Considerations Regarding the Pipeline Project ................ 3-12 3.3 Environmental and Social Considerations Regarding LNG Terminal Construction .. 3-20 3.4 CO2 Emission Reduction Effect Expected to Be Brought by the Proposed Project ... 3-34
Chapter 4 Natural Gas Demand .................................................................................................. 4-1 4.1 Review of JICA M/P(2002) ......................................................................................... 4-1 4.2 Current Situation of Gas Supply and Demand ............................................................. 4-4 4.3 International Trends of LNG Price ............................................................................... 4-5 4.4 Gas Demand for Power Sector ..................................................................................... 4-6 4.5 Gas Demand for Industry Sector ................................................................................ 4-13 4.6 Gas Demand for Commercial Sector.......................................................................... 4-21 4.7 Gas Demand for Transport Sector .............................................................................. 4-23 4.8 Gas Demand in Luzon ................................................................................................ 4-24
Chapter 5 LNG Supply-Demand System ................................................................................... 5-1 5.1 Global LNG Production and Consumption .................................................................. 5-1
Chapter 6 BatMan 1 Pipeline Plan ............................................................................................. 6-1 6.1 Natural Gas Supply Volume/Location ......................................................................... 6-1 6.2 Gas Pipeline Route ....................................................................................................... 6-3 6.3 Gas Pipeline Design Overview .................................................................................... 6-8 6.4 Related Pipeline Facilities .......................................................................................... 6-26 6.5 Consideration of Project Implementation ................................................................... 6-35
Chapter 7 LNG Receiving Terminal ........................................................................................... 7-1 7.1 Design Conditions for LNG Receiving Terminal ........................................................ 7-1 7.2 Main Facilities and Equipments of LNG Receiving Terminal ..................................... 7-3 7.3 Project Execution Study ............................................................................................. 7-16 7.4 LNG Cold Energy Utilization .................................................................................... 7-19
Chapter 8 Project Scheme ........................................................................................................... 8-1 8.1 Current Regulation ....................................................................................................... 8-1 8.2 Pipeline ......................................................................................................................... 8-1 8.3 LNG Regasification Terminal .................................................................................... 8-10 8.4 Economic Analysis ..................................................................................................... 8-12
Chapter 9 Implementation of BatMan 1 Pipeline Project ........................................................ 9-1 9.1 Development of a Physical Link between Sources and Offtakers................................ 9-1 9.2 Project Implementing Entity ........................................................................................ 9-2 9.3 Project Model to Encourage Participation of the Private Sector .................................. 9-8
Chapter 10 Recommendation for Project Implementation ...................................................... 10-1 10.1 Basic Understanding of DOE for Project Implementation ......................................... 10-1 10.2 Institutional Development for Legal and Regulatory Systems ................................... 10-2 10.3 Feasibility Study for Project ....................................................................................... 10-3

10.4 Project Model Scheme and Finance ........................................................................... 10-3 10.5 Procedures for Project Implementation ...................................................................... 10-4
Annex i Procedure and Schedule for promotion of BatMan 1 Gas Pipeline Annex ii BatMan 1 Route Map Annex iii Pipeline Model Annex iv The Philippine BOT Law Annex v Guidelines and Procedures for Entering into Joint Venture (JV) Agreements
between Government and Private Entities
List of Abbreviated Terms (Alphabetical Order)
ADB Asian Development Bank BOG boil-off gas BIR Bureau of Internal Revenue BOI Board of Investment BOT Build Operate Transfer CAPEX Capital Expenditure CBR Cost Benefit Ratio CCGT Combined Cycle Gas Turbine CD Cathodic Protection CNC Certificate of Non-Coverage(CNC) CNG Compressed Natural Gas CPC China Petroleum Corporation DAR Department of Agrarian Reform DCF Discounted Cash Flow DCS Distributed Control System DENR Department of Environment and Natural Resources DILG Department of the Interior and Local Government DMS Dimethyl Sulphide DO Department Order DOE Department of Energy DOF Department of Finance DPWH Department of Public Works and Highways DSCR Debt Service Coverage Ratio ECA Environmentally Critical Area ECC Environmental Compliance certificate ECP Environmentally Critical Project EIA Environmental Impact Assessment EIRR Economic Internal Rate of Return EIS Environmental Impact Statement EMB Environmental Management Bureau EPC Engineering, Procurement and Construction EPRMP Environmental Performance Report and Management Plan ERA Energy Reform Agenda ERC Energy Regulatory Commission ESD Emergency Shut Down system F&G Fire and Gas System FERC US Federal Energy Regulatory Commission FIRR Financial Internal Rate of Return FPIC Free Prior Informed Consent FS Feasibility Study FSRU Floating Storage and Regasification Unit FSU Floating Storage Unit GDP Gross Domestic Product GHG Greenhouse Gas GIS Gas insulation switch gear GOP The Government of the Philippines GPS Global Positioning System GSPL Gujarat State Petronet Ltd HUDCC Housing and Urban Development Coordinating Council ICCs indigenous cultural communities IEEC IEE Checklist IEER Initial Environmental Examination Report IO Implementing Office IPAP Indigenous Peoples Action Plan
IPs indigenous peoples IROW Infrastructure Right of Way IRR Internal Rate of Return JICA Japan International Cooperation Agency JV Joint Venture LAPRAP Land Acquisition Plan and Resettlement Action Plan LNG Liquefied Natural Gas MMS Marine Monitoring System MOA Memorandum of Agreement M/P Master Plan Study MS Metering Station NAPOCOR National Power Corporation NCIP National Commission on Indigenous Peoples NECA Non-Environmentally Critical Area NEDA National Economic Development Authority NGVPPT Natural Gas Vehicle Program for Public Transport NHA National Housing Authority NIA National Irrigation Administration NPV Net Present Value O&M Operation and Maintenance OPEX Operating Expenditure ORV Open Rack Vaporizer PDP Power Development Plan PDR Project Description Report PEIS Programmatic Environmental Impact Statement PEISS Philippines Environmental Impact Statement System PEP Philippine Energy Plan PEZA Philippine Economic Zone Authority PIP Public Investment Program PFD Process Flow Diagram PIMS Plant Information Management System PL Pipeline PMS Unloading arm Position Monitoring System PNCC Philippine National Construction Corporation PNOC Philippine National Oil Company PNOC-EC Philippine National Oil Company Exploration Corporation PQ Prequalification PPP Public-Private Partnership PS Percellary Survey RAP Resettlement Action Plan ROI Return on Investment ROW Right of Way SCV Submerged Combustion Vaporizer SCADA Supervisory Control And Data Acquisition SCF Standard Conversion Factor SLEX The South Luzon Expressway SPS Safeguard Policy Statement STAR South Tagalog Arterial Road STEP Special Terms for Economic Partnership STV Shell & Tube Vaporizer TBM tertiaty butyl mercaptan TRANSCO Transmission Corporation USD United States Dollars VS Valve station WACC Weighted Average Cost of Capital
Units
Category Abbreviation Unit Remarks Natural Gas scf : standard cubic feet 1 scf = 0.0268 normal cubic
meters ton : tonnes 1,000 tonnes = 48,700 cuf
= 51,750 million Btu = 0.05458 PJ
Btu : British thermal unit 1 Btu = 1,055.056 joules PJ : peta joule 1 PJ = 23.9 toe toe : tonne oil equivalent 1 toe = 41.8 GJ BCF : billion cubic feet MMscf/d : million standard cubic feet per day MMscf/h : million standard cubic feet per hour Nm3 : normal cubic meter
MMNm3/h : million Normal cubic per hour
Distance ft. : feet 1 feet = 12 inch = 0.303 meter m. : meter 1 meter = 100 cm = 0.001 km
Area m2 : square meters 1.0 m * 1.0 m
km2 : square kilometers 1.0 km* 1.0 km Ha : hectare 1 ha = 10,000 m2 acre : acre 1 acre = 4,046.86 m2
Currency JPY : Japanese Yen
USD : United States Dollars 1 USD = 85 JPY ** PHP : Philippines Pesos 1 USD = 43 PHP **
Power kV : kilo volts
(**as of 2010, at the time of project cost estimation)
kW : kilo watts 1 kW = 1,000 W MW : mega watts 1 MW = 1,000 kW Wh : watt-hours kWh : kilo watt-hours 1 kWh = 1,000 Wh MWh : mega watt-hours 1 MWh = 1,000 kWh GWh : giga watt-hours 1 GWh = 1,000 MWh
List of Figures (In order of appearance)
Figure 2.1-1 Primary Energy Supply (As of 2009) Figure 2.1-2 Production of Natural Gas and Self-sufficiency Rate Figure 2.1-3 Current Users of Natural Gas Figure 2.2-1 Energy Reform Agenda Figure 2.2-2 Policy Thrust of the PEP and Natural Gas Related Measures Figure 2.2-3 Planned LNG Terminal in Mindanao Figure 2.2-4 Planned Natural Gas Infrastructure in Luzon Figure 2.2-5 Capacity and Gross Power Generation (2010) Figure 2.2-6 Private Sector Initiated Power Projects(Luzon Grid) Figure 2.4-1 Energy Price Prediction as of 2002 Figure 3.1-1 Summary Flowchart of EIA Process Figure 3.2-1 Pipeline Route Figure 3.3-1 Candidate Sites of LNG Terminal Visited during the 1st Site Visit Figure 3.3-2 Candidate Sites of LNG Terminal Visited during the 2nd Site Visit Figure 3.3-3 Candidate Sites of LNG Terminal Visited during the 3rd Site Visit Figure 3.3-4 Candidate Sites of LNG Terminal Visited during the 4th Site Visit Figure 3.3-5 Distribution of the Indigenous Ethnic Group Bajau People in the
Philippines Figure 3.4-1 Forecast of Natural Gas Demand in the Industrial Sector Figure 4.1-1 Trend of GDP in the Philippines Figure 4.1-2 Trend of Final Energy Consumption in the Philippines Figure 4.1-3 Trend of Final Energy Consumption excluding Biomass Figure 4.1-4 Trend of Final Energy Consumption by Sector Figure 4.1-5 Forecast of Final Energy Consumption by Sector Figure 4.1-6 Energy Price Assumption as of 2002 Figure 4.2-1 Production Trend of Camago-Malampaya Gas Field Figure 4.3-1 Comparison of Import LNG Price (2010) Figure 4.3-2 Price Trends among JLC, JCC and Brent Figure 4.4-1 Power Supply and Demand Forecast in Luzon Figure 4.4-2 Trends of Power Generation by Power Sources Figure 4.4-3 Location of Power Plant Projects by Private Company in Luzon Figure 4.4-4 Location of Power Plant Projects by Private Company in Visayas Figure 4.4-5 Location of Power Plant Projects by Private Company in Mindanao Figure 4.5-1 Industry Park along Gas Pipeline Figure 4.5-2 16 Regions in Philippines Figure 4.6-1 Outline of Co-generation System (1 Unit) Figure 4.6-2 Co-Generation System Figure 5.1-1 Production and Consumption of Natural Gas Figure 5.1-2 LNG Exports and Imports Figure 5.1-3 LNG Exports and Imports by Region Figure 5.1-4 Global LNG Supply-Demand Balance Figure 6.1-1 The Peak Natural Gas Supply Volume for Conditions of the Pipeline
Design Figure 6.2-1 BatMan 1 Route Selection Figure 6.2-2 Section 1 Batangas Urban Area Figure 6.2-3 Section 1 Elevation Profile Figure 6.2-4 Section 2 along Highway Figure 6.2-5 Section 2 Elevation Profile Figure 6.2-6 Section 3 along PNR Figure 6.2-7 Section 3 Elevation Profile Figure 6.2-8 ROW Typical Cross Section Drawing Figure 6.3-1 BatMan Pipeline Class Location
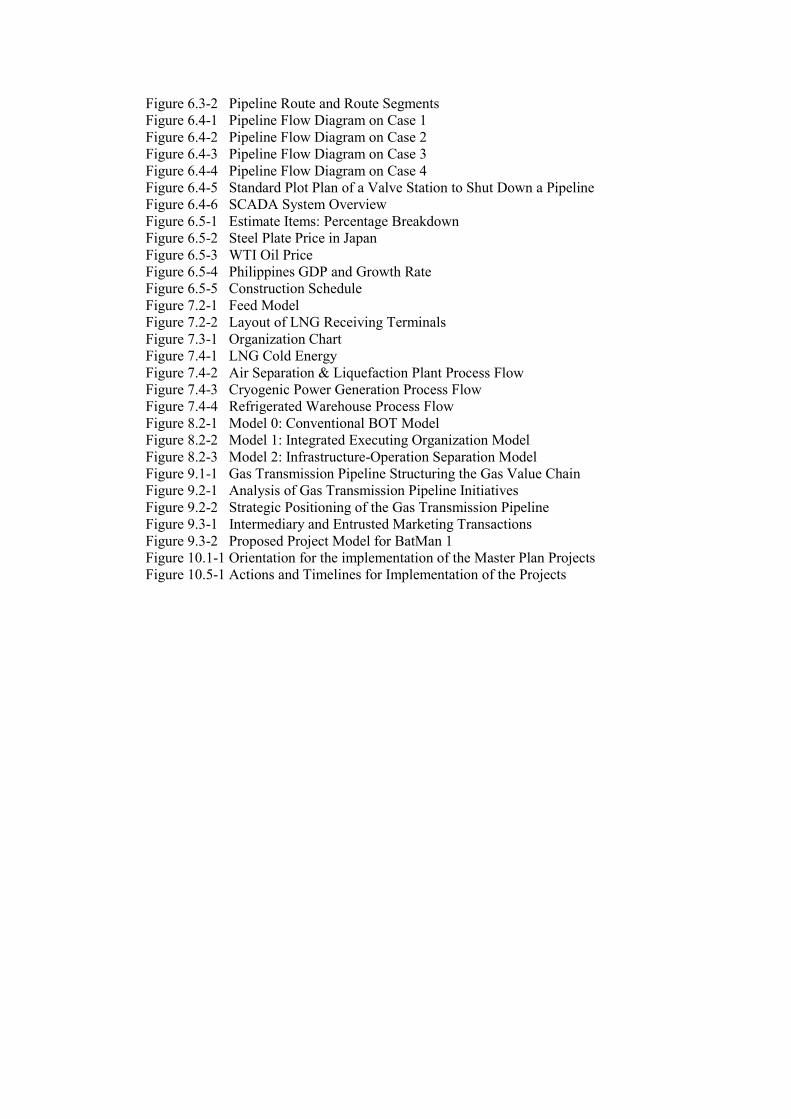
Figure 6.3-2 Pipeline Route and Route Segments Figure 6.4-1 Pipeline Flow Diagram on Case 1 Figure 6.4-2 Pipeline Flow Diagram on Case 2 Figure 6.4-3 Pipeline Flow Diagram on Case 3 Figure 6.4-4 Pipeline Flow Diagram on Case 4 Figure 6.4-5 Standard Plot Plan of a Valve Station to Shut Down a Pipeline Figure 6.4-6 SCADA System Overview Figure 6.5-1 Estimate Items: Percentage Breakdown Figure 6.5-2 Steel Plate Price in Japan Figure 6.5-3 WTI Oil Price Figure 6.5-4 Philippines GDP and Growth Rate Figure 6.5-5 Construction Schedule Figure 7.2-1 Feed Model Figure 7.2-2 Layout of LNG Receiving Terminals Figure 7.3-1 Organization Chart Figure 7.4-1 LNG Cold Energy Figure 7.4-2 Air Separation & Liquefaction Plant Process Flow Figure 7.4-3 Cryogenic Power Generation Process Flow Figure 7.4-4 Refrigerated Warehouse Process Flow Figure 8.2-1 Model 0: Conventional BOT Model Figure 8.2-2 Model 1: Integrated Executing Organization Model Figure 8.2-3 Model 2: Infrastructure-Operation Separation Model Figure 9.1-1 Gas Transmission Pipeline Structuring the Gas Value Chain Figure 9.2-1 Analysis of Gas Transmission Pipeline Initiatives Figure 9.2-2 Strategic Positioning of the Gas Transmission Pipeline Figure 9.3-1 Intermediary and Entrusted Marketing Transactions Figure 9.3-2 Proposed Project Model for BatMan 1 Figure 10.1-1 Orientation for the implementation of the Master Plan Projects Figure 10.5-1 Actions and Timelines for Implementation of the Projects
List of Tables (In order of appearance)
Table 2.1-1 Primary Energy Balance and the Position of Philippines(as of 2008) Table 2.1-2 Natural Gas Production and Consumption Table 2.1-3 Project Information of Gas Plants Table 2.2-1 NGVPPT Measurable Targets Table 2.2-2 Natural Gas Related Measures Table 2.2-3 Infrastructure Development Table 2.2-4 Capacity by Region Table 2.2-5 New Power Plants Projects Conducted by Private Companies in Luzon Table 2.2-6 Forecast for Power Supply and Demand in Luzon Table 2.3-1 Legislation and Existing Laws at the Same Level as Presidential Decrees Table 2.3-2 Natural Gas Related Regulations Table 2.3-3 Brief Description of DOE Circular No.2002-08-005 Table 2.3-4 Regulations and Laws Related to Natural Gas Pipeline Business in Japan Table 2.4-1 Study items of JICA M/P(2002) (Phase 1) Table 2.4-2 Study items of JICA M/P(2002) (Phase 2) Table 2.4-3 The Major Findings of JICA M/P(2002) Table 2.4-4 Effects of Natural Gas Pipeline Table 3.1-1 Category Classification by Philippines Environmental Impact Statement
System Table 3.1-2 Outline for EIS, IEER and IEEC Table 3.1-3 Comparison of JICA Guidelines for Environmental and Social
Considerations and EIA Related Laws of the Philippines Table 3.1-4 Population of Indigenous Peoples by Region(as of March 2011) Table 3.1-5 110 Tribes of Indigenous Peoples in the Philippines (as of March 2011) Table 3.2-1 Checklist in JICA Guidelines for Environmental and Social Considerations Table 3.2-2 Draft of Scoping Table 3.2-3 ROW, Land Acquisition, Involuntary Resettlement Table 3.2-4 The Number of Municipality and Barangay on the Pipeline Route Table 3.2-5 Required Land for Case 4 Table 3.2-6 The Number of Municipality and Barangay on the pipeline route Table 3.3-1 Overview of Candidate Sites Visited during the 1st Site Visit Table 3.3-2 Overview of Candidate Sites visited during the 2nd Site Visit Table 3.3-3 Overview of Candidate Sites visited during the 4th Site Visit Table 3.3-4 Comparison and Evaluation of the Candidate Sites for LNG Terminal Table 3.3-5 Results of Verification by JICA’s Environmental Checklist Table 3.4-1 CO2 Reduction Effect on the Electric Power Sector of Luzon Region with
the Implementation of This Project Table 3.4-2 CO2 Reduction Effect on the Industrial Sector of Luzon Region in 2030
with the Implementation of This Project Table 4.2-1 Gas Consumption from Camago-Malanpaya Gas Field Table 4.4-1 Power Supply and Demand Forecast in Luzon Table 4.4-2 Power Plant Projects by Private Company in Luzon Table 4.4-3 Precondition of Generation Cost Table 4.4-4 Break Down of Generation Cost Table 4.4-5 Generation Cost for Sucat Power Plant Table 4.4-6 Generation Cost of New Combined Cycle Power Plant Table 4.4-7 Gas Consumption for New Combined Cycle Power Plant Table 4.5-1 Fuel Prices Table 4.5-2 Lists of Industry Parks in Calabarzon Region Table 4.5-3 Number of Industry Parks in Philippines Table 4.5-4 Lists of Industry Park and Site Area Table 4.5-5 Number of Samples by Industry Class
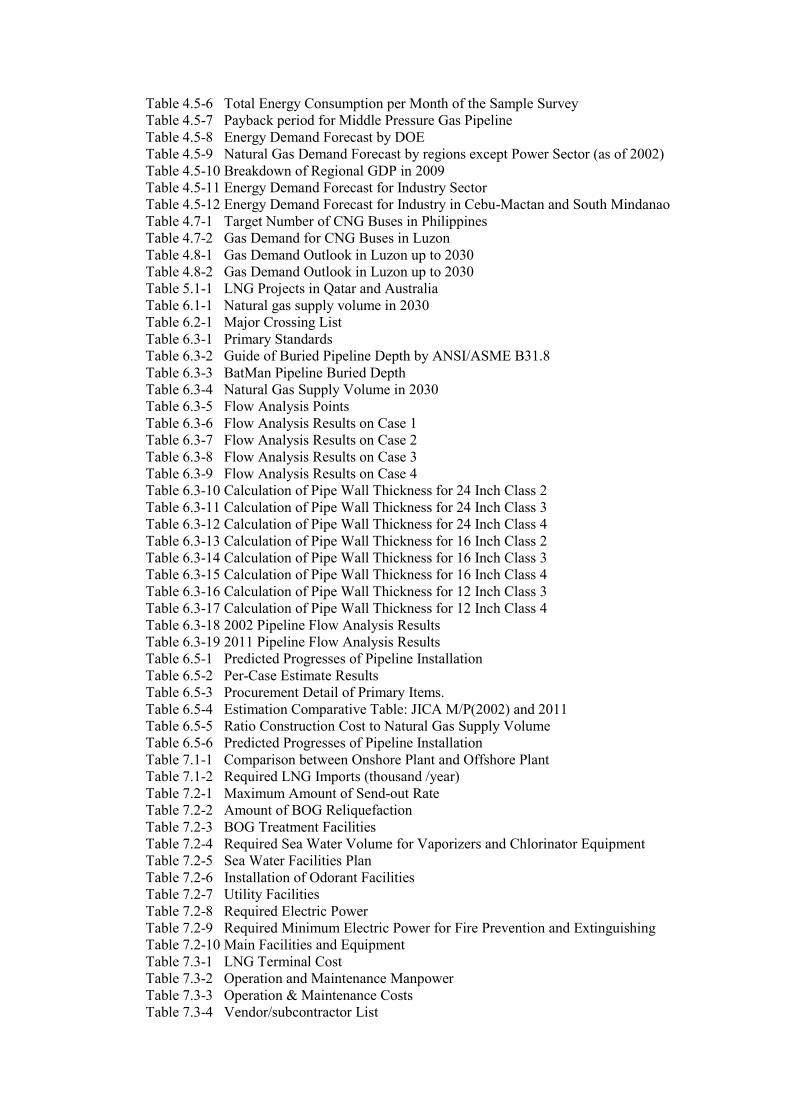
Table 4.5-6 Total Energy Consumption per Month of the Sample Survey Table 4.5-7 Payback period for Middle Pressure Gas Pipeline Table 4.5-8 Energy Demand Forecast by DOE Table 4.5-9 Natural Gas Demand Forecast by regions except Power Sector (as of 2002) Table 4.5-10 Breakdown of Regional GDP in 2009 Table 4.5-11 Energy Demand Forecast for Industry Sector Table 4.5-12 Energy Demand Forecast for Industry in Cebu-Mactan and South Mindanao Table 4.7-1 Target Number of CNG Buses in Philippines Table 4.7-2 Gas Demand for CNG Buses in Luzon Table 4.8-1 Gas Demand Outlook in Luzon up to 2030 Table 4.8-2 Gas Demand Outlook in Luzon up to 2030 Table 5.1-1 LNG Projects in Qatar and Australia Table 6.1-1 Natural gas supply volume in 2030 Table 6.2-1 Major Crossing List Table 6.3-1 Primary Standards Table 6.3-2 Guide of Buried Pipeline Depth by ANSI/ASME B31.8 Table 6.3-3 BatMan Pipeline Buried Depth Table 6.3-4 Natural Gas Supply Volume in 2030 Table 6.3-5 Flow Analysis Points Table 6.3-6 Flow Analysis Results on Case 1 Table 6.3-7 Flow Analysis Results on Case 2 Table 6.3-8 Flow Analysis Results on Case 3 Table 6.3-9 Flow Analysis Results on Case 4 Table 6.3-10 Calculation of Pipe Wall Thickness for 24 Inch Class 2 Table 6.3-11 Calculation of Pipe Wall Thickness for 24 Inch Class 3 Table 6.3-12 Calculation of Pipe Wall Thickness for 24 Inch Class 4 Table 6.3-13 Calculation of Pipe Wall Thickness for 16 Inch Class 2 Table 6.3-14 Calculation of Pipe Wall Thickness for 16 Inch Class 3 Table 6.3-15 Calculation of Pipe Wall Thickness for 16 Inch Class 4 Table 6.3-16 Calculation of Pipe Wall Thickness for 12 Inch Class 3 Table 6.3-17 Calculation of Pipe Wall Thickness for 12 Inch Class 4 Table 6.3-18 2002 Pipeline Flow Analysis Results Table 6.3-19 2011 Pipeline Flow Analysis Results Table 6.5-1 Predicted Progresses of Pipeline Installation Table 6.5-2 Per-Case Estimate Results Table 6.5-3 Procurement Detail of Primary Items. Table 6.5-4 Estimation Comparative Table: JICA M/P(2002) and 2011 Table 6.5-5 Ratio Construction Cost to Natural Gas Supply Volume Table 6.5-6 Predicted Progresses of Pipeline Installation Table 7.1-1 Comparison between Onshore Plant and Offshore Plant Table 7.1-2 Required LNG Imports (thousand /year) Table 7.2-1 Maximum Amount of Send-out Rate Table 7.2-2 Amount of BOG Reliquefaction Table 7.2-3 BOG Treatment Facilities Table 7.2-4 Required Sea Water Volume for Vaporizers and Chlorinator Equipment Table 7.2-5 Sea Water Facilities Plan Table 7.2-6 Installation of Odorant Facilities Table 7.2-7 Utility Facilities Table 7.2-8 Required Electric Power Table 7.2-9 Required Minimum Electric Power for Fire Prevention and Extinguishing Table 7.2-10 Main Facilities and Equipment Table 7.3-1 LNG Terminal Cost Table 7.3-2 Operation and Maintenance Manpower Table 7.3-3 Operation & Maintenance Costs Table 7.3-4 Vendor/subcontractor List

Table 7.3-5 Overall Project Schedule Table 7.4-1 Track Records in Japan Table 8.2-1 Proposed Project Model Patterns and Their Cost of Capital Table 8.2-2 Wheeling Charge to Meet the Equity Return Requirement Table 8.2-3 FIRR Comparison under Referential Wheeling Charges Table 8.3-1 Proposed Financing Arrangements for the LNG Regasification Terminal Table 8.3-2 Financial Analysis Results for LNG Regasification Terminal Table 8.3-3 Financial Analysis Results for Other Financial Arrangement Cases Table 8.4-1 Economic Analysis and Sensitivity Analysis Results Table 8.4-2 Economic Analysis and Sensitivity Analysis Results Table 9.2-1 Examples of Transmission Pipeline Development Initiatives Table 9.2-2 Comparison of Representative Financing Options Table 9.2-3 Comparison of Wheeling Charges under Various Financing Options Table 9.2-3 Task Allocation for Proposed Separation Project Model
1-1
Chapter 1 Introduction 1.1 Background According to the Medium-Term Philippine Development Plan (2011-2016) of the Philippine government, for the purpose of reducing the traditional dependency on oil, increase of utilization of alternative energy is set out as one of the key policies in the energy field. Because natural gas is considered as environmentally friendly among alternative energy source, increase of utilization of natural gas in the industrial and commercial sectors is positioned as a priority issue. Specifically, for both domestic natural gas development and increase of utilization and import of LNG, the government demonstrated policies to promote development of gas pipeline network, gas conversion of the existing thermal plants and increase of utilization of natural gas in transport sector (e.g., introduction of CNG vehicles). Natural gas utilization in the Philippines has been widespread since the start of commercial operation of Camago-Malampaya gas field in 2002. The gas is transported by offshore pipelines (maximum capacity: 650MMcf/d) and supplied to three power plants (Ilijan, Santa Rita and San Lorenzo. Total: 2,700 MW). The master plan including a construction project of natural gas pipeline network-related facilities was developed based on the master plan study on the development of the natural gas industry in the Republic of the Philippines by JICA (2002 : hereinafter called JICA M/P (2002)). Although the Philippines government has promoted policies including the increase of utilization of domestic natural gas based on the JICA M/P (2002), encouraging entry of private sector, some projects including construction of related facilities were not materialized for such reasons as undeveloped investment environment. However, under the Aquino administration established in June 2010, infrastructure development by public-private partnership (PPP) have been put up as a top priority issue and improvement of PPP promotion- related systems and policies and specific project formation have been promoted. 1.2 Objective Following the previously-conducted study, Department of Energy (DOE), with utilization of PPP in mind, is now engaged in the development of natural gas-related infrastructure facilities. They are planning a Batangas-Manila pipeline project as a top-priority project. In the project, to construct about 100km pipeline from Batangas to Sucat, Metro Manila and to supply gas to the power plant in Sucat in which conversion to gas-fired power generation is planned and the surrounding area. In addition, the possibility of its extension to Quirino Highway has also been considered in view of demand in the transportation sector. The project is positioned as one of high-priority projects of natural gas-related facilities in the future. In prospect of gas depletion in Camago-Malampaya gas field and the possibility of import LNG supply to three power plants in Batangas, the necessity of LNG plants in Batangas has also been put under review. Based on the above-mentioned projects since the conduct of JICA M/P (2002) and in view of the current status, the Study will be conducted for the purposes of collecting information required for the realization of future natural gas projects in a manner that would contribute policy promotion of the Philippine government.
1.3 Study Area The study covers all the areas of the Philippines. (The BatMan 1 and LNG terminal projects are located at the Luzon island.)
1-2
1.4 Scope of the Study (1) To review the precondition at the time of conducting JICA M/P(2002)
(a)To compare the energy policy at the time of conducting JICA M/P(2002) and the current energy policy
(b)To position increase of utilization of natural gas (c)To identify focused investigation items
(2) To verify the current status of potential natural gas demand (a)To investigate natural gas demand in Luzon (b)To investigate natural gas demand in Visayas and Mindanao
(3) To review the validity of natural gas-related facilities projects proposed in JICA M/P (2002) (a)To review the validity of pipeline planning (b)To verify the current status of other projects
(4) To collect information on natural gas-related facilities projects since the conduct of JICA M/P(2002)
(5) To evaluate priorities of natural gas-related facilities projects (6) To collect information on regulations and systems regarding environmental and
social considerations associated with construction of natural gas-related facilities (a)To verify the status of environmental permit approval for pipeline planning (b)To collect information on environmental permit required for construction of LNG plant.
(7) To consider construction and business schemes for promotion of natural gas-related facilities projects (a)To consider business schemes regarding pipeline projects (b)To consider business schemes regarding LNG plant
(8)To verify the current status of bidding system of natural gas-related projects (a)To verify the current status of bidding system for private enterprises and assignment of
roles between the private and public sectors (b)To verify items such as TOR of expected consultants
(9)To prepare a draft of proposal on improvement of policies and systems in natural gas sector (a)To prepare a draft of proposal on pipeline projects (b)To prepare a draft of proposal on LNG plant projects (c)To prepare a draft of proposal on other natural gas-related projects
(10)To report to the Philippines government on contents of the study 1.5 Main Findings 1.5.1 BatMan 1 The Study confirmed that the BatMan 1 project would be feasible from the viewpoints of land acquisition, technical and environmental aspects for the segment from Batangas to Sucat.
1-3
The financial analysis showed that the private sector development would have a financial challenge compared with the development by public sector due to the gas supply shortage during the first few years after the commissioning. The analysis also confirmed that so-called ownership-operation separation model, where the asset-holding and asset-operation are managed by two separate entities, could be effectively applicable for the project. The Study therefore proposed the PPP development, in which the infrastructure development and the facility operation would be conducted by the public sector and the private sector, respectively.
1.5.2 LNG Terminal The Study found the possibilities of the LNG terminal development in several potential sites around the Batangas area while the additional examinations would be required for the environmental and social considerations as well as the land acquisition. Since the LNG terminal would expect the solid revenue basis from the beginning of the operation, the facility could be developed and operated by the private sector with the appropriate tariff setting of the gas wheeling charge. Thus the Study proposed to conduct the feasibility study with the idea of the development by the private sector. In addition, the task and schedule for the action plans were suggested to the Department of Energy in order to expedite the project development.

1-4
2-1
Chapter 2 Natural Gas Utilization Policy and Regulatory Framework
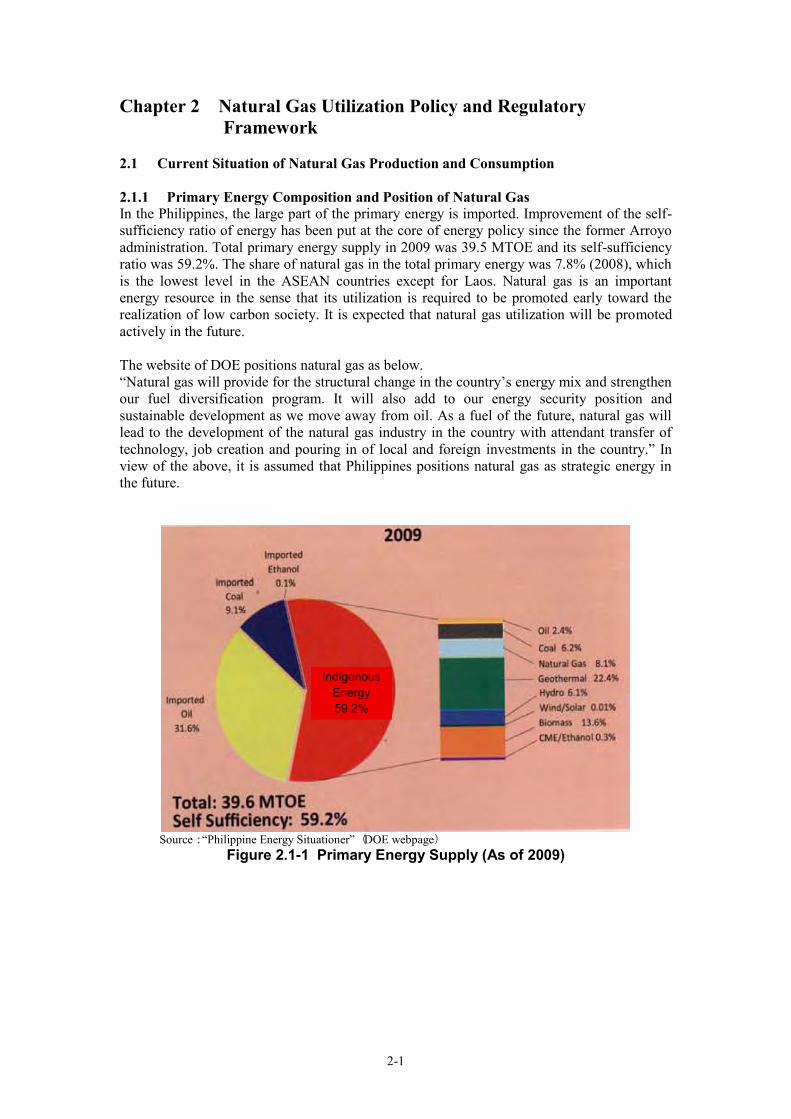
2.1 Current Situation of Natural Gas Production and Consumption 2.1.1 Primary Energy Composition and Position of Natural Gas In the Philippines, the large part of the primary energy is imported. Improvement of the self- sufficiency ratio of energy has been put at the core of energy policy since the former Arroyo administration. Total primary energy supply in 2009 was 39.5 MTOE and its self-sufficiency ratio was 59.2%. The share of natural gas in the total primary energy was 7.8% (2008), which is the lowest level in the ASEAN countries except for Laos. Natural gas is an important energy resource in the sense that its utilization is required to be promoted early toward the realization of low carbon society. It is expected that natural gas utilization will be promoted actively in the future. The website of DOE positions natural gas as below. “Natural gas will provide for the structural change in the country’s energy mix and strengthen our fuel diversification program. It will also add to our energy security position and sustainable development as we move away from oil. As a fuel of the future, natural gas will lead to the development of the natural gas industry in the country with attendant transfer of technology, job creation and pouring in of local and foreign investments in the country.” In view of the above, it is assumed that Philippines positions natural gas as strategic energy in the future.
Source:“Philippine Energy Situationer”(DOE webpage)
Figure 2.1-1 Primary Energy Supply (As of 2009)
Indigenous Energy 59.2%
2-2
Table 2.1-1 Primary Energy Balance and the Position of Philippines(as of 2008)
ASEAN Brunei Cambodia Indonesia Malaysia Myanmar Philippines Singapore Thailand VietNam
Coal and Peat 15.5% 0.0% 9.2% 18.7% 13.1% 0.9% 16.4% 0.0% 14.4% 19.8%
Crude 37.7% 22.9% 55.7% 24.4% 40.9% 5.9% 22.7% 276.7% 51.9% 1.2%
Oil -5.0% -1.0% -13.2% 6.5% -5.7% 3.5% 10.0% -214.5% -13.6% 22.5%
Gas 22.7% 78.2% 21.1% 16.1% 46.8% 20.7% 7.8% 37.7% 27.9% 10.5%
Nuclear 0.0% 0.0% 0.0% 0.0% 0.0% 0.0% 0.0% 0.0% 0.0% 0.0%
Hydro 1.1% 0.0% 13.0% 0.5% 0.9% 2.2% 2.1% 0.0% 0.6% 3.8%
Geothermal 4.5% 0.0% 0.0% 7.2% 0.0% 0.0% 22.5% 0.0% 0.0% 0.0%
Combustible 23.5% 0.0% 14.7% 26.7% 4.1% 66.8% 18.6% 0.0% 18.7% 41.8%
Electricity 0.1% 0.0% -0.4% 0.0% -0.1% 0.0% 0.0% 0.0% 0.1% 0.5%
TOTAL 100.0% 100.0% 100.0% 100.0% 100.0% 100.0% 100.0% 100.0% 100.0% 100.0%
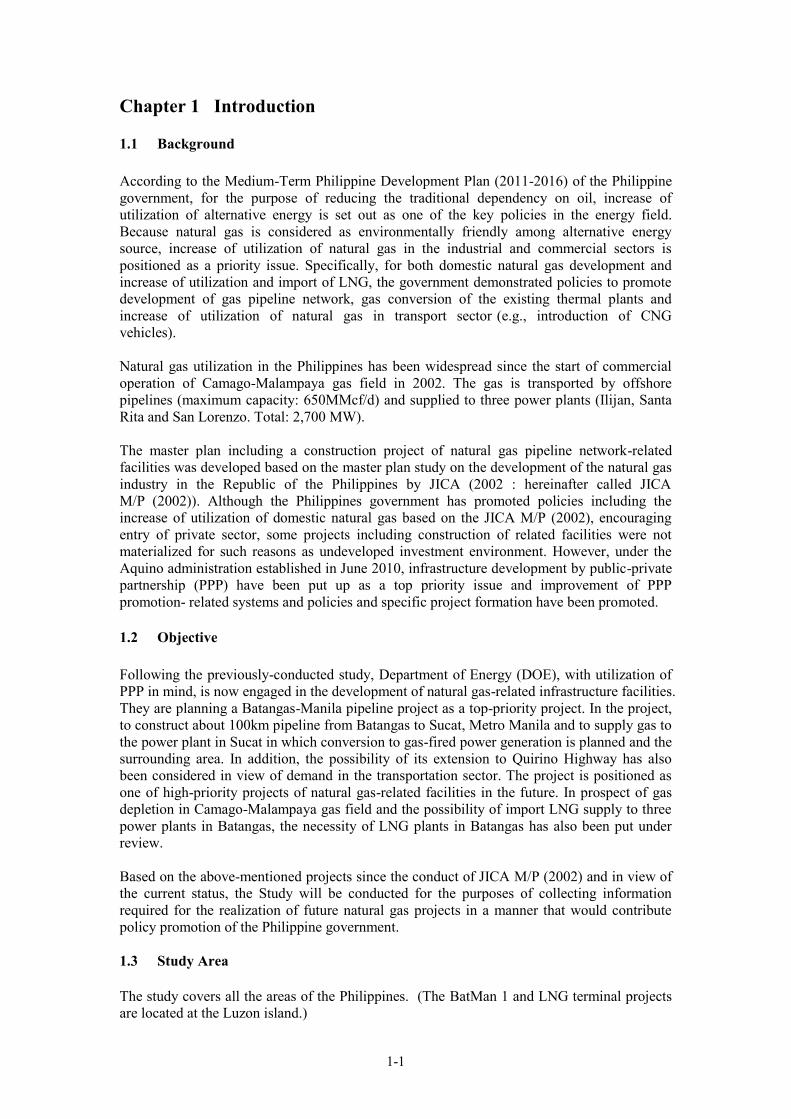
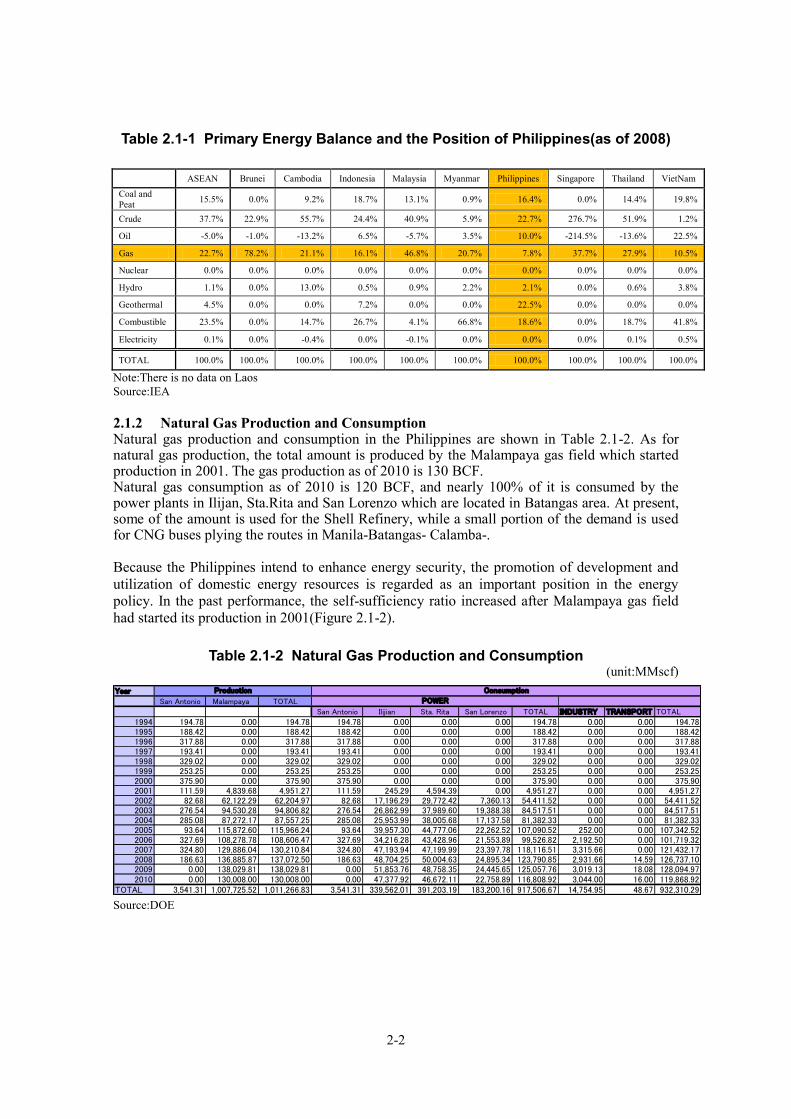
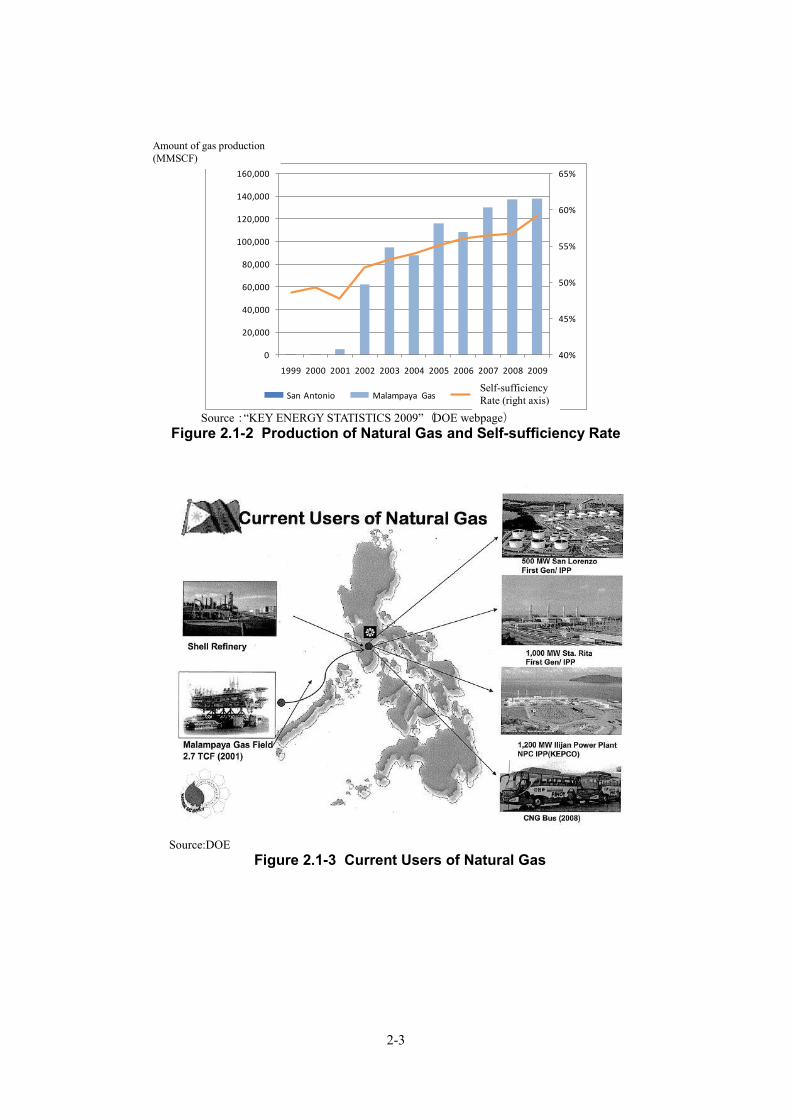
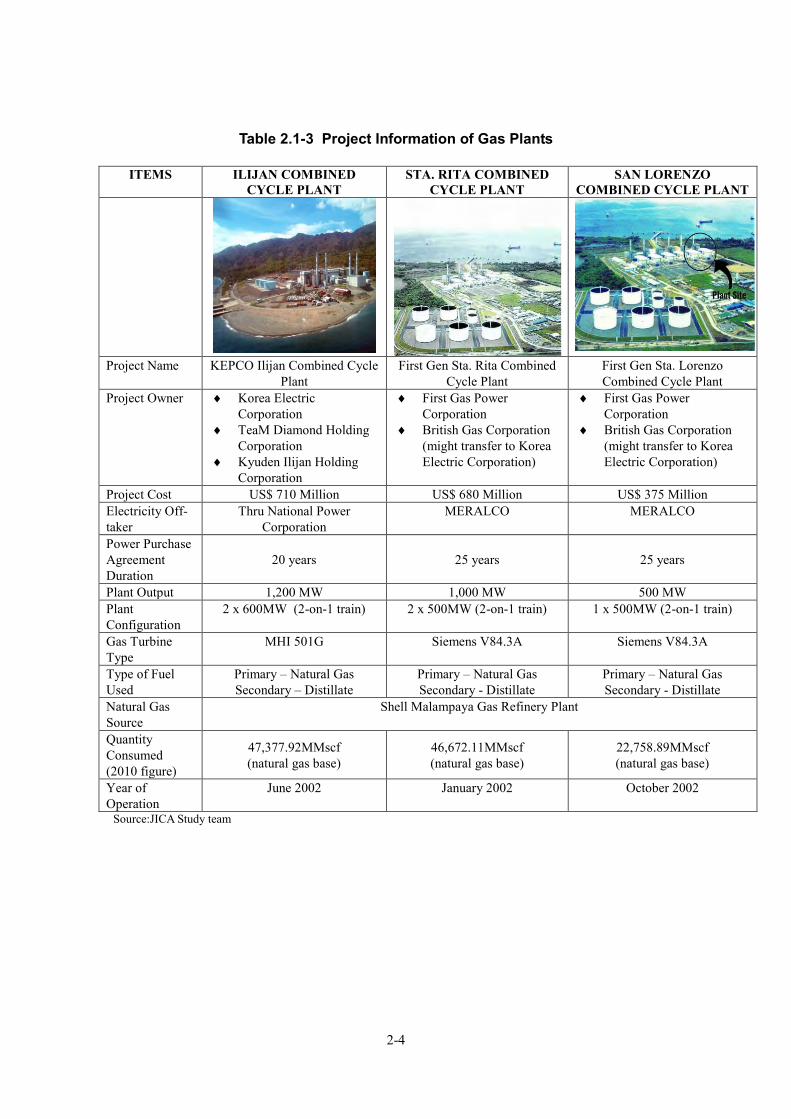
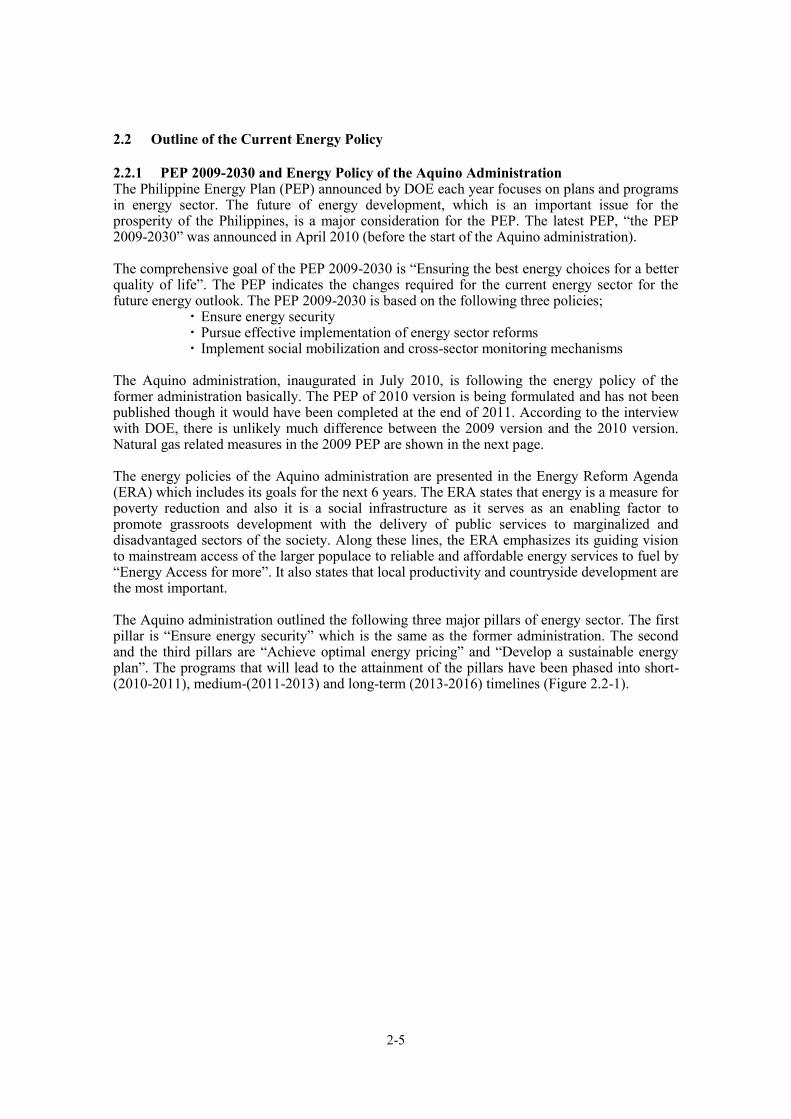
Note:There is no data on Laos Source:IEA 2.1.2 Natural Gas Production and Consumption Natural gas production and consumption in the Philippines are shown in Table 2.1-2. As for natural gas production, the total amount is produced by the Malampaya gas field which started production in 2001. The gas production as of 2010 is 130 BCF. Natural gas consumption as of 2010 is 120 BCF, and nearly 100% of it is consumed by the power plants in Ilijan, Sta.Rita and San Lorenzo which are located in Batangas area. At present, some of the amount is used for the Shell Refinery, while a small portion of the demand is used for CNG buses plying the routes in Manila-Batangas- Calamba-. Because the Philippines intend to enhance energy security, the promotion of development and utilization of domestic energy resources is regarded as an important position in the energy policy. In the past performance, the self-sufficiency ratio increased after Malampaya gas field had started its production in 2001(Figure 2.1-2).
Table 2.1-2 Natural Gas Production and Consumption (unit:MMscf)
Source:DOE
Year
San Antonio Malampaya TOTAL
San Antonio Ilijian Sta. Rita San Lorenzo TOTAL INDUSTRY TRANSPORT TOTAL
1994 194.78 0.00 194.78 194.78 0.00 0.00 0.00 194.78 0.00 0.00 194.781995 188.42 0.00 188.42 188.42 0.00 0.00 0.00 188.42 0.00 0.00 188.421996 317.88 0.00 317.88 317.88 0.00 0.00 0.00 317.88 0.00 0.00 317.881997 193.41 0.00 193.41 193.41 0.00 0.00 0.00 193.41 0.00 0.00 193.411998 329.02 0.00 329.02 329.02 0.00 0.00 0.00 329.02 0.00 0.00 329.021999 253.25 0.00 253.25 253.25 0.00 0.00 0.00 253.25 0.00 0.00 253.252000 375.90 0.00 375.90 375.90 0.00 0.00 0.00 375.90 0.00 0.00 375.902001 111.59 4,839.68 4,951.27 111.59 245.29 4,594.39 0.00 4,951.27 0.00 0.00 4,951.272002 82.68 62,122.29 62,204.97 82.68 17,196.29 29,772.42 7,360.13 54,411.52 0.00 0.00 54,411.522003 276.54 94,530.28 94,806.82 276.54 26,862.99 37,989.60 19,388.38 84,517.51 0.00 0.00 84,517.512004 285.08 87,272.17 87,557.25 285.08 25,953.99 38,005.68 17,137.58 81,382.33 0.00 0.00 81,382.332005 93.64 115,872.60 115,966.24 93.64 39,957.30 44,777.06 22,262.52 107,090.52 252.00 0.00 107,342.522006 327.69 108,278.78 108,606.47 327.69 34,216.28 43,428.96 21,553.89 99,526.82 2,192.50 0.00 101,719.322007 324.80 129,886.04 130,210.84 324.80 47,193.94 47,199.99 23,397.78 118,116.51 3,315.66 0.00 121,432.172008 186.63 136,885.87 137,072.50 186.63 48,704.25 50,004.63 24,895.34 123,790.85 2,931.66 14.59 126,737.102009 0.00 138,029.81 138,029.81 0.00 51,853.76 48,758.35 24,445.65 125,057.76 3,019.13 18.08 128,094.972010 0.00 130,008.00 130,008.00 0.00 47,377.92 46,672.11 22,758.89 116,808.92 3,044.00 16.00 119,868.92
TOTAL 3,541.31 1,007,725.52 1,011,266.83 3,541.31 339,562.01 391,203.19 183,200.16 917,506.67 14,754.95 48.67 932,310.29
Production Consumption
POWER
2-3
40%
45%
50%
55%
60%
65%
0
20,000
40,000
60,000
80,000
100,000
120,000
140,000
160,000
1999 2000 2001 2002 2003 2004 2005 2006 2007 2008 2009
ガス
生産
量(M
MSC
F)
San Antonio Malampaya Gas 自給率(右軸)
Source:“KEY ENERGY STATISTICS 2009”(DOE webpage)
Figure 2.1-2 Production of Natural Gas and Self-sufficiency Rate
Source:DOE Figure 2.1-3 Current Users of Natural Gas
Amount of gas production (MMSCF)
Self-sufficiency Rate (right axis)
2-4
Table 2.1-3 Project Information of Gas Plants
ITEMS ILIJAN COMBINED CYCLE PLANT
STA. RITA COMBINED CYCLE PLANT
SAN LORENZO COMBINED CYCLE PLANT
Project Name KEPCO Ilijan Combined Cycle
Plant First Gen Sta. Rita Combined
Cycle Plant First Gen Sta. Lorenzo Combined Cycle Plant
Project Owner Korea Electric Corporation
TeaM Diamond Holding Corporation
Kyuden Ilijan Holding Corporation
First Gas Power Corporation
British Gas Corporation (might transfer to Korea Electric Corporation)
First Gas Power Corporation
British Gas Corporation (might transfer to Korea Electric Corporation)
Project Cost US$ 710 Million US$ 680 Million US$ 375 Million Electricity Off-taker
Thru National Power Corporation
MERALCO MERALCO
Power Purchase Agreement Duration
20 years 25 years 25 years
Plant Output 1,200 MW 1,000 MW 500 MW Plant Configuration
2 x 600MW (2-on-1 train) 2 x 500MW (2-on-1 train) 1 x 500MW (2-on-1 train)
Gas Turbine Type
MHI 501G Siemens V84.3A Siemens V84.3A
Type of Fuel Used
Primary – Natural Gas Secondary – Distillate
Primary – Natural Gas Secondary - Distillate
Primary – Natural Gas Secondary - Distillate
Natural Gas Source
Shell Malampaya Gas Refinery Plant
Quantity Consumed (2010 figure)
47,377.92MMscf (natural gas base)
46,672.11MMscf (natural gas base)
22,758.89MMscf (natural gas base)
Year of Operation
June 2002 January 2002 October 2002
Source:JICA Study team
2-5
2.2 Outline of the Current Energy Policy 2.2.1 PEP 2009-2030 and Energy Policy of the Aquino Administration The Philippine Energy Plan (PEP) announced by DOE each year focuses on plans and programs in energy sector. The future of energy development, which is an important issue for the prosperity of the Philippines, is a major consideration for the PEP. The latest PEP, “the PEP 2009-2030” was announced in April 2010 (before the start of the Aquino administration). The comprehensive goal of the PEP 2009-2030 is “Ensuring the best energy choices for a better quality of life”. The PEP indicates the changes required for the current energy sector for the future energy outlook. The PEP 2009-2030 is based on the following three policies;
・ Ensure energy security ・ Pursue effective implementation of energy sector reforms ・ Implement social mobilization and cross-sector monitoring mechanisms
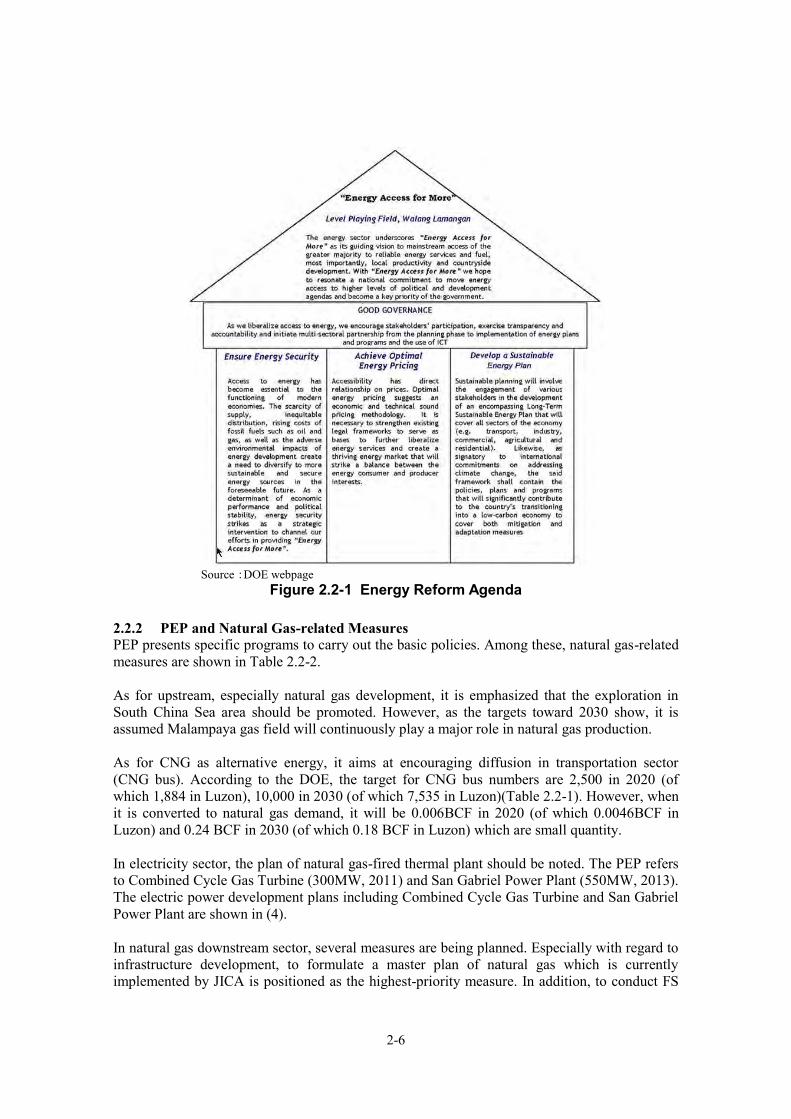
The Aquino administration, inaugurated in July 2010, is following the energy policy of the former administration basically. The PEP of 2010 version is being formulated and has not been published though it would have been completed at the end of 2011. According to the interview with DOE, there is unlikely much difference between the 2009 version and the 2010 version. Natural gas related measures in the 2009 PEP are shown in the next page. The energy policies of the Aquino administration are presented in the Energy Reform Agenda (ERA) which includes its goals for the next 6 years. The ERA states that energy is a measure for poverty reduction and also it is a social infrastructure as it serves as an enabling factor to promote grassroots development with the delivery of public services to marginalized and disadvantaged sectors of the society. Along these lines, the ERA emphasizes its guiding vision to mainstream access of the larger populace to reliable and affordable energy services to fuel by “Energy Access for more”. It also states that local productivity and countryside development are the most important. The Aquino administration outlined the following three major pillars of energy sector. The first pillar is “Ensure energy security” which is the same as the former administration. The second and the third pillars are “Achieve optimal energy pricing” and “Develop a sustainable energy plan”. The programs that will lead to the attainment of the pillars have been phased into short-(2010-2011), medium-(2011-2013) and long-term (2013-2016) timelines (Figure 2.2-1).
2-6
Source:DOE webpage
Figure 2.2-1 Energy Reform Agenda
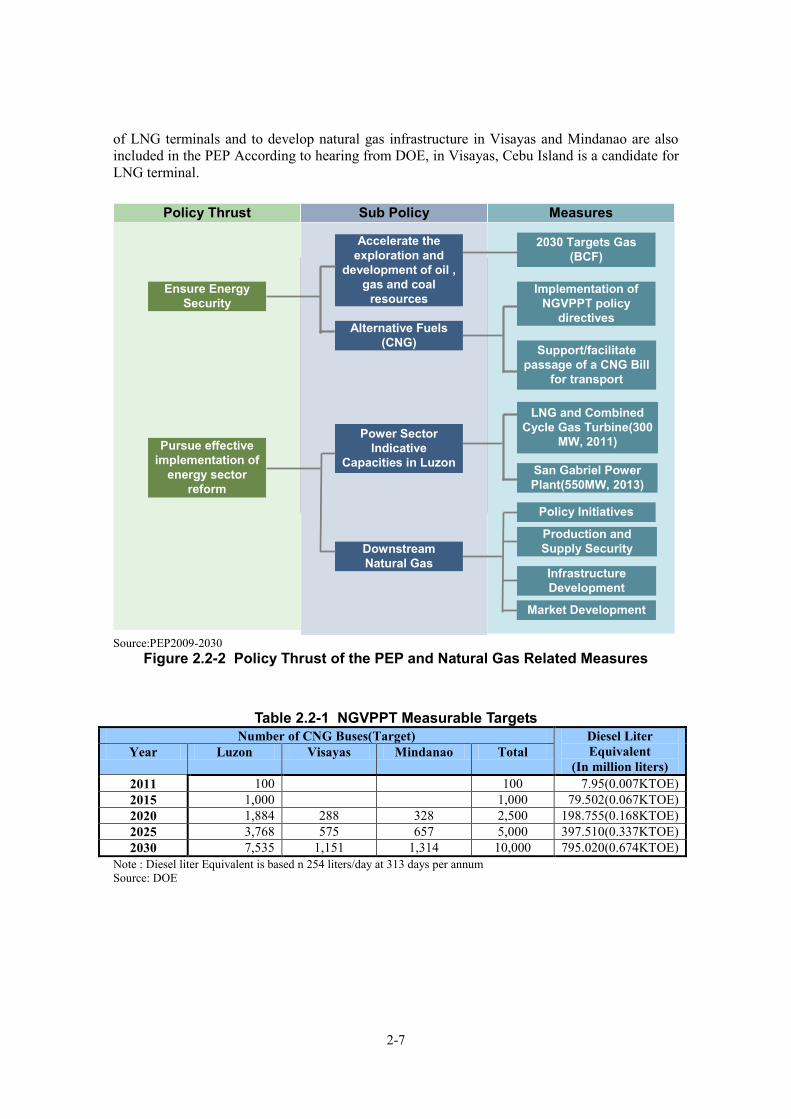
2.2.2 PEP and Natural Gas-related Measures PEP presents specific programs to carry out the basic policies. Among these, natural gas-related measures are shown in Table 2.2-2. As for upstream, especially natural gas development, it is emphasized that the exploration in South China Sea area should be promoted. However, as the targets toward 2030 show, it is assumed Malampaya gas field will continuously play a major role in natural gas production. As for CNG as alternative energy, it aims at encouraging diffusion in transportation sector (CNG bus). According to the DOE, the target for CNG bus numbers are 2,500 in 2020 (of which 1,884 in Luzon), 10,000 in 2030 (of which 7,535 in Luzon)(Table 2.2-1). However, when it is converted to natural gas demand, it will be 0.006BCF in 2020 (of which 0.0046BCF in Luzon) and 0.24 BCF in 2030 (of which 0.18 BCF in Luzon) which are small quantity. In electricity sector, the plan of natural gas-fired thermal plant should be noted. The PEP refers to Combined Cycle Gas Turbine (300MW, 2011) and San Gabriel Power Plant (550MW, 2013). The electric power development plans including Combined Cycle Gas Turbine and San Gabriel Power Plant are shown in (4). In natural gas downstream sector, several measures are being planned. Especially with regard to infrastructure development, to formulate a master plan of natural gas which is currently implemented by JICA is positioned as the highest-priority measure. In addition, to conduct FS
2-7
of LNG terminals and to develop natural gas infrastructure in Visayas and Mindanao are also included in the PEP According to hearing from DOE, in Visayas, Cebu Island is a candidate for LNG terminal.
Source:PEP2009-2030
Figure 2.2-2 Policy Thrust of the PEP and Natural Gas Related Measures
Table 2.2-1 NGVPPT Measurable Targets Number of CNG Buses(Target) Diesel Liter
Equivalent (In million liters)
Year Luzon Visayas Mindanao Total
2011 100 100 7.95(0.007KTOE) 2015 1,000 1,000 79.502(0.067KTOE) 2020 1,884 288 328 2,500 198.755(0.168KTOE) 2025 3,768 575 657 5,000 397.510(0.337KTOE) 2030 7,535 1,151 1,314 10,000 795.020(0.674KTOE)
Note : Diesel liter Equivalent is based n 254 liters/day at 313 days per annum Source: DOE
Ensure Energy Security
Sub Policy MeasuresPolicy Thrust
Pursue effective implementation of
energy sector reform
Alternative Fuels (CNG)
Accelerate the exploration and
development of oil , gas and coal
resources
2030 Targets Gas (BCF)
Power Sector Indicative
Capacities in Luzon
Downstream Natural Gas
Support/facilitate passage of a CNG Bill
for transport
LNG and Combined Cycle Gas Turbine(300
MW, 2011)
Policy Initiatives
San Gabriel Power Plant(550MW, 2013)
Production and Supply Security
Implementation of NGVPPT policy
directives
Infrastructure Development
Market Development
2-8
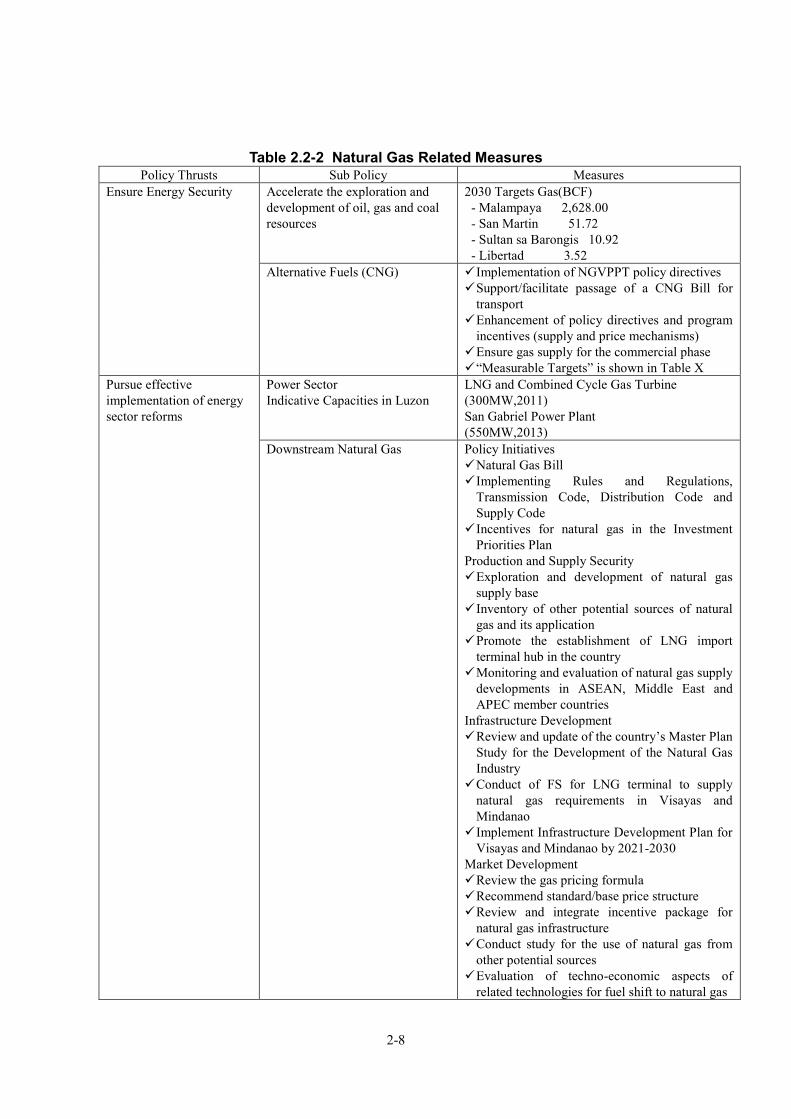
Table 2.2-2 Natural Gas Related Measures
Policy Thrusts Sub Policy Measures Ensure Energy Security
Accelerate the exploration and development of oil, gas and coal resources
2030 Targets Gas(BCF) - Malampaya 2,628.00 - San Martin 51.72 - Sultan sa Barongis 10.92 - Libertad 3.52
Alternative Fuels (CNG) Implementation of NGVPPT policy directives Support/facilitate passage of a CNG Bill for
transport Enhancement of policy directives and program
incentives (supply and price mechanisms) Ensure gas supply for the commercial phase “Measurable Targets” is shown in Table X
Pursue effective implementation of energy sector reforms
Power Sector Indicative Capacities in Luzon
LNG and Combined Cycle Gas Turbine (300MW,2011) San Gabriel Power Plant (550MW,2013)
Downstream Natural Gas Policy Initiatives Natural Gas Bill Implementing Rules and Regulations,
Transmission Code, Distribution Code and Supply Code
Incentives for natural gas in the Investment Priorities Plan
Production and Supply Security Exploration and development of natural gas
supply base Inventory of other potential sources of natural
gas and its application Promote the establishment of LNG import
terminal hub in the country Monitoring and evaluation of natural gas supply
developments in ASEAN, Middle East and APEC member countries
Infrastructure Development Review and update of the country’s Master Plan
Study for the Development of the Natural Gas Industry
Conduct of FS for LNG terminal to supply natural gas requirements in Visayas and Mindanao
Implement Infrastructure Development Plan for Visayas and Mindanao by 2021-2030
Market Development Review the gas pricing formula Recommend standard/base price structure Review and integrate incentive package for
natural gas infrastructure Conduct study for the use of natural gas from
other potential sources Evaluation of techno-economic aspects of
related technologies for fuel shift to natural gas
2-9
Promotion of on-site or small-scale power generation using marginal gas fields
Conduct profiling of potential gas markets “Infrastructure development” is shown in Table
2.2-3 Source: Philippine Energy Plan 2009-2030
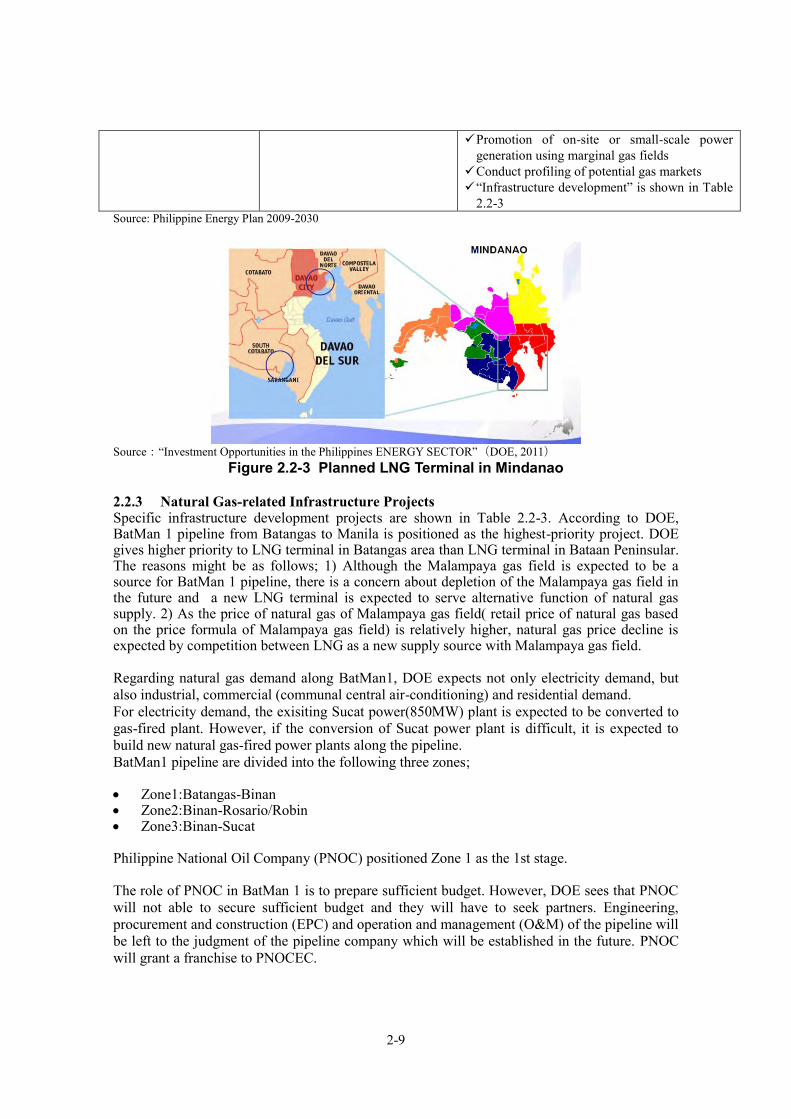
Source:“Investment Opportunities in the Philippines ENERGY SECTOR”(DOE, 2011)
Figure 2.2-3 Planned LNG Terminal in Mindanao 2.2.3 Natural Gas-related Infrastructure Projects Specific infrastructure development projects are shown in Table 2.2-3. According to DOE, BatMan 1 pipeline from Batangas to Manila is positioned as the highest-priority project. DOE gives higher priority to LNG terminal in Batangas area than LNG terminal in Bataan Peninsular. The reasons might be as follows; 1) Although the Malampaya gas field is expected to be a source for BatMan 1 pipeline, there is a concern about depletion of the Malampaya gas field in the future and a new LNG terminal is expected to serve alternative function of natural gas supply. 2) As the price of natural gas of Malampaya gas field( retail price of natural gas based on the price formula of Malampaya gas field) is relatively higher, natural gas price decline is expected by competition between LNG as a new supply source with Malampaya gas field. Regarding natural gas demand along BatMan1, DOE expects not only electricity demand, but also industrial, commercial (communal central air-conditioning) and residential demand. For electricity demand, the exisiting Sucat power(850MW) plant is expected to be converted to gas-fired plant. However, if the conversion of Sucat power plant is difficult, it is expected to build new natural gas-fired power plants along the pipeline. BatMan1 pipeline are divided into the following three zones; Zone1:Batangas-Binan Zone2:Binan-Rosario/Robin Zone3:Binan-Sucat Philippine National Oil Company (PNOC) positioned Zone 1 as the 1st stage. The role of PNOC in BatMan 1 is to prepare sufficient budget. However, DOE sees that PNOC will not able to secure sufficient budget and they will have to seek partners. Engineering, procurement and construction (EPC) and operation and management (O&M) of the pipeline will be left to the judgment of the pipeline company which will be established in the future. PNOC will grant a franchise to PNOCEC.
2-10
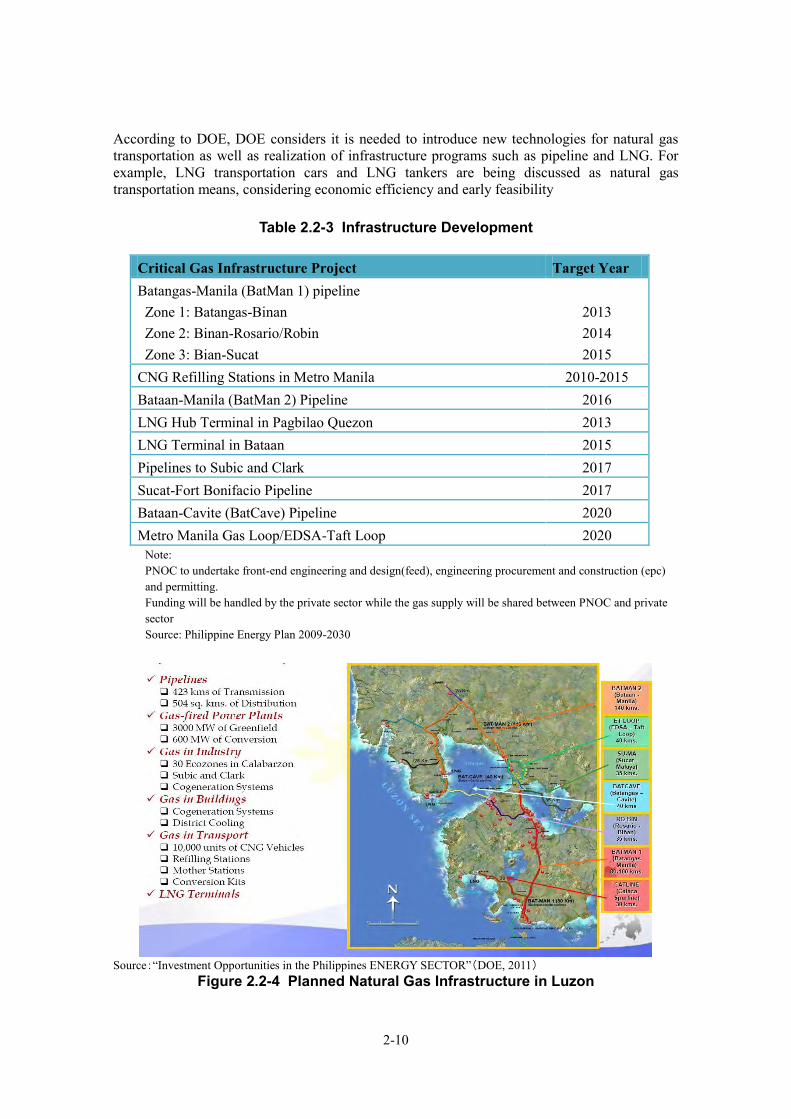
According to DOE, DOE considers it is needed to introduce new technologies for natural gas transportation as well as realization of infrastructure programs such as pipeline and LNG. For example, LNG transportation cars and LNG tankers are being discussed as natural gas transportation means, considering economic efficiency and early feasibility
Table 2.2-3 Infrastructure Development
Critical Gas Infrastructure Project Target Year Batangas-Manila (BatMan 1) pipeline Zone 1: Batangas-Binan Zone 2: Binan-Rosario/Robin Zone 3: Bian-Sucat
2013 2014 2015
CNG Refilling Stations in Metro Manila 2010-2015 Bataan-Manila (BatMan 2) Pipeline 2016 LNG Hub Terminal in Pagbilao Quezon 2013 LNG Terminal in Bataan 2015 Pipelines to Subic and Clark 2017 Sucat-Fort Bonifacio Pipeline 2017 Bataan-Cavite (BatCave) Pipeline 2020 Metro Manila Gas Loop/EDSA-Taft Loop 2020
Note: PNOC to undertake front-end engineering and design(feed), engineering procurement and construction (epc) and permitting. Funding will be handled by the private sector while the gas supply will be shared between PNOC and private sector Source: Philippine Energy Plan 2009-2030
Source:“Investment Opportunities in the Philippines ENERGY SECTOR”(DOE, 2011)
Figure 2.2-4 Planned Natural Gas Infrastructure in Luzon
2-11
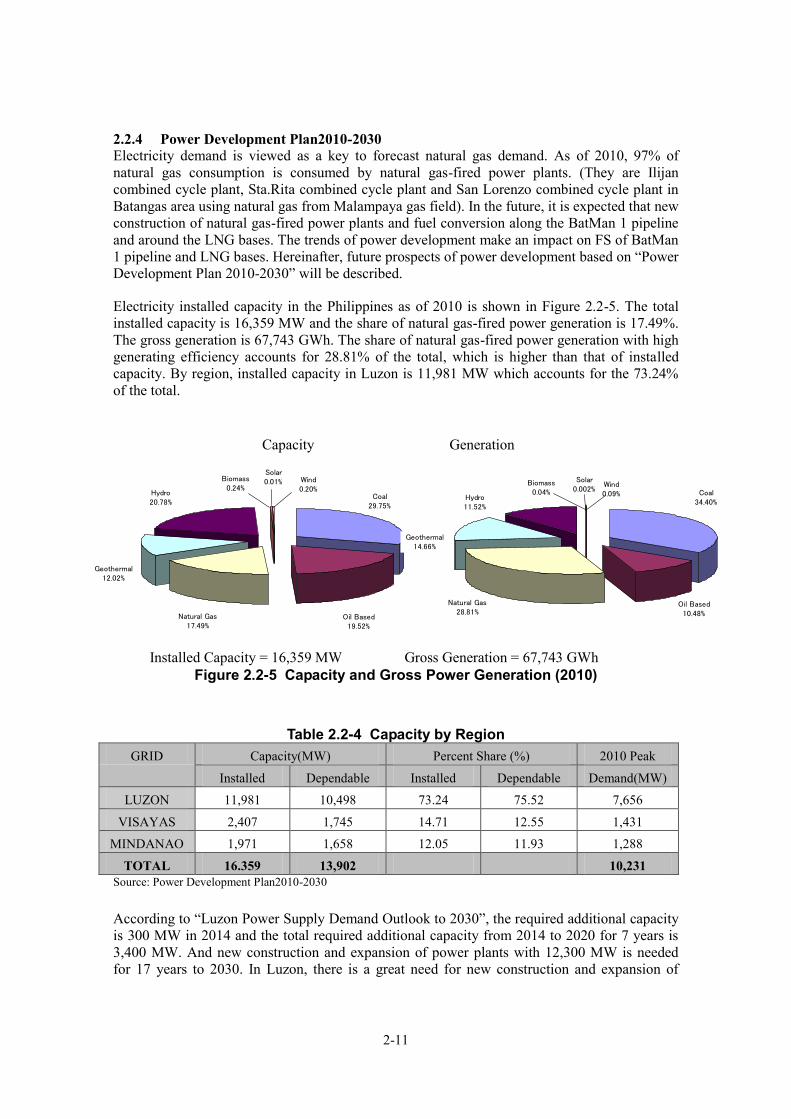
2.2.4 Power Development Plan2010-2030 Electricity demand is viewed as a key to forecast natural gas demand. As of 2010, 97% of natural gas consumption is consumed by natural gas-fired power plants. (They are Ilijan combined cycle plant, Sta.Rita combined cycle plant and San Lorenzo combined cycle plant in Batangas area using natural gas from Malampaya gas field). In the future, it is expected that new construction of natural gas-fired power plants and fuel conversion along the BatMan 1 pipeline and around the LNG bases. The trends of power development make an impact on FS of BatMan 1 pipeline and LNG bases. Hereinafter, future prospects of power development based on “Power Development Plan 2010-2030” will be described. Electricity installed capacity in the Philippines as of 2010 is shown in Figure 2.2-5. The total installed capacity is 16,359 MW and the share of natural gas-fired power generation is 17.49%. The gross generation is 67,743 GWh. The share of natural gas-fired power generation with high generating efficiency accounts for 28.81% of the total, which is higher than that of installed capacity. By region, installed capacity in Luzon is 11,981 MW which accounts for the 73.24% of the total.
Capacity Generation
Installed Capacity = 16,359 MW Gross Generation = 67,743 GWh Figure 2.2-5 Capacity and Gross Power Generation (2010)
Table 2.2-4 Capacity by Region GRID Capacity(MW) Percent Share (%) 2010 Peak
Installed Dependable Installed Dependable Demand(MW)
LUZON 11,981 10,498 73.24 75.52 7,656
VISAYAS 2,407 1,745 14.71 12.55 1,431
MINDANAO 1,971 1,658 12.05 11.93 1,288
TOTAL 16.359 13,902 10,231 Source: Power Development Plan2010-2030
According to “Luzon Power Supply Demand Outlook to 2030”, the required additional capacity is 300 MW in 2014 and the total required additional capacity from 2014 to 2020 for 7 years is 3,400 MW. And new construction and expansion of power plants with 12,300 MW is needed for 17 years to 2030. In Luzon, there is a great need for new construction and expansion of
Solar0.01% Wind
0.20%Coal
29.75%
Oil Based19.52%
Natural Gas17.49%
Geothermal12.02%
Hydro20.78%
Biomass0.24%
Coal34.40%
Wind0.09%
Solar0.002%
Biomass0.04%
Hydro11.52%
Geothermal14.66%
Natural Gas28.81%
Oil Based10.48%
2-12
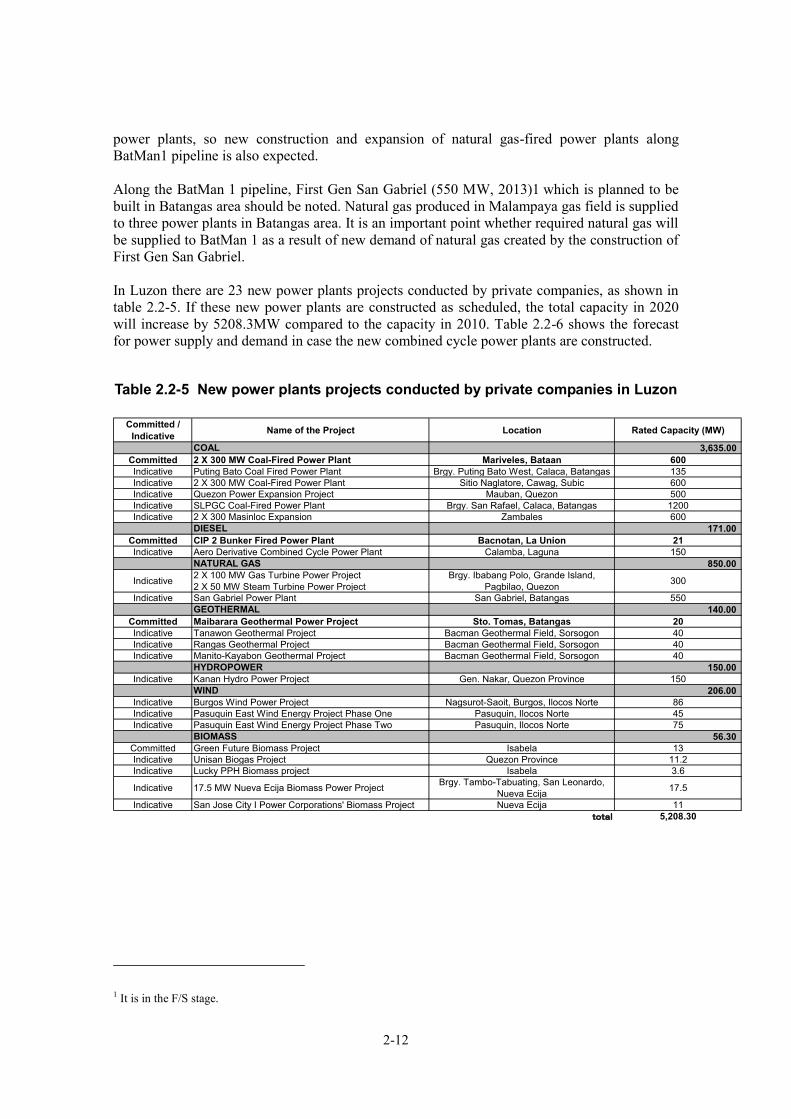
power plants, so new construction and expansion of natural gas-fired power plants along BatMan1 pipeline is also expected. Along the BatMan 1 pipeline, First Gen San Gabriel (550 MW, 2013)1 which is planned to be built in Batangas area should be noted. Natural gas produced in Malampaya gas field is supplied to three power plants in Batangas area. It is an important point whether required natural gas will be supplied to BatMan 1 as a result of new demand of natural gas created by the construction of First Gen San Gabriel. In Luzon there are 23 new power plants projects conducted by private companies, as shown in table 2.2-5. If these new power plants are constructed as scheduled, the total capacity in 2020 will increase by 5208.3MW compared to the capacity in 2010. Table 2.2-6 shows the forecast for power supply and demand in case the new combined cycle power plants are constructed. Table 2.2-5 New power plants projects conducted by private companies in Luzon
1 It is in the F/S stage.
Committed /Indicative Name of the Project Location Rated Capacity (MW)
COAL 3,635.00Committed 2 X 300 MW Coal-Fired Power Plant Mariveles, Bataan 600Indicative Puting Bato Coal Fired Power Plant Brgy. Puting Bato West, Calaca, Batangas 135Indicative 2 X 300 MW Coal-Fired Power Plant Sitio Naglatore, Cawag, Subic 600Indicative Quezon Power Expansion Project Mauban, Quezon 500Indicative SLPGC Coal-Fired Power Plant Brgy. San Rafael, Calaca, Batangas 1200Indicative 2 X 300 Masinloc Expansion Zambales 600
DIESEL 171.00 Committed CIP 2 Bunker Fired Power Plant Bacnotan, La Union 21Indicative Aero Derivative Combined Cycle Power Plant Calamba, Laguna 150
NATURAL GAS 850.00
Indicative 2 X 100 MW Gas Turbine Power Project2 X 50 MW Steam Turbine Power Project
Brgy. Ibabang Polo, Grande Island,Pagbilao, Quezon 300
Indicative San Gabriel Power Plant San Gabriel, Batangas 550GEOTHERMAL 140.00
Committed Maibarara Geothermal Power Project Sto. Tomas, Batangas 20Indicative Tanawon Geothermal Project Bacman Geothermal Field, Sorsogon 40Indicative Rangas Geothermal Project Bacman Geothermal Field, Sorsogon 40Indicative Manito-Kayabon Geothermal Project Bacman Geothermal Field, Sorsogon 40
HYDROPOWER 150.00 Indicative Kanan Hydro Power Project Gen. Nakar, Quezon Province 150
WIND 206.00 Indicative Burgos Wind Power Project Nagsurot-Saoit, Burgos, Ilocos Norte 86Indicative Pasuquin East Wind Energy Project Phase One Pasuquin, Ilocos Norte 45Indicative Pasuquin East Wind Energy Project Phase Two Pasuquin, Ilocos Norte 75
BIOMASS 56.30 Committed Green Future Biomass Project Isabela 13Indicative Unisan Biogas Project Quezon Province 11.2Indicative Lucky PPH Biomass project Isabela 3.6
Indicative 17.5 MW Nueva Ecija Biomass Power Project Brgy. Tambo-Tabuating, San Leonardo,Nueva Ecija 17.5
Indicative San Jose City I Power Corporations' Biomass Project Nueva Ecija 11total 5,208.30
2-13
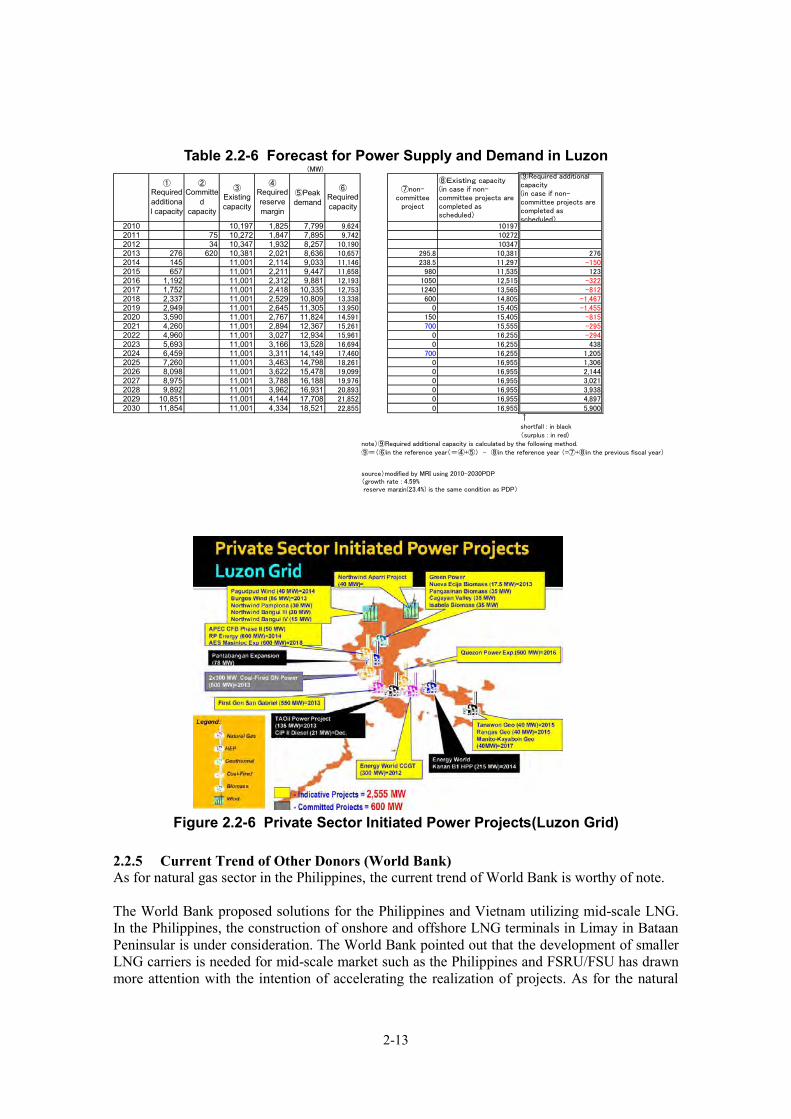
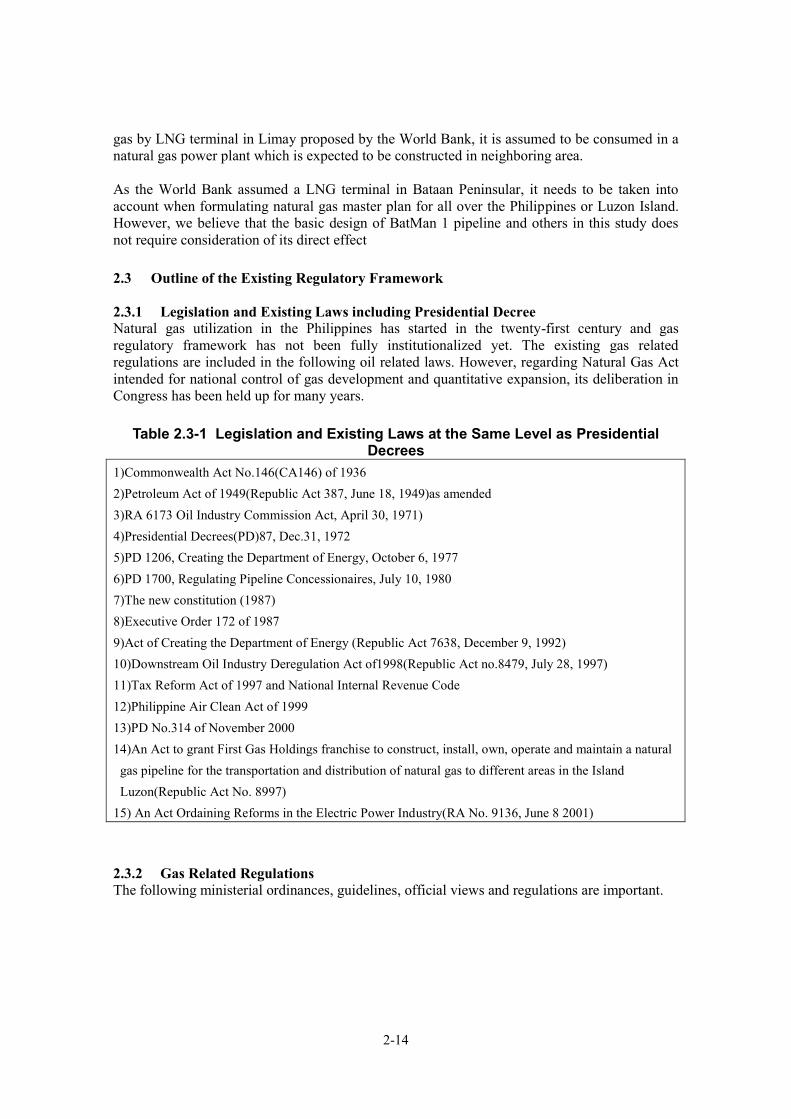
Table 2.2-6 Forecast for Power Supply and Demand in Luzon
(MW)
①Requiredadditional capacity
②Committe
dcapacity
③Existingcapacity
④Requiredreservemargin
⑤Peakdemand
⑥Requiredcapacity
⑦non-committee
project
⑧Existing capacity(in case if non-committee projects arecompleted asscheduled)
⑨Required additionalcapacity(in case if non-committee projects arecompleted asscheduled)
2010 10,197 1,825 7,799 9,624 101972011 75 10,272 1,847 7,895 9,742 102722012 34 10,347 1,932 8,257 10,190 103472013 276 620 10,381 2,021 8,636 10,657 295.8 10,381 2762014 145 11,001 2,114 9,033 11,146 238.5 11,297 -1502015 657 11,001 2,211 9,447 11,658 980 11,535 1232016 1,192 11,001 2,312 9,881 12,193 1050 12,515 -3222017 1,752 11,001 2,418 10,335 12,753 1240 13,565 -8122018 2,337 11,001 2,529 10,809 13,338 600 14,805 -1,4672019 2,949 11,001 2,645 11,305 13,950 0 15,405 -1,4552020 3,590 11,001 2,767 11,824 14,591 150 15,405 -8152021 4,260 11,001 2,894 12,367 15,261 700 15,555 -2952022 4,960 11,001 3,027 12,934 15,961 0 16,255 -2942023 5,693 11,001 3,166 13,528 16,694 0 16,255 4382024 6,459 11,001 3,311 14,149 17,460 700 16,255 1,2052025 7,260 11,001 3,463 14,798 18,261 0 16,955 1,3062026 8,098 11,001 3,622 15,478 19,099 0 16,955 2,1442027 8,975 11,001 3,788 16,188 19,976 0 16,955 3,0212028 9,892 11,001 3,962 16,931 20,893 0 16,955 3,9382029 10,851 11,001 4,144 17,708 21,852 0 16,955 4,8972030 11,854 11,001 4,334 18,521 22,855 0 16,955 5,900
↑shortfall : in black(surplus : in red)
note)⑨Required additional capacity is calculated by the following method.⑨=(⑥in the reference year(=④+⑤) - ⑧in the reference year (=⑦+⑧in the previous fiscal year)
source)modified by MRI using 2010-2030PDP(growth rate : 4.59% reserve margin(23.4%) is the same condition as PDP)
Figure 2.2-6 Private Sector Initiated Power Projects(Luzon Grid) 2.2.5 Current Trend of Other Donors (World Bank) As for natural gas sector in the Philippines, the current trend of World Bank is worthy of note. The World Bank proposed solutions for the Philippines and Vietnam utilizing mid-scale LNG. In the Philippines, the construction of onshore and offshore LNG terminals in Limay in Bataan Peninsular is under consideration. The World Bank pointed out that the development of smaller LNG carriers is needed for mid-scale market such as the Philippines and FSRU/FSU has drawn more attention with the intention of accelerating the realization of projects. As for the natural
2-14
gas by LNG terminal in Limay proposed by the World Bank, it is assumed to be consumed in a natural gas power plant which is expected to be constructed in neighboring area. As the World Bank assumed a LNG terminal in Bataan Peninsular, it needs to be taken into account when formulating natural gas master plan for all over the Philippines or Luzon Island. However, we believe that the basic design of BatMan 1 pipeline and others in this study does not require consideration of its direct effect 2.3 Outline of the Existing Regulatory Framework 2.3.1 Legislation and Existing Laws including Presidential Decree Natural gas utilization in the Philippines has started in the twenty-first century and gas regulatory framework has not been fully institutionalized yet. The existing gas related regulations are included in the following oil related laws. However, regarding Natural Gas Act intended for national control of gas development and quantitative expansion, its deliberation in Congress has been held up for many years.
Table 2.3-1 Legislation and Existing Laws at the Same Level as Presidential
Decrees 1)Commonwealth Act No.146(CA146) of 1936 2)Petroleum Act of 1949(Republic Act 387, June 18, 1949)as amended 3)RA 6173 Oil Industry Commission Act, April 30, 1971) 4)Presidential Decrees(PD)87, Dec.31, 1972 5)PD 1206, Creating the Department of Energy, October 6, 1977 6)PD 1700, Regulating Pipeline Concessionaires, July 10, 1980 7)The new constitution (1987) 8)Executive Order 172 of 1987 9)Act of Creating the Department of Energy (Republic Act 7638, December 9, 1992) 10)Downstream Oil Industry Deregulation Act of1998(Republic Act no.8479, July 28, 1997) 11)Tax Reform Act of 1997 and National Internal Revenue Code 12)Philippine Air Clean Act of 1999 13)PD No.314 of November 2000 14)An Act to grant First Gas Holdings franchise to construct, install, own, operate and maintain a natural
gas pipeline for the transportation and distribution of natural gas to different areas in the Island Luzon(Republic Act No. 8997)
15) An Act Ordaining Reforms in the Electric Power Industry(RA No. 9136, June 8 2001)
2.3.2 Gas Related Regulations The following ministerial ordinances, guidelines, official views and regulations are important.
2-15
Table 2.3-2 Natural Gas Related Regulations
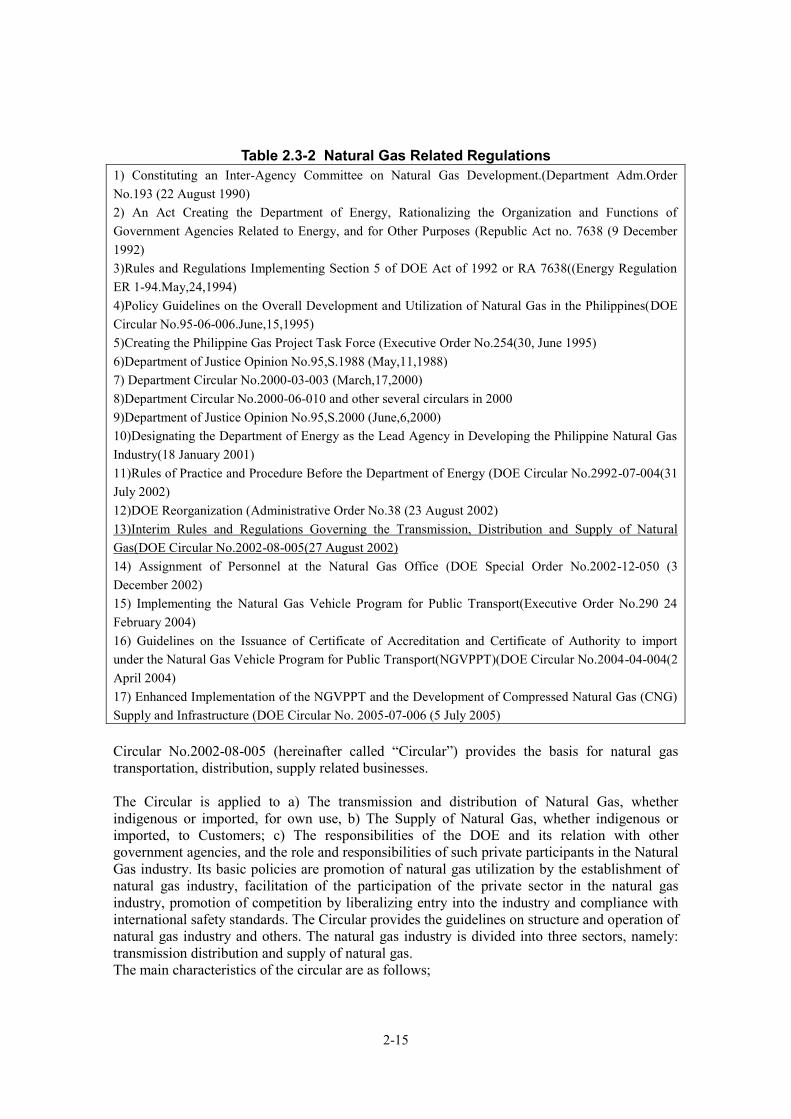
1) Constituting an Inter-Agency Committee on Natural Gas Development.(Department Adm.Order No.193 (22 August 1990) 2) An Act Creating the Department of Energy, Rationalizing the Organization and Functions of Government Agencies Related to Energy, and for Other Purposes (Republic Act no. 7638 (9 December 1992) 3)Rules and Regulations Implementing Section 5 of DOE Act of 1992 or RA 7638((Energy Regulation ER 1-94.May,24,1994) 4)Policy Guidelines on the Overall Development and Utilization of Natural Gas in the Philippines(DOE Circular No.95-06-006.June,15,1995) 5)Creating the Philippine Gas Project Task Force (Executive Order No.254(30, June 1995) 6)Department of Justice Opinion No.95,S.1988 (May,11,1988) 7) Department Circular No.2000-03-003 (March,17,2000) 8)Department Circular No.2000-06-010 and other several circulars in 2000 9)Department of Justice Opinion No.95,S.2000 (June,6,2000) 10)Designating the Department of Energy as the Lead Agency in Developing the Philippine Natural Gas Industry(18 January 2001) 11)Rules of Practice and Procedure Before the Department of Energy (DOE Circular No.2992-07-004(31 July 2002) 12)DOE Reorganization (Administrative Order No.38 (23 August 2002) 13)Interim Rules and Regulations Governing the Transmission, Distribution and Supply of Natural Gas(DOE Circular No.2002-08-005(27 August 2002) 14) Assignment of Personnel at the Natural Gas Office (DOE Special Order No.2002-12-050 (3 December 2002) 15) Implementing the Natural Gas Vehicle Program for Public Transport(Executive Order No.290 24 February 2004) 16) Guidelines on the Issuance of Certificate of Accreditation and Certificate of Authority to import under the Natural Gas Vehicle Program for Public Transport(NGVPPT)(DOE Circular No.2004-04-004(2 April 2004) 17) Enhanced Implementation of the NGVPPT and the Development of Compressed Natural Gas (CNG) Supply and Infrastructure (DOE Circular No. 2005-07-006 (5 July 2005) Circular No.2002-08-005 (hereinafter called “Circular”) provides the basis for natural gas transportation, distribution, supply related businesses. The Circular is applied to a) The transmission and distribution of Natural Gas, whether indigenous or imported, for own use, b) The Supply of Natural Gas, whether indigenous or imported, to Customers; c) The responsibilities of the DOE and its relation with other government agencies, and the role and responsibilities of such private participants in the Natural Gas industry. Its basic policies are promotion of natural gas utilization by the establishment of natural gas industry, facilitation of the participation of the private sector in the natural gas industry, promotion of competition by liberalizing entry into the industry and compliance with international safety standards. The Circular provides the guidelines on structure and operation of natural gas industry and others. The natural gas industry is divided into three sectors, namely: transmission distribution and supply of natural gas. The main characteristics of the circular are as follows;

2-16
Transmission, distribution and natural gas supply sectors’ entities are subject to the permitting authority of the DOE. The operation of Gas Transmission and Distribution Systems is recognized to be public utility operations requiring a Franchise. For these operations, the Philippine ownership is required. Third Party Access obligations shall apply to the Gas Transmission Systems and Gas Distribution Systems. No Person shall undertake the construction, operation and maintenance, expansion, extension or modification of a Gas Transmission System and Gas Distribution System or a Transmission– and/or Distribution-related Facility unless a Permit has been issued by the DOE DOE may recommend the bidding out of a Gas Infrastructure Project subject to existing laws and regulations. All Pipelines shall be constructed following a route that will provide the greatest benefit to Customers that can be identified at the time the application is submitted. Before issuing a Pipeline Permit, the DOE may require an applicant to submit the results of studies undertaken on alternative routes and options for expansion along these proposed routes. No Pipeline or Transmission- and/or Distribution-related Facilities for which a Permit has been issued shall be abandoned or withdrawn from service by the grantee of the Permit without obtaining prior written authorization from the DOE. A Permit shall be valid for twenty five years extendible for up to an additional twenty five years. The construction and operation of Pipelines and Transmission- and/or Distribution-related Facilities shall be in accordance with relevant standards promulgated by the International Standards Organization (ISO). The design standard for Pipelines shall comply with the requirements of ISO 13623 All Permit holders shall conduct their activities and operations consistent with all environmental laws of the Philippines. All matters related to fixing and regulating the rate or schedule of prices of piped gas shall remain the responsibility of ERC consistent with the ERB Charter
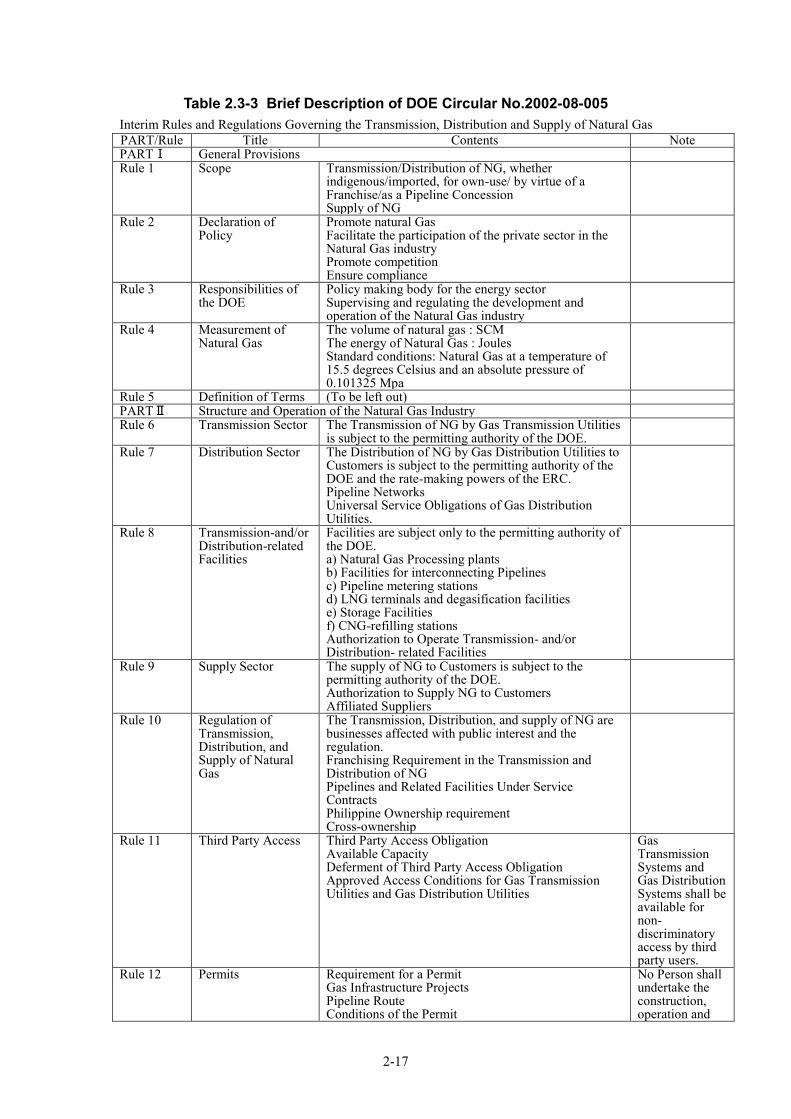
The other items in each section of Circular are shown in the Table 2.3-3.
2-17
Table 2.3-3 Brief Description of DOE Circular No.2002-08-005 Interim Rules and Regulations Governing the Transmission, Distribution and Supply of Natural Gas PART/Rule Title Contents Note PARTⅠ General Provisions Rule 1 Scope Transmission/Distribution of NG, whether
indigenous/imported, for own-use/ by virtue of a Franchise/as a Pipeline Concession Supply of NG
Rule 2 Declaration of Policy
Promote natural Gas Facilitate the participation of the private sector in the Natural Gas industry Promote competition Ensure compliance
Rule 3 Responsibilities of the DOE
Policy making body for the energy sector Supervising and regulating the development and operation of the Natural Gas industry
Rule 4 Measurement of Natural Gas
The volume of natural gas : SCM The energy of Natural Gas : Joules Standard conditions: Natural Gas at a temperature of 15.5 degrees Celsius and an absolute pressure of 0.101325 Mpa
Rule 5 Definition of Terms (To be left out) PARTⅡ Structure and Operation of the Natural Gas Industry Rule 6 Transmission Sector The Transmission of NG by Gas Transmission Utilities
is subject to the permitting authority of the DOE.
Rule 7 Distribution Sector The Distribution of NG by Gas Distribution Utilities to Customers is subject to the permitting authority of the DOE and the rate-making powers of the ERC. Pipeline Networks Universal Service Obligations of Gas Distribution Utilities.
Rule 8 Transmission-and/or Distribution-related Facilities
Facilities are subject only to the permitting authority of the DOE. a) Natural Gas Processing plants b) Facilities for interconnecting Pipelines c) Pipeline metering stations d) LNG terminals and degasification facilities e) Storage Facilities f) CNG-refilling stations Authorization to Operate Transmission- and/or Distribution- related Facilities
Rule 9 Supply Sector The supply of NG to Customers is subject to the permitting authority of the DOE. Authorization to Supply NG to Customers Affiliated Suppliers
Rule 10 Regulation of Transmission, Distribution, and Supply of Natural Gas
The Transmission, Distribution, and supply of NG are businesses affected with public interest and the regulation. Franchising Requirement in the Transmission and Distribution of NG Pipelines and Related Facilities Under Service Contracts Philippine Ownership requirement Cross-ownership
Rule 11 Third Party Access Third Party Access Obligation Available Capacity Deferment of Third Party Access Obligation Approved Access Conditions for Gas Transmission Utilities and Gas Distribution Utilities
Gas Transmission Systems and Gas Distribution Systems shall be available for non-discriminatory access by third party users.
Rule 12 Permits Requirement for a Permit Gas Infrastructure Projects Pipeline Route Conditions of the Permit
No Person shall undertake the construction, operation and

2-18
Petroleum Operations Own-use Permits Fees Abandonment of Pipeline and Transmission- and Distribution- related Facilities Duration of Permit
maintenance, expansion, extension or modification of a Gas Transmission System and Gas Distribution System or a Transmission-and/or Distribution-related Facility unless a permit has been issued by the DOE.
Rule 13 Application for Permits
Application Required Contents of the Application Application Fee Confidential Information Decision to Issue a Permit
Rule 14 Standards for Construction, Operation and Safety
Conduct of Operations Impact on Public Infrastructure Pipeline Design Standard Pipeline Testing Signs Discontinuation of Operations Discharge of Substances from Pipelines Onshore Pipeline Abandonment Submarine Pipeline Abandonment Compliance with Environmental and Other Laws and Regulations
The construction and operation of pipelines shall be in accordance with ISO. The design standard for Pipelines shall comply with the requirements of ISO 13623. All permit holders conduct their activities and operations with all environmental and other laws of the Philippines.
PARTⅢ Natural Gas Pricing Rule 15 Natural Gas Pricing Determination of Rates and Price Schedules
Guiding Principles for Pricing Just and Reasonable Standard Unbundled Service
All matters related to fixing and regulating the rate or schedule of prices of piped gas shall remain the responsibility of ERC.
Rule 16 Promotion of Competition
Promotion of Competition Take-or-Pay Obligations
PARTⅣ Transitory Provisions Rule 17 Existing Systems Permits
Application
Rule 18 Pending Applications
PARTⅣ Final Provisions Rule 19 Reportorial
Requirements The pertinent reportorial requirements are provided in Annex.3
Rule 20 Offenses and Penalties
Offenses Enforcement of Rules Penalties Cancellation of Permit
Rule 21 Separability Clause Rule 22 Amendment of
2-19
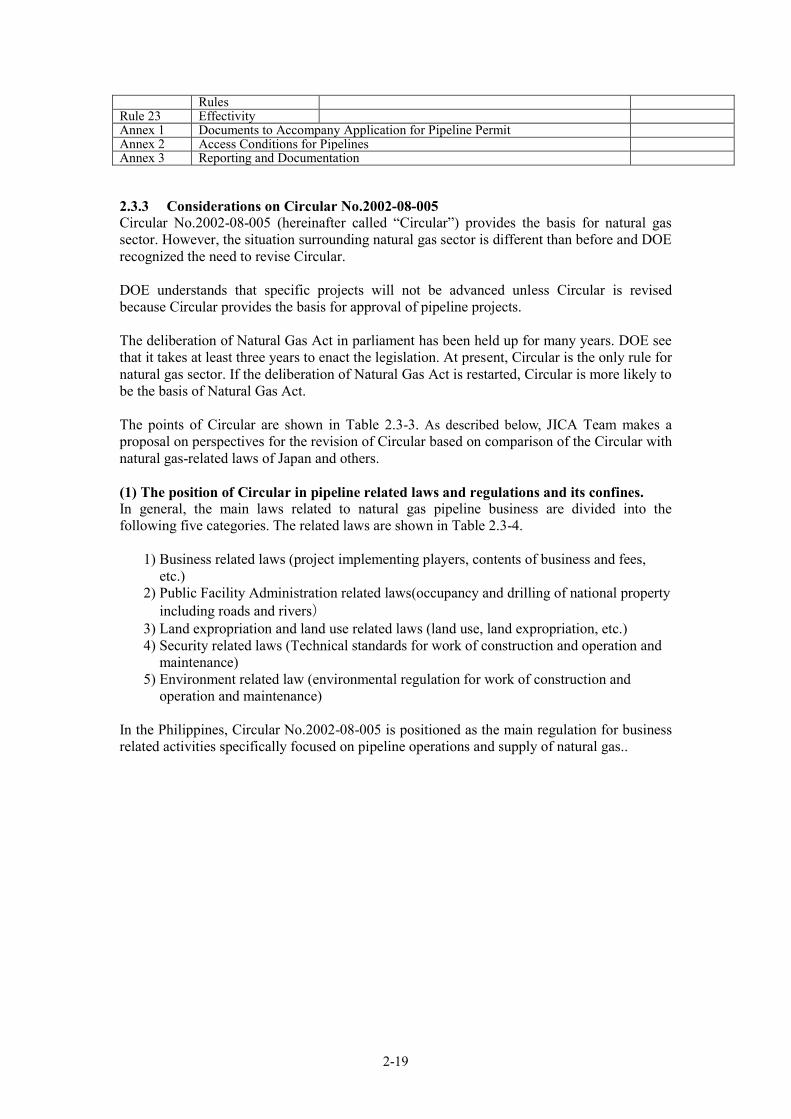
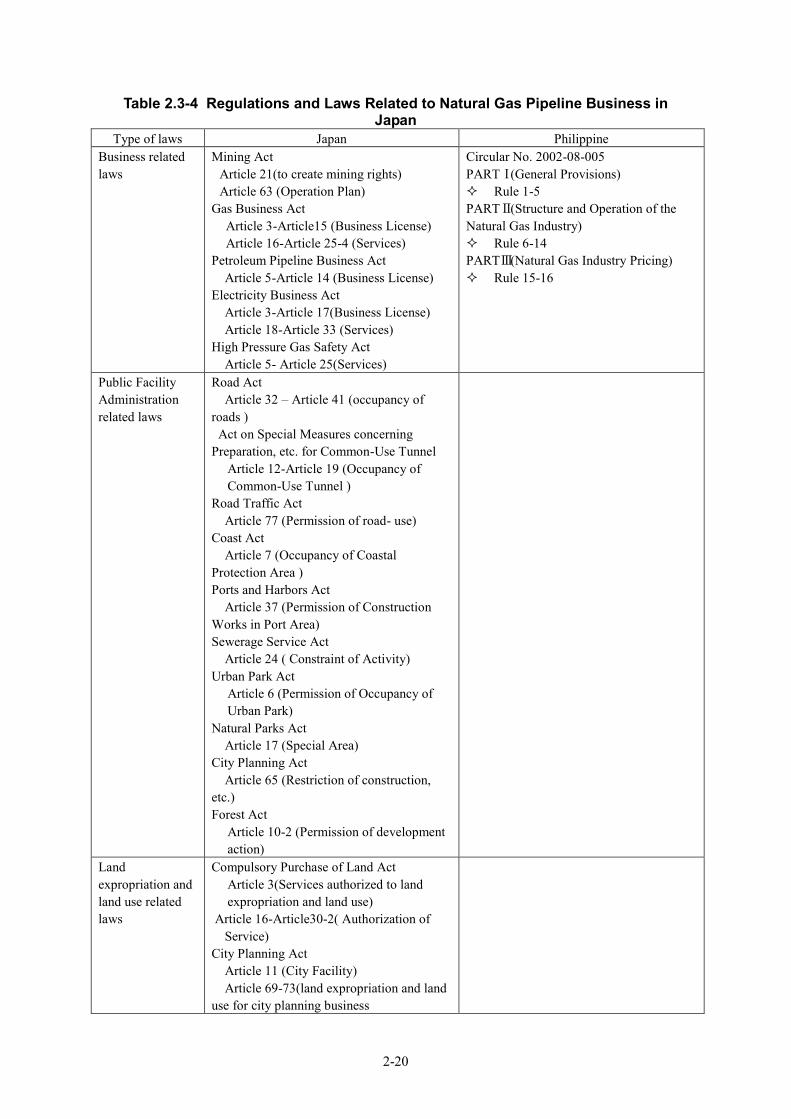
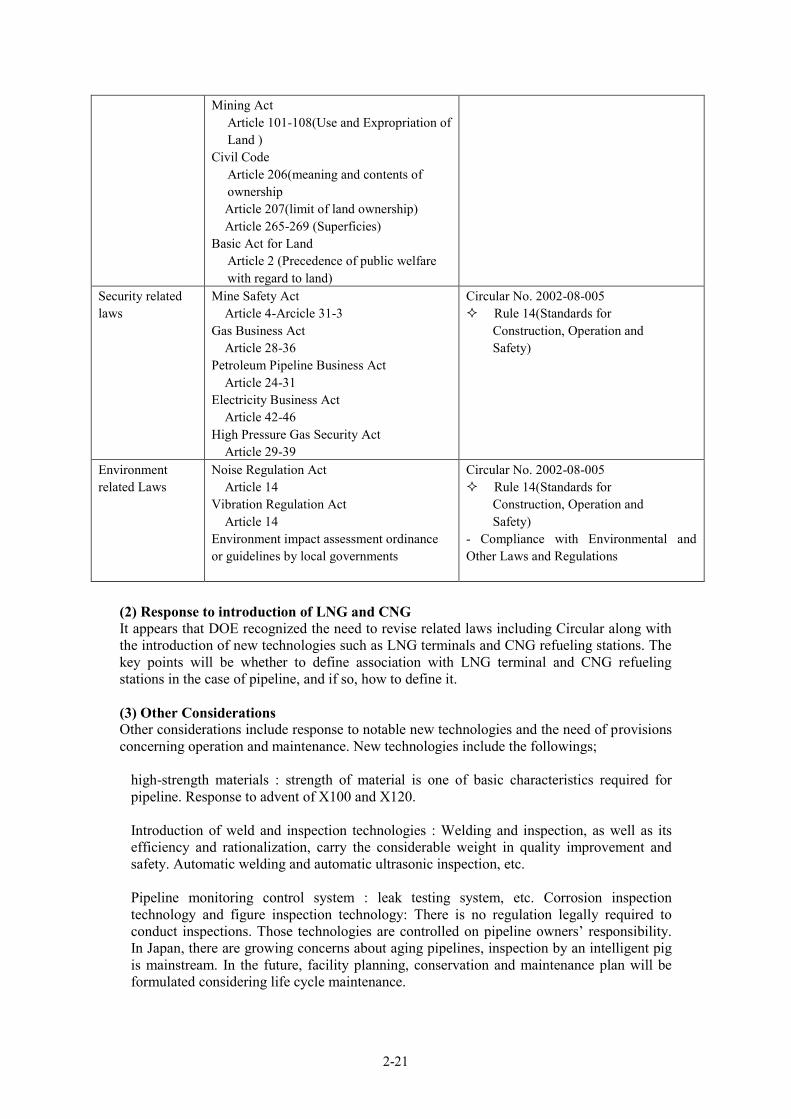
Rules Rule 23 Effectivity Annex 1 Documents to Accompany Application for Pipeline Permit Annex 2 Access Conditions for Pipelines Annex 3 Reporting and Documentation 2.3.3 Considerations on Circular No.2002-08-005 Circular No.2002-08-005 (hereinafter called “Circular”) provides the basis for natural gas sector. However, the situation surrounding natural gas sector is different than before and DOE recognized the need to revise Circular. DOE understands that specific projects will not be advanced unless Circular is revised because Circular provides the basis for approval of pipeline projects. The deliberation of Natural Gas Act in parliament has been held up for many years. DOE see that it takes at least three years to enact the legislation. At present, Circular is the only rule for natural gas sector. If the deliberation of Natural Gas Act is restarted, Circular is more likely to be the basis of Natural Gas Act. The points of Circular are shown in Table 2.3-3. As described below, JICA Team makes a proposal on perspectives for the revision of Circular based on comparison of the Circular with natural gas-related laws of Japan and others. (1) The position of Circular in pipeline related laws and regulations and its confines. In general, the main laws related to natural gas pipeline business are divided into the following five categories. The related laws are shown in Table 2.3-4.
1) Business related laws (project implementing players, contents of business and fees,
etc.) 2) Public Facility Administration related laws(occupancy and drilling of national property
including roads and rivers) 3) Land expropriation and land use related laws (land use, land expropriation, etc.) 4) Security related laws (Technical standards for work of construction and operation and
maintenance) 5) Environment related law (environmental regulation for work of construction and
operation and maintenance)
In the Philippines, Circular No.2002-08-005 is positioned as the main regulation for business related activities specifically focused on pipeline operations and supply of natural gas..
2-20
Table 2.3-4 Regulations and Laws Related to Natural Gas Pipeline Business in Japan
Type of laws Japan Philippine Business related laws
Mining Act Article 21(to create mining rights) Article 63 (Operation Plan)
Gas Business Act Article 3-Article15 (Business License) Article 16-Article 25-4 (Services)
Petroleum Pipeline Business Act Article 5-Article 14 (Business License)
Electricity Business Act Article 3-Article 17(Business License) Article 18-Article 33 (Services)
High Pressure Gas Safety Act Article 5- Article 25(Services)
Circular No. 2002-08-005 PARTⅠ(General Provisions) Rule 1-5 PARTⅡ(Structure and Operation of the Natural Gas Industry) Rule 6-14 PARTⅢ(Natural Gas Industry Pricing) Rule 15-16
Public Facility Administration related laws
Road Act Article 32 – Article 41 (occupancy of
roads ) Act on Special Measures concerning
Preparation, etc. for Common-Use Tunnel Article 12-Article 19 (Occupancy of Common-Use Tunnel )
Road Traffic Act Article 77 (Permission of road- use)
Coast Act Article 7 (Occupancy of Coastal
Protection Area ) Ports and Harbors Act
Article 37 (Permission of Construction Works in Port Area) Sewerage Service Act
Article 24 ( Constraint of Activity) Urban Park Act
Article 6 (Permission of Occupancy of Urban Park)
Natural Parks Act Article 17 (Special Area)
City Planning Act Article 65 (Restriction of construction,
etc.) Forest Act
Article 10-2 (Permission of development action)
Land expropriation and land use related laws
Compulsory Purchase of Land Act Article 3(Services authorized to land expropriation and land use)
Article 16-Article30-2( Authorization of Service)
City Planning Act Article 11 (City Facility) Article 69-73(land expropriation and land
use for city planning business
2-21
Mining Act Article 101-108(Use and Expropriation of Land )
Civil Code Article 206(meaning and contents of ownership Article 207(limit of land ownership) Article 265-269 (Superficies)
Basic Act for Land Article 2 (Precedence of public welfare with regard to land)
Security related laws
Mine Safety Act Article 4-Arcicle 31-3
Gas Business Act Article 28-36
Petroleum Pipeline Business Act Article 24-31
Electricity Business Act Article 42-46
High Pressure Gas Security Act Article 29-39
Circular No. 2002-08-005 Rule 14(Standards for
Construction, Operation and Safety)
Environment related Laws
Noise Regulation Act Article 14
Vibration Regulation Act Article 14
Environment impact assessment ordinance or guidelines by local governments
Circular No. 2002-08-005 Rule 14(Standards for
Construction, Operation and Safety)
- Compliance with Environmental and Other Laws and Regulations
(2) Response to introduction of LNG and CNG It appears that DOE recognized the need to revise related laws including Circular along with the introduction of new technologies such as LNG terminals and CNG refueling stations. The key points will be whether to define association with LNG terminal and CNG refueling stations in the case of pipeline, and if so, how to define it. (3) Other Considerations Other considerations include response to notable new technologies and the need of provisions concerning operation and maintenance. New technologies include the followings;
high-strength materials : strength of material is one of basic characteristics required for pipeline. Response to advent of X100 and X120. Introduction of weld and inspection technologies : Welding and inspection, as well as its efficiency and rationalization, carry the considerable weight in quality improvement and safety. Automatic welding and automatic ultrasonic inspection, etc. Pipeline monitoring control system : leak testing system, etc. Corrosion inspection technology and figure inspection technology: There is no regulation legally required to conduct inspections. Those technologies are controlled on pipeline owners’ responsibility. In Japan, there are growing concerns about aging pipelines, inspection by an intelligent pig is mainstream. In the future, facility planning, conservation and maintenance plan will be formulated considering life cycle maintenance.
2-22
Provisions concerning operation and maintenance. Both Mine Safety Act and Gas Business Act have only a few provisions concerning maintenance. In actual operation, maintenance is performed based on self-imposed rule. From the perspective of continuity, there is a possibility to establish a provision concerning maintenance. Meanwhile, in Japan, to reduce costs including pipeline development cost, there is a sign of deregulation by depth of burial. In the Philippines, Rule 14 of Circular requires that the construction and operation of Pipelines shall be in accordance with relevant standards promulgated by ISO. In particular the design, construction, operation and maintenance of pipelines should comply with the requirements of ISO13623 issued in 2000. Therefore, it is needed to examine ISO 13623 closely and consider technical standards which should be added and amended.
2.4 Review of JICA M/P (2002) and Necessity of Development of Natural Gas Infrastructure
2.4.1 Review of JICA M/P(2002) JICA conducted “A Master Plan Study on the Development of the Natural Gas Industry in the Republic of Philippines” in 2002(hereinafter called “JICA M/P (2002)”). In this section, we summarize and review JICA M/P (2002) based on the development and utilization of natural gas and the development of natural gas infrastructure since 2002. (1) Summary of JICA M/P(2002) JICA M/P (2002) was conducted to prepare a comprehensive medium and long-term master plan for promoting natural gas utilization in the Philippines and to engage in technology transfer, so that the Philippine counterpart can evolve the master plan and continue its effective use by making necessary reviews and modifications themselves. The study consists of “ Gas Demand and Supply Scenarios”(Phase 1) and “a Master Plan for Promoting Natural Gas Use”(Phase 2). The major study items of each phase are summarized in the following table.
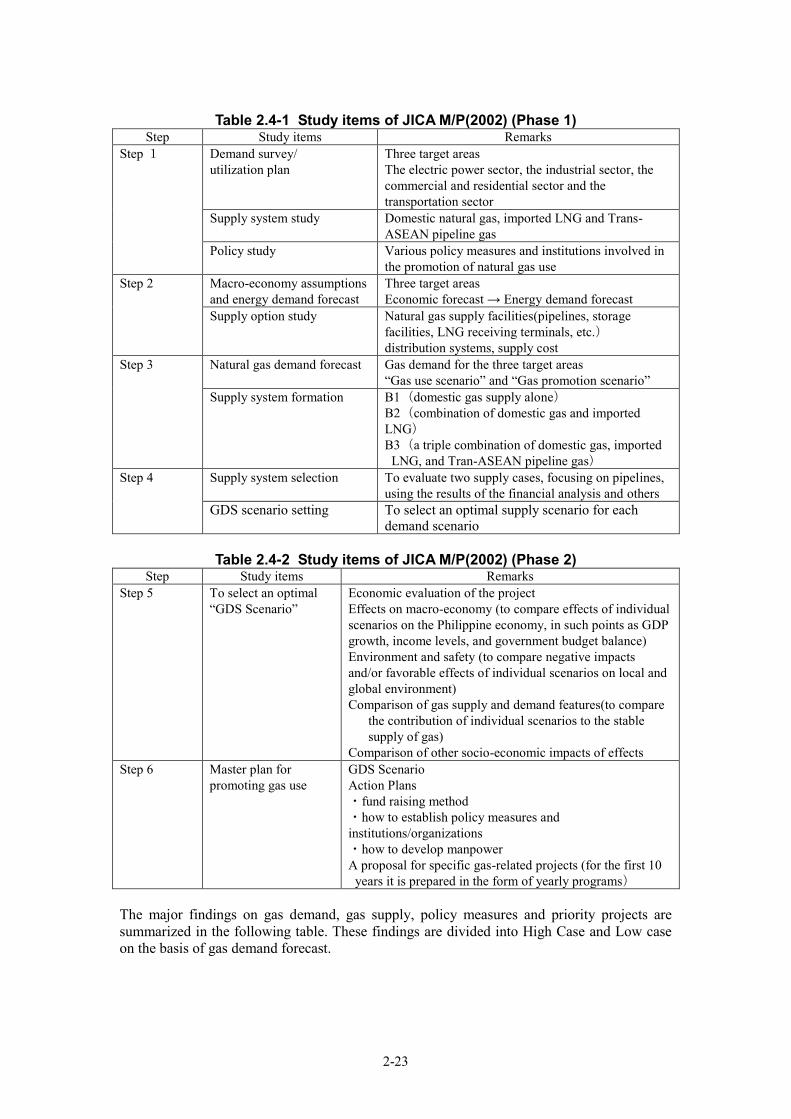
2-23
Table 2.4-1 Study items of JICA M/P(2002) (Phase 1)
Step Study items Remarks Step 1 Demand survey/
utilization plan Three target areas The electric power sector, the industrial sector, the commercial and residential sector and the transportation sector
Supply system study Domestic natural gas, imported LNG and Trans-ASEAN pipeline gas
Policy study Various policy measures and institutions involved in the promotion of natural gas use
Step 2 Macro-economy assumptions and energy demand forecast
Three target areas Economic forecast → Energy demand forecast
Supply option study Natural gas supply facilities(pipelines, storage facilities, LNG receiving terminals, etc.) distribution systems, supply cost
Step 3 Natural gas demand forecast Gas demand for the three target areas “Gas use scenario” and “Gas promotion scenario”
Supply system formation B1(domestic gas supply alone) B2(combination of domestic gas and imported LNG) B3(a triple combination of domestic gas, imported
LNG, and Tran-ASEAN pipeline gas) Step 4 Supply system selection To evaluate two supply cases, focusing on pipelines,
using the results of the financial analysis and others GDS scenario setting To select an optimal supply scenario for each
demand scenario
Table 2.4-2 Study items of JICA M/P(2002) (Phase 2) Step Study items Remarks
Step 5 To select an optimal “GDS Scenario”
Economic evaluation of the project Effects on macro-economy (to compare effects of individual scenarios on the Philippine economy, in such points as GDP growth, income levels, and government budget balance) Environment and safety (to compare negative impacts and/or favorable effects of individual scenarios on local and global environment) Comparison of gas supply and demand features(to compare
the contribution of individual scenarios to the stable supply of gas)
Comparison of other socio-economic impacts of effects Step 6 Master plan for
promoting gas use GDS Scenario Action Plans ・fund raising method ・how to establish policy measures and institutions/organizations ・how to develop manpower A proposal for specific gas-related projects (for the first 10
years it is prepared in the form of yearly programs)
The major findings on gas demand, gas supply, policy measures and priority projects are summarized in the following table. These findings are divided into High Case and Low case on the basis of gas demand forecast.
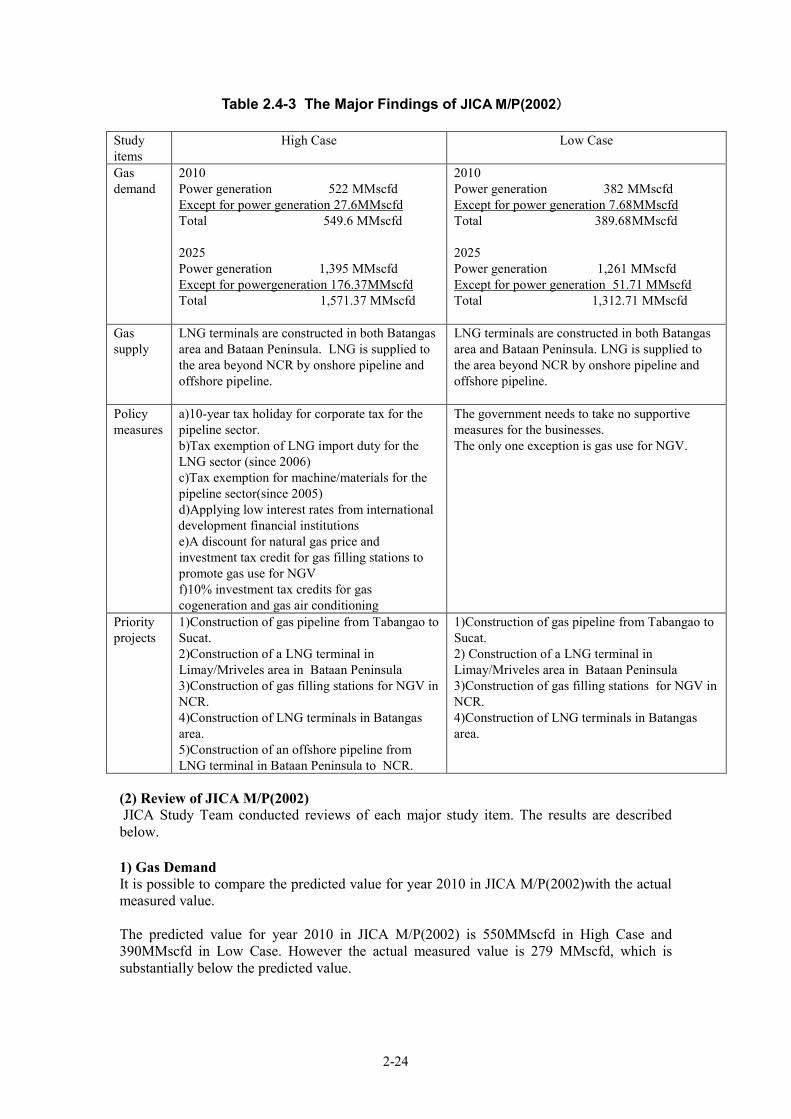
2-24
Table 2.4-3 The Major Findings of JICA M/P(2002)
Study items
High Case Low Case
Gas demand
2010 Power generation 522 MMscfd Except for power generation 27.6MMscfd Total 549.6 MMscfd 2025 Power generation 1,395 MMscfd Except for powergeneration 176.37MMscfd Total 1,571.37 MMscfd
2010 Power generation 382 MMscfd Except for power generation 7.68MMscfd Total 389.68MMscfd 2025 Power generation 1,261 MMscfd Except for power generation 51.71 MMscfd Total 1,312.71 MMscfd
Gas supply
LNG terminals are constructed in both Batangas area and Bataan Peninsula. LNG is supplied to the area beyond NCR by onshore pipeline and offshore pipeline.
LNG terminals are constructed in both Batangas area and Bataan Peninsula. LNG is supplied to the area beyond NCR by onshore pipeline and offshore pipeline.
Policy measures
a)10-year tax holiday for corporate tax for the pipeline sector. b)Tax exemption of LNG import duty for the LNG sector (since 2006) c)Tax exemption for machine/materials for the pipeline sector(since 2005) d)Applying low interest rates from international development financial institutions e)A discount for natural gas price and investment tax credit for gas filling stations to promote gas use for NGV f)10% investment tax credits for gas cogeneration and gas air conditioning
The government needs to take no supportive measures for the businesses. The only one exception is gas use for NGV.
Priority projects
1)Construction of gas pipeline from Tabangao to Sucat. 2)Construction of a LNG terminal in Limay/Mriveles area in Bataan Peninsula 3)Construction of gas filling stations for NGV in NCR. 4)Construction of LNG terminals in Batangas area. 5)Construction of an offshore pipeline from LNG terminal in Bataan Peninsula to NCR.
1)Construction of gas pipeline from Tabangao to Sucat. 2) Construction of a LNG terminal in Limay/Mriveles area in Bataan Peninsula 3)Construction of gas filling stations for NGV in NCR. 4)Construction of LNG terminals in Batangas area.
(2) Review of JICA M/P(2002) JICA Study Team conducted reviews of each major study item. The results are described below. 1) Gas Demand It is possible to compare the predicted value for year 2010 in JICA M/P(2002)with the actual measured value. The predicted value for year 2010 in JICA M/P(2002) is 550MMscfd in High Case and 390MMscfd in Low Case. However the actual measured value is 279 MMscfd, which is substantially below the predicted value.
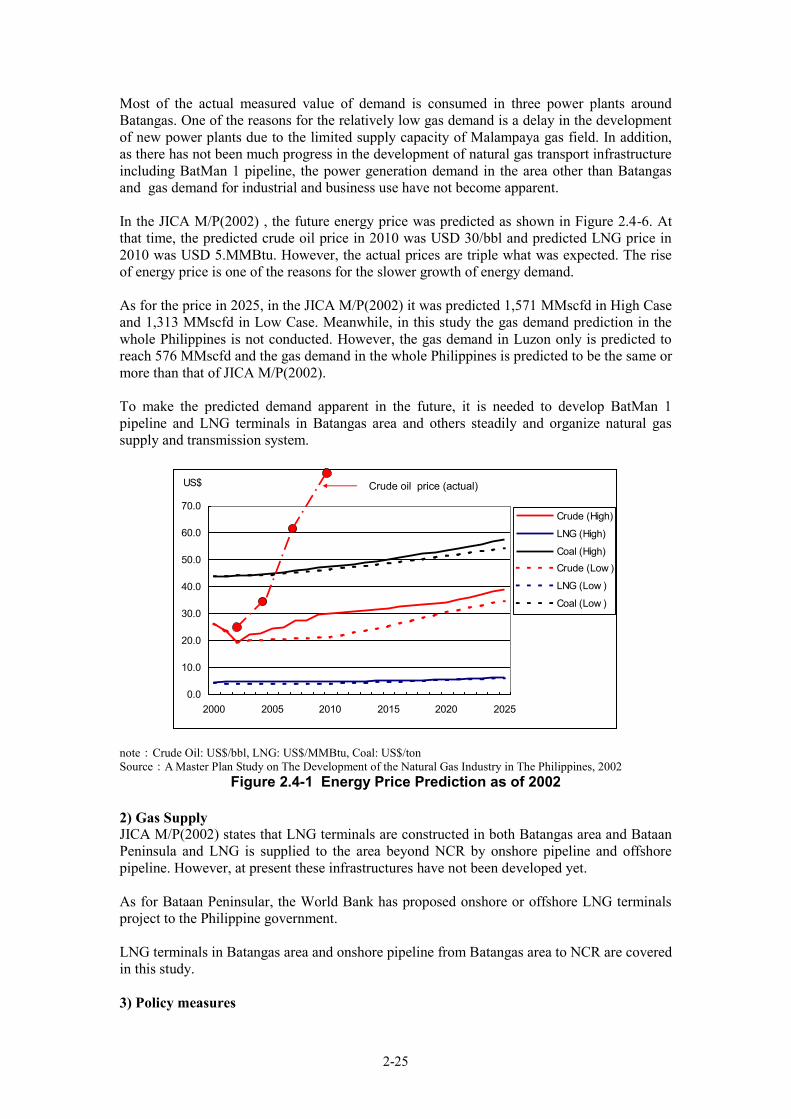
2-25
Most of the actual measured value of demand is consumed in three power plants around Batangas. One of the reasons for the relatively low gas demand is a delay in the development of new power plants due to the limited supply capacity of Malampaya gas field. In addition, as there has not been much progress in the development of natural gas transport infrastructure including BatMan 1 pipeline, the power generation demand in the area other than Batangas and gas demand for industrial and business use have not become apparent. In the JICA M/P(2002) , the future energy price was predicted as shown in Figure 2.4-6. At that time, the predicted crude oil price in 2010 was USD 30/bbl and predicted LNG price in 2010 was USD 5.MMBtu. However, the actual prices are triple what was expected. The rise of energy price is one of the reasons for the slower growth of energy demand. As for the price in 2025, in the JICA M/P(2002) it was predicted 1,571 MMscfd in High Case and 1,313 MMscfd in Low Case. Meanwhile, in this study the gas demand prediction in the whole Philippines is not conducted. However, the gas demand in Luzon only is predicted to reach 576 MMscfd and the gas demand in the whole Philippines is predicted to be the same or more than that of JICA M/P(2002). To make the predicted demand apparent in the future, it is needed to develop BatMan 1 pipeline and LNG terminals in Batangas area and others steadily and organize natural gas supply and transmission system.
note: Crude Oil: US$/bbl, LNG: US$/MMBtu, Coal: US$/ton Source: A Master Plan Study on The Development of the Natural Gas Industry in The Philippines, 2002
Figure 2.4-1 Energy Price Prediction as of 2002 2) Gas Supply JICA M/P(2002) states that LNG terminals are constructed in both Batangas area and Bataan Peninsula and LNG is supplied to the area beyond NCR by onshore pipeline and offshore pipeline. However, at present these infrastructures have not been developed yet. As for Bataan Peninsular, the World Bank has proposed onshore or offshore LNG terminals project to the Philippine government. LNG terminals in Batangas area and onshore pipeline from Batangas area to NCR are covered in this study. 3) Policy measures
0.0
10.0
20.0
30.0
40.0
50.0
60.0
70.0
2000 2005 2010 2015 2020 2025
US$
Crude (High)
LNG (High)
Coal (High)Crude (Low )
LNG (Low )
Coal (Low )
Crude oil price (actual)
0.0
10.0
20.0
30.0
40.0
50.0
60.0
70.0
2000 2005 2010 2015 2020 2025
US$
Crude (High)
LNG (High)
Coal (High)Crude (Low )
LNG (Low )
Coal (Low )
Crude oil price (actual)
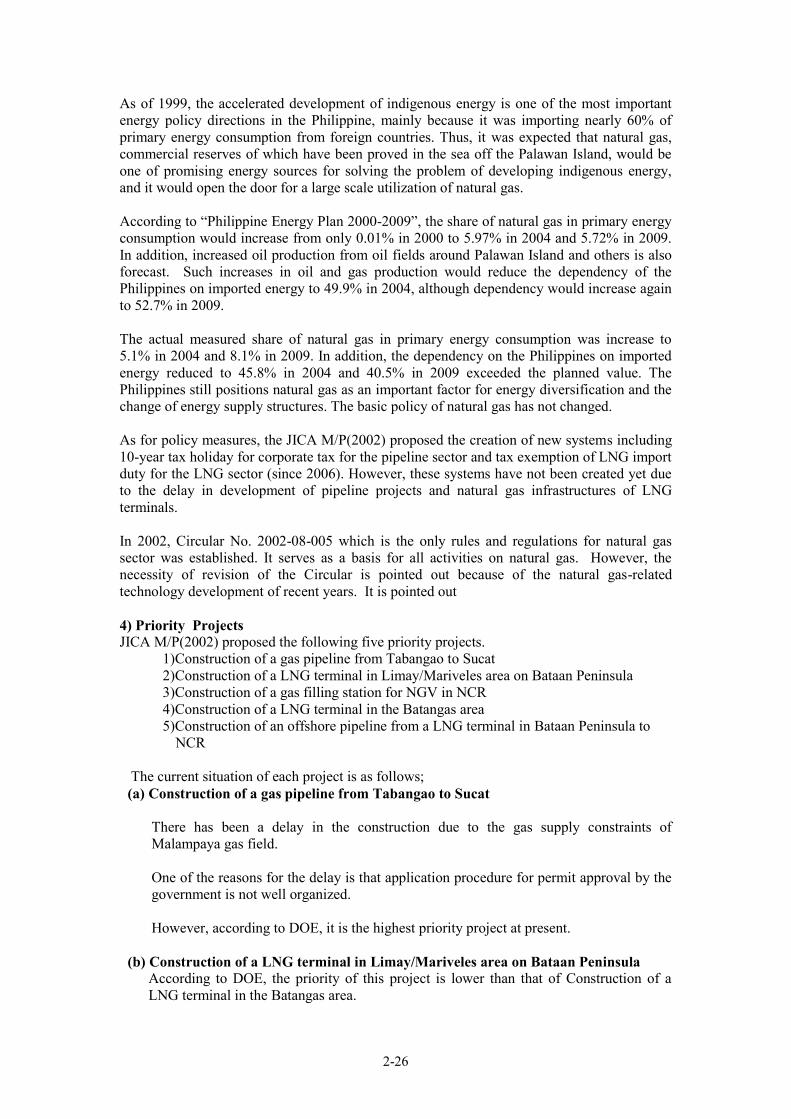
2-26
As of 1999, the accelerated development of indigenous energy is one of the most important energy policy directions in the Philippine, mainly because it was importing nearly 60% of primary energy consumption from foreign countries. Thus, it was expected that natural gas, commercial reserves of which have been proved in the sea off the Palawan Island, would be one of promising energy sources for solving the problem of developing indigenous energy, and it would open the door for a large scale utilization of natural gas. According to “Philippine Energy Plan 2000-2009”, the share of natural gas in primary energy consumption would increase from only 0.01% in 2000 to 5.97% in 2004 and 5.72% in 2009. In addition, increased oil production from oil fields around Palawan Island and others is also forecast. Such increases in oil and gas production would reduce the dependency of the Philippines on imported energy to 49.9% in 2004, although dependency would increase again to 52.7% in 2009. The actual measured share of natural gas in primary energy consumption was increase to 5.1% in 2004 and 8.1% in 2009. In addition, the dependency on the Philippines on imported energy reduced to 45.8% in 2004 and 40.5% in 2009 exceeded the planned value. The Philippines still positions natural gas as an important factor for energy diversification and the change of energy supply structures. The basic policy of natural gas has not changed. As for policy measures, the JICA M/P(2002) proposed the creation of new systems including 10-year tax holiday for corporate tax for the pipeline sector and tax exemption of LNG import duty for the LNG sector (since 2006). However, these systems have not been created yet due to the delay in development of pipeline projects and natural gas infrastructures of LNG terminals. In 2002, Circular No. 2002-08-005 which is the only rules and regulations for natural gas sector was established. It serves as a basis for all activities on natural gas. However, the necessity of revision of the Circular is pointed out because of the natural gas-related technology development of recent years. It is pointed out 4) Priority Projects JICA M/P(2002) proposed the following five priority projects.
1)Construction of a gas pipeline from Tabangao to Sucat 2)Construction of a LNG terminal in Limay/Mariveles area on Bataan Peninsula 3)Construction of a gas filling station for NGV in NCR 4)Construction of a LNG terminal in the Batangas area 5)Construction of an offshore pipeline from a LNG terminal in Bataan Peninsula to
NCR
The current situation of each project is as follows; (a) Construction of a gas pipeline from Tabangao to Sucat
There has been a delay in the construction due to the gas supply constraints of Malampaya gas field. One of the reasons for the delay is that application procedure for permit approval by the government is not well organized. However, according to DOE, it is the highest priority project at present.
(b) Construction of a LNG terminal in Limay/Mariveles area on Bataan Peninsula According to DOE, the priority of this project is lower than that of Construction of a LNG terminal in the Batangas area.
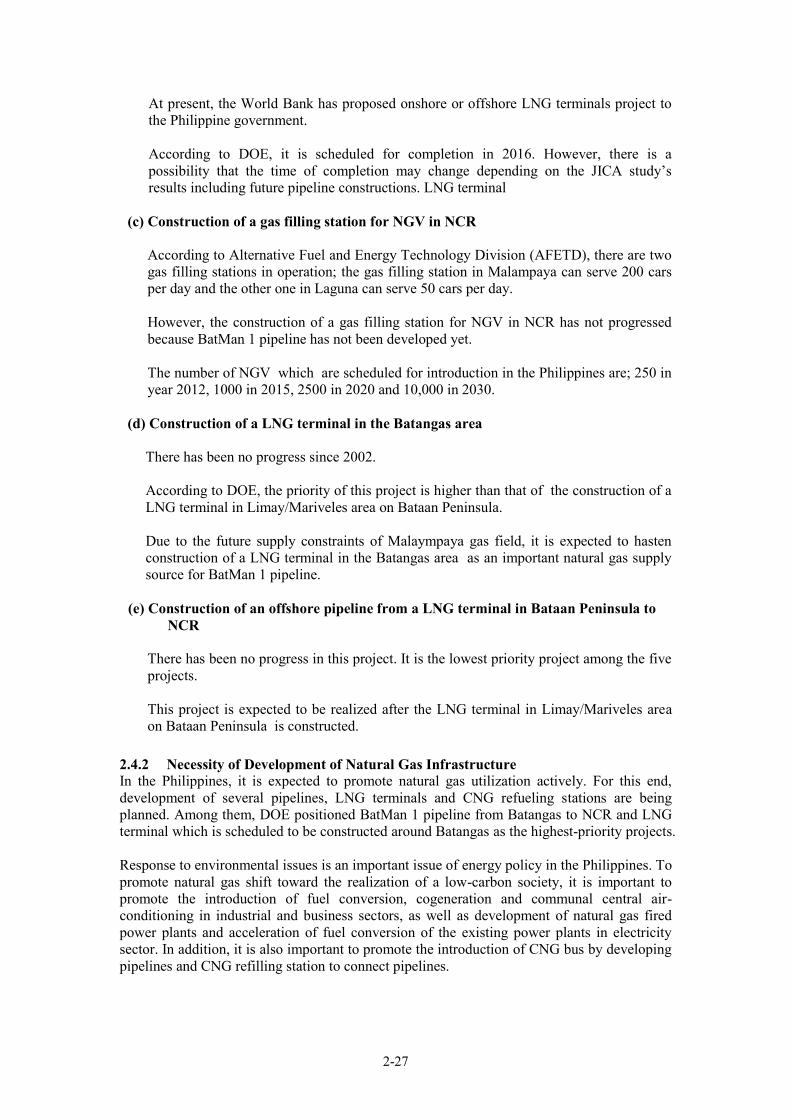
2-27
At present, the World Bank has proposed onshore or offshore LNG terminals project to the Philippine government. According to DOE, it is scheduled for completion in 2016. However, there is a possibility that the time of completion may change depending on the JICA study’s results including future pipeline constructions. LNG terminal
(c) Construction of a gas filling station for NGV in NCR
According to Alternative Fuel and Energy Technology Division (AFETD), there are two gas filling stations in operation; the gas filling station in Malampaya can serve 200 cars per day and the other one in Laguna can serve 50 cars per day. However, the construction of a gas filling station for NGV in NCR has not progressed because BatMan 1 pipeline has not been developed yet. The number of NGV which are scheduled for introduction in the Philippines are; 250 in year 2012, 1000 in 2015, 2500 in 2020 and 10,000 in 2030.
(d) Construction of a LNG terminal in the Batangas area
There has been no progress since 2002. According to DOE, the priority of this project is higher than that of the construction of a LNG terminal in Limay/Mariveles area on Bataan Peninsula. Due to the future supply constraints of Malaympaya gas field, it is expected to hasten construction of a LNG terminal in the Batangas area as an important natural gas supply source for BatMan 1 pipeline.
(e) Construction of an offshore pipeline from a LNG terminal in Bataan Peninsula to
NCR
There has been no progress in this project. It is the lowest priority project among the five projects. This project is expected to be realized after the LNG terminal in Limay/Mariveles area on Bataan Peninsula is constructed.
2.4.2 Necessity of Development of Natural Gas Infrastructure In the Philippines, it is expected to promote natural gas utilization actively. For this end, development of several pipelines, LNG terminals and CNG refueling stations are being planned. Among them, DOE positioned BatMan 1 pipeline from Batangas to NCR and LNG terminal which is scheduled to be constructed around Batangas as the highest-priority projects. Response to environmental issues is an important issue of energy policy in the Philippines. To promote natural gas shift toward the realization of a low-carbon society, it is important to promote the introduction of fuel conversion, cogeneration and communal central air-conditioning in industrial and business sectors, as well as development of natural gas fired power plants and acceleration of fuel conversion of the existing power plants in electricity sector. In addition, it is also important to promote the introduction of CNG bus by developing pipelines and CNG refilling station to connect pipelines.
2-28
A common way to promote natural gas shift in industrial and business sectors is to develop pipelines passing through industry and business accumulation areas and supply natural gas by pipelines. BatMan 1 passes through areas with the most accumulated industry and business and it is the most effective infrastructure. Natural gas supply by pipeline has advantages including realization of large-scale transportation, ensuring of security, environmental load reduction at the time of transportation and response to future hydrogen society as compared to other transportation means such as container lorry transportation.
Table 2.4-4 Effects of Natural Gas Pipeline
Effects Contents Effect in environmental aspect by realization of fuel conversion
Significant CO2 reduction can be expected if fuel conversion from other fossil fuel to natural gas is promoted by the development of natural gas supply infrastructure.
Effect by price reduction
In general, those who get supply of piped gas can purchase gas at lower price than those who don’t get supply of piped gas. (see the cases in Japan)
Economic Ripple Effect
There will be an economic ripple effect of production inducement and job creation associated with pipeline construction work in the region. In addition, expansion of related equipment market by the progress of fuel conversion, price reduction of equipment by introduction of industrial furnace and cogeneration and further high-efficiency by technology competition can be expected.
In the Philippines there is a Malampaya gas field. As it is pointed out the supply capacity of Malampaya gas field is limited, it is indispensable to import LNG in order to accelerate the shift to natural gas. LNG terminals are positioned as import infrastructure for that purpose. The development of LNG terminals in Luzon, especially in Batangas area is high-priority issue. It is for this reason that LNG terminals are positioned as important infrastructure. From Batangas to Manila, BatMan1 pipeline project is being planned. If Malampaya gas field is depleted in the future, it becomes possible to supply imported natural gas from LNG terminals to pipelines. Although it is pointed out that the current price formula of Malampaya gas field is advantageous to producers (Shell, Chevron), for the Philippines as consumer, price reduction due to competition between imported LNG and domestic gas in Malampaya can be expected. Regarding the formation of pipelines in Europe and the United States and East Asian countries including Japan, Korea and Taiwan, it takes on different forms depending on energy resources and situations of each country. In Europe, pipeline network for domestic distribution of gas has been developed mainly by national companies in a well-planned manner by public fund injection. In recent years, international pipelines for imported gas have been developed, which is supported by EU policy. In the United States, natural gas pipelines have been developed mainly by private companies. In Japan, LNG terminals have been set up in urban neighborhood. And along with the LNG terminals, pipelines for transportation and distribution have been developed. In Korea and Taiwan, LNG has been introduced later than Japan and natural gas pipelines have been developed mainly by national companies in a relatively short period of time in a well-planned manner. In the Philippines there is a domestic gas field (Malampaya gas field). BatMan 1 pipeline connecting the domestic gas field with metropolitan area is similar to the European pipelines from the perspective of pipeline formation process. In addition, LNG terminals are scheduled to be constructed based on an assumed depletion of Malampaya gas field. So in the future, the Philippines are likely to follow the situations in East Asian countries such as Japan, Korea and Taiwan.

2-29
With regard to implementing bodies, the Philippines has large expectations for private companies and PPP. However, the demand has not sufficiently manifested and it is uncertain how soon it will be manifested. With this in mind, JICA Team conducts careful consideration on implementing bodies in this study.

2-30
3-1
Chapter 3 Confirmation of Basic Information on Regulation and System for Environmental and Social Considerations
3.1 Regulations and System For Environmental and Social Considerations relevant to
This Project 3.1.1 Environment Impact Assessment (EIA) (1) Outline In the Philippines, all projects are required to submit necessary documents and acquire Environmental Compliance Certificate (ECC) or Certificate of Non-Coverage (CNC) from the final approver (Chief of Environmental Management Bureau etc.). By Philippines Environmental Impact Statement System (PEISS),projects are categorized into 5 groups as described in Table 3.1-1. In the Revised Procedural Manual(RPM)for DENR Administrative Order No. 30 series of 2003 (DAO 03-30)of Department of Environment and Natural Resources(DENR), Pipeline business is defined as Non-Environmentally Critical Projects(NECP) and belongs to Group Ⅱor Ⅲ. As for the project in the study, the rules of Group Ⅱ is applied, because the project area includes Environmental Critical Area(ECA).With regard to the LNG terminal construction project, although its impact on the environment is not expected to be as serious as that of the oil refinery or petrochemical industry since it belongs to the sector of natural gas storage, the rules of Group Ⅱshould be applicable to it just like the case of pipeline project since the project site is likely to be close to an environmentally critical area. In the case of a project of pipeline exceeding 25 km, or of LNG terminal with a storage capacity exceeding 5,000KL, it is required to submit Environmental Impact Statement(EIS) and acquire ECC . It should be approved by the director of Local EMB. The pipeline in the projects covered by the study is required to submit EIS and acquire ECC because it is more than 25 km in length. In the case of a project of pipeline less than 25 km in length, or of LNG terminal with a storage capacity less than 5,000KL, it is required to submit Initial Environmental Examination(IEE) Report(IEER)and acquire ECC2. It should be approved by the director of Local office of EMB3.
Table 3.1-1 Category Classification by Philippines Environmental Impact Statement System
Group Kinds of businesses and location implemented I All Environmentally Critical Projects (ECP)(regardless of locations implemented)
II Non-Environmentally Critical Projects (NECP) in Environmentally Critical Areas (ECA)
III NECP in Non-Environmentally Critical Areas (NECA)
IV Co-located Projects (Several business operators implement and manage business in a contiguous area. Economic zone and industrial park etc are included.)
V Other projects not listed in any of groups Source:Revised Procedural Manual for DAO 2003-30(2008) (2) Flowchart of EIA Process
2 Revised Procedural Manual for DENR Administrative Order No.30 Series of 2003 (DAO 03-30) ANNEX 2-1b 3 The pipeline in the projects covered by the study is under the jurisdiction of Region4A.
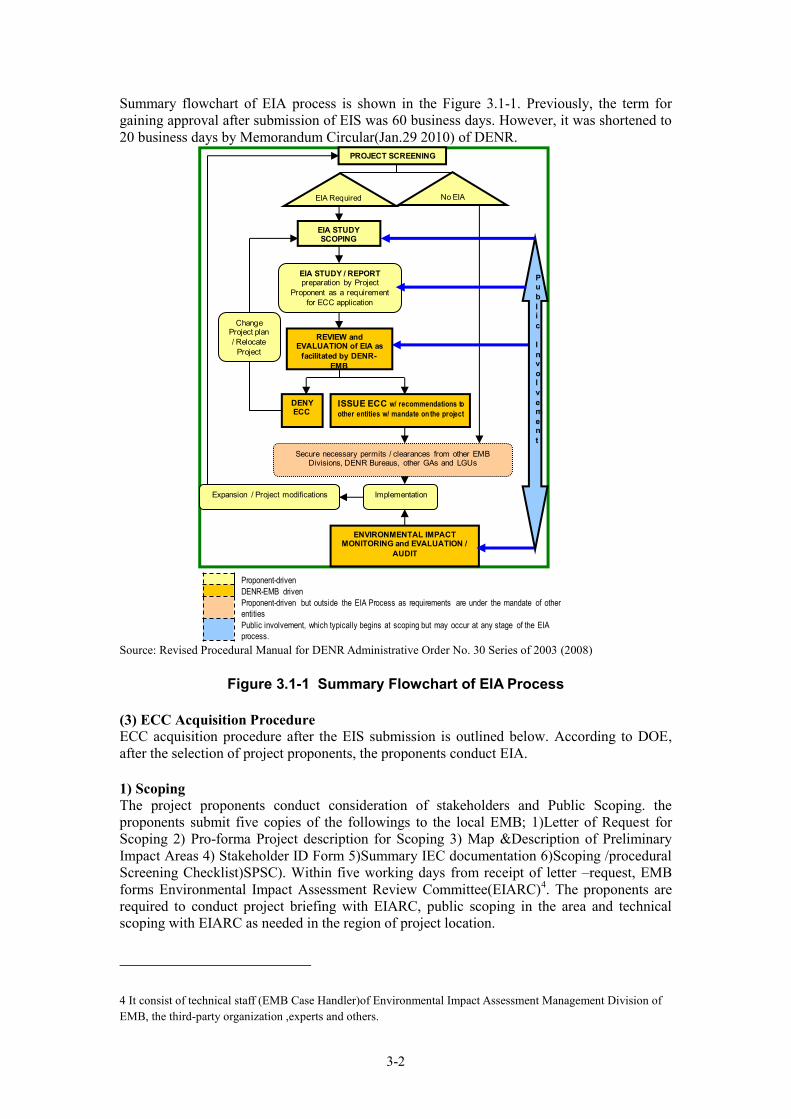
3-2
Summary flowchart of EIA process is shown in the Figure 3.1-1. Previously, the term for gaining approval after submission of EIS was 60 business days. However, it was shortened to 20 business days by Memorandum Circular(Jan.29 2010) of DENR.
PROJECT SCREENING
ENVIRONMENTAL IMPACT MONITORING and EVALUATION /
AUDIT
EIA STUDY SCOPING
REVIEW and EVALUATION of EIA as
facilitated by DENR-EMB
DENY ECC
ISSUE ECC w/ recommendations to
other entities w/ mandate on the project
EIA STUDY / REPORT preparation by Project
Proponent as a requirement for ECC application
Secure necessary permits / clearances from other EMB Divisions, DENR Bureaus, other GAs and LGUs
ImplementationExpansion / Project modifications
Change Project plan / Relocate
Project
Public
Involvement
EIA Required No EIA
Proponent-driven
DENR-EMB driven
Proponent-driven but outside the EIA Process as requirements are under the mandate of other
entities
Public involvement, which typically begins at scoping but may occur at any stage of the EIA
process. Source: Revised Procedural Manual for DENR Administrative Order No. 30 Series of 2003 (2008)
Figure 3.1-1 Summary Flowchart of EIA Process
(3) ECC Acquisition Procedure ECC acquisition procedure after the EIS submission is outlined below. According to DOE, after the selection of project proponents, the proponents conduct EIA. 1) Scoping The project proponents conduct consideration of stakeholders and Public Scoping. the proponents submit five copies of the followings to the local EMB; 1)Letter of Request for Scoping 2) Pro-forma Project description for Scoping 3) Map &Description of Preliminary Impact Areas 4) Stakeholder ID Form 5)Summary IEC documentation 6)Scoping /procedural Screening Checklist)SPSC). Within five working days from receipt of letter –request, EMB forms Environmental Impact Assessment Review Committee(EIARC)4. The proponents are required to conduct project briefing with EIARC, public scoping in the area and technical scoping with EIARC as needed in the region of project location. 4 It consist of technical staff (EMB Case Handler)of Environmental Impact Assessment Management Division of EMB, the third-party organization ,experts and others.
3-3
2) Preparation of EIS In cases where the local EMB approves the SPSC and determines the TOR of the EIA Study, the projects proponent conducts EIA Study based on the TOR and prepares the EIS. The proponent submits one copy of EIS and the SPSC to the local EMB. Within three days from receipt of the EIS, EMB checks the validity of the EIS. If conforming, the proponent is instructed to pay the filing fee. 3) Evaluation of EIS After the receipt of the filling fee by the proponent, EIARC and the resource person through a contract reviews the EIS. They submit the additional information(AI) Request to the proponent before or during the 1st Review Team Meeting. It is also required to hold Site Visit or Public Hearing(organized by EMB) . If the most of opponents are absent from the Public Hearing or if there is any request from stakeholders, it is required to hold Public Consultation.
The proponents are required to give the response to the AI by the 1st Review Team meeting or Public Hearing or Public Consultation within 15 working days. The proponents are required to explain about unresolved additional information at the 2nd or 3rd EIA Review Team Meeting which is held if necessary. After that EIARC prepares the report (within 15 working days after the latest EIA Review Team Meeting) and submit it to EMB. EMB official Review Process Report(RPR) and Recommendation Document to EIA and Management Division. EMB issues ECC after it is approved by EIA and Management Division. 4) Outline for EIS The outline for EIS is shown in Table 3.1-2. It consists of the chapters including Project Description, Analysis of key Environmental Impacts, Environmental Ecological Risk Assessment and Impact Management Plan.
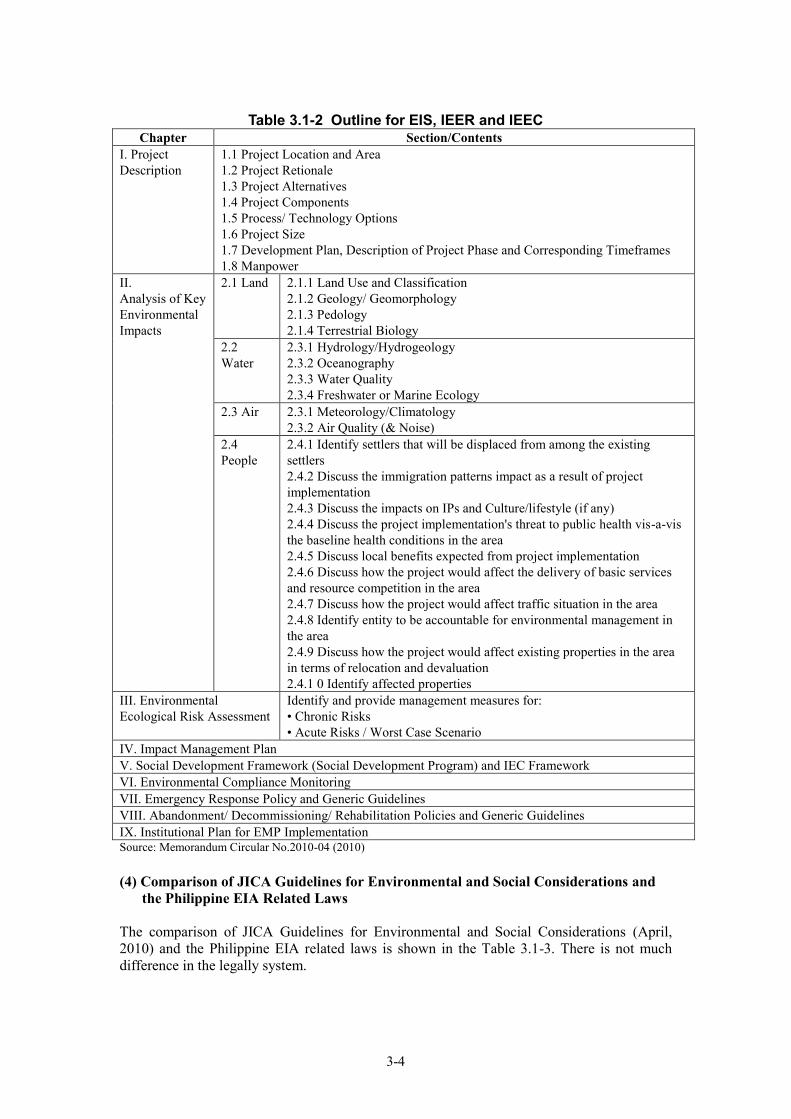
3-4
Table 3.1-2 Outline for EIS, IEER and IEEC
Chapter Section/Contents I. Project Description
1.1 Project Location and Area 1.2 Project Retionale 1.3 Project Alternatives 1.4 Project Components 1.5 Process/ Technology Options 1.6 Project Size 1.7 Development Plan, Description of Project Phase and Corresponding Timeframes 1.8 Manpower
II. Analysis of Key Environmental Impacts
2.1 Land 2.1.1 Land Use and Classification 2.1.2 Geology/ Geomorphology 2.1.3 Pedology 2.1.4 Terrestrial Biology
2.2 Water
2.3.1 Hydrology/Hydrogeology 2.3.2 Oceanography 2.3.3 Water Quality 2.3.4 Freshwater or Marine Ecology
2.3 Air 2.3.1 Meteorology/Climatology 2.3.2 Air Quality (& Noise)
2.4 People
2.4.1 Identify settlers that will be displaced from among the existing settlers 2.4.2 Discuss the immigration patterns impact as a result of project implementation 2.4.3 Discuss the impacts on IPs and Culture/lifestyle (if any) 2.4.4 Discuss the project implementation's threat to public health vis-a-vis the baseline health conditions in the area 2.4.5 Discuss local benefits expected from project implementation 2.4.6 Discuss how the project would affect the delivery of basic services and resource competition in the area 2.4.7 Discuss how the project would affect traffic situation in the area 2.4.8 Identify entity to be accountable for environmental management in the area 2.4.9 Discuss how the project would affect existing properties in the area in terms of relocation and devaluation 2.4.1 0 Identify affected properties
III. Environmental Ecological Risk Assessment
Identify and provide management measures for: • Chronic Risks • Acute Risks / Worst Case Scenario
IV. Impact Management Plan V. Social Development Framework (Social Development Program) and IEC Framework VI. Environmental Compliance Monitoring VII. Emergency Response Policy and Generic Guidelines VIII. Abandonment/ Decommissioning/ Rehabilitation Policies and Generic Guidelines IX. Institutional Plan for EMP Implementation Source: Memorandum Circular No.2010-04 (2010) (4) Comparison of JICA Guidelines for Environmental and Social Considerations and
the Philippine EIA Related Laws The comparison of JICA Guidelines for Environmental and Social Considerations (April, 2010) and the Philippine EIA related laws is shown in the Table 3.1-3. There is not much difference in the legally system.
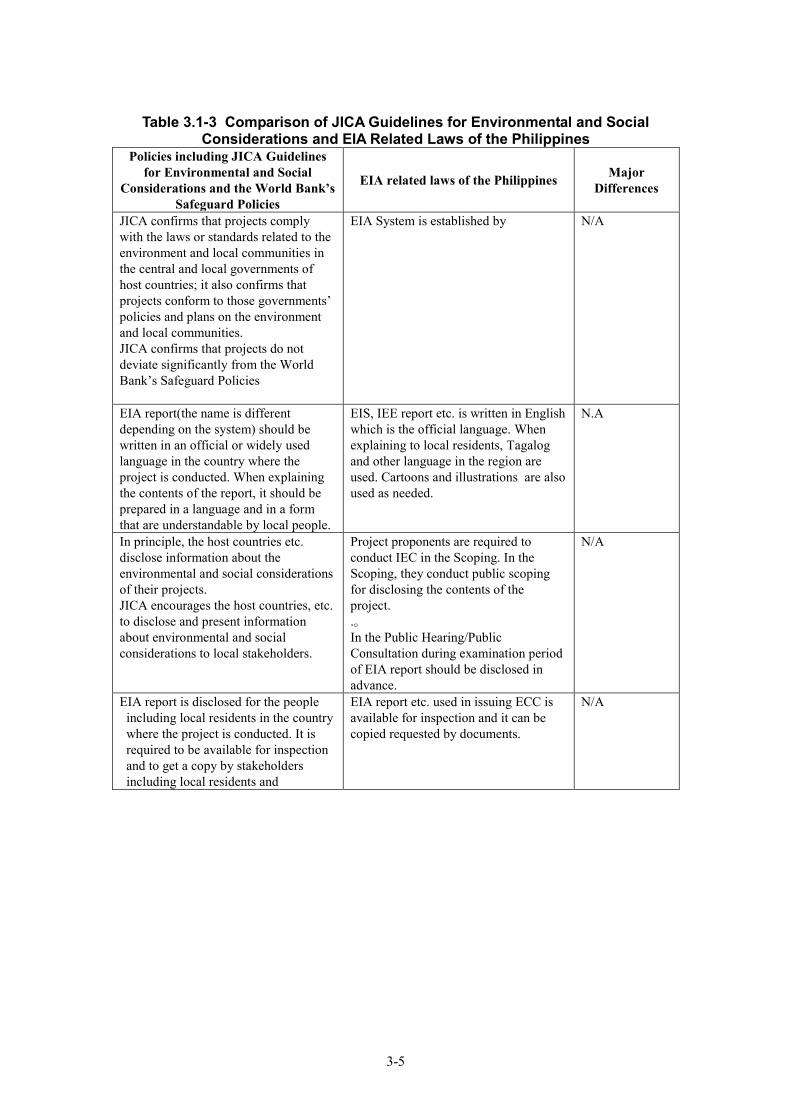
3-5
Table 3.1-3 Comparison of JICA Guidelines for Environmental and Social
Considerations and EIA Related Laws of the Philippines Policies including JICA Guidelines
for Environmental and Social Considerations and the World Bank’s
Safeguard Policies
EIA related laws of the Philippines Major Differences
JICA confirms that projects comply with the laws or standards related to the environment and local communities in the central and local governments of host countries; it also confirms that projects conform to those governments’ policies and plans on the environment and local communities. JICA confirms that projects do not deviate significantly from the World Bank’s Safeguard Policies
EIA System is established by N/A
EIA report(the name is different depending on the system) should be written in an official or widely used language in the country where the project is conducted. When explaining the contents of the report, it should be prepared in a language and in a form that are understandable by local people.
EIS, IEE report etc. is written in English which is the official language. When explaining to local residents, Tagalog and other language in the region are used. Cartoons and illustrations are also used as needed.
N.A
In principle, the host countries etc. disclose information about the environmental and social considerations of their projects. JICA encourages the host countries, etc. to disclose and present information about environmental and social considerations to local stakeholders.
Project proponents are required to conduct IEC in the Scoping. In the Scoping, they conduct public scoping for disclosing the contents of the project. .。 In the Public Hearing/Public Consultation during examination period of EIA report should be disclosed in advance.
N/A
EIA report is disclosed for the people including local residents in the country where the project is conducted. It is required to be available for inspection and to get a copy by stakeholders including local residents and
EIA report etc. used in issuing ECC is available for inspection and it can be copied requested by documents.
N/A
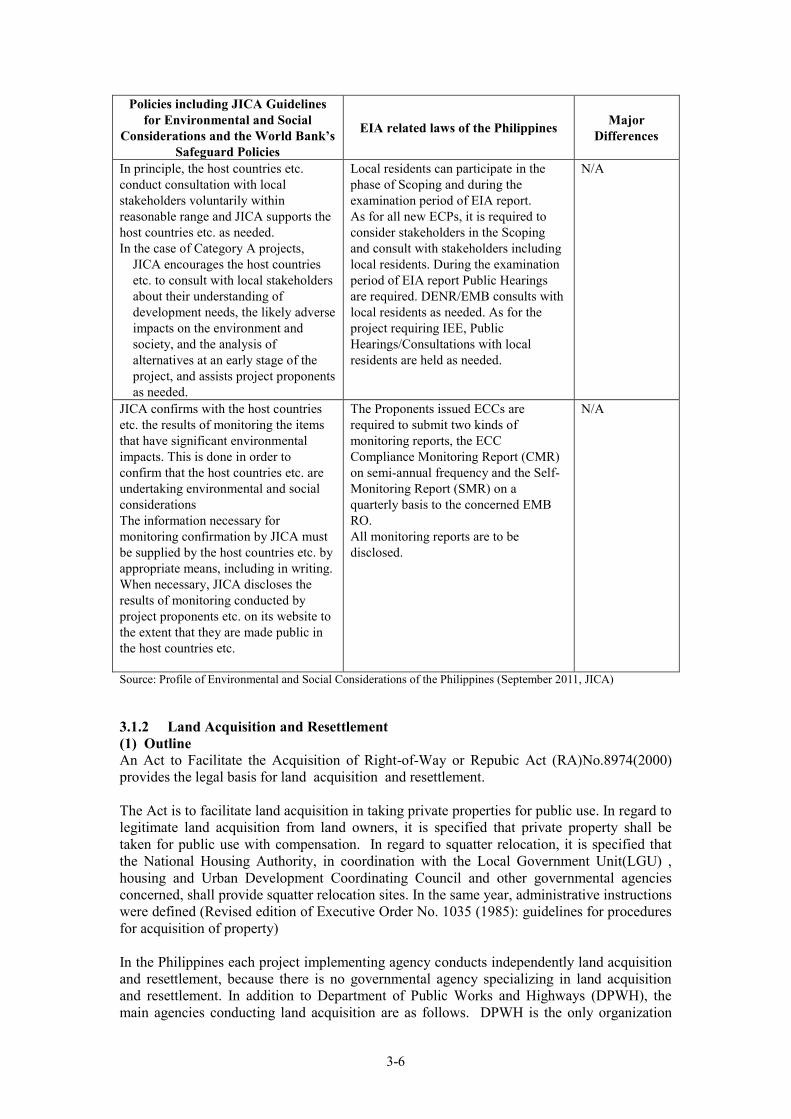
3-6
Policies including JICA Guidelines for Environmental and Social
Considerations and the World Bank’s Safeguard Policies
EIA related laws of the Philippines Major Differences
In principle, the host countries etc. conduct consultation with local stakeholders voluntarily within reasonable range and JICA supports the host countries etc. as needed. In the case of Category A projects,
JICA encourages the host countries etc. to consult with local stakeholders about their understanding of development needs, the likely adverse impacts on the environment and society, and the analysis of alternatives at an early stage of the project, and assists project proponents as needed.
Local residents can participate in the phase of Scoping and during the examination period of EIA report. As for all new ECPs, it is required to consider stakeholders in the Scoping and consult with stakeholders including local residents. During the examination period of EIA report Public Hearings are required. DENR/EMB consults with local residents as needed. As for the project requiring IEE, Public Hearings/Consultations with local residents are held as needed.
N/A
JICA confirms with the host countries etc. the results of monitoring the items that have significant environmental impacts. This is done in order to confirm that the host countries etc. are undertaking environmental and social considerations The information necessary for monitoring confirmation by JICA must be supplied by the host countries etc. by appropriate means, including in writing. When necessary, JICA discloses the results of monitoring conducted by project proponents etc. on its website to the extent that they are made public in the host countries etc.
The Proponents issued ECCs are required to submit two kinds of monitoring reports, the ECC Compliance Monitoring Report (CMR) on semi-annual frequency and the Self-Monitoring Report (SMR) on a quarterly basis to the concerned EMB RO. All monitoring reports are to be disclosed.
N/A
Source: Profile of Environmental and Social Considerations of the Philippines (September 2011, JICA)
3.1.2 Land Acquisition and Resettlement (1) Outline An Act to Facilitate the Acquisition of Right-of-Way or Repubic Act (RA)No.8974(2000) provides the legal basis for land acquisition and resettlement. The Act is to facilitate land acquisition in taking private properties for public use. In regard to legitimate land acquisition from land owners, it is specified that private property shall be taken for public use with compensation. In regard to squatter relocation, it is specified that the National Housing Authority, in coordination with the Local Government Unit(LGU) , housing and Urban Development Coordinating Council and other governmental agencies concerned, shall provide squatter relocation sites. In the same year, administrative instructions were defined (Revised edition of Executive Order No. 1035 (1985): guidelines for procedures for acquisition of property) In the Philippines each project implementing agency conducts independently land acquisition and resettlement, because there is no governmental agency specializing in land acquisition and resettlement. In addition to Department of Public Works and Highways (DPWH), the main agencies conducting land acquisition are as follows. DPWH is the only organization
3-7
that specified the procedures for land acquisition and resettlement. The agencies except for DPWH conduct land acquisition and resettlement in accordance with the procedures of DPWH and guidelines of financing institutions.
National Housing Authority (NHA) National Power Corporation (NAPOCOR) Transmission Corporation (TRANSCO) National Irrigation Administration(NIA) Department of Agrarian Reform (DAR)
(2) Details of Major Laws Relevant to Land Acquisition and Involuntary Resettlement Some of the details of major laws relevant to land acquisition and involuntary resettlement are summarized as follows: 1) “An Act to Facilitate the Acquisition of Right-of-Way, 2000” The policy and measures to facilitate the acquisition of right-of-way for public purpose are stipulated in the document of “An Act to Facilitate the Acquisition of Right-of-Way, 2000” as explained below: Project operator should first of all confirm with the land owner regarding his (her)
intention of whether to convey the land or not. On the occasion that the land owner refuse to convey the land, the project operator
should offer the amount of compensation worked out based on the Zonal Value 5decided by the Bureau of Internal Revenue (BIR) so as to start negotiation with the land owner.
If the land owner refuse to accept the offer based on BIR terms, the project operator
should negotiate with the land owner by offering the amount of compensation based on the price not higher than the appropriate market rate. The project operator can ask a government or private financial institution to figure out the appropriate market rate. The period of negotiation can be possibly prolonged to a maximum extent of 15 days.
If the land owner still does not agree with the amount offered, the project operator
should apply to the Court for arbitrament. The Court should work out the amount of compensation within 60 days for the project operator to pay the land owner so as to settle the deal.
2) “Infrastructure Right-of-Way (IROW) Procedural Manual (2003)” The IROW Procedural Manual formulated by DPWH in 2003 consists of the following items regarding the procedure of land acquisition for public purpose: Implementation of the Percellary Survey and Formulation of the Report Preparation of Land Acquisition Plan and Resettlement Action Plan (LAPRAP)
IROW Acquisition Through Purchase
Expropriation Proceedings
5Zonal Value is calculated based on the past record of land selling prices, which is different from the meaning of
Replacement Cost defined by the World Bank in its OP4.12.
3-8
3) Laws Relevant to the Issue of Resettlement of Squatters The treatment regarding squatters is required to follow the stipulations by Act No. 7279, which forbids the practice of forcing the deforciants to resettle without providing them alternative place for resettlement. The provision of alternative place of resettlement should mainly be the responsibility of local governments, while the government institutions of National Housing Authority (NHA) and Housing and Urban Development Coordinating Council (HUDCC) should give them support. 4) Title Holders of Compensation Under the IROW Procedural Manual (2003), the determination of the title holders of compensation, that is Project Affected Persons (PAPs), and improvements shall be based on the cutoff date, which is the start of the census of PAPs and tagging for improvements. As for squatter, the person who meets the following conditions are subject to relocation (as
beneficiaries of the RA 7279).
a. Filipino citizen b. The person whose income or combined household income falls within the poverty
threshold c. The person who do not own housing facilities
The person who are not the professional squatter and/or the member of the squatter syndicate
3.1.3 Indigenous peoples (1) Definition of Indigenous People and Its Distribution in the Philippines The Philippines is said to be the only country in Asia which clearly recognizes the existence of “indigenous people”6. In the Philippines, “The Indigenous Peoples Rights Act of 1997” specifies indigenous peoples(IPs) and indigenous cultural communities(ICCs) as follows (Article 3-h in Section 2 in Chapter 2) . Indigenous Cultural Communities/Indigenous Peoples - refer to a group of people or homogenous societies identified by self-ascription and ascription by other, who have continuously lived as organized community on communally bounded and defined territory, and who have, under claims of ownership since time immemorial, occupied, possessed customs, tradition and other distinctive cultural traits, or who have, through resistance to political, social and cultural inroads of colonization, non-indigenous religions and culture, became historically differentiated from the majority of Filipinos. There is no exact statistics of population distribution of IPs. National Commision on Indigenous Peoples (NCIP) estimates the IPs population as 14,183,809. 62.6% lives in Mindanao, 35.9% lives in Luzon and 1.4% lives in Visayas(see table 3.1-4. It is calculated by NCIP based on an unofficial statistics and IPs account for more than 20 % of the entire population.
6 Raja Devasish Roy of Minority Rights Group International (MRG), “Traditional Customary Laws and
Indigenous Peoples in Asia” (2005)
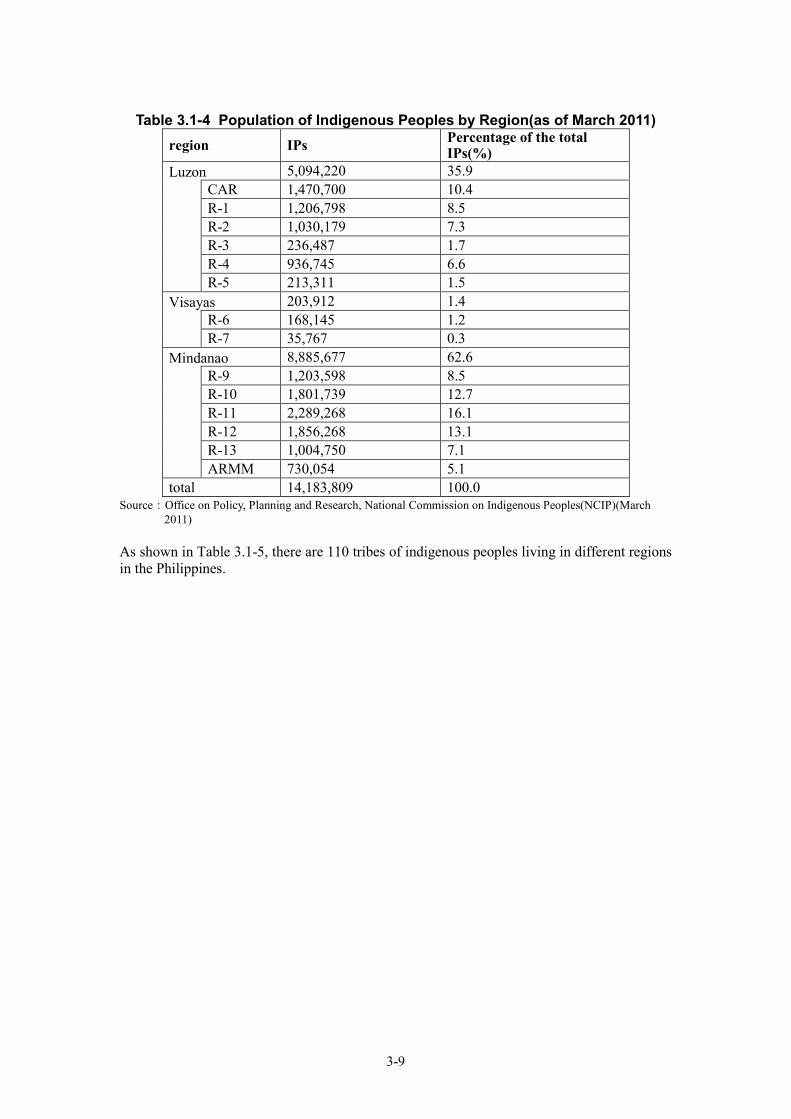
3-9
Table 3.1-4 Population of Indigenous Peoples by Region(as of March 2011)
region IPs Percentage of the total IPs(%)
Luzon 5,094,220 35.9 CAR 1,470,700 10.4 R-1 1,206,798 8.5 R-2 1,030,179 7.3 R-3 236,487 1.7 R-4 936,745 6.6 R-5 213,311 1.5 Visayas 203,912 1.4 R-6 168,145 1.2 R-7 35,767 0.3 Mindanao 8,885,677 62.6 R-9 1,203,598 8.5 R-10 1,801,739 12.7 R-11 2,289,268 16.1 R-12 1,856,268 13.1 R-13 1,004,750 7.1 ARMM 730,054 5.1 total 14,183,809 100.0
Source:Office on Policy, Planning and Research, National Commission on Indigenous Peoples(NCIP)(March 2011)
As shown in Table 3.1-5, there are 110 tribes of indigenous peoples living in different regions in the Philippines.

3-10
Table 3.1-5 110 Tribes of Indigenous Peoples in the Philippines (as of March
2011) 1 Abelling/Aborlin 38 Dumagat 75 Mabaca 2 Abiyan 39 Eskaya 76 Malaueg 3 Adesen 40 Gaddang 77 Magahat/Corolanos 4 Aeta 41 Giangan 78 Manobo 5 Agta 42 Gubang 79 Manobo-Blit 6 Agta-Cimaron 43 Gubanon (Mangyan) 80 Mangguangan 7 Agta-Tabangnon 44 Guiangan-Clata 81 Mamanwa 8 Agutayon 45 Hanunuo (Mangyan) 82 Mansaka 9 Alangan (Mangyan) 46 Hanglulo 83 Matisalog 10 Applai 47 Higaonon 84 Mandaya 11 ata-Matisalog 48 Itneg 85 Molbog 12 Ati 49 Inlaud 86 Pullon 13 Arumanen 50 Inbaloi 87 Palawanon 14 Ayangan 51 Ibanag 88 Remontado 15 Binongan 52 Itwanes 89 Ratagnon (Mangyan) 16 Bago 53 Ikalahan 90 Sulod 17 Bangon (Mangyan) 54 Ilianen 91 Sama (Badjao) 18 Bontok 55 Isinai 92 Sama/Samal 19 Balatoc 56 Isneg/Apayao 93 Sama/Kalibugan 20 Baliwen 57 Iwak 94 Subanen 21 Bulaga 58 Iraya (Mangyan) 95 Sangil 22 Batak 59 Itnom 96 Tadyawan (Mangyan) 23 Batangan/Tao Buid 60 Ilongot/Bungkalot 97 Tagabawa 24 Buhid (mangyan) 61 Ivatan 98 Tagbanwa 25 Balangao 62 Kirintenken 99 Tagakaolo 26 Bantoanon 63 Kalinga 100 Talaandig 27 Bukidnon 64 Kankanaey 101 Talaingod 28 Badjao 65 Kalanguya 102 T'Boli 29 Banac 66 Kalibugan 103 Tao't Bato 30 B'laan 67 Kabihug 104 Tasaday 31 Bagobo 68 Kalagan 105 Tigwayanon 32 Bunwaon 69 Karao 106 Tingguian 33 Calinga 70 Kaylawan 107 Tiruray/Tenduray 34 Camiguin 71 Kongking 108 Tuwali 35 Coyonon 72 Langilan 109 Ubo 36 Danao 73 Masadiit 110 Umayamnon 37 Dibabawon 74 Maeng Source:Office on Policy, Planning and Research, National Commission on Indigenous Peoples(NCIP)(March
2011) (2) Considerations for Indigenous People in Issues of Land Acquisition and Resettlement With respect to its relations with this project, the issue of indigenous people consideration in terms of land acquisition and involuntary resettlement mentioned above is of particular importance. In this regard, the “Land Acquisition, Resettlement, Recovery and Indigenous People Policy”(LARRIP Policy; 3rd edition, 2007)gives explanation of the required procedures regarding projects having potential impact on indigenous people. Here, it is made a prerequisite during the stage of project formulation to go all out to prevent the project from impacting the indigenous people especially in the case where there is the possibility of
3-11
involuntary resettlement. Regarding those projects with evidently negative impact on indigenous people as identified by social assessment, the preparation of an Indigenous Peoples Action Plan (IPAP)is compulsory. a) Land acquisition inside Ancestral Domain In the event land (including structures, improvements, crops, trees, and perennials) is to be acquired inside an ancestral domain, the DPWH and its agents shall obtain the Free and Prior Informed Consent (FPIC) 7of the affected ICC/IPs. Land Acquisition without Resettlement
If passage through, and hence damage to and/or partial or total relocation of religious and cultural properties is unavoidable, this should be presented to the ICC/IPs in the Consultative Community Assembly (CCA) or First Meeting whichever is applicable and obtained the FPIC of the affected ICC/IPs. The restriction involved by the project and its mitigation measures will also be disclosed by the project proponent to the affected ICC/IPs and include as part of the Memorandum of Agreement (MOA). The MOA with the additions written above shall serve as the Indigenous Peoples’ Action Plan (IPAP).
Land Acquisition with Removal and Resettlement
Following their customary law, the ICCs/IPs will be consulted regarding the resettlement site. The project affected families will be resettled as much as possible within their ancestral domain. When the resettlement site is outside the affected ancestral domain, the IPs will be consulted regarding the choice of resettlement site. The project proponent in cooperation with the relevant government agencies shall ensure that the resettlement site is of equivalent productive potential and spatial advantages, e.g. providing the same degree of access to resources and to public and privately provided services and protection. Barring this, the Resettlement Action Plan (RAP) as well as MOA should include measures to mitigate the lack of access to natural resources, basic services, and to cultural and religious sites. The MOA with additions written above shall served as the Indigenous Peoples’ Action Plan (IPAP)
b) Land Acquisition Affected IPs Outside Ancestral Domain FPIC procedure is not required if the affected ICCs/IPs are outside of Ancestral Domain. However regardless of the impact, the project proponent will conduct a separate, meeting with the ICCs/IPs to disclose the project contents and adverse impact and to obtain their broad support for the project. If the project requires resettlement and the affected IPs were migrants in the place and would have to be resettled, the project proponent can represent the option of returning to their place origin. If this option were chosen, the project proponent with the NCIP will prepare the hosting community. If the place of origin and re-settlement of the affected ICCs/IPs were an ancestral domain or an area with a pending application to be declared such, the FPIC of the receiving ICCs/IPs would be obtained first following the FPIC Guidelines of 2006.
7 NCIP Administrative Order No,1, series of 2006
3-12
3.2 Environmental and Social Considerations Regarding the Pipeline Project 3.2.1 Current State of EIS Preparation and ECC Acquisition So far, EIS regarding this project has not been prepared, and ECC has not been acquired. As the tasks of the next step, it is necessary to organize the basic data needed for the drafting of EIS, followed by the formulation of EIS and the acquisition of ECC. Moreover, completion of the Environment Checklist required by JICA and the Scoping required by the Philippines government before the fulfillment of EIS formulation and ECC acquisition is also necessary. With respect to the pipeline project, the relevant JICA Environment Checklist and the document of Scoping are to be prepared as follows. (1) Environmental Checklist in JICA Guidelines for Environmental and Social
Considerations In the JICA JICA Guidelines for Environmental and Social Considerations pipeline is distributed into Category A. When utilizing yen loans in pipeline projects, it is required to receive advice on support and confirmation of environmental and social considerations from Advisory Council of Environmental and Social Considerations. Environmental checklist of pipeline projects is shown in Table 3.2-1. The checklist consists of the following items; permits and explanations, pollution control, natural environment, social environment and others. (2) Draft of the Scoping Document The draft of scoping is shown in the table 3.2-2. It is needed to consider measures for pollution control under construction and impact on the social environment.
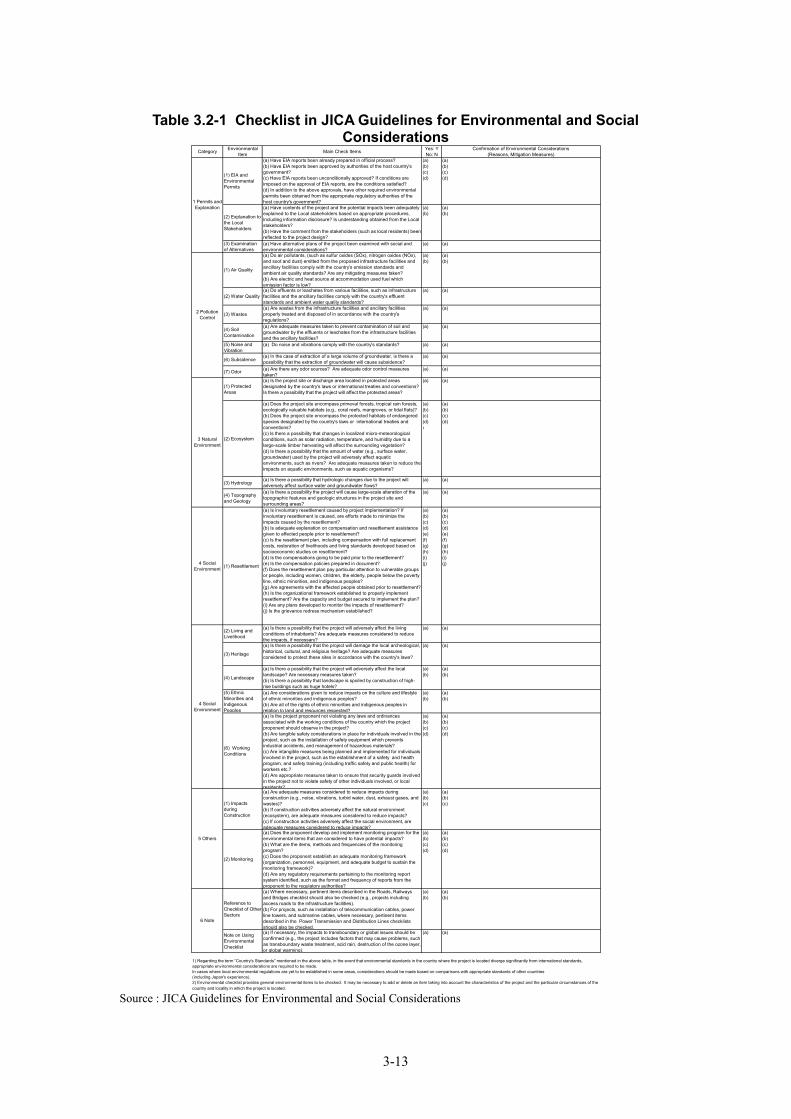
3-13
Table 3.2-1 Checklist in JICA Guidelines for Environmental and Social
Considerations Category Environmental
Item Main Check Items Yes: YNo: N
Confirmation of Environmental Considerations(Reasons, Mitigation Measures)
(1) EIA andEnvironmentalPermits
(a) Have EIA reports been already prepared in official process?(b) Have EIA reports been approved by authorities of the host country'sgovernment?(c) Have EIA reports been unconditionally approved? If conditions areimposed on the approval of EIA reports, are the conditions satisfied?(d) In addition to the above approvals, have other required environmentalpermits been obtained from the appropriate regulatory authorities of thehost country's government?
(a)(b)(c)(d)
(a)(b)(c)(d)
(2) Explanation tothe LocalStakeholders
(a) Have contents of the project and the potential impacts been adequatelyexplained to the Local stakeholders based on appropriate procedures,including information disclosure? Is understanding obtained from the Localstakeholders?(b) Have the comment from the stakeholders (such as local residents) beenreflected to the project design?
(a)(b)
(a)(b)
(3) Examinationof Alternatives
(a) Have alternative plans of the project been examined with social andenvironmental considerations?
(a) (a)
(1) Air Quality
(a) Do air pollutants, (such as sulfur oxides (SOx), nitrogen oxides (NOx),and soot and dust) emitted from the proposed infrastructure facilities andancillary facilities comply with the country's emission standards andambient air quality standards? Are any mitigating measures taken?(b) Are electric and heat source at accommodation used fuel whichemission factor is low?
(a)(b)
(a)(b)
(2) Water Quality(a) Do effluents or leachates from various facilities, such as infrastructurefacilities and the ancillary facilities comply with the country's effluentstandards and ambient water quality standards?
(a) (a)
(3) Wastes(a) Are wastes from the infrastructure facilities and ancillary facilitiesproperly treated and disposed of in accordance with the country'sregulations?
(a) (a)
(4) SoilContamination
(a) Are adequate measures taken to prevent contamination of soil andgroundwater by the effluents or leachates from the infrastructure facilitiesand the ancillary facilities?
(a) (a)
(5) Noise andVibration
(a) Do noise and vibrations comply with the country's standards? (a) (a)
(6) Subsidence(a) In the case of extraction of a large volume of groundwater, is there apossibility that the extraction of groundwater will cause subsidence?
(a) (a)
(7) Odor (a) Are there any odor sources? Are adequate odor control measurestaken?
(a) (a)
(1) ProtectedAreas
(a) Is the project site or discharge area located in protected areasdesignated by the country's laws or international treaties and conventions?Is there a possibility that the project will affect the protected areas?
(a) (a)
(2) Ecosystem
(a) Does the project site encompass primeval forests, tropical rain forests,ecologically valuable habitats (e.g., coral reefs, mangroves, or tidal flats)?(b) Does the project site encompass the protected habitats of endangeredspecies designated by the country's laws or international treaties andconventions?(c) Is there a possibility that changes in localized micro-meteorologicalconditions, such as solar radiation, temperature, and humidity due to alarge-scale timber harvesting will affect the surrounding vegetation?(d) Is there a possibility that the amount of water (e.g., surface water,groundwater) used by the project will adversely affect aquaticenvironments, such as rivers? Are adequate measures taken to reduce theimpacts on aquatic environments, such as aquatic organisms?
(a)(b)(c)(d)ı
(a)(b)(c)(d)
(3) Hydrology(a) Is there a possibility that hydrologic changes due to the project willadversely affect surface water and groundwater flows?
(a) (a)
(4) Topographyand Geology
(a) Is there a possibility the project will cause large-scale alteration of thetopographic features and geologic structures in the project site andsurrounding areas?
(a) (a)
4 SocialEnvironment (1) Resettlement
(a) Is involuntary resettlement caused by project implementation? Ifinvoluntary resettlement is caused, are efforts made to minimize theimpacts caused by the resettlement?(b) Is adequate explanation on compensation and resettlement assistancegiven to affected people prior to resettlement?(c) Is the resettlement plan, including compensation with full replacementcosts, restoration of livelihoods and living standards developed based onsocioeconomic studies on resettlement?(d) Is the compensations going to be paid prior to the resettlement?(e) Is the compensation policies prepared in document?(f) Does the resettlement plan pay particular attention to vulnerable groupsor people, including women, children, the elderly, people below the povertyline, ethnic minorities, and indigenous peoples?(g) Are agreements with the affected people obtained prior to resettlement?(h) Is the organizational framework established to properly implementresettlement? Are the capacity and budget secured to implement the plan?(i) Are any plans developed to monitor the impacts of resettlement?(j) Is the grievance redress mechanism established?
(a)(b)(c)(d)(e)(f)(g)(h)(i)(j)
(a)(b)(c)(d)(e)(f)(g)(h)(i)(j)
(2) Living andLivelihood
(a) Is there a possibility that the project will adversely affect the livingconditions of inhabitants? Are adequate measures considered to reducethe impacts, if necessary?
(a) (a)
(3) Heritage
(a) Is there a possibility that the project will damage the local archeological,historical, cultural, and religious heritage? Are adequate measuresconsidered to protect these sites in accordance with the country's laws?
(a) (a)
(4) Landscape
(a) Is there a possibility that the project will adversely affect the locallandscape? Are necessary measures taken?(b) Is there a possibility that landscape is spoiled by construction of high-rise buildings such as huge hotels?
(a)(b)
(a)(b)
(5) EthnicMinorities andIndigenousPeoples
(a) Are considerations given to reduce impacts on the culture and lifestyleof ethnic minorities and indigenous peoples?(b) Are all of the rights of ethnic minorities and indigenous peoples inrelation to land and resources respected?
(a)(b)
(a)(b)
(6) WorkingConditions
(a) Is the project proponent not violating any laws and ordinancesassociated with the working conditions of the country which the projectproponent should observe in the project?(b) Are tangible safety considerations in place for individuals involved in theproject, such as the installation of safety equipment which preventsindustrial accidents, and management of hazardous materials?(c) Are intangible measures being planned and implemented for individualsinvolved in the project, such as the establishment of a safety and healthprogram, and safety training (including traffic safety and public health) forworkers etc.?(d) Are appropriate measures taken to ensure that security guards involvedin the project not to violate safety of other individuals involved, or localresidents?
(a)(b)(c)(d)
(a)(b)(c)(d)
(1) ImpactsduringConstruction
(a) Are adequate measures considered to reduce impacts duringconstruction (e.g., noise, vibrations, turbid water, dust, exhaust gases, andwastes)?(b) If construction activities adversely affect the natural environment(ecosystem), are adequate measures considered to reduce impacts?(c) If construction activities adversely affect the social environment, areadequate measures considered to reduce impacts?
(a)(b)(c)
(a)(b)(c)
(2) Monitoring
(a) Does the proponent develop and implement monitoring program for theenvironmental items that are considered to have potential impacts?(b) What are the items, methods and frequencies of the monitoringprogram?(c) Does the proponent establish an adequate monitoring framework(organization, personnel, equipment, and adequate budget to sustain themonitoring framework)?(d) Are any regulatory requirements pertaining to the monitoring reportsystem identified, such as the format and frequency of reports from theproponent to the regulatory authorities?
(a)(b)(c)(d)
(a)(b)(c)(d)
Reference toChecklist of OtherSectors
(a) Where necessary, pertinent items described in the Roads, Railwaysand Bridges checklist should also be checked (e.g., projects includingaccess roads to the infrastructure facilities).(b) For projects, such as installation of telecommunication cables, powerline towers, and submarine cables, where necessary, pertinent itemsdescribed in the Power Transmission and Distribution Lines checklistsshould also be checked.
(a)(b)
(a)(b)
Note on UsingEnvironmentalChecklist
(a) If necessary, the impacts to transboundary or global issues should beconfirmed (e.g., the project includes factors that may cause problems, suchas transboundary waste treatment, acid rain, destruction of the ozone layer,or global warming).
(a) (a)
1) Regarding the term “Country's Standards” mentioned in the above table, in the event that environmental standards in the country where the project is located diverge significantly from international standards,appropriate environmental considerations are required to be made. In cases where local environmental regulations are yet to be established in some areas, considerations should be made based on comparisons with appropriate standards of other countries(including Japan's experience).2) Environmental checklist provides general environmental items to be checked. It may be necessary to add or delete an item taking into account the characteristics of the project and the particular circumstances of thecountry and locality in which the project is located.
2 PollutionControl
1 Permits andExplanation
6 Note
4 SocialEnvironment
5 Others
3 NaturalEnvironment
Source : JICA Guidelines for Environmental and Social Considerations
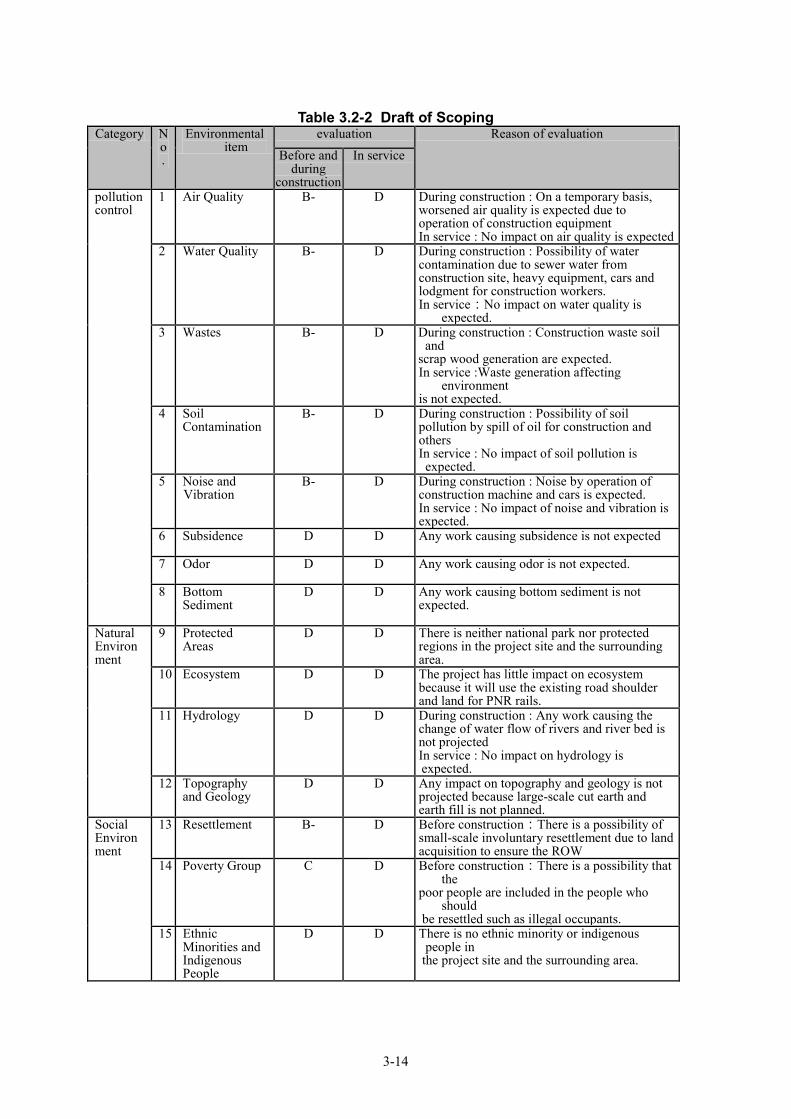
3-14
Table 3.2-2 Draft of Scoping Category N
o.
Environmental item
evaluation Reason of evaluation Before and
during construction
In service
pollution control
1 Air Quality
B- D During construction : On a temporary basis, worsened air quality is expected due to operation of construction equipment In service : No impact on air quality is expected
2 Water Quality B- D During construction : Possibility of water contamination due to sewer water from construction site, heavy equipment, cars and lodgment for construction workers. In service:No impact on water quality is
expected. 3 Wastes
B- D During construction : Construction waste soil
and scrap wood generation are expected. In service :Waste generation affecting
environment is not expected.
4 Soil Contamination
B- D During construction : Possibility of soil pollution by spill of oil for construction and others In service : No impact of soil pollution is expected.
5 Noise and Vibration
B- D During construction : Noise by operation of construction machine and cars is expected. In service : No impact of noise and vibration is expected.
6 Subsidence
D D Any work causing subsidence is not expected
7 Odor
D D Any work causing odor is not expected.
8 Bottom Sediment
D D Any work causing bottom sediment is not expected.
Natural Environment
9 Protected Areas
D D There is neither national park nor protected regions in the project site and the surrounding area.
10 Ecosystem
D D The project has little impact on ecosystem because it will use the existing road shoulder and land for PNR rails.
11 Hydrology
D D During construction : Any work causing the change of water flow of rivers and river bed is not projected In service : No impact on hydrology is expected.
12 Topography and Geology
D D Any impact on topography and geology is not projected because large-scale cut earth and earth fill is not planned.
Social Environment
13 Resettlement
B- D Before construction:There is a possibility of small-scale involuntary resettlement due to land acquisition to ensure the ROW
14 Poverty Group C D Before construction:There is a possibility that the
poor people are included in the people who should
be resettled such as illegal occupants. 15 Ethnic
Minorities and Indigenous People
D D There is no ethnic minority or indigenous people in
the project site and the surrounding area.
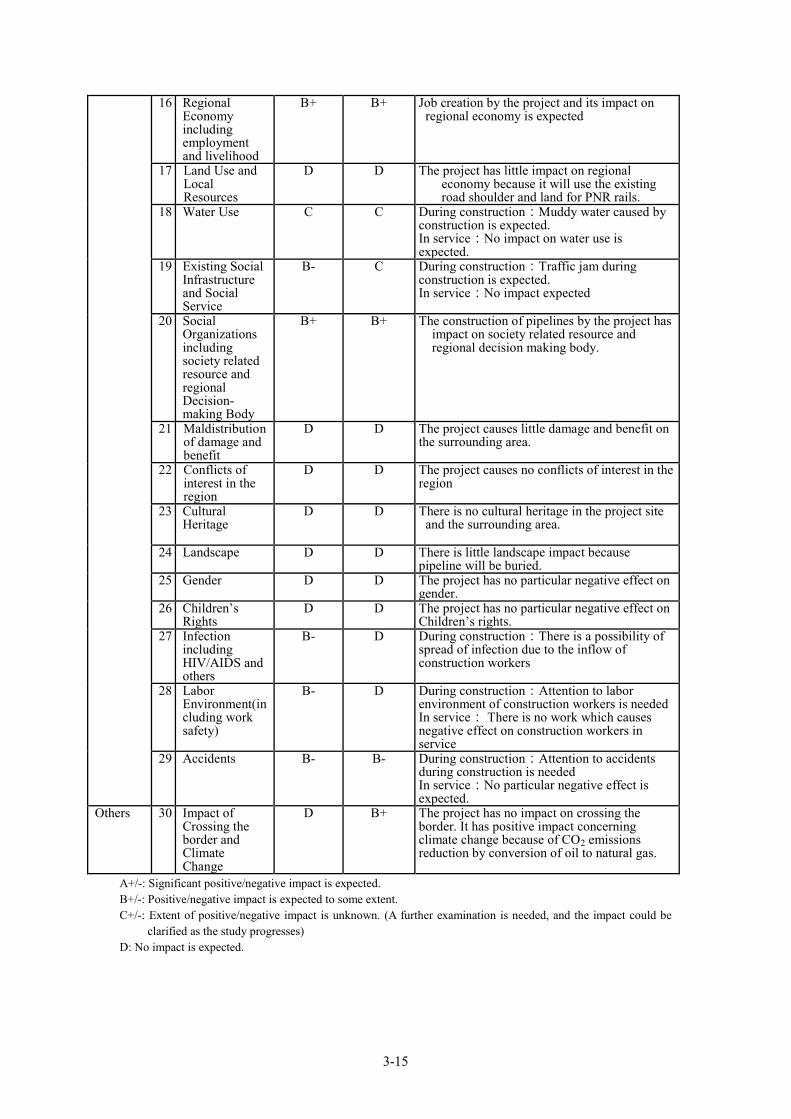
3-15
16 Regional Economy including employment and livelihood
B+ B+ Job creation by the project and its impact on regional economy is expected
17 Land Use and Local Resources
D D The project has little impact on regional economy because it will use the existing road shoulder and land for PNR rails.
18 Water Use C C During construction:Muddy water caused by construction is expected. In service:No impact on water use is expected.
19 Existing Social Infrastructure and Social Service
B- C During construction:Traffic jam during construction is expected. In service:No impact expected
20 Social Organizations including society related resource and regional Decision-making Body
B+ B+ The construction of pipelines by the project has impact on society related resource and regional decision making body.
21 Maldistribution of damage and benefit
D D The project causes little damage and benefit on the surrounding area.
22 Conflicts of interest in the region
D D The project causes no conflicts of interest in the region
23 Cultural Heritage
D D There is no cultural heritage in the project site and the surrounding area.
24 Landscape
D D There is little landscape impact because pipeline will be buried.
25 Gender D D The project has no particular negative effect on gender.
26 Children’s Rights
D D The project has no particular negative effect on Children’s rights.
27 Infection including HIV/AIDS and others
B- D During construction:There is a possibility of spread of infection due to the inflow of construction workers
28 Labor Environment(including work safety)
B- D During construction:Attention to labor environment of construction workers is needed In service: There is no work which causes negative effect on construction workers in service
29 Accidents B- B- During construction:Attention to accidents during construction is needed In service:No particular negative effect is expected.
Others 30 Impact of Crossing the border and Climate Change
D B+ The project has no impact on crossing the border. It has positive impact concerning climate change because of CO2 emissions reduction by conversion of oil to natural gas.
A+/-: Significant positive/negative impact is expected. B+/-: Positive/negative impact is expected to some extent. C+/-: Extent of positive/negative impact is unknown. (A further examination is needed, and the impact could be
clarified as the study progresses) D: No impact is expected.
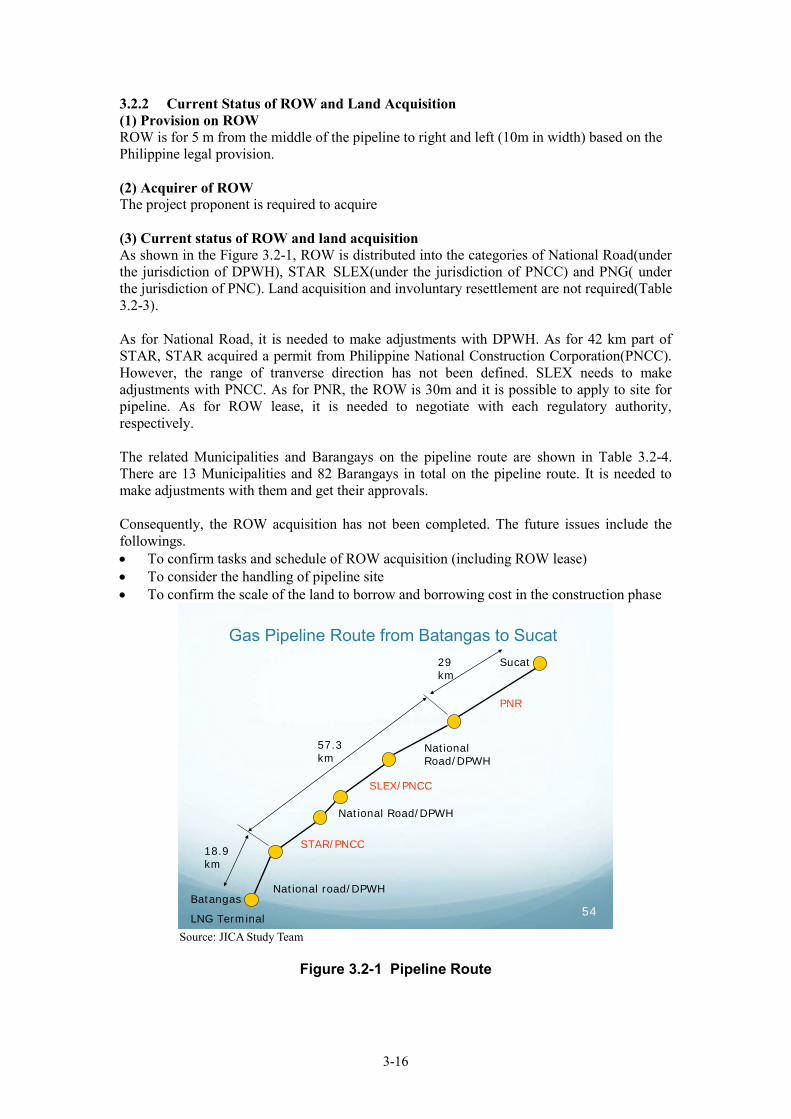
3-16
3.2.2 Current Status of ROW and Land Acquisition (1) Provision on ROW ROW is for 5 m from the middle of the pipeline to right and left (10m in width) based on the Philippine legal provision. (2) Acquirer of ROW The project proponent is required to acquire (3) Current status of ROW and land acquisition As shown in the Figure 3.2-1, ROW is distributed into the categories of National Road(under the jurisdiction of DPWH), STAR SLEX(under the jurisdiction of PNCC) and PNG( under the jurisdiction of PNC). Land acquisition and involuntary resettlement are not required(Table 3.2-3). As for National Road, it is needed to make adjustments with DPWH. As for 42 km part of STAR, STAR acquired a permit from Philippine National Construction Corporation(PNCC). However, the range of tranverse direction has not been defined. SLEX needs to make adjustments with PNCC. As for PNR, the ROW is 30m and it is possible to apply to site for pipeline. As for ROW lease, it is needed to negotiate with each regulatory authority, respectively. The related Municipalities and Barangays on the pipeline route are shown in Table 3.2-4. There are 13 Municipalities and 82 Barangays in total on the pipeline route. It is needed to make adjustments with them and get their approvals. Consequently, the ROW acquisition has not been completed. The future issues include the followings. To confirm tasks and schedule of ROW acquisition (including ROW lease) To consider the handling of pipeline site To confirm the scale of the land to borrow and borrowing cost in the construction phase
Gas Pipeline Route from Batangas to Sucat
54
Sucat
Batangas
LNG Terminal
National road/DPWH
STAR/PNCC
National Road/DPWH
SLEX/PNCC
National Road/DPWH
PNR
18.9km
57.3km
29km
Source: JICA Study Team
Figure 3.2-1 Pipeline Route
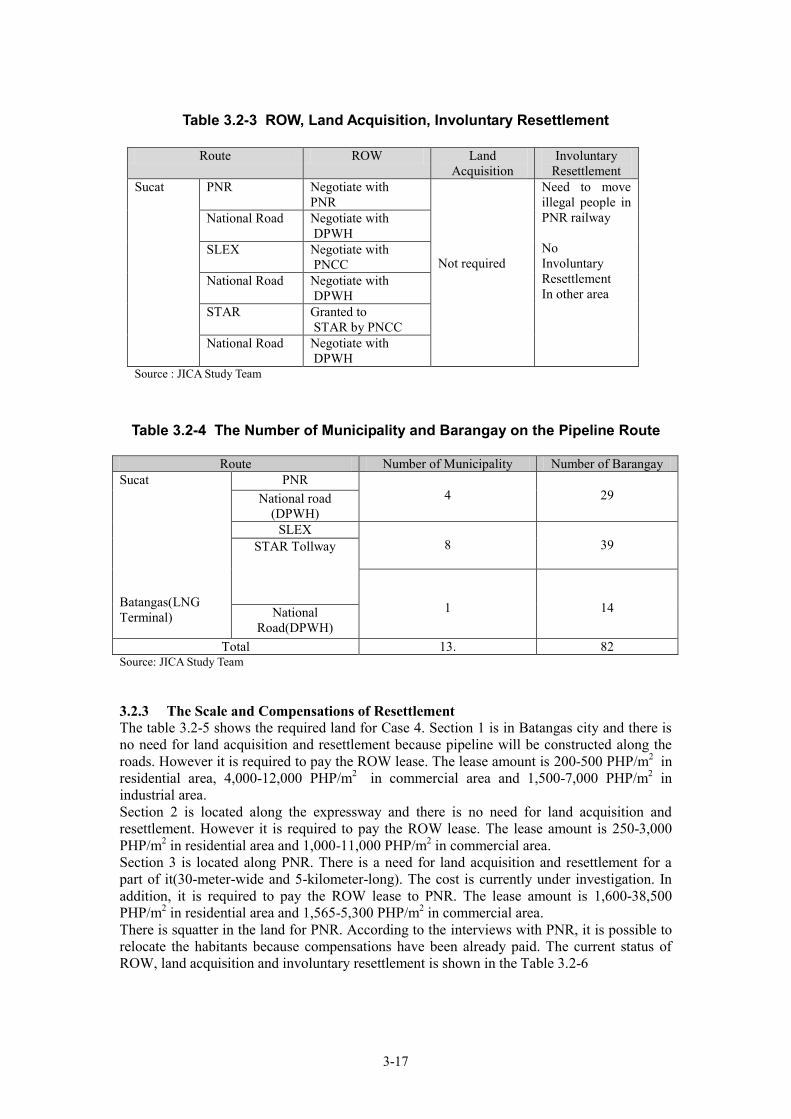
3-17
Table 3.2-3 ROW, Land Acquisition, Involuntary Resettlement
Route ROW Land
Acquisition Involuntary
Resettlement Sucat PNR Negotiate with
PNR Not required
Need to move illegal people in PNR railway No Involuntary Resettlement In other area
National Road Negotiate with DPWH
SLEX Negotiate with PNCC
National Road Negotiate with DPWH
STAR Granted to STAR by PNCC
National Road Negotiate with DPWH
Source : JICA Study Team
Table 3.2-4 The Number of Municipality and Barangay on the Pipeline Route
Route Number of Municipality Number of Barangay Sucat Batangas(LNG Terminal)
PNR 4
29 National road
(DPWH) SLEX
8
39 STAR Tollway
1
14 National Road(DPWH)
Total 13. 82 Source: JICA Study Team 3.2.3 The Scale and Compensations of Resettlement The table 3.2-5 shows the required land for Case 4. Section 1 is in Batangas city and there is no need for land acquisition and resettlement because pipeline will be constructed along the roads. However it is required to pay the ROW lease. The lease amount is 200-500 PHP/m2 in residential area, 4,000-12,000 PHP/m2 in commercial area and 1,500-7,000 PHP/m2 in industrial area. Section 2 is located along the expressway and there is no need for land acquisition and resettlement. However it is required to pay the ROW lease. The lease amount is 250-3,000 PHP/m2 in residential area and 1,000-11,000 PHP/m2 in commercial area. Section 3 is located along PNR. There is a need for land acquisition and resettlement for a part of it(30-meter-wide and 5-kilometer-long). The cost is currently under investigation. In addition, it is required to pay the ROW lease to PNR. The lease amount is 1,600-38,500 PHP/m2 in residential area and 1,565-5,300 PHP/m2 in commercial area. There is squatter in the land for PNR. According to the interviews with PNR, it is possible to relocate the habitants because compensations have been already paid. The current status of ROW, land acquisition and involuntary resettlement is shown in the Table 3.2-6
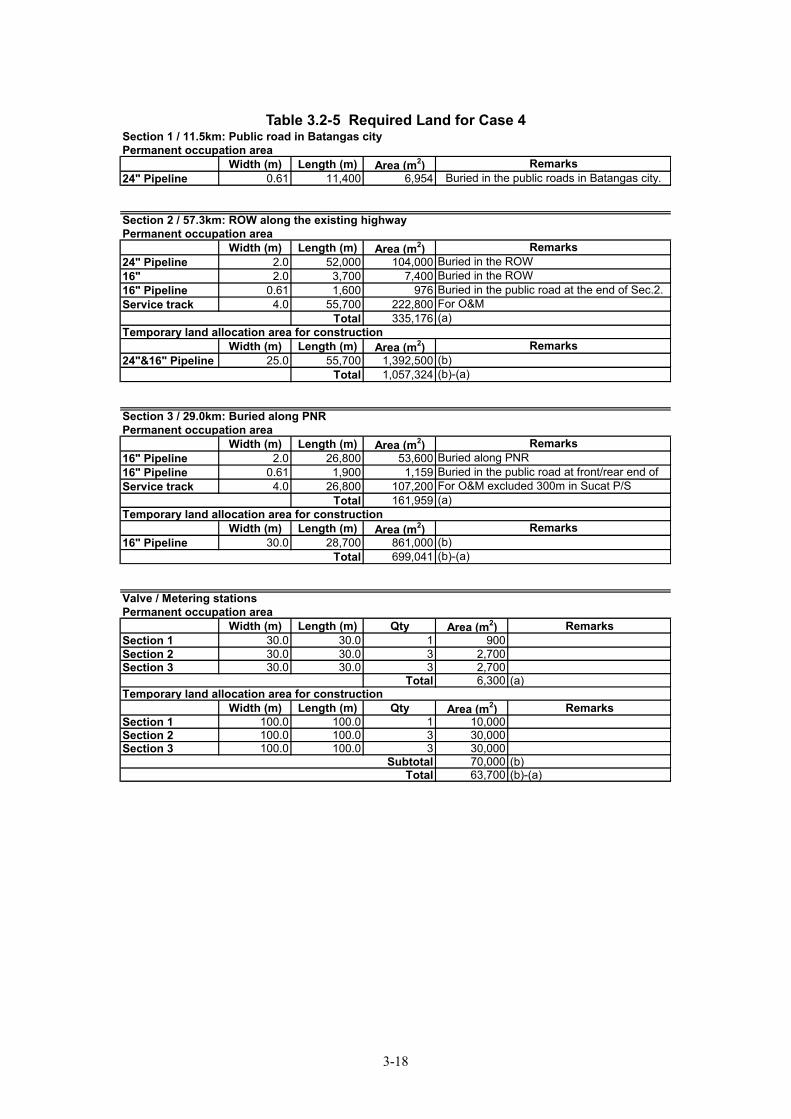
3-18
Table 3.2-5 Required Land for Case 4
Section 1 / 11.5km: Public road in Batangas cityPermanent occupation area
Width (m) Length (m) Area (m2)24" Pipeline 0.61 11,400 6,954
Section 2 / 57.3km: ROW along the existing highwayPermanent occupation area
Width (m) Length (m) Area (m2)24" Pipeline 2.0 52,000 104,00016" 2.0 3,700 7,40016" Pipeline 0.61 1,600 976Service track 4.0 55,700 222,800
Total 335,176Temporary land allocation area for construction
Width (m) Length (m) Area (m2)24"&16" Pipeline 25.0 55,700 1,392,500
Total 1,057,324
Section 3 / 29.0km: Buried along PNRPermanent occupation area
Width (m) Length (m) Area (m2)16" Pipeline 2.0 26,800 53,60016" Pipeline 0.61 1,900 1,159Service track 4.0 26,800 107,200
Total 161,959Temporary land allocation area for construction
Width (m) Length (m) Area (m2)16" Pipeline 30.0 28,700 861,000
Total 699,041
Valve / Metering stationsPermanent occupation area
Width (m) Length (m) Qty Area (m2) RemarksSection 1 30.0 30.0 1 900Section 2 30.0 30.0 3 2,700Section 3 30.0 30.0 3 2,700
Total 6,300 (a)Temporary land allocation area for construction
Width (m) Length (m) Qty Area (m2) RemarksSection 1 100.0 100.0 1 10,000Section 2 100.0 100.0 3 30,000Section 3 100.0 100.0 3 30,000
Subtotal 70,000 (b)Total 63,700 (b)-(a)
Remarks
RemarksBuried in the public roads in Batangas city.
RemarksBuried in the ROWBuried in the ROWBuried in the public road at the end of Sec.2.For O&M(a)
(b)-(a)
(b)(b)-(a)
RemarksBuried along PNRBuried in the public road at front/rear end ofFor O&M excluded 300m in Sucat P/S(a)
Remarks(b)
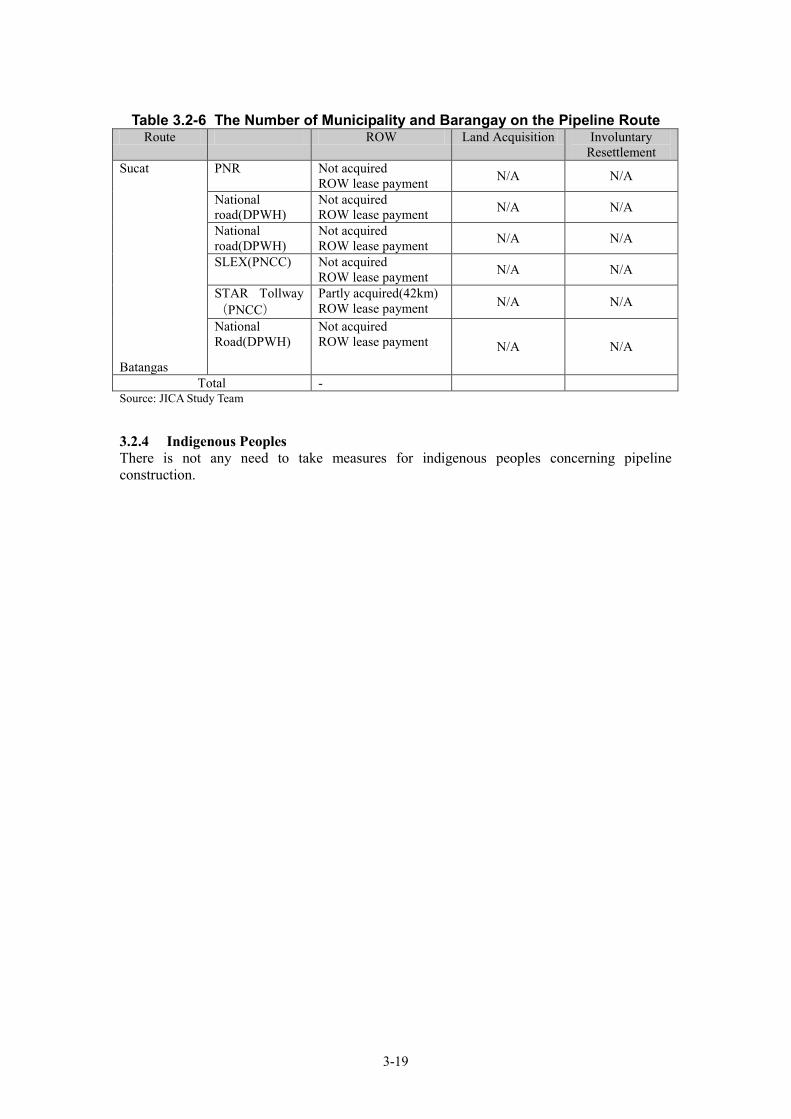
3-19
Table 3.2-6 The Number of Municipality and Barangay on the Pipeline Route
Route ROW Land Acquisition Involuntary Resettlement
Sucat Batangas
PNR Not acquired ROW lease payment N/A N/A
National road(DPWH)
Not acquired ROW lease payment N/A N/A
National road(DPWH)
Not acquired ROW lease payment N/A N/A
SLEX(PNCC)
Not acquired ROW lease payment N/A N/A
STAR Tollway(PNCC)
Partly acquired(42km) ROW lease payment N/A N/A
National Road(DPWH)
Not acquired ROW lease payment N/A N/A
Total - Source: JICA Study Team 3.2.4 Indigenous Peoples There is not any need to take measures for indigenous peoples concerning pipeline construction.
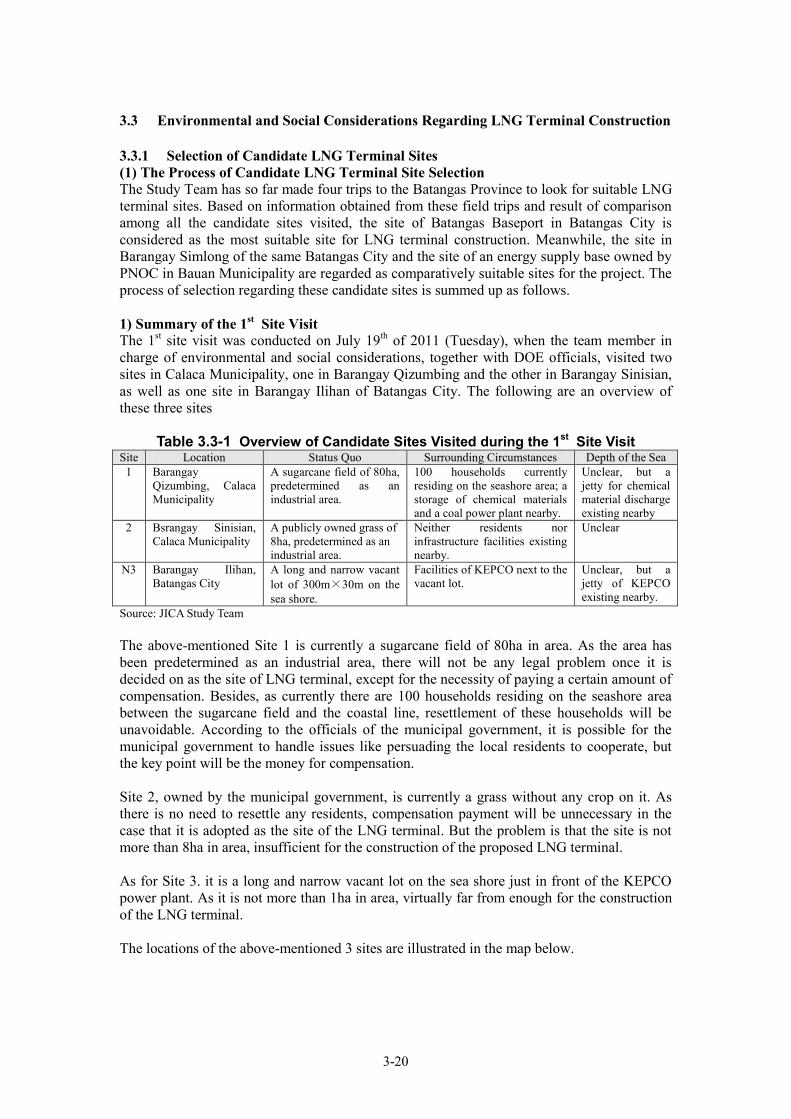
3-20
3.3 Environmental and Social Considerations Regarding LNG Terminal Construction 3.3.1 Selection of Candidate LNG Terminal Sites (1) The Process of Candidate LNG Terminal Site Selection The Study Team has so far made four trips to the Batangas Province to look for suitable LNG terminal sites. Based on information obtained from these field trips and result of comparison among all the candidate sites visited, the site of Batangas Baseport in Batangas City is considered as the most suitable site for LNG terminal construction. Meanwhile, the site in Barangay Simlong of the same Batangas City and the site of an energy supply base owned by PNOC in Bauan Municipality are regarded as comparatively suitable sites for the project. The process of selection regarding these candidate sites is summed up as follows. 1) Summary of the 1st Site Visit The 1st site visit was conducted on July 19th of 2011 (Tuesday), when the team member in charge of environmental and social considerations, together with DOE officials, visited two sites in Calaca Municipality, one in Barangay Qizumbing and the other in Barangay Sinisian, as well as one site in Barangay Ilihan of Batangas City. The following are an overview of these three sites
Table 3.3-1 Overview of Candidate Sites Visited during the 1st Site Visit Site Location Status Quo Surrounding Circumstances Depth of the Sea
1 Barangay Qizumbing, Calaca Municipality
A sugarcane field of 80ha, predetermined as an industrial area.
100 households currently residing on the seashore area; a storage of chemical materials and a coal power plant nearby.
Unclear, but a jetty for chemical material discharge existing nearby
2 Bsrangay Sinisian, Calaca Municipality
A publicly owned grass of 8ha, predetermined as an industrial area.
Neither residents nor infrastructure facilities existing nearby.
Unclear
N3 Barangay Ilihan, Batangas City
A long and narrow vacant lot of 300m×30m on the sea shore.
Facilities of KEPCO next to the vacant lot.
Unclear, but a jetty of KEPCO existing nearby.
Source: JICA Study Team The above-mentioned Site 1 is currently a sugarcane field of 80ha in area. As the area has been predetermined as an industrial area, there will not be any legal problem once it is decided on as the site of LNG terminal, except for the necessity of paying a certain amount of compensation. Besides, as currently there are 100 households residing on the seashore area between the sugarcane field and the coastal line, resettlement of these households will be unavoidable. According to the officials of the municipal government, it is possible for the municipal government to handle issues like persuading the local residents to cooperate, but the key point will be the money for compensation. Site 2, owned by the municipal government, is currently a grass without any crop on it. As there is no need to resettle any residents, compensation payment will be unnecessary in the case that it is adopted as the site of the LNG terminal. But the problem is that the site is not more than 8ha in area, insufficient for the construction of the proposed LNG terminal. As for Site 3. it is a long and narrow vacant lot on the sea shore just in front of the KEPCO power plant. As it is not more than 1ha in area, virtually far from enough for the construction of the LNG terminal. The locations of the above-mentioned 3 sites are illustrated in the map below.
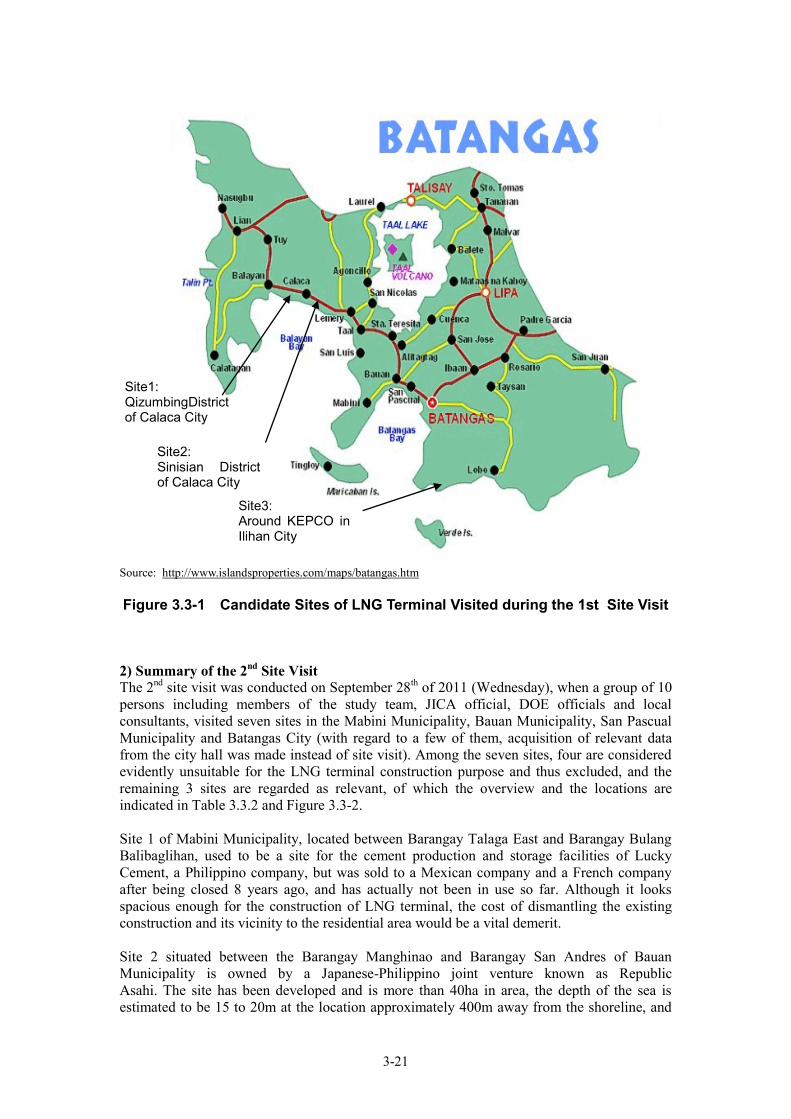
3-21
Source: http://www.islandsproperties.com/maps/batangas.htm
Figure 3.3-1 Candidate Sites of LNG Terminal Visited during the 1st Site Visit
2) Summary of the 2nd Site Visit The 2nd site visit was conducted on September 28th of 2011 (Wednesday), when a group of 10 persons including members of the study team, JICA official, DOE officials and local consultants, visited seven sites in the Mabini Municipality, Bauan Municipality, San Pascual Municipality and Batangas City (with regard to a few of them, acquisition of relevant data from the city hall was made instead of site visit). Among the seven sites, four are considered evidently unsuitable for the LNG terminal construction purpose and thus excluded, and the remaining 3 sites are regarded as relevant, of which the overview and the locations are indicated in Table 3.3.2 and Figure 3.3-2. Site 1 of Mabini Municipality, located between Barangay Talaga East and Barangay Bulang Balibaglihan, used to be a site for the cement production and storage facilities of Lucky Cement, a Philippino company, but was sold to a Mexican company and a French company after being closed 8 years ago, and has actually not been in use so far. Although it looks spacious enough for the construction of LNG terminal, the cost of dismantling the existing construction and its vicinity to the residential area would be a vital demerit. Site 2 situated between the Barangay Manghinao and Barangay San Andres of Bauan Municipality is owned by a Japanese-Philippino joint venture known as Republic Asahi. The site has been developed and is more than 40ha in area, the depth of the sea is estimated to be 15 to 20m at the location approximately 400m away from the shoreline, and
Site1: QizumbingDistrict of Calaca City
Site2: Sinisian District of Calaca City
Site3: Around KEPCO in Ilihan City
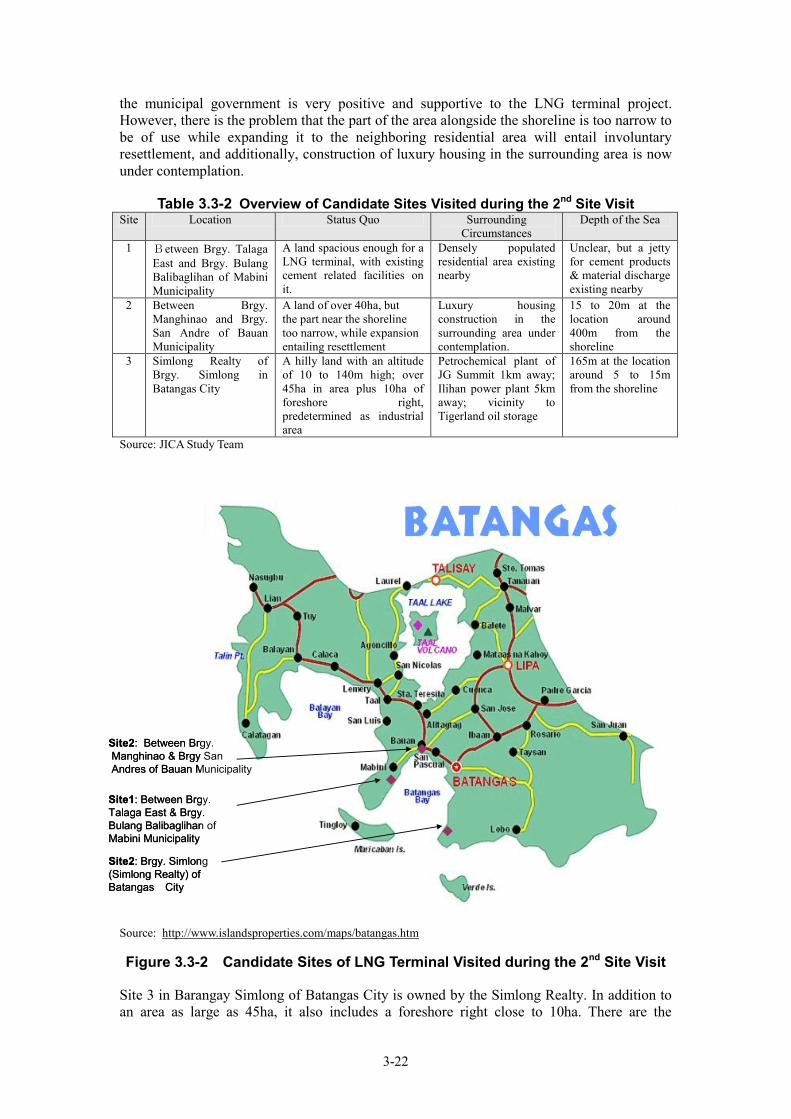
3-22
the municipal government is very positive and supportive to the LNG terminal project. However, there is the problem that the part of the area alongside the shoreline is too narrow to be of use while expanding it to the neighboring residential area will entail involuntary resettlement, and additionally, construction of luxury housing in the surrounding area is now under contemplation.
Table 3.3-2 Overview of Candidate Sites Visited during the 2nd Site Visit Site Location Status Quo Surrounding
Circumstances Depth of the Sea
1 Between Brgy. Talaga East and Brgy. Bulang Balibaglihan of Mabini Municipality
A land spacious enough for a LNG terminal, with existing cement related facilities on it.
Densely populated residential area existing nearby
Unclear, but a jetty for cement products & material discharge existing nearby
2 Between Brgy. Manghinao and Brgy. San Andre of Bauan Municipality
A land of over 40ha, but the part near the shoreline too narrow, while expansion entailing resettlement
Luxury housing construction in the surrounding area under contemplation.
15 to 20m at the location around 400m from the shoreline
3 Simlong Realty of Brgy. Simlong in Batangas City
A hilly land with an altitude of 10 to 140m high; over 45ha in area plus 10ha of foreshore right, predetermined as industrial area
Petrochemical plant of JG Summit 1km away; Ilihan power plant 5km away; vicinity to Tigerland oil storage
165m at the location around 5 to 15m from the shoreline
Source: JICA Study Team
Source: http://www.islandsproperties.com/maps/batangas.htm Figure 3.3-2 Candidate Sites of LNG Terminal Visited during the 2nd Site Visit
Site 3 in Barangay Simlong of Batangas City is owned by the Simlong Realty. In addition to an area as large as 45ha, it also includes a foreshore right close to 10ha. There are the
Site2: Between Brgy. Manghinao & Brgy San Andres of Bauan Municipality
Site1: Between Brgy. Talaga East & Brgy. Bulang Balibaglihan of Mabini Municipality
Site2: Brgy. Simlong(Simlong Realty) of Batangas City
Site2: Between Brgy. Manghinao & Brgy San Andres of Bauan Municipality
Site1: Between Brgy. Talaga East & Brgy. Bulang Balibaglihan of Mabini Municipality
Site2: Brgy. Simlong(Simlong Realty) of Batangas City
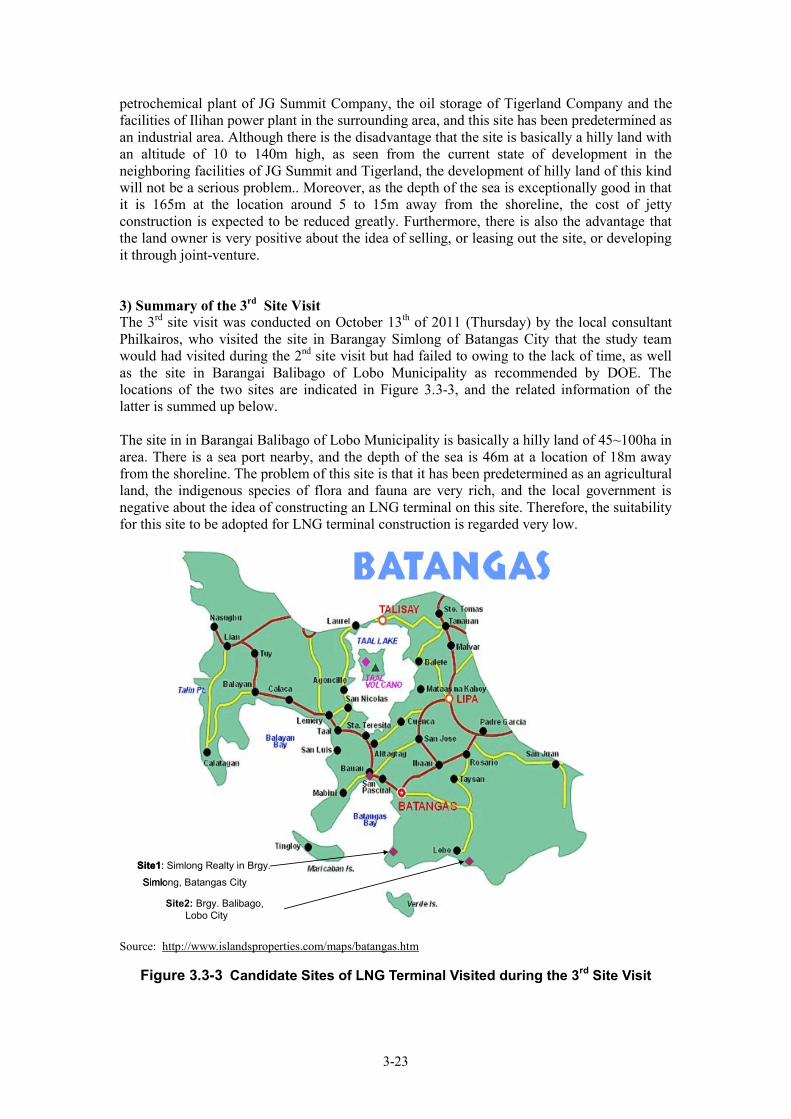
3-23
petrochemical plant of JG Summit Company, the oil storage of Tigerland Company and the facilities of Ilihan power plant in the surrounding area, and this site has been predetermined as an industrial area. Although there is the disadvantage that the site is basically a hilly land with an altitude of 10 to 140m high, as seen from the current state of development in the neighboring facilities of JG Summit and Tigerland, the development of hilly land of this kind will not be a serious problem.. Moreover, as the depth of the sea is exceptionally good in that it is 165m at the location around 5 to 15m away from the shoreline, the cost of jetty construction is expected to be reduced greatly. Furthermore, there is also the advantage that the land owner is very positive about the idea of selling, or leasing out the site, or developing it through joint-venture. 3) Summary of the 3rd Site Visit The 3rd site visit was conducted on October 13th of 2011 (Thursday) by the local consultant Philkairos, who visited the site in Barangay Simlong of Batangas City that the study team would had visited during the 2nd site visit but had failed to owing to the lack of time, as well as the site in Barangai Balibago of Lobo Municipality as recommended by DOE. The locations of the two sites are indicated in Figure 3.3-3, and the related information of the latter is summed up below. The site in in Barangai Balibago of Lobo Municipality is basically a hilly land of 45~100ha in area. There is a sea port nearby, and the depth of the sea is 46m at a location of 18m away from the shoreline. The problem of this site is that it has been predetermined as an agricultural land, the indigenous species of flora and fauna are very rich, and the local government is negative about the idea of constructing an LNG terminal on this site. Therefore, the suitability for this site to be adopted for LNG terminal construction is regarded very low.
Source: http://www.islandsproperties.com/maps/batangas.htm
Figure 3.3-3 Candidate Sites of LNG Terminal Visited during the 3rd Site Visit
Site1: Simlong Realty in Brgy.
Simlong, Batangas City
Site2: Brgy. Balibago,Lobo City
Site1: Simlong Realty in Brgy.
Simlong, Batangas City
Site2: Brgy. Balibago,Lobo City
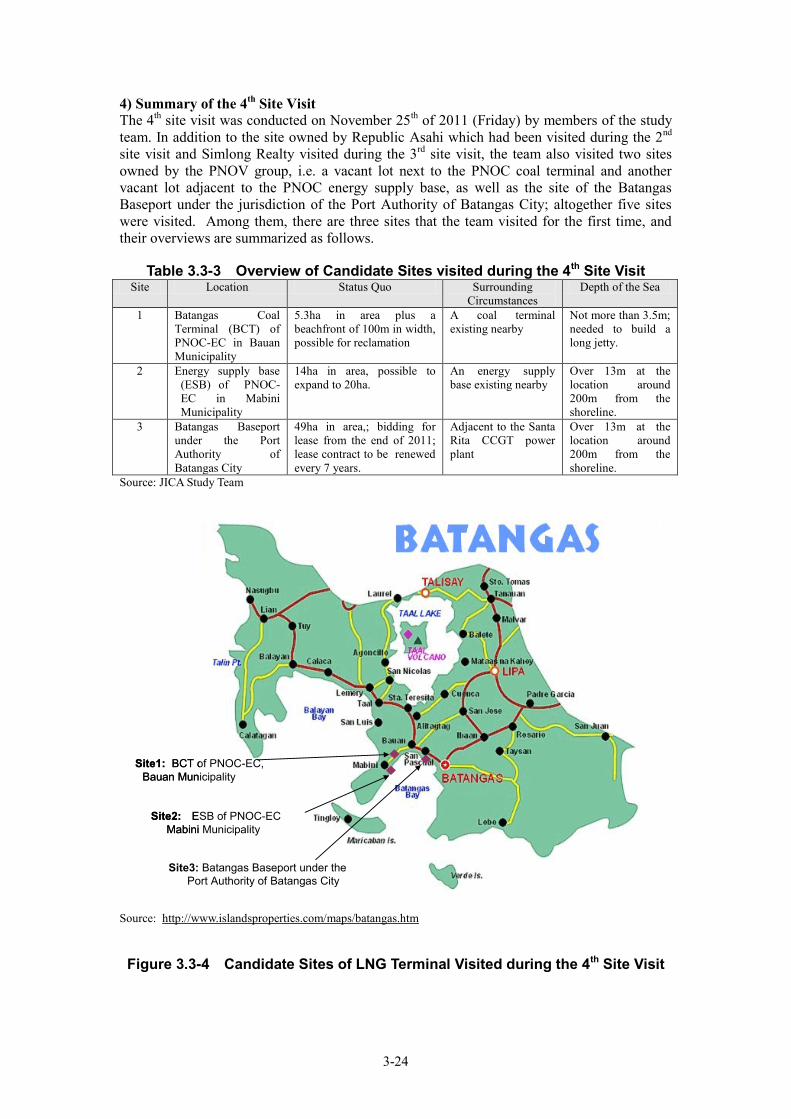
3-24
4) Summary of the 4th Site Visit The 4th site visit was conducted on November 25th of 2011 (Friday) by members of the study team. In addition to the site owned by Republic Asahi which had been visited during the 2nd site visit and Simlong Realty visited during the 3rd site visit, the team also visited two sites owned by the PNOV group, i.e. a vacant lot next to the PNOC coal terminal and another vacant lot adjacent to the PNOC energy supply base, as well as the site of the Batangas Baseport under the jurisdiction of the Port Authority of Batangas City; altogether five sites were visited. Among them, there are three sites that the team visited for the first time, and their overviews are summarized as follows.
Table 3.3-3 Overview of Candidate Sites visited during the 4th Site Visit Site Location Status Quo Surrounding
Circumstances Depth of the Sea
1 Batangas Coal Terminal (BCT) of PNOC-EC in Bauan Municipality
5.3ha in area plus a beachfront of 100m in width, possible for reclamation
A coal terminal existing nearby
Not more than 3.5m; needed to build a long jetty.
2 Energy supply base (ESB) of PNOC-EC in Mabini Municipality
14ha in area, possible to expand to 20ha.
An energy supply base existing nearby
Over 13m at the location around 200m from the shoreline.
3 Batangas Baseport under the Port Authority of Batangas City
49ha in area,; bidding for lease from the end of 2011; lease contract to be renewed every 7 years.
Adjacent to the Santa Rita CCGT power plant
Over 13m at the location around 200m from the shoreline.
Source: JICA Study Team
Source: http://www.islandsproperties.com/maps/batangas.htm
Figure 3.3-4 Candidate Sites of LNG Terminal Visited during the 4th Site Visit
Site2: ESB of PNOC-EC Mabini Municipality
Site1: BCT of PNOC-EC, Bauan Municipality
Site3: Batangas Baseport under the Port Authority of Batangas City
Site2: ESB of PNOC-EC Mabini Municipality
Site1: BCT of PNOC-EC, Bauan Municipality
Site3: Batangas Baseport under the Port Authority of Batangas City
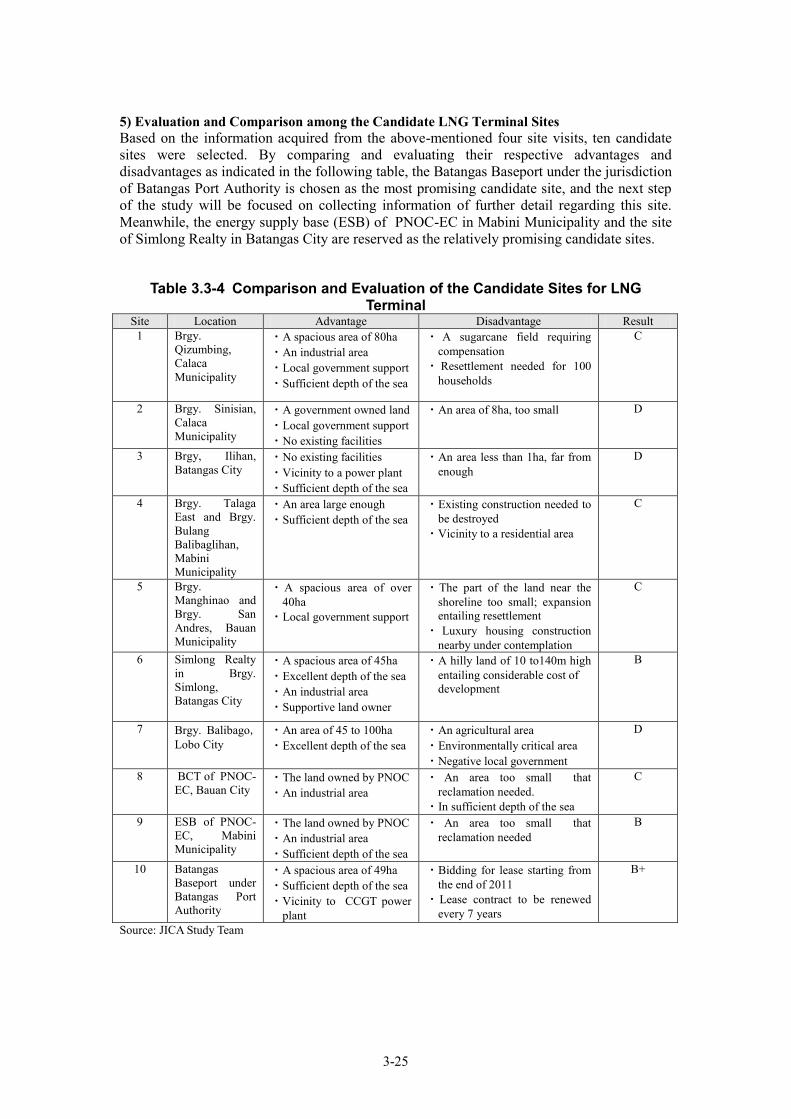
3-25
5) Evaluation and Comparison among the Candidate LNG Terminal Sites Based on the information acquired from the above-mentioned four site visits, ten candidate sites were selected. By comparing and evaluating their respective advantages and disadvantages as indicated in the following table, the Batangas Baseport under the jurisdiction of Batangas Port Authority is chosen as the most promising candidate site, and the next step of the study will be focused on collecting information of further detail regarding this site. Meanwhile, the energy supply base (ESB) of PNOC-EC in Mabini Municipality and the site of Simlong Realty in Batangas City are reserved as the relatively promising candidate sites.
Table 3.3-4 Comparison and Evaluation of the Candidate Sites for LNG
Terminal Site Location Advantage Disadvantage Result
1 Brgy. Qizumbing, Calaca Municipality
・A spacious area of 80ha ・An industrial area ・Local government support ・Sufficient depth of the sea
・ A sugarcane field requiring compensation
・ Resettlement needed for 100 households
C
2 Brgy. Sinisian, Calaca Municipality
・A government owned land ・Local government support ・No existing facilities
・An area of 8ha, too small
D
3 Brgy, Ilihan, Batangas City
・No existing facilities ・Vicinity to a power plant ・Sufficient depth of the sea
・An area less than 1ha, far from enough
D
4 Brgy. Talaga East and Brgy. Bulang Balibaglihan, Mabini Municipality
・An area large enough ・Sufficient depth of the sea
・Existing construction needed to be destroyed
・Vicinity to a residential area
C
5 Brgy. Manghinao and Brgy. San Andres, Bauan Municipality
・A spacious area of over 40ha
・Local government support
・The part of the land near the shoreline too small; expansion entailing resettlement
・ Luxury housing construction nearby under contemplation
C
6 Simlong Realty in Brgy. Simlong, Batangas City
・A spacious area of 45ha ・Excellent depth of the sea ・An industrial area ・Supportive land owner
・A hilly land of 10 to140m high entailing considerable cost of development
B
7 Brgy. Balibago, Lobo City
・An area of 45 to 100ha ・Excellent depth of the sea
・An agricultural area ・Environmentally critical area ・Negative local government
D
8 BCT of PNOC-EC, Bauan City
・The land owned by PNOC ・An industrial area
・ An area too small that reclamation needed.
・In sufficient depth of the sea
C
9 ESB of PNOC-EC, Mabini Municipality
・The land owned by PNOC ・An industrial area ・Sufficient depth of the sea
・ An area too small that reclamation needed
B
10 Batangas Baseport under Batangas Port Authority
・A spacious area of 49ha ・Sufficient depth of the sea ・Vicinity to CCGT power
plant
・Bidding for lease starting from the end of 2011
・Lease contract to be renewed every 7 years
B+
Source: JICA Study Team

3-26
(2) Environmental Conditions of the Site of Batangas Baseport and the Surrounding Area 1) Size of the Area and Location The total area of Batangas Baseport is 150ha, out of which, a land of 49ha is to be leased out though bidding and the Port Authority is now soliciting leaseholders. This site is located 110km from Metro Manila, Latitude 130 45.2’ N, longitude 1210 06.6’ E on the northeast section of Batangas Bay along the southwestern part of Luzon. The port is in Barangay Sta. Clara, Batangas City, about 2 kilometers from the city proper 2) Access from Outside Area Besides the national road passing through Batangas City proper, the Southern Tagalog Arterial Road (also known as Star Tollway, or Calabarzon Expressway)connects Batangas City with South Luzon Expressway (SLEX), which directly leads to Manila. 3) Climate Conditions The climate of Batangas is marine tropical, characterized by gentle winds, moderate cloudiness, high temperature and a relatively high humidity. The wet season of Batangas is from the beginning of May until the end of December with June, July and August as the wettest months. This is the period when the southwest monsoon blows. 4) Natural Reserve In light of the vicinity of Batangas Baseport to the Santa Rita power plant, it can be imagined that there would not be any area which needs special protection like natural reserve near the proposed candidate site of LNG terminal. However, the Batangas Bay is said to be a marine area with high degree of biodiversity, abounding with coral reef, mangrove and fish. Therefore, it would be necessary to make sure whether the construction of LNG terminal will make an impact on the ecosystem of Batangas Bay or not. 5) Indigenous People
Source: http://www.prayway.com/unreached/peoplegroups4/1104.html Figure 3.3-5 Distribution of the Indigenous Ethnic Group Bajau People in the
Philippines
3-27
There are indigenous communities known as Bajau living along the coastal line of Batangas Bay. These communities are the subgroup of indigenous people now scattering throughout the Southeast Asian countries like Indonesia, Malaysia, Myanmar and so on. In Sulawesi and East Kalimantan of Indonesia, for example, there exists the subgroup known as Bajo. As these people have traditionally lived on fishing and have been boat-dwelling and nomadic on the sea, they are usually called “Sea Nomad”, “Sea People”, or “Sea Gypsies”. As illustrated by the map below, the Bajau people in the Philippines mainly exist in Mindanao, Cebu and South Luzon including Batangas. The list of 110 indigenous ethnic groups in the Philippines issued by the Office on Policy, Planning and Research (OPPR) of National Commission on Indigenous People (NCIP) in March, 2011 also includes the ethnic group of Bajau. As the Bajau people basically do not possess any inherent land ownership owing to their traditional boat-dwelling lifestyle, there is no worry about the possible violation of their interest on shore by the implementation of this project. Nevertheless, it needs to be clarified whether the marine component of the LNG terminal, i.e. the jetty and the ship berth and so on, will overlap with the area where the Bajau people have their fishing ground, and whether the project will have negative effect on their livelihood or not. 3.3.2 Current State of EIS Preparation and ECC Acquisition Just like the component of Pipeline, EIS regarding the LNG component has not been prepared, and ECC has not been acquired up to now. As the tasks of the next step, it is necessary to organize the basic data needed for the drafting of EIS, followed by the formulation of EIS and the acquisition of ECC. Moreover, completion of the Environment Checklist required by JICA and the Scoping required by the Philippines government before the fulfillment of EIS formulation and ECC acquisition is also necessary. The JICA Environment Checklist relevant to the LNG component and the scoping document are indicated below. (1) Environmental Checklist in JICA Guidelines for Environmental and Social
Considerations Focusing on the afore-mentioned Batangas Baseport as the most promising candidate site for LNG terminal construction, verification based on JICA’s Environmental Checklist was conducted. The results are summed up as follows: 1) Permits and Explanation Currently, activities relevant to the items of EIA and Environmental Permits, and explanation to the local people around the project site are not yet started, but the 1st seminar on information disclosure of the project was held on Dec. 1, 2011, targeting business circle of gas pipeline, energy and power generation, government officials and mass media people. After the designation of the implementation agency in the near future, with the help of the consultant, the implementation agency will hold the responsibility of preparing the EIA report, conducting information disclosure seminar targeting the local stakeholders especially the affected people, and applying for necessary permits from the Environment Management Bureau (EMB) under Department of Environment and Natural Resources (DENR) or its regional office. 2) Pollution Control With respect to pollution control covering the seven items of air quality, water quality, wastes, noise and vibration, subsidence, odor and sediment, the design and construction work will be conducted by complying with the emission standards and environmental standards of the Philippines. The specific measures will be decided through the study of the next phase. 3) Natural Environment It is sure that, Batangas Baseport, currently considered the most promising candidate site for LNG terminal construction, is not located in any protected area designated by the country's
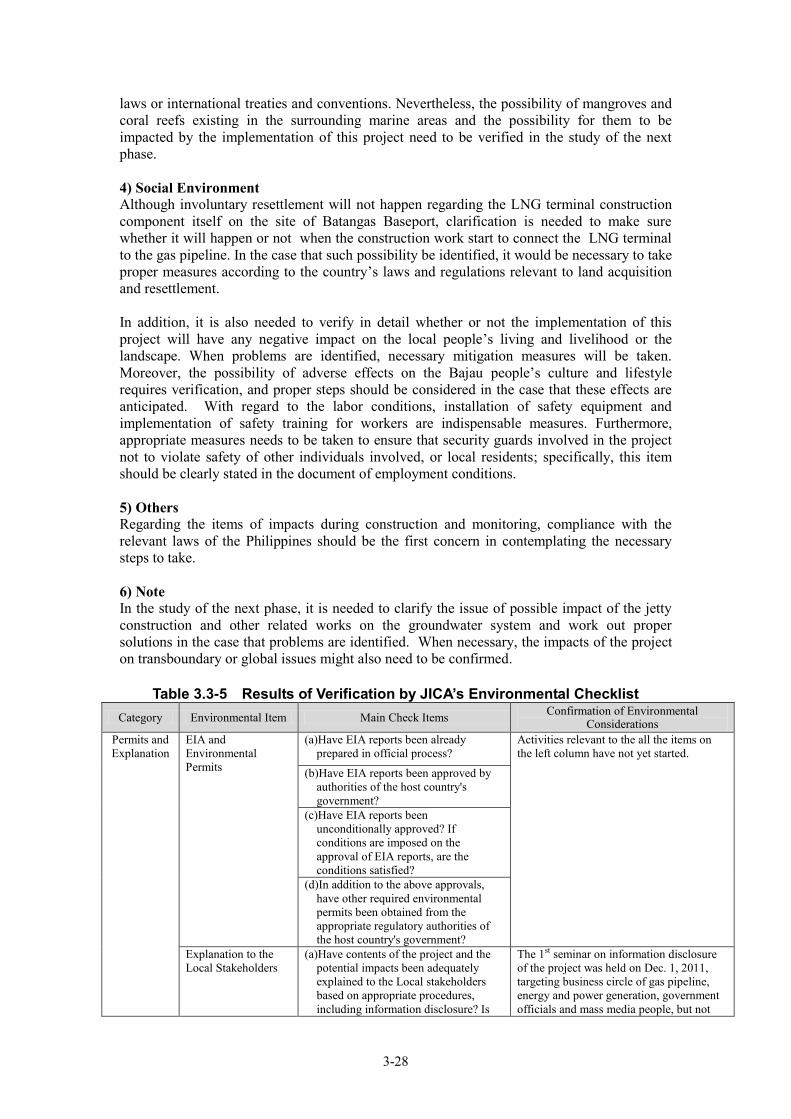
3-28
laws or international treaties and conventions. Nevertheless, the possibility of mangroves and coral reefs existing in the surrounding marine areas and the possibility for them to be impacted by the implementation of this project need to be verified in the study of the next phase. 4) Social Environment Although involuntary resettlement will not happen regarding the LNG terminal construction component itself on the site of Batangas Baseport, clarification is needed to make sure whether it will happen or not when the construction work start to connect the LNG terminal to the gas pipeline. In the case that such possibility be identified, it would be necessary to take proper measures according to the country’s laws and regulations relevant to land acquisition and resettlement. In addition, it is also needed to verify in detail whether or not the implementation of this project will have any negative impact on the local people’s living and livelihood or the landscape. When problems are identified, necessary mitigation measures will be taken. Moreover, the possibility of adverse effects on the Bajau people’s culture and lifestyle requires verification, and proper steps should be considered in the case that these effects are anticipated. With regard to the labor conditions, installation of safety equipment and implementation of safety training for workers are indispensable measures. Furthermore, appropriate measures needs to be taken to ensure that security guards involved in the project not to violate safety of other individuals involved, or local residents; specifically, this item should be clearly stated in the document of employment conditions.
5) Others Regarding the items of impacts during construction and monitoring, compliance with the relevant laws of the Philippines should be the first concern in contemplating the necessary steps to take. 6) Note In the study of the next phase, it is needed to clarify the issue of possible impact of the jetty construction and other related works on the groundwater system and work out proper solutions in the case that problems are identified. When necessary, the impacts of the project on transboundary or global issues might also need to be confirmed.
Table 3.3-5 Results of Verification by JICA’s Environmental Checklist Category Environmental Item Main Check Items Confirmation of Environmental
Considerations Permits and Explanation
EIA and Environmental Permits
(a)Have EIA reports been already prepared in official process?
Activities relevant to the all the items on the left column have not yet started.
(b)Have EIA reports been approved by authorities of the host country's government?
(c)Have EIA reports been unconditionally approved? If conditions are imposed on the approval of EIA reports, are the conditions satisfied?
(d)In addition to the above approvals, have other required environmental permits been obtained from the appropriate regulatory authorities of the host country's government?
Explanation to the Local Stakeholders
(a)Have contents of the project and the potential impacts been adequately explained to the Local stakeholders based on appropriate procedures, including information disclosure? Is
The 1st seminar on information disclosure of the project was held on Dec. 1, 2011, targeting business circle of gas pipeline, energy and power generation, government officials and mass media people, but not
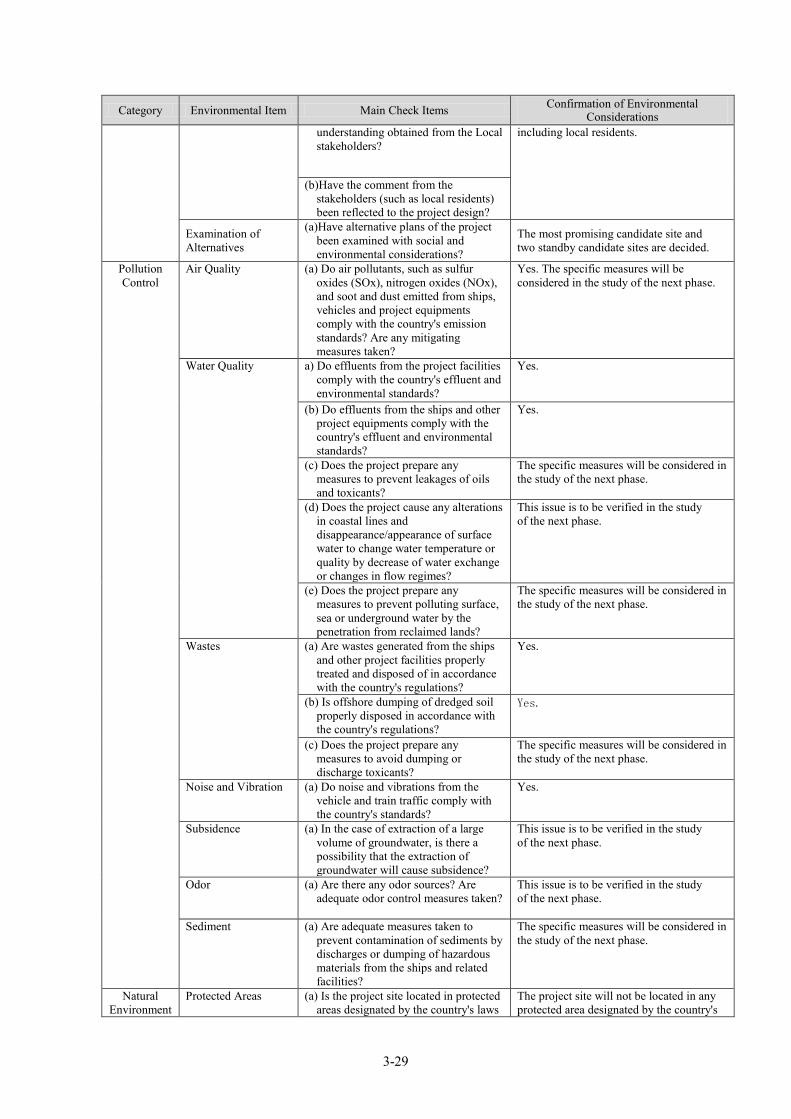
3-29
Category Environmental Item Main Check Items Confirmation of Environmental Considerations
understanding obtained from the Local stakeholders?
including local residents.
(b)Have the comment from the stakeholders (such as local residents) been reflected to the project design?
Examination of Alternatives
(a)Have alternative plans of the project been examined with social and environmental considerations?
The most promising candidate site and two standby candidate sites are decided.
Pollution Control
Air Quality (a) Do air pollutants, such as sulfur oxides (SOx), nitrogen oxides (NOx), and soot and dust emitted from ships, vehicles and project equipments comply with the country's emission standards? Are any mitigating measures taken?
Yes. The specific measures will be considered in the study of the next phase.
Water Quality a) Do effluents from the project facilities comply with the country's effluent and environmental standards?
Yes.
(b) Do effluents from the ships and other project equipments comply with the country's effluent and environmental standards?
Yes.
(c) Does the project prepare any measures to prevent leakages of oils and toxicants?
The specific measures will be considered in the study of the next phase.
(d) Does the project cause any alterations in coastal lines and disappearance/appearance of surface water to change water temperature or quality by decrease of water exchange or changes in flow regimes?
This issue is to be verified in the study of the next phase.
(e) Does the project prepare any measures to prevent polluting surface, sea or underground water by the penetration from reclaimed lands?
The specific measures will be considered in the study of the next phase.
Wastes (a) Are wastes generated from the ships and other project facilities properly treated and disposed of in accordance with the country's regulations?
Yes.
(b) Is offshore dumping of dredged soil properly disposed in accordance with the country's regulations?
Yes.
(c) Does the project prepare any measures to avoid dumping or discharge toxicants?
The specific measures will be considered in the study of the next phase.
Noise and Vibration (a) Do noise and vibrations from the vehicle and train traffic comply with the country's standards?
Yes.
Subsidence (a) In the case of extraction of a large volume of groundwater, is there a possibility that the extraction of groundwater will cause subsidence?
This issue is to be verified in the study of the next phase.
Odor (a) Are there any odor sources? Are adequate odor control measures taken?
This issue is to be verified in the study of the next phase.
Sediment (a) Are adequate measures taken to prevent contamination of sediments by discharges or dumping of hazardous materials from the ships and related facilities?
The specific measures will be considered in the study of the next phase.
Natural Environment
Protected Areas (a) Is the project site located in protected areas designated by the country's laws
The project site will not be located in any protected area designated by the country's
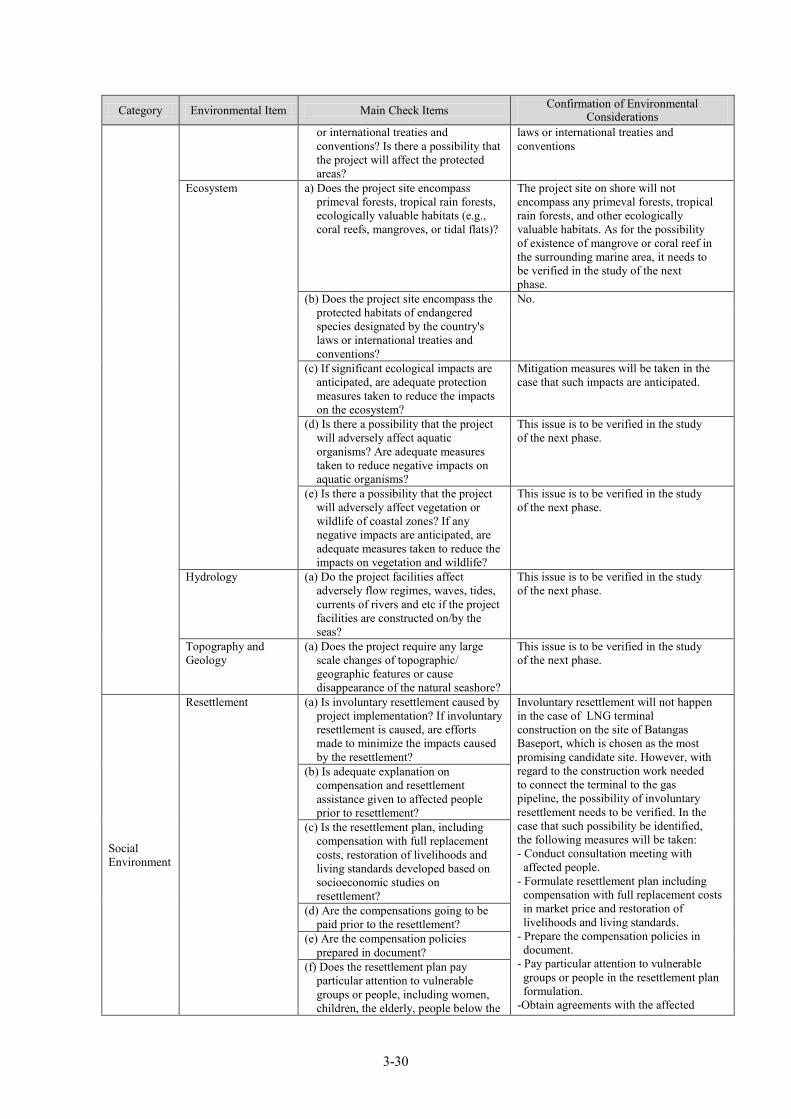
3-30
Category Environmental Item Main Check Items Confirmation of Environmental Considerations
or international treaties and conventions? Is there a possibility that the project will affect the protected areas?
laws or international treaties and conventions
Ecosystem a) Does the project site encompass primeval forests, tropical rain forests, ecologically valuable habitats (e.g., coral reefs, mangroves, or tidal flats)?
The project site on shore will not encompass any primeval forests, tropical rain forests, and other ecologically valuable habitats. As for the possibility of existence of mangrove or coral reef in the surrounding marine area, it needs to be verified in the study of the next phase.
(b) Does the project site encompass the protected habitats of endangered species designated by the country's laws or international treaties and conventions?
No.
(c) If significant ecological impacts are anticipated, are adequate protection measures taken to reduce the impacts on the ecosystem?
Mitigation measures will be taken in the case that such impacts are anticipated.
(d) Is there a possibility that the project will adversely affect aquatic organisms? Are adequate measures taken to reduce negative impacts on aquatic organisms?
This issue is to be verified in the study of the next phase.
(e) Is there a possibility that the project will adversely affect vegetation or wildlife of coastal zones? If any negative impacts are anticipated, are adequate measures taken to reduce the impacts on vegetation and wildlife?
This issue is to be verified in the study of the next phase.
Hydrology (a) Do the project facilities affect adversely flow regimes, waves, tides, currents of rivers and etc if the project facilities are constructed on/by the seas?
This issue is to be verified in the study of the next phase.
Topography and Geology
(a) Does the project require any large scale changes of topographic/ geographic features or cause disappearance of the natural seashore?
This issue is to be verified in the study of the next phase.
Social Environment
Resettlement (a) Is involuntary resettlement caused by project implementation? If involuntary resettlement is caused, are efforts made to minimize the impacts caused by the resettlement?
Involuntary resettlement will not happen in the case of LNG terminal construction on the site of Batangas Baseport, which is chosen as the most promising candidate site. However, with regard to the construction work needed to connect the terminal to the gas pipeline, the possibility of involuntary resettlement needs to be verified. In the case that such possibility be identified, the following measures will be taken: - Conduct consultation meeting with
affected people. - Formulate resettlement plan including
compensation with full replacement costs in market price and restoration of livelihoods and living standards.
- Prepare the compensation policies in document.
- Pay particular attention to vulnerable groups or people in the resettlement plan formulation.
-Obtain agreements with the affected
(b) Is adequate explanation on compensation and resettlement assistance given to affected people prior to resettlement?
(c) Is the resettlement plan, including compensation with full replacement costs, restoration of livelihoods and living standards developed based on socioeconomic studies on resettlement?
(d) Are the compensations going to be paid prior to the resettlement?
(e) Are the compensation policies prepared in document?
(f) Does the resettlement plan pay particular attention to vulnerable groups or people, including women, children, the elderly, people below the
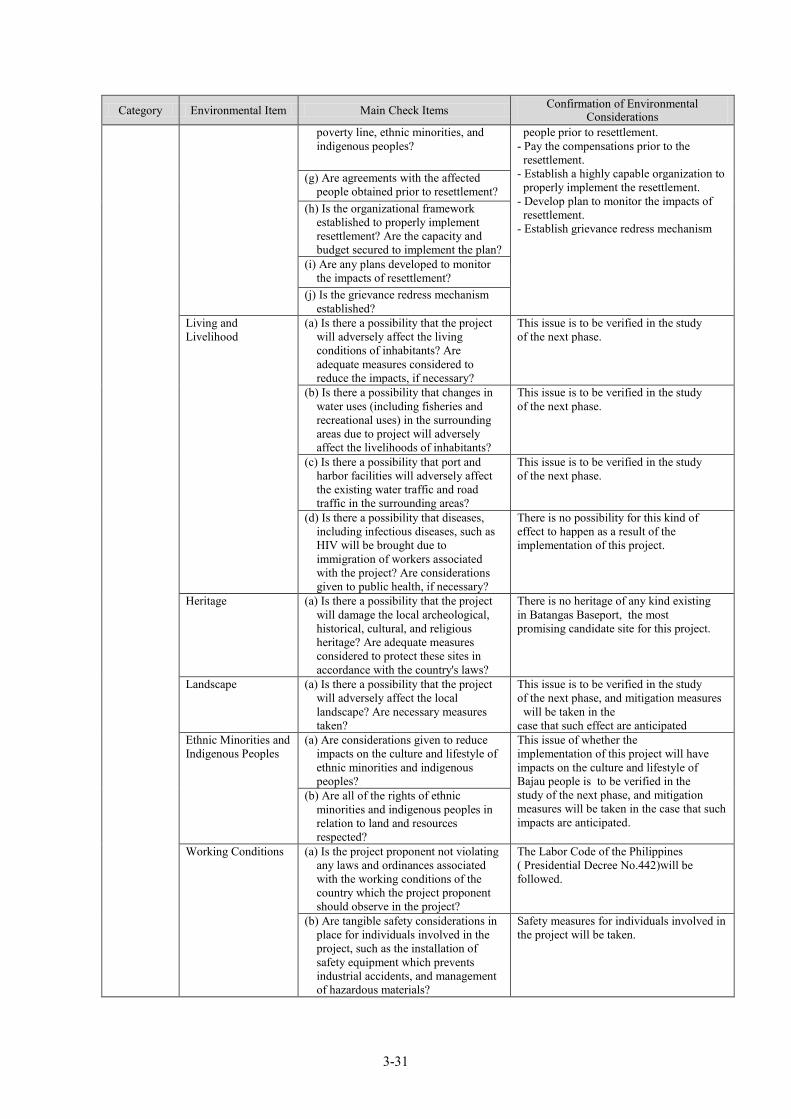
3-31
Category Environmental Item Main Check Items Confirmation of Environmental Considerations
poverty line, ethnic minorities, and indigenous peoples?
people prior to resettlement. - Pay the compensations prior to the
resettlement. - Establish a highly capable organization to
properly implement the resettlement. - Develop plan to monitor the impacts of
resettlement. - Establish grievance redress mechanism
(g) Are agreements with the affected people obtained prior to resettlement?
(h) Is the organizational framework established to properly implement resettlement? Are the capacity and budget secured to implement the plan?
(i) Are any plans developed to monitor the impacts of resettlement?
(j) Is the grievance redress mechanism established?
Living and Livelihood
(a) Is there a possibility that the project will adversely affect the living conditions of inhabitants? Are adequate measures considered to reduce the impacts, if necessary?
This issue is to be verified in the study of the next phase.
(b) Is there a possibility that changes in water uses (including fisheries and recreational uses) in the surrounding areas due to project will adversely affect the livelihoods of inhabitants?
This issue is to be verified in the study of the next phase.
(c) Is there a possibility that port and harbor facilities will adversely affect the existing water traffic and road traffic in the surrounding areas?
This issue is to be verified in the study of the next phase.
(d) Is there a possibility that diseases, including infectious diseases, such as HIV will be brought due to immigration of workers associated with the project? Are considerations given to public health, if necessary?
There is no possibility for this kind of effect to happen as a result of the implementation of this project.
Heritage (a) Is there a possibility that the project will damage the local archeological, historical, cultural, and religious heritage? Are adequate measures considered to protect these sites in accordance with the country's laws?
There is no heritage of any kind existing in Batangas Baseport, the most promising candidate site for this project.
Landscape (a) Is there a possibility that the project will adversely affect the local landscape? Are necessary measures taken?
This issue is to be verified in the study of the next phase, and mitigation measures
will be taken in the case that such effect are anticipated
Ethnic Minorities and Indigenous Peoples
(a) Are considerations given to reduce impacts on the culture and lifestyle of ethnic minorities and indigenous peoples?
This issue of whether the implementation of this project will have impacts on the culture and lifestyle of Bajau people is to be verified in the study of the next phase, and mitigation measures will be taken in the case that such impacts are anticipated.
(b) Are all of the rights of ethnic minorities and indigenous peoples in relation to land and resources respected?
Working Conditions (a) Is the project proponent not violating any laws and ordinances associated with the working conditions of the country which the project proponent should observe in the project?
The Labor Code of the Philippines ( Presidential Decree No.442)will be followed.
(b) Are tangible safety considerations in place for individuals involved in the project, such as the installation of safety equipment which prevents industrial accidents, and management of hazardous materials?
Safety measures for individuals involved in the project will be taken.
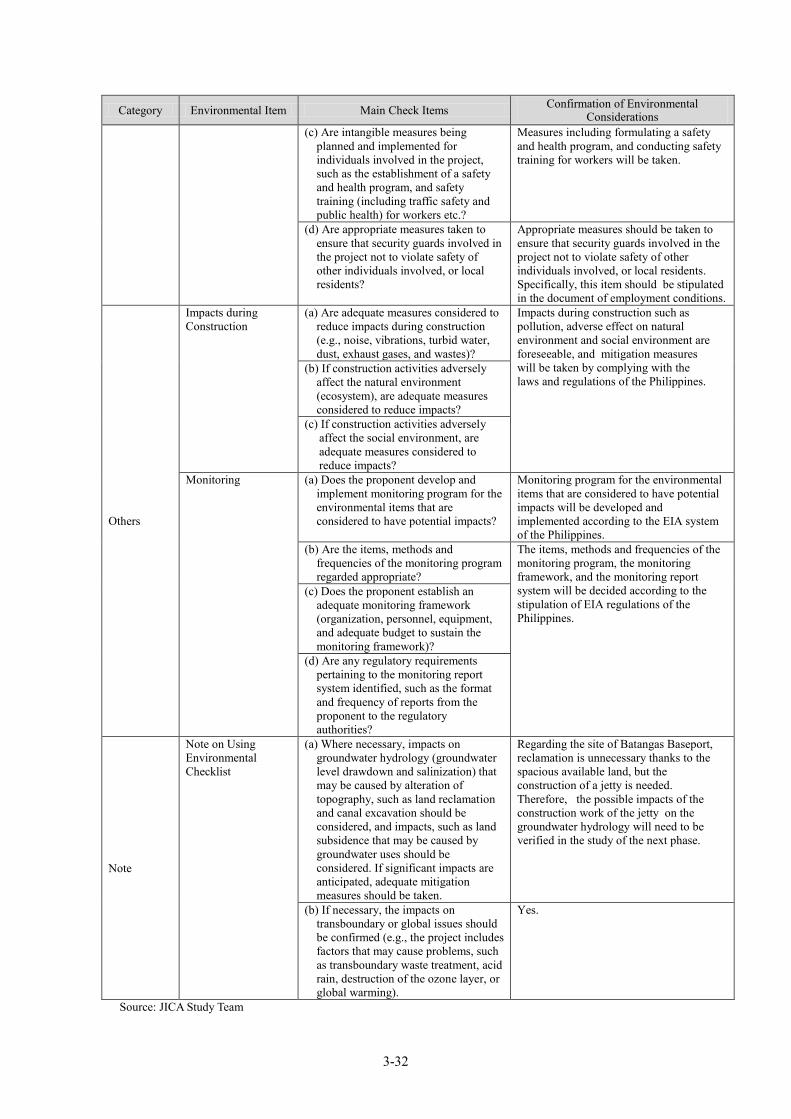
3-32
Category Environmental Item Main Check Items Confirmation of Environmental Considerations
(c) Are intangible measures being planned and implemented for individuals involved in the project, such as the establishment of a safety and health program, and safety training (including traffic safety and public health) for workers etc.?
Measures including formulating a safety and health program, and conducting safety training for workers will be taken.
(d) Are appropriate measures taken to ensure that security guards involved in the project not to violate safety of other individuals involved, or local residents?
Appropriate measures should be taken to ensure that security guards involved in the project not to violate safety of other individuals involved, or local residents. Specifically, this item should be stipulated in the document of employment conditions.
Others
Impacts during Construction
(a) Are adequate measures considered to reduce impacts during construction (e.g., noise, vibrations, turbid water, dust, exhaust gases, and wastes)?
Impacts during construction such as pollution, adverse effect on natural environment and social environment are foreseeable, and mitigation measures will be taken by complying with the laws and regulations of the Philippines.
(b) If construction activities adversely affect the natural environment (ecosystem), are adequate measures considered to reduce impacts?
(c) If construction activities adversely affect the social environment, are adequate measures considered to reduce impacts?
Monitoring (a) Does the proponent develop and implement monitoring program for the environmental items that are considered to have potential impacts?
Monitoring program for the environmental items that are considered to have potential impacts will be developed and implemented according to the EIA system of the Philippines.
(b) Are the items, methods and frequencies of the monitoring program regarded appropriate?
The items, methods and frequencies of the monitoring program, the monitoring framework, and the monitoring report system will be decided according to the stipulation of EIA regulations of the Philippines.
(c) Does the proponent establish an adequate monitoring framework (organization, personnel, equipment, and adequate budget to sustain the monitoring framework)?
(d) Are any regulatory requirements pertaining to the monitoring report system identified, such as the format and frequency of reports from the proponent to the regulatory authorities?
Note
Note on Using Environmental Checklist
(a) Where necessary, impacts on groundwater hydrology (groundwater level drawdown and salinization) that may be caused by alteration of topography, such as land reclamation and canal excavation should be considered, and impacts, such as land subsidence that may be caused by groundwater uses should be considered. If significant impacts are anticipated, adequate mitigation measures should be taken.
Regarding the site of Batangas Baseport, reclamation is unnecessary thanks to the spacious available land, but the construction of a jetty is needed. Therefore, the possible impacts of the construction work of the jetty on the groundwater hydrology will need to be verified in the study of the next phase.
(b) If necessary, the impacts on transboundary or global issues should be confirmed (e.g., the project includes factors that may cause problems, such as transboundary waste treatment, acid rain, destruction of the ozone layer, or global warming).
Yes.
Source: JICA Study Team
3-33
(2) Draft of the Scoping Document
The Scoping document is to be prepared as indicated previously in Table 3.2-2, whereby a total of thirty items in the four categories of pollution control, natural environment, social environment and others are to be evaluated with the grades from A to D. The specific work of Scoping with regard to the LNG component will be conducted in the study of the next stage. 3.3.3 Current Status of ROW and Land Acquisition The site of LNG terminal is envisioned as the public land under the jurisdiction of the Batangas Port Authority. So long as the land can be acquired through open bidding, it is possible to use it for a long time by way of leasing, though the leasing contract will need to be renewed every seven years. Accordingly, efforts in obtaining additional ROW and land are unnecessary. 3.3.4 Scale and Compensations of Resettlement The LNG terminal component is not expected to cause any involuntary resettlement, but it needs to make sure whether resettlement will happen or not when the installation work is required to connect the LNG terminal with the pipeline afterwards. 3.3.5 Indigenous Peoples As was mentioned in (2) of 3.3.1, there are tribes of indigenous people known as Bajau living in the coastal areas of the Batangas Bay, and though it is almost impossible for the implementation of this project to violate their interest on shore, it still needs to be clarified whether the marine component of the LNG terminal, i.e. the jetty and the ship berth and so on, will overlap with the area where the Bajau people have their fishing ground, and whether the project will have negative effect on their livelihood or not.
3-34
3.4 CO2 Emission Reduction Effect Expected to Be Brought by the Proposed Project It can be expected that part of the environmental improvement effect to be brought by the implementation of this project will be reflected in the effect of CO2 emission reduction. In this section, the CO2 emission reduction effect to be brought by the implementation of this project are estimated focusing on the electric power sector and industrial sector of Luzon Region which is assumed to be the area to benefit from this project . The estimation covers the period from the year of 2017 when the pipeline installation work is to be completed to the year of 2030 which is the final year of demand forecast conducted in this study. The result estimation shows that the total CO2 emission reduction including both the electric power sector and the industrial sector is expected to attain 14.5Mt. The specific way of estimation regarding the two sectors and their respective results are as follows. 3.4.1 CO2 Emission Reduction Effect on the Electric Power Sector (1) CO2 Emission from the Power Sector in Luzon Area with the Implementation of This
Project According to the result of projection for future natural gas demand in Chapter 4, the amount of annual natural gas consumption relevant to the additional installation of electric power sector in Luzon Region by 2030 will be 697 MMNm3 starting from 2022 and 1,395 MMNm3
from2025. Moreover, during the 4 year’s period from 2017 to 2020, which is envisioned as the period begun with the completion of the pipeline installation work and lasting through to the year when the LNG terminal start operation, a limited amount of natural gas envisioned as around 123 million Nm3 per annum will be provided to a power generation station of 100 MW in capacity from the Camago-Malampaya gas field through pipelines. Accordingly, CO2 emission resulted from the natural gas consumption by the electric power sector in Luzon area with regard to this project during the period from 2017 to 2030 can be divided into three time frames, i.e. the time frames of 2017-2021, 2022-2024 and 2025-2030. As seen from Table 3.4-1, the total amount of CO2 emission resulted from the natural gas consumption is estimated as 25.2Mt. (2) Energy Consumption by Fuel Type Relevant to Generation in the Case without This
Project Meanwhile, assume that in the case of without this project, the generation mix in 2013 envisioned by DOE will remain the same up to 2030, and the generating efficiency of coal and oil/natural gas will be 40% and 55% respectively, the annual energy consumption by fuel type based on the above-mentioned generation mix expressed in heat value to be replaced by utilizing natural gas with this project can be worked out and displayed in the afore-mentioned three time frames as follows: 2017-2021: Coal 329,286Gcal Oil 100,122Gcal Natural gas 230,010Gcal 2022-2024: Coal 1,865,956Gcal Oil 567,358Gcal Natural gas 1,303,390Gcal 2025-2030: Coal 3,734,589Gcal Oil 1,135,530Gcal Natural gas 2,608,650Gcal (3) CO2 Emission Reduction with the Implementation of This Project The annual CO2 emission by fuel type can be worked out by multiplying the heat values of respective fuel types with CO2 conversion factors. In order to estimate the CO2 emission reduction effect, it is necessary to compare the afore-mentioned CO2 emission value with the implementation of this project with the values of CO2 emission by coal and oil consumption in the case without this project. The results of CO2 emission reduction in the three time frames are worked out as follows: 2017-2021: 84.7kt 2022-2024: 480kt 2025-2030: 960.7kt
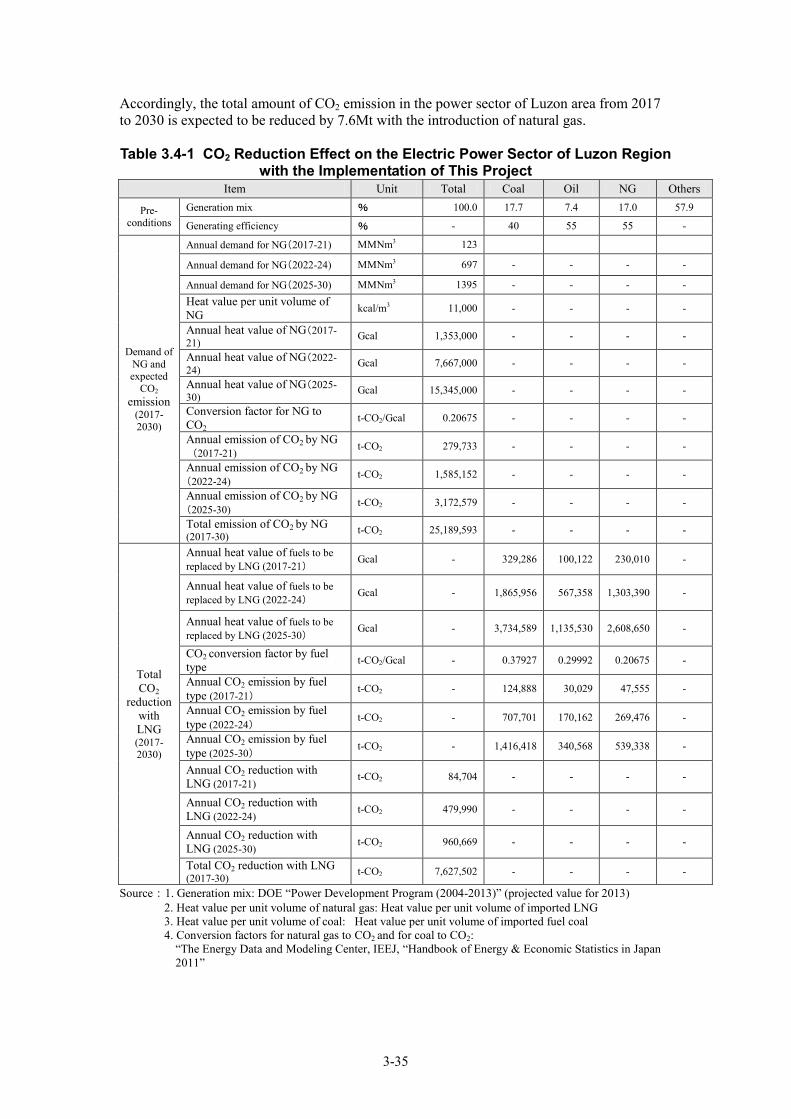
3-35
Accordingly, the total amount of CO2 emission in the power sector of Luzon area from 2017 to 2030 is expected to be reduced by 7.6Mt with the introduction of natural gas. Table 3.4-1 CO2 Reduction Effect on the Electric Power Sector of Luzon Region
with the Implementation of This Project Item Unit Total Coal Oil NG Others
Pre-conditions
Generation mix % 100.0 17.7 7.4 17.0 57.9
Generating efficiency % - 40 55 55 -
Demand of NG and expected
CO2
emission (2017-2030)
Annual demand for NG(2017-21) MMNm3 123
Annual demand for NG(2022-24) MMNm3 697 - - - -
Annual demand for NG(2025-30) MMNm3 1395 - - - - Heat value per unit volume of NG
kcal/m3 11,000 - - - -
Annual heat value of NG(2017-21)
Gcal 1,353,000 - - - -
Annual heat value of NG(2022-24)
Gcal 7,667,000 - - - -
Annual heat value of NG(2025-30)
Gcal 15,345,000 - - - -
Conversion factor for NG to CO2
t-CO2/Gcal 0.20675 - - - -
Annual emission of CO2 by NG(2017-21)
t-CO2 279,733 - - - -
Annual emission of CO2 by NG(2022-24)
t-CO2 1,585,152 - - - -
Annual emission of CO2 by NG(2025-30)
t-CO2 3,172,579 - - - -
Total emission of CO2 by NG (2017-30) t-CO2 25,189,593 - - - -
Total CO2
reduction with LNG (2017-2030)
Annual heat value of fuels to be replaced by LNG (2017-21)
Gcal - 329,286 100,122 230,010 -
Annual heat value of fuels to be replaced by LNG (2022-24)
Gcal - 1,865,956 567,358 1,303,390 -
Annual heat value of fuels to be replaced by LNG (2025-30)
Gcal - 3,734,589 1,135,530 2,608,650 -
CO2 conversion factor by fuel type
t-CO2/Gcal - 0.37927 0.29992 0.20675 -
Annual CO2 emission by fuel type (2017-21)
t-CO2 - 124,888 30,029 47,555 -
Annual CO2 emission by fuel type (2022-24)
t-CO2 - 707,701 170,162 269,476 -
Annual CO2 emission by fuel type (2025-30)
t-CO2 - 1,416,418 340,568 539,338 -
Annual CO2 reduction with LNG (2017-21)
t-CO2 84,704 - - - -
Annual CO2 reduction with LNG (2022-24)
t-CO2 479,990 - - - -
Annual CO2 reduction with LNG (2025-30)
t-CO2 960,669 - - - -
Total CO2 reduction with LNG (2017-30) t-CO2 7,627,502 - - - -
Source:1. Generation mix: DOE “Power Development Program (2004-2013)” (projected value for 2013) 2. Heat value per unit volume of natural gas: Heat value per unit volume of imported LNG 3. Heat value per unit volume of coal: Heat value per unit volume of imported fuel coal 4. Conversion factors for natural gas to CO2 and for coal to CO2:
“The Energy Data and Modeling Center, IEEJ, “Handbook of Energy & Economic Statistics in Japan 2011”
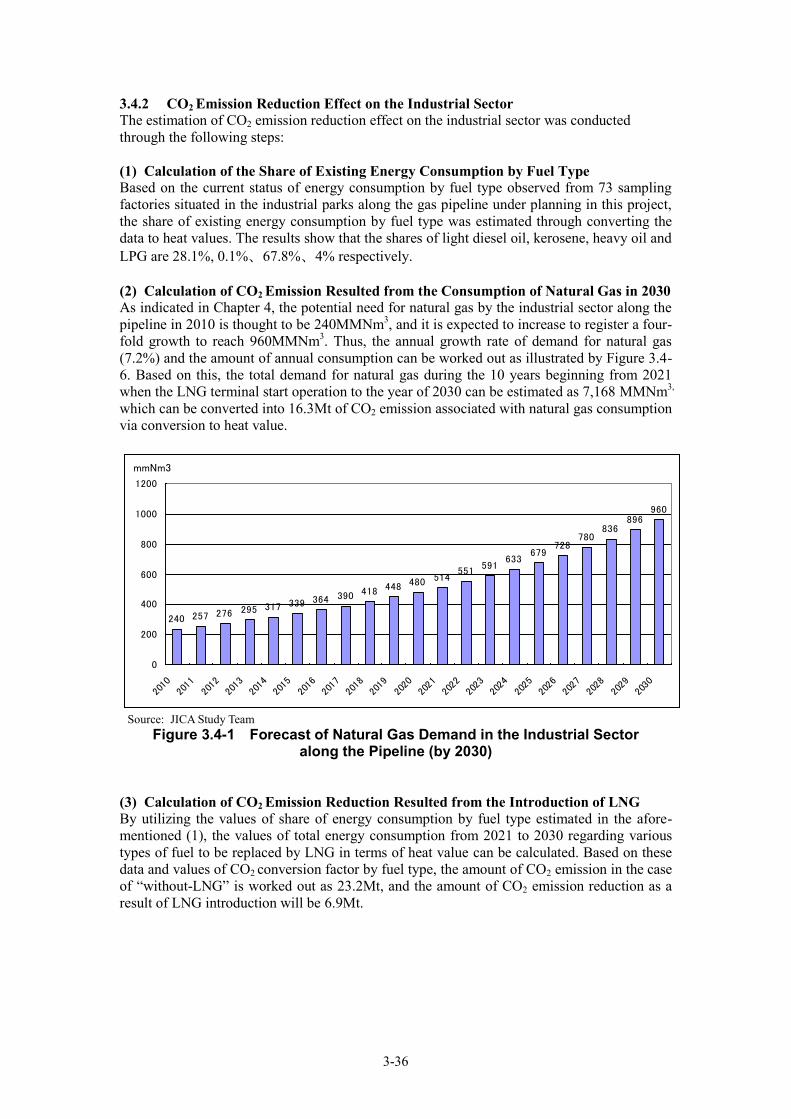
3-36
3.4.2 CO2 Emission Reduction Effect on the Industrial Sector The estimation of CO2 emission reduction effect on the industrial sector was conducted through the following steps: (1) Calculation of the Share of Existing Energy Consumption by Fuel Type Based on the current status of energy consumption by fuel type observed from 73 sampling factories situated in the industrial parks along the gas pipeline under planning in this project, the share of existing energy consumption by fuel type was estimated through converting the data to heat values. The results show that the shares of light diesel oil, kerosene, heavy oil and LPG are 28.1%, 0.1%、67.8%、4% respectively. (2) Calculation of CO2 Emission Resulted from the Consumption of Natural Gas in 2030 As indicated in Chapter 4, the potential need for natural gas by the industrial sector along the pipeline in 2010 is thought to be 240MMNm3, and it is expected to increase to register a four-fold growth to reach 960MMNm3. Thus, the annual growth rate of demand for natural gas (7.2%) and the amount of annual consumption can be worked out as illustrated by Figure 3.4-6. Based on this, the total demand for natural gas during the 10 years beginning from 2021 when the LNG terminal start operation to the year of 2030 can be estimated as 7,168 MMNm3,
which can be converted into 16.3Mt of CO2 emission associated with natural gas consumption via conversion to heat value.
240 257 276 295 317 339 364 390 418 448 480 514551
591633
679728
780836
896960
0
200
400
600
800
1000
1200
2010
2011
2012
2013
2014
2015
2016
2017
2018
2019
2020
2021
2022
2023
2024
2025
2026
2027
2028
2029
2030
mmNm3
Source: JICA Study Team
Figure 3.4-1 Forecast of Natural Gas Demand in the Industrial Sector along the Pipeline (by 2030)
(3) Calculation of CO2 Emission Reduction Resulted from the Introduction of LNG By utilizing the values of share of energy consumption by fuel type estimated in the afore-mentioned (1), the values of total energy consumption from 2021 to 2030 regarding various types of fuel to be replaced by LNG in terms of heat value can be calculated. Based on these data and values of CO2 conversion factor by fuel type, the amount of CO2 emission in the case of “without-LNG” is worked out as 23.2Mt, and the amount of CO2 emission reduction as a result of LNG introduction will be 6.9Mt.
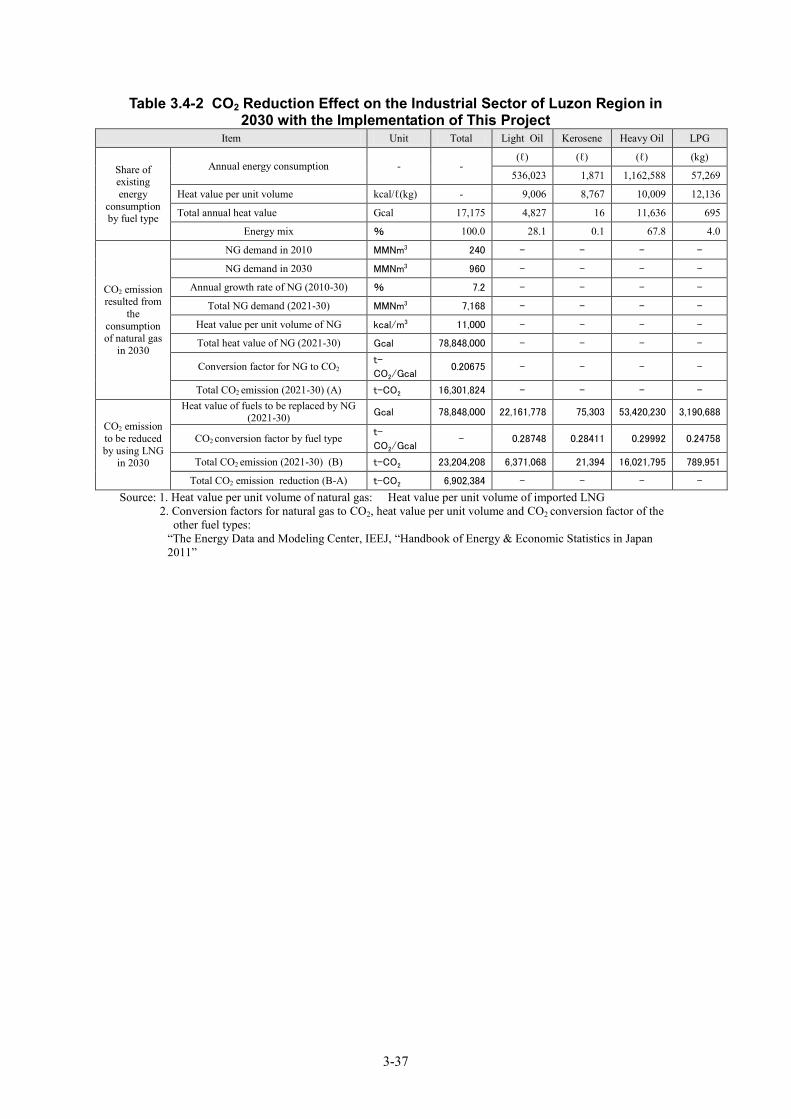
3-37
Table 3.4-2 CO2 Reduction Effect on the Industrial Sector of Luzon Region in 2030 with the Implementation of This Project
Item Unit Total Light Oil Kerosene Heavy Oil LPG
Share of existing energy
consumption by fuel type
Annual energy consumption - - (ℓ) (ℓ) (ℓ) (kg)
536,023 1,871 1,162,588 57,269
Heat value per unit volume kcal/ℓ(kg) - 9,006 8,767 10,009 12,136
Total annual heat value Gcal 17,175 4,827 16 11,636 695
Energy mix % 100.0 28.1 0.1 67.8 4.0
CO2 emission resulted from
the consumption of natural gas
in 2030
NG demand in 2010 MMNm3 240 - - - -
NG demand in 2030 MMNm3 960 - - - -
Annual growth rate of NG (2010-30) % 7.2 - - - -
Total NG demand (2021-30) MMNm3 7,168 - - - -
Heat value per unit volume of NG kcal/m3 11,000 - - - -
Total heat value of NG (2021-30) Gcal 78,848,000 - - - -
Conversion factor for NG to CO2 t-
CO2/Gcal 0.20675 - - - -
Total CO2 emission (2021-30) (A) t-CO2 16,301,824 - - - -
CO2 emission to be reduced by using LNG
in 2030
Heat value of fuels to be replaced by NG (2021-30) Gcal 78,848,000 22,161,778 75,303 53,420,230 3,190,688
CO2 conversion factor by fuel type t-
CO2/Gcal - 0.28748 0.28411 0.29992 0.24758
Total CO2 emission (2021-30) (B) t-CO2 23,204,208 6,371,068 21,394 16,021,795 789,951
Total CO2 emission reduction (B-A) t-CO2 6,902,384 - - - -
Source: 1. Heat value per unit volume of natural gas: Heat value per unit volume of imported LNG 2. Conversion factors for natural gas to CO2, heat value per unit volume and CO2 conversion factor of the
other fuel types: “The Energy Data and Modeling Center, IEEJ, “Handbook of Energy & Economic Statistics in Japan 2011”

3-38
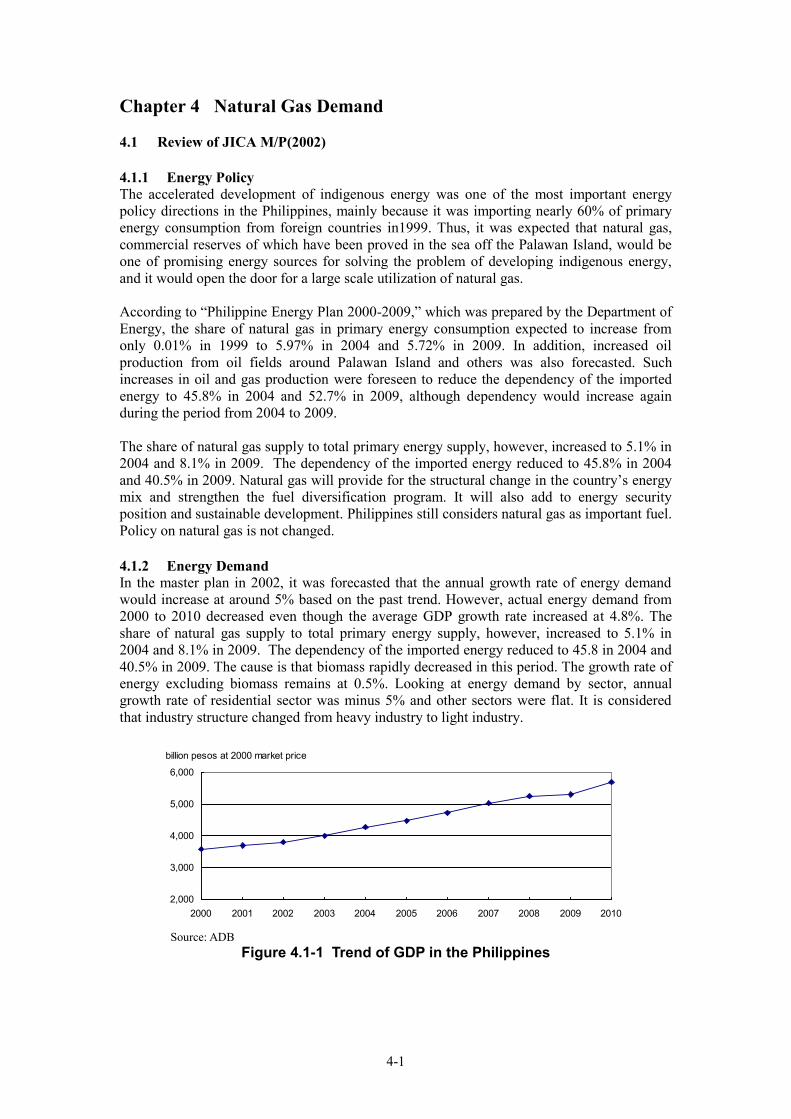
4-1
2,000
3,000
4,000
5,000
6,000
2000 2001 2002 2003 2004 2005 2006 2007 2008 2009 2010
billion pesos at 2000 market price
Chapter 4 Natural Gas Demand 4.1 Review of JICA M/P(2002) 4.1.1 Energy Policy The accelerated development of indigenous energy was one of the most important energy policy directions in the Philippines, mainly because it was importing nearly 60% of primary energy consumption from foreign countries in1999. Thus, it was expected that natural gas, commercial reserves of which have been proved in the sea off the Palawan Island, would be one of promising energy sources for solving the problem of developing indigenous energy, and it would open the door for a large scale utilization of natural gas. According to “Philippine Energy Plan 2000-2009,” which was prepared by the Department of Energy, the share of natural gas in primary energy consumption expected to increase from only 0.01% in 1999 to 5.97% in 2004 and 5.72% in 2009. In addition, increased oil production from oil fields around Palawan Island and others was also forecasted. Such increases in oil and gas production were foreseen to reduce the dependency of the imported energy to 45.8% in 2004 and 52.7% in 2009, although dependency would increase again during the period from 2004 to 2009. The share of natural gas supply to total primary energy supply, however, increased to 5.1% in 2004 and 8.1% in 2009. The dependency of the imported energy reduced to 45.8% in 2004 and 40.5% in 2009. Natural gas will provide for the structural change in the country’s energy mix and strengthen the fuel diversification program. It will also add to energy security position and sustainable development. Philippines still considers natural gas as important fuel. Policy on natural gas is not changed. 4.1.2 Energy Demand In the master plan in 2002, it was forecasted that the annual growth rate of energy demand would increase at around 5% based on the past trend. However, actual energy demand from 2000 to 2010 decreased even though the average GDP growth rate increased at 4.8%. The share of natural gas supply to total primary energy supply, however, increased to 5.1% in 2004 and 8.1% in 2009. The dependency of the imported energy reduced to 45.8 in 2004 and 40.5% in 2009. The cause is that biomass rapidly decreased in this period. The growth rate of energy excluding biomass remains at 0.5%. Looking at energy demand by sector, annual growth rate of residential sector was minus 5% and other sectors were flat. It is considered that industry structure changed from heavy industry to light industry.
Source: ADB
Figure 4.1-1 Trend of GDP in the Philippines
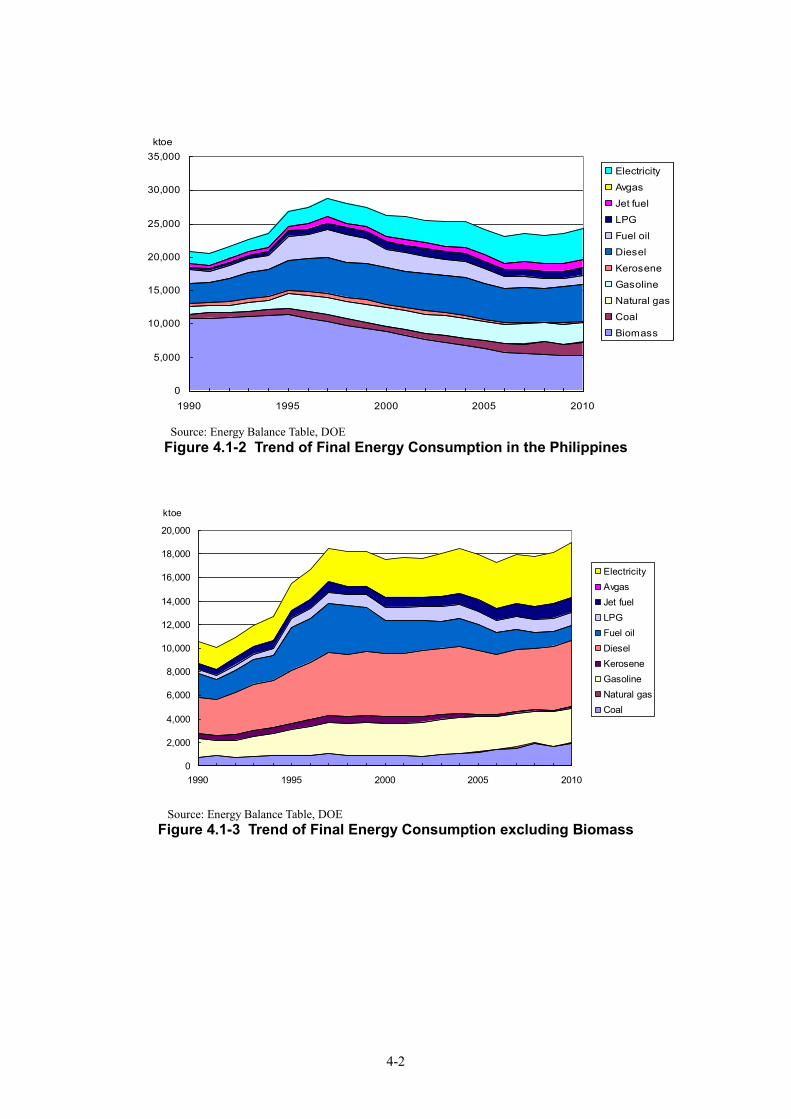
4-2
0
5,000
10,000
15,000
20,000
25,000
30,000
35,000
1990 1995 2000 2005 2010
ktoe
Electricity
Avgas
Jet fuel
LPG
Fuel oil
Diesel
Kerosene
Gasoline
Natural gas
Coal
Biomass
0
2,000
4,000
6,000
8,000
10,000
12,000
14,000
16,000
18,000
20,000
1990 1995 2000 2005 2010
ktoe
ElectricityAvgasJet fuelLPGFuel oilDieselKeroseneGasolineNatural gasCoal
Source: Energy Balance Table, DOE
Figure 4.1-2 Trend of Final Energy Consumption in the Philippines
Source: Energy Balance Table, DOE
Figure 4.1-3 Trend of Final Energy Consumption excluding Biomass
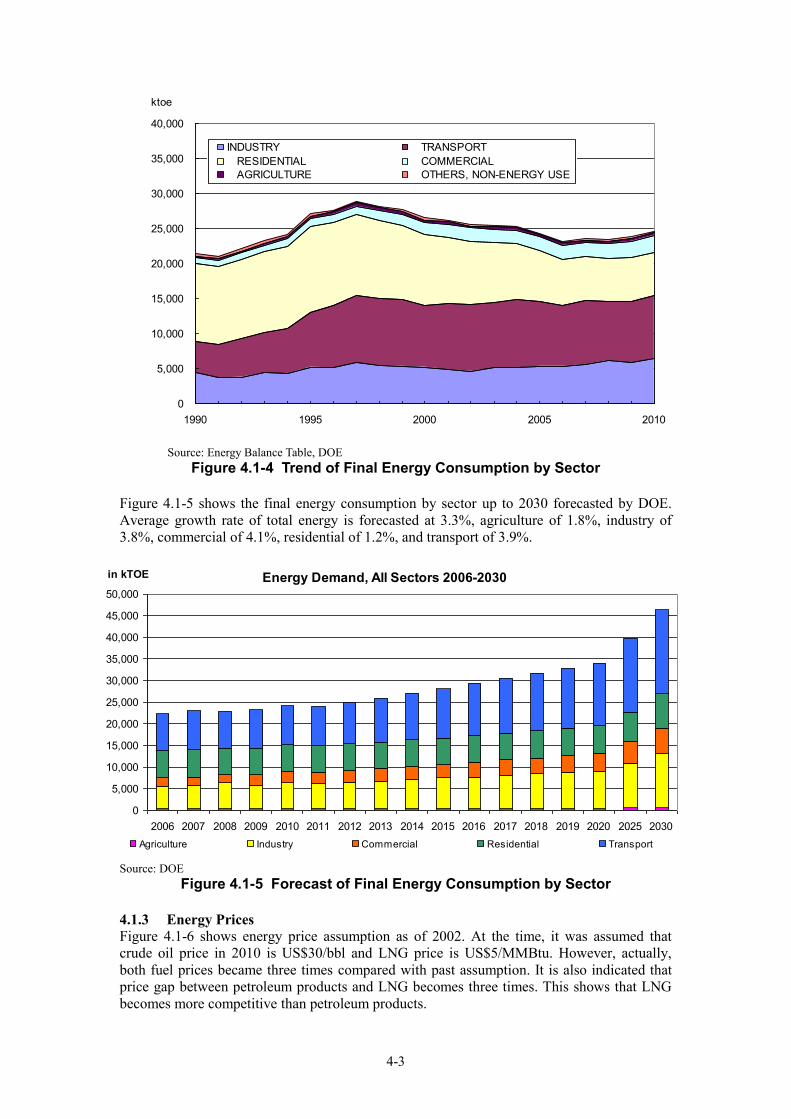
4-3
0
5,000
10,000
15,000
20,000
25,000
30,000
35,000
40,000
1990 1995 2000 2005 2010
ktoe
INDUSTRY TRANSPORT RESIDENTIAL COMMERCIAL AGRICULTURE OTHERS, NON-ENERGY USE
Source: Energy Balance Table, DOE
Figure 4.1-4 Trend of Final Energy Consumption by Sector Figure 4.1-5 shows the final energy consumption by sector up to 2030 forecasted by DOE. Average growth rate of total energy is forecasted at 3.3%, agriculture of 1.8%, industry of 3.8%, commercial of 4.1%, residential of 1.2%, and transport of 3.9%.
Source: DOE
Figure 4.1-5 Forecast of Final Energy Consumption by Sector 4.1.3 Energy Prices Figure 4.1-6 shows energy price assumption as of 2002. At the time, it was assumed that crude oil price in 2010 is US$30/bbl and LNG price is US$5/MMBtu. However, actually, both fuel prices became three times compared with past assumption. It is also indicated that price gap between petroleum products and LNG becomes three times. This shows that LNG becomes more competitive than petroleum products.
Energy Demand, All Sectors 2006-2030
0
5,000
10,000
15,000
20,000
25,000
30,000
35,000
40,000
45,000
50,000
2006 2007 2008 2009 2010 2011 2012 2013 2014 2015 2016 2017 2018 2019 2020 2025 2030
in kTOE
Agriculture Industry Commercial Residential Transport
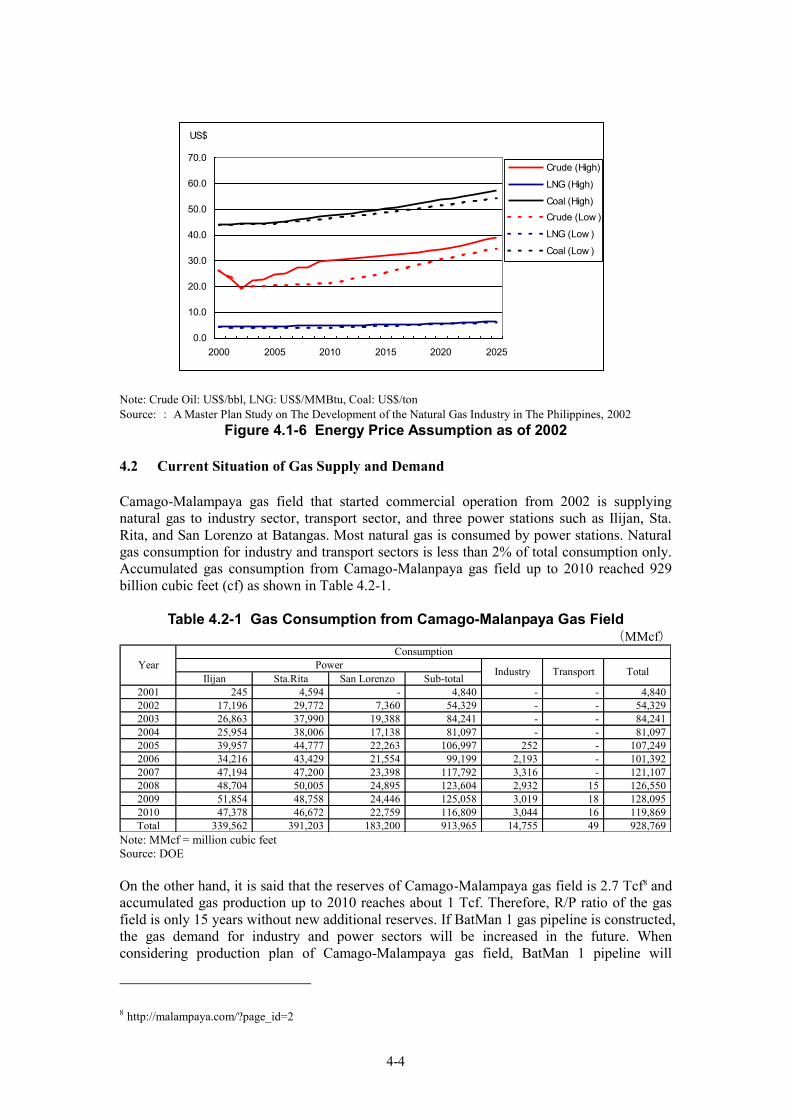
4-4
Note: Crude Oil: US$/bbl, LNG: US$/MMBtu, Coal: US$/ton Source: : A Master Plan Study on The Development of the Natural Gas Industry in The Philippines, 2002
Figure 4.1-6 Energy Price Assumption as of 2002 4.2 Current Situation of Gas Supply and Demand Camago-Malampaya gas field that started commercial operation from 2002 is supplying natural gas to industry sector, transport sector, and three power stations such as Ilijan, Sta. Rita, and San Lorenzo at Batangas. Most natural gas is consumed by power stations. Natural gas consumption for industry and transport sectors is less than 2% of total consumption only. Accumulated gas consumption from Camago-Malanpaya gas field up to 2010 reached 929 billion cubic feet (cf) as shown in Table 4.2-1.
Table 4.2-1 Gas Consumption from Camago-Malanpaya Gas Field (MMcf)
Ilijan Sta.Rita San Lorenzo Sub-total2001 245 4,594 - 4,840 - - 4,840 2002 17,196 29,772 7,360 54,329 - - 54,329 2003 26,863 37,990 19,388 84,241 - - 84,241 2004 25,954 38,006 17,138 81,097 - - 81,097 2005 39,957 44,777 22,263 106,997 252 - 107,249 2006 34,216 43,429 21,554 99,199 2,193 - 101,392 2007 47,194 47,200 23,398 117,792 3,316 - 121,107 2008 48,704 50,005 24,895 123,604 2,932 15 126,550 2009 51,854 48,758 24,446 125,058 3,019 18 128,095 2010 47,378 46,672 22,759 116,809 3,044 16 119,869 Total 339,562 391,203 183,200 913,965 14,755 49 928,769
YearConsumption
Power Industry Transport Total
Note: MMcf = million cubic feet Source: DOE On the other hand, it is said that the reserves of Camago-Malampaya gas field is 2.7 Tcf8 and accumulated gas production up to 2010 reaches about 1 Tcf. Therefore, R/P ratio of the gas field is only 15 years without new additional reserves. If BatMan 1 gas pipeline is constructed, the gas demand for industry and power sectors will be increased in the future. When considering production plan of Camago-Malampaya gas field, BatMan 1 pipeline will
8 http://malampaya.com/?page_id=2
0.0
10.0
20.0
30.0
40.0
50.0
60.0
70.0
2000 2005 2010 2015 2020 2025
US$
Crude (High)
LNG (High)
Coal (High)Crude (Low )
LNG (Low )
Coal (Low )
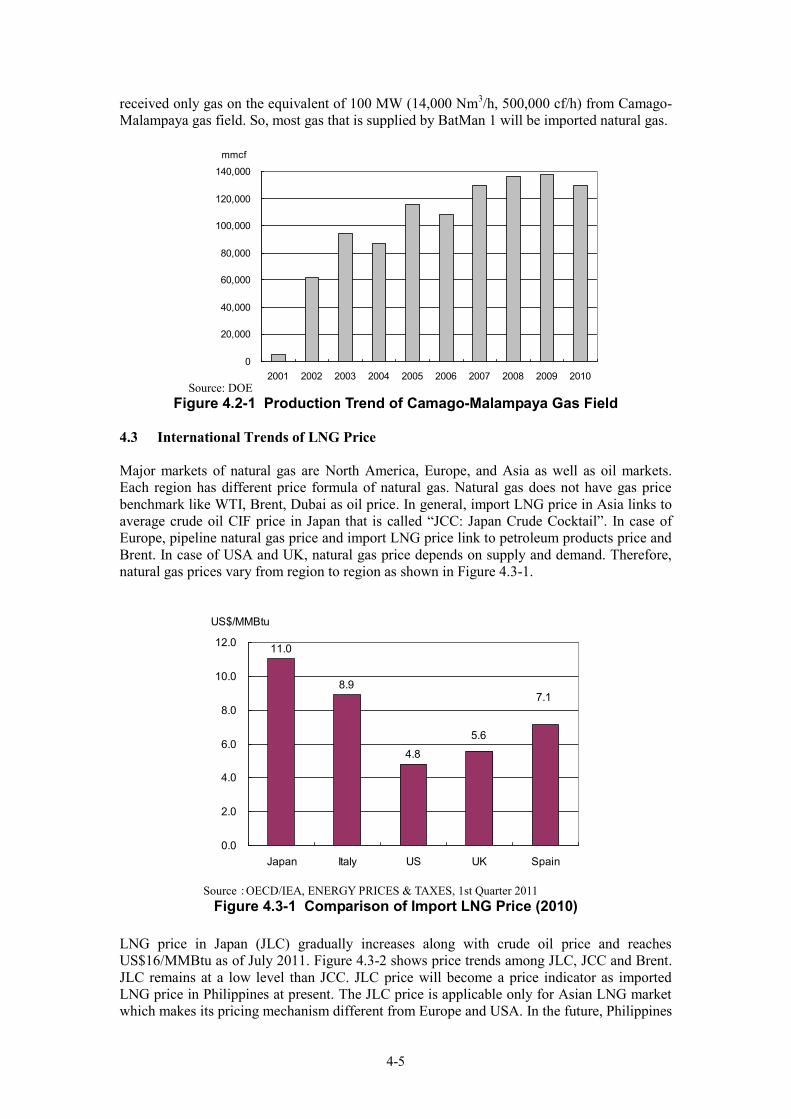
4-5
0
20,000
40,000
60,000
80,000
100,000
120,000
140,000
2001 2002 2003 2004 2005 2006 2007 2008 2009 2010
mmcf
11.0
8.9
4.8
5.6
7.1
0.0
2.0
4.0
6.0
8.0
10.0
12.0
Japan Italy US UK Spain
US$/MMBtu
received only gas on the equivalent of 100 MW (14,000 Nm3/h, 500,000 cf/h) from Camago-Malampaya gas field. So, most gas that is supplied by BatMan 1 will be imported natural gas. Source: DOE
Figure 4.2-1 Production Trend of Camago-Malampaya Gas Field 4.3 International Trends of LNG Price Major markets of natural gas are North America, Europe, and Asia as well as oil markets. Each region has different price formula of natural gas. Natural gas does not have gas price benchmark like WTI, Brent, Dubai as oil price. In general, import LNG price in Asia links to average crude oil CIF price in Japan that is called “JCC: Japan Crude Cocktail”. In case of Europe, pipeline natural gas price and import LNG price link to petroleum products price and Brent. In case of USA and UK, natural gas price depends on supply and demand. Therefore, natural gas prices vary from region to region as shown in Figure 4.3-1.
Source:OECD/IEA, ENERGY PRICES & TAXES, 1st Quarter 2011
Figure 4.3-1 Comparison of Import LNG Price (2010) LNG price in Japan (JLC) gradually increases along with crude oil price and reaches US$16/MMBtu as of July 2011. Figure 4.3-2 shows price trends among JLC, JCC and Brent. JLC remains at a low level than JCC. JLC price will become a price indicator as imported LNG price in Philippines at present. The JLC price is applicable only for Asian LNG market which makes its pricing mechanism different from Europe and USA. In the future, Philippines
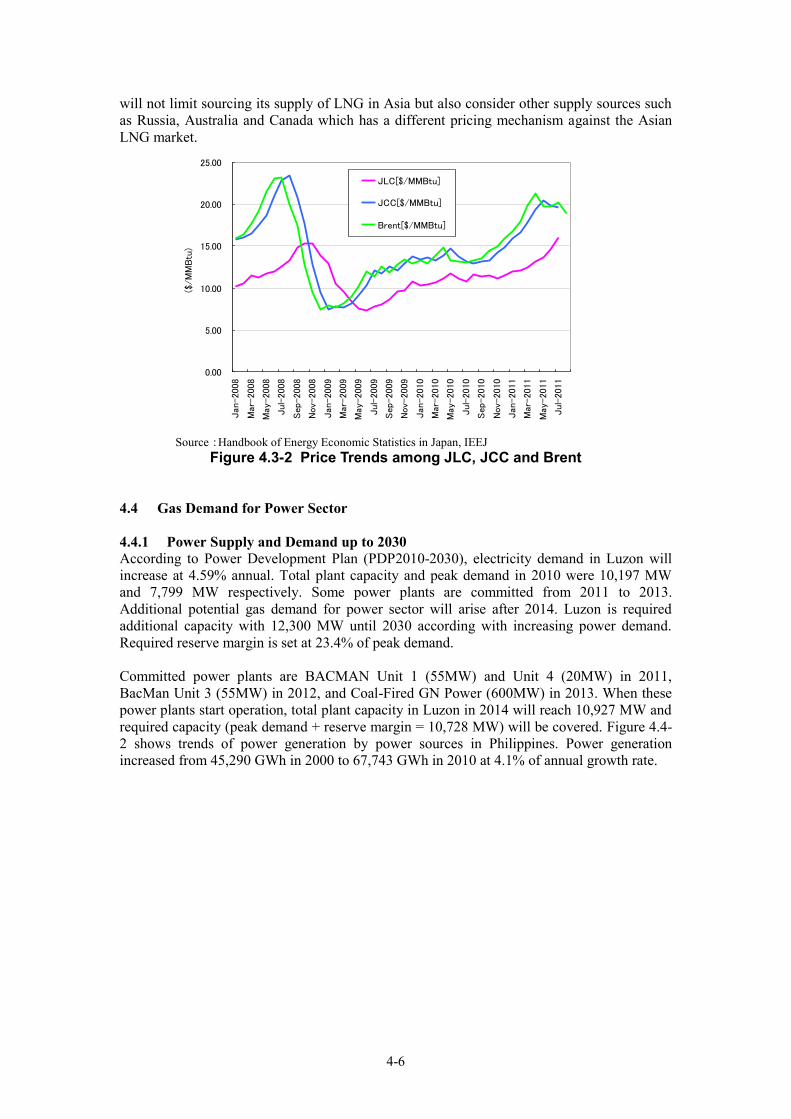
4-6
will not limit sourcing its supply of LNG in Asia but also consider other supply sources such as Russia, Australia and Canada which has a different pricing mechanism against the Asian LNG market.
Source:Handbook of Energy Economic Statistics in Japan, IEEJ
Figure 4.3-2 Price Trends among JLC, JCC and Brent 4.4 Gas Demand for Power Sector 4.4.1 Power Supply and Demand up to 2030 According to Power Development Plan (PDP2010-2030), electricity demand in Luzon will increase at 4.59% annual. Total plant capacity and peak demand in 2010 were 10,197 MW and 7,799 MW respectively. Some power plants are committed from 2011 to 2013. Additional potential gas demand for power sector will arise after 2014. Luzon is required additional capacity with 12,300 MW until 2030 according with increasing power demand. Required reserve margin is set at 23.4% of peak demand. Committed power plants are BACMAN Unit 1 (55MW) and Unit 4 (20MW) in 2011, BacMan Unit 3 (55MW) in 2012, and Coal-Fired GN Power (600MW) in 2013. When these power plants start operation, total plant capacity in Luzon in 2014 will reach 10,927 MW and required capacity (peak demand + reserve margin = 10,728 MW) will be covered. Figure 4.4-2 shows trends of power generation by power sources in Philippines. Power generation increased from 45,290 GWh in 2000 to 67,743 GWh in 2010 at 4.1% of annual growth rate.
0.00
5.00
10.00
15.00
20.00
25.00
Jan
-200
8
Mar
-200
8
May
-200
8
Jul
-200
8
Sep
-200
8
Nov
-200
8
Jan
-200
9
Mar
-200
9
May
-200
9
Jul
-200
9
Sep
-200
9
Nov
-200
9
Jan
-201
0
Mar
-201
0
May
-201
0
Jul
-201
0
Sep
-201
0
Nov
-201
0
Jan
-201
1
Mar
-201
1
May
-201
1
Jul
-201
1
($/M
MB
tu)
JLC[$/MMBtu]
JCC[$/MMBtu]
Brent[$/MMBtu]
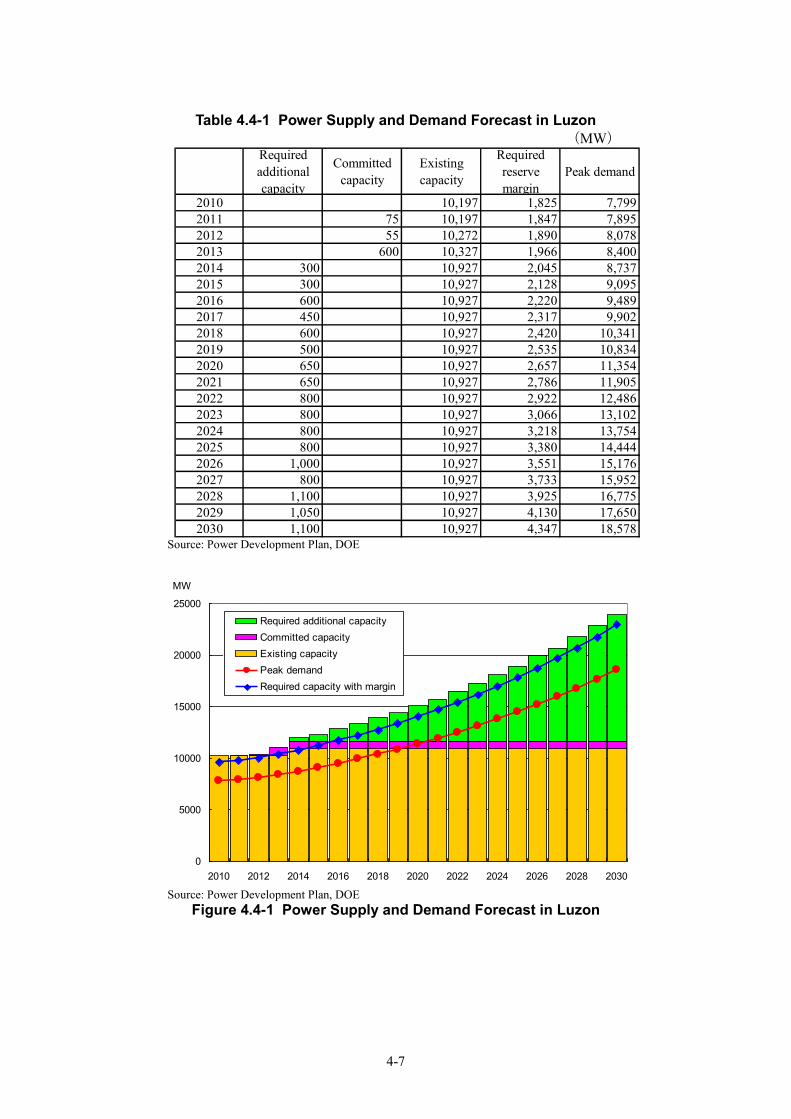
4-7
0
5000
10000
15000
20000
25000
2010 2012 2014 2016 2018 2020 2022 2024 2026 2028 2030
MW
Required additional capacityCommitted capacityExisting capacityPeak demandRequired capacity with margin
Table 4.4-1 Power Supply and Demand Forecast in Luzon
(MW)
Requiredadditionalcapacity
Committedcapacity
Existingcapacity
Requiredreservemargin
Peak demand
2010 10,197 1,825 7,7992011 75 10,197 1,847 7,8952012 55 10,272 1,890 8,0782013 600 10,327 1,966 8,4002014 300 10,927 2,045 8,7372015 300 10,927 2,128 9,0952016 600 10,927 2,220 9,4892017 450 10,927 2,317 9,9022018 600 10,927 2,420 10,3412019 500 10,927 2,535 10,8342020 650 10,927 2,657 11,3542021 650 10,927 2,786 11,9052022 800 10,927 2,922 12,4862023 800 10,927 3,066 13,1022024 800 10,927 3,218 13,7542025 800 10,927 3,380 14,4442026 1,000 10,927 3,551 15,1762027 800 10,927 3,733 15,9522028 1,100 10,927 3,925 16,7752029 1,050 10,927 4,130 17,6502030 1,100 10,927 4,347 18,578
Source: Power Development Plan, DOE Source: Power Development Plan, DOE
Figure 4.4-1 Power Supply and Demand Forecast in Luzon
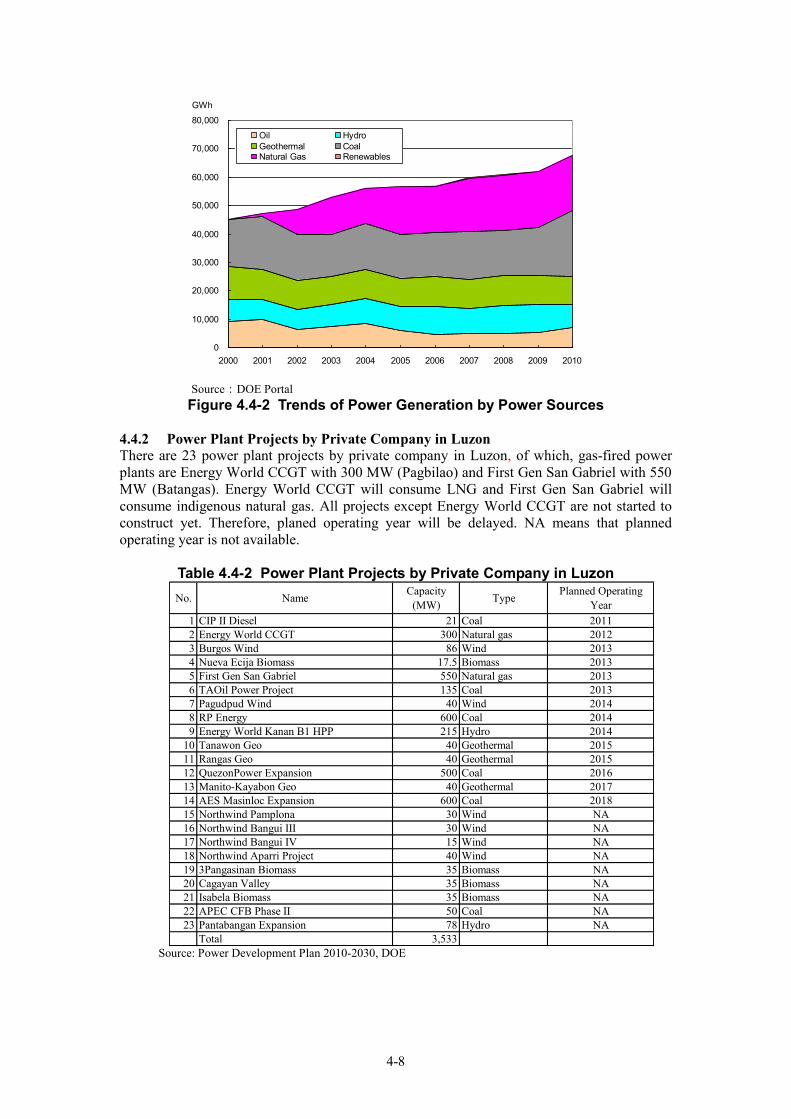
4-8
0
10,000
20,000
30,000
40,000
50,000
60,000
70,000
80,000
2000 2001 2002 2003 2004 2005 2006 2007 2008 2009 2010
GWh
Oil HydroGeothermal CoalNatural Gas Renewables
Source:DOE Portal Figure 4.4-2 Trends of Power Generation by Power Sources
4.4.2 Power Plant Projects by Private Company in Luzon There are 23 power plant projects by private company in Luzon, of which, gas-fired power plants are Energy World CCGT with 300 MW (Pagbilao) and First Gen San Gabriel with 550 MW (Batangas). Energy World CCGT will consume LNG and First Gen San Gabriel will consume indigenous natural gas. All projects except Energy World CCGT are not started to construct yet. Therefore, planed operating year will be delayed. NA means that planned operating year is not available.
Table 4.4-2 Power Plant Projects by Private Company in Luzon
No. Name Capacity(MW) Type Planned Operating
Year1 CIP II Diesel 21 Coal 20112 Energy World CCGT 300 Natural gas 20123 Burgos Wind 86 Wind 20134 Nueva Ecija Biomass 17.5 Biomass 20135 First Gen San Gabriel 550 Natural gas 20136 TAOil Power Project 135 Coal 20137 Pagudpud Wind 40 Wind 20148 RP Energy 600 Coal 20149 Energy World Kanan B1 HPP 215 Hydro 2014
10 Tanawon Geo 40 Geothermal 201511 Rangas Geo 40 Geothermal 201512 QuezonPower Expansion 500 Coal 201613 Manito-Kayabon Geo 40 Geothermal 201714 AES Masinloc Expansion 600 Coal 201815 Northwind Pamplona 30 Wind NA16 Northwind Bangui III 30 Wind NA17 Northwind Bangui IV 15 Wind NA18 Northwind Aparri Project 40 Wind NA19 3Pangasinan Biomass 35 Biomass NA20 Cagayan Valley 35 Biomass NA21 Isabela Biomass 35 Biomass NA22 APEC CFB Phase II 50 Coal NA23 Pantabangan Expansion 78 Hydro NA
Total 3,533 Source: Power Development Plan 2010-2030, DOE
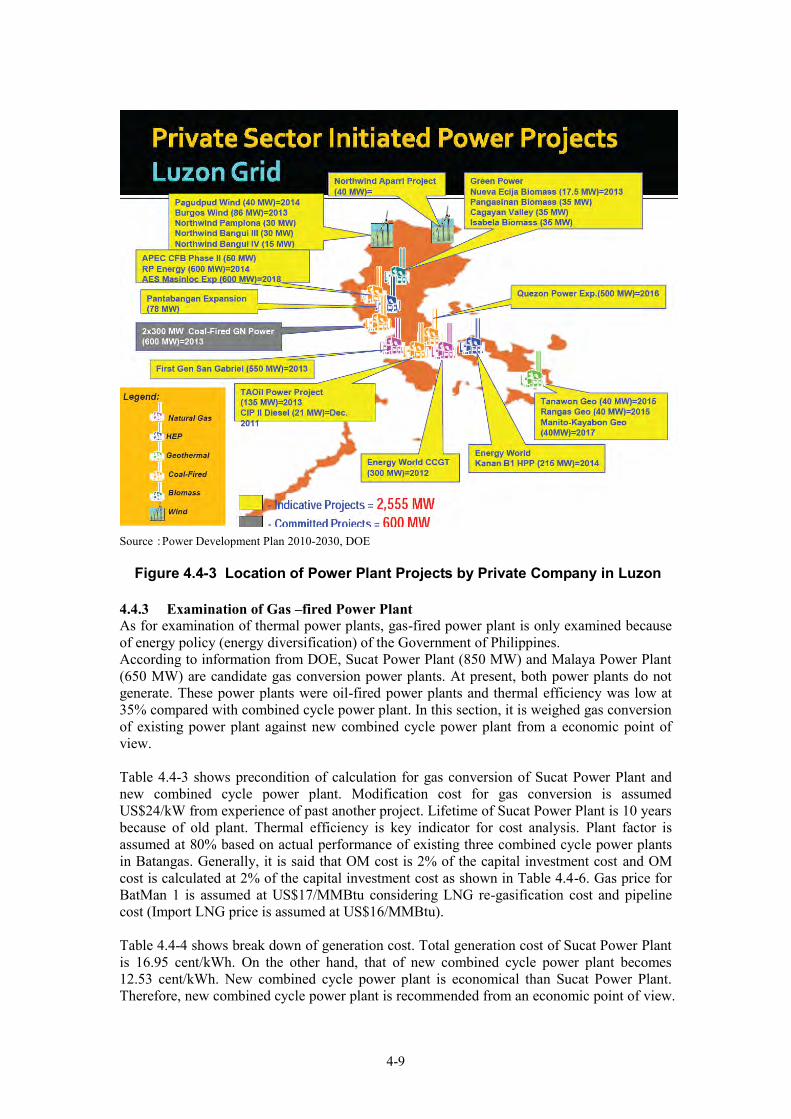
4-9
Source:Power Development Plan 2010-2030, DOE
Figure 4.4-3 Location of Power Plant Projects by Private Company in Luzon
4.4.3 Examination of Gas –fired Power Plant As for examination of thermal power plants, gas-fired power plant is only examined because of energy policy (energy diversification) of the Government of Philippines. According to information from DOE, Sucat Power Plant (850 MW) and Malaya Power Plant (650 MW) are candidate gas conversion power plants. At present, both power plants do not generate. These power plants were oil-fired power plants and thermal efficiency was low at 35% compared with combined cycle power plant. In this section, it is weighed gas conversion of existing power plant against new combined cycle power plant from a economic point of view. Table 4.4-3 shows precondition of calculation for gas conversion of Sucat Power Plant and new combined cycle power plant. Modification cost for gas conversion is assumed US$24/kW from experience of past another project. Lifetime of Sucat Power Plant is 10 years because of old plant. Thermal efficiency is key indicator for cost analysis. Plant factor is assumed at 80% based on actual performance of existing three combined cycle power plants in Batangas. Generally, it is said that OM cost is 2% of the capital investment cost and OM cost is calculated at 2% of the capital investment cost as shown in Table 4.4-6. Gas price for BatMan 1 is assumed at US$17/MMBtu considering LNG re-gasification cost and pipeline cost (Import LNG price is assumed at US$16/MMBtu). Table 4.4-4 shows break down of generation cost. Total generation cost of Sucat Power Plant is 16.95 cent/kWh. On the other hand, that of new combined cycle power plant becomes 12.53 cent/kWh. New combined cycle power plant is economical than Sucat Power Plant. Therefore, new combined cycle power plant is recommended from an economic point of view.
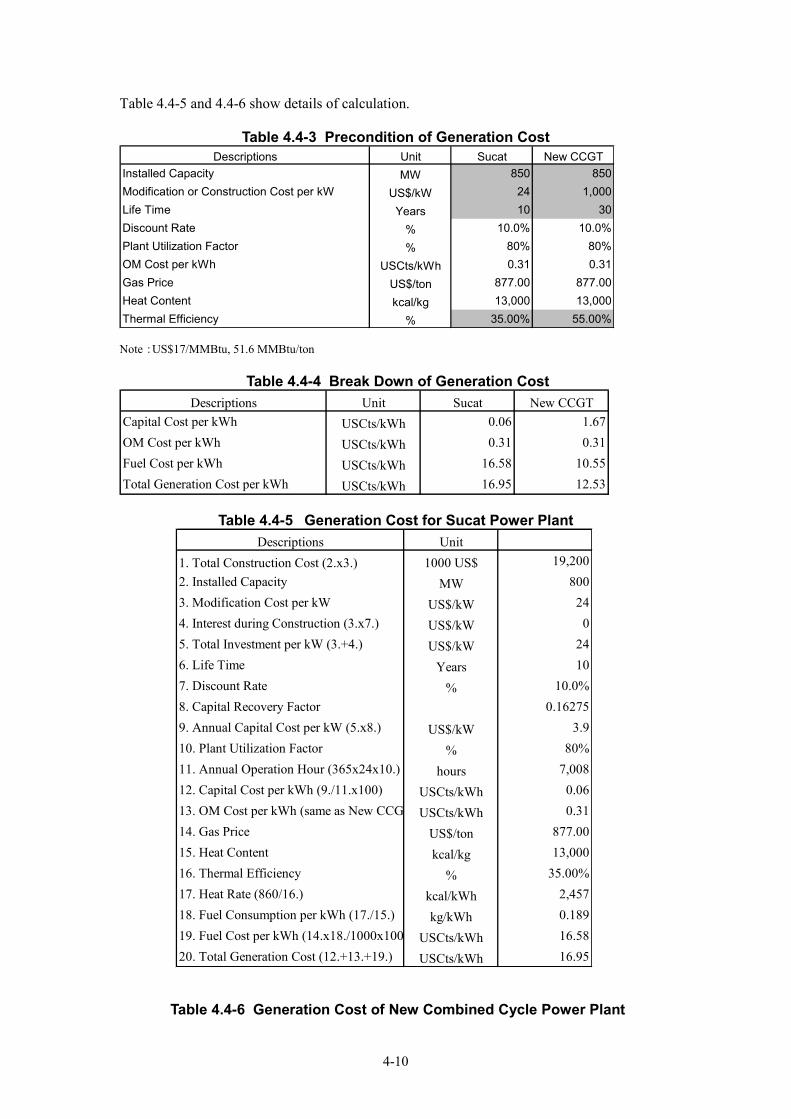
4-10
Table 4.4-5 and 4.4-6 show details of calculation.
Table 4.4-3 Precondition of Generation Cost Descriptions Unit Sucat New CCGT
Installed Capacity MW 850 850Modification or Construction Cost per kW US$/kW 24 1,000Life Time Years 10 30Discount Rate % 10.0% 10.0%Plant Utilization Factor % 80% 80%OM Cost per kWh USCts/kWh 0.31 0.31Gas Price US$/ton 877.00 877.00Heat Content kcal/kg 13,000 13,000Thermal Efficiency % 35.00% 55.00% Note:US$17/MMBtu, 51.6 MMBtu/ton
Table 4.4-4 Break Down of Generation Cost Descriptions Unit Sucat New CCGT
Capital Cost per kWh USCts/kWh 0.06 1.67OM Cost per kWh USCts/kWh 0.31 0.31Fuel Cost per kWh USCts/kWh 16.58 10.55Total Generation Cost per kWh USCts/kWh 16.95 12.53
Table 4.4-5 Generation Cost for Sucat Power Plant
Descriptions Unit1. Total Construction Cost (2.x3.) 1000 US$ 19,2002. Installed Capacity MW 8003. Modification Cost per kW US$/kW 244. Interest during Construction (3.x7.) US$/kW 05. Total Investment per kW (3.+4.) US$/kW 246. Life Time Years 107. Discount Rate % 10.0%8. Capital Recovery Factor 0.162759. Annual Capital Cost per kW (5.x8.) US$/kW 3.910. Plant Utilization Factor % 80%11. Annual Operation Hour (365x24x10.) hours 7,00812. Capital Cost per kWh (9./11.x100) USCts/kWh 0.0613. OM Cost per kWh (same as New CCGT) USCts/kWh 0.3114. Gas Price US$/ton 877.0015. Heat Content kcal/kg 13,00016. Thermal Efficiency % 35.00%17. Heat Rate (860/16.) kcal/kWh 2,45718. Fuel Consumption per kWh (17./15.) kg/kWh 0.18919. Fuel Cost per kWh (14.x18./1000x100) USCts/kWh 16.5820. Total Generation Cost (12.+13.+19.) USCts/kWh 16.95
Table 4.4-6 Generation Cost of New Combined Cycle Power Plant
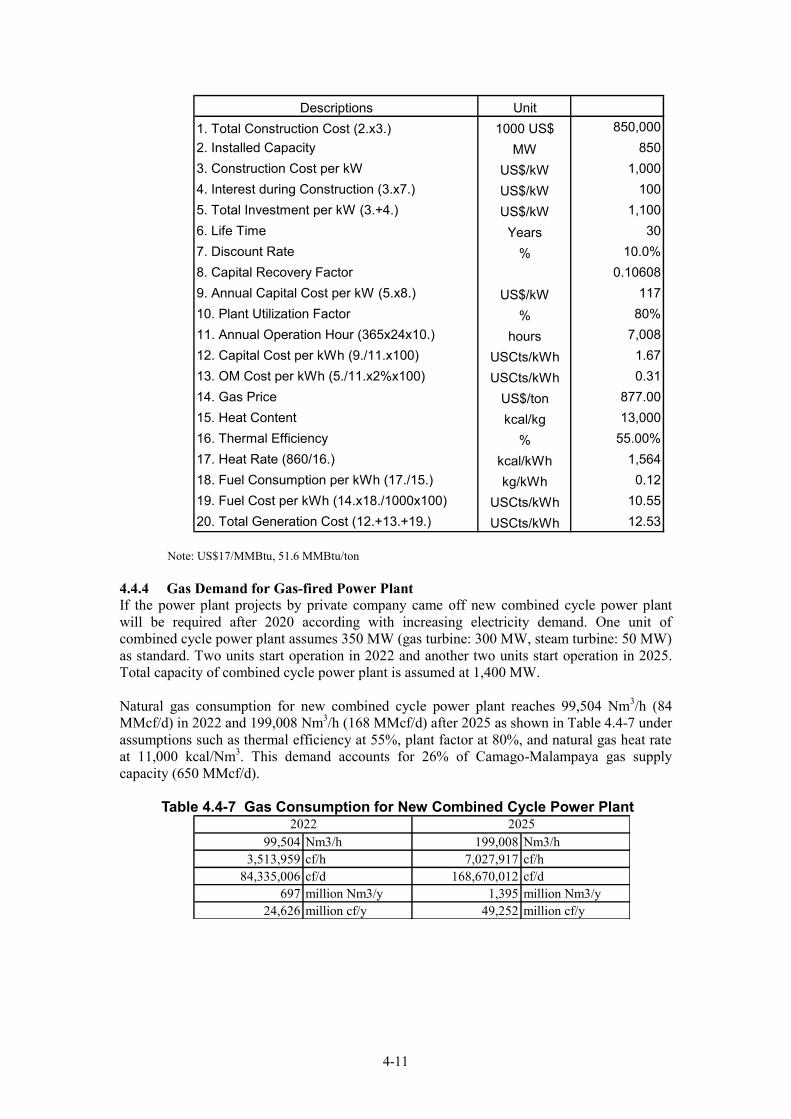
4-11
Descriptions Unit1. Total Construction Cost (2.x3.) 1000 US$ 850,0002. Installed Capacity MW 8503. Construction Cost per kW US$/kW 1,0004. Interest during Construction (3.x7.) US$/kW 1005. Total Investment per kW (3.+4.) US$/kW 1,1006. Life Time Years 307. Discount Rate % 10.0%8. Capital Recovery Factor 0.106089. Annual Capital Cost per kW (5.x8.) US$/kW 11710. Plant Utilization Factor % 80%11. Annual Operation Hour (365x24x10.) hours 7,00812. Capital Cost per kWh (9./11.x100) USCts/kWh 1.6713. OM Cost per kWh (5./11.x2%x100) USCts/kWh 0.3114. Gas Price US$/ton 877.0015. Heat Content kcal/kg 13,00016. Thermal Efficiency % 55.00%17. Heat Rate (860/16.) kcal/kWh 1,56418. Fuel Consumption per kWh (17./15.) kg/kWh 0.1219. Fuel Cost per kWh (14.x18./1000x100) USCts/kWh 10.5520. Total Generation Cost (12.+13.+19.) USCts/kWh 12.53
Note: US$17/MMBtu, 51.6 MMBtu/ton 4.4.4 Gas Demand for Gas-fired Power Plant If the power plant projects by private company came off new combined cycle power plant will be required after 2020 according with increasing electricity demand. One unit of combined cycle power plant assumes 350 MW (gas turbine: 300 MW, steam turbine: 50 MW) as standard. Two units start operation in 2022 and another two units start operation in 2025. Total capacity of combined cycle power plant is assumed at 1,400 MW. Natural gas consumption for new combined cycle power plant reaches 99,504 Nm3/h (84 MMcf/d) in 2022 and 199,008 Nm3/h (168 MMcf/d) after 2025 as shown in Table 4.4-7 under assumptions such as thermal efficiency at 55%, plant factor at 80%, and natural gas heat rate at 11,000 kcal/Nm3. This demand accounts for 26% of Camago-Malampaya gas supply capacity (650 MMcf/d).
Table 4.4-7 Gas Consumption for New Combined Cycle Power Plant
99,504 Nm3/h 199,008 Nm3/h3,513,959 cf/h 7,027,917 cf/h
84,335,006 cf/d 168,670,012 cf/d697 million Nm3/y 1,395 million Nm3/y
24,626 million cf/y 49,252 million cf/y
2022 2025
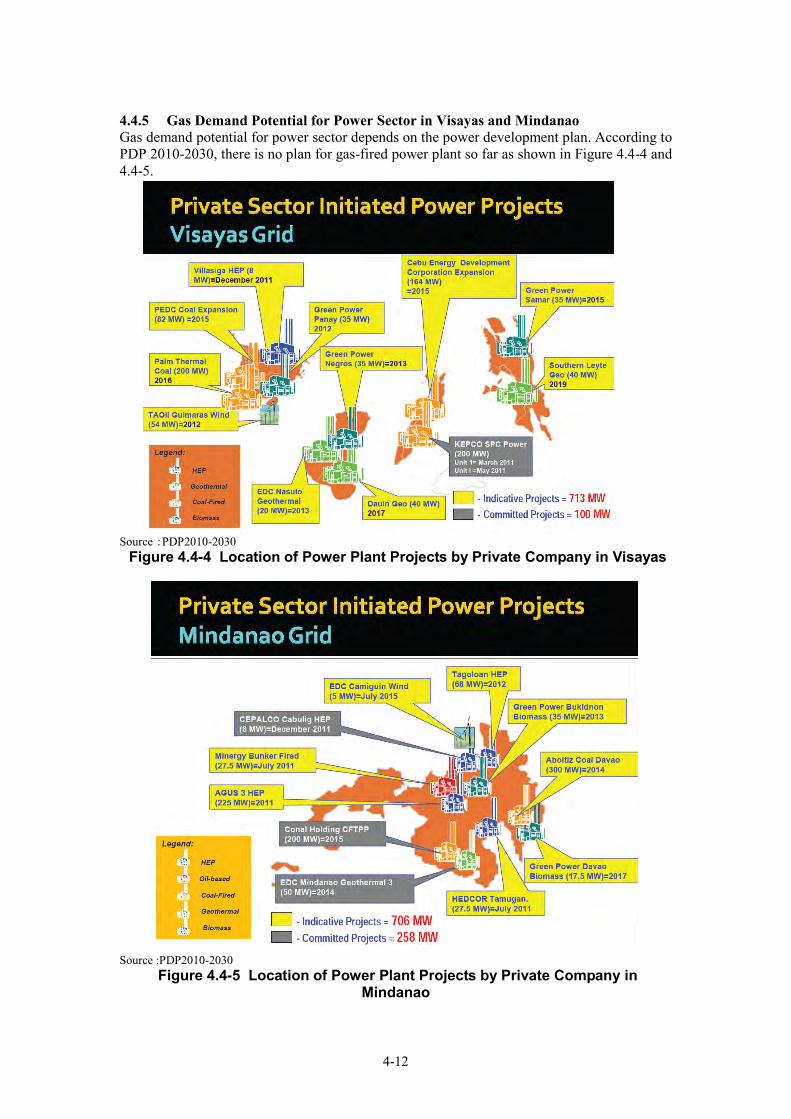
4-12
4.4.5 Gas Demand Potential for Power Sector in Visayas and Mindanao Gas demand potential for power sector depends on the power development plan. According to PDP 2010-2030, there is no plan for gas-fired power plant so far as shown in Figure 4.4-4 and 4.4-5. Source:PDP2010-2030 Figure 4.4-4 Location of Power Plant Projects by Private Company in Visayas
Source :PDP2010-2030
Figure 4.4-5 Location of Power Plant Projects by Private Company in Mindanao
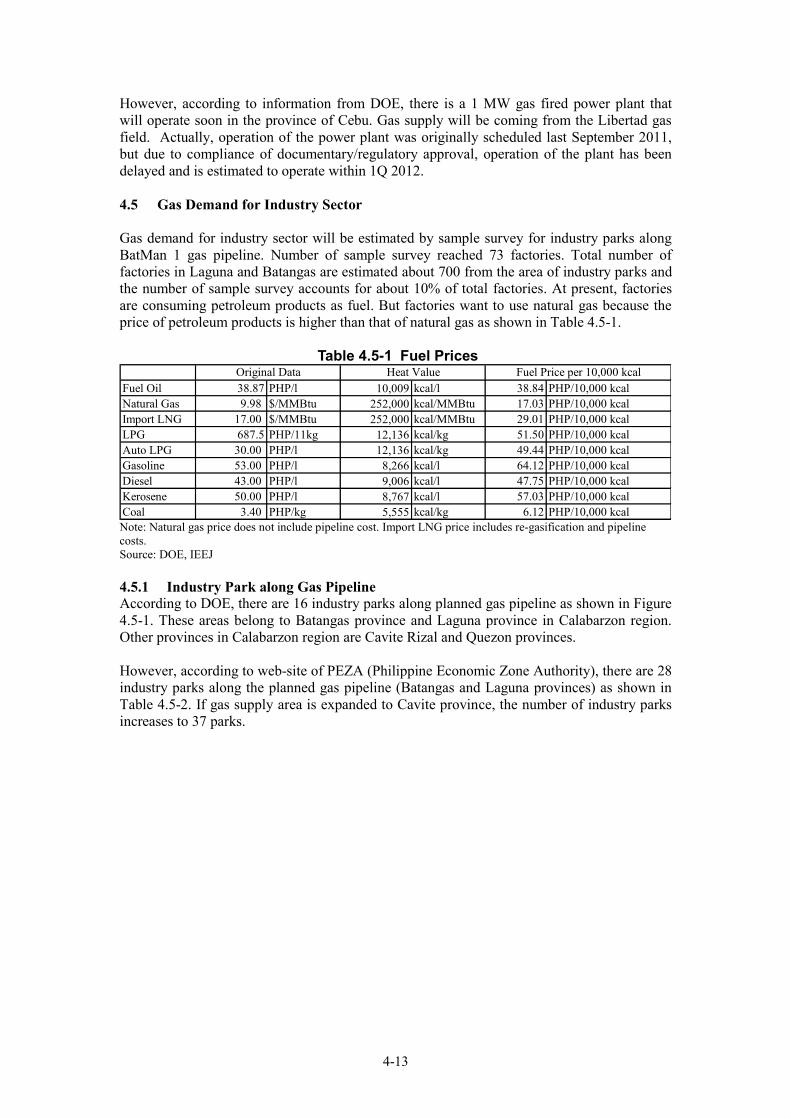
4-13
However, according to information from DOE, there is a 1 MW gas fired power plant that will operate soon in the province of Cebu. Gas supply will be coming from the Libertad gas field. Actually, operation of the power plant was originally scheduled last September 2011, but due to compliance of documentary/regulatory approval, operation of the plant has been delayed and is estimated to operate within 1Q 2012. 4.5 Gas Demand for Industry Sector Gas demand for industry sector will be estimated by sample survey for industry parks along BatMan 1 gas pipeline. Number of sample survey reached 73 factories. Total number of factories in Laguna and Batangas are estimated about 700 from the area of industry parks and the number of sample survey accounts for about 10% of total factories. At present, factories are consuming petroleum products as fuel. But factories want to use natural gas because the price of petroleum products is higher than that of natural gas as shown in Table 4.5-1.
Table 4.5-1 Fuel Prices
Fuel Oil 38.87 PHP/l 10,009 kcal/l 38.84 PHP/10,000 kcalNatural Gas 9.98 $/MMBtu 252,000 kcal/MMBtu 17.03 PHP/10,000 kcalImport LNG 17.00 $/MMBtu 252,000 kcal/MMBtu 29.01 PHP/10,000 kcalLPG 687.5 PHP/11kg 12,136 kcal/kg 51.50 PHP/10,000 kcalAuto LPG 30.00 PHP/l 12,136 kcal/kg 49.44 PHP/10,000 kcalGasoline 53.00 PHP/l 8,266 kcal/l 64.12 PHP/10,000 kcalDiesel 43.00 PHP/l 9,006 kcal/l 47.75 PHP/10,000 kcalKerosene 50.00 PHP/l 8,767 kcal/l 57.03 PHP/10,000 kcalCoal 3.40 PHP/kg 5,555 kcal/kg 6.12 PHP/10,000 kcal
Original Data Heat Value Fuel Price per 10,000 kcal
Note: Natural gas price does not include pipeline cost. Import LNG price includes re-gasification and pipeline costs. Source: DOE, IEEJ 4.5.1 Industry Park along Gas Pipeline According to DOE, there are 16 industry parks along planned gas pipeline as shown in Figure 4.5-1. These areas belong to Batangas province and Laguna province in Calabarzon region. Other provinces in Calabarzon region are Cavite Rizal and Quezon provinces. However, according to web-site of PEZA (Philippine Economic Zone Authority), there are 28 industry parks along the planned gas pipeline (Batangas and Laguna provinces) as shown in Table 4.5-2. If gas supply area is expanded to Cavite province, the number of industry parks increases to 37 parks.
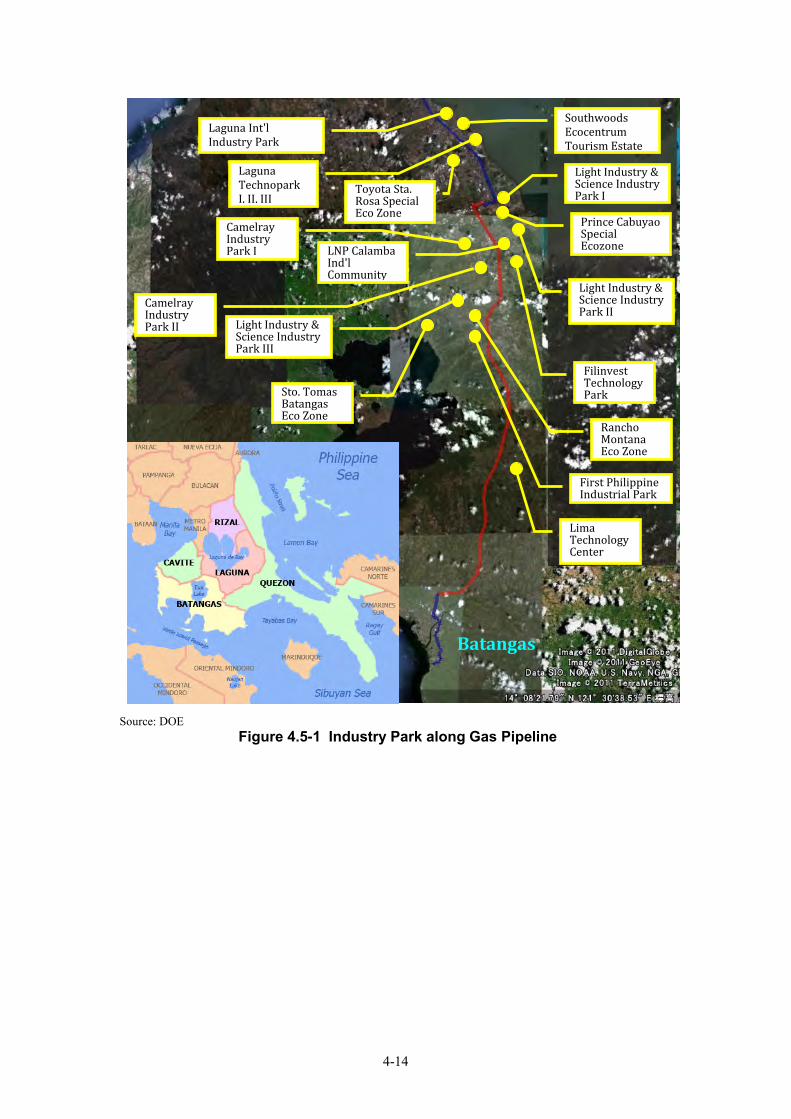
4-14
Source: DOE
Figure 4.5-1 Industry Park along Gas Pipeline
Lima Technology Center
First Philippine Industrial Park
Laguna Int'l Industry Park
Light Industry & Science Industry Park I
Prince Cabuyao Special Ecozone
Light Industry & Science Industry Park II
LNP Calamba Ind'l Community
Filinvest Technology Park
Camelray Industry Park I
Camelray Industry Park II
Light Industry & Science Industry Park III
Sto. Tomas Batangas Eco Zone
Rancho Montana Eco Zone
Southwoods Ecocentrum Tourism Estate
Laguna Technopark I, II, III
Toyota Sta. Rosa Special Eco Zone
Batangas
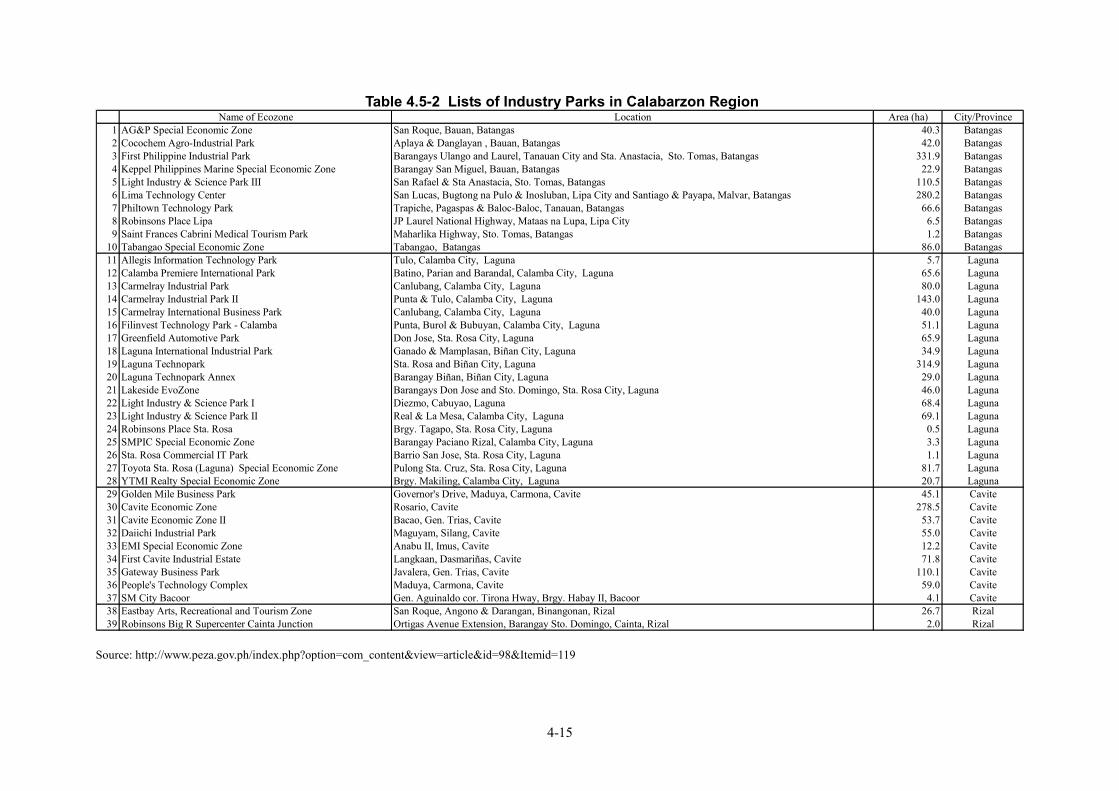
4-15
Table 4.5-2 Lists of Industry Parks in Calabarzon Region Name of Ecozone Location Area (ha) City/Province
1 AG&P Special Economic Zone San Roque, Bauan, Batangas 40.3 Batangas2 Cocochem Agro-Industrial Park Aplaya & Danglayan , Bauan, Batangas 42.0 Batangas3 First Philippine Industrial Park Barangays Ulango and Laurel, Tanauan City and Sta. Anastacia, Sto. Tomas, Batangas 331.9 Batangas4 Keppel Philippines Marine Special Economic Zone Barangay San Miguel, Bauan, Batangas 22.9 Batangas5 Light Industry & Science Park III San Rafael & Sta Anastacia, Sto. Tomas, Batangas 110.5 Batangas6 Lima Technology Center San Lucas, Bugtong na Pulo & Inosluban, Lipa City and Santiago & Payapa, Malvar, Batangas 280.2 Batangas7 Philtown Technology Park Trapiche, Pagaspas & Baloc-Baloc, Tanauan, Batangas 66.6 Batangas8 Robinsons Place Lipa (Building floor area = 68,361 square meters)JP Laurel National Highway, Mataas na Lupa, Lipa City 6.5 Batangas9 Saint Frances Cabrini Medical Tourism Park Maharlika Highway, Sto. Tomas, Batangas 1.2 Batangas
10 Tabangao Special Economic Zone Tabangao, Batangas 86.0 Batangas11 Allegis Information Technology Park Tulo, Calamba City, Laguna 5.7 Laguna12 Calamba Premiere International Park Batino, Parian and Barandal, Calamba City, Laguna 65.6 Laguna13 Carmelray Industrial Park Canlubang, Calamba City, Laguna 80.0 Laguna14 Carmelray Industrial Park II Punta & Tulo, Calamba City, Laguna 143.0 Laguna15 Carmelray International Business Park Canlubang, Calamba City, Laguna 40.0 Laguna16 Filinvest Technology Park - Calamba Punta, Burol & Bubuyan, Calamba City, Laguna 51.1 Laguna17 Greenfield Automotive Park Don Jose, Sta. Rosa City, Laguna 65.9 Laguna18 Laguna International Industrial Park Ganado & Mamplasan, Biñan City, Laguna 34.9 Laguna19 Laguna Technopark Sta. Rosa and Biñan City, Laguna 314.9 Laguna20 Laguna Technopark Annex Barangay Biñan, Biñan City, Laguna 29.0 Laguna21 Lakeside EvoZone Barangays Don Jose and Sto. Domingo, Sta. Rosa City, Laguna 46.0 Laguna22 Light Industry & Science Park I Diezmo, Cabuyao, Laguna 68.4 Laguna23 Light Industry & Science Park II Real & La Mesa, Calamba City, Laguna 69.1 Laguna24 Robinsons Place Sta. Rosa (Building floor area = 37,382 square meters)Brgy. Tagapo, Sta. Rosa City, Laguna 0.5 Laguna25 SMPIC Special Economic Zone Barangay Paciano Rizal, Calamba City, Laguna 3.3 Laguna26 Sta. Rosa Commercial IT Park Barrio San Jose, Sta. Rosa City, Laguna 1.1 Laguna27 Toyota Sta. Rosa (Laguna) Special Economic Zone Pulong Sta. Cruz, Sta. Rosa City, Laguna 81.7 Laguna28 YTMI Realty Special Economic Zone Brgy. Makiling, Calamba City, Laguna 20.7 Laguna29 Golden Mile Business Park Governor's Drive, Maduya, Carmona, Cavite 45.1 Cavite30 Cavite Economic Zone Rosario, Cavite 278.5 Cavite31 Cavite Economic Zone II Bacao, Gen. Trias, Cavite 53.7 Cavite32 Daiichi Industrial Park Maguyam, Silang, Cavite 55.0 Cavite33 EMI Special Economic Zone Anabu II, Imus, Cavite 12.2 Cavite34 First Cavite Industrial Estate Langkaan, Dasmariñas, Cavite 71.8 Cavite35 Gateway Business Park Javalera, Gen. Trias, Cavite 110.1 Cavite36 People's Technology Complex Maduya, Carmona, Cavite 59.0 Cavite37 SM City Bacoor (Building floor area = 116,892.28 square meters )Gen. Aguinaldo cor. Tirona Hway, Brgy. Habay II, Bacoor 4.1 Cavite38 Eastbay Arts, Recreational and Tourism Zone San Roque, Angono & Darangan, Binangonan, Rizal 26.7 Rizal39 Robinsons Big R Supercenter Cainta Junction (Building floor area = 31,635.00 square meters)Ortigas Avenue Extension, Barangay Sto. Domingo, Cainta, Rizal 2.0 Rizal
Source: http://www.peza.gov.ph/index.php?option=com_content&view=article&id=98&Itemid=119
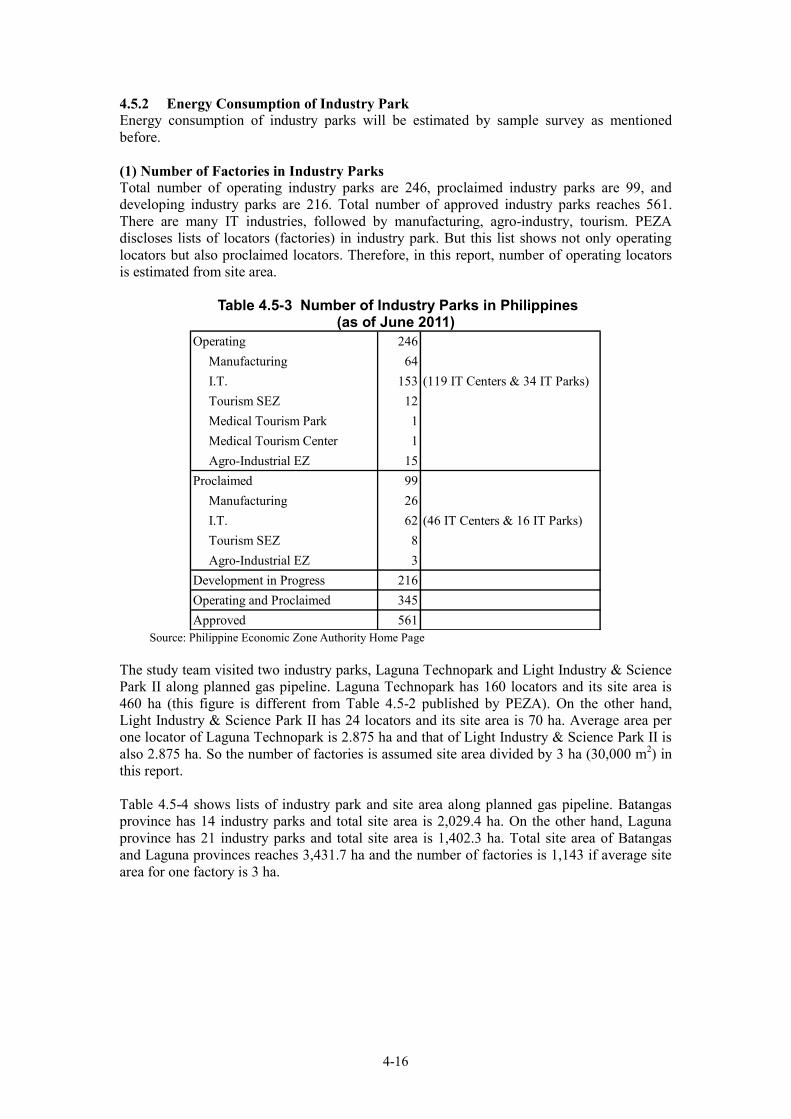
4-16
4.5.2 Energy Consumption of Industry Park Energy consumption of industry parks will be estimated by sample survey as mentioned before. (1) Number of Factories in Industry Parks Total number of operating industry parks are 246, proclaimed industry parks are 99, and developing industry parks are 216. Total number of approved industry parks reaches 561. There are many IT industries, followed by manufacturing, agro-industry, tourism. PEZA discloses lists of locators (factories) in industry park. But this list shows not only operating locators but also proclaimed locators. Therefore, in this report, number of operating locators is estimated from site area.
Table 4.5-3 Number of Industry Parks in Philippines (as of June 2011)
Operating 246Manufacturing 64I.T. 153 (119 IT Centers & 34 IT Parks)Tourism SEZ 12Medical Tourism Park 1Medical Tourism Center 1Agro-Industrial EZ 15
Proclaimed 99Manufacturing 26I.T. 62 (46 IT Centers & 16 IT Parks)Tourism SEZ 8Agro-Industrial EZ 3
Development in Progress 216Operating and Proclaimed 345Approved 561
Source: Philippine Economic Zone Authority Home Page The study team visited two industry parks, Laguna Technopark and Light Industry & Science Park II along planned gas pipeline. Laguna Technopark has 160 locators and its site area is 460 ha (this figure is different from Table 4.5-2 published by PEZA). On the other hand, Light Industry & Science Park II has 24 locators and its site area is 70 ha. Average area per one locator of Laguna Technopark is 2.875 ha and that of Light Industry & Science Park II is also 2.875 ha. So the number of factories is assumed site area divided by 3 ha (30,000 m2) in this report. Table 4.5-4 shows lists of industry park and site area along planned gas pipeline. Batangas province has 14 industry parks and total site area is 2,029.4 ha. On the other hand, Laguna province has 21 industry parks and total site area is 1,402.3 ha. Total site area of Batangas and Laguna provinces reaches 3,431.7 ha and the number of factories is 1,143 if average site area for one factory is 3 ha.
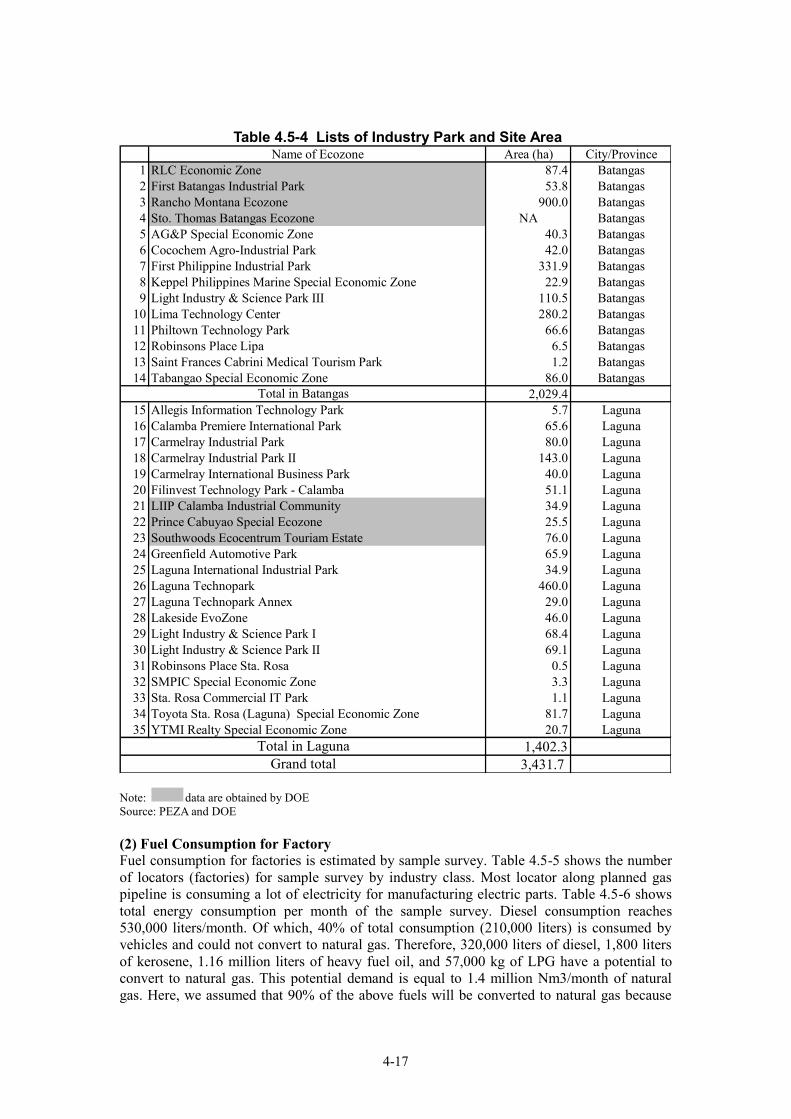
4-17
Table 4.5-4 Lists of Industry Park and Site Area Name of Ecozone Area (ha) City/Province
1 RLC Economic Zone 87.4 Batangas2 First Batangas Industrial Park 53.8 Batangas3 Rancho Montana Ecozone 900.0 Batangas4 Sto. Thomas Batangas Ecozone NA Batangas5 AG&P Special Economic Zone 40.3 Batangas6 Cocochem Agro-Industrial Park 42.0 Batangas7 First Philippine Industrial Park 331.9 Batangas8 Keppel Philippines Marine Special Economic Zone 22.9 Batangas9 Light Industry & Science Park III 110.5 Batangas
10 Lima Technology Center 280.2 Batangas11 Philtown Technology Park 66.6 Batangas12 Robinsons Place Lipa (Building floor area = 68,361 square meters)6.5 Batangas13 Saint Frances Cabrini Medical Tourism Park 1.2 Batangas14 Tabangao Special Economic Zone 86.0 Batangas
2,029.415 Allegis Information Technology Park 5.7 Laguna16 Calamba Premiere International Park 65.6 Laguna17 Carmelray Industrial Park 80.0 Laguna18 Carmelray Industrial Park II 143.0 Laguna19 Carmelray International Business Park 40.0 Laguna20 Filinvest Technology Park - Calamba 51.1 Laguna21 LIIP Calamba Industrial Community 34.9 Laguna22 Prince Cabuyao Special Ecozone 25.5 Laguna23 Southwoods Ecocentrum Touriam Estate 76.0 Laguna24 Greenfield Automotive Park 65.9 Laguna25 Laguna International Industrial Park 34.9 Laguna26 Laguna Technopark 460.0 Laguna27 Laguna Technopark Annex 29.0 Laguna28 Lakeside EvoZone 46.0 Laguna29 Light Industry & Science Park I 68.4 Laguna30 Light Industry & Science Park II 69.1 Laguna31 Robinsons Place Sta. Rosa (Building floor area = 37,382 square meters)0.5 Laguna32 SMPIC Special Economic Zone 3.3 Laguna33 Sta. Rosa Commercial IT Park 1.1 Laguna34 Toyota Sta. Rosa (Laguna) Special Economic Zone 81.7 Laguna35 YTMI Realty Special Economic Zone 20.7 Laguna
1,402.33,431.7
Total in Batangas
Total in LagunaGrand total
Note: data are obtained by DOE Source: PEZA and DOE (2) Fuel Consumption for Factory Fuel consumption for factories is estimated by sample survey. Table 4.5-5 shows the number of locators (factories) for sample survey by industry class. Most locator along planned gas pipeline is consuming a lot of electricity for manufacturing electric parts. Table 4.5-6 shows total energy consumption per month of the sample survey. Diesel consumption reaches 530,000 liters/month. Of which, 40% of total consumption (210,000 liters) is consumed by vehicles and could not convert to natural gas. Therefore, 320,000 liters of diesel, 1,800 liters of kerosene, 1.16 million liters of heavy fuel oil, and 57,000 kg of LPG have a potential to convert to natural gas. This potential demand is equal to 1.4 million Nm3/month of natural gas. Here, we assumed that 90% of the above fuels will be converted to natural gas because
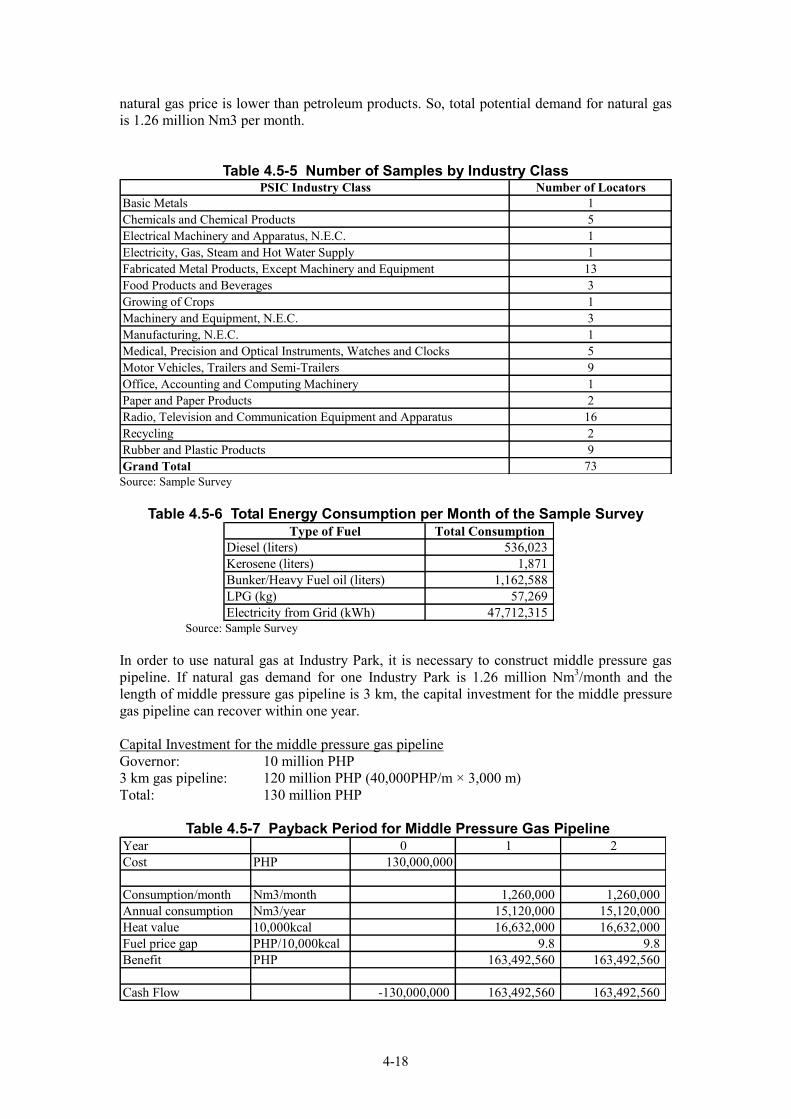
4-18
natural gas price is lower than petroleum products. So, total potential demand for natural gas is 1.26 million Nm3 per month.
Table 4.5-5 Number of Samples by Industry Class PSIC Industry Class Number of Locators
Basic Metals 1Chemicals and Chemical Products 5Electrical Machinery and Apparatus, N.E.C. 1Electricity, Gas, Steam and Hot Water Supply 1Fabricated Metal Products, Except Machinery and Equipment 13Food Products and Beverages 3Growing of Crops 1Machinery and Equipment, N.E.C. 3Manufacturing, N.E.C. 1Medical, Precision and Optical Instruments, Watches and Clocks 5Motor Vehicles, Trailers and Semi-Trailers 9Office, Accounting and Computing Machinery 1Paper and Paper Products 2Radio, Television and Communication Equipment and Apparatus 16Recycling 2Rubber and Plastic Products 9Grand Total 73
Source: Sample Survey
Table 4.5-6 Total Energy Consumption per Month of the Sample Survey Type of Fuel Total Consumption
Diesel (liters) 536,023 Kerosene (liters) 1,871 Bunker/Heavy Fuel oil (liters) 1,162,588 LPG (kg) 57,269 Electricity from Grid (kWh) 47,712,315
Source: Sample Survey In order to use natural gas at Industry Park, it is necessary to construct middle pressure gas pipeline. If natural gas demand for one Industry Park is 1.26 million Nm3/month and the length of middle pressure gas pipeline is 3 km, the capital investment for the middle pressure gas pipeline can recover within one year. Capital Investment for the middle pressure gas pipeline Governor: 10 million PHP 3 km gas pipeline: 120 million PHP (40,000PHP/m × 3,000 m) Total: 130 million PHP
Table 4.5-7 Payback Period for Middle Pressure Gas Pipeline Year 0 1 2Cost PHP 130,000,000
Consumption/month Nm3/month 1,260,000 1,260,000 Annual consumption Nm3/year 15,120,000 15,120,000 Heat value 10,000kcal 16,632,000 16,632,000 Fuel price gap PHP/10,000kcal 9.8 9.8 Benefit PHP 163,492,560 163,492,560
Cash Flow -130,000,000 163,492,560 163,492,560
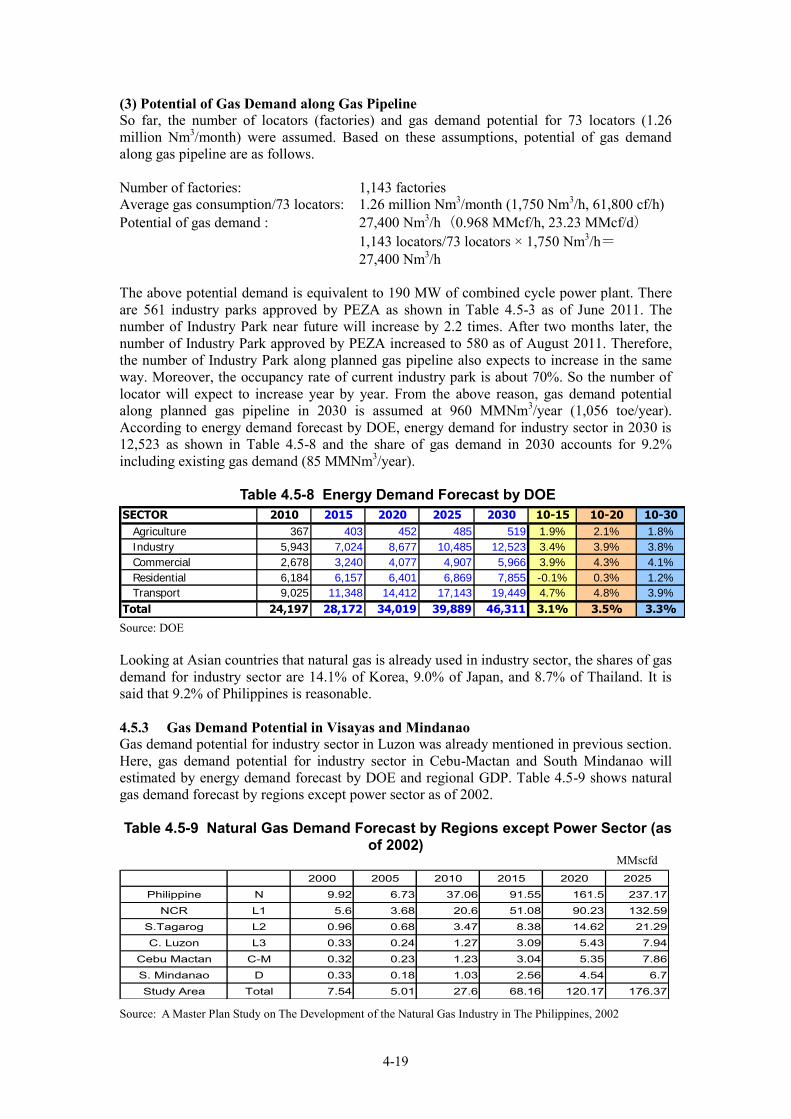
4-19
(3) Potential of Gas Demand along Gas Pipeline So far, the number of locators (factories) and gas demand potential for 73 locators (1.26 million Nm3/month) were assumed. Based on these assumptions, potential of gas demand along gas pipeline are as follows. Number of factories: 1,143 factories Average gas consumption/73 locators: 1.26 million Nm3/month (1,750 Nm3/h, 61,800 cf/h) Potential of gas demand : 27,400 Nm3/h(0.968 MMcf/h, 23.23 MMcf/d) 1,143 locators/73 locators × 1,750 Nm3/h= 27,400 Nm3/h The above potential demand is equivalent to 190 MW of combined cycle power plant. There are 561 industry parks approved by PEZA as shown in Table 4.5-3 as of June 2011. The number of Industry Park near future will increase by 2.2 times. After two months later, the number of Industry Park approved by PEZA increased to 580 as of August 2011. Therefore, the number of Industry Park along planned gas pipeline also expects to increase in the same way. Moreover, the occupancy rate of current industry park is about 70%. So the number of locator will expect to increase year by year. From the above reason, gas demand potential along planned gas pipeline in 2030 is assumed at 960 MMNm3/year (1,056 toe/year). According to energy demand forecast by DOE, energy demand for industry sector in 2030 is 12,523 as shown in Table 4.5-8 and the share of gas demand in 2030 accounts for 9.2% including existing gas demand (85 MMNm3/year).
Table 4.5-8 Energy Demand Forecast by DOE Source: DOE Looking at Asian countries that natural gas is already used in industry sector, the shares of gas demand for industry sector are 14.1% of Korea, 9.0% of Japan, and 8.7% of Thailand. It is said that 9.2% of Philippines is reasonable. 4.5.3 Gas Demand Potential in Visayas and Mindanao Gas demand potential for industry sector in Luzon was already mentioned in previous section. Here, gas demand potential for industry sector in Cebu-Mactan and South Mindanao will estimated by energy demand forecast by DOE and regional GDP. Table 4.5-9 shows natural gas demand forecast by regions except power sector as of 2002. Table 4.5-9 Natural Gas Demand Forecast by Regions except Power Sector (as
of 2002) MMscfd Source: A Master Plan Study on The Development of the Natural Gas Industry in The Philippines, 2002
SECTOR 2010 2015 2020 2025 2030 10-15 10-20 10-30
Agriculture 367 403 452 485 519 1.9% 2.1% 1.8%
Industry 5,943 7,024 8,677 10,485 12,523 3.4% 3.9% 3.8%
Commercial 2,678 3,240 4,077 4,907 5,966 3.9% 4.3% 4.1%
Residential 6,184 6,157 6,401 6,869 7,855 -0.1% 0.3% 1.2%
Transport 9,025 11,348 14,412 17,143 19,449 4.7% 4.8% 3.9%
Total 24,197 28,172 34,019 39,889 46,311 3.1% 3.5% 3.3%
2000 2005 2010 2015 2020 2025
Philippine N 9.92 6.73 37.06 91.55 161.5 237.17
NCR L1 5.6 3.68 20.6 51.08 90.23 132.59
S.Tagarog L2 0.96 0.68 3.47 8.38 14.62 21.29
C. Luzon L3 0.33 0.24 1.27 3.09 5.43 7.94
Cebu Mactan C-M 0.32 0.23 1.23 3.04 5.35 7.86
S. Mindanao D 0.33 0.18 1.03 2.56 4.54 6.7
Study Area Total 7.54 5.01 27.6 68.16 120.17 176.37
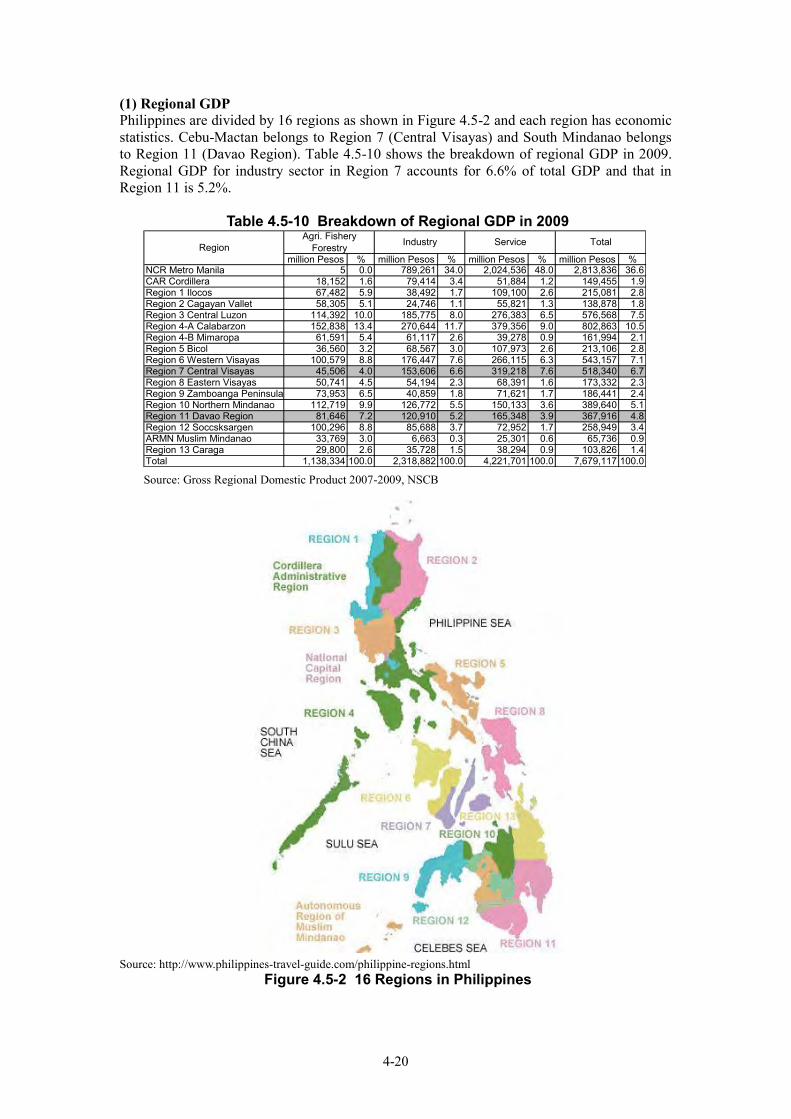
4-20
(1) Regional GDP Philippines are divided by 16 regions as shown in Figure 4.5-2 and each region has economic statistics. Cebu-Mactan belongs to Region 7 (Central Visayas) and South Mindanao belongs to Region 11 (Davao Region). Table 4.5-10 shows the breakdown of regional GDP in 2009. Regional GDP for industry sector in Region 7 accounts for 6.6% of total GDP and that in Region 11 is 5.2%.
Table 4.5-10 Breakdown of Regional GDP in 2009 Source: Gross Regional Domestic Product 2007-2009, NSCB Source: http://www.philippines-travel-guide.com/philippine-regions.html
Figure 4.5-2 16 Regions in Philippines
million Pesos % million Pesos % million Pesos % million Pesos %NCR Metro Manila 5 0.0 789,261 34.0 2,024,536 48.0 2,813,836 36.6CAR Cordillera 18,152 1.6 79,414 3.4 51,884 1.2 149,455 1.9Region 1 Ilocos 67,482 5.9 38,492 1.7 109,100 2.6 215,081 2.8Region 2 Cagayan Vallet 58,305 5.1 24,746 1.1 55,821 1.3 138,878 1.8Region 3 Central Luzon 114,392 10.0 185,775 8.0 276,383 6.5 576,568 7.5Region 4-A Calabarzon 152,838 13.4 270,644 11.7 379,356 9.0 802,863 10.5Region 4-B Mimaropa 61,591 5.4 61,117 2.6 39,278 0.9 161,994 2.1Region 5 Bicol 36,560 3.2 68,567 3.0 107,973 2.6 213,106 2.8Region 6 Western Visayas 100,579 8.8 176,447 7.6 266,115 6.3 543,157 7.1Region 7 Central Visayas 45,506 4.0 153,606 6.6 319,218 7.6 518,340 6.7Region 8 Eastern Visayas 50,741 4.5 54,194 2.3 68,391 1.6 173,332 2.3Region 9 Zamboanga Peninsula 73,953 6.5 40,859 1.8 71,621 1.7 186,441 2.4Region 10 Northern Mindanao 112,719 9.9 126,772 5.5 150,133 3.6 389,640 5.1Region 11 Davao Region 81,646 7.2 120,910 5.2 165,348 3.9 367,916 4.8Region 12 Soccsksargen 100,296 8.8 85,688 3.7 72,952 1.7 258,949 3.4ARMN Muslim Mindanao 33,769 3.0 6,663 0.3 25,301 0.6 65,736 0.9Region 13 Caraga 29,800 2.6 35,728 1.5 38,294 0.9 103,826 1.4Total 1,138,334 100.0 2,318,882 100.0 4,221,701 100.0 7,679,117 100.0
RegionAgri. Fishery
Forestry Industry Service Total
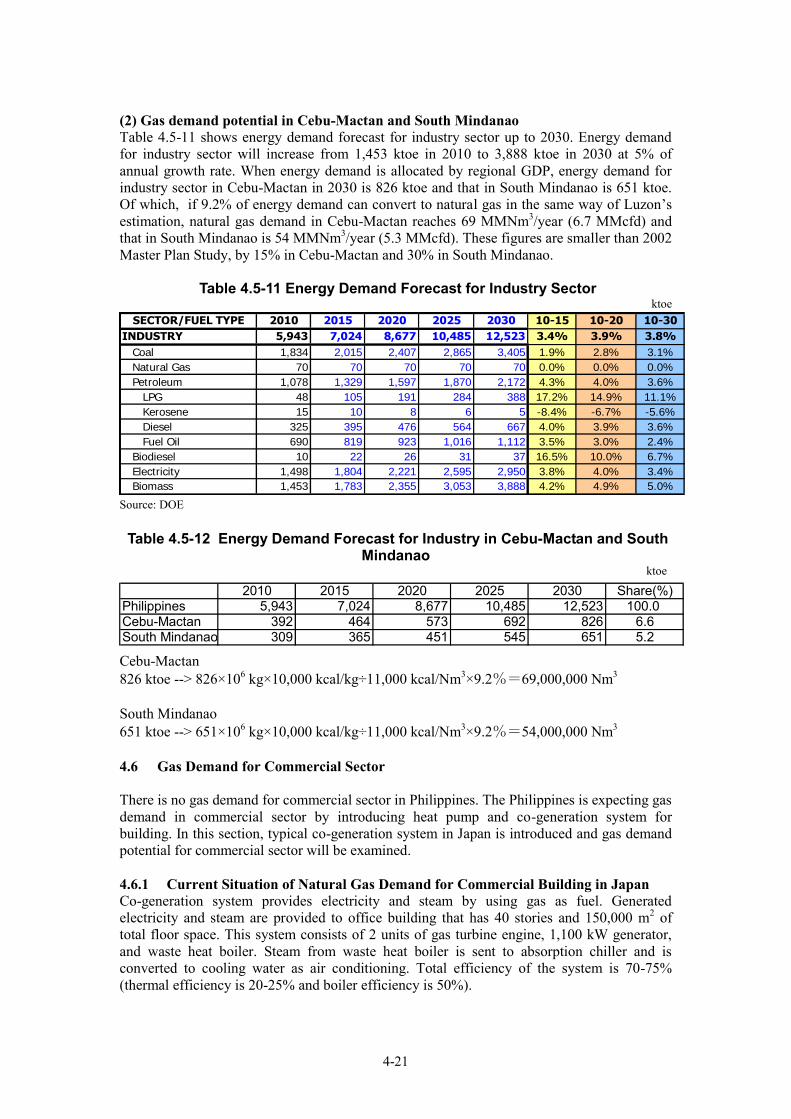
4-21
(2) Gas demand potential in Cebu-Mactan and South Mindanao Table 4.5-11 shows energy demand forecast for industry sector up to 2030. Energy demand for industry sector will increase from 1,453 ktoe in 2010 to 3,888 ktoe in 2030 at 5% of annual growth rate. When energy demand is allocated by regional GDP, energy demand for industry sector in Cebu-Mactan in 2030 is 826 ktoe and that in South Mindanao is 651 ktoe. Of which, if 9.2% of energy demand can convert to natural gas in the same way of Luzon’s estimation, natural gas demand in Cebu-Mactan reaches 69 MMNm3/year (6.7 MMcfd) and that in South Mindanao is 54 MMNm3/year (5.3 MMcfd). These figures are smaller than 2002 Master Plan Study, by 15% in Cebu-Mactan and 30% in South Mindanao.
Table 4.5-11 Energy Demand Forecast for Industry Sector ktoe
Source: DOE Table 4.5-12 Energy Demand Forecast for Industry in Cebu-Mactan and South
Mindanao ktoe Cebu-Mactan 826 ktoe --> 826×106 kg×10,000 kcal/kg÷11,000 kcal/Nm3×9.2%=69,000,000 Nm3 South Mindanao 651 ktoe --> 651×106 kg×10,000 kcal/kg÷11,000 kcal/Nm3×9.2%=54,000,000 Nm3 4.6 Gas Demand for Commercial Sector There is no gas demand for commercial sector in Philippines. The Philippines is expecting gas demand in commercial sector by introducing heat pump and co-generation system for building. In this section, typical co-generation system in Japan is introduced and gas demand potential for commercial sector will be examined. 4.6.1 Current Situation of Natural Gas Demand for Commercial Building in Japan Co-generation system provides electricity and steam by using gas as fuel. Generated electricity and steam are provided to office building that has 40 stories and 150,000 m2 of total floor space. This system consists of 2 units of gas turbine engine, 1,100 kW generator, and waste heat boiler. Steam from waste heat boiler is sent to absorption chiller and is converted to cooling water as air conditioning. Total efficiency of the system is 70-75% (thermal efficiency is 20-25% and boiler efficiency is 50%).
SECTOR/FUEL TYPE 2010 2015 2020 2025 2030 10-15 10-20 10-30
INDUSTRY 5,943 7,024 8,677 10,485 12,523 3.4% 3.9% 3.8%
Coal 1,834 2,015 2,407 2,865 3,405 1.9% 2.8% 3.1%
Natural Gas 70 70 70 70 70 0.0% 0.0% 0.0%
Petroleum 1,078 1,329 1,597 1,870 2,172 4.3% 4.0% 3.6%
LPG 48 105 191 284 388 17.2% 14.9% 11.1%
Kerosene 15 10 8 6 5 -8.4% -6.7% -5.6%
Diesel 325 395 476 564 667 4.0% 3.9% 3.6%
Fuel Oil 690 819 923 1,016 1,112 3.5% 3.0% 2.4%
Biodiesel 10 22 26 31 37 16.5% 10.0% 6.7%
Electricity 1,498 1,804 2,221 2,595 2,950 3.8% 4.0% 3.4%
Biomass 1,453 1,783 2,355 3,053 3,888 4.2% 4.9% 5.0%
2010 2015 2020 2025 2030 Share(%)Philippines 5,943 7,024 8,677 10,485 12,523 100.0Cebu-Mactan 392 464 573 692 826 6.6South Mindanao 309 365 451 545 651 5.2
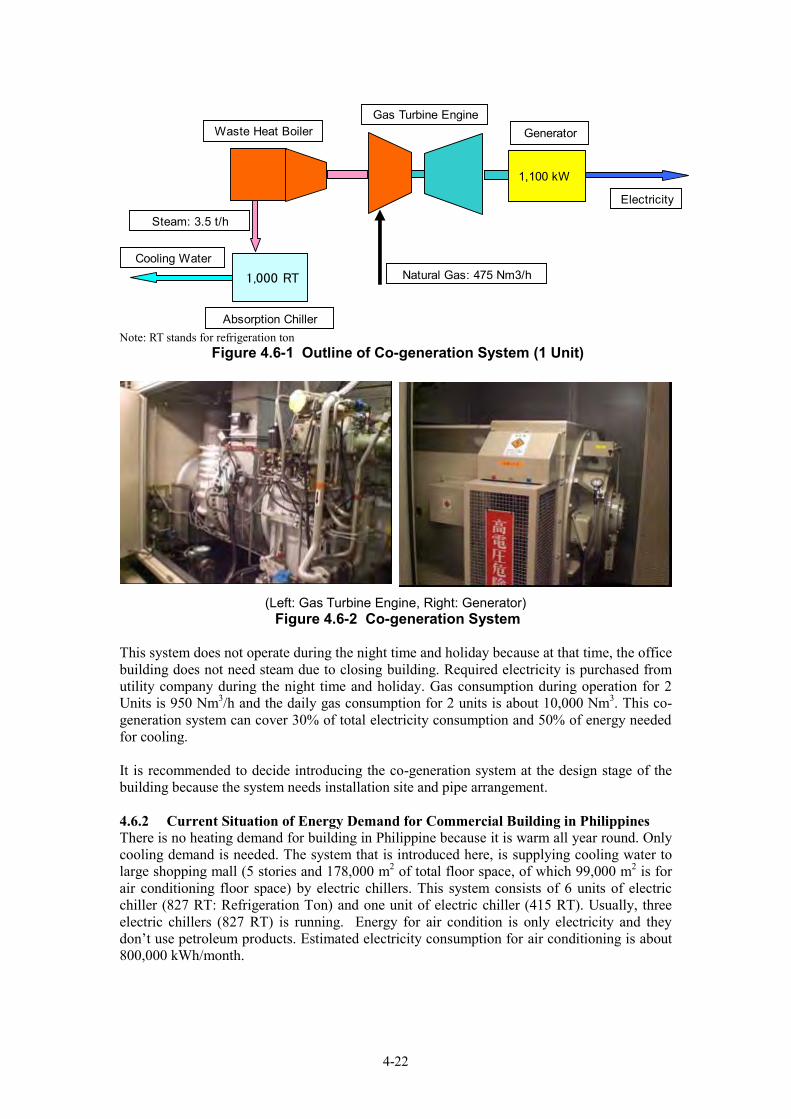
4-22
Note: RT stands for refrigeration ton
Figure 4.6-1 Outline of Co-generation System (1 Unit)
(Left: Gas Turbine Engine, Right: Generator) Figure 4.6-2 Co-generation System
This system does not operate during the night time and holiday because at that time, the office building does not need steam due to closing building. Required electricity is purchased from utility company during the night time and holiday. Gas consumption during operation for 2 Units is 950 Nm3/h and the daily gas consumption for 2 units is about 10,000 Nm3. This co-generation system can cover 30% of total electricity consumption and 50% of energy needed for cooling. It is recommended to decide introducing the co-generation system at the design stage of the building because the system needs installation site and pipe arrangement. 4.6.2 Current Situation of Energy Demand for Commercial Building in Philippines There is no heating demand for building in Philippine because it is warm all year round. Only cooling demand is needed. The system that is introduced here, is supplying cooling water to large shopping mall (5 stories and 178,000 m2 of total floor space, of which 99,000 m2 is for air conditioning floor space) by electric chillers. This system consists of 6 units of electric chiller (827 RT: Refrigeration Ton) and one unit of electric chiller (415 RT). Usually, three electric chillers (827 RT) is running. Energy for air condition is only electricity and they don’t use petroleum products. Estimated electricity consumption for air conditioning is about 800,000 kWh/month.
Waste Heat Boiler
Gas Turbine EngineGenerator
Absorption Chiller
Steam: 3.5 t/h
Cooling Water
Electricity
Natural Gas: 475 Nm3/h
1,100 kW
1,000 RT
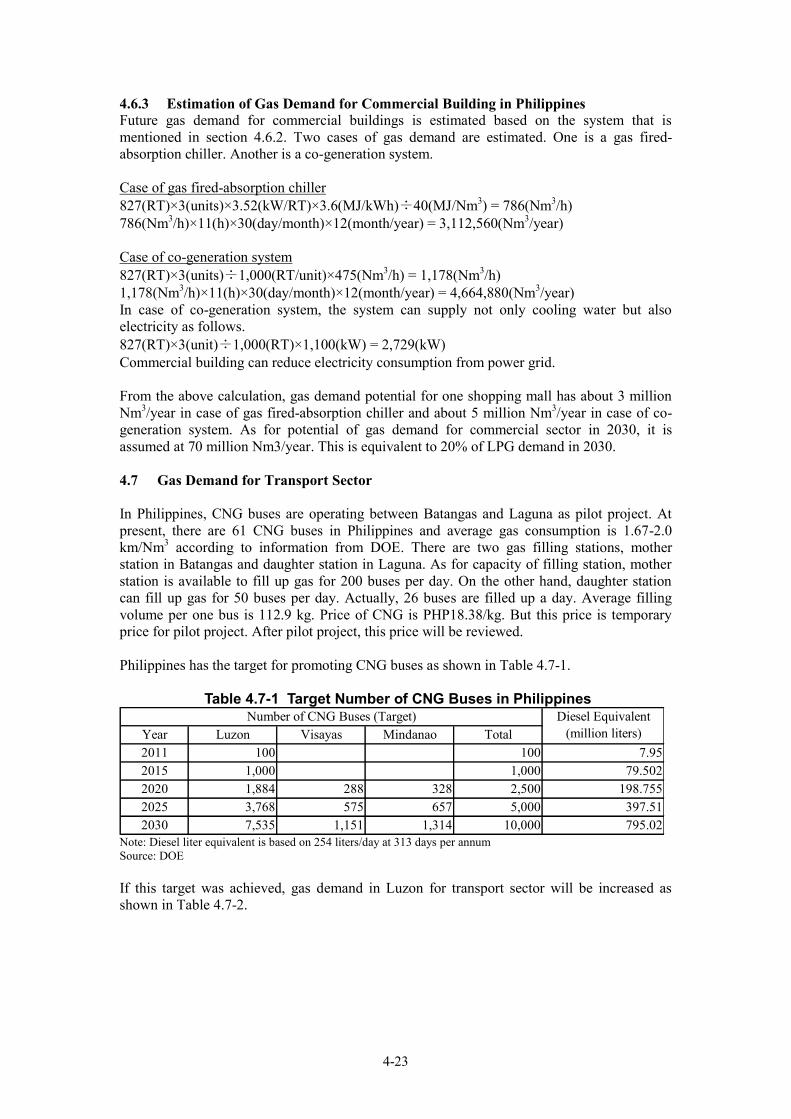
4-23
4.6.3 Estimation of Gas Demand for Commercial Building in Philippines Future gas demand for commercial buildings is estimated based on the system that is mentioned in section 4.6.2. Two cases of gas demand are estimated. One is a gas fired-absorption chiller. Another is a co-generation system. Case of gas fired-absorption chiller 827(RT)×3(units)×3.52(kW/RT)×3.6(MJ/kWh)÷40(MJ/Nm3) = 786(Nm3/h) 786(Nm3/h)×11(h)×30(day/month)×12(month/year) = 3,112,560(Nm3/year) Case of co-generation system 827(RT)×3(units)÷1,000(RT/unit)×475(Nm3/h) = 1,178(Nm3/h) 1,178(Nm3/h)×11(h)×30(day/month)×12(month/year) = 4,664,880(Nm3/year) In case of co-generation system, the system can supply not only cooling water but also electricity as follows. 827(RT)×3(unit)÷1,000(RT)×1,100(kW) = 2,729(kW) Commercial building can reduce electricity consumption from power grid. From the above calculation, gas demand potential for one shopping mall has about 3 million Nm3/year in case of gas fired-absorption chiller and about 5 million Nm3/year in case of co-generation system. As for potential of gas demand for commercial sector in 2030, it is assumed at 70 million Nm3/year. This is equivalent to 20% of LPG demand in 2030. 4.7 Gas Demand for Transport Sector In Philippines, CNG buses are operating between Batangas and Laguna as pilot project. At present, there are 61 CNG buses in Philippines and average gas consumption is 1.67-2.0 km/Nm3 according to information from DOE. There are two gas filling stations, mother station in Batangas and daughter station in Laguna. As for capacity of filling station, mother station is available to fill up gas for 200 buses per day. On the other hand, daughter station can fill up gas for 50 buses per day. Actually, 26 buses are filled up a day. Average filling volume per one bus is 112.9 kg. Price of CNG is PHP18.38/kg. But this price is temporary price for pilot project. After pilot project, this price will be reviewed. Philippines has the target for promoting CNG buses as shown in Table 4.7-1.
Table 4.7-1 Target Number of CNG Buses in Philippines
Year Luzon Visayas Mindanao Total2011 100 100 7.952015 1,000 1,000 79.5022020 1,884 288 328 2,500 198.7552025 3,768 575 657 5,000 397.512030 7,535 1,151 1,314 10,000 795.02
Number of CNG Buses (Target) Diesel Equivalent(million liters)
Note: Diesel liter equivalent is based on 254 liters/day at 313 days per annum Source: DOE If this target was achieved, gas demand in Luzon for transport sector will be increased as shown in Table 4.7-2.
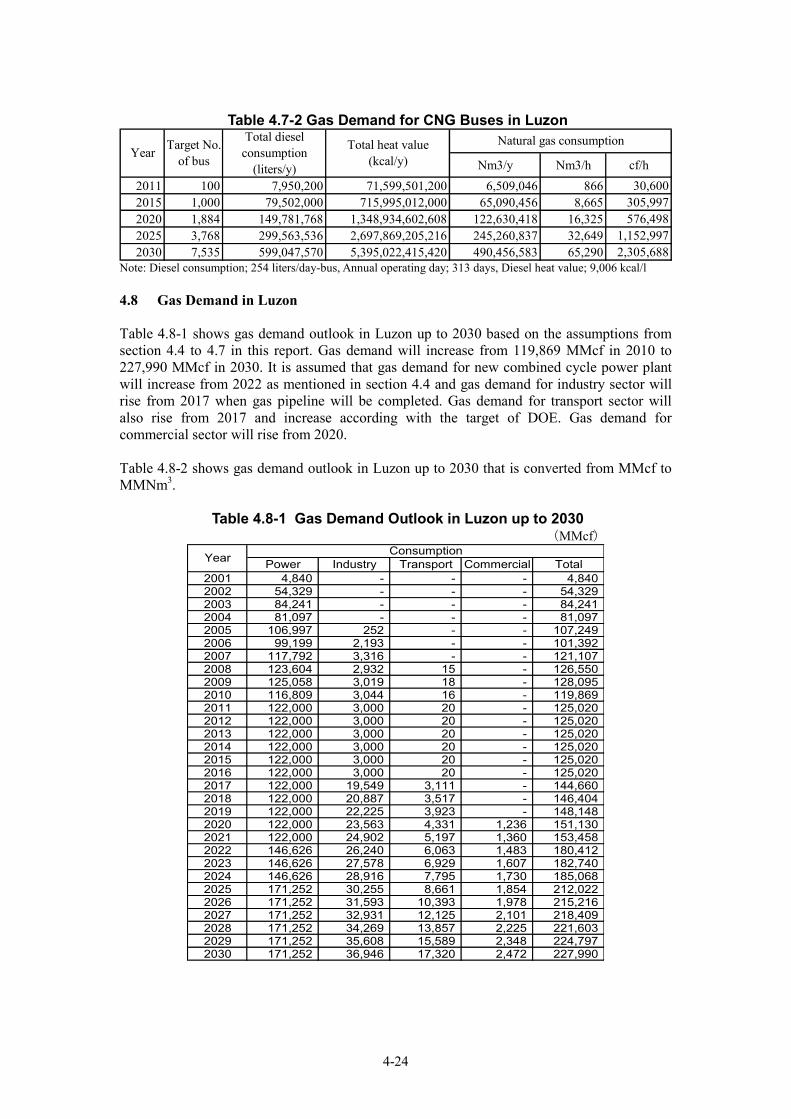
4-24
Table 4.7-2 Gas Demand for CNG Buses in Luzon
Nm3/y Nm3/h cf/h2011 100 7,950,200 71,599,501,200 6,509,046 866 30,6002015 1,000 79,502,000 715,995,012,000 65,090,456 8,665 305,9972020 1,884 149,781,768 1,348,934,602,608 122,630,418 16,325 576,4982025 3,768 299,563,536 2,697,869,205,216 245,260,837 32,649 1,152,9972030 7,535 599,047,570 5,395,022,415,420 490,456,583 65,290 2,305,688
YearNatural gas consumptionTarget No.
of bus
Total dieselconsumption
(liters/y)
Total heat value(kcal/y)
Note: Diesel consumption; 254 liters/day-bus, Annual operating day; 313 days, Diesel heat value; 9,006 kcal/l 4.8 Gas Demand in Luzon Table 4.8-1 shows gas demand outlook in Luzon up to 2030 based on the assumptions from section 4.4 to 4.7 in this report. Gas demand will increase from 119,869 MMcf in 2010 to 227,990 MMcf in 2030. It is assumed that gas demand for new combined cycle power plant will increase from 2022 as mentioned in section 4.4 and gas demand for industry sector will rise from 2017 when gas pipeline will be completed. Gas demand for transport sector will also rise from 2017 and increase according with the target of DOE. Gas demand for commercial sector will rise from 2020. Table 4.8-2 shows gas demand outlook in Luzon up to 2030 that is converted from MMcf to MMNm3.
Table 4.8-1 Gas Demand Outlook in Luzon up to 2030 (MMcf)
2001 4,840 - - - 4,840 2002 54,329 - - - 54,329 2003 84,241 - - - 84,241 2004 81,097 - - - 81,097 2005 106,997 252 - - 107,249 2006 99,199 2,193 - - 101,392 2007 117,792 3,316 - - 121,107 2008 123,604 2,932 15 - 126,550 2009 125,058 3,019 18 - 128,095 2010 116,809 3,044 16 - 119,869 2011 122,000 3,000 20 - 125,020 2012 122,000 3,000 20 - 125,020 2013 122,000 3,000 20 - 125,020 2014 122,000 3,000 20 - 125,020 2015 122,000 3,000 20 - 125,020 2016 122,000 3,000 20 - 125,020 2017 122,000 19,549 3,111 - 144,660 2018 122,000 20,887 3,517 - 146,404 2019 122,000 22,225 3,923 - 148,148 2020 122,000 23,563 4,331 1,236 151,130 2021 122,000 24,902 5,197 1,360 153,458 2022 146,626 26,240 6,063 1,483 180,412 2023 146,626 27,578 6,929 1,607 182,740 2024 146,626 28,916 7,795 1,730 185,068 2025 171,252 30,255 8,661 1,854 212,022 2026 171,252 31,593 10,393 1,978 215,216 2027 171,252 32,931 12,125 2,101 218,409 2028 171,252 34,269 13,857 2,225 221,603 2029 171,252 35,608 15,589 2,348 224,797 2030 171,252 36,946 17,320 2,472 227,990
Year ConsumptionIndustry Transport TotalCommercialPower
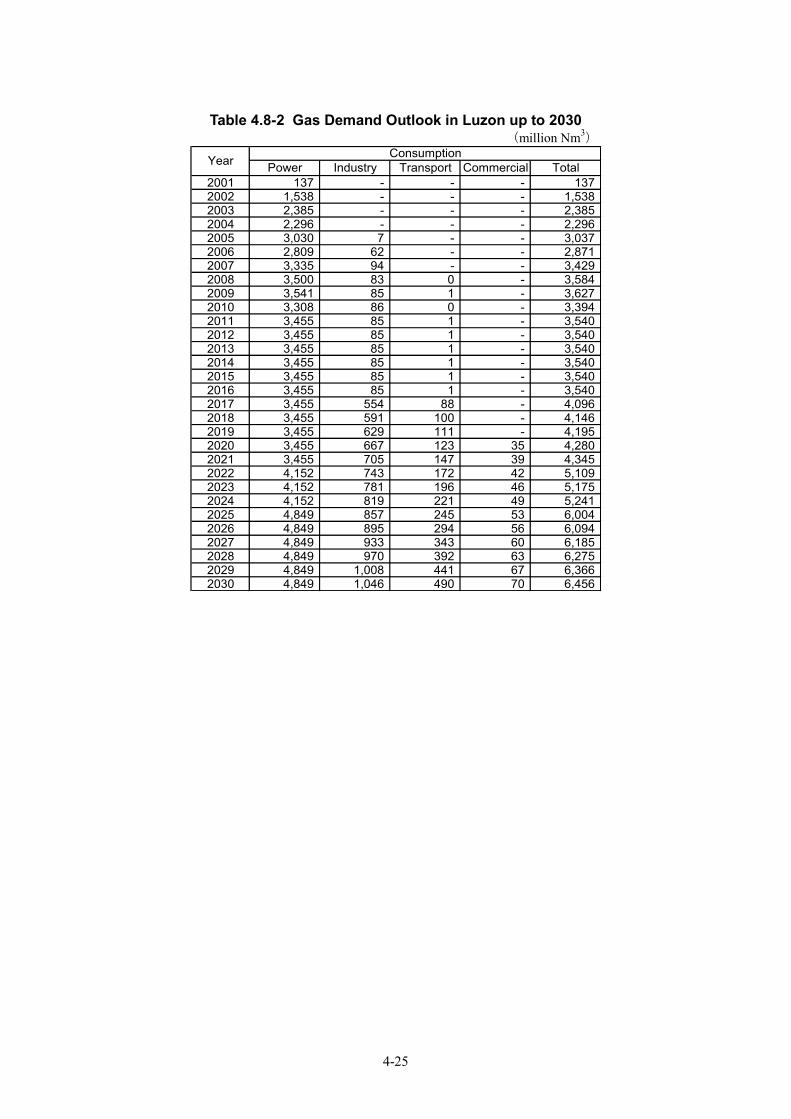
4-25
Table 4.8-2 Gas Demand Outlook in Luzon up to 2030
(million Nm3)
2001 137 - - - 137 2002 1,538 - - - 1,538 2003 2,385 - - - 2,385 2004 2,296 - - - 2,296 2005 3,030 7 - - 3,037 2006 2,809 62 - - 2,871 2007 3,335 94 - - 3,429 2008 3,500 83 0 - 3,584 2009 3,541 85 1 - 3,627 2010 3,308 86 0 - 3,394 2011 3,455 85 1 - 3,540 2012 3,455 85 1 - 3,540 2013 3,455 85 1 - 3,540 2014 3,455 85 1 - 3,540 2015 3,455 85 1 - 3,540 2016 3,455 85 1 - 3,540 2017 3,455 554 88 - 4,096 2018 3,455 591 100 - 4,146 2019 3,455 629 111 - 4,195 2020 3,455 667 123 35 4,280 2021 3,455 705 147 39 4,345 2022 4,152 743 172 42 5,109 2023 4,152 781 196 46 5,175 2024 4,152 819 221 49 5,241 2025 4,849 857 245 53 6,004 2026 4,849 895 294 56 6,094 2027 4,849 933 343 60 6,185 2028 4,849 970 392 63 6,275 2029 4,849 1,008 441 67 6,366 2030 4,849 1,046 490 70 6,456
Year ConsumptionIndustry Transport Commercial TotalPower

4-26
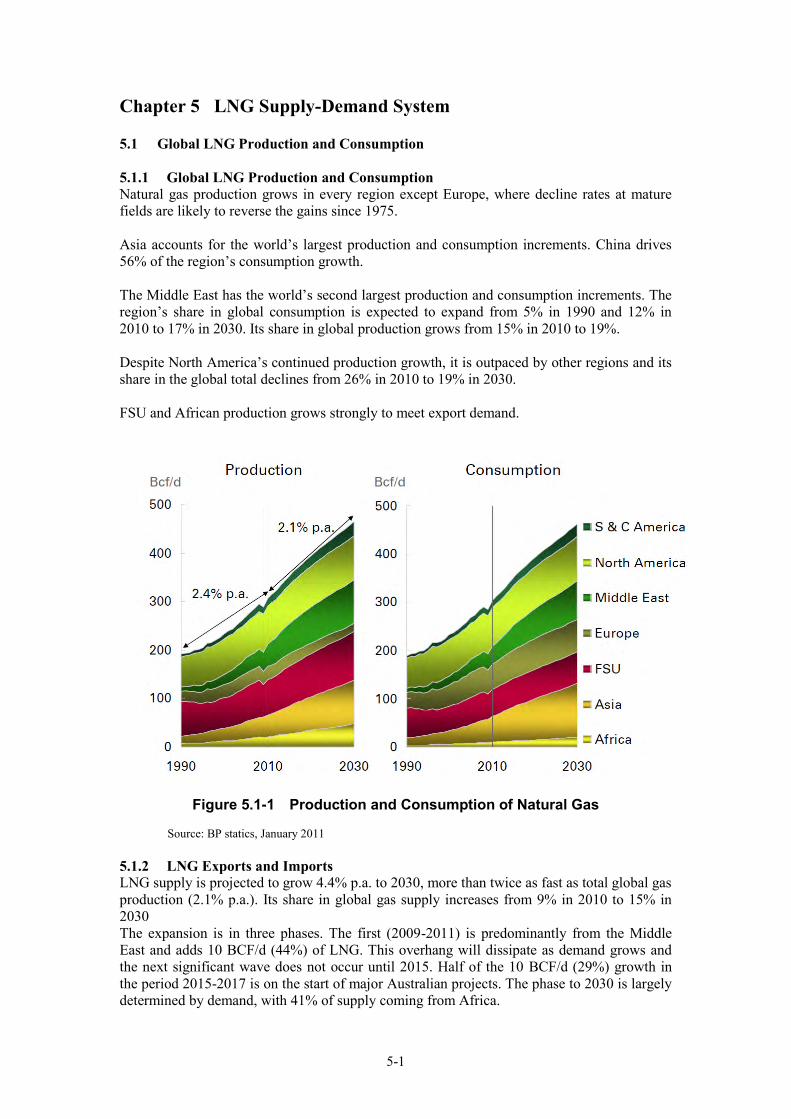
5-1
Chapter 5 LNG Supply-Demand System 5.1 Global LNG Production and Consumption 5.1.1 Global LNG Production and Consumption Natural gas production grows in every region except Europe, where decline rates at mature fields are likely to reverse the gains since 1975. Asia accounts for the world’s largest production and consumption increments. China drives 56% of the region’s consumption growth. The Middle East has the world’s second largest production and consumption increments. The region’s share in global consumption is expected to expand from 5% in 1990 and 12% in 2010 to 17% in 2030. Its share in global production grows from 15% in 2010 to 19%. Despite North America’s continued production growth, it is outpaced by other regions and its share in the global total declines from 26% in 2010 to 19% in 2030. FSU and African production grows strongly to meet export demand.
Figure 5.1-1 Production and Consumption of Natural Gas Source: BP statics, January 2011
5.1.2 LNG Exports and Imports LNG supply is projected to grow 4.4% p.a. to 2030, more than twice as fast as total global gas production (2.1% p.a.). Its share in global gas supply increases from 9% in 2010 to 15% in 2030 The expansion is in three phases. The first (2009-2011) is predominantly from the Middle East and adds 10 BCF/d (44%) of LNG. This overhang will dissipate as demand grows and the next significant wave does not occur until 2015. Half of the 10 BCF/d (29%) growth in the period 2015-2017 is on the start of major Australian projects. The phase to 2030 is largely determined by demand, with 41% of supply coming from Africa.
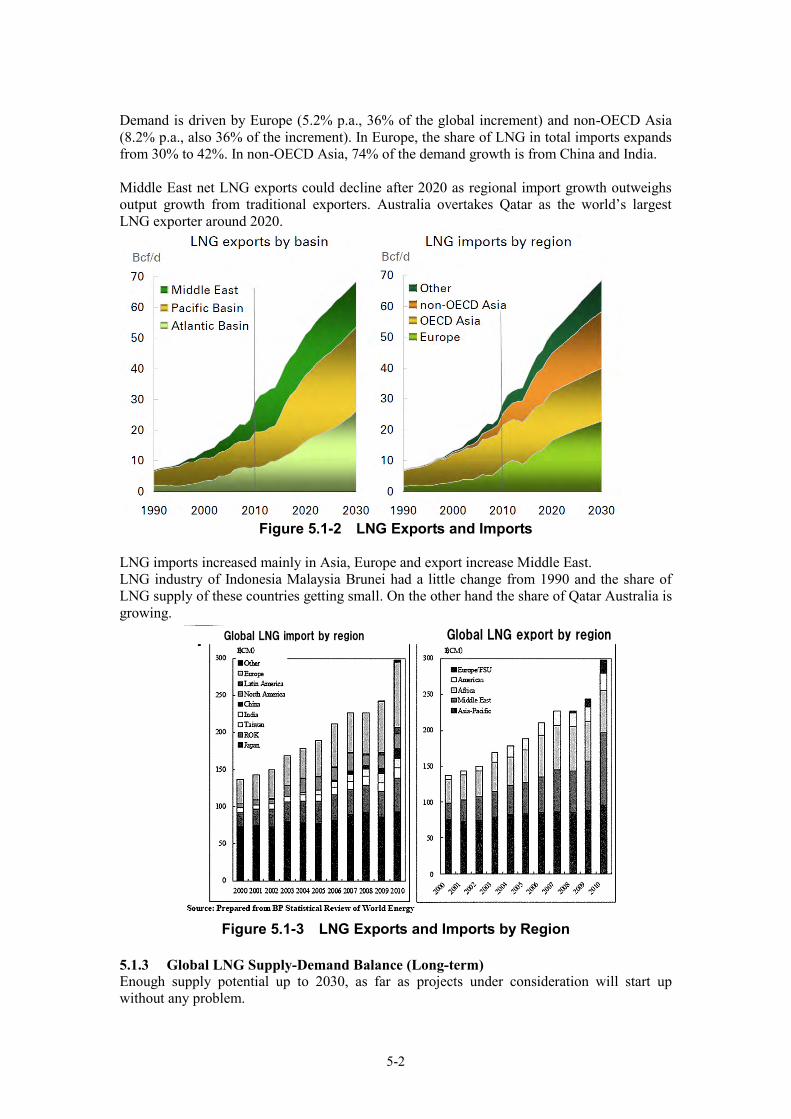
5-2
Demand is driven by Europe (5.2% p.a., 36% of the global increment) and non-OECD Asia (8.2% p.a., also 36% of the increment). In Europe, the share of LNG in total imports expands from 30% to 42%. In non-OECD Asia, 74% of the demand growth is from China and India. Middle East net LNG exports could decline after 2020 as regional import growth outweighs output growth from traditional exporters. Australia overtakes Qatar as the world’s largest LNG exporter around 2020.
Figure 5.1-2 LNG Exports and Imports
LNG imports increased mainly in Asia, Europe and export increase Middle East. LNG industry of Indonesia Malaysia Brunei had a little change from 1990 and the share of LNG supply of these countries getting small. On the other hand the share of Qatar Australia is growing.
Figure 5.1-3 LNG Exports and Imports by Region 5.1.3 Global LNG Supply-Demand Balance (Long-term) Enough supply potential up to 2030, as far as projects under consideration will start up without any problem.
Global LNG import by region Global LNG import by regionGlobal LNG export by regionGlobal LNG import by region Global LNG import by regionGlobal LNG export by region
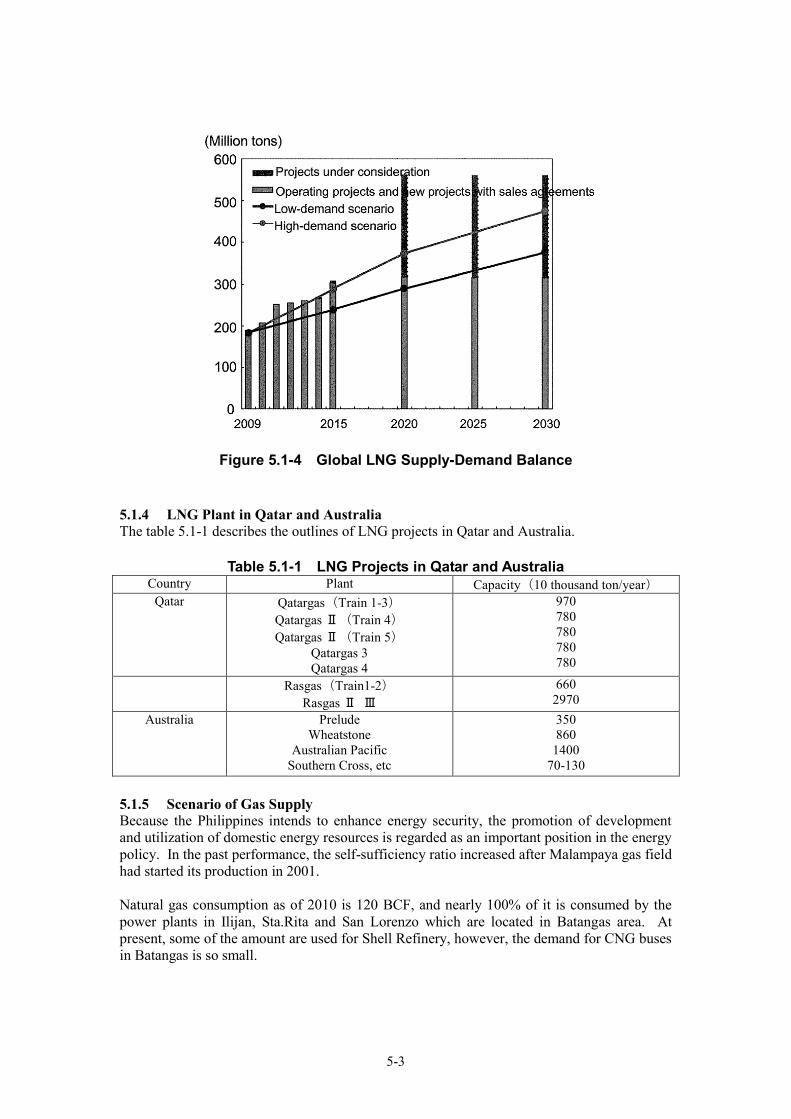
5-3
Figure 5.1-4 Global LNG Supply-Demand Balance
5.1.4 LNG Plant in Qatar and Australia The table 5.1-1 describes the outlines of LNG projects in Qatar and Australia.
Table 5.1-1 LNG Projects in Qatar and Australia Country Plant Capacity(10 thousand ton/year)
Qatar Qatargas(Train 1-3) Qatargas Ⅱ(Train 4) Qatargas Ⅱ(Train 5)
Qatargas 3 Qatargas 4
970 780 780 780 780
Rasgas(Train1-2) Rasgas Ⅱ Ⅲ
660 2970
Australia Prelude Wheatstone
Australian Pacific Southern Cross, etc
350 860
1400 70-130
5.1.5 Scenario of Gas Supply Because the Philippines intends to enhance energy security, the promotion of development and utilization of domestic energy resources is regarded as an important position in the energy policy. In the past performance, the self-sufficiency ratio increased after Malampaya gas field had started its production in 2001. Natural gas consumption as of 2010 is 120 BCF, and nearly 100% of it is consumed by the power plants in Ilijan, Sta.Rita and San Lorenzo which are located in Batangas area. At present, some of the amount are used for Shell Refinery, however, the demand for CNG buses in Batangas is so small.

5-4
It is said that the reserves of Camago-Malampaya gas field is 2.7 Tcf and accumulated gas production up to 2010 reaches about 1 Tcf. Therefore, R/P ratio of the gas field is only 15 years without new additional reserves. So one of the scenarios of gas supply is as follows. The pipeline is assumed to be constructed within two years starting from 2015,
inaugurating for commencement of business in 2017. The LNG regasification terminal will only operate from 2021 onwards, the gas to be
transmitted between 2017 and 2020 is assumed to be from Camago-Malampaya After the pipeline LNG regasification terminal complete, natural gas demand for industry
and power sectors increase, and the economic growth would be. Accelerate.
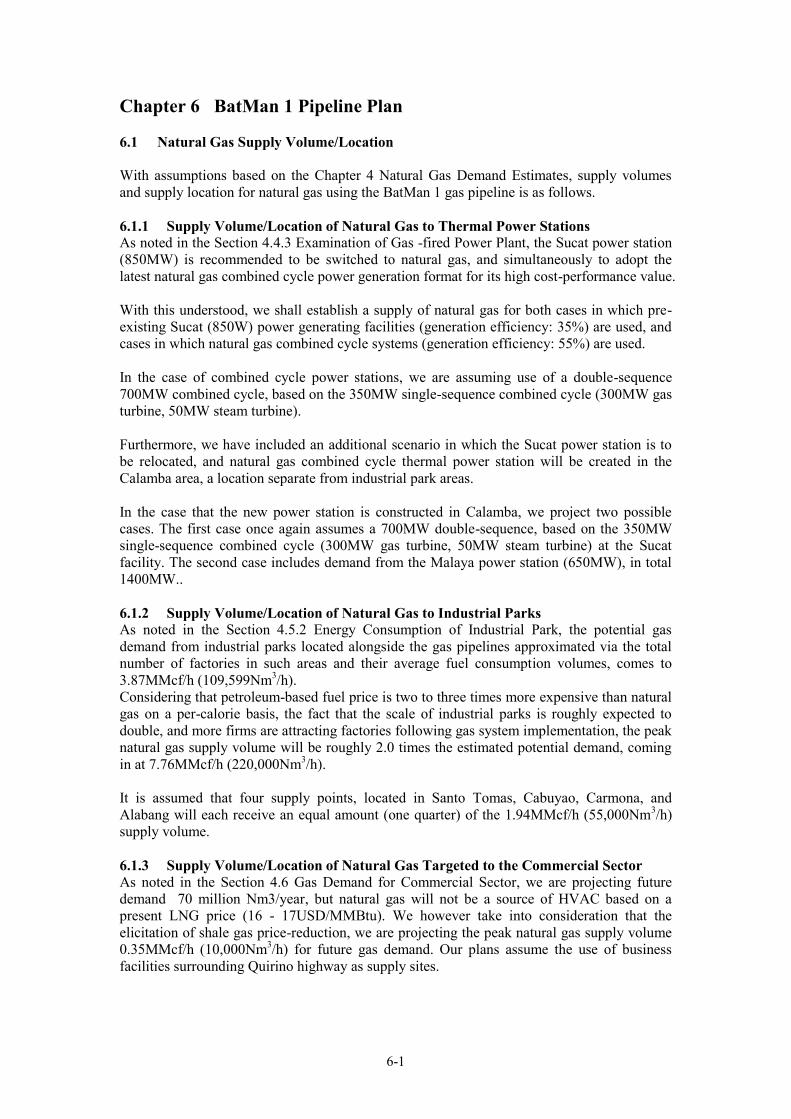
6-1
Chapter 6 BatMan 1 Pipeline Plan 6.1 Natural Gas Supply Volume/Location With assumptions based on the Chapter 4 Natural Gas Demand Estimates, supply volumes and supply location for natural gas using the BatMan 1 gas pipeline is as follows. 6.1.1 Supply Volume/Location of Natural Gas to Thermal Power Stations As noted in the Section 4.4.3 Examination of Gas -fired Power Plant, the Sucat power station (850MW) is recommended to be switched to natural gas, and simultaneously to adopt the latest natural gas combined cycle power generation format for its high cost-performance value. With this understood, we shall establish a supply of natural gas for both cases in which pre-existing Sucat (850W) power generating facilities (generation efficiency: 35%) are used, and cases in which natural gas combined cycle systems (generation efficiency: 55%) are used. In the case of combined cycle power stations, we are assuming use of a double-sequence 700MW combined cycle, based on the 350MW single-sequence combined cycle (300MW gas turbine, 50MW steam turbine). Furthermore, we have included an additional scenario in which the Sucat power station is to be relocated, and natural gas combined cycle thermal power station will be created in the Calamba area, a location separate from industrial park areas. In the case that the new power station is constructed in Calamba, we project two possible cases. The first case once again assumes a 700MW double-sequence, based on the 350MW single-sequence combined cycle (300MW gas turbine, 50MW steam turbine) at the Sucat facility. The second case includes demand from the Malaya power station (650MW), in total 1400MW.. 6.1.2 Supply Volume/Location of Natural Gas to Industrial Parks As noted in the Section 4.5.2 Energy Consumption of Industrial Park, the potential gas demand from industrial parks located alongside the gas pipelines approximated via the total number of factories in such areas and their average fuel consumption volumes, comes to 3.87MMcf/h (109,599Nm3/h). Considering that petroleum-based fuel price is two to three times more expensive than natural gas on a per-calorie basis, the fact that the scale of industrial parks is roughly expected to double, and more firms are attracting factories following gas system implementation, the peak natural gas supply volume will be roughly 2.0 times the estimated potential demand, coming in at 7.76MMcf/h (220,000Nm3/h). It is assumed that four supply points, located in Santo Tomas, Cabuyao, Carmona, and Alabang will each receive an equal amount (one quarter) of the 1.94MMcf/h (55,000Nm3/h) supply volume. 6.1.3 Supply Volume/Location of Natural Gas Targeted to the Commercial Sector As noted in the Section 4.6 Gas Demand for Commercial Sector, we are projecting future demand 70 million Nm3/year, but natural gas will not be a source of HVAC based on a present LNG price (16 - 17USD/MMBtu). We however take into consideration that the elicitation of shale gas price-reduction, we are projecting the peak natural gas supply volume 0.35MMcf/h (10,000Nm3/h) for future gas demand. Our plans assume the use of business facilities surrounding Quirino highway as supply sites.
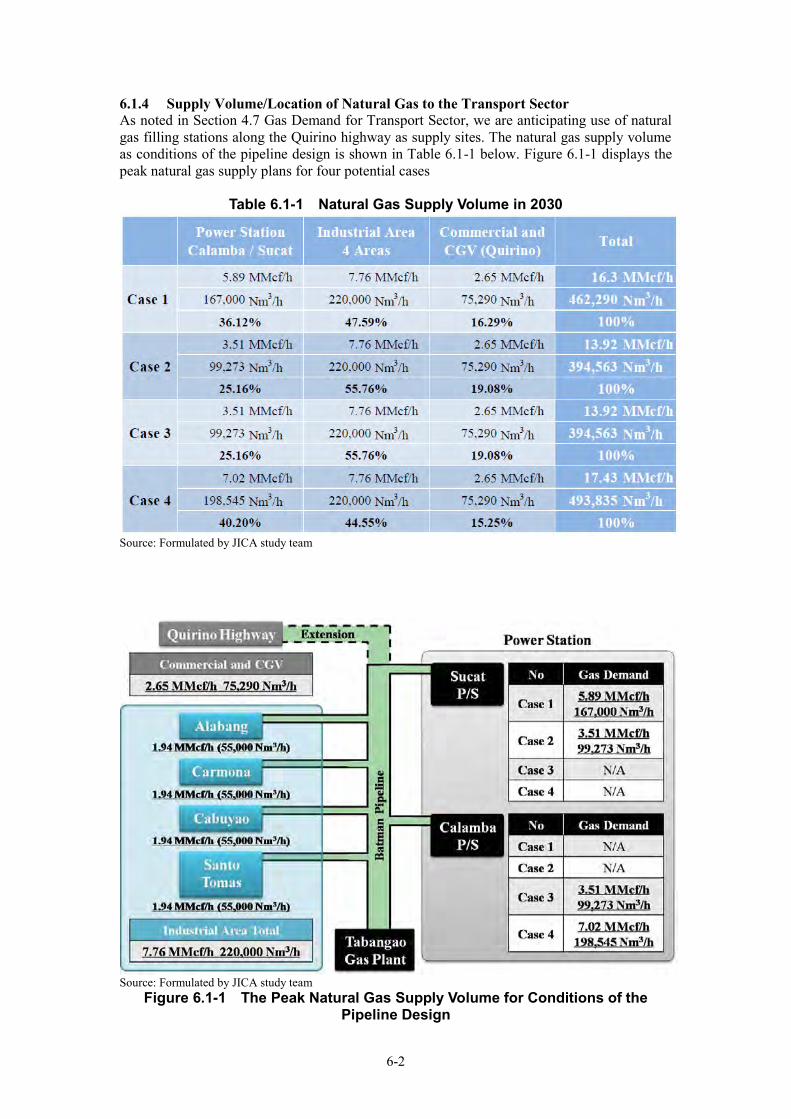
6-2
6.1.4 Supply Volume/Location of Natural Gas to the Transport Sector As noted in Section 4.7 Gas Demand for Transport Sector, we are anticipating use of natural gas filling stations along the Quirino highway as supply sites. The natural gas supply volume as conditions of the pipeline design is shown in Table 6.1-1 below. Figure 6.1-1 displays the peak natural gas supply plans for four potential cases
Table 6.1-1 Natural Gas Supply Volume in 2030
Source: Formulated by JICA study team
Source: Formulated by JICA study team
Figure 6.1-1 The Peak Natural Gas Supply Volume for Conditions of the Pipeline Design
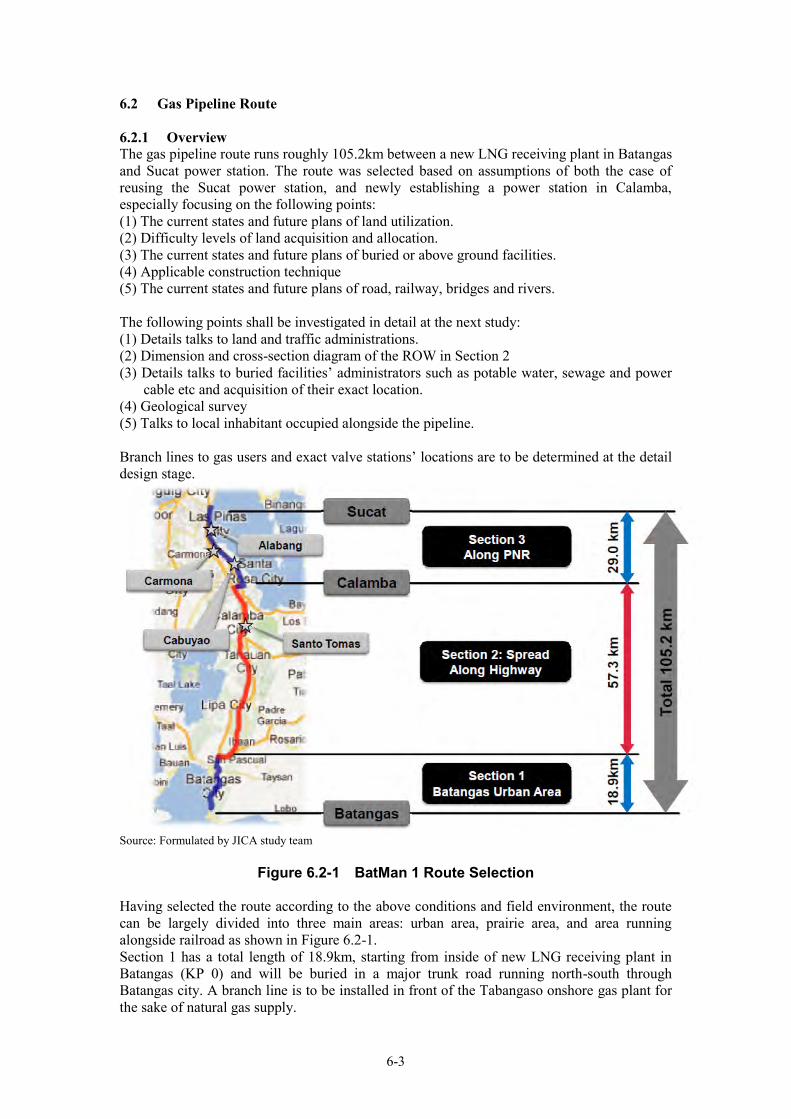
6-3
6.2 Gas Pipeline Route 6.2.1 Overview The gas pipeline route runs roughly 105.2km between a new LNG receiving plant in Batangas and Sucat power station. The route was selected based on assumptions of both the case of reusing the Sucat power station, and newly establishing a power station in Calamba, especially focusing on the following points: (1) The current states and future plans of land utilization. (2) Difficulty levels of land acquisition and allocation. (3) The current states and future plans of buried or above ground facilities. (4) Applicable construction technique (5) The current states and future plans of road, railway, bridges and rivers. The following points shall be investigated in detail at the next study: (1) Details talks to land and traffic administrations. (2) Dimension and cross-section diagram of the ROW in Section 2 (3) Details talks to buried facilities’ administrators such as potable water, sewage and power
cable etc and acquisition of their exact location. (4) Geological survey (5) Talks to local inhabitant occupied alongside the pipeline. Branch lines to gas users and exact valve stations’ locations are to be determined at the detail design stage.
Source: Formulated by JICA study team
Figure 6.2-1 BatMan 1 Route Selection
Having selected the route according to the above conditions and field environment, the route can be largely divided into three main areas: urban area, prairie area, and area running alongside railroad as shown in Figure 6.2-1. Section 1 has a total length of 18.9km, starting from inside of new LNG receiving plant in Batangas (KP 0) and will be buried in a major trunk road running north-south through Batangas city. A branch line is to be installed in front of the Tabangaso onshore gas plant for the sake of natural gas supply.
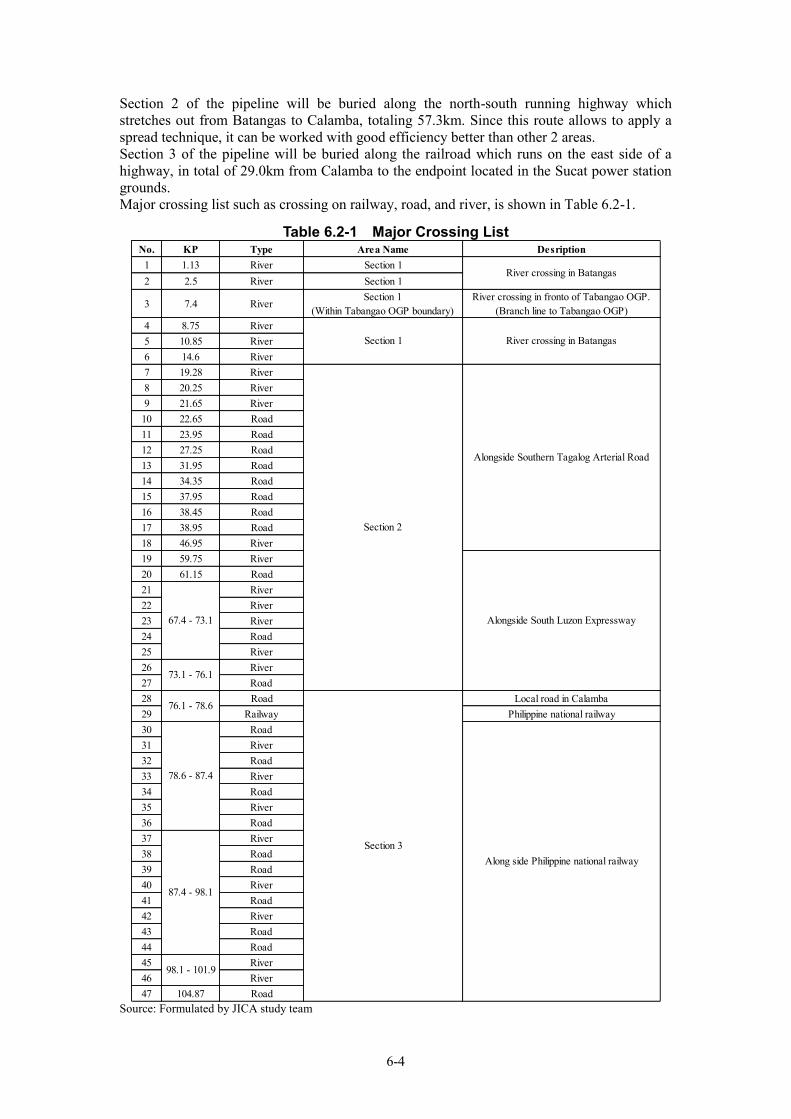
6-4
Section 2 of the pipeline will be buried along the north-south running highway which stretches out from Batangas to Calamba, totaling 57.3km. Since this route allows to apply a spread technique, it can be worked with good efficiency better than other 2 areas. Section 3 of the pipeline will be buried along the railroad which runs on the east side of a highway, in total of 29.0km from Calamba to the endpoint located in the Sucat power station grounds. Major crossing list such as crossing on railway, road, and river, is shown in Table 6.2-1.
Table 6.2-1 Major Crossing List No. KP Type Area Name Desription
1 1.13 River Section 12 2.5 River Section 1
3 7.4 RiverSection 1
(Within Tabangao OGP boundary)River crossing in fronto of Tabangao OGP.
(Branch line to Tabangao OGP)4 8.75 River5 10.85 River6 14.6 River7 19.28 River8 20.25 River9 21.65 River
10 22.65 Road11 23.95 Road12 27.25 Road13 31.95 Road14 34.35 Road15 37.95 Road16 38.45 Road17 38.95 Road18 46.95 River19 59.75 River20 61.15 Road21 River22 River23 River24 Road25 River26 River27 Road28 Road Local road in Calamba29 Railway Philippine national railway30 Road31 River32 Road33 River34 Road35 River36 Road37 River38 Road39 Road40 River41 Road42 River43 Road44 Road45 River46 River47 104.87 Road
River crossing in Batangas
River crossing in Batangas
73.1 - 76.1
Alongside Southern Tagalog Arterial Road
Alongside South Luzon Expressway
Along side Philippine national railway
67.4 - 73.1
Section 2
Section 3
76.1 - 78.6
78.6 - 87.4
87.4 - 98.1
Section 1
98.1 - 101.9
Source: Formulated by JICA study team
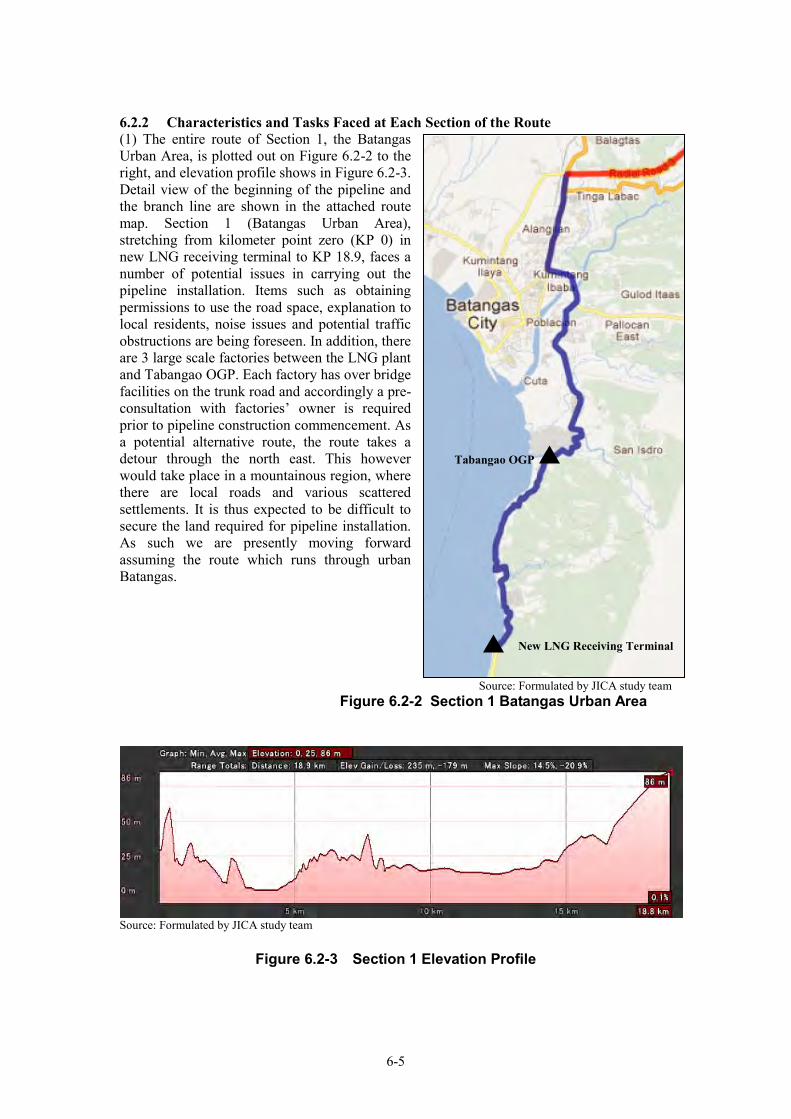
6-5
6.2.2 Characteristics and Tasks Faced at Each Section of the Route (1) The entire route of Section 1, the Batangas Urban Area, is plotted out on Figure 6.2-2 to the right, and elevation profile shows in Figure 6.2-3. Detail view of the beginning of the pipeline and the branch line are shown in the attached route map. Section 1 (Batangas Urban Area), stretching from kilometer point zero (KP 0) in new LNG receiving terminal to KP 18.9, faces a number of potential issues in carrying out the pipeline installation. Items such as obtaining permissions to use the road space, explanation to local residents, noise issues and potential traffic obstructions are being foreseen. In addition, there are 3 large scale factories between the LNG plant and Tabangao OGP. Each factory has over bridge facilities on the trunk road and accordingly a pre- consultation with factories’ owner is required prior to pipeline construction commencement. As a potential alternative route, the route takes a detour through the north east. This however would take place in a mountainous region, where there are local roads and various scattered settlements. It is thus expected to be difficult to secure the land required for pipeline installation. As such we are presently moving forward assuming the route which runs through urban Batangas.
Source: Formulated by JICA study team
Figure 6.2-2 Section 1 Batangas Urban Area
Source: Formulated by JICA study team
Figure 6.2-3 Section 1 Elevation Profile
New LNG Receiving Terminal
Tabangao OGP
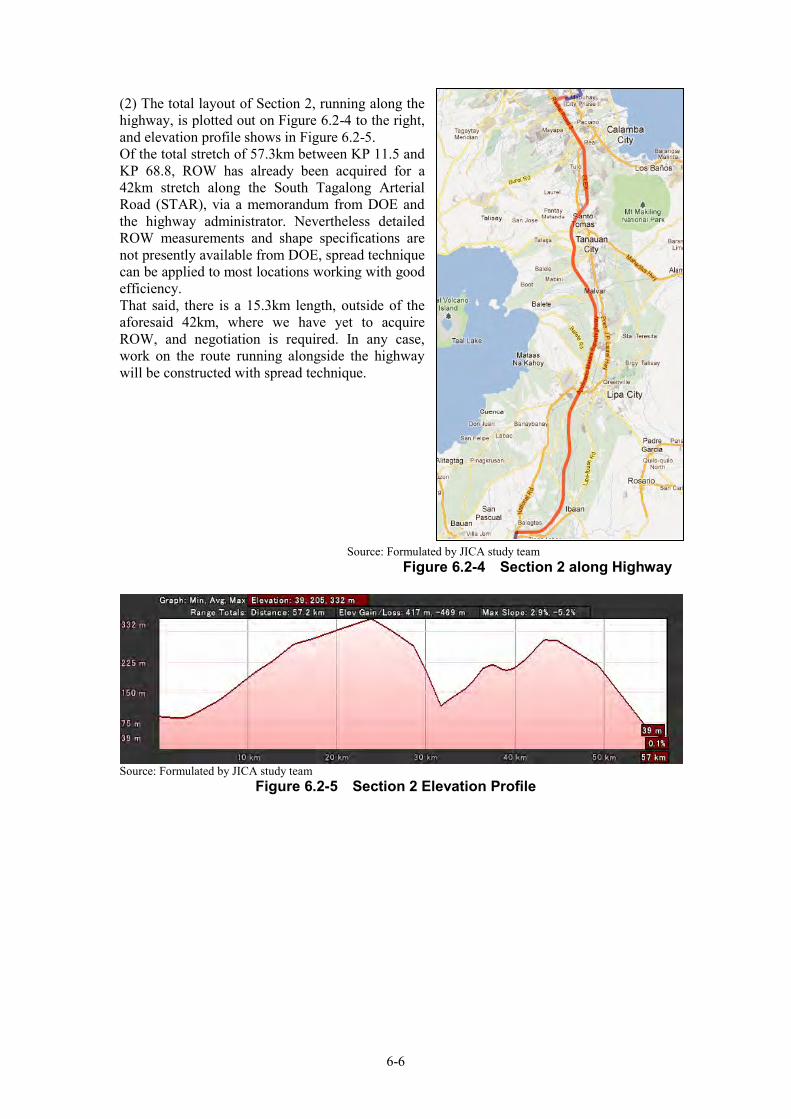
6-6
(2) The total layout of Section 2, running along the highway, is plotted out on Figure 6.2-4 to the right, and elevation profile shows in Figure 6.2-5. Of the total stretch of 57.3km between KP 11.5 and KP 68.8, ROW has already been acquired for a 42km stretch along the South Tagalong Arterial Road (STAR), via a memorandum from DOE and the highway administrator. Nevertheless detailed ROW measurements and shape specifications are not presently available from DOE, spread technique can be applied to most locations working with good efficiency. That said, there is a 15.3km length, outside of the aforesaid 42km, where we have yet to acquire ROW, and negotiation is required. In any case, work on the route running alongside the highway will be constructed with spread technique.
Source: Formulated by JICA study team Figure 6.2-4 Section 2 along Highway
Source: Formulated by JICA study team
Figure 6.2-5 Section 2 Elevation Profile
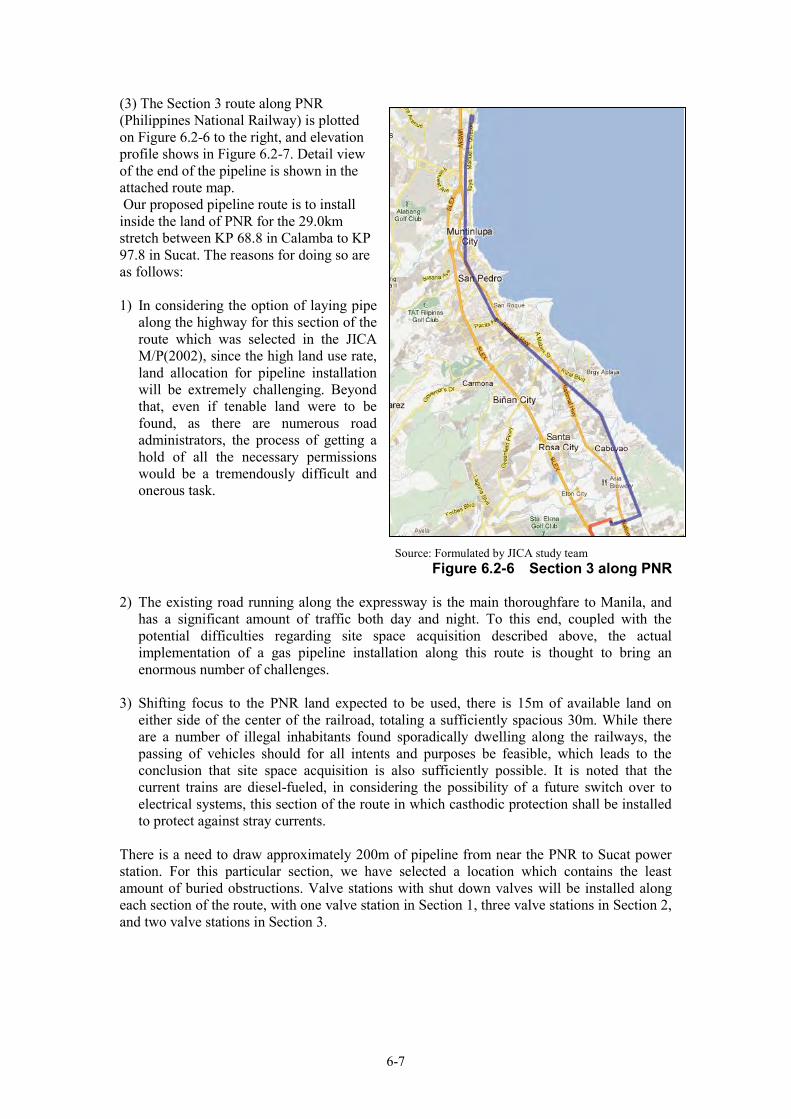
6-7
(3) The Section 3 route along PNR (Philippines National Railway) is plotted on Figure 6.2-6 to the right, and elevation profile shows in Figure 6.2-7. Detail view of the end of the pipeline is shown in the attached route map. Our proposed pipeline route is to install inside the land of PNR for the 29.0km stretch between KP 68.8 in Calamba to KP 97.8 in Sucat. The reasons for doing so are as follows:
1) In considering the option of laying pipe
along the highway for this section of the route which was selected in the JICA M/P(2002), since the high land use rate, land allocation for pipeline installation will be extremely challenging. Beyond that, even if tenable land were to be found, as there are numerous road administrators, the process of getting a hold of all the necessary permissions would be a tremendously difficult and onerous task.
Source: Formulated by JICA study team
Figure 6.2-6 Section 3 along PNR
2) The existing road running along the expressway is the main thoroughfare to Manila, and has a significant amount of traffic both day and night. To this end, coupled with the potential difficulties regarding site space acquisition described above, the actual implementation of a gas pipeline installation along this route is thought to bring an enormous number of challenges.
3) Shifting focus to the PNR land expected to be used, there is 15m of available land on either side of the center of the railroad, totaling a sufficiently spacious 30m. While there are a number of illegal inhabitants found sporadically dwelling along the railways, the passing of vehicles should for all intents and purposes be feasible, which leads to the conclusion that site space acquisition is also sufficiently possible. It is noted that the current trains are diesel-fueled, in considering the possibility of a future switch over to electrical systems, this section of the route in which casthodic protection shall be installed to protect against stray currents.
There is a need to draw approximately 200m of pipeline from near the PNR to Sucat power station. For this particular section, we have selected a location which contains the least amount of buried obstructions. Valve stations with shut down valves will be installed along each section of the route, with one valve station in Section 1, three valve stations in Section 2, and two valve stations in Section 3.
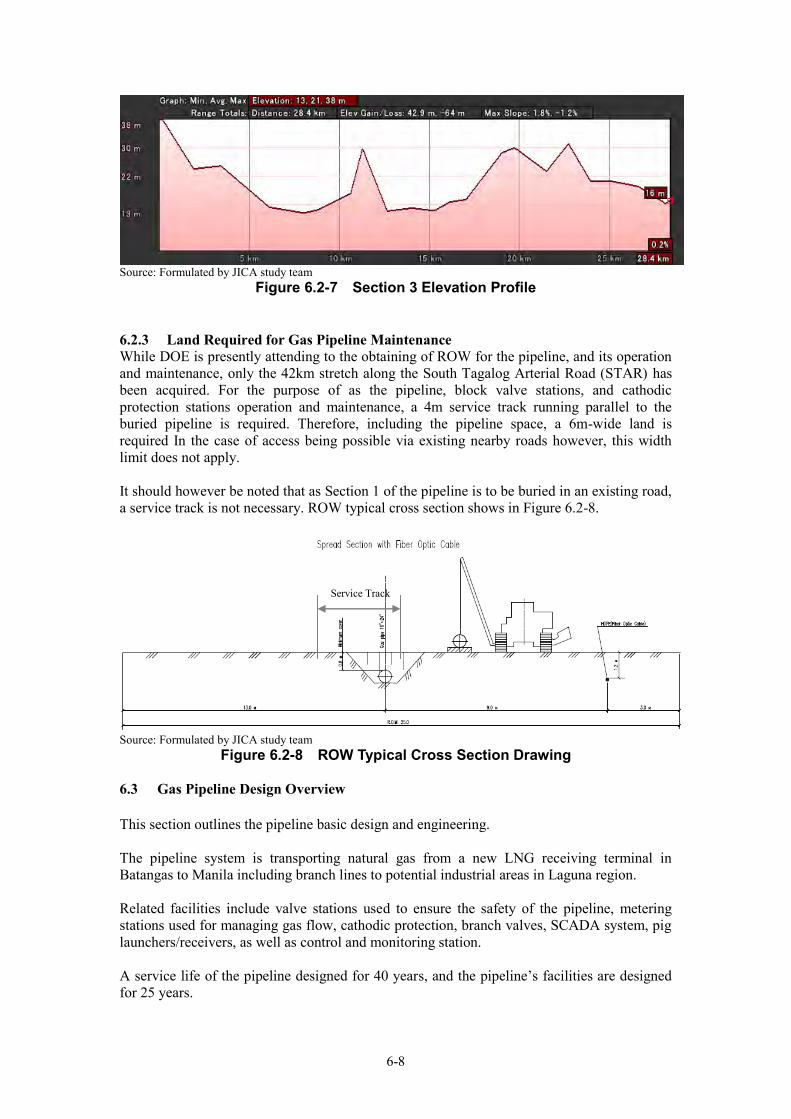
6-8
Source: Formulated by JICA study team
Figure 6.2-7 Section 3 Elevation Profile 6.2.3 Land Required for Gas Pipeline Maintenance While DOE is presently attending to the obtaining of ROW for the pipeline, and its operation and maintenance, only the 42km stretch along the South Tagalog Arterial Road (STAR) has been acquired. For the purpose of as the pipeline, block valve stations, and cathodic protection stations operation and maintenance, a 4m service track running parallel to the buried pipeline is required. Therefore, including the pipeline space, a 6m-wide land is required In the case of access being possible via existing nearby roads however, this width limit does not apply. It should however be noted that as Section 1 of the pipeline is to be buried in an existing road, a service track is not necessary. ROW typical cross section shows in Figure 6.2-8.
Source: Formulated by JICA study team
Figure 6.2-8 ROW Typical Cross Section Drawing 6.3 Gas Pipeline Design Overview This section outlines the pipeline basic design and engineering. The pipeline system is transporting natural gas from a new LNG receiving terminal in Batangas to Manila including branch lines to potential industrial areas in Laguna region. Related facilities include valve stations used to ensure the safety of the pipeline, metering stations used for managing gas flow, cathodic protection, branch valves, SCADA system, pig launchers/receivers, as well as control and monitoring station. A service life of the pipeline designed for 40 years, and the pipeline’s facilities are designed for 25 years.
Service Track
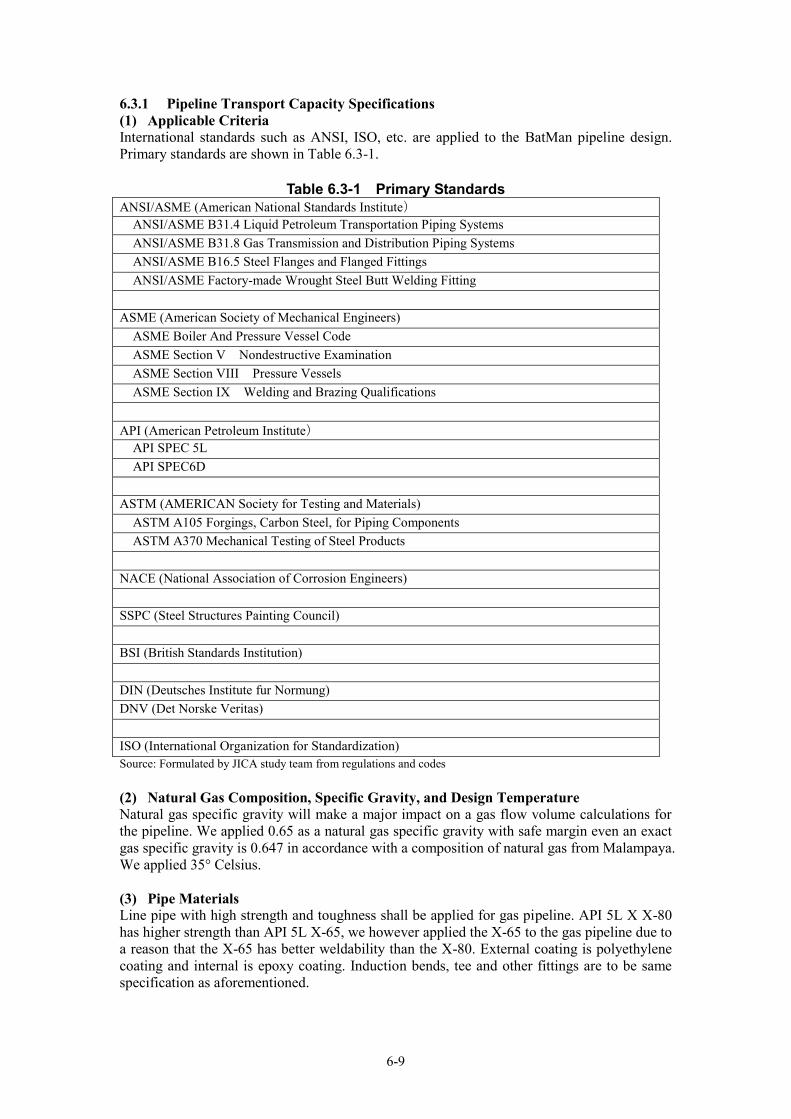
6-9
6.3.1 Pipeline Transport Capacity Specifications (1) Applicable Criteria International standards such as ANSI, ISO, etc. are applied to the BatMan pipeline design. Primary standards are shown in Table 6.3-1.
Table 6.3-1 Primary Standards ANSI/ASME (American National Standards Institute)
ANSI/ASME B31.4 Liquid Petroleum Transportation Piping Systems ANSI/ASME B31.8 Gas Transmission and Distribution Piping Systems ANSI/ASME B16.5 Steel Flanges and Flanged Fittings ANSI/ASME Factory-made Wrought Steel Butt Welding Fitting
ASME (American Society of Mechanical Engineers)
ASME Boiler And Pressure Vessel Code ASME Section V Nondestructive Examination ASME Section VIII Pressure Vessels ASME Section IX Welding and Brazing Qualifications
API (American Petroleum Institute)
API SPEC 5L API SPEC6D
ASTM (AMERICAN Society for Testing and Materials)
ASTM A105 Forgings, Carbon Steel, for Piping Components ASTM A370 Mechanical Testing of Steel Products
NACE (National Association of Corrosion Engineers) SSPC (Steel Structures Painting Council) BSI (British Standards Institution) DIN (Deutsches Institute fur Normung) DNV (Det Norske Veritas) ISO (International Organization for Standardization) Source: Formulated by JICA study team from regulations and codes (2) Natural Gas Composition, Specific Gravity, and Design Temperature Natural gas specific gravity will make a major impact on a gas flow volume calculations for the pipeline. We applied 0.65 as a natural gas specific gravity with safe margin even an exact gas specific gravity is 0.647 in accordance with a composition of natural gas from Malampaya. We applied 35° Celsius. (3) Pipe Materials Line pipe with high strength and toughness shall be applied for gas pipeline. API 5L X X-80 has higher strength than API 5L X-65, we however applied the X-65 to the gas pipeline due to a reason that the X-65 has better weldability than the X-80. External coating is polyethylene coating and internal is epoxy coating. Induction bends, tee and other fittings are to be same specification as aforementioned.
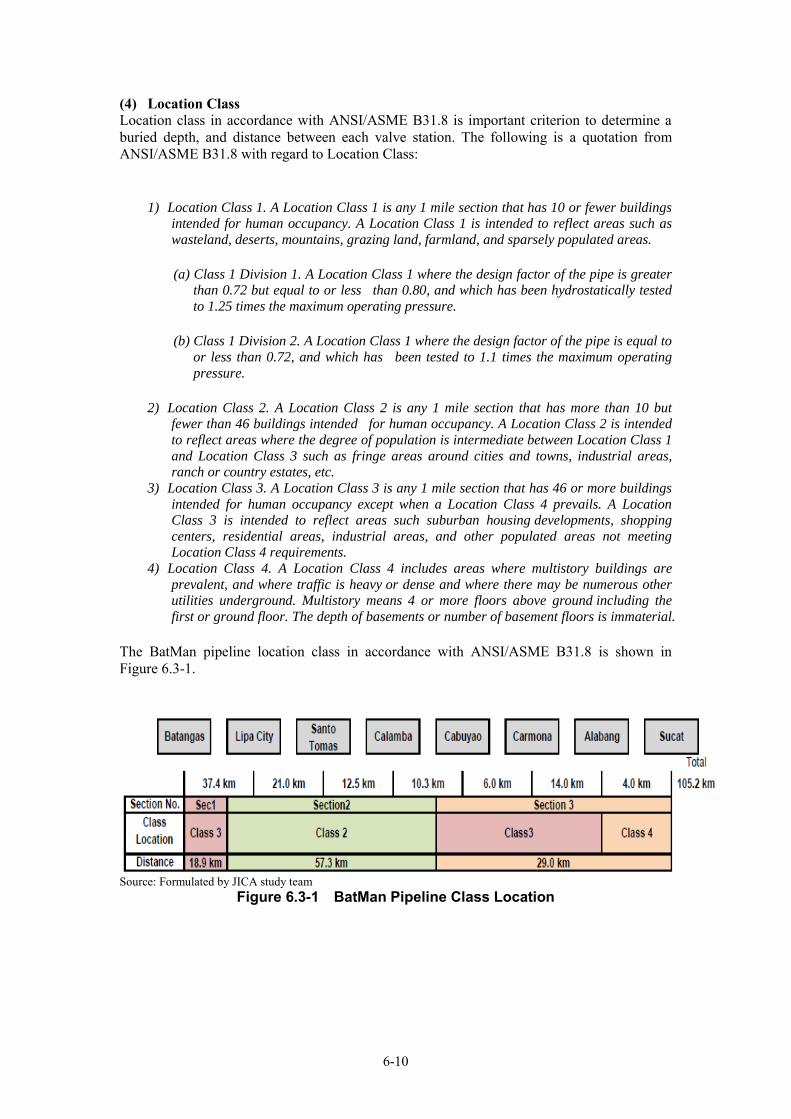
6-10
(4) Location Class Location class in accordance with ANSI/ASME B31.8 is important criterion to determine a buried depth, and distance between each valve station. The following is a quotation from ANSI/ASME B31.8 with regard to Location Class:
1) Location Class 1. A Location Class 1 is any 1 mile section that has 10 or fewer buildings intended for human occupancy. A Location Class 1 is intended to reflect areas such as
wasteland, deserts, mountains, grazing land, farmland, and sparsely populated areas.
(a) Class 1 Division 1. A Location Class 1 where the design factor of the pipe is greater than 0.72 but equal to or less than 0.80, and which has been hydrostatically tested
to 1.25 times the maximum operating pressure.
(b) Class 1 Division 2. A Location Class 1 where the design factor of the pipe is equal to
or less than 0.72, and which has been tested to 1.1 times the maximum operating
pressure.
2) Location Class 2. A Location Class 2 is any 1 mile section that has more than 10 but fewer than 46 buildings intended for human occupancy. A Location Class 2 is intended
to reflect areas where the degree of population is intermediate between Location Class 1
and Location Class 3 such as fringe areas around cities and towns, industrial areas, ranch or country estates, etc.
3) Location Class 3. A Location Class 3 is any 1 mile section that has 46 or more buildings
intended for human occupancy except when a Location Class 4 prevails. A Location Class 3 is intended to reflect areas such suburban housing developments, shopping
centers, residential areas, industrial areas, and other populated areas not meeting Location Class 4 requirements.
4) Location Class 4. A Location Class 4 includes areas where multistory buildings are
prevalent, and where traffic is heavy or dense and where there may be numerous other utilities underground. Multistory means 4 or more floors above ground including the
first or ground floor. The depth of basements or number of basement floors is immaterial.
The BatMan pipeline location class in accordance with ANSI/ASME B31.8 is shown in Figure 6.3-1.
Source: Formulated by JICA study team
Figure 6.3-1 BatMan Pipeline Class Location
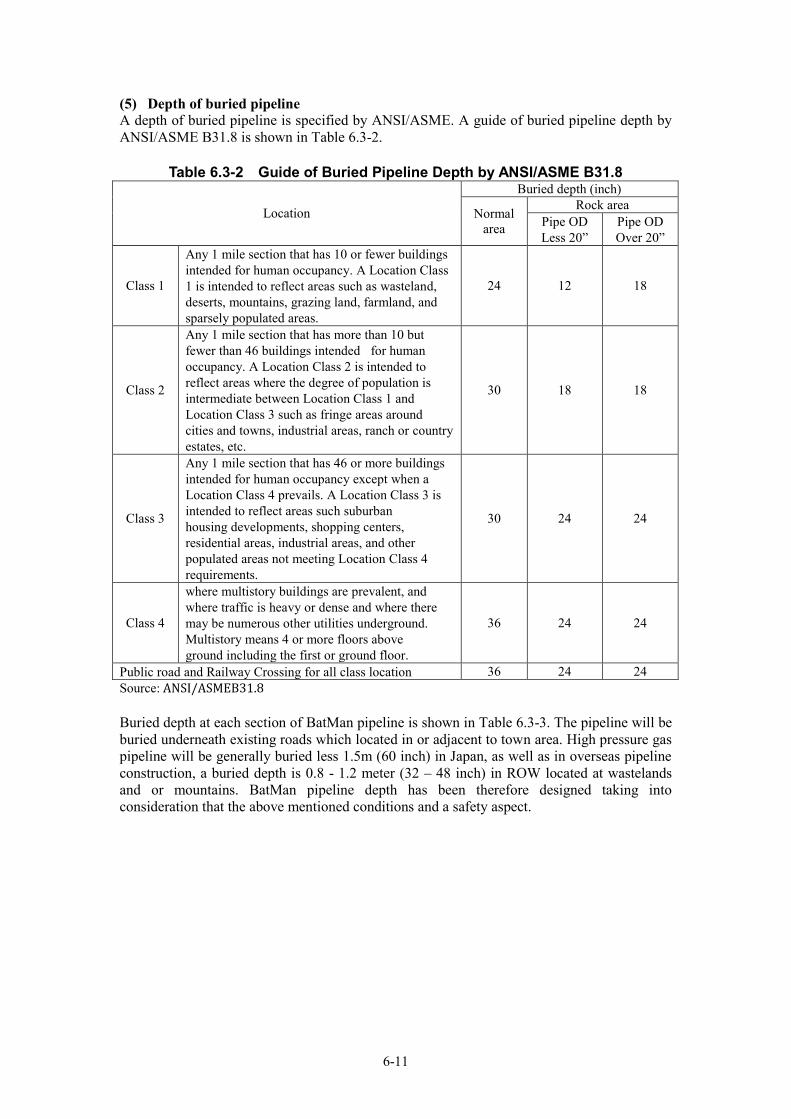
6-11
(5) Depth of buried pipeline A depth of buried pipeline is specified by ANSI/ASME. A guide of buried pipeline depth by ANSI/ASME B31.8 is shown in Table 6.3-2.
Table 6.3-2 Guide of Buried Pipeline Depth by ANSI/ASME B31.8
Location
Buried depth (inch)
Normal area
Rock area Pipe OD Less 20”
Pipe OD Over 20”
Class 1
Any 1 mile section that has 10 or fewer buildings intended for human occupancy. A Location Class 1 is intended to reflect areas such as wasteland, deserts, mountains, grazing land, farmland, and sparsely populated areas.
24 12 18
Class 2
Any 1 mile section that has more than 10 but fewer than 46 buildings intended for human occupancy. A Location Class 2 is intended to reflect areas where the degree of population is intermediate between Location Class 1 and Location Class 3 such as fringe areas around cities and towns, industrial areas, ranch or country estates, etc.
30 18 18
Class 3
Any 1 mile section that has 46 or more buildings intended for human occupancy except when a Location Class 4 prevails. A Location Class 3 is intended to reflect areas such suburban housing developments, shopping centers, residential areas, industrial areas, and other populated areas not meeting Location Class 4 requirements.
30 24 24
Class 4
where multistory buildings are prevalent, and where traffic is heavy or dense and where there may be numerous other utilities underground. Multistory means 4 or more floors above ground including the first or ground floor.
36 24 24
Public road and Railway Crossing for all class location 36 24 24 Source: ANSI/ASMEB31.8
Buried depth at each section of BatMan pipeline is shown in Table 6.3-3. The pipeline will be buried underneath existing roads which located in or adjacent to town area. High pressure gas pipeline will be generally buried less 1.5m (60 inch) in Japan, as well as in overseas pipeline construction, a buried depth is 0.8 - 1.2 meter (32 – 48 inch) in ROW located at wastelands and or mountains. BatMan pipeline depth has been therefore designed taking into consideration that the above mentioned conditions and a safety aspect.
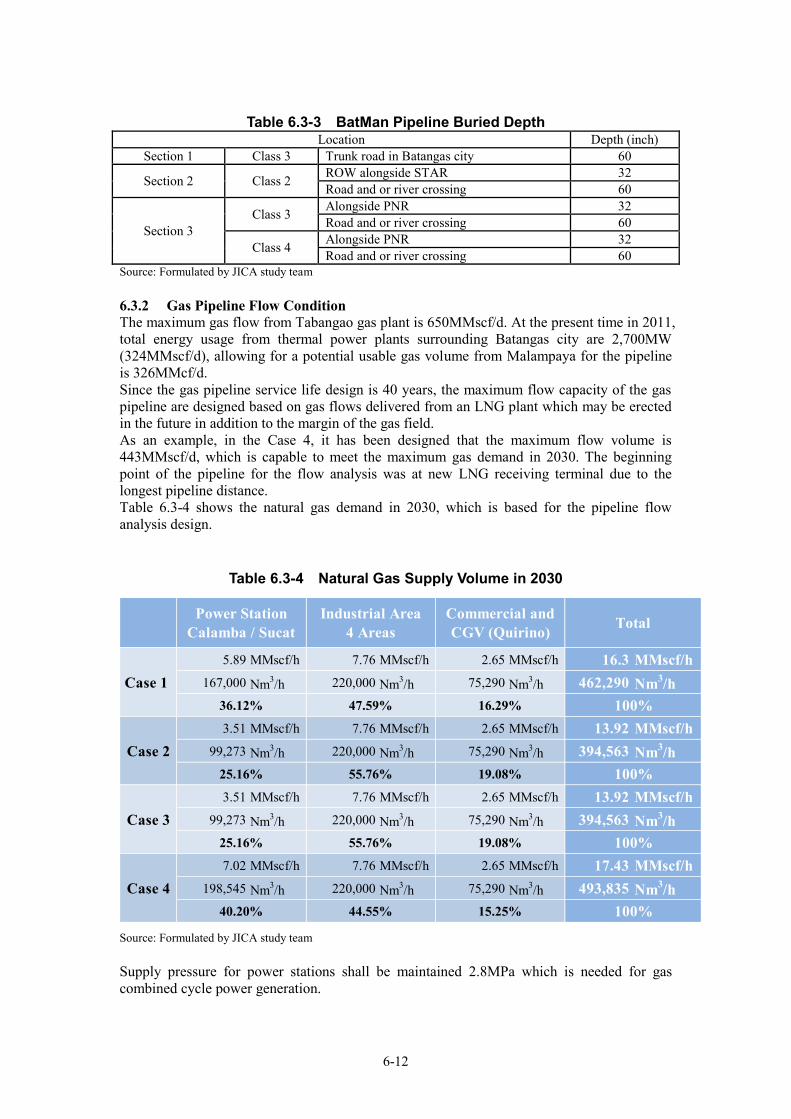
6-12
Table 6.3-3 BatMan Pipeline Buried Depth
Location Depth (inch) Section 1 Class 3 Trunk road in Batangas city 60
Section 2 Class 2 ROW alongside STAR 32 Road and or river crossing 60
Section 3 Class 3 Alongside PNR 32
Road and or river crossing 60
Class 4 Alongside PNR 32 Road and or river crossing 60
Source: Formulated by JICA study team 6.3.2 Gas Pipeline Flow Condition The maximum gas flow from Tabangao gas plant is 650MMscf/d. At the present time in 2011, total energy usage from thermal power plants surrounding Batangas city are 2,700MW (324MMscf/d), allowing for a potential usable gas volume from Malampaya for the pipeline is 326MMcf/d. Since the gas pipeline service life design is 40 years, the maximum flow capacity of the gas pipeline are designed based on gas flows delivered from an LNG plant which may be erected in the future in addition to the margin of the gas field. As an example, in the Case 4, it has been designed that the maximum flow volume is 443MMscf/d, which is capable to meet the maximum gas demand in 2030. The beginning point of the pipeline for the flow analysis was at new LNG receiving terminal due to the longest pipeline distance. Table 6.3-4 shows the natural gas demand in 2030, which is based for the pipeline flow analysis design.
Table 6.3-4 Natural Gas Supply Volume in 2030 The outlet pressure at Batangas is 82.5bar (8.25MPa) as of July, 2011. We will use it as the designated gas pressure in the section from the gas plant to the end of the Batangas urban area. Source: Formulated by JICA study team Supply pressure for power stations shall be maintained 2.8MPa which is needed for gas combined cycle power generation.
5.89 MMscf/h 7.76 MMscf/h 2.65 MMscf/h 16.3 MMscf/h167,000 Nm3/h 220,000 Nm3/h 75,290 Nm3/h 462,290 Nm3/h
3.51 MMscf/h 7.76 MMscf/h 2.65 MMscf/h 13.92 MMscf/h99,273 Nm3/h 220,000 Nm3/h 75,290 Nm3/h 394,563 Nm3/h
3.51 MMscf/h 7.76 MMscf/h 2.65 MMscf/h 13.92 MMscf/h99,273 Nm3/h 220,000 Nm3/h 75,290 Nm3/h 394,563 Nm3/h
7.02 MMscf/h 7.76 MMscf/h 2.65 MMscf/h 17.43 MMscf/h198,545 Nm3/h 220,000 Nm3/h 75,290 Nm3/h 493,835 Nm3/h
Commercial andCGV (Quirino)
15.25% 100%
100%
100%
100%16.29%
Total
36.12%
55.76% 19.08%
19.08%55.76%
44.55%
Case 1
Case 2
Case 3
Case 4
Power StationCalamba / Sucat
Industrial Area4 Areas
47.59%
40.20%
25.16%
25.16%
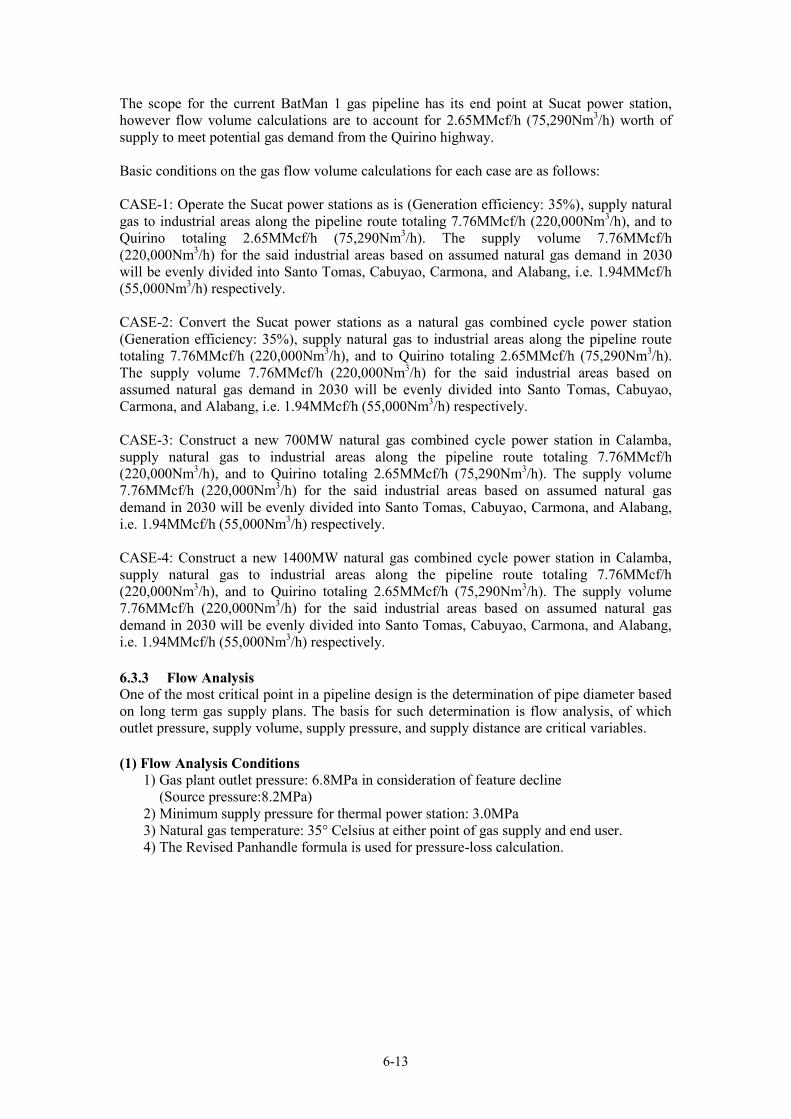
6-13
The scope for the current BatMan 1 gas pipeline has its end point at Sucat power station, however flow volume calculations are to account for 2.65MMcf/h (75,290Nm3/h) worth of supply to meet potential gas demand from the Quirino highway. Basic conditions on the gas flow volume calculations for each case are as follows: CASE-1: Operate the Sucat power stations as is (Generation efficiency: 35%), supply natural gas to industrial areas along the pipeline route totaling 7.76MMcf/h (220,000Nm3/h), and to Quirino totaling 2.65MMcf/h (75,290Nm3/h). The supply volume 7.76MMcf/h (220,000Nm3/h) for the said industrial areas based on assumed natural gas demand in 2030 will be evenly divided into Santo Tomas, Cabuyao, Carmona, and Alabang, i.e. 1.94MMcf/h (55,000Nm3/h) respectively. CASE-2: Convert the Sucat power stations as a natural gas combined cycle power station (Generation efficiency: 35%), supply natural gas to industrial areas along the pipeline route totaling 7.76MMcf/h (220,000Nm3/h), and to Quirino totaling 2.65MMcf/h (75,290Nm3/h). The supply volume 7.76MMcf/h (220,000Nm3/h) for the said industrial areas based on assumed natural gas demand in 2030 will be evenly divided into Santo Tomas, Cabuyao, Carmona, and Alabang, i.e. 1.94MMcf/h (55,000Nm3/h) respectively. CASE-3: Construct a new 700MW natural gas combined cycle power station in Calamba, supply natural gas to industrial areas along the pipeline route totaling 7.76MMcf/h (220,000Nm3/h), and to Quirino totaling 2.65MMcf/h (75,290Nm3/h). The supply volume 7.76MMcf/h (220,000Nm3/h) for the said industrial areas based on assumed natural gas demand in 2030 will be evenly divided into Santo Tomas, Cabuyao, Carmona, and Alabang, i.e. 1.94MMcf/h (55,000Nm3/h) respectively. CASE-4: Construct a new 1400MW natural gas combined cycle power station in Calamba, supply natural gas to industrial areas along the pipeline route totaling 7.76MMcf/h (220,000Nm3/h), and to Quirino totaling 2.65MMcf/h (75,290Nm3/h). The supply volume 7.76MMcf/h (220,000Nm3/h) for the said industrial areas based on assumed natural gas demand in 2030 will be evenly divided into Santo Tomas, Cabuyao, Carmona, and Alabang, i.e. 1.94MMcf/h (55,000Nm3/h) respectively. 6.3.3 Flow Analysis One of the most critical point in a pipeline design is the determination of pipe diameter based on long term gas supply plans. The basis for such determination is flow analysis, of which outlet pressure, supply volume, supply pressure, and supply distance are critical variables. (1) Flow Analysis Conditions
1) Gas plant outlet pressure: 6.8MPa in consideration of feature decline (Source pressure:8.2MPa)
2) Minimum supply pressure for thermal power station: 3.0MPa 3) Natural gas temperature: 35° Celsius at either point of gas supply and end user. 4) The Revised Panhandle formula is used for pressure-loss calculation.
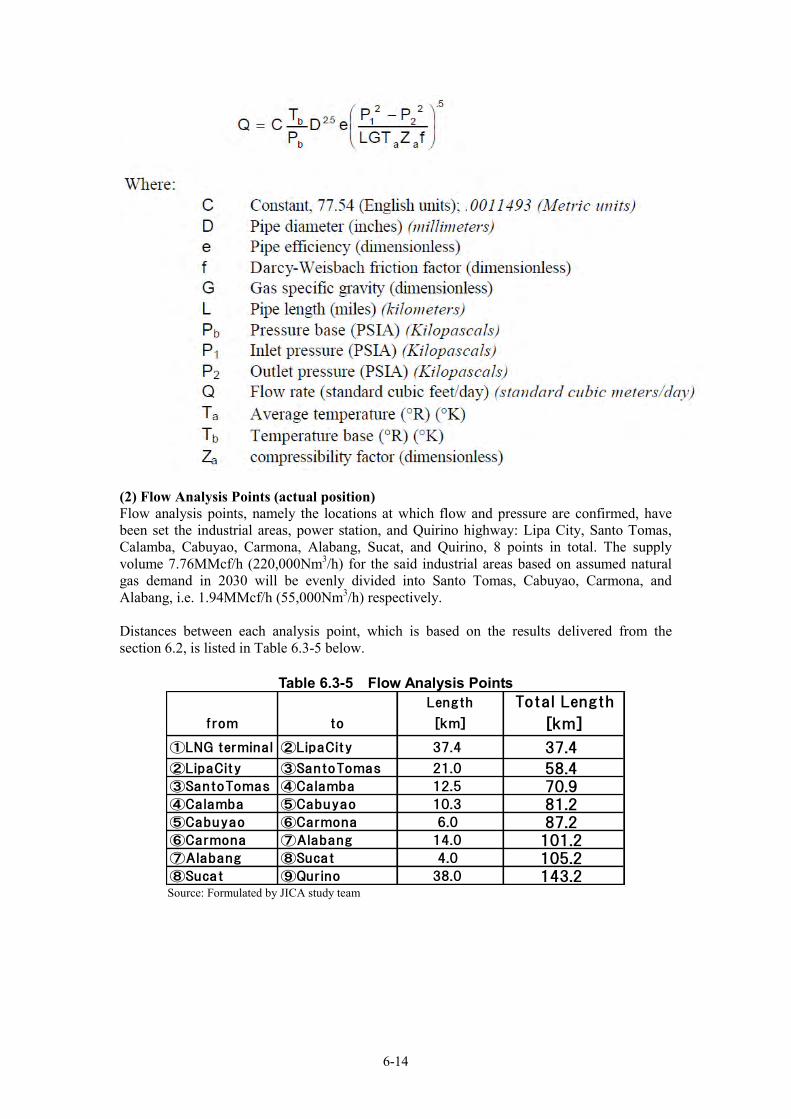
6-14
(2) Flow Analysis Points (actual position) Flow analysis points, namely the locations at which flow and pressure are confirmed, have been set the industrial areas, power station, and Quirino highway: Lipa City, Santo Tomas, Calamba, Cabuyao, Carmona, Alabang, Sucat, and Quirino, 8 points in total. The supply volume 7.76MMcf/h (220,000Nm3/h) for the said industrial areas based on assumed natural gas demand in 2030 will be evenly divided into Santo Tomas, Cabuyao, Carmona, and Alabang, i.e. 1.94MMcf/h (55,000Nm3/h) respectively. Distances between each analysis point, which is based on the results delivered from the section 6.2, is listed in Table 6.3-5 below.
Table 6.3-5 Flow Analysis Points Length Total Length
from to [km] [km]
①LNG terminal ②LipaCity 37.4 37.4
②LipaCity ③SantoTomas 21.0 58.4③SantoTomas ④Calamba 12.5 70.9④Calamba ⑤Cabuyao 10.3 81.2⑤Cabuyao ⑥Carmona 6.0 87.2⑥Carmona ⑦Alabang 14.0 101.2⑦Alabang ⑧Sucat 4.0 105.2⑧Sucat ⑨Qurino 38.0 143.2 Source: Formulated by JICA study team
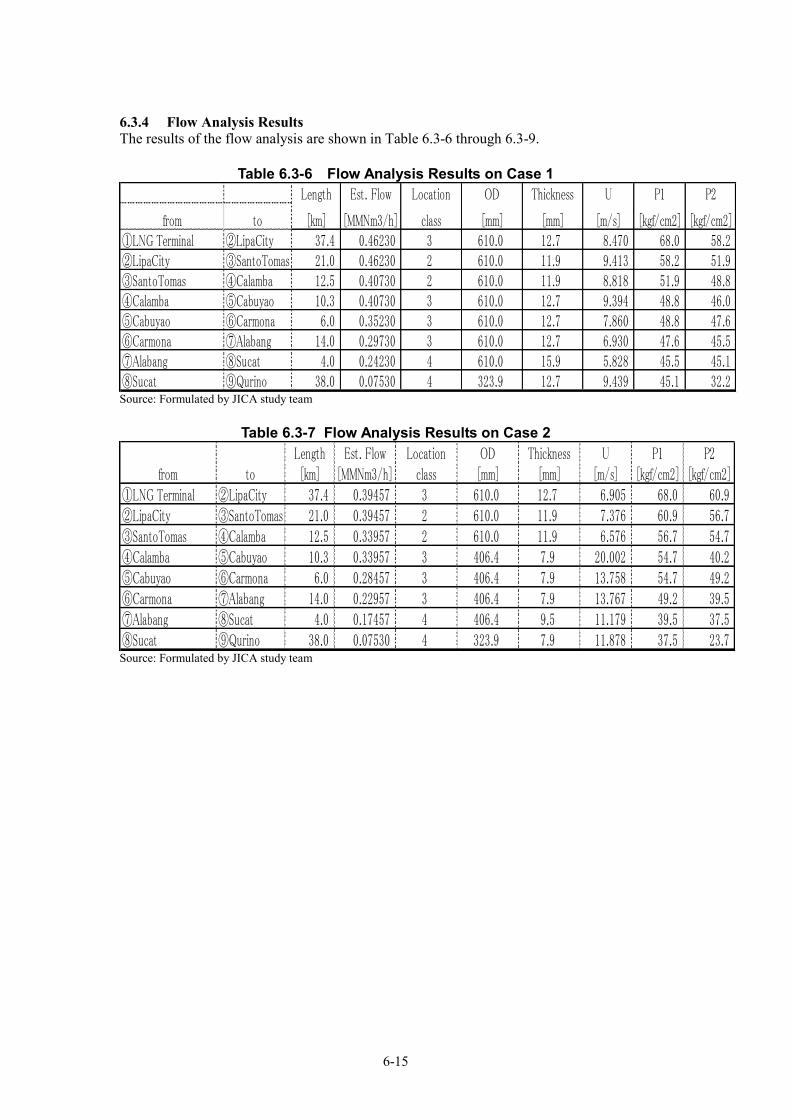
6-15
6.3.4 Flow Analysis Results The results of the flow analysis are shown in Table 6.3-6 through 6.3-9.
Table 6.3-6 Flow Analysis Results on Case 1 Length Est. Flow Location OD Thickness U P1 P2
from to [km] [MMNm3/h] class [mm] [mm] [m/s] [kgf/cm2] [kgf/cm2]①LNG Terminal ②LipaCity 37.4 0.46230 3 610.0 12.7 8.470 68.0 58.2②LipaCity ③SantoTomas 21.0 0.46230 2 610.0 11.9 9.413 58.2 51.9③SantoTomas ④Calamba 12.5 0.40730 2 610.0 11.9 8.818 51.9 48.8④Calamba ⑤Cabuyao 10.3 0.40730 3 610.0 12.7 9.394 48.8 46.0⑤Cabuyao ⑥Carmona 6.0 0.35230 3 610.0 12.7 7.860 48.8 47.6⑥Carmona ⑦Alabang 14.0 0.29730 3 610.0 12.7 6.930 47.6 45.5⑦Alabang ⑧Sucat 4.0 0.24230 4 610.0 15.9 5.828 45.5 45.1⑧Sucat ⑨Qurino 38.0 0.07530 4 323.9 12.7 9.439 45.1 32.2 Source: Formulated by JICA study team
Table 6.3-7 Flow Analysis Results on Case 2
Length Est. Flow Location OD Thickness U P1 P2from to [km] [MMNm3/h] class [mm] [mm] [m/s] [kgf/cm2] [kgf/cm2]
①LNG Terminal ②LipaCity 37.4 0.39457 3 610.0 12.7 6.905 68.0 60.9②LipaCity ③SantoTomas 21.0 0.39457 2 610.0 11.9 7.376 60.9 56.7③SantoTomas ④Calamba 12.5 0.33957 2 610.0 11.9 6.576 56.7 54.7④Calamba ⑤Cabuyao 10.3 0.33957 3 406.4 7.9 20.002 54.7 40.2⑤Cabuyao ⑥Carmona 6.0 0.28457 3 406.4 7.9 13.758 54.7 49.2⑥Carmona ⑦Alabang 14.0 0.22957 3 406.4 7.9 13.767 49.2 39.5⑦Alabang ⑧Sucat 4.0 0.17457 4 406.4 9.5 11.179 39.5 37.5⑧Sucat ⑨Qurino 38.0 0.07530 4 323.9 7.9 11.878 37.5 23.7 Source: Formulated by JICA study team
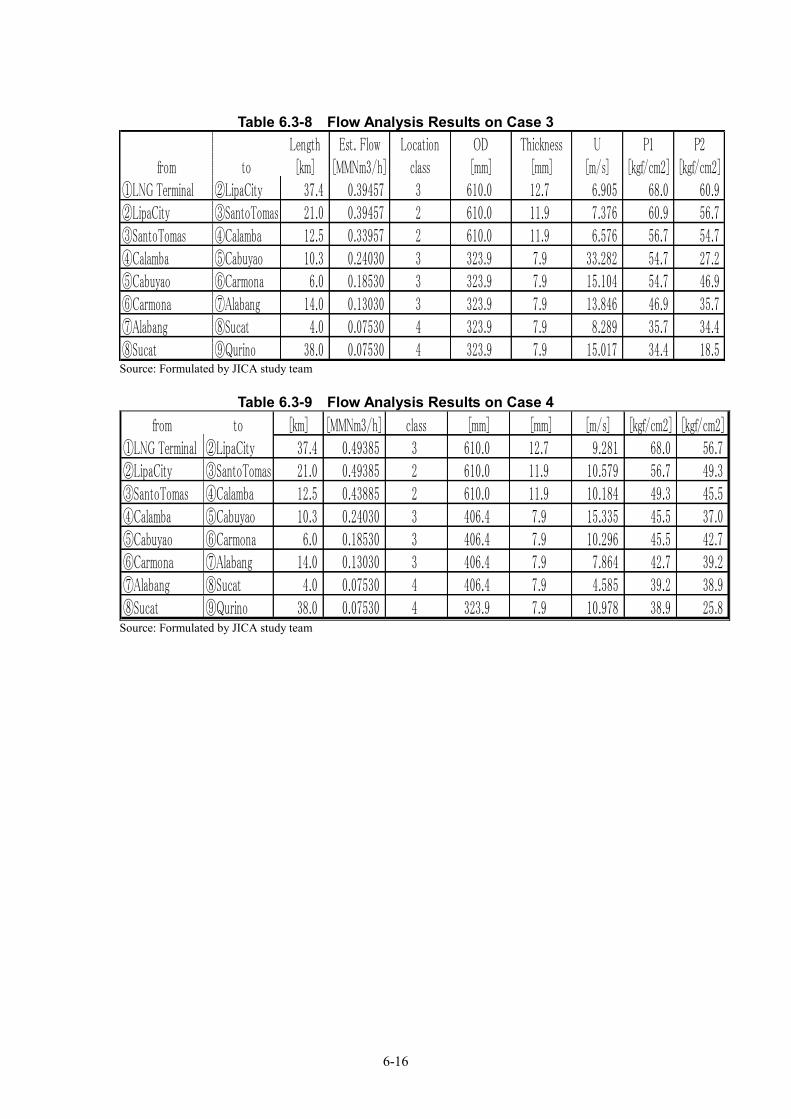
6-16
Table 6.3-8 Flow Analysis Results on Case 3
Length Est. Flow Location OD Thickness U P1 P2from to [km] [MMNm3/h] class [mm] [mm] [m/s] [kgf/cm2] [kgf/cm2]
①LNG Terminal ②LipaCity 37.4 0.39457 3 610.0 12.7 6.905 68.0 60.9②LipaCity ③SantoTomas 21.0 0.39457 2 610.0 11.9 7.376 60.9 56.7③SantoTomas ④Calamba 12.5 0.33957 2 610.0 11.9 6.576 56.7 54.7④Calamba ⑤Cabuyao 10.3 0.24030 3 323.9 7.9 33.282 54.7 27.2⑤Cabuyao ⑥Carmona 6.0 0.18530 3 323.9 7.9 15.104 54.7 46.9⑥Carmona ⑦Alabang 14.0 0.13030 3 323.9 7.9 13.846 46.9 35.7⑦Alabang ⑧Sucat 4.0 0.07530 4 323.9 7.9 8.289 35.7 34.4⑧Sucat ⑨Qurino 38.0 0.07530 4 323.9 7.9 15.017 34.4 18.5 Source: Formulated by JICA study team
Table 6.3-9 Flow Analysis Results on Case 4 from to [km] [MMNm3/h] class [mm] [mm] [m/s] [kgf/cm2] [kgf/cm2]
①LNG Terminal ②LipaCity 37.4 0.49385 3 610.0 12.7 9.281 68.0 56.7②LipaCity ③SantoTomas 21.0 0.49385 2 610.0 11.9 10.579 56.7 49.3③SantoTomas ④Calamba 12.5 0.43885 2 610.0 11.9 10.184 49.3 45.5④Calamba ⑤Cabuyao 10.3 0.24030 3 406.4 7.9 15.335 45.5 37.0⑤Cabuyao ⑥Carmona 6.0 0.18530 3 406.4 7.9 10.296 45.5 42.7⑥Carmona ⑦Alabang 14.0 0.13030 3 406.4 7.9 7.864 42.7 39.2⑦Alabang ⑧Sucat 4.0 0.07530 4 406.4 7.9 4.585 39.2 38.9⑧Sucat ⑨Qurino 38.0 0.07530 4 323.9 7.9 10.978 38.9 25.8
Source: Formulated by JICA study team
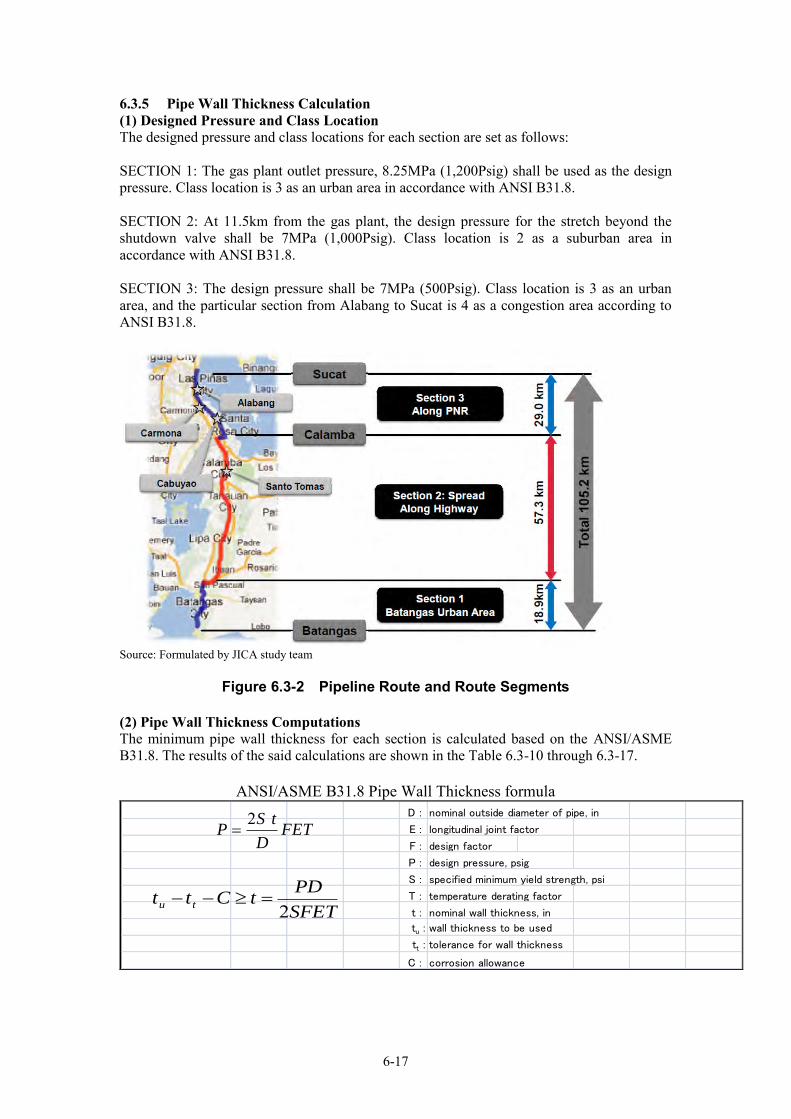
6-17
6.3.5 Pipe Wall Thickness Calculation (1) Designed Pressure and Class Location The designed pressure and class locations for each section are set as follows: SECTION 1: The gas plant outlet pressure, 8.25MPa (1,200Psig) shall be used as the design pressure. Class location is 3 as an urban area in accordance with ANSI B31.8. SECTION 2: At 11.5km from the gas plant, the design pressure for the stretch beyond the shutdown valve shall be 7MPa (1,000Psig). Class location is 2 as a suburban area in accordance with ANSI B31.8. SECTION 3: The design pressure shall be 7MPa (500Psig). Class location is 3 as an urban area, and the particular section from Alabang to Sucat is 4 as a congestion area according to ANSI B31.8.
Source: Formulated by JICA study team
Figure 6.3-2 Pipeline Route and Route Segments
(2) Pipe Wall Thickness Computations The minimum pipe wall thickness for each section is calculated based on the ANSI/ASME B31.8. The results of the said calculations are shown in the Table 6.3-10 through 6.3-17.
ANSI/ASME B31.8 Pipe Wall Thickness formula D : nominal outside diameter of pipe, in
E : longitudinal joint factor
F : design factor
P : design pressure, psig
S : specified minimum yield strength, psi
T : temperature derating factor
t : nominal wall thickness, in
tu : wall thickness to be used
tt : tolerance for wall thickness
C : corrosion allowance
FETD
tSP
2
SFET
PDtCtt tu 2
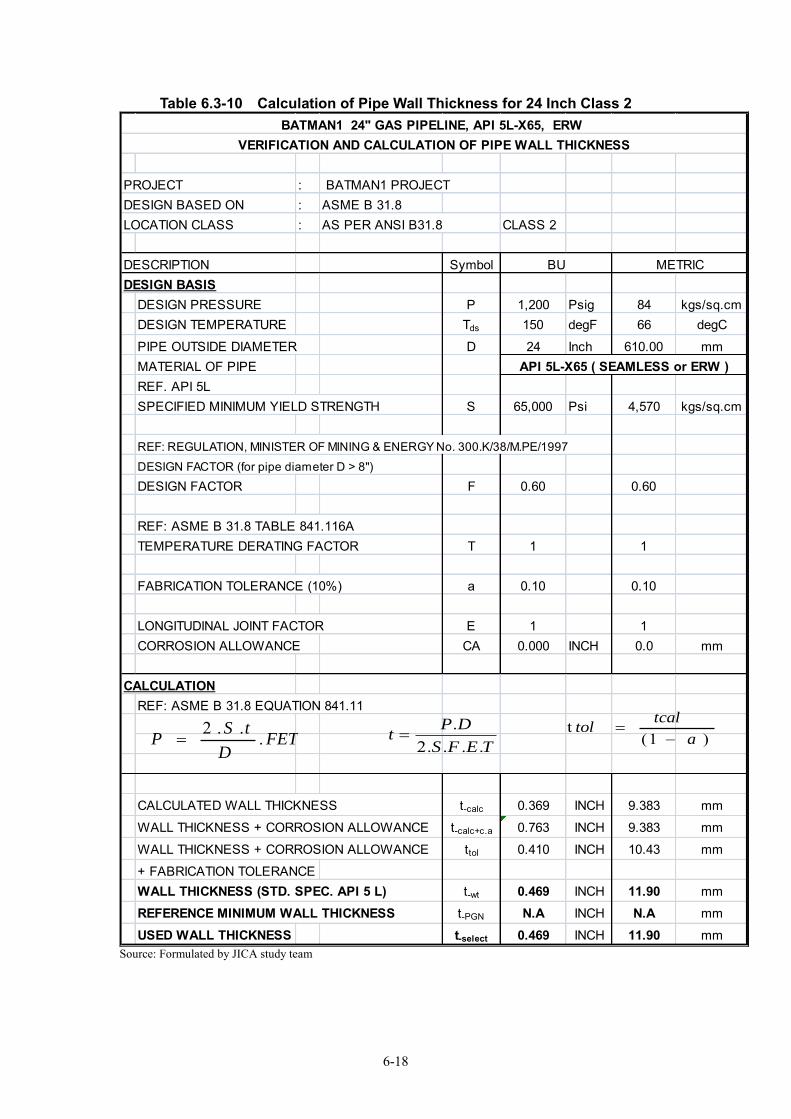
6-18
Table 6.3-10 Calculation of Pipe Wall Thickness for 24 Inch Class 2
PROJECT : BATMAN1 PROJECTDESIGN BASED ON : ASME B 31.8LOCATION CLASS : AS PER ANSI B31.8 CLASS 2
DESCRIPTION SymbolDESIGN BASIS
DESIGN PRESSURE P 1,200 Psig 84 kgs/sq.cmDESIGN TEMPERATURE Tds 150 degF 66 degC
PIPE OUTSIDE DIAMETER D 24 Inch 610.00 mmMATERIAL OF PIPEREF. API 5LSPECIFIED MINIMUM YIELD STRENGTH S 65,000 Psi 4,570 kgs/sq.cm
REF: REGULATION, MINISTER OF MINING & ENERGY No. 300.K/38/M.PE/1997
DESIGN FACTOR (for pipe diameter D > 8")
DESIGN FACTOR F 0.60 0.60
REF: ASME B 31.8 TABLE 841.116ATEMPERATURE DERATING FACTOR T 1 1
FABRICATION TOLERANCE (10%) a 0.10 0.10
LONGITUDINAL JOINT FACTOR E 1 1CORROSION ALLOWANCE CA 0.000 INCH 0.0 mm
CALCULATIONREF: ASME B 31.8 EQUATION 841.11
CALCULATED WALL THICKNESS t-calc 0.369 INCH 9.383 mm
WALL THICKNESS + CORROSION ALLOWANCE t-calc+c.a 0.763 INCH 9.383 mm
WALL THICKNESS + CORROSION ALLOWANCE ttol 0.410 INCH 10.43 mm
+ FABRICATION TOLERANCEWALL THICKNESS (STD. SPEC. API 5 L) t-wt 0.469 INCH 11.90 mm
REFERENCE MINIMUM WALL THICKNESS t-PGN N.A INCH N.A mm
USED WALL THICKNESS t-select 0.469 INCH 11.90 mm
BATMAN1 24" GAS PIPELINE, API 5L-X65, ERW VERIFICATION AND CALCULATION OF PIPE WALL THICKNESS
BU METRIC
API 5L-X65 ( SEAMLESS or ERW )
TFES
DPt..2.
FETD
tSP ...2
TFES DPt ..2 .FETD tSP ...2
TEFS
DPt
....2.
TFESDPt..2.FETD tSP ...2 TEFS DPt ....2 .
TFESDPt..2.FETDtSP...2
TFES
DPt..2.FETD
tSP...2TEFSDPt....2.
TFES
DPt..2.FETD
tSP...2
TFESDPt..2.FETDtSP...2
TEFS
DPt....2.
TFESDPt..2.FETDtSP...2TEFSDPt....2.
TFES
DPt..2.FETD
tSP...2
TFESDPt..2.FETDtSP...2
TEFS
DPt....2.
TFESDPt..2.FETDtSP...2TEFSDPt....2.
TFES
DPt..2.FETD
tSP...2
TFESDPt..2.FETDtSP...2
TEFS
DPt....2.
TFESDPt..2.FETDtSP...2TEFSDPt....2.
)1(t
a
tcaltol
Source: Formulated by JICA study team
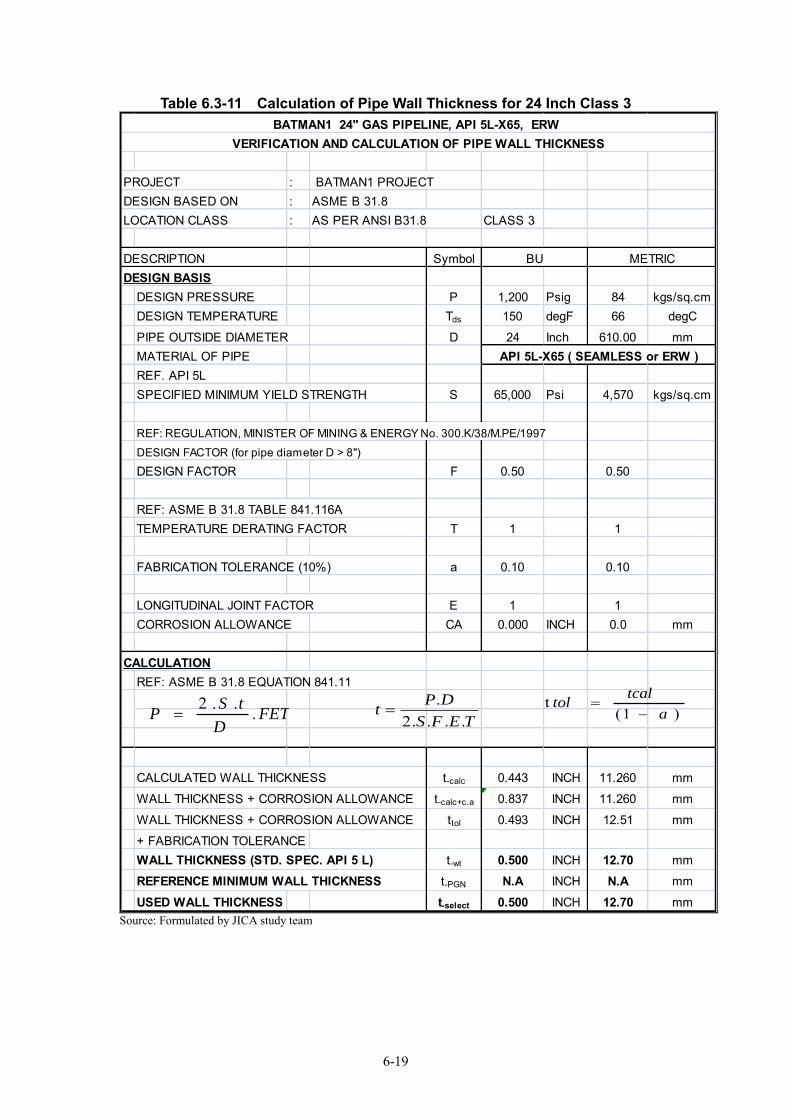
6-19
Table 6.3-11 Calculation of Pipe Wall Thickness for 24 Inch Class 3
PROJECT : BATMAN1 PROJECTDESIGN BASED ON : ASME B 31.8LOCATION CLASS : AS PER ANSI B31.8 CLASS 3
DESCRIPTION SymbolDESIGN BASIS
DESIGN PRESSURE P 1,200 Psig 84 kgs/sq.cmDESIGN TEMPERATURE Tds 150 degF 66 degC
PIPE OUTSIDE DIAMETER D 24 Inch 610.00 mmMATERIAL OF PIPEREF. API 5LSPECIFIED MINIMUM YIELD STRENGTH S 65,000 Psi 4,570 kgs/sq.cm
REF: REGULATION, MINISTER OF MINING & ENERGY No. 300.K/38/M.PE/1997
DESIGN FACTOR (for pipe diameter D > 8")
DESIGN FACTOR F 0.50 0.50
REF: ASME B 31.8 TABLE 841.116ATEMPERATURE DERATING FACTOR T 1 1
FABRICATION TOLERANCE (10%) a 0.10 0.10
LONGITUDINAL JOINT FACTOR E 1 1CORROSION ALLOWANCE CA 0.000 INCH 0.0 mm
CALCULATIONREF: ASME B 31.8 EQUATION 841.11
CALCULATED WALL THICKNESS t-calc 0.443 INCH 11.260 mm
WALL THICKNESS + CORROSION ALLOWANCE t-calc+c.a 0.837 INCH 11.260 mm
WALL THICKNESS + CORROSION ALLOWANCE ttol 0.493 INCH 12.51 mm
+ FABRICATION TOLERANCEWALL THICKNESS (STD. SPEC. API 5 L) t-wt 0.500 INCH 12.70 mm
REFERENCE MINIMUM WALL THICKNESS t-PGN N.A INCH N.A mm
USED WALL THICKNESS t-select 0.500 INCH 12.70 mm
BATMAN1 24" GAS PIPELINE, API 5L-X65, ERW VERIFICATION AND CALCULATION OF PIPE WALL THICKNESS
BU METRIC
API 5L-X65 ( SEAMLESS or ERW )
TFES
DPt..2.
FETD
tSP ...2
TFES DPt ..2 .FETD tSP ...2
TEFS
DPt
....2.
TFESDPt..2.FETD tSP ...2 TEFS DPt ....2 .
TFESDPt..2.FETDtSP...2
TFES
DPt..2.FETD
tSP...2TEFSDPt....2.
TFES
DPt..2.FETD
tSP...2
TFESDPt..2.FETDtSP...2
TEFS
DPt....2.
TFESDPt..2.FETDtSP...2TEFSDPt....2.
TFES
DPt..2.FETD
tSP...2
TFESDPt..2.FETDtSP...2
TEFS
DPt....2.
TFESDPt..2.FETDtSP...2TEFSDPt....2.
TFES
DPt..2.FETD
tSP...2
TFESDPt..2.FETDtSP...2
TEFS
DPt....2.
TFESDPt..2.FETDtSP...2TEFSDPt....2.
)1(t
a
tcaltol
Source: Formulated by JICA study team
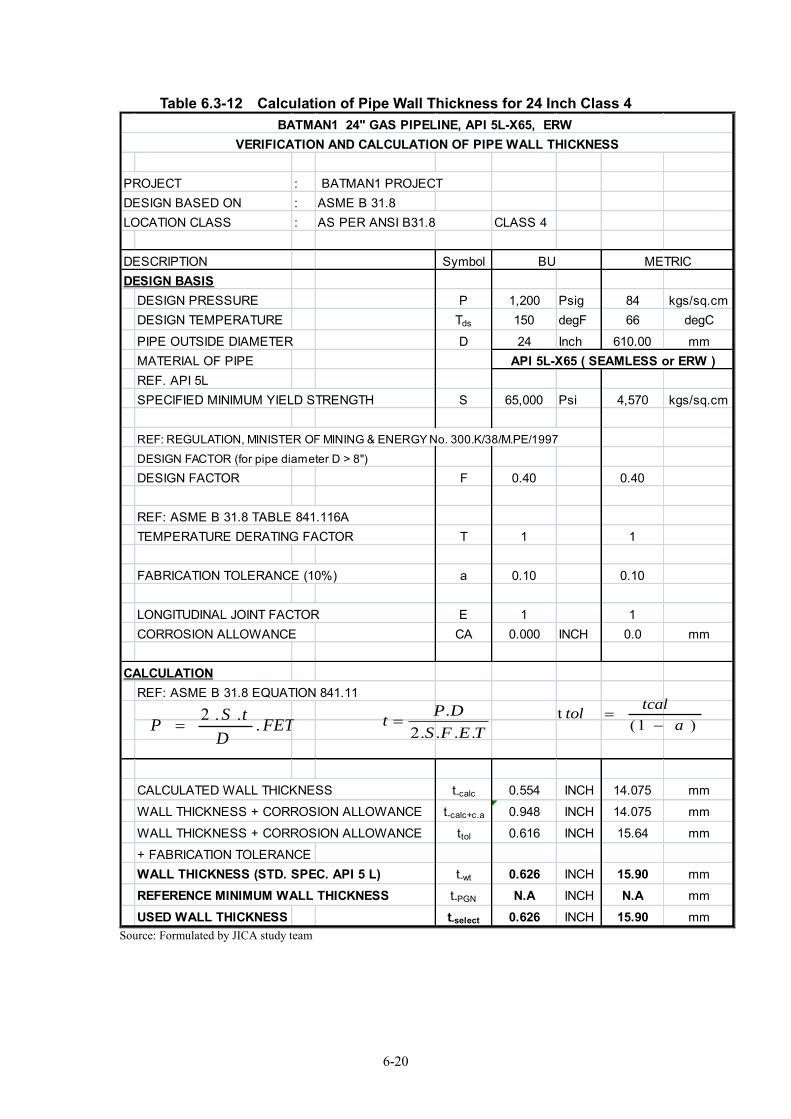
6-20
Table 6.3-12 Calculation of Pipe Wall Thickness for 24 Inch Class 4
PROJECT : BATMAN1 PROJECTDESIGN BASED ON : ASME B 31.8LOCATION CLASS : AS PER ANSI B31.8 CLASS 4
DESCRIPTION SymbolDESIGN BASIS
DESIGN PRESSURE P 1,200 Psig 84 kgs/sq.cmDESIGN TEMPERATURE Tds 150 degF 66 degC
PIPE OUTSIDE DIAMETER D 24 Inch 610.00 mmMATERIAL OF PIPEREF. API 5LSPECIFIED MINIMUM YIELD STRENGTH S 65,000 Psi 4,570 kgs/sq.cm
REF: REGULATION, MINISTER OF MINING & ENERGY No. 300.K/38/M.PE/1997
DESIGN FACTOR (for pipe diameter D > 8")
DESIGN FACTOR F 0.40 0.40
REF: ASME B 31.8 TABLE 841.116ATEMPERATURE DERATING FACTOR T 1 1
FABRICATION TOLERANCE (10%) a 0.10 0.10
LONGITUDINAL JOINT FACTOR E 1 1CORROSION ALLOWANCE CA 0.000 INCH 0.0 mm
CALCULATIONREF: ASME B 31.8 EQUATION 841.11
CALCULATED WALL THICKNESS t-calc 0.554 INCH 14.075 mm
WALL THICKNESS + CORROSION ALLOWANCE t-calc+c.a 0.948 INCH 14.075 mm
WALL THICKNESS + CORROSION ALLOWANCE ttol 0.616 INCH 15.64 mm
+ FABRICATION TOLERANCEWALL THICKNESS (STD. SPEC. API 5 L) t-wt 0.626 INCH 15.90 mm
REFERENCE MINIMUM WALL THICKNESS t-PGN N.A INCH N.A mm
USED WALL THICKNESS t-select 0.626 INCH 15.90 mm
BATMAN1 24" GAS PIPELINE, API 5L-X65, ERW VERIFICATION AND CALCULATION OF PIPE WALL THICKNESS
BU METRIC
API 5L-X65 ( SEAMLESS or ERW )
TFES
DPt..2.
FETD
tSP ...2
TFES DPt ..2 .FETD tSP ...2
TEFS
DPt
....2.
TFESDPt..2.FETD tSP ...2 TEFS DPt ....2 .
TFESDPt..2.FETDtSP...2
TFES
DPt..2.FETD
tSP...2TEFSDPt....2.
TFES
DPt..2.FETD
tSP...2
TFESDPt..2.FETDtSP...2
TEFS
DPt....2.
TFESDPt..2.FETDtSP...2TEFSDPt....2.
TFES
DPt..2.FETD
tSP...2
TFESDPt..2.FETDtSP...2
TEFS
DPt....2.
TFESDPt..2.FETDtSP...2TEFSDPt....2.
TFES
DPt..2.FETD
tSP...2
TFESDPt..2.FETDtSP...2
TEFS
DPt....2.
TFESDPt..2.FETDtSP...2TEFSDPt....2.
)1(t
a
tcaltol
Source: Formulated by JICA study team
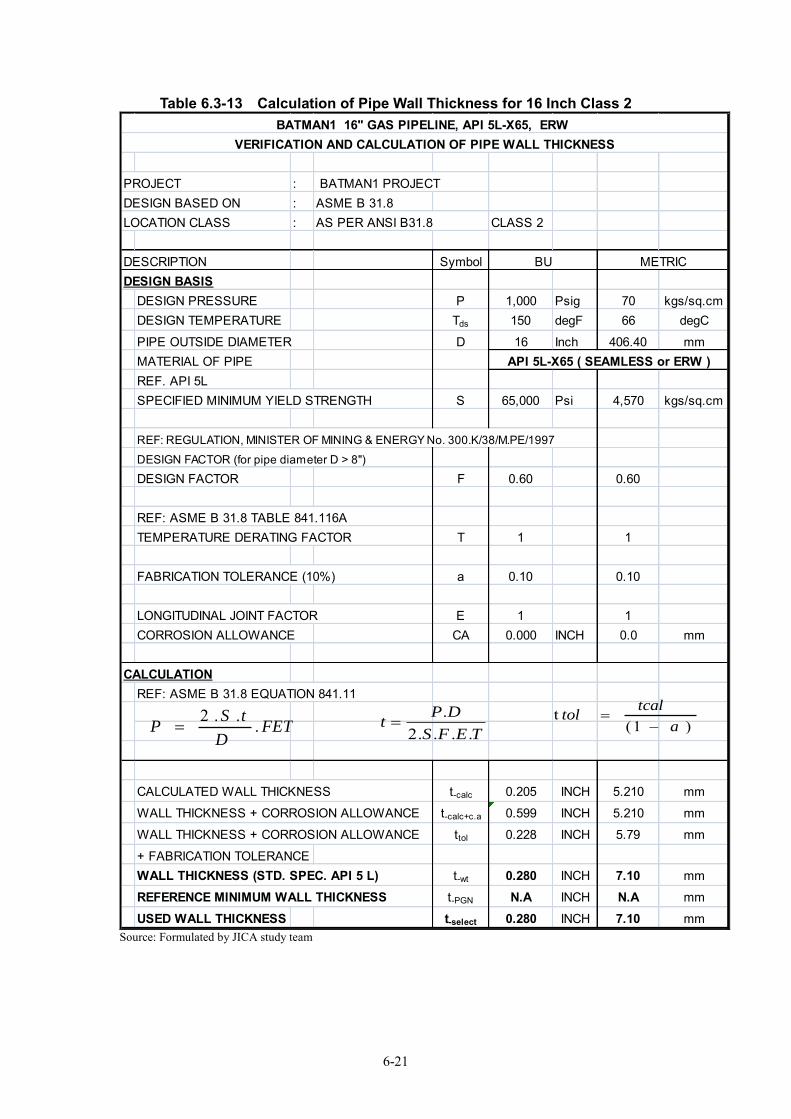
6-21
Table 6.3-13 Calculation of Pipe Wall Thickness for 16 Inch Class 2
PROJECT : BATMAN1 PROJECTDESIGN BASED ON : ASME B 31.8LOCATION CLASS : AS PER ANSI B31.8 CLASS 2
DESCRIPTION SymbolDESIGN BASIS
DESIGN PRESSURE P 1,000 Psig 70 kgs/sq.cmDESIGN TEMPERATURE Tds 150 degF 66 degC
PIPE OUTSIDE DIAMETER D 16 Inch 406.40 mmMATERIAL OF PIPEREF. API 5LSPECIFIED MINIMUM YIELD STRENGTH S 65,000 Psi 4,570 kgs/sq.cm
REF: REGULATION, MINISTER OF MINING & ENERGY No. 300.K/38/M.PE/1997
DESIGN FACTOR (for pipe diameter D > 8")
DESIGN FACTOR F 0.60 0.60
REF: ASME B 31.8 TABLE 841.116ATEMPERATURE DERATING FACTOR T 1 1
FABRICATION TOLERANCE (10%) a 0.10 0.10
LONGITUDINAL JOINT FACTOR E 1 1CORROSION ALLOWANCE CA 0.000 INCH 0.0 mm
CALCULATIONREF: ASME B 31.8 EQUATION 841.11
CALCULATED WALL THICKNESS t-calc 0.205 INCH 5.210 mm
WALL THICKNESS + CORROSION ALLOWANCE t-calc+c.a 0.599 INCH 5.210 mm
WALL THICKNESS + CORROSION ALLOWANCE ttol 0.228 INCH 5.79 mm
+ FABRICATION TOLERANCEWALL THICKNESS (STD. SPEC. API 5 L) t-wt 0.280 INCH 7.10 mm
REFERENCE MINIMUM WALL THICKNESS t-PGN N.A INCH N.A mm
USED WALL THICKNESS t-select 0.280 INCH 7.10 mm
BATMAN1 16" GAS PIPELINE, API 5L-X65, ERW VERIFICATION AND CALCULATION OF PIPE WALL THICKNESS
BU METRIC
API 5L-X65 ( SEAMLESS or ERW )
TFES
DPt..2.
FETD
tSP ...2
TFES DPt ..2 .FETD tSP ...2
TEFS
DPt
....2.
TFESDPt..2.FETD tSP ...2 TEFS DPt ....2 .
TFESDPt..2.FETDtSP...2
TFES
DPt..2.FETD
tSP...2TEFSDPt....2.
TFES
DPt..2.FETD
tSP...2
TFESDPt..2.FETDtSP...2
TEFS
DPt....2.
TFESDPt..2.FETDtSP...2TEFSDPt....2.
TFES
DPt..2.FETD
tSP...2
TFESDPt..2.FETDtSP...2
TEFS
DPt....2.
TFESDPt..2.FETDtSP...2TEFSDPt....2.
TFES
DPt..2.FETD
tSP...2
TFESDPt..2.FETDtSP...2
TEFS
DPt....2.
TFESDPt..2.FETDtSP...2TEFSDPt....2.
)1(t
a
tcaltol
Source: Formulated by JICA study team
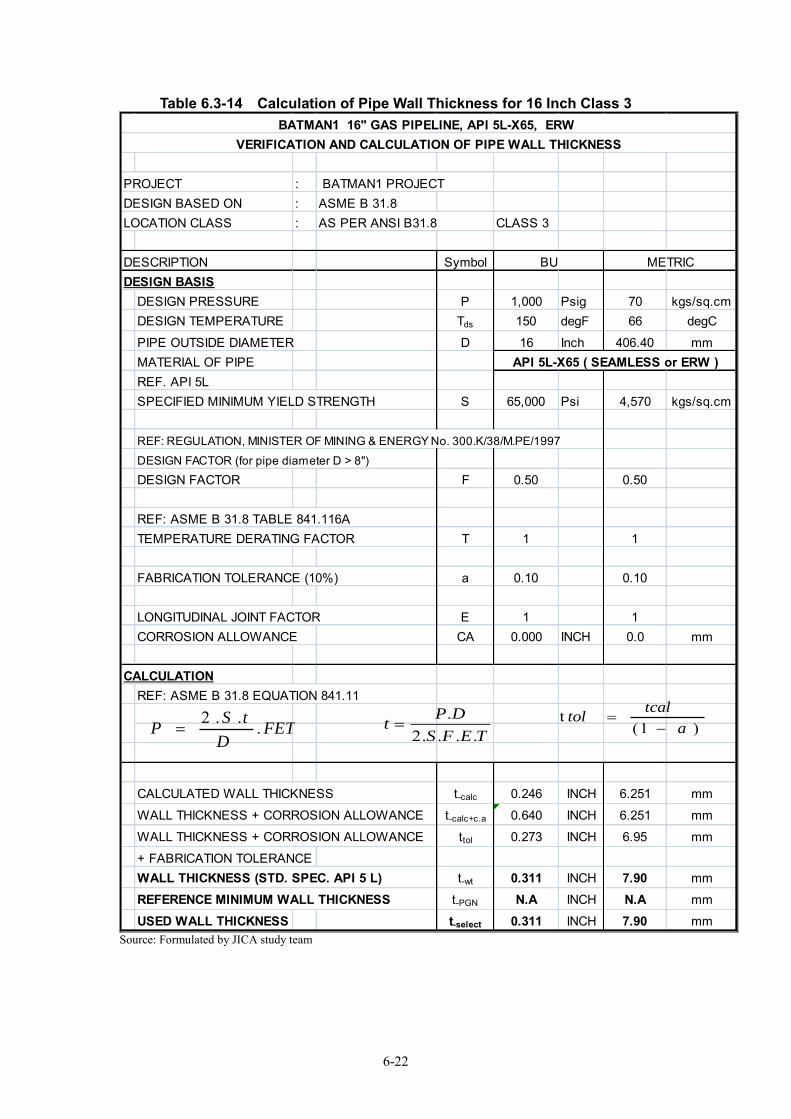
6-22
Table 6.3-14 Calculation of Pipe Wall Thickness for 16 Inch Class 3
PROJECT : BATMAN1 PROJECTDESIGN BASED ON : ASME B 31.8LOCATION CLASS : AS PER ANSI B31.8 CLASS 3
DESCRIPTION SymbolDESIGN BASIS
DESIGN PRESSURE P 1,000 Psig 70 kgs/sq.cmDESIGN TEMPERATURE Tds 150 degF 66 degC
PIPE OUTSIDE DIAMETER D 16 Inch 406.40 mmMATERIAL OF PIPEREF. API 5LSPECIFIED MINIMUM YIELD STRENGTH S 65,000 Psi 4,570 kgs/sq.cm
REF: REGULATION, MINISTER OF MINING & ENERGY No. 300.K/38/M.PE/1997
DESIGN FACTOR (for pipe diameter D > 8")
DESIGN FACTOR F 0.50 0.50
REF: ASME B 31.8 TABLE 841.116ATEMPERATURE DERATING FACTOR T 1 1
FABRICATION TOLERANCE (10%) a 0.10 0.10
LONGITUDINAL JOINT FACTOR E 1 1CORROSION ALLOWANCE CA 0.000 INCH 0.0 mm
CALCULATIONREF: ASME B 31.8 EQUATION 841.11
CALCULATED WALL THICKNESS t-calc 0.246 INCH 6.251 mm
WALL THICKNESS + CORROSION ALLOWANCE t-calc+c.a 0.640 INCH 6.251 mm
WALL THICKNESS + CORROSION ALLOWANCE ttol 0.273 INCH 6.95 mm
+ FABRICATION TOLERANCEWALL THICKNESS (STD. SPEC. API 5 L) t-wt 0.311 INCH 7.90 mm
REFERENCE MINIMUM WALL THICKNESS t-PGN N.A INCH N.A mm
USED WALL THICKNESS t-select 0.311 INCH 7.90 mm
BATMAN1 16" GAS PIPELINE, API 5L-X65, ERW VERIFICATION AND CALCULATION OF PIPE WALL THICKNESS
BU METRIC
API 5L-X65 ( SEAMLESS or ERW )
TFES
DPt..2.
FETD
tSP ...2
TFES DPt ..2 .FETD tSP ...2
TEFS
DPt
....2.
TFESDPt..2.FETD tSP ...2 TEFS DPt ....2 .
TFESDPt..2.FETDtSP...2
TFES
DPt..2.FETD
tSP...2TEFSDPt....2.
TFES
DPt..2.FETD
tSP...2
TFESDPt..2.FETDtSP...2
TEFS
DPt....2.
TFESDPt..2.FETDtSP...2TEFSDPt....2.
TFES
DPt..2.FETD
tSP...2
TFESDPt..2.FETDtSP...2
TEFS
DPt....2.
TFESDPt..2.FETDtSP...2TEFSDPt....2.
TFES
DPt..2.FETD
tSP...2
TFESDPt..2.FETDtSP...2
TEFS
DPt....2.
TFESDPt..2.FETDtSP...2TEFSDPt....2.
)1(t
a
tcaltol
Source: Formulated by JICA study team
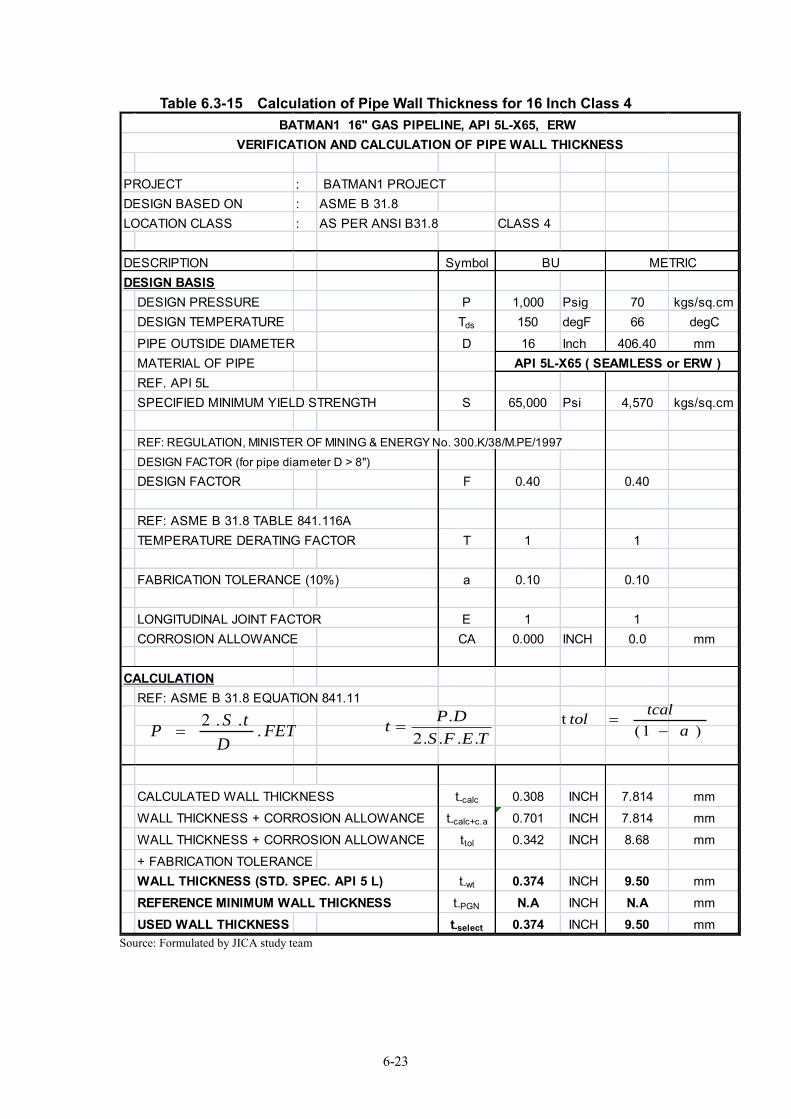
6-23
Table 6.3-15 Calculation of Pipe Wall Thickness for 16 Inch Class 4
PROJECT : BATMAN1 PROJECTDESIGN BASED ON : ASME B 31.8LOCATION CLASS : AS PER ANSI B31.8 CLASS 4
DESCRIPTION SymbolDESIGN BASIS
DESIGN PRESSURE P 1,000 Psig 70 kgs/sq.cmDESIGN TEMPERATURE Tds 150 degF 66 degC
PIPE OUTSIDE DIAMETER D 16 Inch 406.40 mmMATERIAL OF PIPEREF. API 5LSPECIFIED MINIMUM YIELD STRENGTH S 65,000 Psi 4,570 kgs/sq.cm
REF: REGULATION, MINISTER OF MINING & ENERGY No. 300.K/38/M.PE/1997
DESIGN FACTOR (for pipe diameter D > 8")
DESIGN FACTOR F 0.40 0.40
REF: ASME B 31.8 TABLE 841.116ATEMPERATURE DERATING FACTOR T 1 1
FABRICATION TOLERANCE (10%) a 0.10 0.10
LONGITUDINAL JOINT FACTOR E 1 1CORROSION ALLOWANCE CA 0.000 INCH 0.0 mm
CALCULATIONREF: ASME B 31.8 EQUATION 841.11
CALCULATED WALL THICKNESS t-calc 0.308 INCH 7.814 mm
WALL THICKNESS + CORROSION ALLOWANCE t-calc+c.a 0.701 INCH 7.814 mm
WALL THICKNESS + CORROSION ALLOWANCE ttol 0.342 INCH 8.68 mm
+ FABRICATION TOLERANCEWALL THICKNESS (STD. SPEC. API 5 L) t-wt 0.374 INCH 9.50 mm
REFERENCE MINIMUM WALL THICKNESS t-PGN N.A INCH N.A mm
USED WALL THICKNESS t-select 0.374 INCH 9.50 mm
BATMAN1 16" GAS PIPELINE, API 5L-X65, ERW VERIFICATION AND CALCULATION OF PIPE WALL THICKNESS
BU METRIC
API 5L-X65 ( SEAMLESS or ERW )
TFES
DPt..2.
FETD
tSP ...2
TFES DPt ..2 .FETD tSP ...2
TEFS
DPt
....2.
TFESDPt..2.FETD tSP ...2 TEFS DPt ....2 .
TFESDPt..2.FETDtSP...2
TFES
DPt..2.FETD
tSP...2TEFSDPt....2.
TFES
DPt..2.FETD
tSP...2
TFESDPt..2.FETDtSP...2
TEFS
DPt....2.
TFESDPt..2.FETDtSP...2TEFSDPt....2.
TFES
DPt..2.FETD
tSP...2
TFESDPt..2.FETDtSP...2
TEFS
DPt....2.
TFESDPt..2.FETDtSP...2TEFSDPt....2.
TFES
DPt..2.FETD
tSP...2
TFESDPt..2.FETDtSP...2
TEFS
DPt....2.
TFESDPt..2.FETDtSP...2TEFSDPt....2.
)1(t
a
tcaltol
Source: Formulated by JICA study team
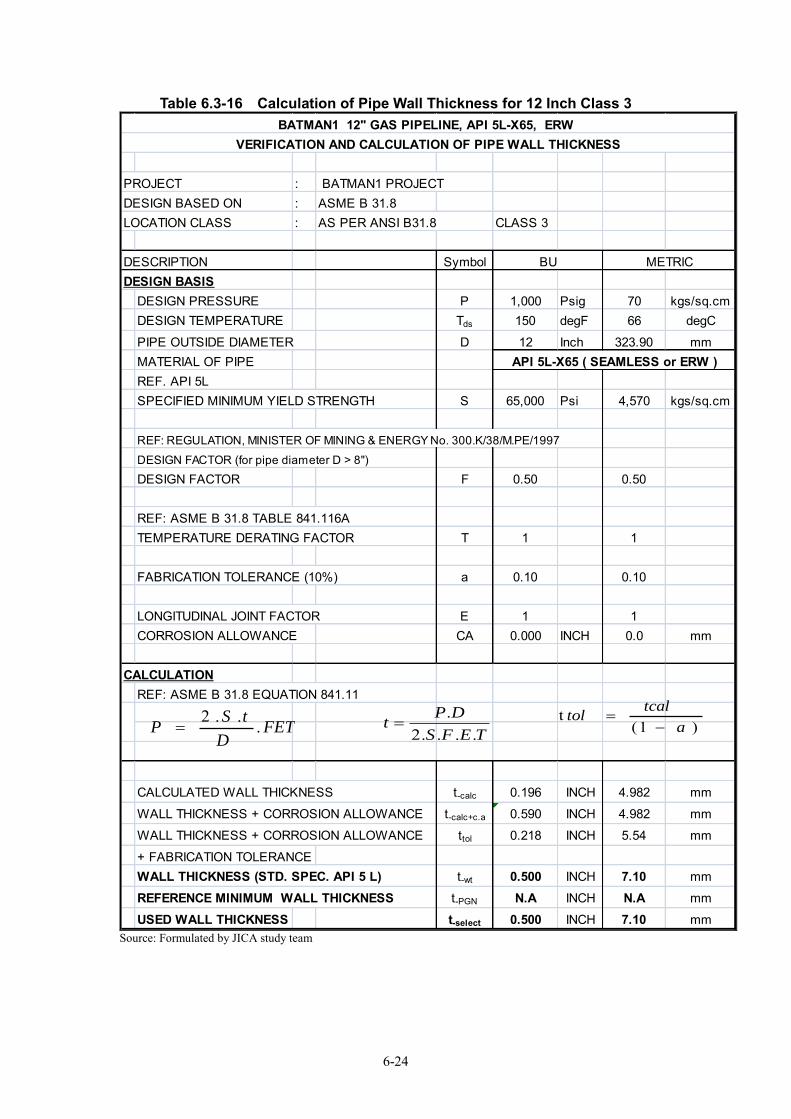
6-24
Table 6.3-16 Calculation of Pipe Wall Thickness for 12 Inch Class 3
PROJECT : BATMAN1 PROJECTDESIGN BASED ON : ASME B 31.8LOCATION CLASS : AS PER ANSI B31.8 CLASS 3
DESCRIPTION SymbolDESIGN BASIS
DESIGN PRESSURE P 1,000 Psig 70 kgs/sq.cmDESIGN TEMPERATURE Tds 150 degF 66 degC
PIPE OUTSIDE DIAMETER D 12 Inch 323.90 mmMATERIAL OF PIPEREF. API 5LSPECIFIED MINIMUM YIELD STRENGTH S 65,000 Psi 4,570 kgs/sq.cm
REF: REGULATION, MINISTER OF MINING & ENERGY No. 300.K/38/M.PE/1997
DESIGN FACTOR (for pipe diameter D > 8")
DESIGN FACTOR F 0.50 0.50
REF: ASME B 31.8 TABLE 841.116ATEMPERATURE DERATING FACTOR T 1 1
FABRICATION TOLERANCE (10%) a 0.10 0.10
LONGITUDINAL JOINT FACTOR E 1 1CORROSION ALLOWANCE CA 0.000 INCH 0.0 mm
CALCULATIONREF: ASME B 31.8 EQUATION 841.11
CALCULATED WALL THICKNESS t-calc 0.196 INCH 4.982 mm
WALL THICKNESS + CORROSION ALLOWANCE t-calc+c.a 0.590 INCH 4.982 mm
WALL THICKNESS + CORROSION ALLOWANCE ttol 0.218 INCH 5.54 mm
+ FABRICATION TOLERANCEWALL THICKNESS (STD. SPEC. API 5 L) t-wt 0.500 INCH 7.10 mm
REFERENCE MINIMUM WALL THICKNESS t-PGN N.A INCH N.A mm
USED WALL THICKNESS t-select 0.500 INCH 7.10 mm
BATMAN1 12" GAS PIPELINE, API 5L-X65, ERW VERIFICATION AND CALCULATION OF PIPE WALL THICKNESS
BU METRIC
API 5L-X65 ( SEAMLESS or ERW )
TFES
DPt..2.
FETD
tSP ...2
TFES DPt ..2 .FETD tSP ...2
TEFS
DPt
....2.
TFESDPt..2.FETD tSP ...2 TEFS DPt ....2 .
TFESDPt..2.FETDtSP...2
TFES
DPt..2.FETD
tSP...2TEFSDPt....2.
TFES
DPt..2.FETD
tSP...2
TFESDPt..2.FETDtSP...2
TEFS
DPt....2.
TFESDPt..2.FETDtSP...2TEFSDPt....2.
TFES
DPt..2.FETD
tSP...2
TFESDPt..2.FETDtSP...2
TEFS
DPt....2.
TFESDPt..2.FETDtSP...2TEFSDPt....2.
TFES
DPt..2.FETD
tSP...2
TFESDPt..2.FETDtSP...2
TEFS
DPt....2.
TFESDPt..2.FETDtSP...2TEFSDPt....2.
)1(t
a
tcaltol
Source: Formulated by JICA study team
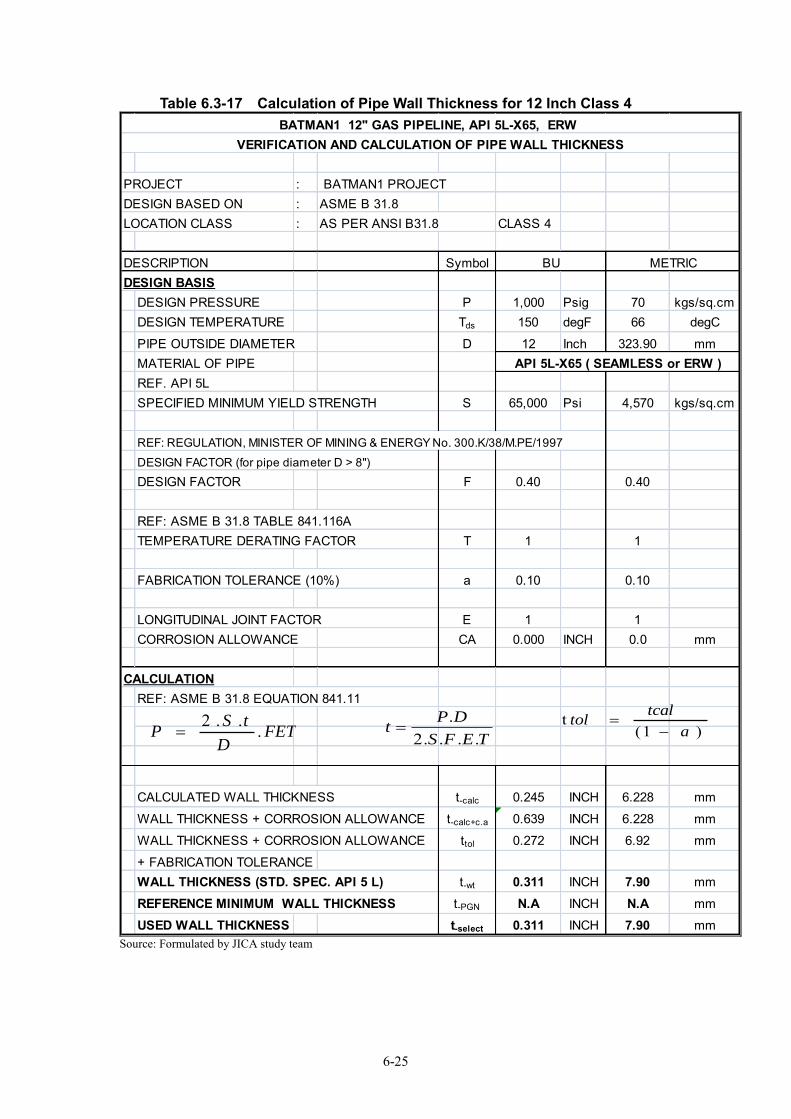
6-25
Table 6.3-17 Calculation of Pipe Wall Thickness for 12 Inch Class 4
PROJECT : BATMAN1 PROJECTDESIGN BASED ON : ASME B 31.8LOCATION CLASS : AS PER ANSI B31.8 CLASS 4
DESCRIPTION SymbolDESIGN BASIS
DESIGN PRESSURE P 1,000 Psig 70 kgs/sq.cmDESIGN TEMPERATURE Tds 150 degF 66 degC
PIPE OUTSIDE DIAMETER D 12 Inch 323.90 mmMATERIAL OF PIPEREF. API 5LSPECIFIED MINIMUM YIELD STRENGTH S 65,000 Psi 4,570 kgs/sq.cm
REF: REGULATION, MINISTER OF MINING & ENERGY No. 300.K/38/M.PE/1997
DESIGN FACTOR (for pipe diameter D > 8")
DESIGN FACTOR F 0.40 0.40
REF: ASME B 31.8 TABLE 841.116ATEMPERATURE DERATING FACTOR T 1 1
FABRICATION TOLERANCE (10%) a 0.10 0.10
LONGITUDINAL JOINT FACTOR E 1 1CORROSION ALLOWANCE CA 0.000 INCH 0.0 mm
CALCULATIONREF: ASME B 31.8 EQUATION 841.11
CALCULATED WALL THICKNESS t-calc 0.245 INCH 6.228 mm
WALL THICKNESS + CORROSION ALLOWANCE t-calc+c.a 0.639 INCH 6.228 mm
WALL THICKNESS + CORROSION ALLOWANCE ttol 0.272 INCH 6.92 mm
+ FABRICATION TOLERANCEWALL THICKNESS (STD. SPEC. API 5 L) t-wt 0.311 INCH 7.90 mm
REFERENCE MINIMUM WALL THICKNESS t-PGN N.A INCH N.A mm
USED WALL THICKNESS t-select 0.311 INCH 7.90 mm
BATMAN1 12" GAS PIPELINE, API 5L-X65, ERW VERIFICATION AND CALCULATION OF PIPE WALL THICKNESS
BU METRIC
API 5L-X65 ( SEAMLESS or ERW )
TFES
DPt..2.
FETD
tSP ...2
TFES DPt ..2 .FETD tSP ...2
TEFS
DPt
....2.
TFESDPt..2.FETD tSP ...2 TEFS DPt ....2 .
TFESDPt..2.FETDtSP...2
TFES
DPt..2.FETD
tSP...2TEFSDPt....2.
TFES
DPt..2.FETD
tSP...2
TFESDPt..2.FETDtSP...2
TEFS
DPt....2.
TFESDPt..2.FETDtSP...2TEFSDPt....2.
TFES
DPt..2.FETD
tSP...2
TFESDPt..2.FETDtSP...2
TEFS
DPt....2.
TFESDPt..2.FETDtSP...2TEFSDPt....2.
TFES
DPt..2.FETD
tSP...2
TFESDPt..2.FETDtSP...2
TEFS
DPt....2.
TFESDPt..2.FETDtSP...2TEFSDPt....2.
)1(t
a
tcaltol
Source: Formulated by JICA study team
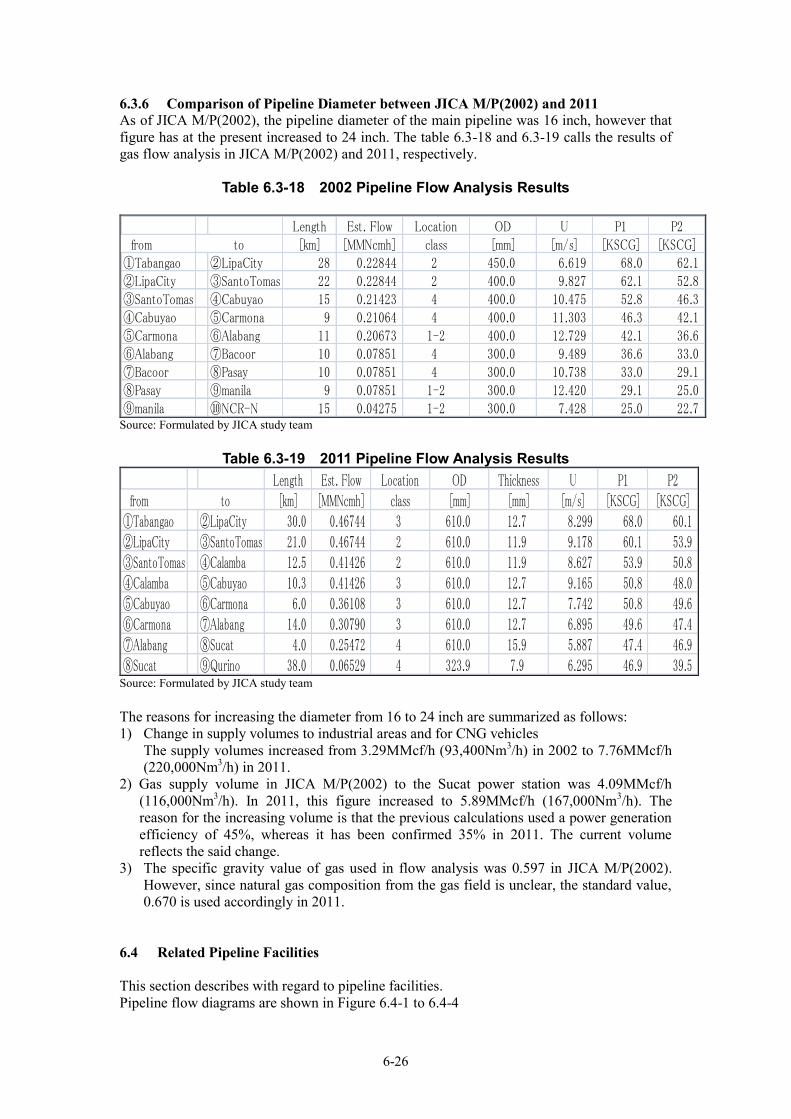
6-26
6.3.6 Comparison of Pipeline Diameter between JICA M/P(2002) and 2011 As of JICA M/P(2002), the pipeline diameter of the main pipeline was 16 inch, however that figure has at the present increased to 24 inch. The table 6.3-18 and 6.3-19 calls the results of gas flow analysis in JICA M/P(2002) and 2011, respectively.
Table 6.3-18 2002 Pipeline Flow Analysis Results
Length Est. Flow Location OD U P1 P2from to [km] [MMNcmh] class [mm] [m/s] [KSCG] [KSCG]
①Tabangao ②LipaCity 28 0.22844 2 450.0 6.619 68.0 62.1②LipaCity ③SantoTomas 22 0.22844 2 400.0 9.827 62.1 52.8③SantoTomas ④Cabuyao 15 0.21423 4 400.0 10.475 52.8 46.3④Cabuyao ⑤Carmona 9 0.21064 4 400.0 11.303 46.3 42.1⑤Carmona ⑥Alabang 11 0.20673 1-2 400.0 12.729 42.1 36.6⑥Alabang ⑦Bacoor 10 0.07851 4 300.0 9.489 36.6 33.0⑦Bacoor ⑧Pasay 10 0.07851 4 300.0 10.738 33.0 29.1⑧Pasay ⑨manila 9 0.07851 1-2 300.0 12.420 29.1 25.0⑨manila ⑩NCR-N 15 0.04275 1-2 300.0 7.428 25.0 22.7
Source: Formulated by JICA study team
Table 6.3-19 2011 Pipeline Flow Analysis Results Length Est. Flow Location OD Thickness U P1 P2
from to [km] [MMNcmh] class [mm] [mm] [m/s] [KSCG] [KSCG]①Tabangao ②LipaCity 30.0 0.46744 3 610.0 12.7 8.299 68.0 60.1②LipaCity ③SantoTomas 21.0 0.46744 2 610.0 11.9 9.178 60.1 53.9③SantoTomas ④Calamba 12.5 0.41426 2 610.0 11.9 8.627 53.9 50.8④Calamba ⑤Cabuyao 10.3 0.41426 3 610.0 12.7 9.165 50.8 48.0⑤Cabuyao ⑥Carmona 6.0 0.36108 3 610.0 12.7 7.742 50.8 49.6⑥Carmona ⑦Alabang 14.0 0.30790 3 610.0 12.7 6.895 49.6 47.4⑦Alabang ⑧Sucat 4.0 0.25472 4 610.0 15.9 5.887 47.4 46.9⑧Sucat ⑨Qurino 38.0 0.06529 4 323.9 7.9 6.295 46.9 39.5
Source: Formulated by JICA study team The reasons for increasing the diameter from 16 to 24 inch are summarized as follows: 1) Change in supply volumes to industrial areas and for CNG vehicles
The supply volumes increased from 3.29MMcf/h (93,400Nm3/h) in 2002 to 7.76MMcf/h (220,000Nm3/h) in 2011.
2) Gas supply volume in JICA M/P(2002) to the Sucat power station was 4.09MMcf/h (116,000Nm3/h). In 2011, this figure increased to 5.89MMcf/h (167,000Nm3/h). The reason for the increasing volume is that the previous calculations used a power generation efficiency of 45%, whereas it has been confirmed 35% in 2011. The current volume reflects the said change.
3) The specific gravity value of gas used in flow analysis was 0.597 in JICA M/P(2002). However, since natural gas composition from the gas field is unclear, the standard value, 0.670 is used accordingly in 2011.
6.4 Related Pipeline Facilities This section describes with regard to pipeline facilities. Pipeline flow diagrams are shown in Figure 6.4-1 to 6.4-4
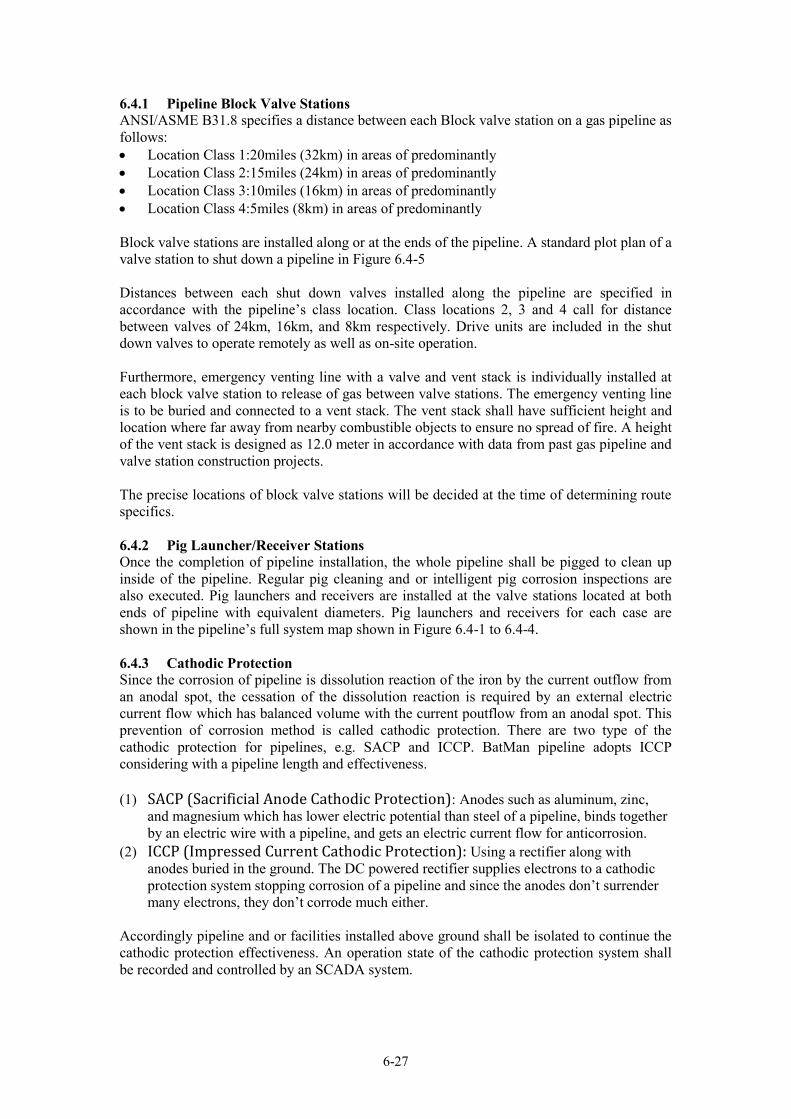
6-27
6.4.1 Pipeline Block Valve Stations ANSI/ASME B31.8 specifies a distance between each Block valve station on a gas pipeline as follows: Location Class 1:20miles (32km) in areas of predominantly Location Class 2:15miles (24km) in areas of predominantly Location Class 3:10miles (16km) in areas of predominantly Location Class 4:5miles (8km) in areas of predominantly Block valve stations are installed along or at the ends of the pipeline. A standard plot plan of a valve station to shut down a pipeline in Figure 6.4-5 Distances between each shut down valves installed along the pipeline are specified in accordance with the pipeline’s class location. Class locations 2, 3 and 4 call for distance between valves of 24km, 16km, and 8km respectively. Drive units are included in the shut down valves to operate remotely as well as on-site operation. Furthermore, emergency venting line with a valve and vent stack is individually installed at each block valve station to release of gas between valve stations. The emergency venting line is to be buried and connected to a vent stack. The vent stack shall have sufficient height and location where far away from nearby combustible objects to ensure no spread of fire. A height of the vent stack is designed as 12.0 meter in accordance with data from past gas pipeline and valve station construction projects. The precise locations of block valve stations will be decided at the time of determining route specifics. 6.4.2 Pig Launcher/Receiver Stations Once the completion of pipeline installation, the whole pipeline shall be pigged to clean up inside of the pipeline. Regular pig cleaning and or intelligent pig corrosion inspections are also executed. Pig launchers and receivers are installed at the valve stations located at both ends of pipeline with equivalent diameters. Pig launchers and receivers for each case are shown in the pipeline’s full system map shown in Figure 6.4-1 to 6.4-4. 6.4.3 Cathodic Protection Since the corrosion of pipeline is dissolution reaction of the iron by the current outflow from an anodal spot, the cessation of the dissolution reaction is required by an external electric current flow which has balanced volume with the current poutflow from an anodal spot. This prevention of corrosion method is called cathodic protection. There are two type of the cathodic protection for pipelines, e.g. SACP and ICCP. BatMan pipeline adopts ICCP considering with a pipeline length and effectiveness. (1) SACP (Sacrificial Anode Cathodic Protection): Anodes such as aluminum, zinc,
and magnesium which has lower electric potential than steel of a pipeline, binds together by an electric wire with a pipeline, and gets an electric current flow for anticorrosion.
(2) ICCP (Impressed Current Cathodic Protection): Using a rectifier along with anodes buried in the ground. The DC powered rectifier supplies electrons to a cathodic protection system stopping corrosion of a pipeline and since the anodes don’t surrender many electrons, they don’t corrode much either.
Accordingly pipeline and or facilities installed above ground shall be isolated to continue the cathodic protection effectiveness. An operation state of the cathodic protection system shall be recorded and controlled by an SCADA system.

6-28
6.4.4 Metering Station Metering stations, which are installed at pipeline terminal, shall manage and monitor flow volumes of commercial-use gas to end users. Metering stations on the pipeline are installed at the Batangas gas plant and each power station. Metering stations will be installed at each user in the industrial areas, however they are not to be included in the present investigation. 6.4.5 SCADA System The SCADA system is to be installed in order to assure reliable and efficient operational performance, as well as for general system monitoring purposes for the pipeline. The system shall be capable to control remotely shut down valve and vent valve in emergency situations such as a gas leak. The system can also gather information from the gas plant such as changes of outlet flow conditions, and reflect such changes in pipeline operation. The operation room shall be established in the office of the pipeline’s owner, and will monitor the items below. The SCADA system overview is shown in Figure 6.4-6. Gas flow volume, pressure, and temperature Measure current of cathodic protection Emergency response to sudden and dramatic changes in gas pressure remotely Data exchange with related facilities
6-29
Figure 6.4-1 Pipeline Flow Diagram on Case 1
6-30
Figure 6.4-2 Pipeline Flow Diagram on Case 2
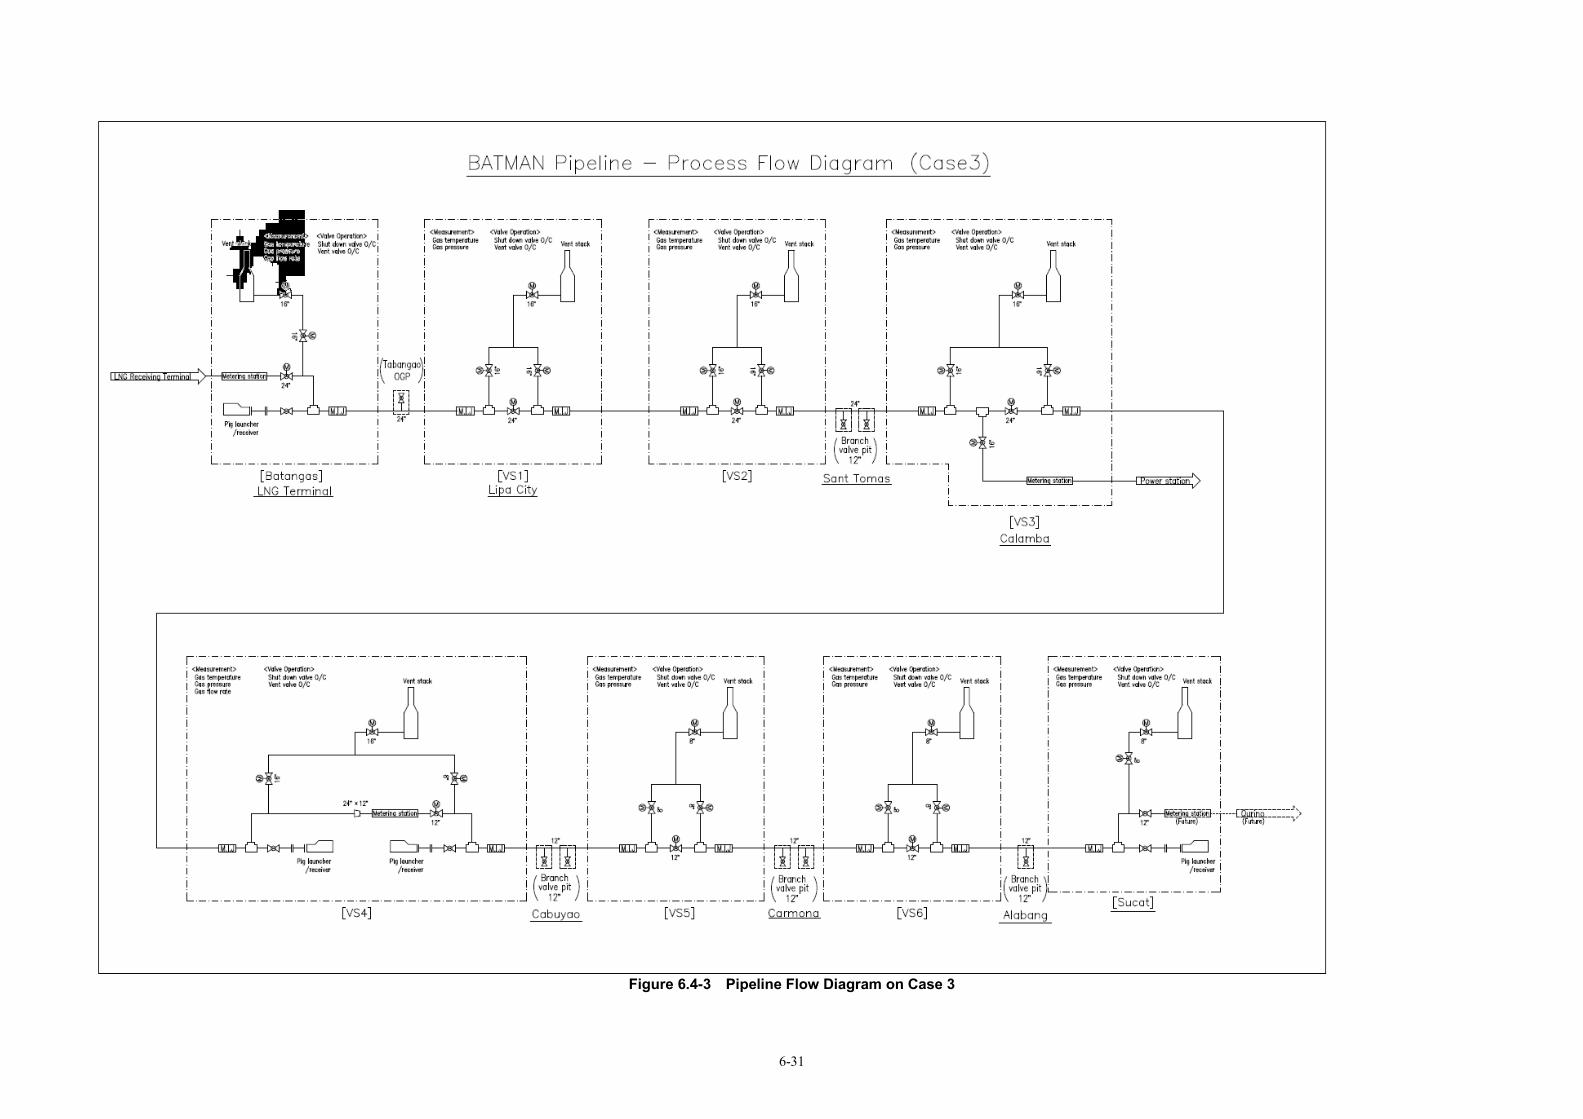
6-31
Figure 6.4-3 Pipeline Flow Diagram on Case 3
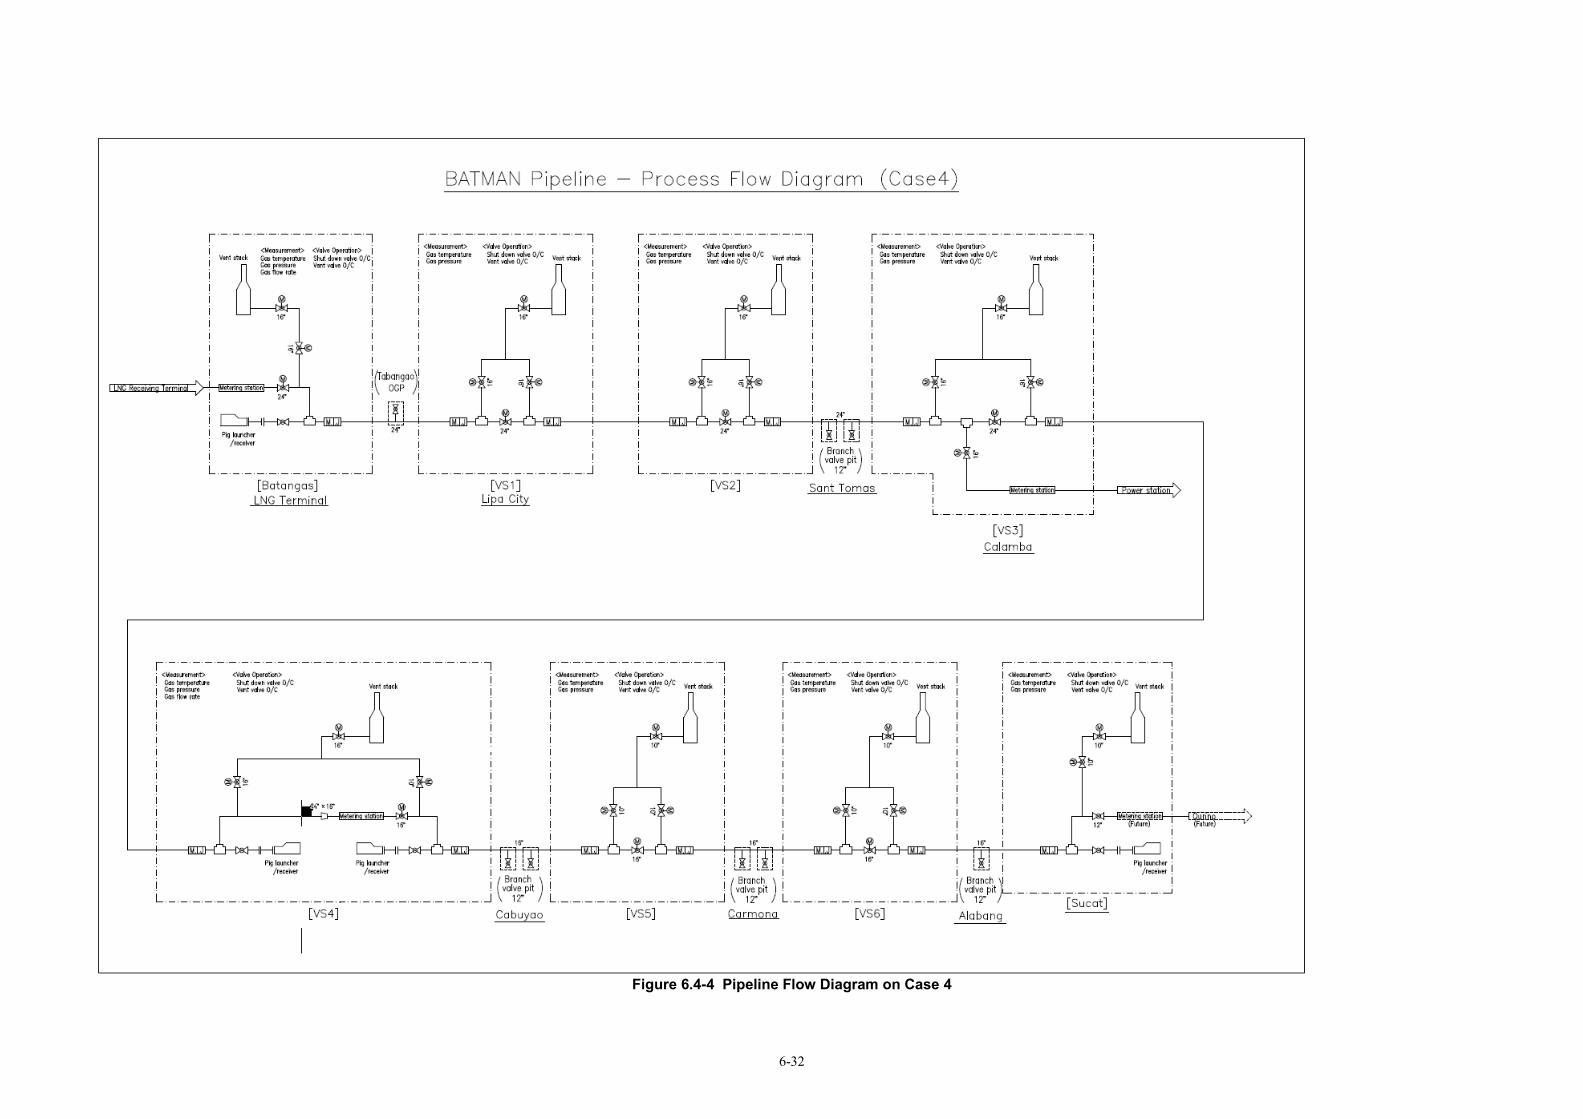
6-32
Figure 6.4-4 Pipeline Flow Diagram on Case 4
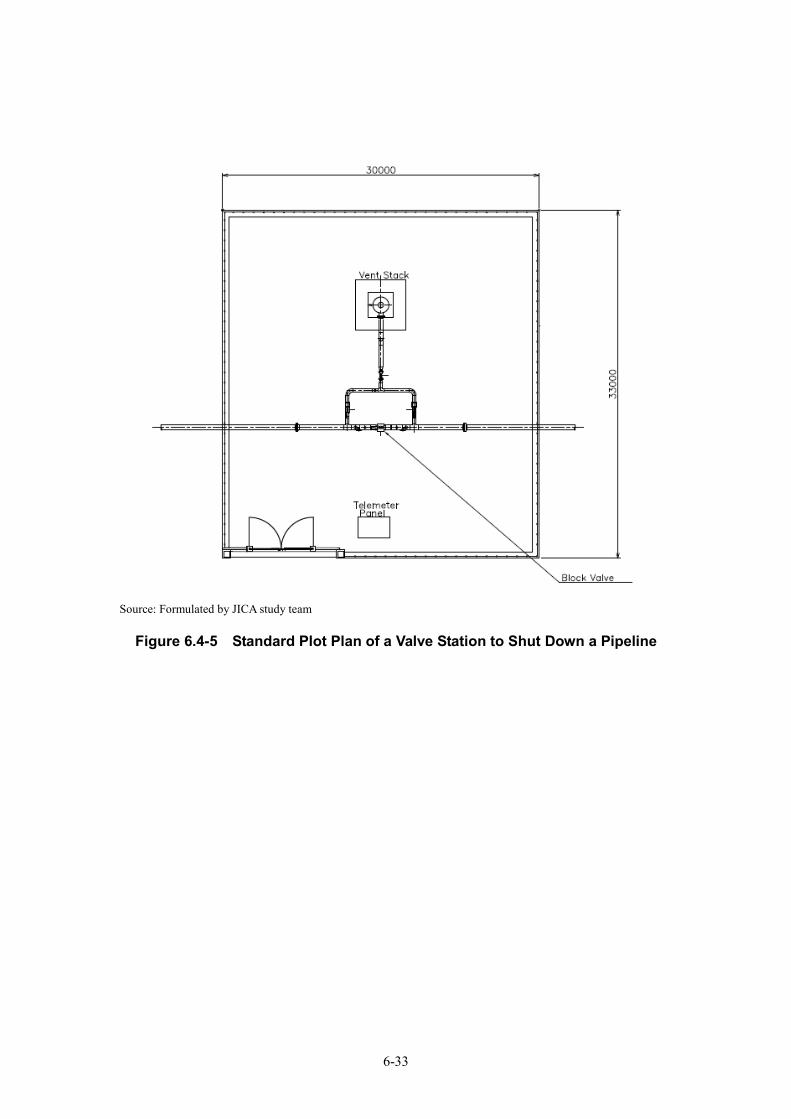
6-33
Source: Formulated by JICA study team
Figure 6.4-5 Standard Plot Plan of a Valve Station to Shut Down a Pipeline
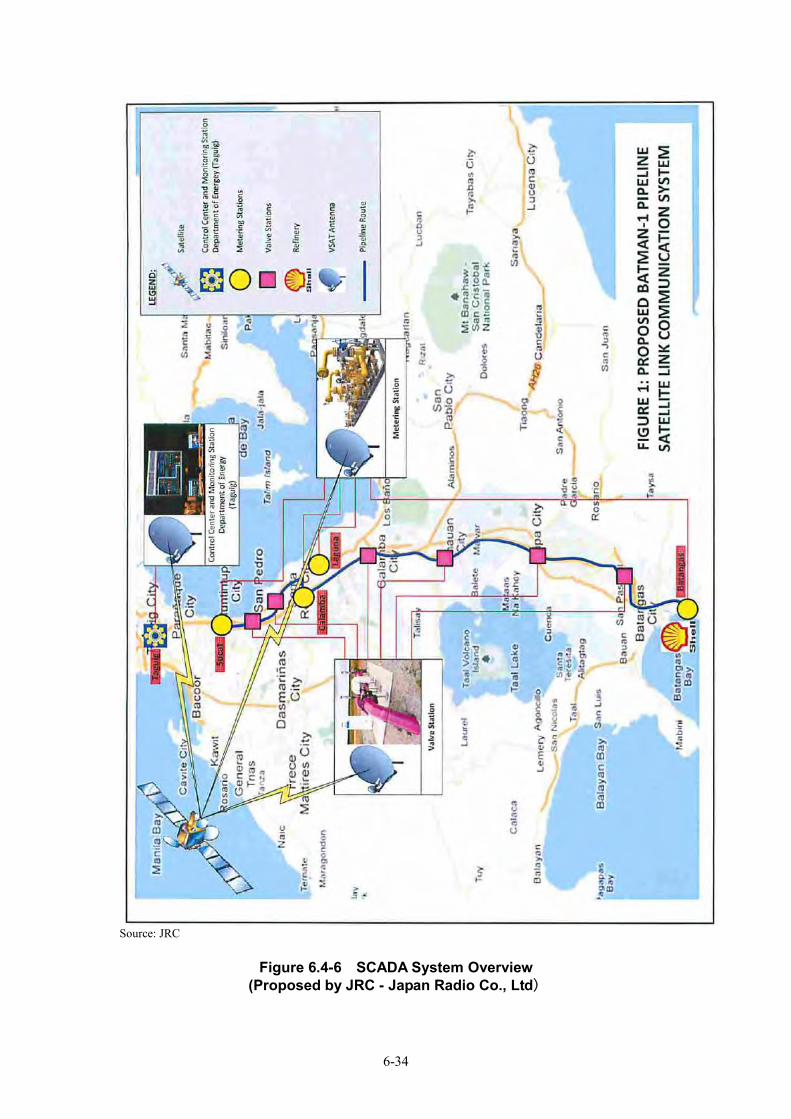
6-34
Source: JRC
Figure 6.4-6 SCADA System Overview (Proposed by JRC - Japan Radio Co., Ltd)
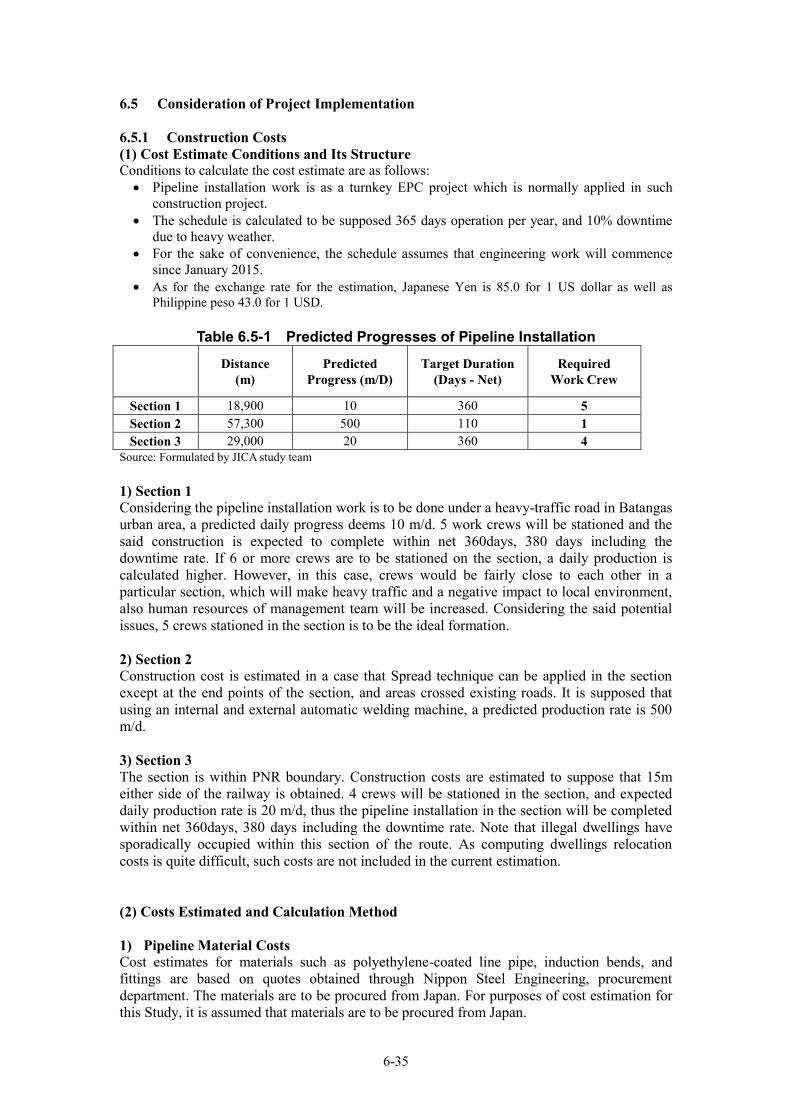
6-35
6.5 Consideration of Project Implementation 6.5.1 Construction Costs (1) Cost Estimate Conditions and Its Structure Conditions to calculate the cost estimate are as follows: Pipeline installation work is as a turnkey EPC project which is normally applied in such
construction project. The schedule is calculated to be supposed 365 days operation per year, and 10% downtime
due to heavy weather. For the sake of convenience, the schedule assumes that engineering work will commence
since January 2015. As for the exchange rate for the estimation, Japanese Yen is 85.0 for 1 US dollar as well as
Philippine peso 43.0 for 1 USD.
Table 6.5-1 Predicted Progresses of Pipeline Installation
Distance (m)
Predicted Progress (m/D)
Target Duration (Days - Net)
Required Work Crew
Section 1 18,900 10 360 5 Section 2 57,300 500 110 1 Section 3 29,000 20 360 4
Source: Formulated by JICA study team 1) Section 1 Considering the pipeline installation work is to be done under a heavy-traffic road in Batangas urban area, a predicted daily progress deems 10 m/d. 5 work crews will be stationed and the said construction is expected to complete within net 360days, 380 days including the downtime rate. If 6 or more crews are to be stationed on the section, a daily production is calculated higher. However, in this case, crews would be fairly close to each other in a particular section, which will make heavy traffic and a negative impact to local environment, also human resources of management team will be increased. Considering the said potential issues, 5 crews stationed in the section is to be the ideal formation. 2) Section 2 Construction cost is estimated in a case that Spread technique can be applied in the section except at the end points of the section, and areas crossed existing roads. It is supposed that using an internal and external automatic welding machine, a predicted production rate is 500 m/d. 3) Section 3 The section is within PNR boundary. Construction costs are estimated to suppose that 15m either side of the railway is obtained. 4 crews will be stationed in the section, and expected daily production rate is 20 m/d, thus the pipeline installation in the section will be completed within net 360days, 380 days including the downtime rate. Note that illegal dwellings have sporadically occupied within this section of the route. As computing dwellings relocation costs is quite difficult, such costs are not included in the current estimation. (2) Costs Estimated and Calculation Method 1) Pipeline Material Costs Cost estimates for materials such as polyethylene-coated line pipe, induction bends, and fittings are based on quotes obtained through Nippon Steel Engineering, procurement department. The materials are to be procured from Japan. For purposes of cost estimation for this Study, it is assumed that materials are to be procured from Japan.
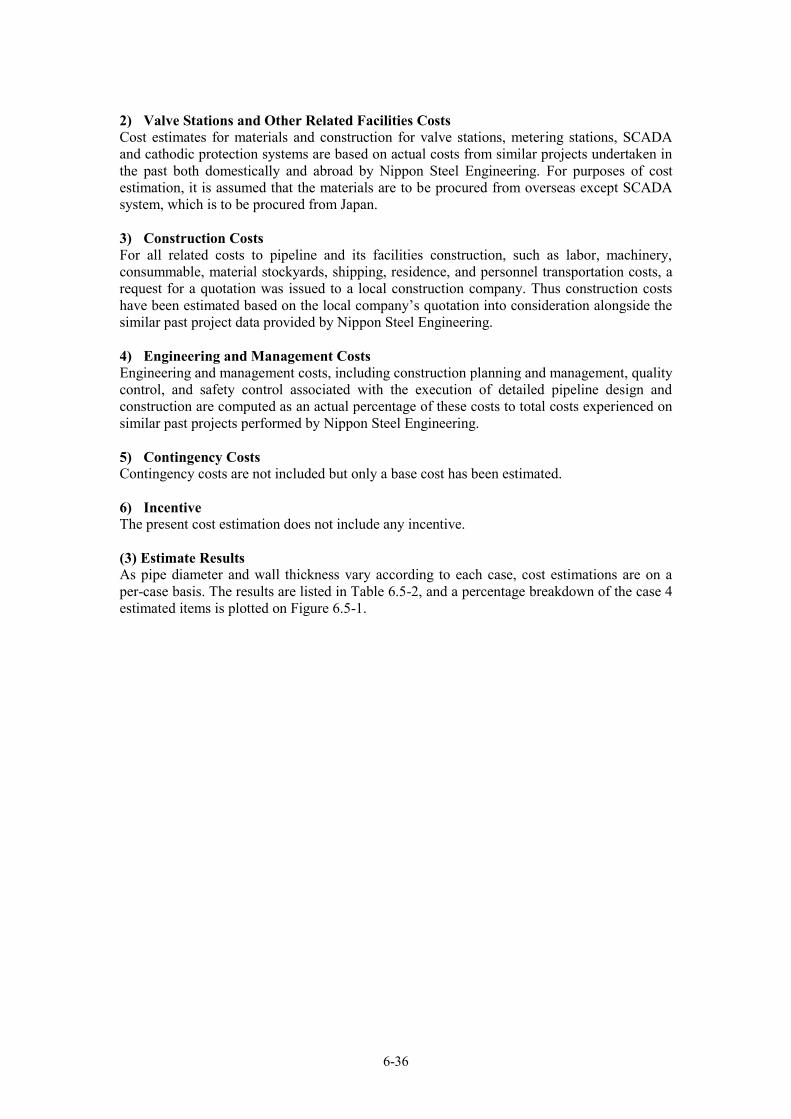
6-36
2) Valve Stations and Other Related Facilities Costs Cost estimates for materials and construction for valve stations, metering stations, SCADA and cathodic protection systems are based on actual costs from similar projects undertaken in the past both domestically and abroad by Nippon Steel Engineering. For purposes of cost estimation, it is assumed that the materials are to be procured from overseas except SCADA system, which is to be procured from Japan. 3) Construction Costs For all related costs to pipeline and its facilities construction, such as labor, machinery, consummable, material stockyards, shipping, residence, and personnel transportation costs, a request for a quotation was issued to a local construction company. Thus construction costs have been estimated based on the local company’s quotation into consideration alongside the similar past project data provided by Nippon Steel Engineering. 4) Engineering and Management Costs Engineering and management costs, including construction planning and management, quality control, and safety control associated with the execution of detailed pipeline design and construction are computed as an actual percentage of these costs to total costs experienced on similar past projects performed by Nippon Steel Engineering. 5) Contingency Costs Contingency costs are not included but only a base cost has been estimated. 6) Incentive The present cost estimation does not include any incentive. (3) Estimate Results As pipe diameter and wall thickness vary according to each case, cost estimations are on a per-case basis. The results are listed in Table 6.5-2, and a percentage breakdown of the case 4 estimated items is plotted on Figure 6.5-1.
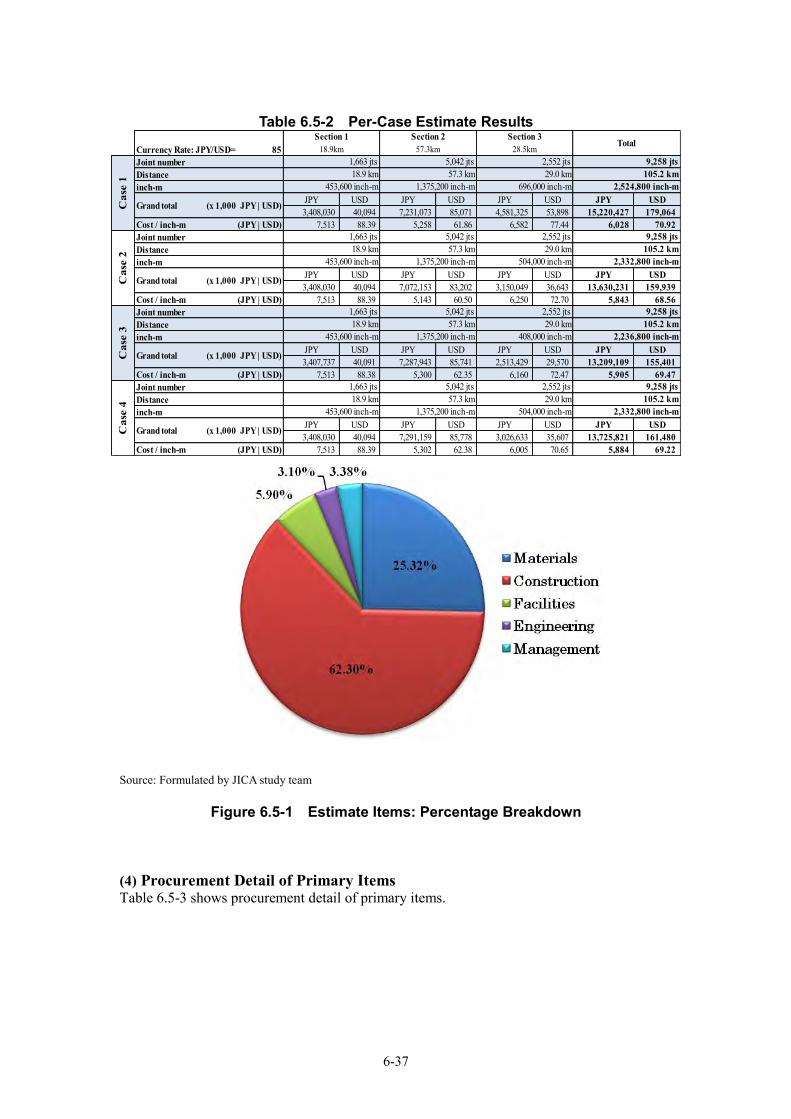
6-37
Table 6.5-2 Per-Case Estimate Results
Currency Rate: JPY/USD= 85Joint numberDistanceinch-m
JPY USD JPY USD JPY USD JPY USD3,408,030 40,094 7,231,073 85,071 4,581,325 53,898 15,220,427 179,064
Cost / inch-m (JPY | USD) 7,513 88.39 5,258 61.86 6,582 77.44 6,028 70.92 Joint numberDistanceinch-m
JPY USD JPY USD JPY USD JPY USD3,408,030 40,094 7,072,153 83,202 3,150,049 36,643 13,630,231 159,939
Cost / inch-m (JPY | USD) 7,513 88.39 5,143 60.50 6,250 72.70 5,843 68.56 Joint numberDistanceinch-m
JPY USD JPY USD JPY USD JPY USD3,407,737 40,091 7,287,943 85,741 2,513,429 29,570 13,209,109 155,401
Cost / inch-m (JPY | USD) 7,513 88.38 5,300 62.35 6,160 72.47 5,905 69.47 Joint numberDistanceinch-m
JPY USD JPY USD JPY USD JPY USD3,408,030 40,094 7,291,159 85,778 3,026,633 35,607 13,725,821 161,480
Cost / inch-m (JPY | USD) 7,513 88.39 5,302 62.38 6,005 70.65 5,884 69.22
Total18.9km 57.3km 28.5km
Section 1 Section 2 Section 3
9,258 jts
Cas
e 3
2,524,800 inch-m
1,663 jts 5,042 jts 2,552 jts 9,258 jts18.9 km 57.3 km 29.0 km 105.2 km
453,600 inch-m
Cas
e 1
Cas
e 2
1,375,200 inch-m 696,000 inch-m
2,552 jts
Grand total
1,663 jts 5,042 jts 2,552 jts
(x 1,000 JPY | USD)
1,375,200 inch-m 504,000 inch-m
1,663 jts 5,042 jts
2,332,800 inch-m18.9 km 57.3 km 29.0 km 105.2 km
453,600 inch-m
Cas
e 4
1,663 jts 5,042 jts 2,552 jts 9,258 jts18.9 km 57.3 km 29.0 km 105.2 km
453,600 inch-m 1,375,200 inch-m 504,000 inch-m
9,258 jts18.9 km
2,332,800 inch-m
Grand total (x 1,000 JPY | USD)
Grand total (x 1,000 JPY | USD)
Grand total (x 1,000 JPY | USD)
57.3 km 29.0 km 105.2 km2,236,800 inch-m453,600 inch-m 1,375,200 inch-m 408,000 inch-m
Source: Formulated by JICA study team
Figure 6.5-1 Estimate Items: Percentage Breakdown
(4) Procurement Detail of Primary Items Table 6.5-3 shows procurement detail of primary items.
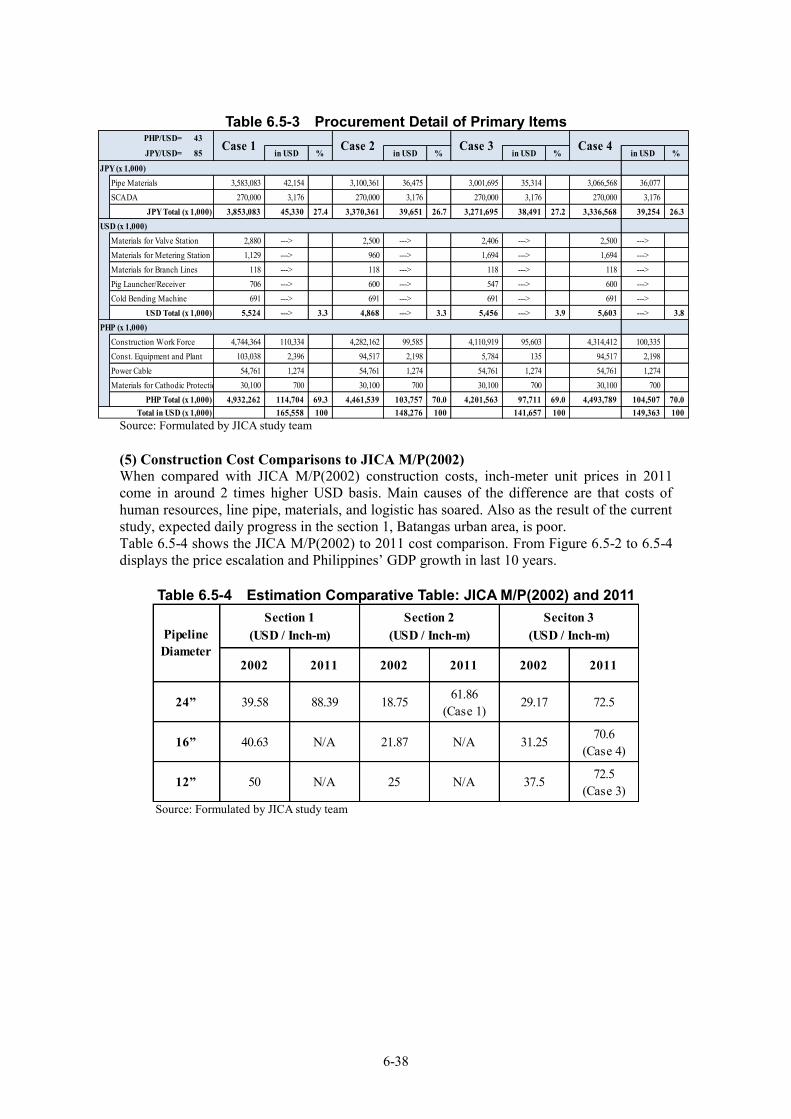
6-38
Table 6.5-3 Procurement Detail of Primary Items
PHP/USD= 43
JPY/USD= 85 in USD % in USD % in USD % in USD %
JPY (x 1,000)Pipe Materials 3,583,083 42,154 3,100,361 36,475 3,001,695 35,314 3,066,568 36,077 SCADA 270,000 3,176 270,000 3,176 270,000 3,176 270,000 3,176
JPY Total (x 1,000) 3,853,083 45,330 27.4 3,370,361 39,651 26.7 3,271,695 38,491 27.2 3,336,568 39,254 26.3USD (x 1,000)
Materials for Valve Station 2,880 ---> 2,500 ---> 2,406 ---> 2,500 --->Materials for Metering Station 1,129 ---> 960 ---> 1,694 ---> 1,694 --->Materials for Branch Lines 118 ---> 118 ---> 118 ---> 118 --->Pig Launcher/Receiver 706 ---> 600 ---> 547 ---> 600 --->Cold Bending Machine 691 ---> 691 ---> 691 ---> 691 --->
USD Total (x 1,000) 5,524 ---> 3.3 4,868 ---> 3.3 5,456 ---> 3.9 5,603 ---> 3.8PHP (x 1,000)
Construction Work Force 4,744,364 110,334 4,282,162 99,585 4,110,919 95,603 4,314,412 100,335 Const. Equipment and Plant 103,038 2,396 94,517 2,198 5,784 135 94,517 2,198 Power Cable 54,761 1,274 54,761 1,274 54,761 1,274 54,761 1,274 Materials for Cathodic Protection 30,100 700 30,100 700 30,100 700 30,100 700
PHP Total (x 1,000) 4,932,262 114,704 69.3 4,461,539 103,757 70.0 4,201,563 97,711 69.0 4,493,789 104,507 70.0Total in USD (x 1,000) 165,558 100 148,276 100 141,657 100 149,363 100
Case 3 Case 4Case 1 Case 2
Source: Formulated by JICA study team (5) Construction Cost Comparisons to JICA M/P(2002) When compared with JICA M/P(2002) construction costs, inch-meter unit prices in 2011 come in around 2 times higher USD basis. Main causes of the difference are that costs of human resources, line pipe, materials, and logistic has soared. Also as the result of the current study, expected daily progress in the section 1, Batangas urban area, is poor. Table 6.5-4 shows the JICA M/P(2002) to 2011 cost comparison. From Figure 6.5-2 to 6.5-4 displays the price escalation and Philippines’ GDP growth in last 10 years.
Table 6.5-4 Estimation Comparative Table: JICA M/P(2002) and 2011
61.86(Case 1)
70.6(Case 4)
72.5(Case 3)
88.39 18.75 29.17
37.5
16” 40.63 N/A 21.87 N/A 31.25
12” 50 N/A 25 N/A
2011 2011 2011
72.5
PipelineDiameter
Section 1(USD / Inch-m)
Section 2(USD / Inch-m)
Seciton 3(USD / Inch-m)
2002 2002 2002
24” 39.58
Source: Formulated by JICA study team
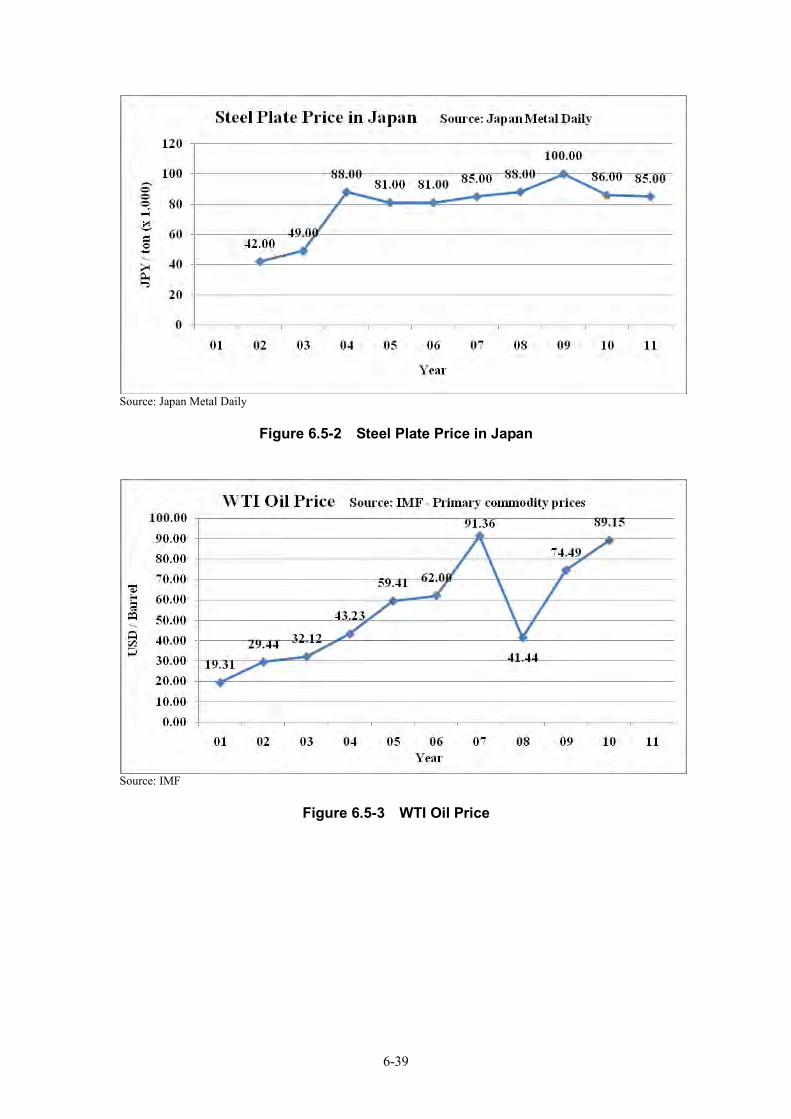
6-39
Source: Japan Metal Daily
Figure 6.5-2 Steel Plate Price in Japan
Source: IMF
Figure 6.5-3 WTI Oil Price
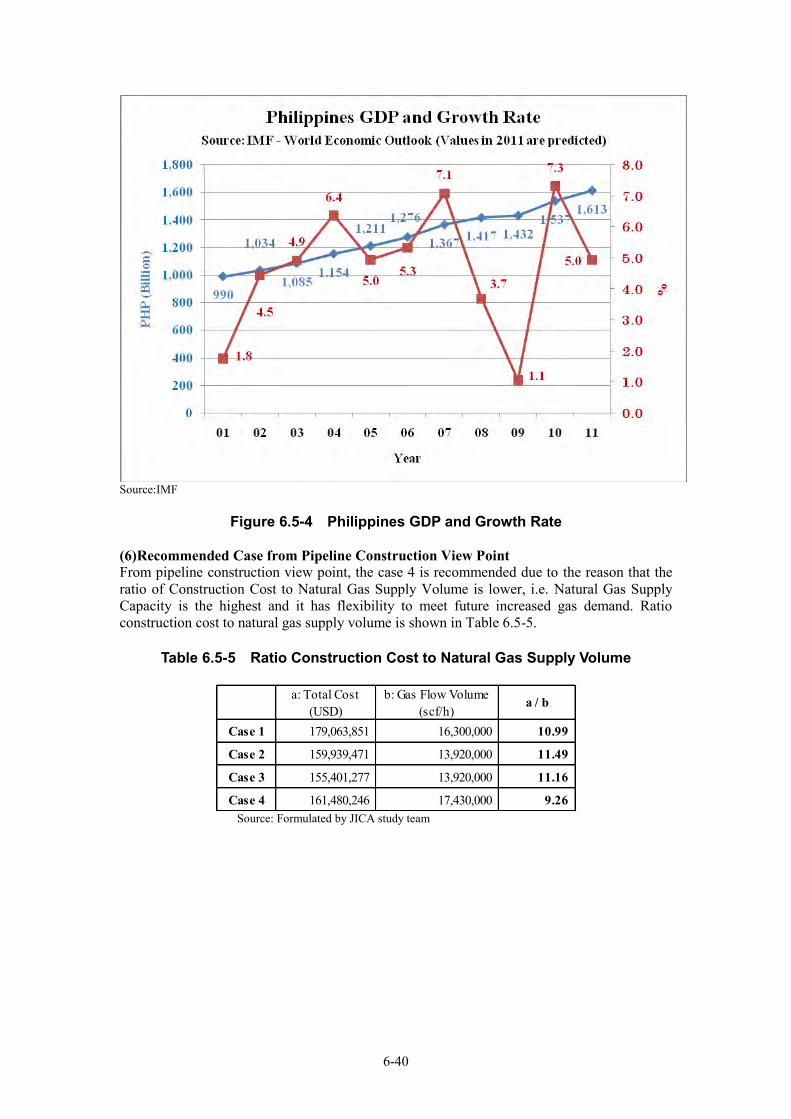
6-40
Source:IMF
Figure 6.5-4 Philippines GDP and Growth Rate
(6)Recommended Case from Pipeline Construction View Point From pipeline construction view point, the case 4 is recommended due to the reason that the ratio of Construction Cost to Natural Gas Supply Volume is lower, i.e. Natural Gas Supply Capacity is the highest and it has flexibility to meet future increased gas demand. Ratio construction cost to natural gas supply volume is shown in Table 6.5-5.
Table 6.5-5 Ratio Construction Cost to Natural Gas Supply Volume
a: Total Cost
(USD)b: Gas Flow Volume
(scf/h)a / b
Case 1 179,063,851 16,300,000 10.99
Case 2 159,939,471 13,920,000 11.49
Case 3 155,401,277 13,920,000 11.16
Case 4 161,480,246 17,430,000 9.26 Source: Formulated by JICA study team
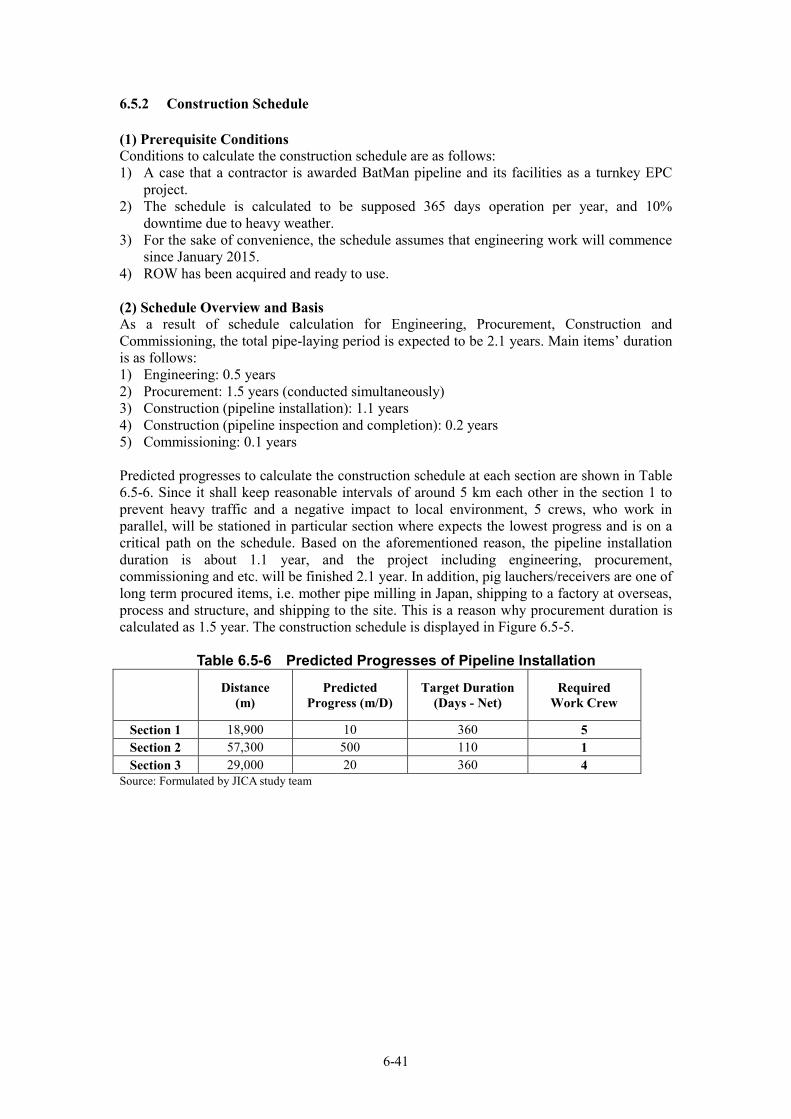
6-41
6.5.2 Construction Schedule (1) Prerequisite Conditions Conditions to calculate the construction schedule are as follows: 1) A case that a contractor is awarded BatMan pipeline and its facilities as a turnkey EPC
project. 2) The schedule is calculated to be supposed 365 days operation per year, and 10%
downtime due to heavy weather. 3) For the sake of convenience, the schedule assumes that engineering work will commence
since January 2015. 4) ROW has been acquired and ready to use. (2) Schedule Overview and Basis As a result of schedule calculation for Engineering, Procurement, Construction and Commissioning, the total pipe-laying period is expected to be 2.1 years. Main items’ duration is as follows: 1) Engineering: 0.5 years 2) Procurement: 1.5 years (conducted simultaneously) 3) Construction (pipeline installation): 1.1 years 4) Construction (pipeline inspection and completion): 0.2 years 5) Commissioning: 0.1 years Predicted progresses to calculate the construction schedule at each section are shown in Table 6.5-6. Since it shall keep reasonable intervals of around 5 km each other in the section 1 to prevent heavy traffic and a negative impact to local environment, 5 crews, who work in parallel, will be stationed in particular section where expects the lowest progress and is on a critical path on the schedule. Based on the aforementioned reason, the pipeline installation duration is about 1.1 year, and the project including engineering, procurement, commissioning and etc. will be finished 2.1 year. In addition, pig lauchers/receivers are one of long term procured items, i.e. mother pipe milling in Japan, shipping to a factory at overseas, process and structure, and shipping to the site. This is a reason why procurement duration is calculated as 1.5 year. The construction schedule is displayed in Figure 6.5-5.
Table 6.5-6 Predicted Progresses of Pipeline Installation
Distance (m)
Predicted Progress (m/D)
Target Duration (Days - Net)
Required Work Crew
Section 1 18,900 10 360 5 Section 2 57,300 500 110 1 Section 3 29,000 20 360 4
Source: Formulated by JICA study team
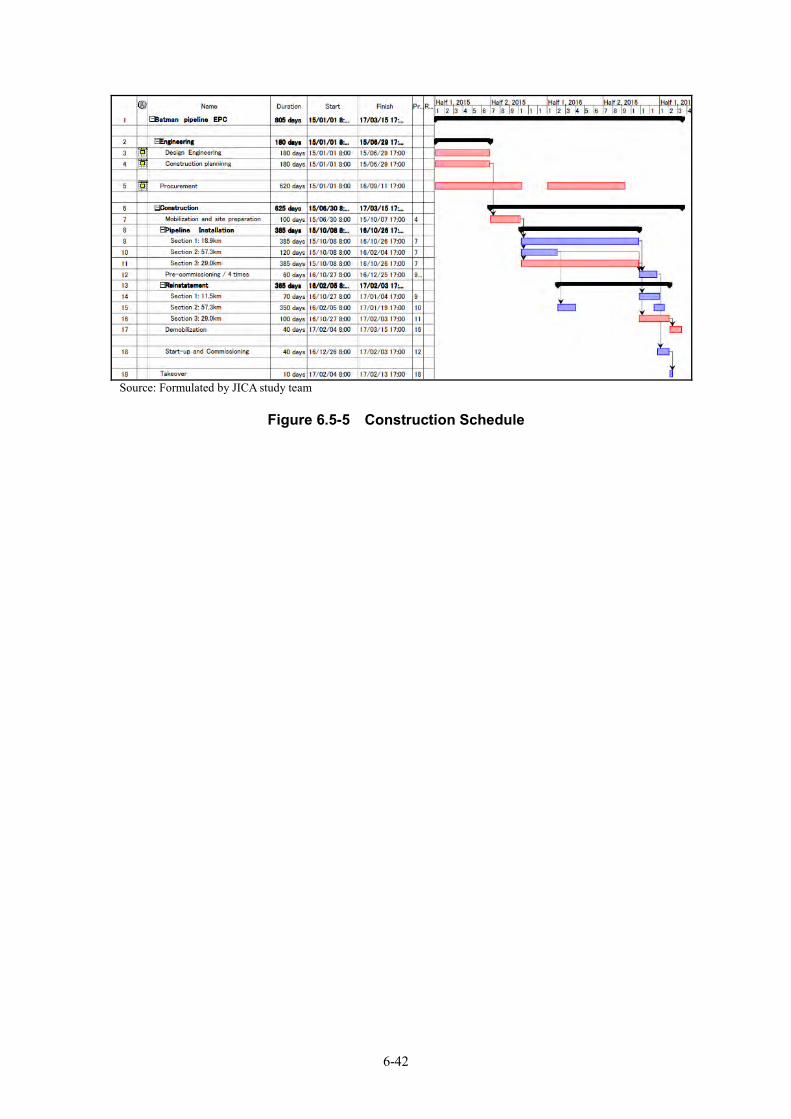
6-42
Source: Formulated by JICA study team
Figure 6.5-5 Construction Schedule
7-1
Chapter 7 LNG Receiving Terminal 7.1 Design Conditions for LNG Receiving Terminal 7.1.1 Type of LNG Re-gasification Terminal LNG receiving terminal has two types, which are onshore plant and offshore plant. Table 7.1-1 shows the comparison between onshore plant and offshore plant.
Table 7.1-1 Comparison between Onshore Plant and Offshore Plant Onshore Plant Offshore Plant
(Floating Storage Unloading Re-gasification : FRSU)
Capital expenditure Relatively High (It depends on the situation of harbor and installation site.)
Relatively Low
Operational expenditure Same between onshore and offshore
Same between onshore and offshore
Construction period Long due to the long EPC period of LNG storage tank
Short in case of a used carrier’s remodeling
Operational Flexibility High flexibility No restriction of available LNG carrier
Many restrictions such as gas send-out pattern and unloading timing
Reliability of gas send-out High Reliability (Large amount of LNG storage volume)
Low reliability due to the small amount of LNG storage volume
Expansion ability Infinite in case of no restriction of land and harbor
Possibility of the additional install of FSRU in case of no restriction of harbor
Source: Formulated by JICA study team If LNG re-gas Terminal has to be installed and started up in a short term, it is seemed to be better that an offshore plant which is a remodeling type of a used LNG carrier is applied to it. However when it can be installed and started up in a long term, an onshore plant should be applied to LNG re-gas terminal due to the high reliability of gas send-out. And then the capacity of LNG re-gas terminal should be expanded according to the increase of gas demand. From the point of long-term view, an onshore plant should be applied and studied in this feasibility study due to the high reliability and expansion ability. 7.1.2 Location of the LNG Receiving Terminal The following conditions will be considered for receiving terminals:
(1) Harmony with/ Acceptance by Local Community How to maintain local environment after accepting the siting of an LNG receiving terminal will be important for secure operation. This requires the confidence of local residents regarding safety, protecting preferred local distinctions such as natural landscape and monuments, and maintaining the everyday lives of the residents. It is preferred not just to maintain them but to improve them when introducing terminals. (2) Proximity to Transmission and Use The location of an LNG terminal should accommodate easy connection to gas transmission, and eventual distribution and end use. Furthermore, utilities supply situation such as power, industrial water, and drinking water is one of the selection criteria. (3) Easy Reception of LNG Ships
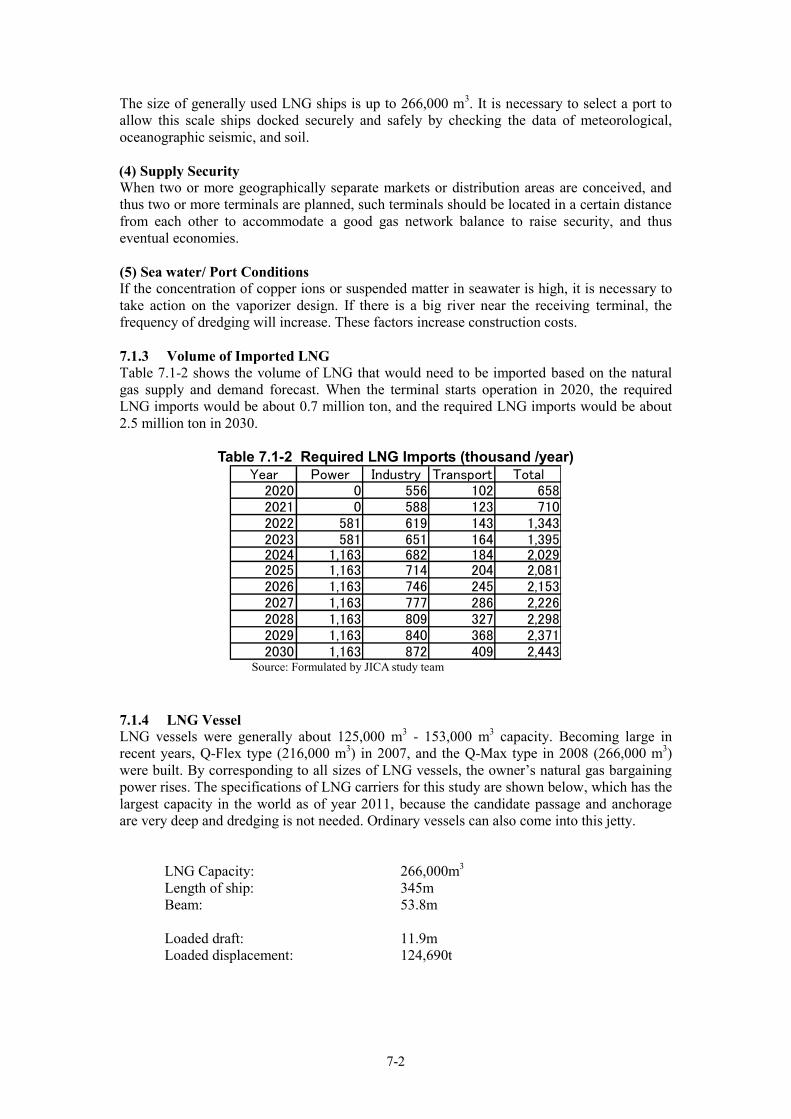
7-2
The size of generally used LNG ships is up to 266,000 m3. It is necessary to select a port to allow this scale ships docked securely and safely by checking the data of meteorological, oceanographic seismic, and soil. (4) Supply Security When two or more geographically separate markets or distribution areas are conceived, and thus two or more terminals are planned, such terminals should be located in a certain distance from each other to accommodate a good gas network balance to raise security, and thus eventual economies. (5) Sea water/ Port Conditions If the concentration of copper ions or suspended matter in seawater is high, it is necessary to take action on the vaporizer design. If there is a big river near the receiving terminal, the frequency of dredging will increase. These factors increase construction costs. 7.1.3 Volume of Imported LNG Table 7.1-2 shows the volume of LNG that would need to be imported based on the natural gas supply and demand forecast. When the terminal starts operation in 2020, the required LNG imports would be about 0.7 million ton, and the required LNG imports would be about 2.5 million ton in 2030.
Table 7.1-2 Required LNG Imports (thousand /year) Year Power Industry Transport Total
2020 0 556 102 6582021 0 588 123 7102022 581 619 143 1,3432023 581 651 164 1,3952024 1,163 682 184 2,0292025 1,163 714 204 2,0812026 1,163 746 245 2,1532027 1,163 777 286 2,2262028 1,163 809 327 2,2982029 1,163 840 368 2,3712030 1,163 872 409 2,443
Source: Formulated by JICA study team 7.1.4 LNG Vessel LNG vessels were generally about 125,000 m3 - 153,000 m3 capacity. Becoming large in recent years, Q-Flex type (216,000 m3) in 2007, and the Q-Max type in 2008 (266,000 m3) were built. By corresponding to all sizes of LNG vessels, the owner’s natural gas bargaining power rises. The specifications of LNG carriers for this study are shown below, which has the largest capacity in the world as of year 2011, because the candidate passage and anchorage are very deep and dredging is not needed. Ordinary vessels can also come into this jetty.
LNG Capacity: 266,000m3 Length of ship: 345m Beam: 53.8m Loaded draft: 11.9m Loaded displacement: 124,690t
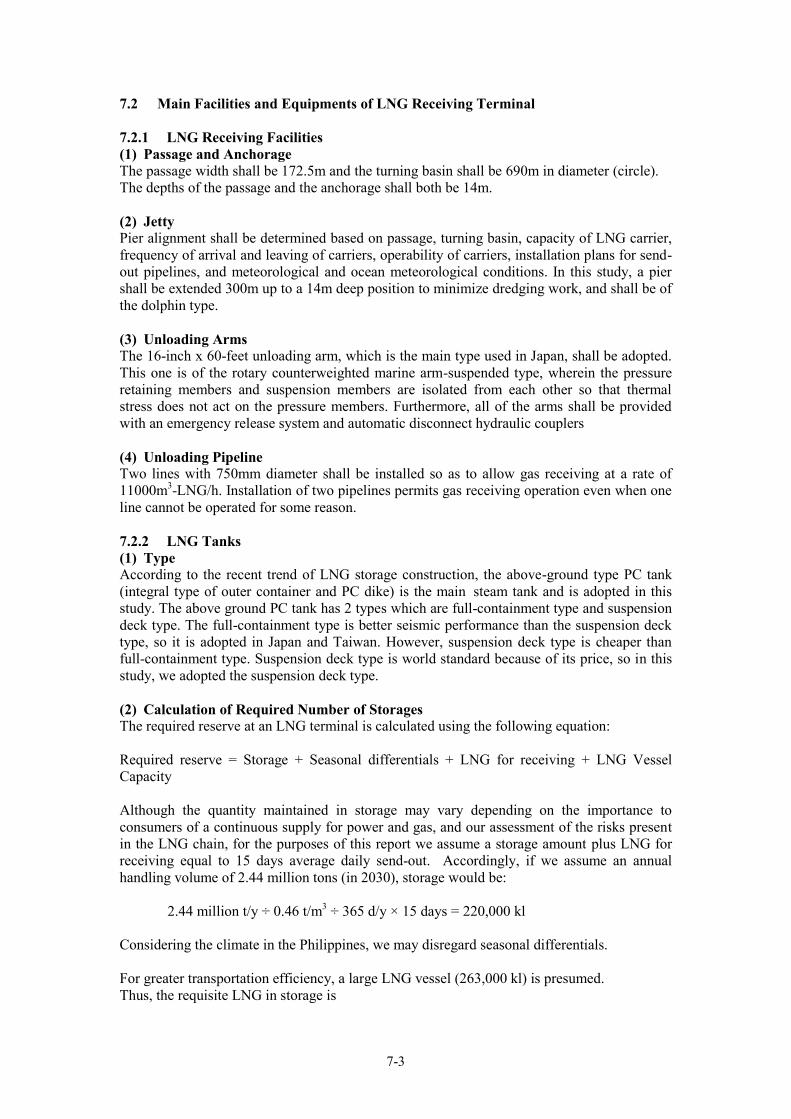
7-3
7.2 Main Facilities and Equipments of LNG Receiving Terminal 7.2.1 LNG Receiving Facilities (1) Passage and Anchorage The passage width shall be 172.5m and the turning basin shall be 690m in diameter (circle). The depths of the passage and the anchorage shall both be 14m. (2) Jetty Pier alignment shall be determined based on passage, turning basin, capacity of LNG carrier, frequency of arrival and leaving of carriers, operability of carriers, installation plans for send-out pipelines, and meteorological and ocean meteorological conditions. In this study, a pier shall be extended 300m up to a 14m deep position to minimize dredging work, and shall be of the dolphin type. (3) Unloading Arms The 16-inch x 60-feet unloading arm, which is the main type used in Japan, shall be adopted. This one is of the rotary counterweighted marine arm-suspended type, wherein the pressure retaining members and suspension members are isolated from each other so that thermal stress does not act on the pressure members. Furthermore, all of the arms shall be provided with an emergency release system and automatic disconnect hydraulic couplers (4) Unloading Pipeline Two lines with 750mm diameter shall be installed so as to allow gas receiving at a rate of 11000m3-LNG/h. Installation of two pipelines permits gas receiving operation even when one line cannot be operated for some reason. 7.2.2 LNG Tanks (1) Type According to the recent trend of LNG storage construction, the above-ground type PC tank (integral type of outer container and PC dike) is the main steam tank and is adopted in this study. The above ground PC tank has 2 types which are full-containment type and suspension deck type. The full-containment type is better seismic performance than the suspension deck type, so it is adopted in Japan and Taiwan. However, suspension deck type is cheaper than full-containment type. Suspension deck type is world standard because of its price, so in this study, we adopted the suspension deck type. (2) Calculation of Required Number of Storages The required reserve at an LNG terminal is calculated using the following equation: Required reserve = Storage + Seasonal differentials + LNG for receiving + LNG Vessel Capacity Although the quantity maintained in storage may vary depending on the importance to consumers of a continuous supply for power and gas, and our assessment of the risks present in the LNG chain, for the purposes of this report we assume a storage amount plus LNG for receiving equal to 15 days average daily send-out. Accordingly, if we assume an annual handling volume of 2.44 million tons (in 2030), storage would be: 2.44 million t/y ÷ 0.46 t/m3 ÷ 365 d/y × 15 days = 220,000 kl Considering the climate in the Philippines, we may disregard seasonal differentials. For greater transportation efficiency, a large LNG vessel (263,000 kl) is presumed. Thus, the requisite LNG in storage is
7-4
220,000 kl + 263,000kl = 483,000 kl. If we assume a 180,000 kl LNG storage with a dead capacity of 3% (the amount that can not be sent out by LNG pumps), the number of tanks required would be four, according to the following equation:
483,000 kl/(180,000 ×0.97) = 2.6 Hence, in 2030, three 180,000 kl LNG storages should be deployed. If we assume, with the same calculation as in 2020, two 180,000 kl LNG storages are also needed. (3) LNG Pumps Table 7.2-1 shows the maximum amount of send-out rate. Operating rate of the power plants is calculated at 80%, but we estimate the maximum amount of send-out rate using the data which all power plants are running
Table 7.2-1 Maximum Amount of Send-out Rate Year Power Industry Transport Total
2020 0 63 12 752021 0 67 14 812022 83 71 16 1702023 83 74 19 1762024 166 78 21 2652025 166 81 23 2712026 166 85 28 2792027 166 89 33 2872028 166 92 37 2962029 166 96 42 3042030 166 100 47 312
Source: Formulated by JICA study team
The number of LNG pumps to be established is determined by the maximum amount of send-out rate. If we assume the primary (1ry) pump has a capacity of 150 t/h, and the secondary (2ry) pump capacity 150 t/h, the number of pumps required in a terminal would be five which is included two back-up pumps.
7.2.3 LNG Vaporizers (1) Types of LNG Vaporizer A vaporiser uses seawater as a LNG heating source, because LNG terminals are mostly constructed along seashores. An open rack-type LNG vaporiser (hereinafter abbreviated as ORV) and a shell & tube-type LNG vaporiser (hereinafter abbreviated as STV) are currently available as LNG vaporizers using seawater as the LNG heating source. In addition, a submerged-type LNG vaporiser (hereinafter abbreviated as SMV) is also available, which recycles the heat that results from LNG combustion. Generally, either ORV or STV is employed considering running costs. On the other hand, the SMV is adopted as a countermeasure against peak gas demand. This study adopts the ORV, which is adopted world-wide, taking comprehensive consideration of operability, maintainability, and cost. However, depending on the sea condition (in case, concentration of suspended matter is high), there is the potential to adopt the SMV. (2) Calculating Required Numbers
7-5
The capacities of LNG vaporizers are determined by the maximum send-out rate per hour. Using ORV (open rack vaporizer) with a send-out capacity of 150 t/h, the number of vaporizers required would be: 312 t/h ÷ 150 t/h・unit = 2.1. If we were to use one back-up vaporizer, the number would increase to 4. 7.2.4 BOG (boil-off gas) Treatment Facilities (1) BOG Generation Factors influencing BOG generation include: 1) BOG due to spontaneous heat input to LNG tanks and pipes; 2) BOG due to heat loss of rotating equipment including LNG pumps; 3) BOG when unloading from an LNG tanker; and, 4) BOG from unloading arms. Because (1) is permanently generated, the following is assumed. 1.5 t/h・tank unit + 2.5 t/h (piping) BOG generated when unloading tanks is assumed to be 10 t/h. The rate of BOG generation with unloading operation would be 17.0t/h and without unloading operation 7.0t/h in 2030. The rate of BOG generation with unloading operation would be 15.5t/h and without unloading operation 5.5t/h in 2020. (2) BOG Reliquefaction Facilities When there is sufficient LNG send-out to meet needs, BOG may be reliquefied by mixing it with LNG. Suppose BOG can be reliquefied using the amount of LNG which corresponds to 30% of the average send out rate. Since, to be reliquefied, a ton of BOG needs 7 tons, the amount of BOG which can be reliquefied can be calculated. (See Table 7.2-2)
Table 7.2-2 Amount of BOG Reliquefaction Year 2020 2030
Imported LNG (million t/year) 0.658 2.443 Maximum send-out rate (t/h) 75 312 Minimum send-out rate (t/h) 23 94 Available BOG reliquefied (t/h) 3.2 13.3
Source: Formulated by JICA study team (3) Types of BOG Compressor A reciprocal compressor and a centrifugal compressor are generally used in LNG receiving terminals. These two types of compressor are compared in Appendix. The operability of the reciprocating compressor is better than the centrifugal compressor for both start-stop and cool down performance. On the other hand, the centrifugal compressor is excellent in terms of maintainability and is more compact than the reciprocating compressor. From the comparative results, this study adopts the reciprocating type with the good operability and low power cost. (4) BOG Compressors and Reliquefaction Facilities Installation Plan Assuming a capacity of 10 t/h for a BOG compressor capable of raising the atmospheric pressure to 1.0 MPaG, the number of compressors required would be
13.3t/h÷10 t/h・unit = 1.3 unit
7-6
Accordingly, in all cases, the number of compressors required would be 2. If we include one back-up compressor, the number would be 3. BOG which is not reliquefied by reliquefaction facilities have to be compressed to mix gas line. The maximum rate will be 12.3 ton / h in case of unloading operation in 2020. When we adopt a BOG compressor (High pressure) with a maximum capacity of 5 ton / h, the number of required BOG compressors would be: 12.3 t/h ÷ 5 t/h・unit = 2.7. Specifications of the BOG treatment facilities are provided in Tables 7-2-3.
Table 7.2-3 BOG Treatment Facilities
Year 2020 2030 Number of BOG compressor units (Low pressure)
2 3
Number of BOG compressor units (High pressure)
3 3
Number of BOG reliquefaction units
2 2
BOG reliquefaciton capacity (t/h) Max 3.2 Max 13.3 Source: Formulated by JICA study team
7.2.5 Seawater Facilities (1) Required Seawater Volume Seawater facilities supply water drawn from the sea to a vaporizer and a disaster control facility. Supply capacity depends upon the number of vaporizers. Assuming the design seawater temperature to be 10℃, the required seawater volume for an open rack vaporizer (our plan) would be
35t/t-LNG.
Accordingly, the volume of seawater required for one vaporizer would be 150 t/h × 35 = 5,250 m3/h・unit.
Table 7.2-4 indicates the volume of seawater required for vaporizers, together with that for the seawater electrolyte and the disaster-control facility. The volume for disaster-control is based on a disaster affecting one tank.
Table 7.2-4 Required Sea Water Volume for Vaporizers and Chlorinator
Equipment Year 2020 2030
Number of vaporizer units 2(1) 4(1) Sea water volume for vaporizers
(m3/h ) 5,250 15,750
Sea water volume for chlorinator equipment(m3/h ) 150 150 Sea water for disaster prevention
(m3/h ) 5,200 5,200
Source: Formulated by JICA study team
(2) Seawater Pumps and Seawater Lines Seawater pumps for vaporizers are with 7,000 m3/h of capacity and 30 m of lift with two back-ups, booster pumps for disaster control are centrifugal types with 3,000 m3/h of capacity and 80 m of lift with one back-up. The intake is installed where the required water depth is assured, taking into account ocean topography, currents, and waves. For greater reliability, one back-up should be included for the intake and intake line. The diameter of the intake
7-7
opening is based on a maximum flow of 0.2 m/s, and that of the seawater main pipe on a maximum flow of 2 m/s. We take the supply for the Malampaya into consideration because expansion of sea water facilities is not easy. Specifications of the main seawater facilities are provided in Table 7.2-5.
Table 7.2-5 Sea Water Facilities Plan Year 2020 2030
Number of sea water pumps 3(2) 5(2) Number of booster pumps for disaster prevention
3(1) 3(1)
Sea water intake end portion 9000φ
1 1
Sea water main pipeline 2800φ
2(1) 2(1)
Note: Numbers in parentheses show the number of back-up pumps. Source: Formulated by JICA study team 7.2.6 Gas Send-out Facilities (1) Odorizers The Gas Utility Industry Law in Japan requires that “the concentration of city gas must be at a level that is detectable when diluted in the atmosphere at a volume of 1/1,000.” Ten mg/Nm3 of a mixture of DMS (dimethyl sulphide) and TBM (tertiary butyl mercaptan), which Osaka Gas uses, will be employed as an odorizer. A facility plan assuming an odorizer tank capacity of thirty days’ worth is shown in Tables 7.2-6.
Table 7.2-6 Installation of Odorant Facilities Year 2020 2030
Imported LNG (million t/year)
0.658 2.433
Nominal LNG handling volume (million Nm3/day)
2.2 8.0
Odorant (kg/day) 22 80 Capacity of odorant tank (m3) 0.8 2.9
Note: Specific weight of odorant 0.827 Source: Formulated by JICA study team (2) Measurement and Quality Control The send-out pipe is equipped with measuring instruments and quality control devices. The orifice meter and the delta meter can be used to measure the volume of gas, and the calorimeter, the specific weight meter, and the analyzers including gas chromatography can be used to control quality. 7.2.7 Utility Facilities A list of the required utility facilities is provided in Table 7.2-7.
7-8
Table 7.2-7 Utility Facilities
Name of facility Specification Chilling water facilities 300m3/hunit×3 units Compressor for instrument air 1000m3/hunit×3 units Nitrogen facilities 20m3/hunit×2 units Portable water facilities 500m3 Sewage treatment facilities 20m3/day
Source: Formulated by JICA study team 7.2.8 Electrical Equipment (1) Basic Design Concept The capacity of the power-receiving equipment must accommodate the future maximum power demand. To manufacture and supply gas during regular maintenance periods, two systems will be necessary for the power-receiving equipment. One system should be usually used, and in case of blackout, the system should be switched after gas supply is stopped. The distribution equipment should be separated according to the equipments. The importance equipments, such as loading, should be able to access to electricity in case of the maintenance. The importance equipments should be able to access to the emergency power generation equipment. Emergency power should be installed 100% back up. If commercial power fails, back-up power needs to be secured by means of back-up power generation equipment. The capacity of this power generation equipment must be large enough to operate disaster-control facilities. Monitoring and control must be centralized. (2) Power Demand The integration of electric power for gas manufacture/supply and maintenance is shown below.
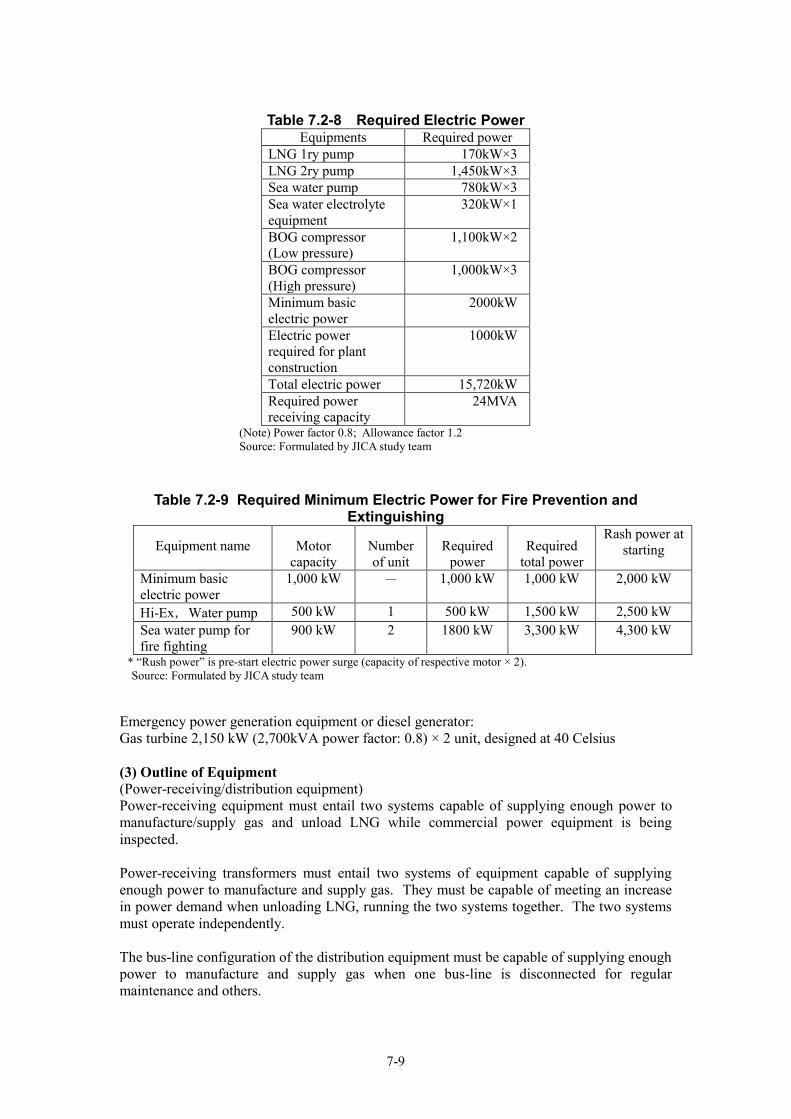
7-9
Table 7.2-8 Required Electric Power
Equipments Required power LNG 1ry pump 170kW×3 LNG 2ry pump 1,450kW×3 Sea water pump 780kW×3 Sea water electrolyte equipment
320kW×1
BOG compressor (Low pressure)
1,100kW×2
BOG compressor (High pressure)
1,000kW×3
Minimum basic electric power
2000kW
Electric power required for plant construction
1000kW
Total electric power 15,720kW Required power receiving capacity
24MVA
(Note) Power factor 0.8; Allowance factor 1.2 Source: Formulated by JICA study team
Table 7.2-9 Required Minimum Electric Power for Fire Prevention and Extinguishing
Equipment name Motor capacity
Number of unit
Required power
Required total power
Rash power at starting
Minimum basic electric power
1,000 kW - 1,000 kW 1,000 kW 2,000 kW
Hi-Ex,Water pump 500 kW 1 500 kW 1,500 kW 2,500 kW Sea water pump for fire fighting
900 kW 2 1800 kW 3,300 kW 4,300 kW
* “Rush power” is pre-start electric power surge (capacity of respective motor × 2). Source: Formulated by JICA study team
Emergency power generation equipment or diesel generator: Gas turbine 2,150 kW (2,700kVA power factor: 0.8) × 2 unit, designed at 40 Celsius (3) Outline of Equipment (Power-receiving/distribution equipment) Power-receiving equipment must entail two systems capable of supplying enough power to manufacture/supply gas and unload LNG while commercial power equipment is being inspected. Power-receiving transformers must entail two systems of equipment capable of supplying enough power to manufacture and supply gas. They must be capable of meeting an increase in power demand when unloading LNG, running the two systems together. The two systems must operate independently. The bus-line configuration of the distribution equipment must be capable of supplying enough power to manufacture and supply gas when one bus-line is disconnected for regular maintenance and others.
7-10
The equipment supplies power to large motors and regional transforming equipment. Power is supplied to regional transforming equipment via two systems.
1) Power-receiving equipment Method 69 kV – 60 Hz, two lines (permanent, reserve) Capacity 50 MVA/line (420 A) Type GIS (gas insulation switch gear), installed outdoors
2) Power-receiving/transformer
Capacity 25 MVA x 2 Type 69 kV/6.24 kV, hydraulic self-cooling, installed outdoors Operation Operate two systems independently
3) Distribution equipment Type Single bus line divided into five System Metal-clad switchgear, installed indoors Operation Operate two systems independently (Areal transforming equipment) Areal transforming equipment is responsible for supplying power to small- and medium-sized motors and lighting equipment. The bus-line configuration of the distribution equipment must be capable of supplying enough power to manufacture and supply gas when one bus-line is disconnected for regular maintenance and others. 1) Areal transforming equipment - Metal-clad switchgear, installed indoors - Use combination starter for high-voltage distribution equipment - Operate two systems independently
- Transformer for distribution Power 6.24 kV/440 V, Lighting 6.24 kV/110-220 V, installed outdoors
(Building for substation room) The substation room must be of the enclosed type, ferro-concrete, and equipped with an air-conditioner. The transformer should be installed outside. (Distribution in the plant) Cables must be constructed in an open-pit. Fire-retardant CV cables must be used. 7.2.9 Control and Supervision Systems (1) Design Policy This LNG terminal has the responsibility to maintain a stable gas send-out capability according to varying gas demand for town gas consumption, electric power generation, and NGV vehicles. The process control and supervision system must consider the following items.
Gas send-out reliability and system and facilities redundancy in case of mal function or incident.
Terminal management efficiency and labor reduction. Easy and efficiency maintenance.
7-11
Easy and efficiency system expansion according to increment of gas demand in future and system hardware replacement almost every 15 years.
Adoption of experienced and proven technology, especially the integrated information system.
So, this system is based on Distributed Control System (DCS), Safety Interlock System (SIS), and Plant Information Management System (PIMS). (2) System Composition. To realize stable, reliable, and efficient management of latest LNG terminal, several systems will be required, and all system information shall be integrated. Required major systems are as follows.
Distributed Control System (DCS) of LNG facilities that include high-voltage electric power supply equipments, and Plant Information Management System (PIMS).
Disaster prevention facilities control and supervision system for detecting LNG and/or gas leakage, fire detection and control of fire extinguisher and/or water deluge system of LNG tanks.
Fire and Gas System (F&G), Laboratory system for unloaded or storage LNG and gas analyzer for send-out gas.
Mooring monitoring system (MMS) included for weather, tidal and wave condition monitoring.
Unloading arm supervision system, which is closely related to arm operation. As an independent system, intruder supervision and alarm system for Guardhouse. Closed circuit television system for the entire terminal area. Paging system for the entire terminal area. Standalone system for software debugging when changing or adding programs, and
training of new operators. Note;
This system excludes Vessel Navigation System for harbors. This kind of navigation system is assumed to be controlled and supervised by a Governmental Organization or others. Also exclude personnel affairs, organizational management, financial data saver, and other systems related to company management. These systems shall be realized for office automation systems. Abbreviations
DCS = Distributed Control System SIS = Safety Interlock System F&G = Fire and Gas System MMS = Marine Monitoring System PMS = unloading arm Position Monitoring System ESD = Emergency Shut Down system PIMS = Plant Information Management System
(3) Design Concept 1) System Segregation and Integration.
DCS, SIS, F&G, and PIMS segregate each other and should be avoided interference in control level.
DCS segregate SSS (Safety and Security System), because of importance and operability in case of an accident.
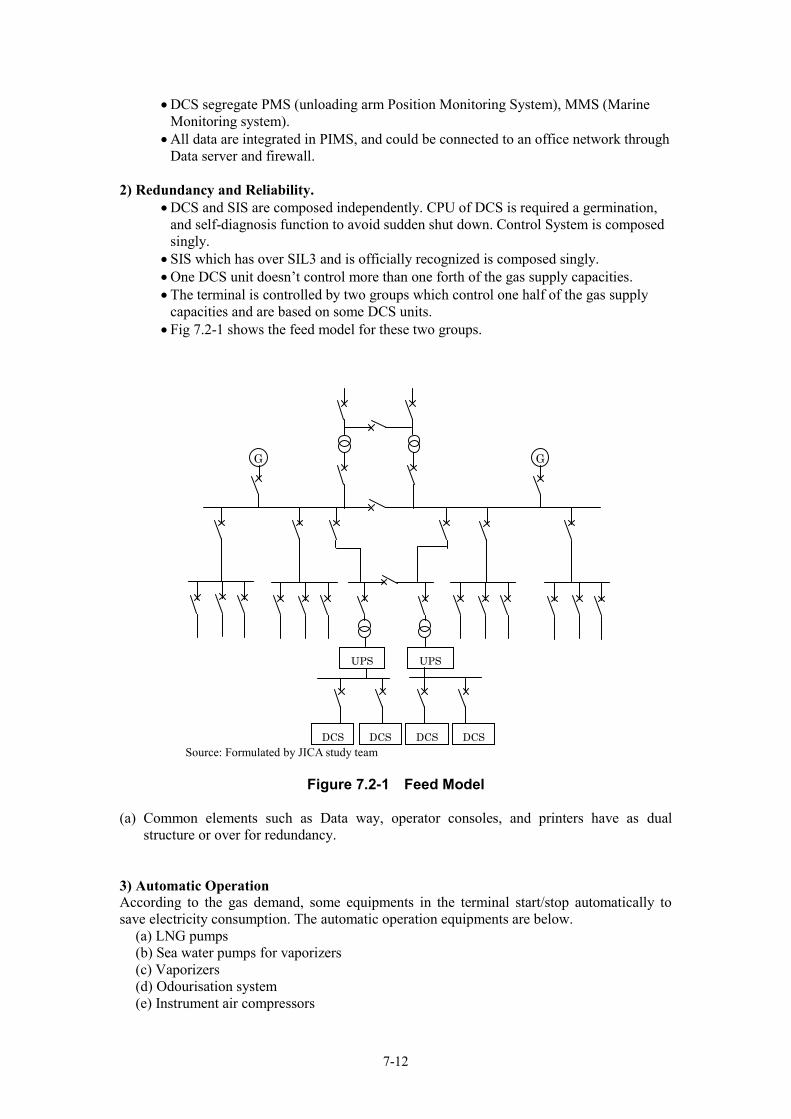
7-12
DCS segregate PMS (unloading arm Position Monitoring System), MMS (Marine Monitoring system).
All data are integrated in PIMS, and could be connected to an office network through Data server and firewall.
2) Redundancy and Reliability.
DCS and SIS are composed independently. CPU of DCS is required a germination, and self-diagnosis function to avoid sudden shut down. Control System is composed singly.
SIS which has over SIL3 and is officially recognized is composed singly. One DCS unit doesn’t control more than one forth of the gas supply capacities. The terminal is controlled by two groups which control one half of the gas supply
capacities and are based on some DCS units. Fig 7.2-1 shows the feed model for these two groups.
UPS UPS
DCS DCS DCS DCS
G G
Source: Formulated by JICA study team
Figure 7.2-1 Feed Model
(a) Common elements such as Data way, operator consoles, and printers have as dual
structure or over for redundancy. 3) Automatic Operation According to the gas demand, some equipments in the terminal start/stop automatically to save electricity consumption. The automatic operation equipments are below.
(a) LNG pumps (b) Sea water pumps for vaporizers (c) Vaporizers (d) Odourisation system (e) Instrument air compressors

7-13
(f) BOG reliquefaction facility These equipments are operated manually.
(a) Unloading arms (b) BOG compressors (c) Sea water pumps for hydrant (d) Utility Facility
4) Maintenance Most of the equipments have to be stopped for maintenance. Some extra operator consoles should be installed for maintenance. 7.2.10 Main Facilities and Layout Table 7.2-10 shows a list of the main facilities. Figure 7.2-2 shows the layout of LNG receiving terminals.
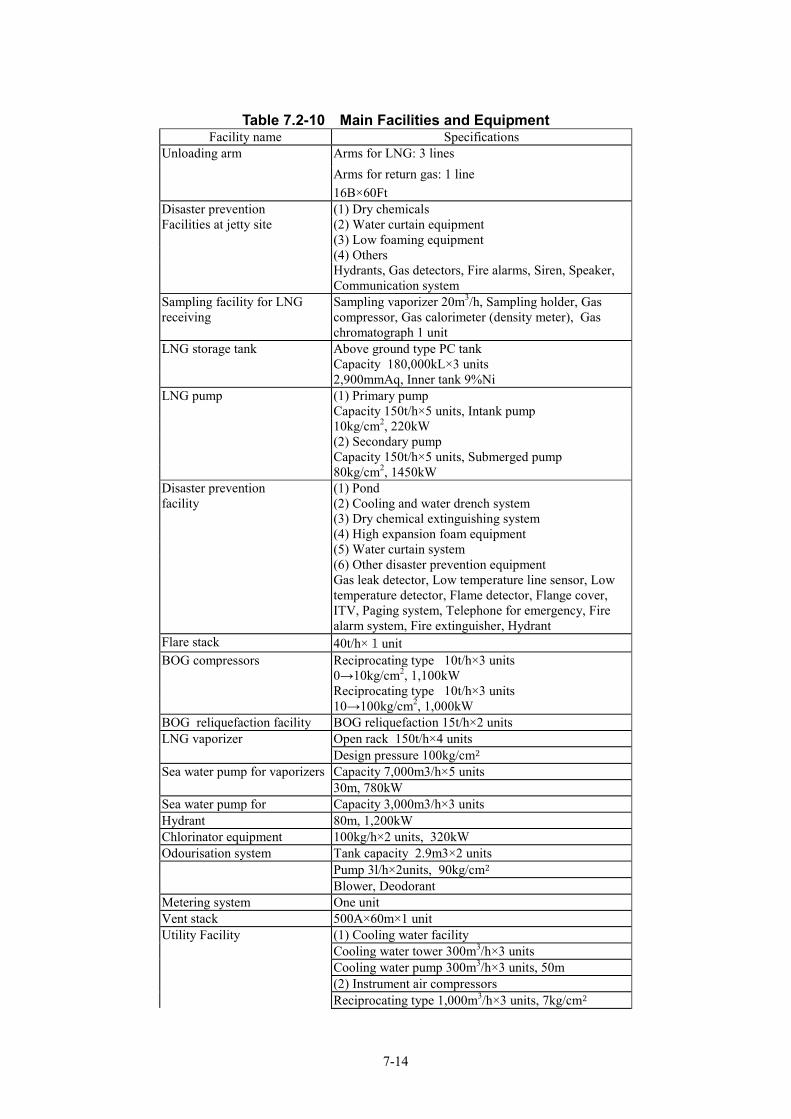
7-14
Table 7.2-10 Main Facilities and Equipment
Facility name Specifications Unloading arm Arms for LNG: 3 lines Arms for return gas: 1 line
16B×60Ft Disaster prevention (1) Dry chemicals Facilities at jetty site (2) Water curtain equipment (3) Low foaming equipment (4) Others Hydrants, Gas detectors, Fire alarms, Siren, Speaker,
Communication system Sampling facility for LNG receiving
Sampling vaporizer 20m3/h, Sampling holder, Gas compressor, Gas calorimeter (density meter), Gas chromatograph 1 unit
LNG storage tank Above ground type PC tank Capacity 180,000kL×3 units 2,900mmAq, Inner tank 9%Ni
LNG pump (1) Primary pump Capacity 150t/h×5 units, Intank pump 10kg/cm2, 220kW (2) Secondary pump Capacity 150t/h×5 units, Submerged pump 80kg/cm2, 1450kW
Disaster prevention (1) Pond facility (2) Cooling and water drench system
(3) Dry chemical extinguishing system (4) High expansion foam equipment (5) Water curtain system (6) Other disaster prevention equipment Gas leak detector, Low temperature line sensor, Low temperature detector, Flame detector, Flange cover, ITV, Paging system, Telephone for emergency, Fire alarm system, Fire extinguisher, Hydrant
Flare stack 40t/h×1unit BOG compressors Reciprocating type 10t/h×3 units 0→10kg/cm2, 1,100kW Reciprocating type 10t/h×3 units
10→100kg/cm2, 1,000kW BOG reliquefaction facility BOG reliquefaction 15t/h×2 units LNG vaporizer Open rack 150t/h×4 units
Design pressure 100kg/cm2 Sea water pump for vaporizers Capacity 7,000m3/h×5 units
30m, 780kW Sea water pump for Capacity 3,000m3/h×3 units Hydrant 80m, 1,200kW Chlorinator equipment 100kg/h×2 units, 320kW Odourisation system Tank capacity 2.9m3×2 units
Pump 3l/h×2units, 90kg/cm2 Blower, Deodorant
Metering system One unit Vent stack 500A×60m×1 unit Utility Facility (1) Cooling water facility
Cooling water tower 300m3/h×3 units Cooling water pump 300m3/h×3 units, 50m (2) Instrument air compressors Reciprocating type 1,000m3/h×3 units, 7kg/cm2
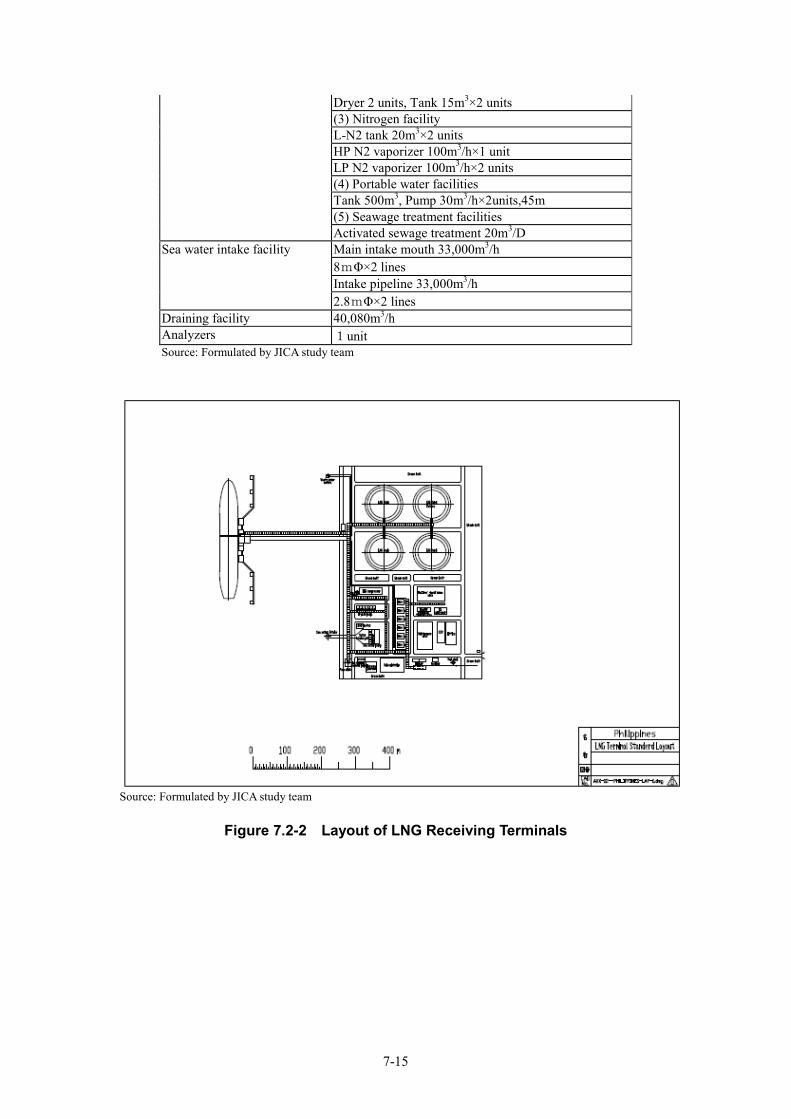
7-15
Dryer 2 units, Tank 15m3×2 units (3) Nitrogen facility L-N2 tank 20m3×2 units HP N2 vaporizer 100m3/h×1 unit LP N2 vaporizer 100m3/h×2 units (4) Portable water facilities Tank 500m3, Pump 30m3/h×2units,45m (5) Seawage treatment facilities Activated sewage treatment 20m3/D
Sea water intake facility Main intake mouth 33,000m3/h 8mΦ×2 lines Intake pipeline 33,000m3/h 2.8mΦ×2 lines
Draining facility 40,080m3/h Analyzers 1unit Source: Formulated by JICA study team
Source: Formulated by JICA study team
Figure 7.2-2 Layout of LNG Receiving Terminals
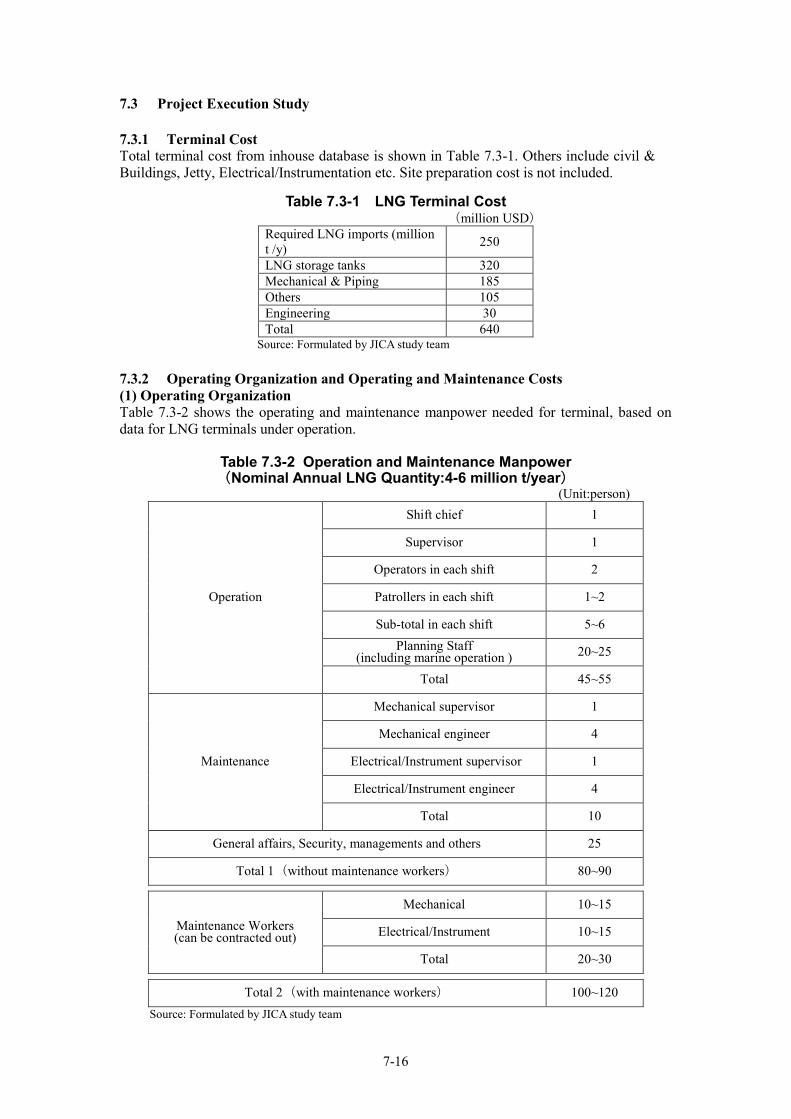
7-16
7.3 Project Execution Study 7.3.1 Terminal Cost Total terminal cost from inhouse database is shown in Table 7.3-1. Others include civil & Buildings, Jetty, Electrical/Instrumentation etc. Site preparation cost is not included.
Table 7.3-1 LNG Terminal Cost (million USD)
Required LNG imports (million t /y) 250
LNG storage tanks 320 Mechanical & Piping 185 Others 105 Engineering 30 Total 640
Source: Formulated by JICA study team 7.3.2 Operating Organization and Operating and Maintenance Costs (1) Operating Organization Table 7.3-2 shows the operating and maintenance manpower needed for terminal, based on data for LNG terminals under operation.
Table 7.3-2 Operation and Maintenance Manpower (Nominal Annual LNG Quantity:4-6 million t/year)
(Unit:person)
Operation
Shift chief 1
Supervisor 1
Operators in each shift 2
Patrollers in each shift 1~2
Sub-total in each shift 5~6 Planning Staff
(including marine operation ) 20~25
Total 45~55
Maintenance
Mechanical supervisor 1
Mechanical engineer 4
Electrical/Instrument supervisor 1
Electrical/Instrument engineer 4
Total 10
General affairs, Security, managements and others 25
Total 1(without maintenance workers) 80~90
Maintenance Workers (can be contracted out)
Mechanical 10~15
Electrical/Instrument 10~15
Total 20~30
Total 2(with maintenance workers) 100~120 Source: Formulated by JICA study team
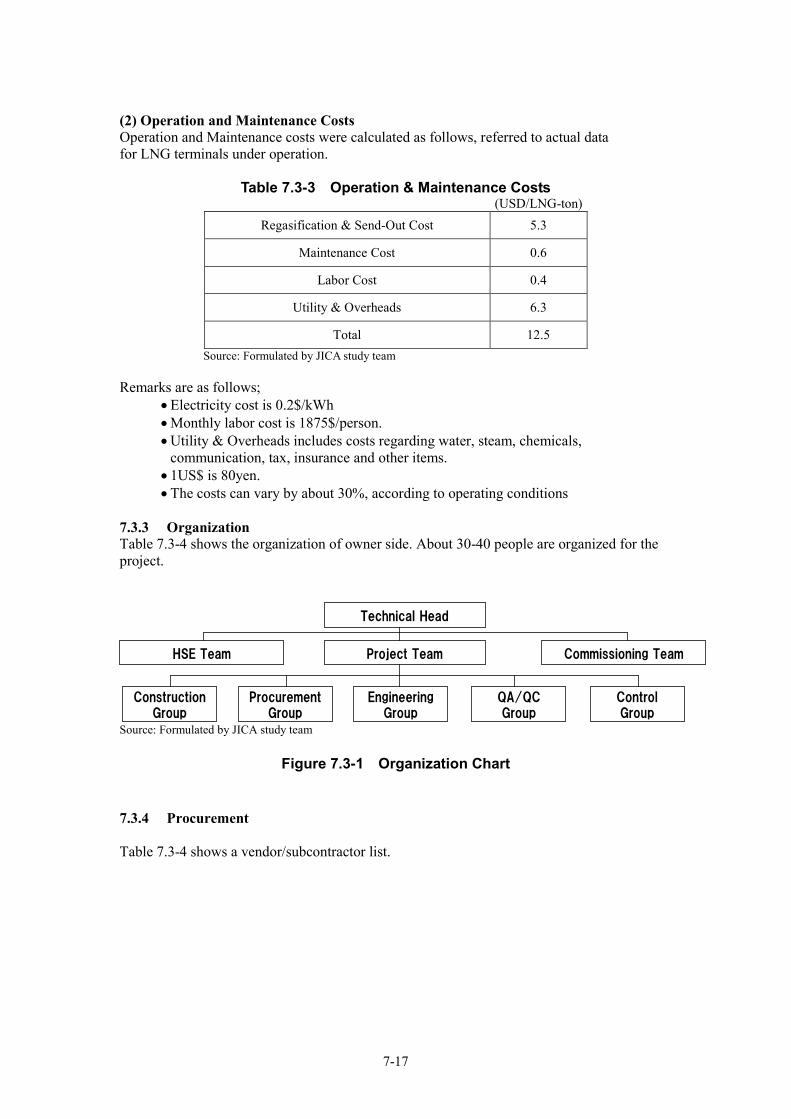
7-17
(2) Operation and Maintenance Costs Operation and Maintenance costs were calculated as follows, referred to actual data for LNG terminals under operation.
Table 7.3-3 Operation & Maintenance Costs
(USD/LNG-ton) Regasification & Send-Out Cost 5.3
Maintenance Cost 0.6
Labor Cost 0.4
Utility & Overheads 6.3
Total 12.5 Source: Formulated by JICA study team
Remarks are as follows;
Electricity cost is 0.2$/kWh Monthly labor cost is 1875$/person. Utility & Overheads includes costs regarding water, steam, chemicals,
communication, tax, insurance and other items. 1US$ is 80yen. The costs can vary by about 30%, according to operating conditions
7.3.3 Organization Table 7.3-4 shows the organization of owner side. About 30-40 people are organized for the project.
Technical Head
Project Team Commissioning TeamHSE Team
EngineeringGroup
ProcurementGroup
ConstructionGroup
QA/QCGroup
ControlGroup
Source: Formulated by JICA study team
Figure 7.3-1 Organization Chart 7.3.4 Procurement Table 7.3-4 shows a vendor/subcontractor list.
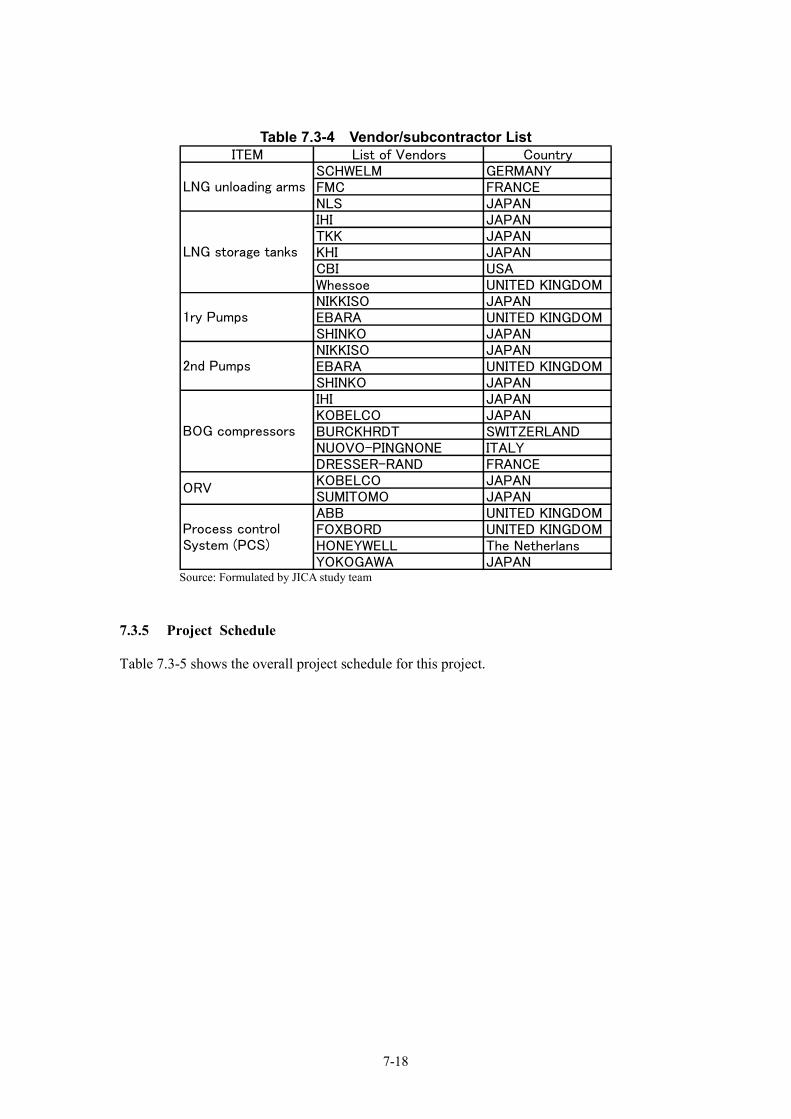
7-18
Table 7.3-4 Vendor/subcontractor List ITEM List of Vendors Country
SCHWELM GERMANYFMC FRANCENLS JAPANIHI JAPANTKK JAPANKHI JAPANCBI USAWhessoe UNITED KINGDOMNIKKISO JAPANEBARA UNITED KINGDOMSHINKO JAPANNIKKISO JAPANEBARA UNITED KINGDOMSHINKO JAPANIHI JAPANKOBELCO JAPANBURCKHRDT SWITZERLANDNUOVO-PINGNONE ITALYDRESSER-RAND FRANCEKOBELCO JAPANSUMITOMO JAPANABB UNITED KINGDOMFOXBORD UNITED KINGDOMHONEYWELL The NetherlansYOKOGAWA JAPAN
BOG compressors
Process controlSystem (PCS)
LNG storage tanks
LNG unloading arms
1ry Pumps
2nd Pumps
ORV
Source: Formulated by JICA study team
7.3.5 Project Schedule Table 7.3-5 shows the overall project schedule for this project.
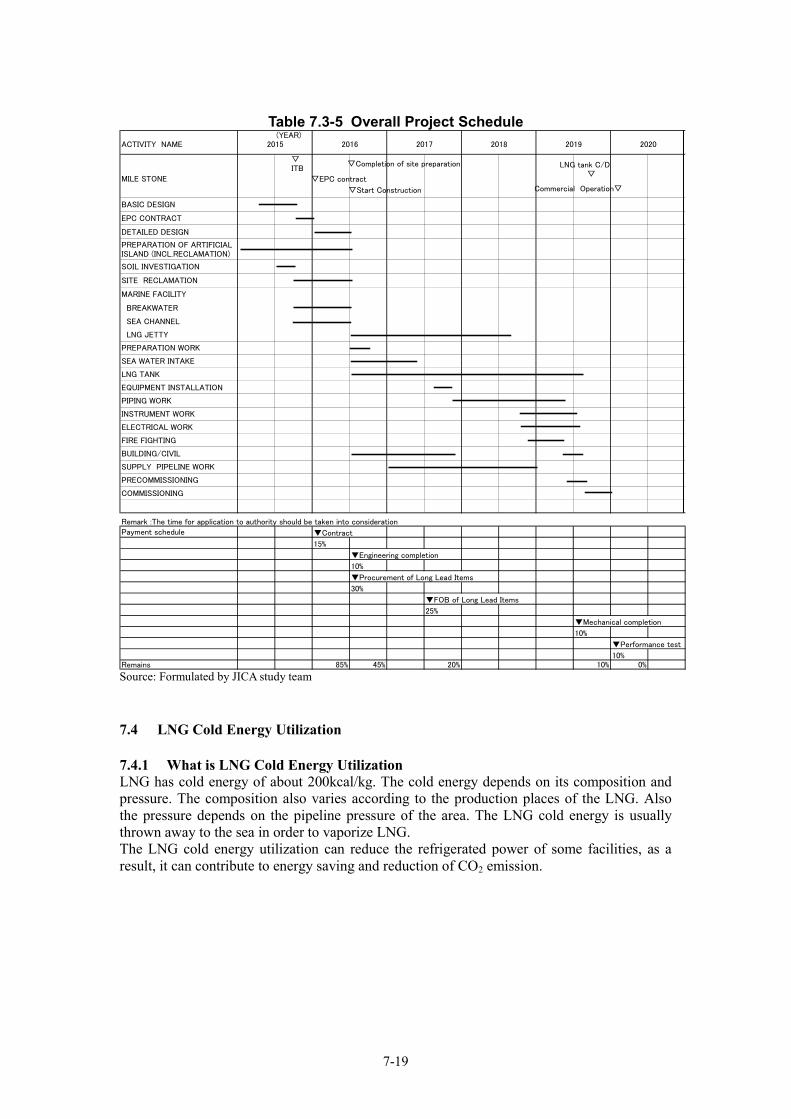
7-19
Table 7.3-5 Overall Project Schedule
(YEAR)ACTIVITY NAME 2015 2016 2017 2018 2019 2020
MILE STONE
BASIC DESIGN
EPC CONTRACT
DETAILED DESIGN
PREPARATION OF ARTIFICIALISLAND (INCL.RECLAMATION)
SOIL INVESTIGATION
SITE RECLAMATION
MARINE FACILITY
BREAKWATER
SEA CHANNEL
LNG JETTY
PREPARATION WORK
SEA WATER INTAKE
LNG TANK
EQUIPMENT INSTALLATION
PIPING WORK
INSTRUMENT WORK
ELECTRICAL WORK
FIRE FIGHTING
BUILDING/CIVIL
SUPPLY PIPELINE WORK
PRECOMMISSIONING
COMMISSIONING
Remark :The time for application to authority should be taken into consideration Payment schedule ▼Contract
15%
▼Engineering completion
10%
▼Procurement of Long Lead Items
30%
▼FOB of Long Lead Items
25%
▼Mechanical completion
10%
▼Performance test
10%Remains 85% 45% 20% 10% 0%
▽ITB
▽EPC contract
▽Start Construction
LNG tank C/D ▽
Commercial Operation▽
▽Completion of site preparation
Source: Formulated by JICA study team 7.4 LNG Cold Energy Utilization 7.4.1 What is LNG Cold Energy Utilization LNG has cold energy of about 200kcal/kg. The cold energy depends on its composition and pressure. The composition also varies according to the production places of the LNG. Also the pressure depends on the pipeline pressure of the area. The LNG cold energy is usually thrown away to the sea in order to vaporize LNG. The LNG cold energy utilization can reduce the refrigerated power of some facilities, as a result, it can contribute to energy saving and reduction of CO2 emission.
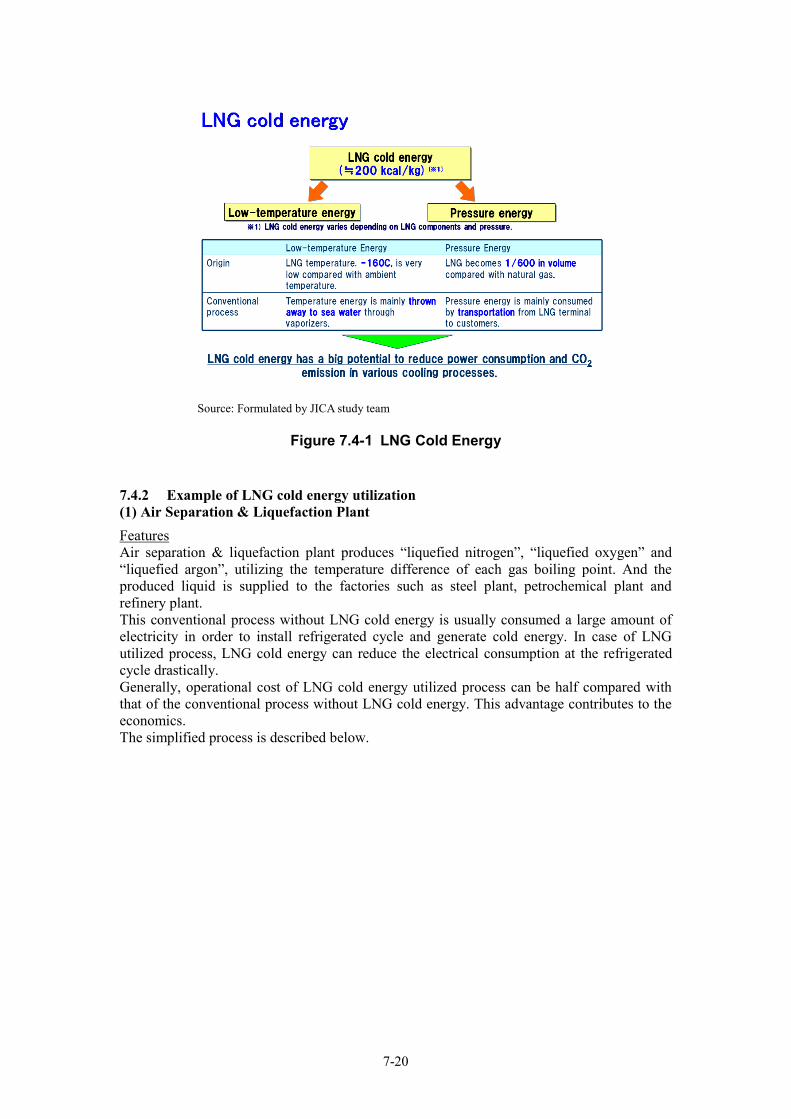
7-20
Source: Formulated by JICA study team
Figure 7.4-1 LNG Cold Energy
7.4.2 Example of LNG cold energy utilization (1) Air Separation & Liquefaction Plant Features Air separation & liquefaction plant produces “liquefied nitrogen”, “liquefied oxygen” and “liquefied argon”, utilizing the temperature difference of each gas boiling point. And the produced liquid is supplied to the factories such as steel plant, petrochemical plant and refinery plant. This conventional process without LNG cold energy is usually consumed a large amount of electricity in order to install refrigerated cycle and generate cold energy. In case of LNG utilized process, LNG cold energy can reduce the electrical consumption at the refrigerated cycle drastically. Generally, operational cost of LNG cold energy utilized process can be half compared with that of the conventional process without LNG cold energy. This advantage contributes to the economics. The simplified process is described below.
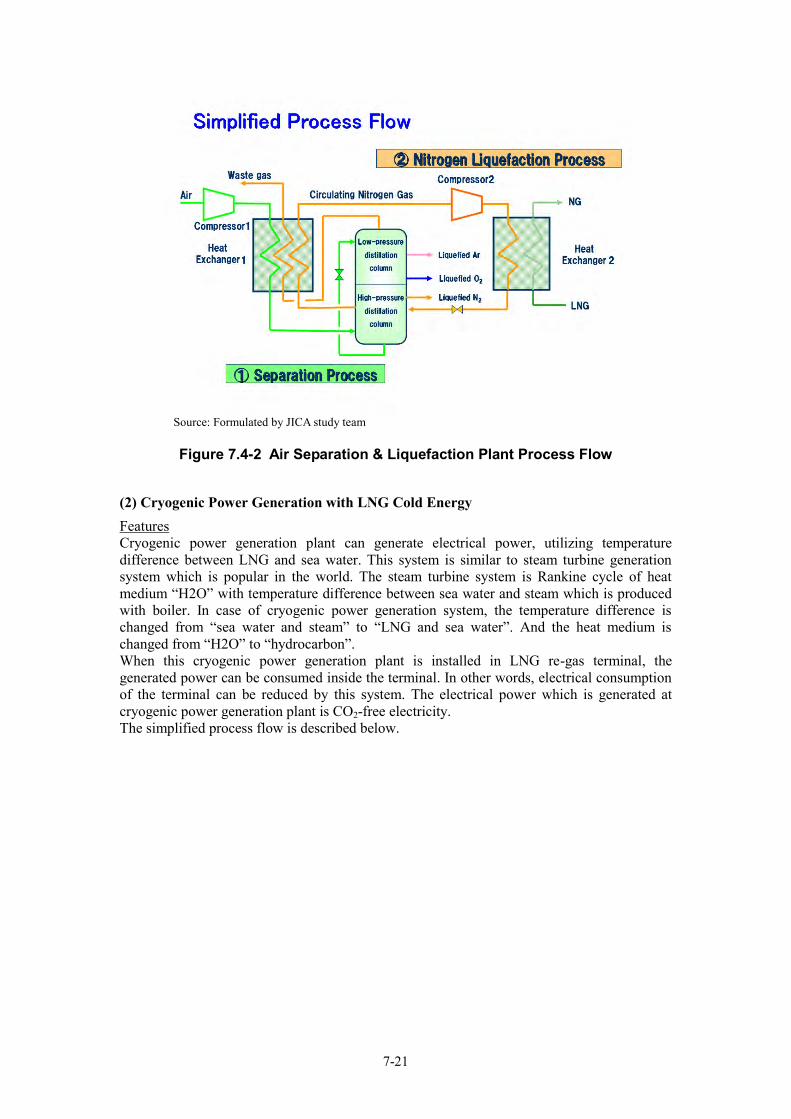
7-21
Source: Formulated by JICA study team
Figure 7.4-2 Air Separation & Liquefaction Plant Process Flow
(2) Cryogenic Power Generation with LNG Cold Energy Features Cryogenic power generation plant can generate electrical power, utilizing temperature difference between LNG and sea water. This system is similar to steam turbine generation system which is popular in the world. The steam turbine system is Rankine cycle of heat medium “H2O” with temperature difference between sea water and steam which is produced with boiler. In case of cryogenic power generation system, the temperature difference is changed from “sea water and steam” to “LNG and sea water”. And the heat medium is changed from “H2O” to “hydrocarbon”. When this cryogenic power generation plant is installed in LNG re-gas terminal, the generated power can be consumed inside the terminal. In other words, electrical consumption of the terminal can be reduced by this system. The electrical power which is generated at cryogenic power generation plant is CO2-free electricity. The simplified process flow is described below.
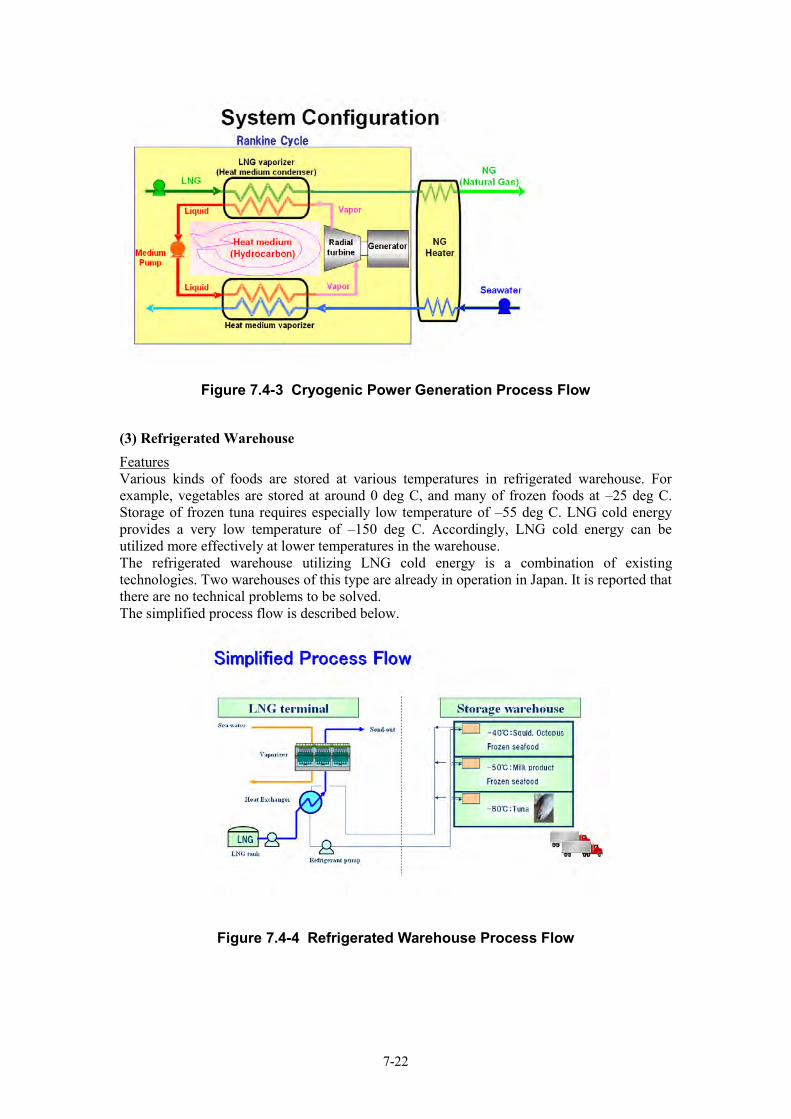
7-22
Figure 7.4-3 Cryogenic Power Generation Process Flow
(3) Refrigerated Warehouse Features Various kinds of foods are stored at various temperatures in refrigerated warehouse. For example, vegetables are stored at around 0 deg C, and many of frozen foods at –25 deg C. Storage of frozen tuna requires especially low temperature of –55 deg C. LNG cold energy provides a very low temperature of –150 deg C. Accordingly, LNG cold energy can be utilized more effectively at lower temperatures in the warehouse. The refrigerated warehouse utilizing LNG cold energy is a combination of existing technologies. Two warehouses of this type are already in operation in Japan. It is reported that there are no technical problems to be solved. The simplified process flow is described below.
Figure 7.4-4 Refrigerated Warehouse Process Flow
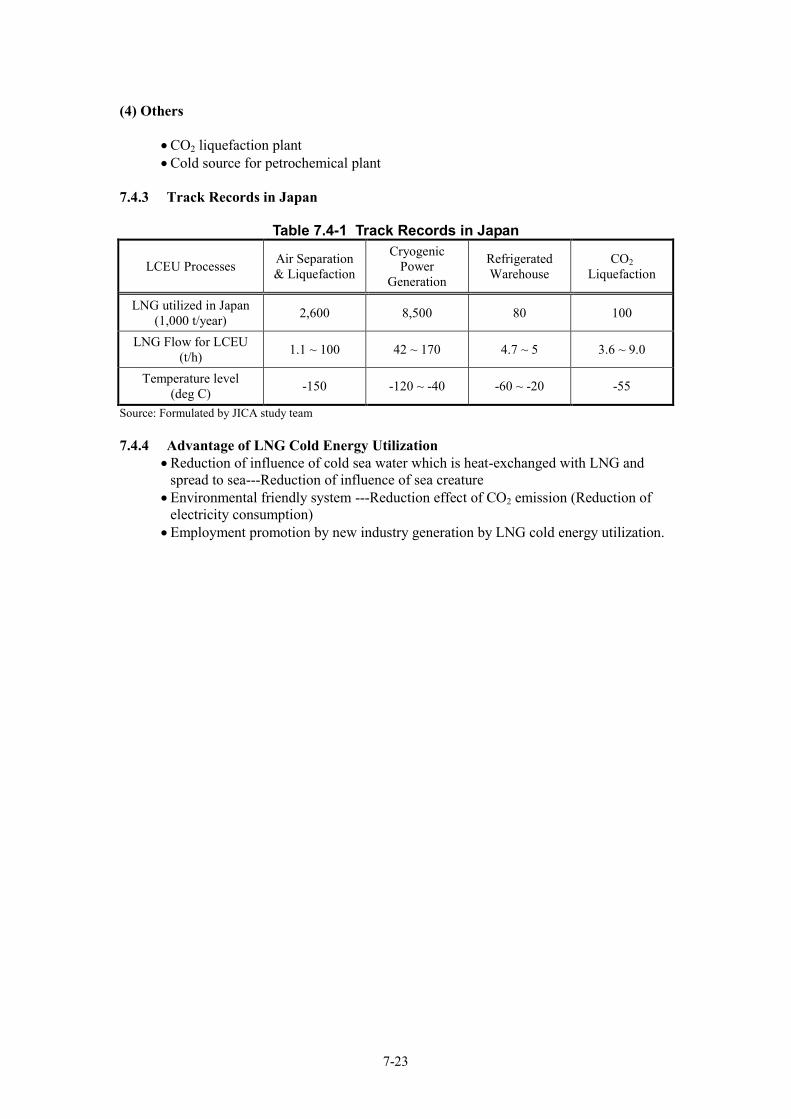
7-23
(4) Others
CO2 liquefaction plant Cold source for petrochemical plant
7.4.3 Track Records in Japan
Table 7.4-1 Track Records in Japan
LCEU Processes Air Separation & Liquefaction
Cryogenic Power
Generation
Refrigerated Warehouse
CO2 Liquefaction
LNG utilized in Japan (1,000 t/year) 2,600 8,500 80 100
LNG Flow for LCEU (t/h) 1.1 ~ 100 42 ~ 170 4.7 ~ 5 3.6 ~ 9.0
Temperature level (deg C) -150 -120 ~ -40 -60 ~ -20 -55
Source: Formulated by JICA study team 7.4.4 Advantage of LNG Cold Energy Utilization
Reduction of influence of cold sea water which is heat-exchanged with LNG and spread to sea---Reduction of influence of sea creature
Environmental friendly system ---Reduction effect of CO2 emission (Reduction of electricity consumption)
Employment promotion by new industry generation by LNG cold energy utilization.

7-24
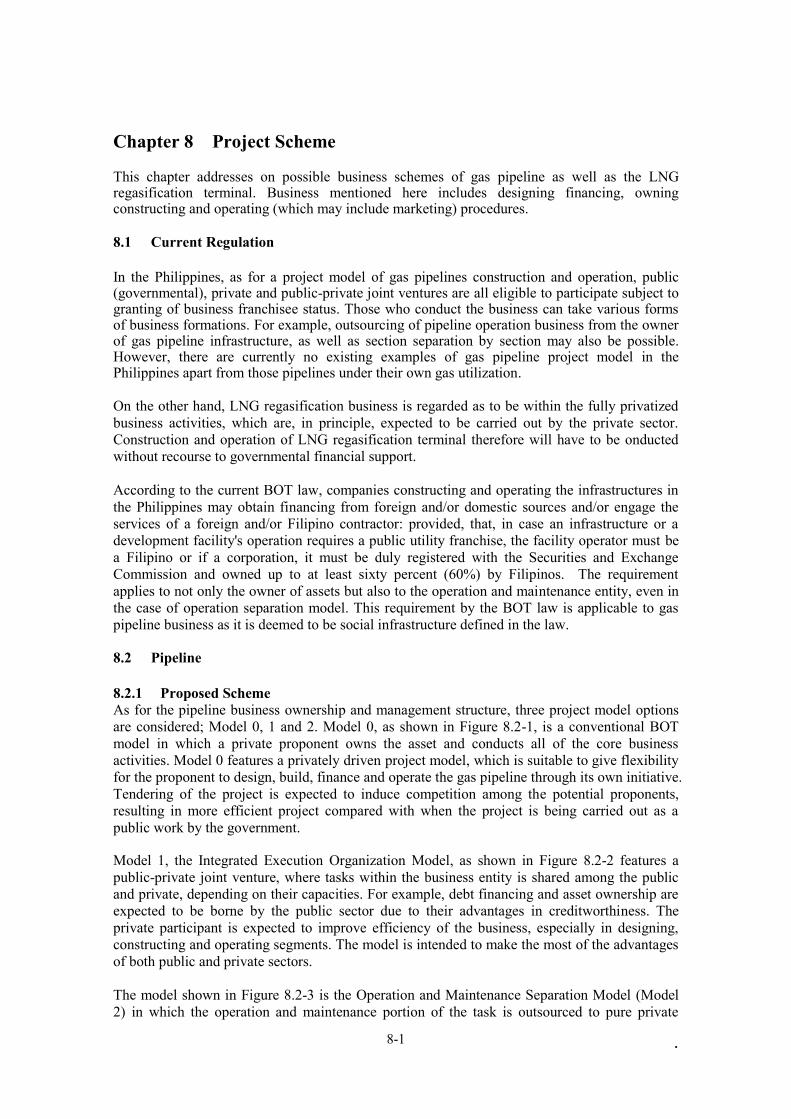
. 8-1
Chapter 8 Project Scheme This chapter addresses on possible business schemes of gas pipeline as well as the LNG regasification terminal. Business mentioned here includes designing financing, owning constructing and operating (which may include marketing) procedures. 8.1 Current Regulation In the Philippines, as for a project model of gas pipelines construction and operation, public (governmental), private and public-private joint ventures are all eligible to participate subject to granting of business franchisee status. Those who conduct the business can take various forms of business formations. For example, outsourcing of pipeline operation business from the owner of gas pipeline infrastructure, as well as section separation by section may also be possible. However, there are currently no existing examples of gas pipeline project model in the Philippines apart from those pipelines under their own gas utilization. On the other hand, LNG regasification business is regarded as to be within the fully privatized business activities, which are, in principle, expected to be carried out by the private sector. Construction and operation of LNG regasification terminal therefore will have to be onducted without recourse to governmental financial support. According to the current BOT law, companies constructing and operating the infrastructures in the Philippines may obtain financing from foreign and/or domestic sources and/or engage the services of a foreign and/or Filipino contractor: provided, that, in case an infrastructure or a development facility's operation requires a public utility franchise, the facility operator must be a Filipino or if a corporation, it must be duly registered with the Securities and Exchange Commission and owned up to at least sixty percent (60%) by Filipinos. The requirement applies to not only the owner of assets but also to the operation and maintenance entity, even in the case of operation separation model. This requirement by the BOT law is applicable to gas pipeline business as it is deemed to be social infrastructure defined in the law. 8.2 Pipeline 8.2.1 Proposed Scheme As for the pipeline business ownership and management structure, three project model options are considered; Model 0, 1 and 2. Model 0, as shown in Figure 8.2-1, is a conventional BOT model in which a private proponent owns the asset and conducts all of the core business activities. Model 0 features a privately driven project model, which is suitable to give flexibility for the proponent to design, build, finance and operate the gas pipeline through its own initiative. Tendering of the project is expected to induce competition among the potential proponents, resulting in more efficient project compared with when the project is being carried out as a public work by the government. Model 1, the Integrated Execution Organization Model, as shown in Figure 8.2-2 features a public-private joint venture, where tasks within the business entity is shared among the public and private, depending on their capacities. For example, debt financing and asset ownership are expected to be borne by the public sector due to their advantages in creditworthiness. The private participant is expected to improve efficiency of the business, especially in designing, constructing and operating segments. The model is intended to make the most of the advantages of both public and private sectors. The model shown in Figure 8.2-3 is the Operation and Maintenance Separation Model (Model 2) in which the operation and maintenance portion of the task is outsourced to pure private
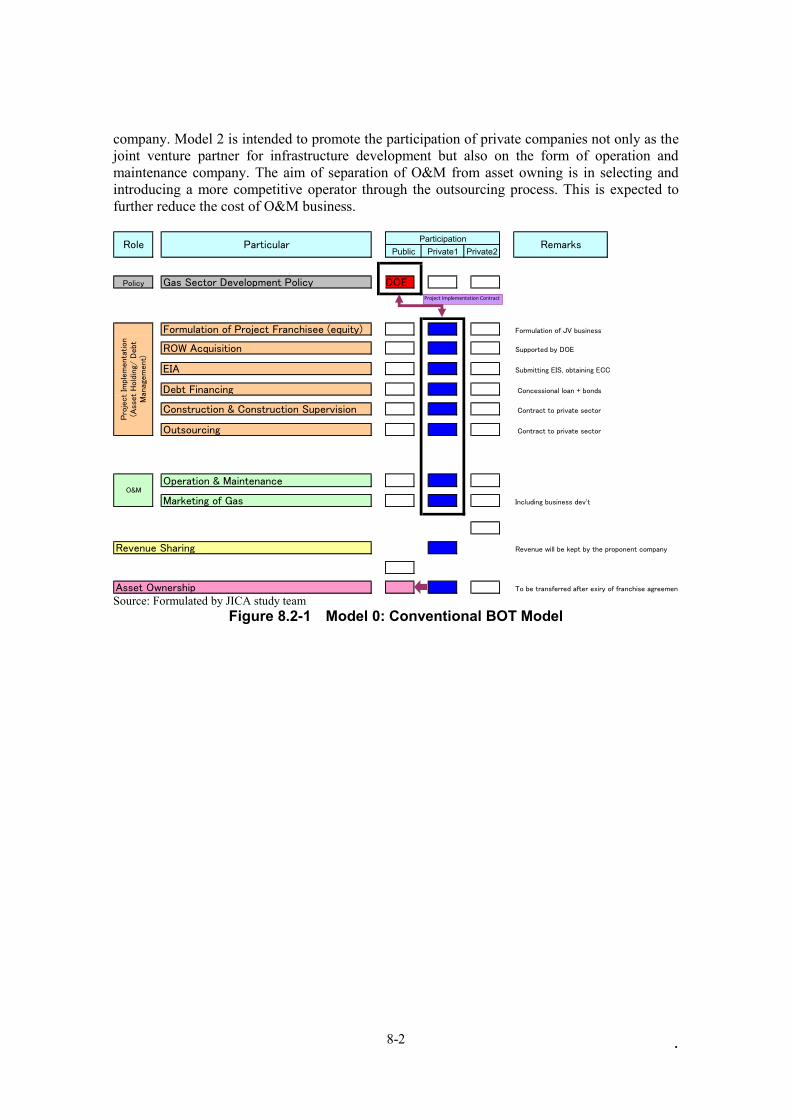
. 8-2
company. Model 2 is intended to promote the participation of private companies not only as the joint venture partner for infrastructure development but also on the form of operation and maintenance company. The aim of separation of O&M from asset owning is in selecting and introducing a more competitive operator through the outsourcing process. This is expected to further reduce the cost of O&M business.
Policy Gas Sector Development Policy DOE
Formulation of Project Franchisee (equity) Formulation of JV business
ROW Acquisition Supported by DOE
EIA Submitting EIS, obtaining ECC
Debt Financing Concessional loan + bonds
Construction & Construction Supervision Contract to private sector
Outsourcing Contract to private sector
Operation & Maintenance
Marketing of Gas Including business dev't
Revenue will be kept by the proponent company
Asset Ownership To be transferred after exiry of franchise agreement
Revenue Sharing
Pro
ject
Impl
em
enta
tion
(Ass
et
Hold
ing/
Debt
Man
agem
ent)
O&M
Role Particular RemarksPublic Private2
ParticipationPrivate1
Project Implementation Contract
Source: Formulated by JICA study team
Figure 8.2-1 Model 0: Conventional BOT Model
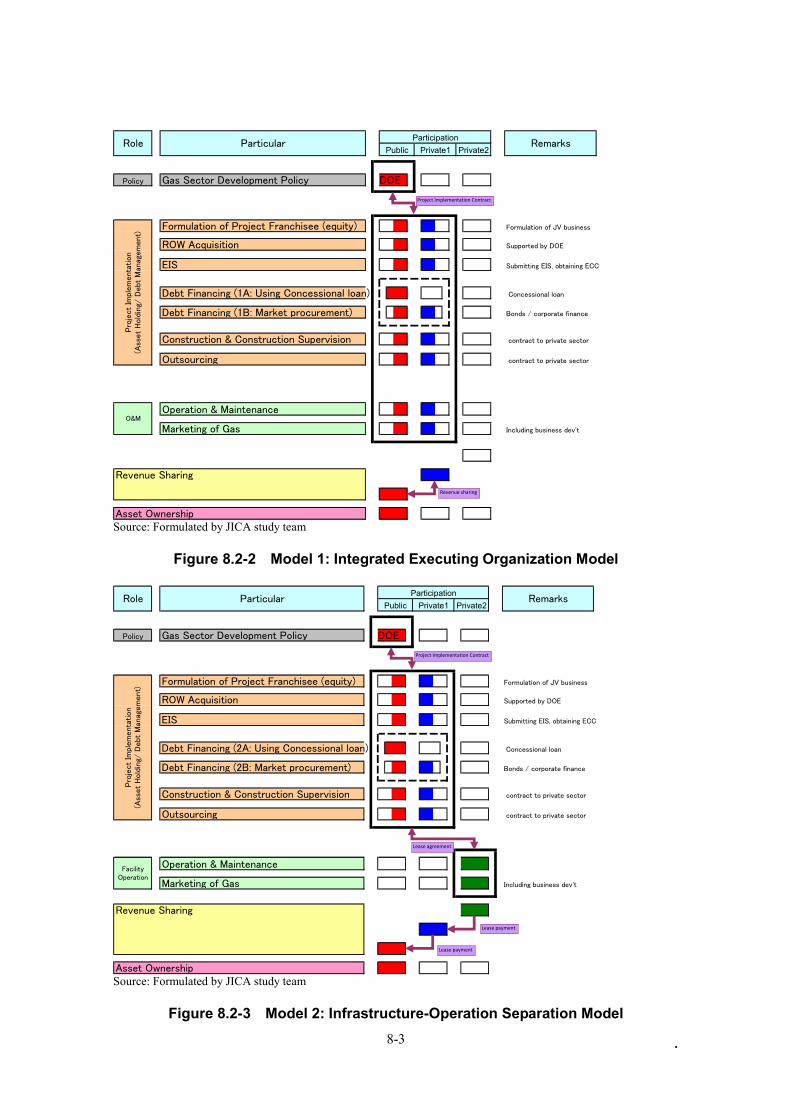
. 8-3
Policy Gas Sector Development Policy DOE
Formulation of Project Franchisee (equity) Formulation of JV business
ROW Acquisition Supported by DOE
EIS Submitting EIS, obtaining ECC
Debt Financing (1A: Using Concessional loan) Concessional loan
Debt Financing (1B: Market procurement) Bonds / corporate finance
Construction & Construction Supervision contract to private sector
Outsourcing contract to private sector
Operation & Maintenance
Marketing of Gas Including business dev't
Revenue Sharing
Asset Ownership
ParticipationPrivate1
RemarksPublic Private2
O&M
Role Particular
Pro
ject
Impl
em
enta
tion
(Ass
et
Hold
ing/
Debt
Man
agem
ent)
Project Implementation Contract
Revenue sharing
Source: Formulated by JICA study team
Figure 8.2-2 Model 1: Integrated Executing Organization Model
Policy Gas Sector Development Policy DOE
Formulation of Project Franchisee (equity) Formulation of JV business
ROW Acquisition Supported by DOE
EIS Submitting EIS, obtaining ECC
Debt Financing (2A: Using Concessional loan) Concessional loan
Debt Financing (2B: Market procurement) Bonds / corporate finance
Construction & Construction Supervision contract to private sector
Outsourcing contract to private sector
Operation & Maintenance
Marketing of Gas Including business dev't
Asset Ownership
FacilityOperation
Revenue Sharing
Role Particular
Pro
ject
Impl
em
enta
tion
(Ass
et
Hold
ing/
Debt
Man
agem
ent)
ParticipationPrivate1
RemarksPublic Private2
Project Implementation Contract
Lease agreement
Lease payment
Lease payment
Source: Formulated by JICA study team
Figure 8.2-3 Model 2: Infrastructure-Operation Separation Model
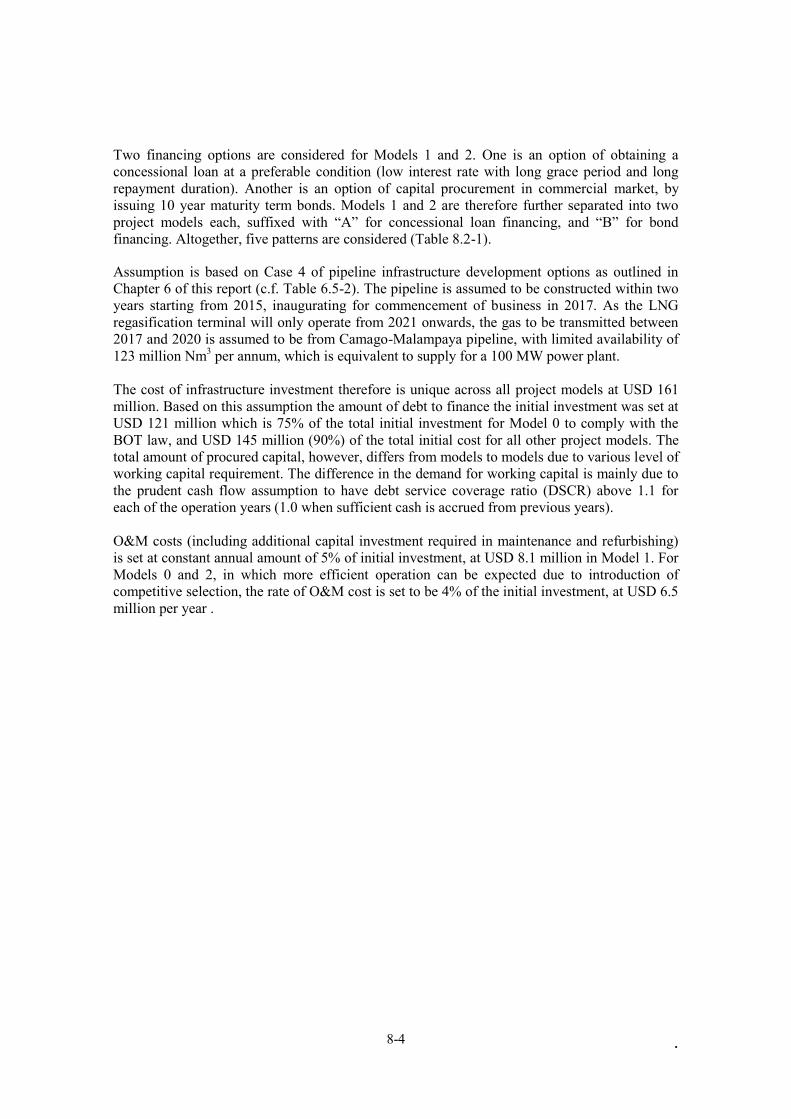
. 8-4
Two financing options are considered for Models 1 and 2. One is an option of obtaining a concessional loan at a preferable condition (low interest rate with long grace period and long repayment duration). Another is an option of capital procurement in commercial market, by issuing 10 year maturity term bonds. Models 1 and 2 are therefore further separated into two project models each, suffixed with “A” for concessional loan financing, and “B” for bond financing. Altogether, five patterns are considered (Table 8.2-1). Assumption is based on Case 4 of pipeline infrastructure development options as outlined in Chapter 6 of this report (c.f. Table 6.5-2). The pipeline is assumed to be constructed within two years starting from 2015, inaugurating for commencement of business in 2017. As the LNG regasification terminal will only operate from 2021 onwards, the gas to be transmitted between 2017 and 2020 is assumed to be from Camago-Malampaya pipeline, with limited availability of 123 million Nm3 per annum, which is equivalent to supply for a 100 MW power plant. The cost of infrastructure investment therefore is unique across all project models at USD 161 million. Based on this assumption the amount of debt to finance the initial investment was set at USD 121 million which is 75% of the total initial investment for Model 0 to comply with the BOT law, and USD 145 million (90%) of the total initial cost for all other project models. The total amount of procured capital, however, differs from models to models due to various level of working capital requirement. The difference in the demand for working capital is mainly due to the prudent cash flow assumption to have debt service coverage ratio (DSCR) above 1.1 for each of the operation years (1.0 when sufficient cash is accrued from previous years). O&M costs (including additional capital investment required in maintenance and refurbishing) is set at constant annual amount of 5% of initial investment, at USD 8.1 million in Model 1. For Models 0 and 2, in which more efficient operation can be expected due to introduction of competitive selection, the rate of O&M cost is set to be 4% of the initial investment, at USD 6.5 million per year .
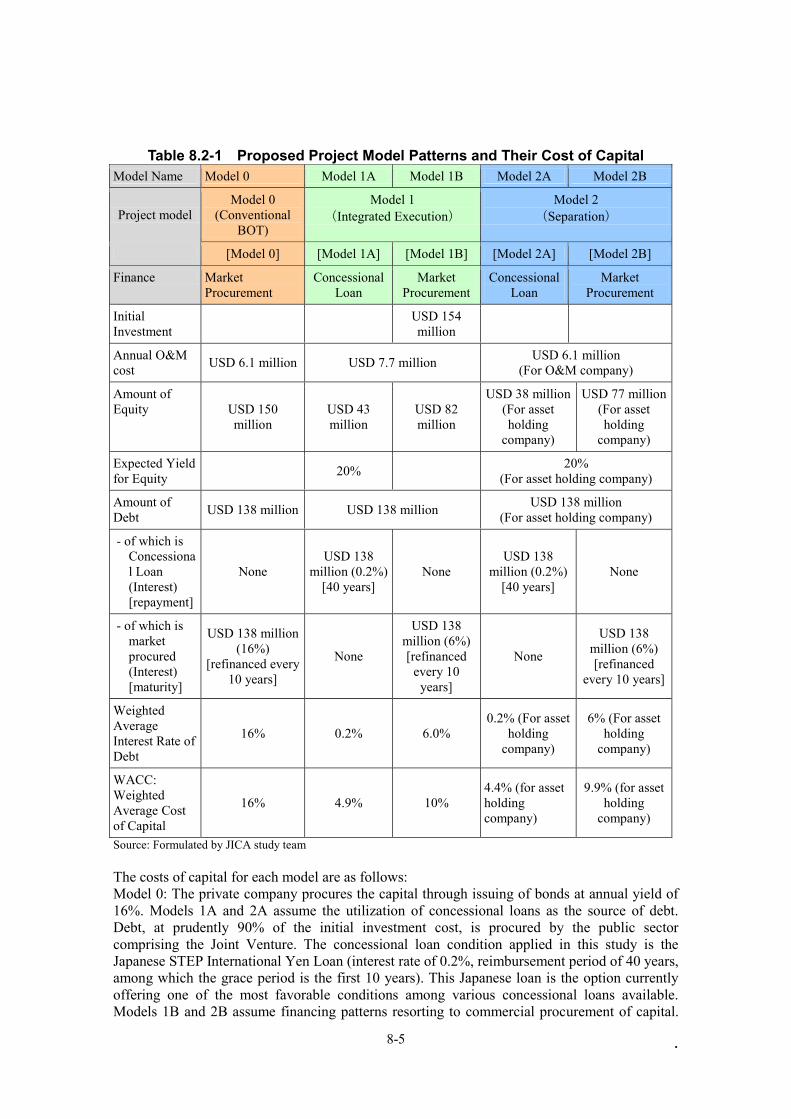
. 8-5
Table 8.2-1 Proposed Project Model Patterns and Their Cost of Capital
Model Name Model 0 Model 1A Model 1B Model 2A Model 2B
Project model Model 0
(Conventional BOT)
Model 1 (Integrated Execution)
Model 2 (Separation)
[Model 0] [Model 1A] [Model 1B] [Model 2A] [Model 2B]
Finance Market Procurement
Concessional Loan
Market Procurement
Concessional Loan
Market Procurement
Initial Investment
USD 154 million
Annual O&M cost USD 6.1 million USD 7.7 million USD 6.1 million
(For O&M company)
Amount of Equity USD 150
million USD 43 million
USD 82 million
USD 38 million (For asset holding
company)
USD 77 million (For asset holding
company)
Expected Yield for Equity 20% 20%
(For asset holding company)
Amount of Debt USD 138 million USD 138 million USD 138 million
(For asset holding company)
- of which is Concessional Loan (Interest) [repayment]
None USD 138
million (0.2%) [40 years]
None USD 138
million (0.2%) [40 years]
None
- of which is market procured (Interest) [maturity]
USD 138 million (16%)
[refinanced every 10 years]
None
USD 138 million (6%) [refinanced
every 10 years]
None
USD 138 million (6%) [refinanced
every 10 years]
Weighted Average Interest Rate of Debt
16% 0.2% 6.0% 0.2% (For asset
holding company)
6% (For asset holding
company)
WACC: Weighted Average Cost of Capital
16% 4.9% 10% 4.4% (for asset holding company)
9.9% (for asset holding
company)
Source: Formulated by JICA study team The costs of capital for each model are as follows: Model 0: The private company procures the capital through issuing of bonds at annual yield of 16%. Models 1A and 2A assume the utilization of concessional loans as the source of debt. Debt, at prudently 90% of the initial investment cost, is procured by the public sector comprising the Joint Venture. The concessional loan condition applied in this study is the Japanese STEP International Yen Loan (interest rate of 0.2%, reimbursement period of 40 years, among which the grace period is the first 10 years). This Japanese loan is the option currently offering one of the most favorable conditions among various concessional loans available. Models 1B and 2B assume financing patterns resorting to commercial procurement of capital.
. 8-6
Borrowing by public entity, enables the project to procure capital at low interest rate of 6%, backed by the government’s creditworthiness (PNOC mentions that it can procure USD corporate finance debt at the spread of 2%). Remainder of the capital required is assumed to be procured through equity. Expected yield for the equity finance is set at 20%. Weighted average cost of capital (WACC) was calculated as 16% for Model 0, 6.0% and 11% respectively for Models 1A and 1B, 4.6% and 10% for Models 2A and 2B respectively. WACC can be calculated as follows: Whereas: n = number of source of capital ri = required rate of return for capital “i” Vi = market value of capital “i” ti = effective tax rate for capital “i” 8.2.2 Scheme Comparison through Financial Analysis Financial analysis based on discounted cash flow (DCF) method was conducted for each of the project models. Financial internal rate of return (FIRR) was calculated so as to verify the financial sustainability of the project based on each of the models. The striking financial characteristics of the pipeline business, common to all from project models considered in this study, are that the net balance of profit and loss for the first several years of operation is expected to be negative. This is mainly due to the low availability of gas to be supplied prior to the commencement of operation of the LNG regasification terminal. The pipeline, being developed with expectation to induce gas businesses in the Philippines will have to bear with the low demand and supply until the industry begins to stand on its feet. The pipeline, as a public utility, will require support from the public sector unless a large amount of money charged onto the wheeling charge. Ways to avoid a high wheeling charge imposed on the gas users is to minimize the financial burden during the first years of operation. Loan repayment during the operational years with only a limited availability of gas will become a heavy burden for the pipeline business. The arrangement of concessional loan with a long grace period is an appropriate option to relieve such burden. Cost cut by introducing an efficient operation and maintenance method is another option for reducing the cost of the project. Introduction of private sector through competitive bidding will be an effective measure for the O&M cost cuts. Models are therefore compared from the viewpoint of difference in required wheeling charges as well as their viability. Advantages and disadvantages for each of the project models and financing patterns as outlined in Table 8.2-1 are compared as follows: (1) Gas Transmission (Wheeling) Charge Revenue expected for each Model will be dependent on the amount of gas transported and the unit tariff for the transmission by the pipeline. As natural gas is to be supplied to an unspecified number of customers, the gas transmission (wheeling) charges are likely to be regulated by the Energy Regulatory Commission (ERC). However, ERC is yet to establish a method for regulating the wheeling charges of natural gas pipelines. In conducting the analysis the revenue from providing the pipeline business service, the wheeling charge was considered and treated as a variable based on the current situation where regulatory mechanism for gas transmission service is not existent. The wheeling charges for each of the project models were set so as to realize the FIRR of approximately 2 percentage points above WACC, to ensure financially sustainable operation of the business.

. 8-7
The assumed setting is a type of cost recovery scheme, which allows the operating entity to recover from wheeling charge revenue, the operating expense (OPEX) and the capital expenditure (CAPEX), to meet the weighted average cost of capital (WACC). Additional profit to cover the business risks will also be required. The assumption in this analysis, therefore, allows the operator to conduct a financially sustainable business at a given cost and profit. (2) Comparison of the Project Models First, wheeling charges are set so that the FIRR becomes approximately 2 percentage points above WACC for each of the project models. Models 2A and 1A, taking advantage of the preferential concessional loan, offer the lowest wheeling charge of 0.017 USD/Nm3 and 0.018 USD/Nm3 respectively. Wheeling charges in Models 2B and 1B, procuring debt from the market, will be 0.011 USD/Nm3 higher than the concessional loan patterns, at 0.028 USD/Nm3 and 0.029 USD/Nm3 respectively. Conventional BOT model is seen to require more than twice the wheeling charge compared with the concessional loan patterns, at 0.047 USD/Nm3.
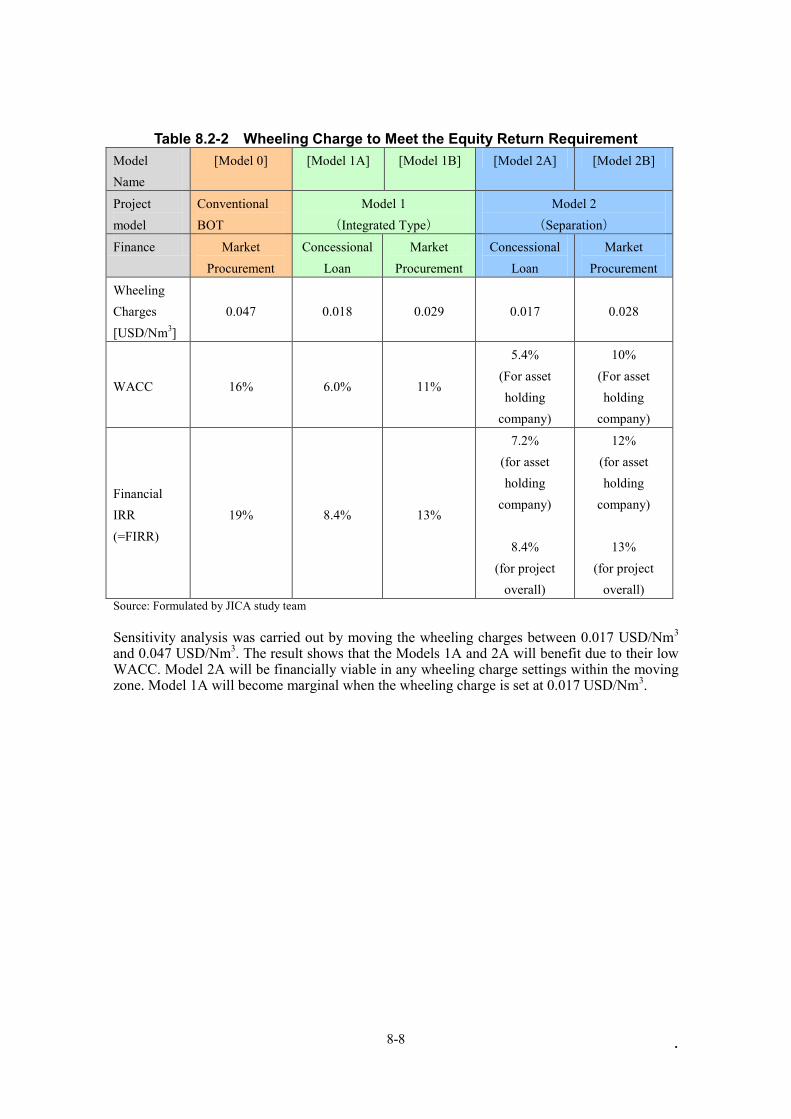
. 8-8
Table 8.2-2 Wheeling Charge to Meet the Equity Return Requirement Model Name
[Model 0] [Model 1A] [Model 1B] [Model 2A] [Model 2B]
Project model
Conventional BOT
Model 1 (Integrated Type)
Model 2 (Separation)
Finance Market Procurement
Concessional Loan
Market Procurement
Concessional Loan
Market Procurement
Wheeling Charges [USD/Nm3]
0.047 0.018 0.029 0.017 0.028
WACC 16% 6.0% 11%
5.4% (For asset holding
company)
10% (For asset holding
company)
Financial IRR (=FIRR)
19% 8.4% 13%
7.2% (for asset holding
company)
8.4% (for project
overall)
12% (for asset holding
company)
13% (for project
overall) Source: Formulated by JICA study team Sensitivity analysis was carried out by moving the wheeling charges between 0.017 USD/Nm3 and 0.047 USD/Nm3. The result shows that the Models 1A and 2A will benefit due to their low WACC. Model 2A will be financially viable in any wheeling charge settings within the moving zone. Model 1A will become marginal when the wheeling charge is set at 0.017 USD/Nm3.
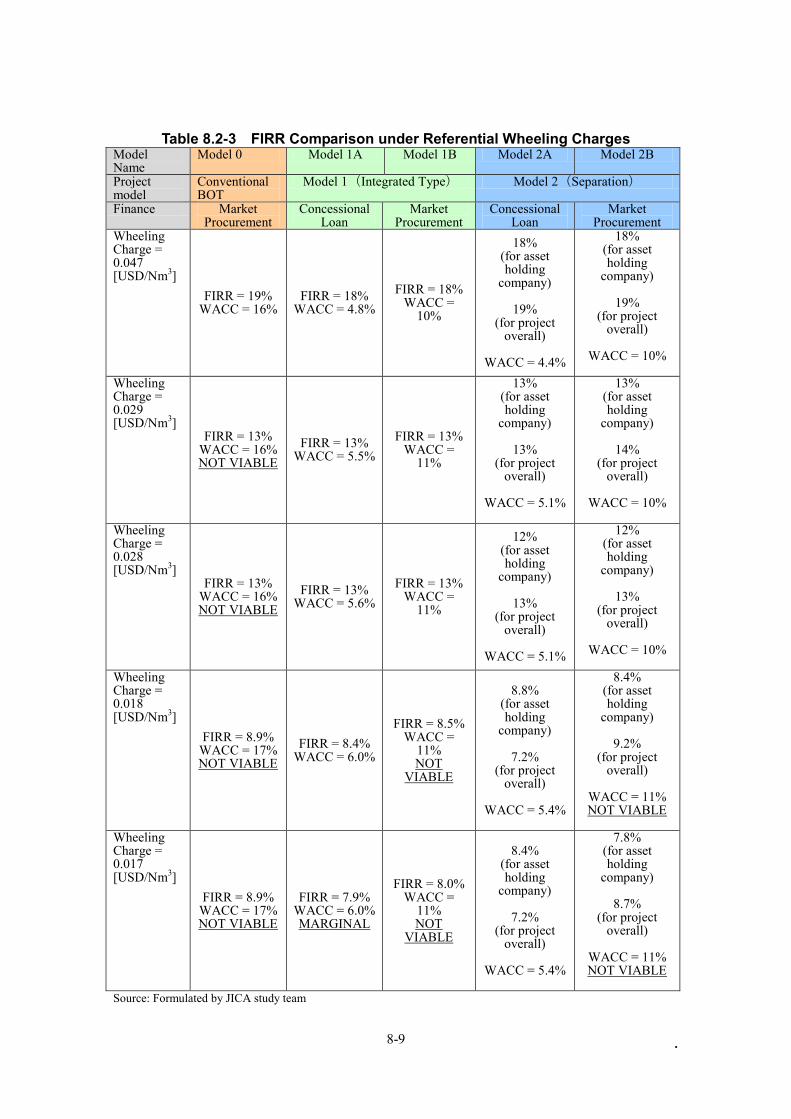
. 8-9
Table 8.2-3 FIRR Comparison under Referential Wheeling Charges Model Name
Model 0 Model 1A Model 1B Model 2A Model 2B
Project model
Conventional BOT
Model 1(Integrated Type) Model 2(Separation)
Finance Market Procurement
Concessional Loan
Market Procurement
Concessional Loan
Market Procurement
Wheeling Charge = 0.047 [USD/Nm3]
FIRR = 19% WACC = 16%
FIRR = 18% WACC = 4.8%
FIRR = 18% WACC =
10%
18% (for asset holding
company)
19% (for project
overall)
WACC = 4.4%
18% (for asset holding
company)
19% (for project
overall)
WACC = 10%
Wheeling Charge = 0.029 [USD/Nm3] FIRR = 13%
WACC = 16% NOT VIABLE
FIRR = 13% WACC = 5.5%
FIRR = 13% WACC =
11%
13% (for asset holding
company)
13% (for project
overall)
WACC = 5.1%
13% (for asset holding
company)
14% (for project
overall)
WACC = 10%
Wheeling Charge = 0.028 [USD/Nm3] FIRR = 13%
WACC = 16% NOT VIABLE
FIRR = 13% WACC = 5.6%
FIRR = 13% WACC =
11%
12% (for asset holding
company)
13% (for project
overall)
WACC = 5.1%
12% (for asset holding
company)
13% (for project
overall)
WACC = 10%
Wheeling Charge = 0.018 [USD/Nm3] FIRR = 8.9%
WACC = 17% NOT VIABLE
FIRR = 8.4% WACC = 6.0%
FIRR = 8.5% WACC =
11% NOT
VIABLE
8.8% (for asset holding
company)
7.2% (for project
overall)
WACC = 5.4%
8.4% (for asset holding
company)
9.2% (for project
overall)
WACC = 11% NOT VIABLE
Wheeling Charge = 0.017 [USD/Nm3] FIRR = 8.9%
WACC = 17% NOT VIABLE
FIRR = 7.9% WACC = 6.0% MARGINAL
FIRR = 8.0% WACC =
11% NOT
VIABLE
8.4% (for asset holding
company)
7.2% (for project
overall)
WACC = 5.4%
7.8% (for asset holding
company)
8.7% (for project
overall)
WACC = 11% NOT VIABLE
Source: Formulated by JICA study team
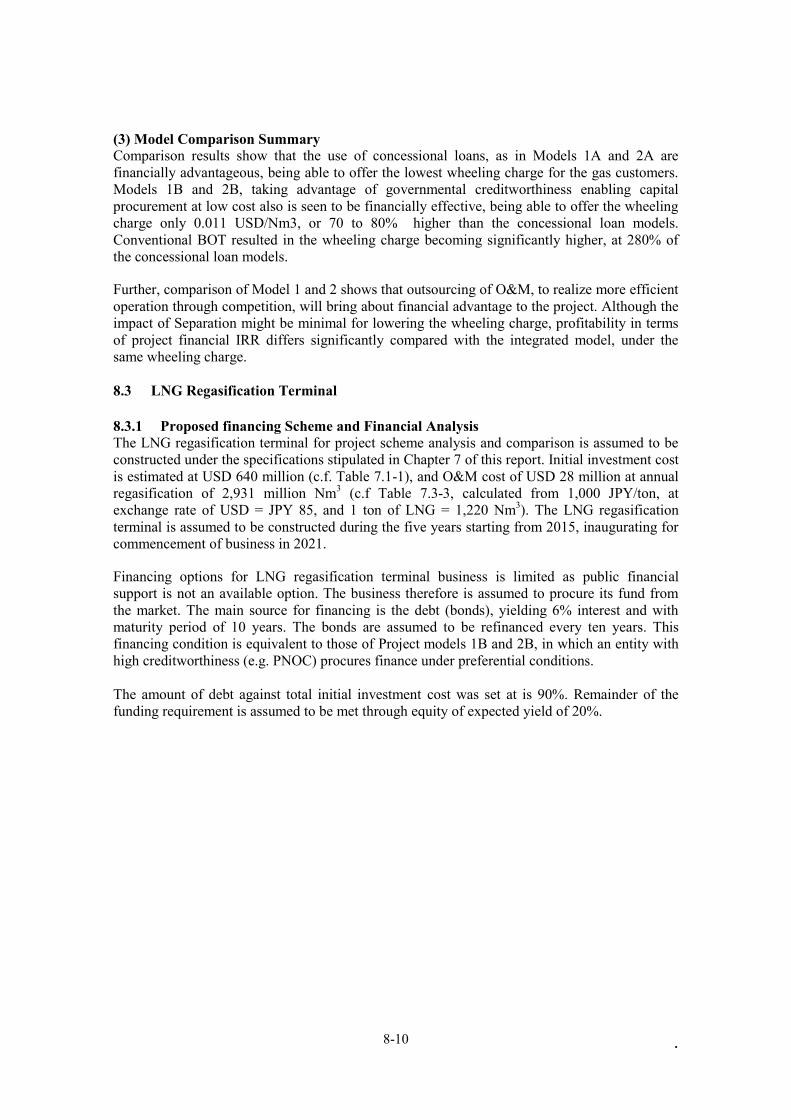
. 8-10
(3) Model Comparison Summary Comparison results show that the use of concessional loans, as in Models 1A and 2A are financially advantageous, being able to offer the lowest wheeling charge for the gas customers. Models 1B and 2B, taking advantage of governmental creditworthiness enabling capital procurement at low cost also is seen to be financially effective, being able to offer the wheeling charge only 0.011 USD/Nm3, or 70 to 80% higher than the concessional loan models. Conventional BOT resulted in the wheeling charge becoming significantly higher, at 280% of the concessional loan models. Further, comparison of Model 1 and 2 shows that outsourcing of O&M, to realize more efficient operation through competition, will bring about financial advantage to the project. Although the impact of Separation might be minimal for lowering the wheeling charge, profitability in terms of project financial IRR differs significantly compared with the integrated model, under the same wheeling charge. 8.3 LNG Regasification Terminal 8.3.1 Proposed financing Scheme and Financial Analysis The LNG regasification terminal for project scheme analysis and comparison is assumed to be constructed under the specifications stipulated in Chapter 7 of this report. Initial investment cost is estimated at USD 640 million (c.f. Table 7.1-1), and O&M cost of USD 28 million at annual regasification of 2,931 million Nm3 (c.f Table 7.3-3, calculated from 1,000 JPY/ton, at exchange rate of USD = JPY 85, and 1 ton of LNG = 1,220 Nm3). The LNG regasification terminal is assumed to be constructed during the five years starting from 2015, inaugurating for commencement of business in 2021. Financing options for LNG regasification terminal business is limited as public financial support is not an available option. The business therefore is assumed to procure its fund from the market. The main source for financing is the debt (bonds), yielding 6% interest and with maturity period of 10 years. The bonds are assumed to be refinanced every ten years. This financing condition is equivalent to those of Project models 1B and 2B, in which an entity with high creditworthiness (e.g. PNOC) procures finance under preferential conditions. The amount of debt against total initial investment cost was set at is 90%. Remainder of the funding requirement is assumed to be met through equity of expected yield of 20%.
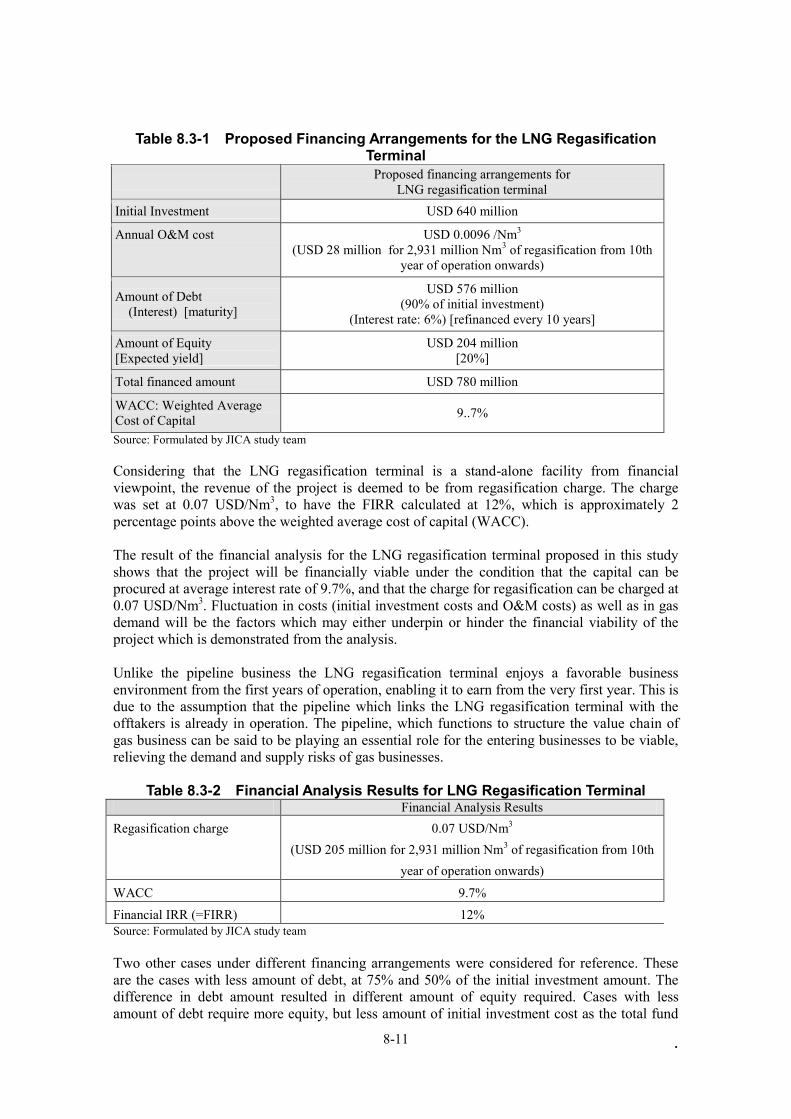
. 8-11
Table 8.3-1 Proposed Financing Arrangements for the LNG Regasification Terminal
Proposed financing arrangements for LNG regasification terminal
Initial Investment USD 640 million
Annual O&M cost USD 0.0096 /Nm3 (USD 28 million for 2,931 million Nm3 of regasification from 10th
year of operation onwards)
Amount of Debt (Interest) [maturity]
USD 576 million (90% of initial investment)
(Interest rate: 6%) [refinanced every 10 years]
Amount of Equity [Expected yield]
USD 204 million [20%]
Total financed amount USD 780 million
WACC: Weighted Average Cost of Capital 9..7%
Source: Formulated by JICA study team Considering that the LNG regasification terminal is a stand-alone facility from financial viewpoint, the revenue of the project is deemed to be from regasification charge. The charge was set at 0.07 USD/Nm3, to have the FIRR calculated at 12%, which is approximately 2 percentage points above the weighted average cost of capital (WACC). The result of the financial analysis for the LNG regasification terminal proposed in this study shows that the project will be financially viable under the condition that the capital can be procured at average interest rate of 9.7%, and that the charge for regasification can be charged at 0.07 USD/Nm3. Fluctuation in costs (initial investment costs and O&M costs) as well as in gas demand will be the factors which may either underpin or hinder the financial viability of the project which is demonstrated from the analysis. Unlike the pipeline business the LNG regasification terminal enjoys a favorable business environment from the first years of operation, enabling it to earn from the very first year. This is due to the assumption that the pipeline which links the LNG regasification terminal with the offtakers is already in operation. The pipeline, which functions to structure the value chain of gas business can be said to be playing an essential role for the entering businesses to be viable, relieving the demand and supply risks of gas businesses.
Table 8.3-2 Financial Analysis Results for LNG Regasification Terminal Financial Analysis Results Regasification charge 0.07 USD/Nm3
(USD 205 million for 2,931 million Nm3 of regasification from 10th year of operation onwards)
WACC 9.7%
Financial IRR (=FIRR) 12% Source: Formulated by JICA study team Two other cases under different financing arrangements were considered for reference. These are the cases with less amount of debt, at 75% and 50% of the initial investment amount. The difference in debt amount resulted in different amount of equity required. Cases with less amount of debt require more equity, but less amount of initial investment cost as the total fund
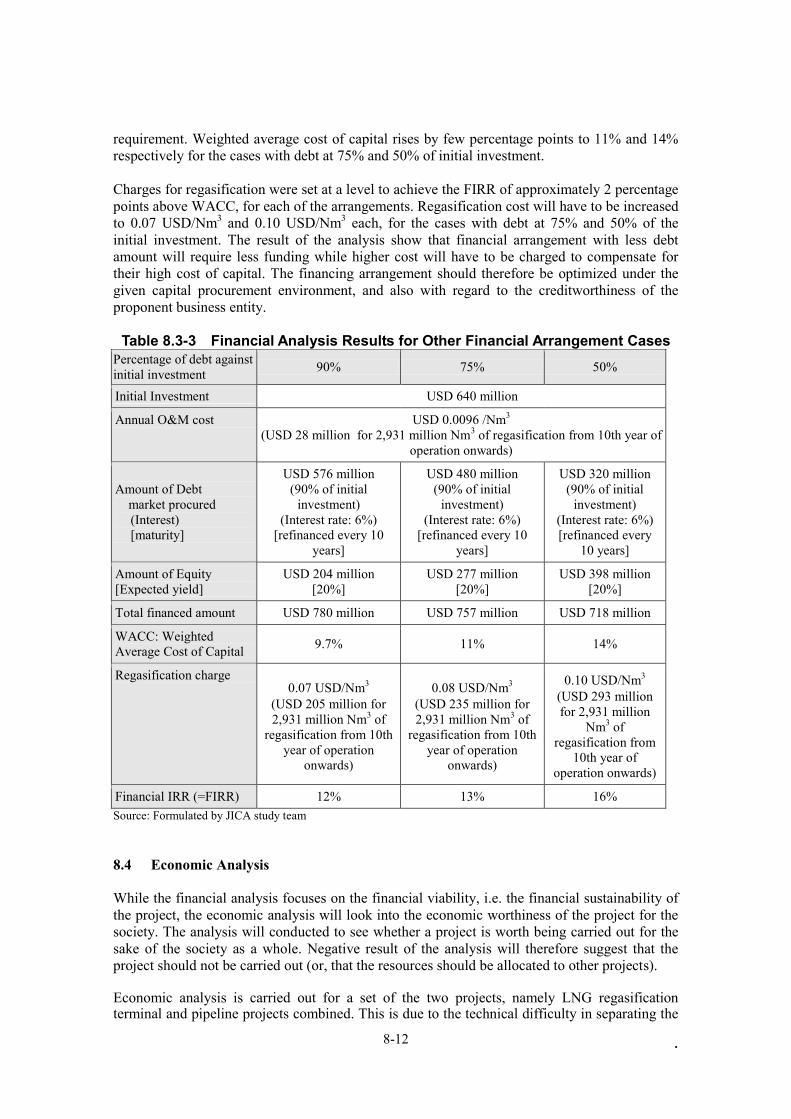
. 8-12
requirement. Weighted average cost of capital rises by few percentage points to 11% and 14% respectively for the cases with debt at 75% and 50% of initial investment. Charges for regasification were set at a level to achieve the FIRR of approximately 2 percentage points above WACC, for each of the arrangements. Regasification cost will have to be increased to 0.07 USD/Nm3 and 0.10 USD/Nm3 each, for the cases with debt at 75% and 50% of the initial investment. The result of the analysis show that financial arrangement with less debt amount will require less funding while higher cost will have to be charged to compensate for their high cost of capital. The financing arrangement should therefore be optimized under the given capital procurement environment, and also with regard to the creditworthiness of the proponent business entity.
Table 8.3-3 Financial Analysis Results for Other Financial Arrangement Cases Percentage of debt against initial investment 90% 75% 50%
Initial Investment USD 640 million
Annual O&M cost USD 0.0096 /Nm3 (USD 28 million for 2,931 million Nm3 of regasification from 10th year of
operation onwards)
Amount of Debt market procured
(Interest) [maturity]
USD 576 million (90% of initial
investment) (Interest rate: 6%)
[refinanced every 10 years]
USD 480 million (90% of initial
investment) (Interest rate: 6%)
[refinanced every 10 years]
USD 320 million (90% of initial
investment) (Interest rate: 6%) [refinanced every
10 years]
Amount of Equity [Expected yield]
USD 204 million [20%]
USD 277 million [20%]
USD 398 million [20%]
Total financed amount USD 780 million USD 757 million USD 718 million
WACC: Weighted Average Cost of Capital 9.7% 11% 14%
Regasification charge 0.07 USD/Nm3
(USD 205 million for 2,931 million Nm3 of
regasification from 10th year of operation
onwards)
0.08 USD/Nm3 (USD 235 million for 2,931 million Nm3 of
regasification from 10th year of operation
onwards)
0.10 USD/Nm3 (USD 293 million for 2,931 million
Nm3 of regasification from
10th year of operation onwards)
Financial IRR (=FIRR) 12% 13% 16% Source: Formulated by JICA study team 8.4 Economic Analysis While the financial analysis focuses on the financial viability, i.e. the financial sustainability of the project, the economic analysis will look into the economic worthiness of the project for the society. The analysis will conducted to see whether a project is worth being carried out for the sake of the society as a whole. Negative result of the analysis will therefore suggest that the project should not be carried out (or, that the resources should be allocated to other projects). Economic analysis is carried out for a set of the two projects, namely LNG regasification terminal and pipeline projects combined. This is due to the technical difficulty in separating the
. 8-13
benefits from each of the infrastructures. Benefits to the society will rather be realized when both of these infrastructures operate. Costs and benefits of the two projects, i.e. pipeline and LNG regasification terminal projects are therefore combined into one analysis. 8.4.1 Benefits Benefits to be included in the calculation are not limited to gains recoverable by the project owner. Any benefits that may be brought by the project should be considered and included in the analysis, as long as they are quantifiable. Economic benefits to the society due to investment are commonly calculated through input-output analysis. On the other hand, benefits from operation of the facility are commonly evaluated by discounted cash flow (DCF) method. Economic analysis in this study focuses on the latter, the benefit from operation of LNG regasification terminal and Batangas – Manila Pipeline. Benefits other than the revenue gained through business should also be included in the calculation. Among various benefits that will be brought about by making natural gas available to the society, one of the most significant and quantifiable benefit will be the cost reduction compared with the use of fuel oil. As mentioned in Chapter 4 of this report, the current unit cost of fuel oil in the Philippines is calculated as 2.2 times the unit cost of nationally available natural gas, or 1.3 times the unit cost of imported natural gas (c.f. Table 4.5-1). Although the fuel cost saved by energy consumers will not be collected by the gas business entities, it is the economic advantage for the society that can be directly quantified. The benefit is calculated by multiplying the unit cost difference between natural gas and fuel oil, and by the amount of gas provided through the pipeline. 8.4.2 Costs Costs for the project were calculated as the sum of investment and O&M costs for both the regasification terminal and the pipeline. Tax levies were deducted and internal transactions (e.g. lease paid by the operator to the asset holding company) were balanced out to ensure the accuracy of the calculation. Standard conversion factor (SCF) to adjust the local portion of the costs to international costs was set at 0.95 (All costs excluding material, engineering and management costs were considered as the local costs). Three indicators were calculated to evaluate the result of the analysis, namely cost benefit ratio (CBR), net present value (NPV) and economic internal rate of return (EIRR). Definitions for these indicators are as explained in the following table:
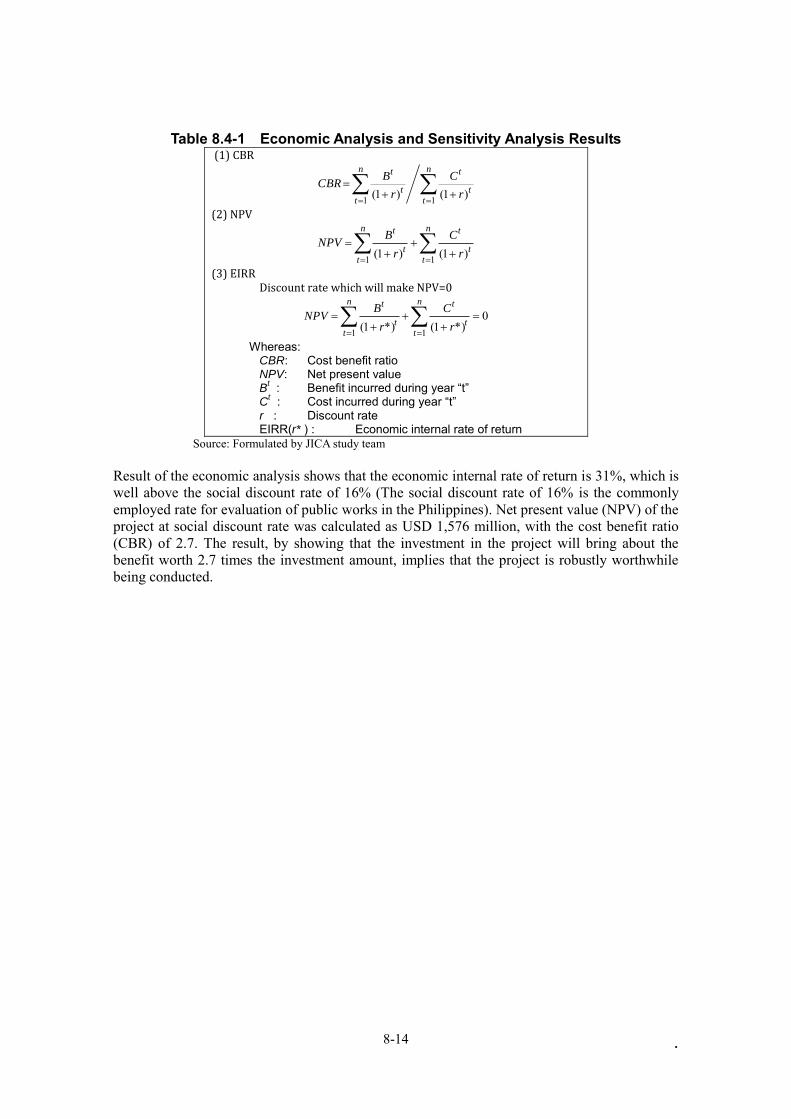
. 8-14
Table 8.4-1 Economic Analysis and Sensitivity Analysis Results (1) CBR
n
t
t
tn
t
t
t
r
C
r
BCBR
11 )1()1(
(2) NPV
n
t
t
tn
t
t
t
r
C
r
BNPV
11 )1()1(
(3) EIRR Discount rate which will make NPV=0
0*)1(*)1( 11
n
t
t
tn
t
t
t
r
C
r
BNPV
Whereas: CBR: Cost benefit ratio NPV: Net present value B
t : Benefit incurred during year “t” C
t : Cost incurred during year “t” r : Discount rate EIRR(r* ) : Economic internal rate of return
Source: Formulated by JICA study team Result of the economic analysis shows that the economic internal rate of return is 31%, which is well above the social discount rate of 16% (The social discount rate of 16% is the commonly employed rate for evaluation of public works in the Philippines). Net present value (NPV) of the project at social discount rate was calculated as USD 1,576 million, with the cost benefit ratio (CBR) of 2.7. The result, by showing that the investment in the project will bring about the benefit worth 2.7 times the investment amount, implies that the project is robustly worthwhile being conducted.
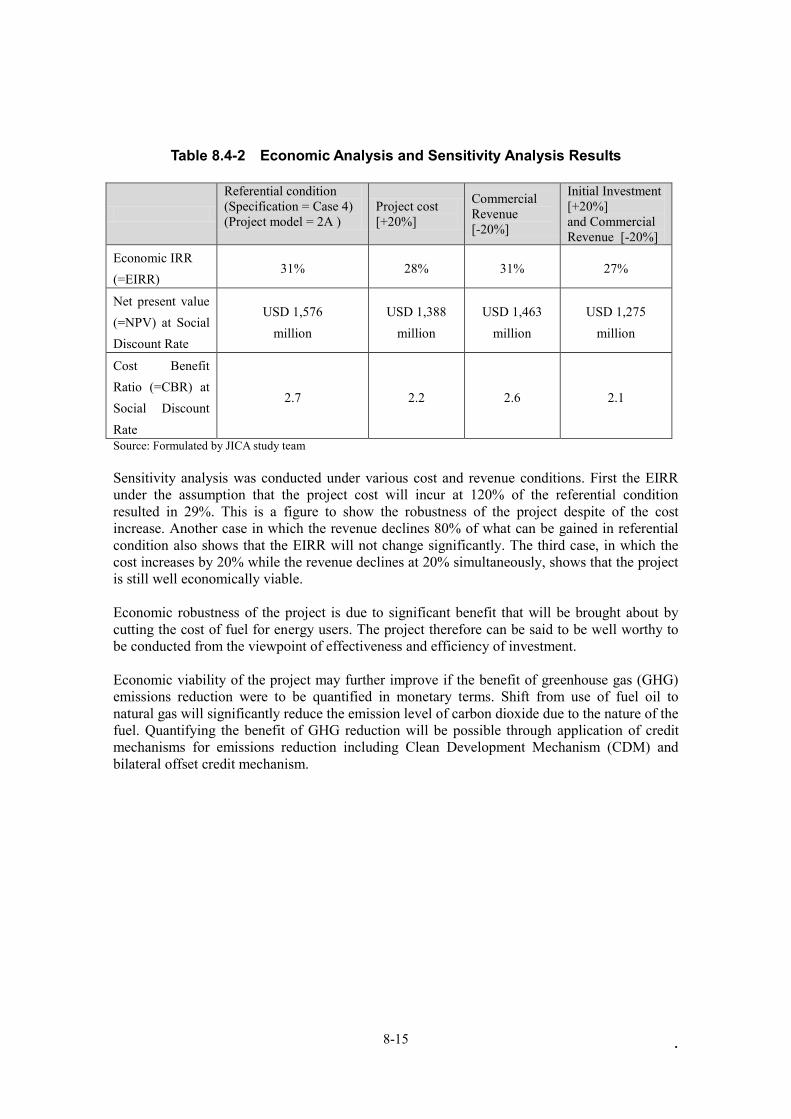
. 8-15
Table 8.4-2 Economic Analysis and Sensitivity Analysis Results
Referential condition (Specification = Case 4) (Project model = 2A )
Project cost [+20%]
Commercial Revenue [-20%]
Initial Investment [+20%] and Commercial Revenue [-20%]
Economic IRR (=EIRR)
31% 28% 31% 27%
Net present value (=NPV) at Social Discount Rate
USD 1,576 million
USD 1,388 million
USD 1,463 million
USD 1,275 million
Cost Benefit Ratio (=CBR) at Social Discount Rate
2.7 2.2 2.6 2.1
Source: Formulated by JICA study team Sensitivity analysis was conducted under various cost and revenue conditions. First the EIRR under the assumption that the project cost will incur at 120% of the referential condition resulted in 29%. This is a figure to show the robustness of the project despite of the cost increase. Another case in which the revenue declines 80% of what can be gained in referential condition also shows that the EIRR will not change significantly. The third case, in which the cost increases by 20% while the revenue declines at 20% simultaneously, shows that the project is still well economically viable. Economic robustness of the project is due to significant benefit that will be brought about by cutting the cost of fuel for energy users. The project therefore can be said to be well worthy to be conducted from the viewpoint of effectiveness and efficiency of investment. Economic viability of the project may further improve if the benefit of greenhouse gas (GHG) emissions reduction were to be quantified in monetary terms. Shift from use of fuel oil to natural gas will significantly reduce the emission level of carbon dioxide due to the nature of the fuel. Quantifying the benefit of GHG reduction will be possible through application of credit mechanisms for emissions reduction including Clean Development Mechanism (CDM) and bilateral offset credit mechanism.

. 8-16
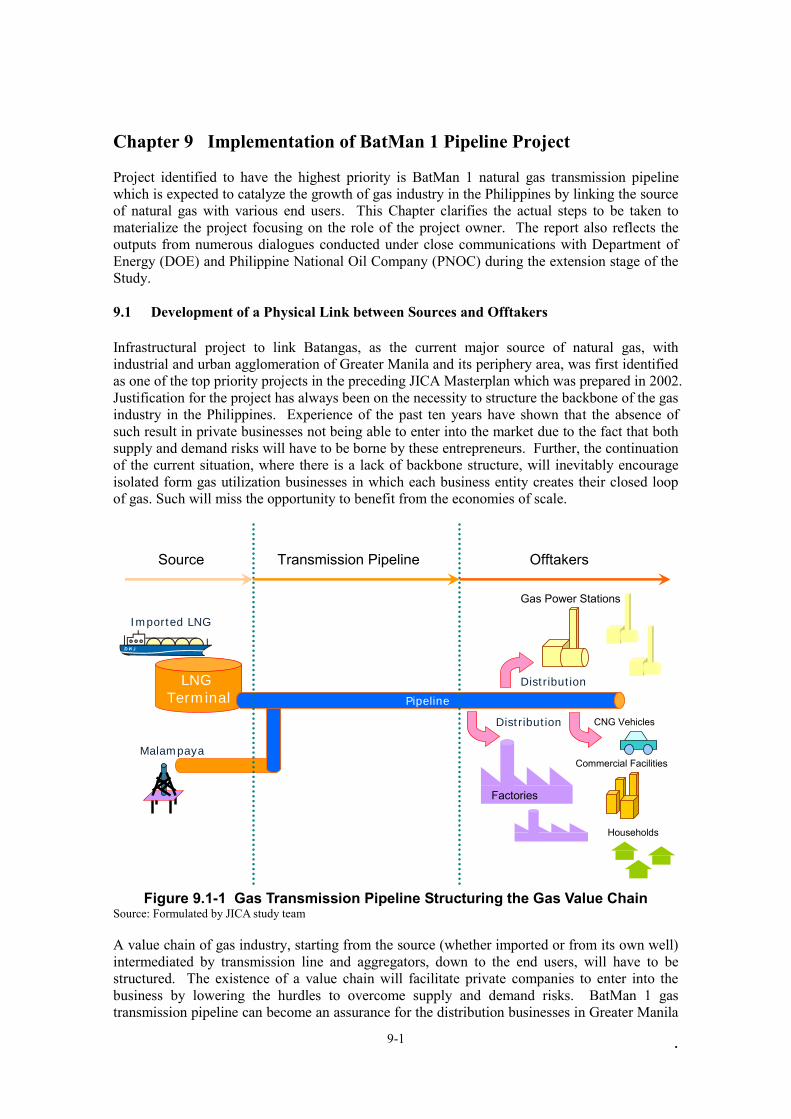
. 9-1
Chapter 9 Implementation of BatMan 1 Pipeline Project Project identified to have the highest priority is BatMan 1 natural gas transmission pipeline which is expected to catalyze the growth of gas industry in the Philippines by linking the source of natural gas with various end users. This Chapter clarifies the actual steps to be taken to materialize the project focusing on the role of the project owner. The report also reflects the outputs from numerous dialogues conducted under close communications with Department of Energy (DOE) and Philippine National Oil Company (PNOC) during the extension stage of the Study. 9.1 Development of a Physical Link between Sources and Offtakers Infrastructural project to link Batangas, as the current major source of natural gas, with industrial and urban agglomeration of Greater Manila and its periphery area, was first identified as one of the top priority projects in the preceding JICA Masterplan which was prepared in 2002. Justification for the project has always been on the necessity to structure the backbone of the gas industry in the Philippines. Experience of the past ten years have shown that the absence of such result in private businesses not being able to enter into the market due to the fact that both supply and demand risks will have to be borne by these entrepreneurs. Further, the continuation of the current situation, where there is a lack of backbone structure, will inevitably encourage isolated form gas utilization businesses in which each business entity creates their closed loop of gas. Such will miss the opportunity to benefit from the economies of scale.
LNG Terminal
Distribution
Factories
Pipeline
Malampaya
Imported LNG
Gas Power Stations
Distribution
CNG Vehicles
Commercial Facilities
Households
Transmission PipelineSource Offtakers
Figure 9.1-1 Gas Transmission Pipeline Structuring the Gas Value Chain
Source: Formulated by JICA study team A value chain of gas industry, starting from the source (whether imported or from its own well) intermediated by transmission line and aggregators, down to the end users, will have to be structured. The existence of a value chain will facilitate private companies to enter into the business by lowering the hurdles to overcome supply and demand risks. BatMan 1 gas transmission pipeline can become an assurance for the distribution businesses in Greater Manila
. 9-2
and its periphery area on supply. Companies will be encouraged to embark on distribution businesses once the gas supply will be secured. Development of a natural gas transmission pipeline will be beneficial not only to the gas industry but also to the society as a whole. As opposed to the road transport being currently conducted for the Natural Gas Vehicle Program for Public Transport (NGVPPT), gas transmission pipeline will be offering better safety, reliability, efficiency and less negative impacts on the environment. 9.2 Project Implementing Entity Since the identification of the project, various efforts have been made to materialize the project including government-driven development concepts and proposals for unsolicited projects from the private companies. These efforts were, however, not effectuated due to the complexity of the situation where various constraints and restrictions were in place, including impediments such as the followings:
Supply of gas from Malampaya could not be secured; Safety and other technical specifications to be imposed on the project implementing
entity were not ready; Roles and responsibility of the public sector was not defined; Market regulatory framework was not yet designed;
Requisite conditions not being met, as with the examples stated above, is the consequence of the absence of decision on the implementing entity of the project. Government, as the project owner, with the aim to promote the development of the gas industry, is expected to formulate a policy on how the project will be implemented. Initial decision to be made is who should the project implementing entity will be. 9.2.1 Government’s Initiatives in the Cases Overseas (1) Examples Overseas Many of the examples of natural gas transmission pipeline development show that the infrastructure was developed through government initiative. Korea established KOGAS, a government-owned gas company with the strong commitment to develop a gas value chain from the scratch. Financial resource from the governmental budget was allocated intensively to the company so as to materialize the strategy to develop a whole gas industry. In Europe, both UK and France, as with many other countries, also developed their gas infrastructure through government initiatives (the companies were government owned in case of UK while they were government regulated in case of France). Companies serving as city gas companies were already in operation in both countries when necessity of trunk transmission line emerged. It was therefore these publicly owned / regulated city gas companies that were in a position to undertake the development of natural gas transmission pipelines. Germany (former West Germany), as in some states of US, was in a different situation where various regional city gas companies under purely private management were already existent. These regional private gas companies, when interlinked, were in a position to cover major built up areas that there was not a need for a government’s role to enter into the market. It is against this background that the gas transmission pipeline network in Germany could be developed under the initiative of private sector. India’s national gas operation company GAIL was incorporated with the initial task of developing and operating a trunk line pipeline, which reflects the country’s intention to develop the infrastructure under the government’s initiative. States in India also established their public
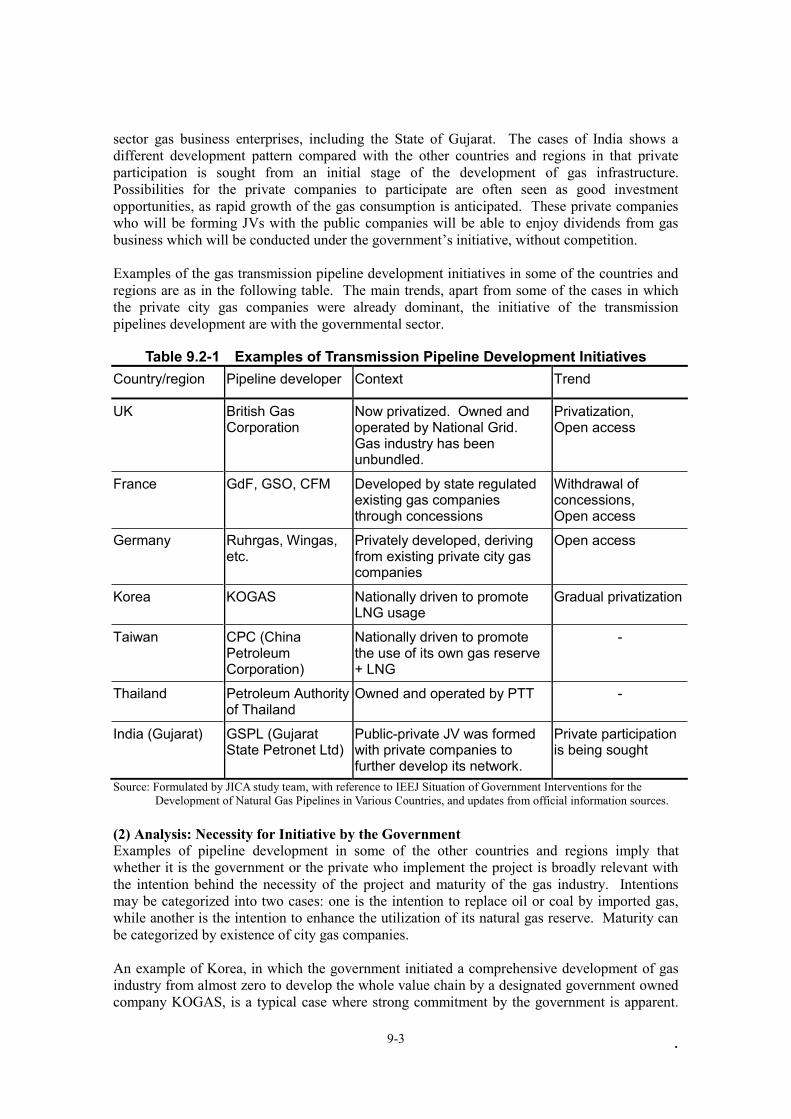
. 9-3
sector gas business enterprises, including the State of Gujarat. The cases of India shows a different development pattern compared with the other countries and regions in that private participation is sought from an initial stage of the development of gas infrastructure. Possibilities for the private companies to participate are often seen as good investment opportunities, as rapid growth of the gas consumption is anticipated. These private companies who will be forming JVs with the public companies will be able to enjoy dividends from gas business which will be conducted under the government’s initiative, without competition. Examples of the gas transmission pipeline development initiatives in some of the countries and regions are as in the following table. The main trends, apart from some of the cases in which the private city gas companies were already dominant, the initiative of the transmission pipelines development are with the governmental sector.
Table 9.2-1 Examples of Transmission Pipeline Development Initiatives Country/region Pipeline developer Context Trend
UK British Gas Corporation
Now privatized. Owned and operated by National Grid. Gas industry has been unbundled.
Privatization, Open access
France GdF, GSO, CFM Developed by state regulated existing gas companies through concessions
Withdrawal of concessions, Open access
Germany Ruhrgas, Wingas, etc.
Privately developed, deriving from existing private city gas companies
Open access
Korea KOGAS Nationally driven to promote LNG usage
Gradual privatization
Taiwan CPC (China Petroleum Corporation)
Nationally driven to promote the use of its own gas reserve + LNG
-
Thailand Petroleum Authority of Thailand
Owned and operated by PTT -
India (Gujarat) GSPL (Gujarat State Petronet Ltd)
Public-private JV was formed with private companies to further develop its network.
Private participation is being sought
Source: Formulated by JICA study team, with reference to IEEJ Situation of Government Interventions for the Development of Natural Gas Pipelines in Various Countries, and updates from official information sources.
(2) Analysis: Necessity for Initiative by the Government Examples of pipeline development in some of the other countries and regions imply that whether it is the government or the private who implement the project is broadly relevant with the intention behind the necessity of the project and maturity of the gas industry. Intentions may be categorized into two cases: one is the intention to replace oil or coal by imported gas, while another is the intention to enhance the utilization of its natural gas reserve. Maturity can be categorized by existence of city gas companies. An example of Korea, in which the government initiated a comprehensive development of gas industry from almost zero to develop the whole value chain by a designated government owned company KOGAS, is a typical case where strong commitment by the government is apparent.
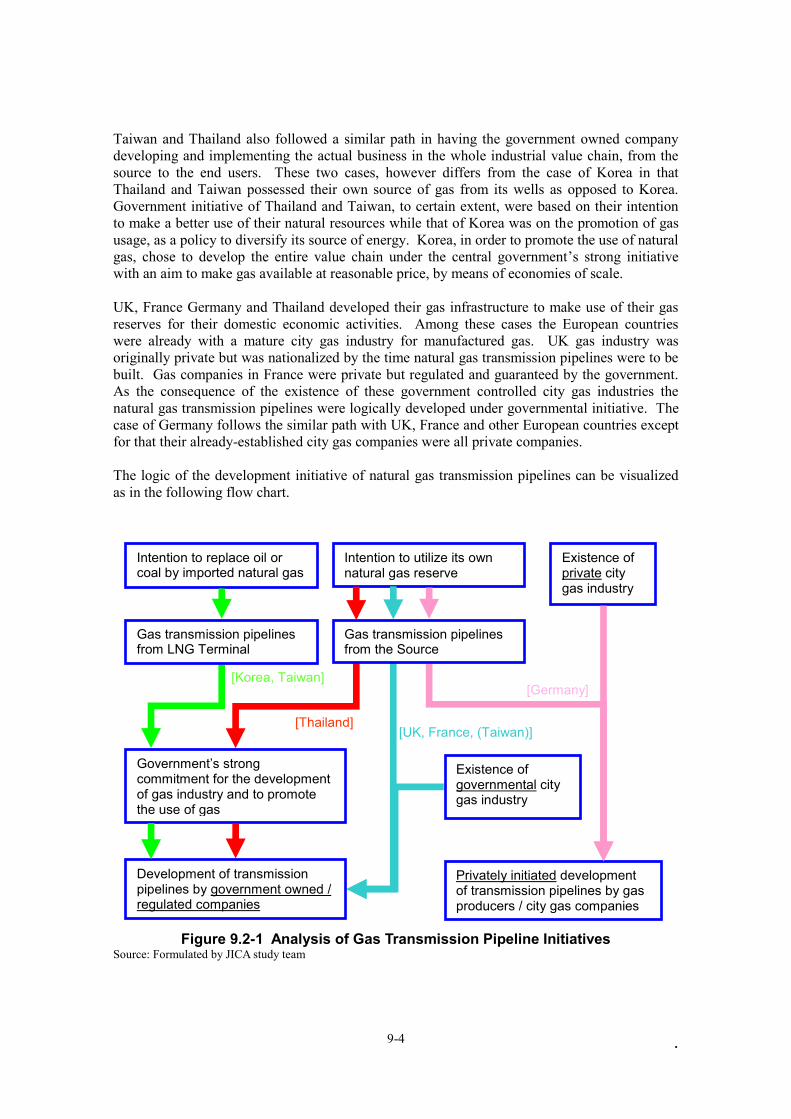
. 9-4
Taiwan and Thailand also followed a similar path in having the government owned company developing and implementing the actual business in the whole industrial value chain, from the source to the end users. These two cases, however differs from the case of Korea in that Thailand and Taiwan possessed their own source of gas from its wells as opposed to Korea. Government initiative of Thailand and Taiwan, to certain extent, were based on their intention to make a better use of their natural resources while that of Korea was on the promotion of gas usage, as a policy to diversify its source of energy. Korea, in order to promote the use of natural gas, chose to develop the entire value chain under the central government’s strong initiative with an aim to make gas available at reasonable price, by means of economies of scale. UK, France Germany and Thailand developed their gas infrastructure to make use of their gas reserves for their domestic economic activities. Among these cases the European countries were already with a mature city gas industry for manufactured gas. UK gas industry was originally private but was nationalized by the time natural gas transmission pipelines were to be built. Gas companies in France were private but regulated and guaranteed by the government. As the consequence of the existence of these government controlled city gas industries the natural gas transmission pipelines were logically developed under governmental initiative. The case of Germany follows the similar path with UK, France and other European countries except for that their already-established city gas companies were all private companies. The logic of the development initiative of natural gas transmission pipelines can be visualized as in the following flow chart.
Figure 9.2-1 Analysis of Gas Transmission Pipeline Initiatives
Source: Formulated by JICA study team
Intention to replace oil or coal by imported natural gas
Intention to utilize its own natural gas reserve
Existence of governmental city gas industry
Privately initiated development of transmission pipelines by gas producers / city gas companies
Gas transmission pipelines from LNG Terminal
[Korea, Taiwan] [Germany]
Development of transmission pipelines by government owned / regulated companies
[UK, France, (Taiwan)]
Existence of private city gas industry
[Thailand]
Government’s strong commitment for the development of gas industry and to promote the use of gas
Gas transmission pipelines from the Source
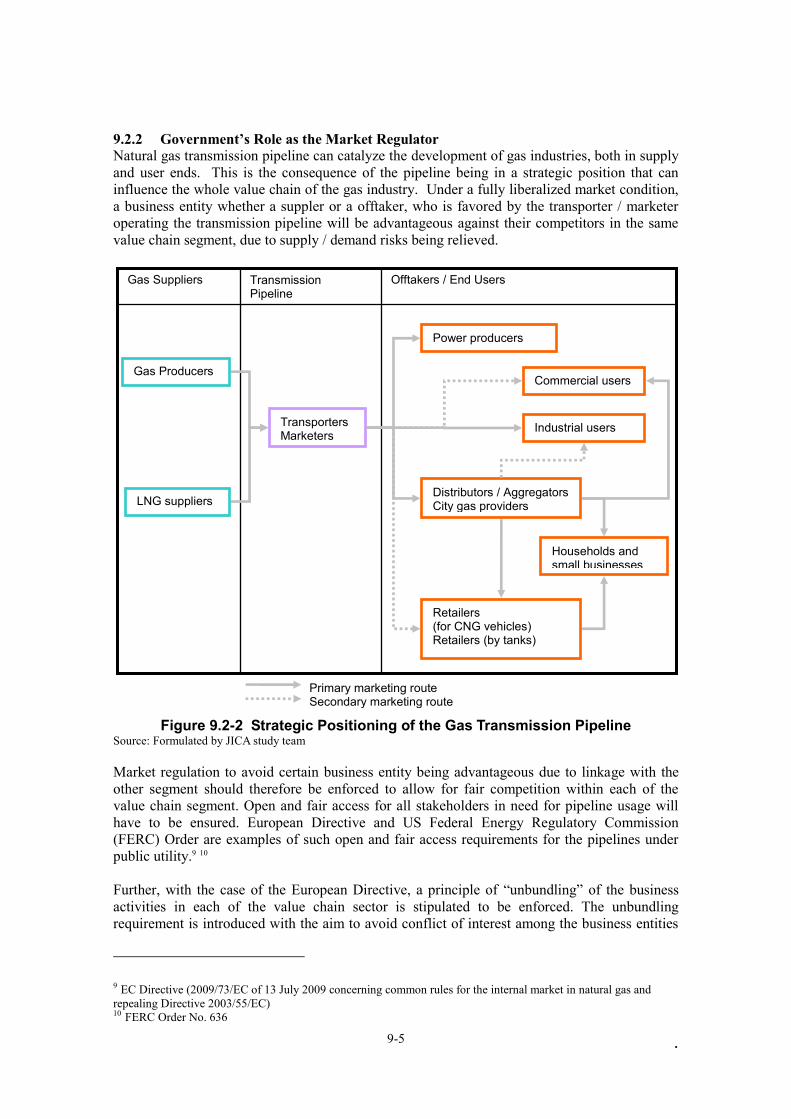
. 9-5
9.2.2 Government’s Role as the Market Regulator Natural gas transmission pipeline can catalyze the development of gas industries, both in supply and user ends. This is the consequence of the pipeline being in a strategic position that can influence the whole value chain of the gas industry. Under a fully liberalized market condition, a business entity whether a suppler or a offtaker, who is favored by the transporter / marketer operating the transmission pipeline will be advantageous against their competitors in the same value chain segment, due to supply / demand risks being relieved.
Figure 9.2-2 Strategic Positioning of the Gas Transmission Pipeline
Source: Formulated by JICA study team Market regulation to avoid certain business entity being advantageous due to linkage with the other segment should therefore be enforced to allow for fair competition within each of the value chain segment. Open and fair access for all stakeholders in need for pipeline usage will have to be ensured. European Directive and US Federal Energy Regulatory Commission (FERC) Order are examples of such open and fair access requirements for the pipelines under public utility.9 10 Further, with the case of the European Directive, a principle of “unbundling” of the business activities in each of the value chain sector is stipulated to be enforced. The unbundling requirement is introduced with the aim to avoid conflict of interest among the business entities
9 EC Directive (2009/73/EC of 13 July 2009 concerning common rules for the internal market in natural gas and repealing Directive 2003/55/EC) 10 FERC Order No. 636
Offtakers / End Users Transmission Pipeline
Gas Suppliers
Transporters Marketers
Gas Producers
LNG suppliers
Power producers
Industrial users
Commercial users
Distributors / Aggregators City gas providers
Retailers (for CNG vehicles) Retailers (by tanks)
Households and small businesses
Primary marketing route Secondary marketing route
. 9-6
in different value chain segments, by ensuring independence among the entities. Forms of unbundling can be categorized into following four types:11
Accounting unbundling Functional unbundling Legal unbundling Ownership unbundling
Accounting unbundling is the most common type of unbundling and is employed in France, Germany, Belgium, among other countries. Ownership unbundling is the form applied in UK. Market regulation on open and fair access, including transparent tariff for the transmission pipeline is a condition for encouraging competition in the gas industry to be nurtured. Government is in a position to regulate the market, either by means of establishing an independent regulatory body or, as a tentative structure, enforcing the principle by public body. Hence, the government will have to play an essential role not only in development of the transmission pipeline but also in enforcing appropriate regulations to promote fair competition in the gas market. 9.2.3 Government’s Role to Ensure Low Tariff for the Users Commitment to nurture a gas industry will have to be accompanies by incentive that will encourage more potential gas users to positively consider switching from other energy sources. Commonly available instruments for a government to extend incentives to the users may be subsidy, guarantee, tax relief, low interest credit, in-kind supports. Subsidy will not be a preferred option for the Philippines, where liberal market policy is already applied to its energy market. Additional tax relief, on top of what will be offered by the Board of Investment (BOI) will be available for Public-Private Partnership (PPP) projects. Low interest credit, by means of guarantee may be sought in particular cases when approved by Department of Finance (DOF). If BatMan 1 project were to be implemented by the private sector, either as solicited or unsolicited project, it is probable to be covered by the Philippine BOT Law. 12 Infrastructure development projects conducted under private initiative based on the Philippine BOT Law, in most of the cases in which BOT scheme is applied, require private finance for whole or part of the project cost. This private finance will be arranged through bank loans and equity, with expected debt service and dividend at market rate or higher. As the consequence, the cost of capital will be come higher compared with the public finance which may be procured at considerably lower rate against the government’s creditworthiness. BatMan 1 project, with the aim to promote the development of a gas industry from its infancy, will have to be conducted by lowest capital cost available, i.e. public finance. The following table shows a simple comparison of representative financing means which might be considered for the project. Financing by government budget backed by concessional loan(s) will be the realistic and appropriate option, followed by governmental bonds.
11 Various document citing the EC Directive, e.g. Gilardoni A, The World Market for Natural Gas: Implications for Europe (Springer, Berlin, 2008) 12 Act No. 6957, Entitled “An Act Authorizing the Financing, Construction, Operation and Maintenance of Infrastructure Projects by the Private Sector, and for Other Purposes”, as amended by Act No. 7718
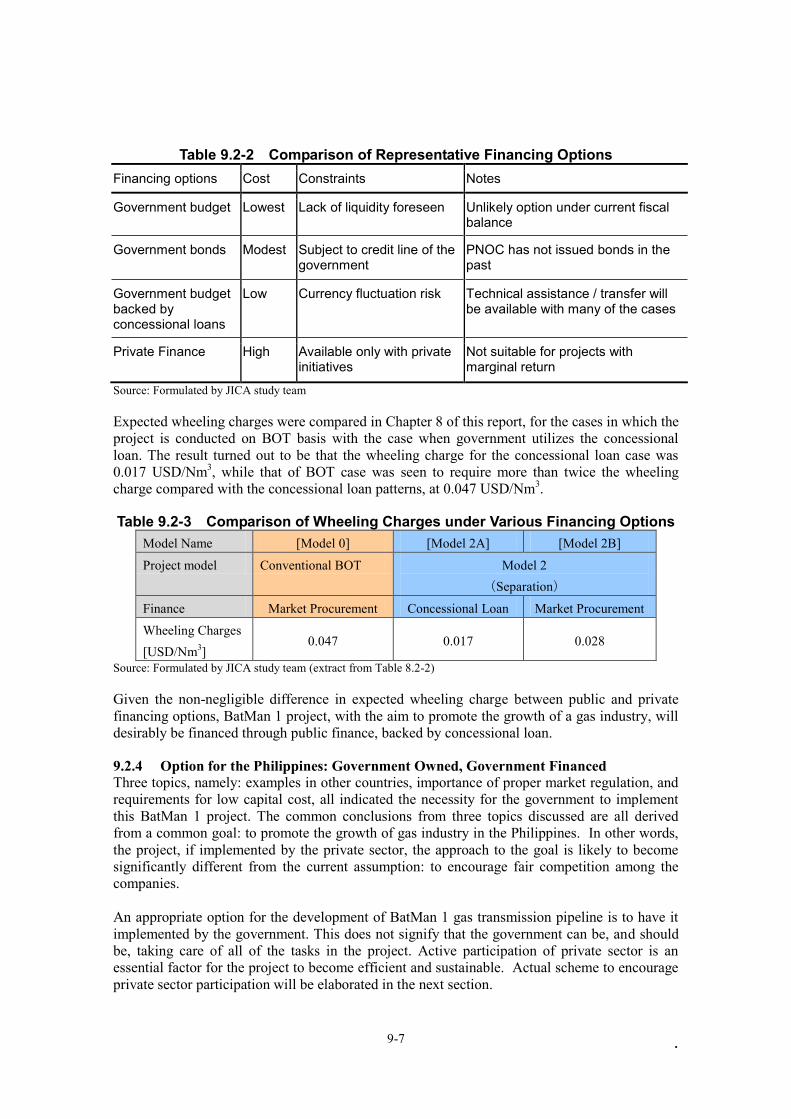
. 9-7
Table 9.2-2 Comparison of Representative Financing Options
Financing options Cost Constraints Notes
Government budget Lowest Lack of liquidity foreseen Unlikely option under current fiscal balance
Government bonds Modest Subject to credit line of the government
PNOC has not issued bonds in the past
Government budget backed by concessional loans
Low Currency fluctuation risk Technical assistance / transfer will be available with many of the cases
Private Finance High Available only with private initiatives
Not suitable for projects with marginal return
Source: Formulated by JICA study team Expected wheeling charges were compared in Chapter 8 of this report, for the cases in which the project is conducted on BOT basis with the case when government utilizes the concessional loan. The result turned out to be that the wheeling charge for the concessional loan case was 0.017 USD/Nm3, while that of BOT case was seen to require more than twice the wheeling charge compared with the concessional loan patterns, at 0.047 USD/Nm3. Table 9.2-3 Comparison of Wheeling Charges under Various Financing Options
Model Name [Model 0] [Model 2A] [Model 2B]
Project model Conventional BOT Model 2 (Separation)
Finance Market Procurement Concessional Loan Market Procurement
Wheeling Charges [USD/Nm3]
0.047 0.017 0.028
Source: Formulated by JICA study team (extract from Table 8.2-2) Given the non-negligible difference in expected wheeling charge between public and private financing options, BatMan 1 project, with the aim to promote the growth of a gas industry, will desirably be financed through public finance, backed by concessional loan. 9.2.4 Option for the Philippines: Government Owned, Government Financed Three topics, namely: examples in other countries, importance of proper market regulation, and requirements for low capital cost, all indicated the necessity for the government to implement this BatMan 1 project. The common conclusions from three topics discussed are all derived from a common goal: to promote the growth of gas industry in the Philippines. In other words, the project, if implemented by the private sector, the approach to the goal is likely to become significantly different from the current assumption: to encourage fair competition among the companies. An appropriate option for the development of BatMan 1 gas transmission pipeline is to have it implemented by the government. This does not signify that the government can be, and should be, taking care of all of the tasks in the project. Active participation of private sector is an essential factor for the project to become efficient and sustainable. Actual scheme to encourage private sector participation will be elaborated in the next section.
. 9-8
9.3 Project Model to Encourage Participation of the Private Sector Appropriate modality, or project model, will now have to be considered based on the assumption that BatMan 1 project will be conducted under the initiative of the government. The project model to be identified should, first of all, enable the government to be able to finance, own and regulate the gas transmission pipeline. Further, with the aim to enable the project to be pursued in an efficient manner, participation of private sector will also have to be encouraged. A model to encourage private participation will have to be considered with regard to the required tasks within the project. Tasks may be sorted into two groups; one is the tasks suitable to be taken by the public sector, and the other, by the private sector. Tasks may therefore be allocated to either public or private depending on their characteristics as well as on the capability of each of the sectors. 9.3.1 Major Tasks and their Allocation Tasks or functions, which will be required in an infrastructure development project, will broadly be the following five tasks: designing constructing, financing, owning and operating. Operation may further be broken down to management, technical maintenance & repairs, marketing. (1) Designing Specifications and detailed design will be provided by the project implementing entity, which is assumed to be the government. Desirable form of specification is the output-based specification (or requirements), as opposed to conventional input-based specifications / requirements.13 This will allow the EPC contractor to introduce innovative considerations for the facility to be constructed and maintained in more efficient manner, at the same time as meeting the standards stipulated in the specification. (2) Building The task, whatever the project model, is likely to be pursued by an EPC contractor who will work under the supervision of the designing and controlled under the construction management consultant which is commonly the role of the designing consultant. The EPC contractor is expected to liaise with the technical maintenance & repair company so as to avoid interface risk after the completion / handover of the infrastructure. For this reason, EPC contract and technical maintenance & repair service contract, although separate as two contracts, may be awarded as a set to a single entity. (3) Financing Government finance if the preferred option so as to ensure that the cost of capital will be maintained at minimal level, allowing the pipeline usage tariff to be kept low to be able to encourage the development of the gas industry. In case of BOT, as well as with the privately initiated projects, the financing cost will become considerably high, as mentioned in Chapter 8 of this report. (4) Owning If market regulatory requirement, i.e. open and fair access is imposed, the act of owning of the infrastructure, as the task itself, will not bring about commercial benefits. Private businesses are therefore unlikely to show interest in owning the infrastructure. Government is expected to own the infrastructure and to provide requirement to whoever will manage and maintain the infrastructure.
13 c.f., for example, Farquharson E et al., How to Engage with the Private Sector in Public-Private Partnerships in Emerging Markets (PPIAF-World Bank, New York, 2011)
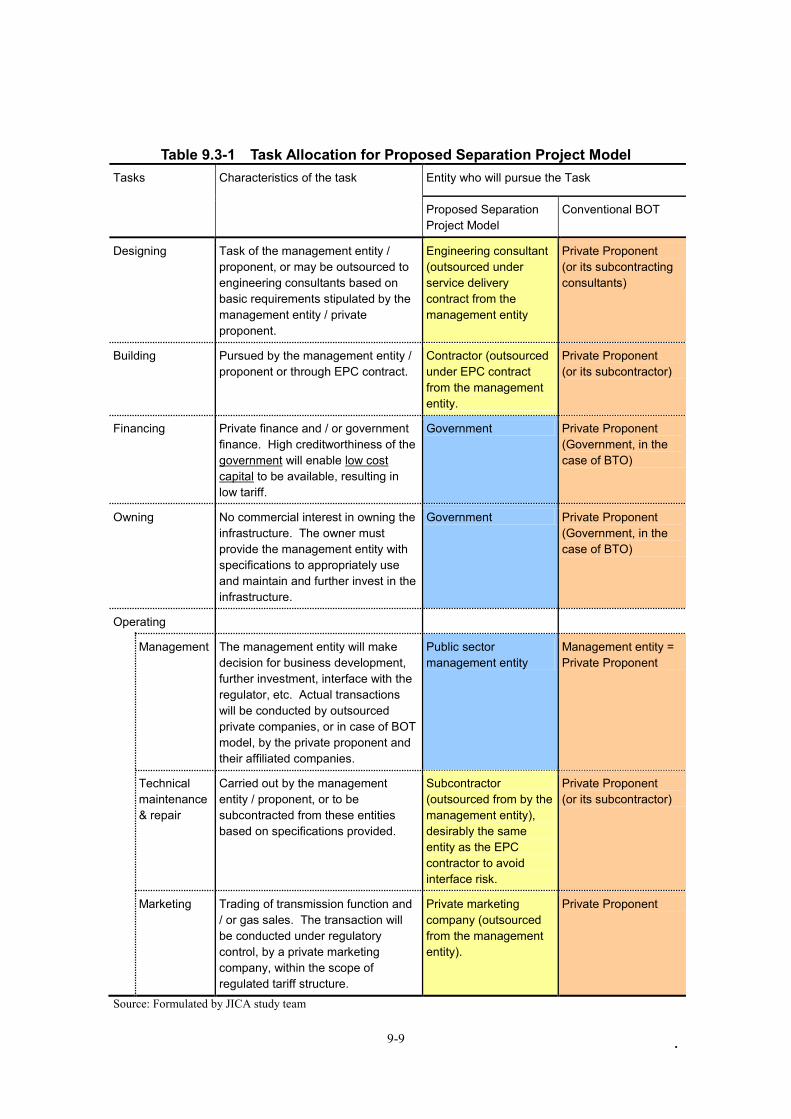
. 9-9
Table 9.3-1 Task Allocation for Proposed Separation Project Model
Tasks Characteristics of the task Entity who will pursue the Task
Proposed Separation Project Model
Conventional BOT
Designing Task of the management entity / proponent, or may be outsourced to engineering consultants based on basic requirements stipulated by the management entity / private proponent.
Engineering consultant (outsourced under service delivery contract from the management entity
Private Proponent (or its subcontracting consultants)
Building Pursued by the management entity / proponent or through EPC contract.
Contractor (outsourced under EPC contract from the management entity.
Private Proponent (or its subcontractor)
Financing Private finance and / or government finance. High creditworthiness of the government will enable low cost capital to be available, resulting in low tariff.
Government Private Proponent (Government, in the case of BTO)
Owning No commercial interest in owning the infrastructure. The owner must provide the management entity with specifications to appropriately use and maintain and further invest in the infrastructure.
Government Private Proponent (Government, in the case of BTO)
Operating
Management The management entity will make decision for business development, further investment, interface with the regulator, etc. Actual transactions will be conducted by outsourced private companies, or in case of BOT model, by the private proponent and their affiliated companies.
Public sector management entity
Management entity = Private Proponent
Technical maintenance & repair
Carried out by the management entity / proponent, or to be subcontracted from these entities based on specifications provided.
Subcontractor (outsourced from by the management entity), desirably the same entity as the EPC contractor to avoid interface risk.
Private Proponent (or its subcontractor)
Marketing Trading of transmission function and / or gas sales. The transaction will be conducted under regulatory control, by a private marketing company, within the scope of regulated tariff structure.
Private marketing company (outsourced from the management entity).
Private Proponent
Source: Formulated by JICA study team
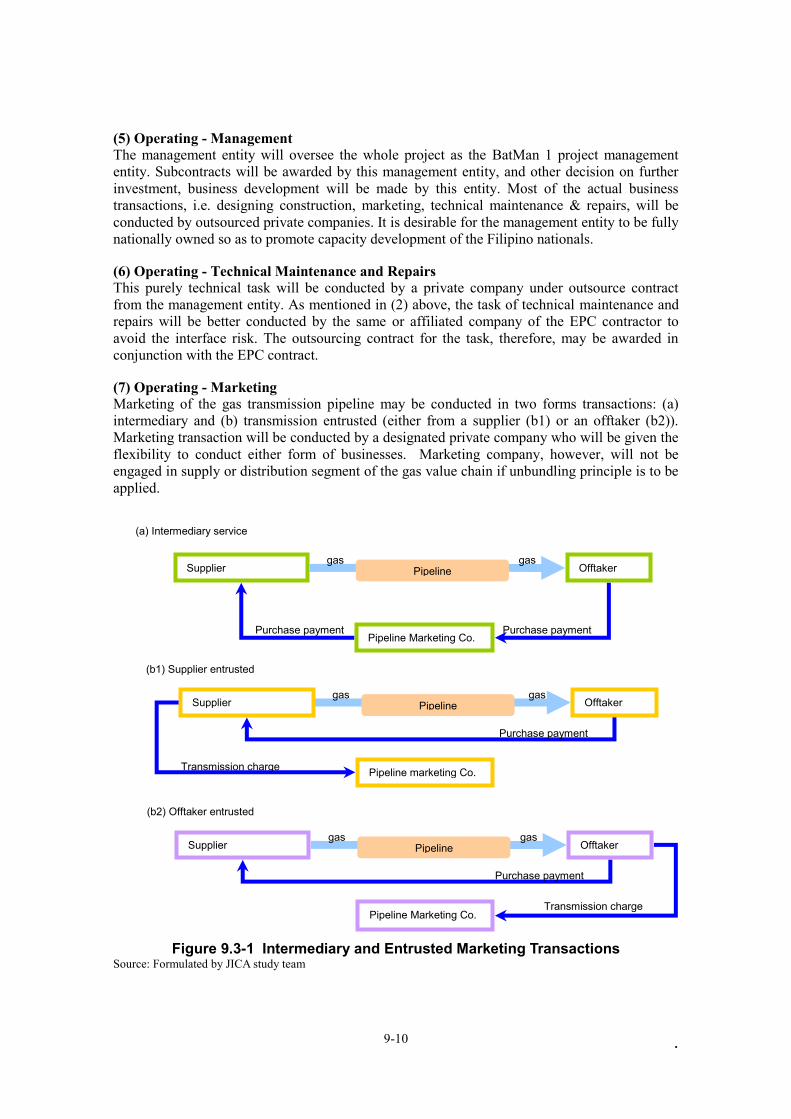
. 9-10
(5) Operating - Management The management entity will oversee the whole project as the BatMan 1 project management entity. Subcontracts will be awarded by this management entity, and other decision on further investment, business development will be made by this entity. Most of the actual business transactions, i.e. designing construction, marketing, technical maintenance & repairs, will be conducted by outsourced private companies. It is desirable for the management entity to be fully nationally owned so as to promote capacity development of the Filipino nationals. (6) Operating - Technical Maintenance and Repairs This purely technical task will be conducted by a private company under outsource contract from the management entity. As mentioned in (2) above, the task of technical maintenance and repairs will be better conducted by the same or affiliated company of the EPC contractor to avoid the interface risk. The outsourcing contract for the task, therefore, may be awarded in conjunction with the EPC contract. (7) Operating - Marketing Marketing of the gas transmission pipeline may be conducted in two forms transactions: (a) intermediary and (b) transmission entrusted (either from a supplier (b1) or an offtaker (b2)). Marketing transaction will be conducted by a designated private company who will be given the flexibility to conduct either form of businesses. Marketing company, however, will not be engaged in supply or distribution segment of the gas value chain if unbundling principle is to be applied.
Figure 9.3-1 Intermediary and Entrusted Marketing Transactions
Source: Formulated by JICA study team
Supplier Offtaker Pipeline
Pipeline Marketing Co.
gas gas
Purchase payment Purchase payment
Supplier Offtaker Pipeline
Pipeline marketing Co.
gas gas
Purchase payment
Transmission charge
Supplier Offtaker Pipeline
Pipeline Marketing Co.
gas gas
Purchase payment
Transmission charge
(a) Intermediary service
(b1) Supplier entrusted
(b2) Offtaker entrusted
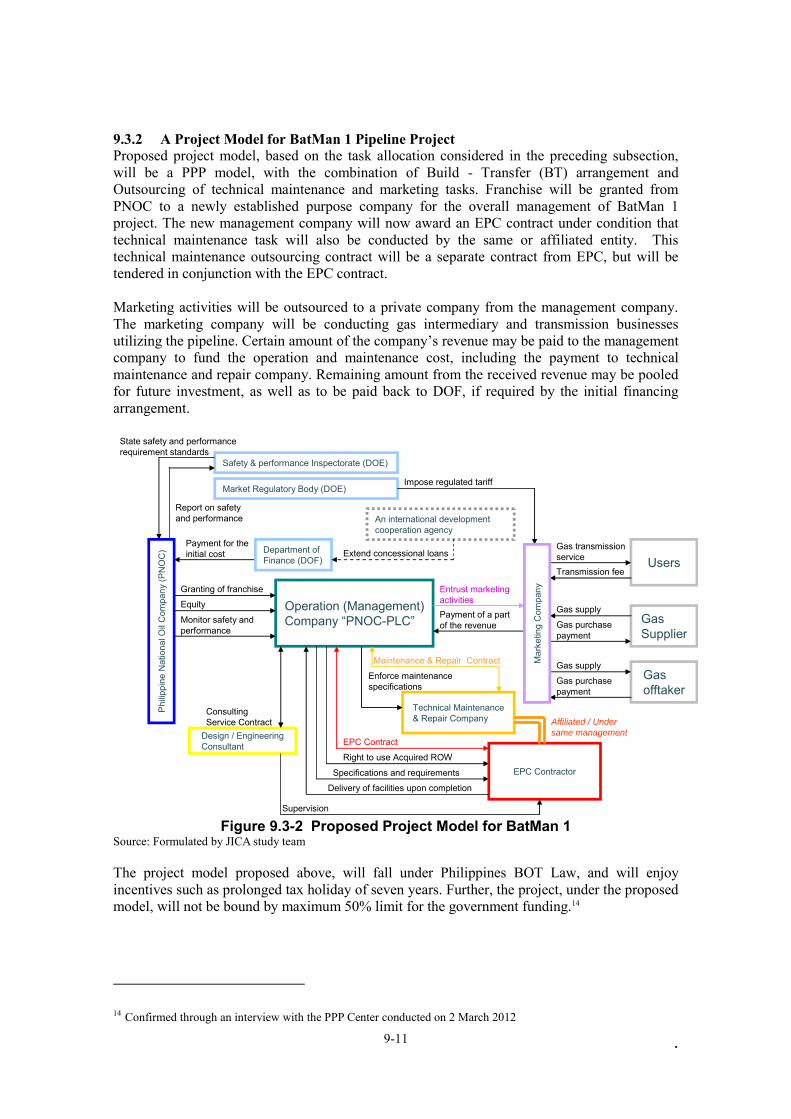
. 9-11
9.3.2 A Project Model for BatMan 1 Pipeline Project Proposed project model, based on the task allocation considered in the preceding subsection, will be a PPP model, with the combination of Build - Transfer (BT) arrangement and Outsourcing of technical maintenance and marketing tasks. Franchise will be granted from PNOC to a newly established purpose company for the overall management of BatMan 1 project. The new management company will now award an EPC contract under condition that technical maintenance task will also be conducted by the same or affiliated entity. This technical maintenance outsourcing contract will be a separate contract from EPC, but will be tendered in conjunction with the EPC contract. Marketing activities will be outsourced to a private company from the management company. The marketing company will be conducting gas intermediary and transmission businesses utilizing the pipeline. Certain amount of the company’s revenue may be paid to the management company to fund the operation and maintenance cost, including the payment to technical maintenance and repair company. Remaining amount from the received revenue may be pooled for future investment, as well as to be paid back to DOF, if required by the initial financing arrangement.
Market Regulatory Body (DOE)
Operation (Management) Company “PNOC-PLC”
Technical Maintenance & Repair Company
Users
Right to use Acquired ROW
Granting of franchise
Delivery of facilities upon completion
Payment for the initial cost
Enforce maintenance specifications
Impose regulated tariff
Monitor safety and performance
State safety and performance requirement standards
Specifications and requirements
Safety & performance Inspectorate (DOE)
Report on safety and performance
EPC Contractor
Gas transmission serviceTransmission fee
Gas Supplier
Gas offtaker
Gas supply
Gas purchase payment
Gas supply
Gas purchase payment
Design / Engineering Consultant EPC Contract
Consulting Service Contract
Maintenance & Repair Contract Mar
ketin
g C
ompa
ny
Philip
pine
Nat
iona
l Oil
Com
pany
(PN
OC
)
Equity
Department of Finance (DOF)
Supervision
An international development cooperation agency
Extend concessional loans
Entrust marketing activitiesPayment of a part of the revenue
Affiliated / Under
same management
Figure 9.3-2 Proposed Project Model for BatMan 1
Source: Formulated by JICA study team The project model proposed above, will fall under Philippines BOT Law, and will enjoy incentives such as prolonged tax holiday of seven years. Further, the project, under the proposed model, will not be bound by maximum 50% limit for the government funding.14
14 Confirmed through an interview with the PPP Center conducted on 2 March 2012

. 9-12
. 10-1
Chapter 10 Recommendation for Project Implementation 10.1 Basic Understanding of DOE for Project Implementation Current natural gas management administration activities are conducted based on policies stipulated in the following statutory instruments:
DOE Act of 1992 No. 7638 DOE Executive Order No. 66 Designating DOE as the Lead Agency in Developing
the Philippine Natural Gas Industry DOE Circular No. 2002-08-005
Further, the JICA Master plan, prepared in 2002 is also functioning as a reference for the direction of the gas industry development. The Study Team acknowledged that the priority projects for promotion of development of the gas industry have now been listed in the Medium Term Public Investment Program (PIP) of DOE, to be published by National Economic Development Authority (NEDA) in the first half of 2012. The list will include not only BatMan 1 pipeline project but also other projects in the supply segment as well as the end user segment. The Study Team also acknowledged in February 2012 that, with the finalization of this study, a Steering Committee (formerly named Technical Working Group) will be established to promote the implementation of the priority projects. The team, as the follow up activity of the study, initially intended to further support DOE to push forward the project by (i) preparing a framework document for proceeding with the top priority project, which is BatMan 1 project; (ii) supporting the preparation of bid documents based on the project model proposed by the team; (iii) supporting market sounding and stakeholder consultation by holding a focus group seminar on BatMan 1 project model decision, and; (iv) to invite a high ranked official with one technical staff of DOE to Japan to share among the team and DOE decision makers, the necessity to introduce strict safety standards and efficient operation & management system for gas transmission pipelines. As DOE requested the team to support the discussions at the Steering Committee on natural gas projects the follow up activities conducted in February to March 2012 was focused on (i) mentioned above, without (ii) (iv) and the seminar mentioned in (iii). The outcomes of the follow up activities are mostly reflected in Chapter 9 of this report. Results from the dialogues with the private stakeholders were reflected and incorporated in the context rather than referring to their actual comments. The Study Team conducted several high-level meetings with DOE and the consultations with the stakeholders in both of the public and private sectors as well as the information and view sharing at the final presentation. The basic understanding and the agreed views on the project implementation, which have been obtained and shared among the concerned project-related parties, are the followings:
Considering the current development status of the Philippines, it is preferable to have the gas pipeline developed and owned by the government given the nature of the public utility infrastructure and also to promote the growth of the gas industry. Since the knowledge and experiences of the private sector will be effective for the operation (mainly marketing and maintenance), the project may be developed by applying the ownership-operation separation model;
The formulation of the implementing organization will be carried out under coordination among the government offices, related organizations and institutions. DOE will examine the detailed procedures in the coming months;
The project preparation and implementation will require the selection of the
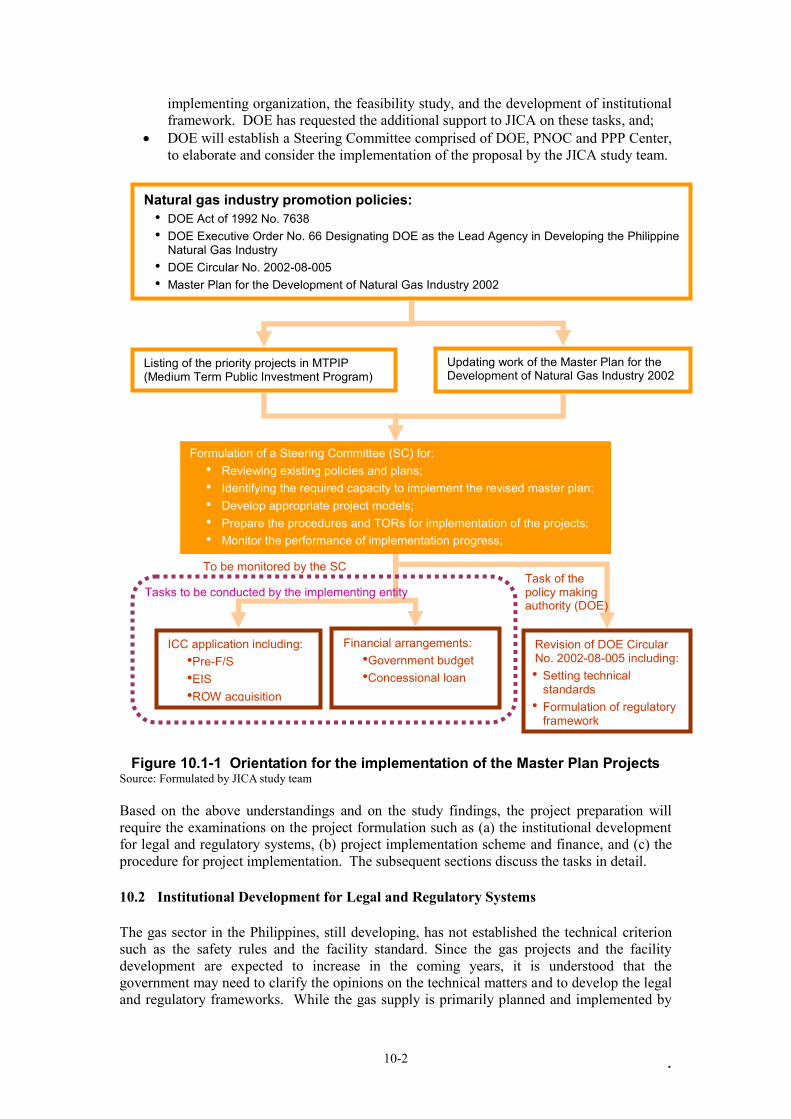
. 10-2
implementing organization, the feasibility study, and the development of institutional framework. DOE has requested the additional support to JICA on these tasks, and;
DOE will establish a Steering Committee comprised of DOE, PNOC and PPP Center, to elaborate and consider the implementation of the proposal by the JICA study team.
Figure 10.1-1 Orientation for the implementation of the Master Plan Projects Source: Formulated by JICA study team Based on the above understandings and on the study findings, the project preparation will require the examinations on the project formulation such as (a) the institutional development for legal and regulatory systems, (b) project implementation scheme and finance, and (c) the procedure for project implementation. The subsequent sections discuss the tasks in detail. 10.2 Institutional Development for Legal and Regulatory Systems The gas sector in the Philippines, still developing, has not established the technical criterion such as the safety rules and the facility standard. Since the gas projects and the facility development are expected to increase in the coming years, it is understood that the government may need to clarify the opinions on the technical matters and to develop the legal and regulatory frameworks. While the gas supply is primarily planned and implemented by
Formulation of a Steering Committee (SC) for: • Reviewing existing policies and plans; • Identifying the required capacity to implement the revised master plan; • Develop appropriate project models; • Prepare the procedures and TORs for implementation of the projects; • Monitor the performance of implementation progress;
Updating work of the Master Plan for the Development of Natural Gas Industry 2002
Listing of the priority projects in MTPIP (Medium Term Public Investment Program)
Revision of DOE Circular No. 2002-08-005 including: • Setting technical
standards • Formulation of regulatory
framework
ICC application including: •Pre-F/S •EIS •ROW acquisition
Natural gas industry promotion policies: • DOE Act of 1992 No. 7638 • DOE Executive Order No. 66 Designating DOE as the Lead Agency in Developing the Philippine
Natural Gas Industry • DOE Circular No. 2002-08-005 • Master Plan for the Development of Natural Gas Industry 2002
Financial arrangements: •Government budget •Concessional loan
Task of the policy making authority (DOE)
To be monitored by the SC
Tasks to be conducted by the implementing entity
. 10-3
the gas suppliers, the central government offices will need to study the supply security and the necessary supports for the suppliers from the viewpoints of the energy supply security and the improvement of the policy to attract industries. The action items would include the following. The schedule for the action items are also summarized at the end of this chapter.
Review of laws and regulations on the gas sector Study of the current circular on the gas sector Study of the establishment of the regulatory commissions on the gas sector Study of the regulations on the approvals of the gas pricing Study of the standards for safety, security and inspection
10.3 Feasibility Study for Project The Study conducted the basic design for the gas project, including the gas pipeline and the LNG terminal, based on the data available at hand at the time of the study period. Since the Study rests in the category of the pre-feasibility study, the feasibility study needs to be carried out in order to enhance the accuracy of the projections in the study. This would aim to develop the documents that can be applied to the project bidding through the design of the structures and facilities based on the basic information such as the topographical map, geological data, meteorological and oceanographic data, and seismic information. The data required for the study will include;
Oceanographic data (water depth, wave, wind, current, tide level) Foundation data Land use and Right-of-Way data Information on underground structures
The report also needs to be developed based on the data required for the environmental and social impact assessment. The detailed information on the right-of-way for project development, for instance, should be compiled and presented to the project-implementing agency. It is understood that the environmental and social issues should be basically addressed by the implementing agency. It is however necessary for the central government offices to confirm the relevancy of the countermeasures by the implementing agency. The conditions in the JICA guideline also needs to be met in order to clear the loan appraisal in addition to the environmental and social considerations by the Philippines laws. The supply source for the gas pipeline tentatively expects the utilization of the Malampaya gas supply. The detailed conditions of the transaction should be examined. The overall future gas supply scenario should also be studied as to the suppliers, amount and the purchase conditions. 10.4 Project Model Scheme and Finance The first action would be the decision making of the implementing organization from those candidates including the institutions that carry the current franchise right. There is also a need for the government to conduct the detailed design of the public private partnership, coordinate with the relevant organizations on the funding sources and procedures, and to put together the first draft of the business scheme. Moreover it is important to share the information with the private sector and to obtain the understanding on the project implementation. In connection with the financing for the project, it is important to confirm the required procedures for the relevant organizations if the project seeks the public finance and/or the donor funding such as JICA ODA loan. Finally, the country does not have any large-scale
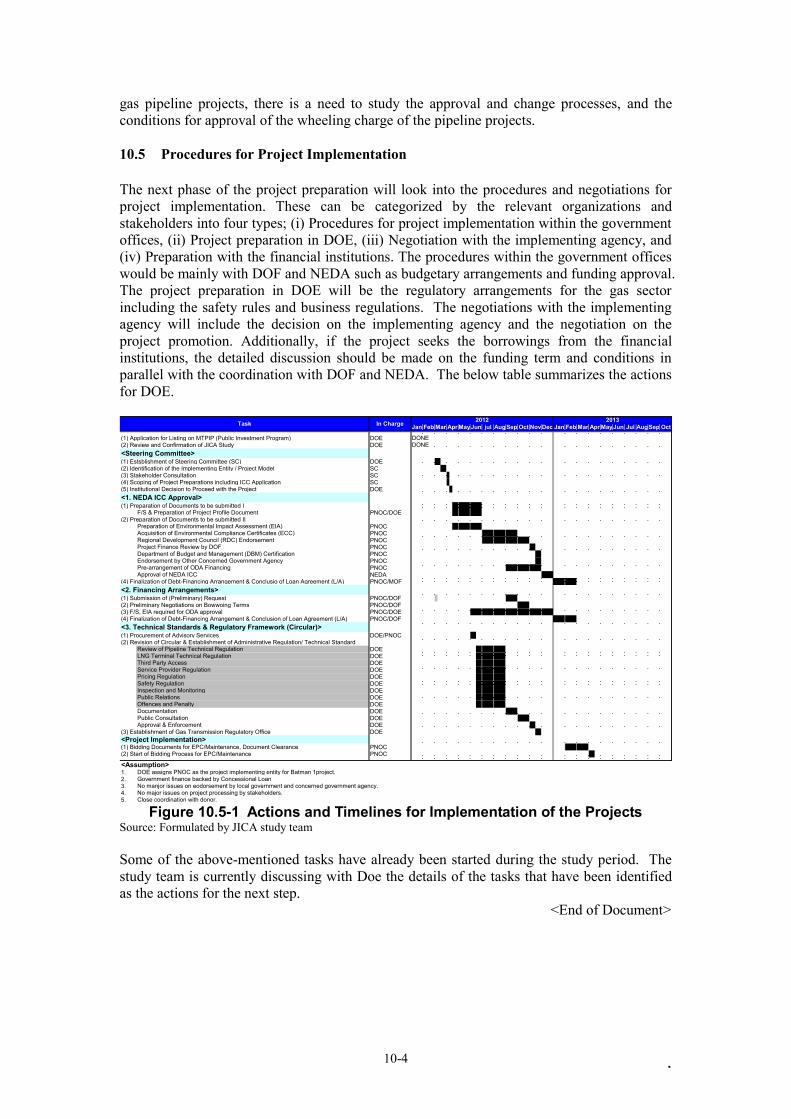
. 10-4
gas pipeline projects, there is a need to study the approval and change processes, and the conditions for approval of the wheeling charge of the pipeline projects. 10.5 Procedures for Project Implementation The next phase of the project preparation will look into the procedures and negotiations for project implementation. These can be categorized by the relevant organizations and stakeholders into four types; (i) Procedures for project implementation within the government offices, (ii) Project preparation in DOE, (iii) Negotiation with the implementing agency, and (iv) Preparation with the financial institutions. The procedures within the government offices would be mainly with DOF and NEDA such as budgetary arrangements and funding approval. The project preparation in DOE will be the regulatory arrangements for the gas sector including the safety rules and business regulations. The negotiations with the implementing agency will include the decision on the implementing agency and the negotiation on the project promotion. Additionally, if the project seeks the borrowings from the financial institutions, the detailed discussion should be made on the funding term and conditions in parallel with the coordination with DOF and NEDA. The below table summarizes the actions for DOE.
(1) Application for Listing on MTPIP (Public Investment Program) DOE DONE(2) Review and Confirmation of JICA Study DOE DONE<Steering Committee>(1) Estsblishment of Steering Committee (SC) DOE(2) Identification of the Implementing Entity / Project Model SC(3) Stakeholder Consultation SC(4) Scoping of Project Preparations including ICC Application SC(5) Institutional Decision to Proceed with the Project DOE<1. NEDA ICC Approval>(1) Preparation of Documents to be submitted I
F/S & Preparation of Project Profile Document PNOC/DOE(2) Preparation of Documents to be submitted II
Preparation of Environmental Impact Assessment (EIA) PNOCAcquisition of Environmental Compliance Certificates (ECC) PNOCRegional Development Council (RDC) Endorsement PNOCProject Finance Review by DOF PNOCDepartment of Budget and Management (DBM) Certification PNOCEndorsement by Other Concerned Government Agency PNOCPre-arrangement of ODA Financing PNOCApproval of NEDA ICC NEDA
(4) Finalization of Debt-Financing Arrangement & Conclusio of Loan Agreement (L/A) PNOC/MOF<2. Financing Arrangements>(1) Submission of (Preliminary) Request PNOC/DOF(2) Preliminary Negotiations on Bowwoing Terms PNOC/DOF(3) F/S, EIA required for ODA approval PNOC/DOE(4) Finalization of Debt-Financing Arrangement & Conclusion of Loan Agreement (L/A) PNOC/DOF<3. Technical Standards & Regulatory Framework (Circular)>(1) Procurement of Advisory Services DOE/PNOC(2) Revision of Circular & Establishment of Administrative Regulation/ Technical Standard
Review of Pipeline Technical Regulation DOELNG Terminal Technical Regulation DOEThird Party Access DOEService Provider Regulation DOEPricing Regulation DOESafety Regulation DOEInspection and Monitoring DOEPublic Relations DOEOffences and Penalty DOEDocumentation DOEPublic Consultation DOEApproval & Enforcement DOE
(3) Establishment of Gas Transmission Regulatory Office DOE<Project Implementation>(1) Bidding Documents for EPC/Maintenance, Document Clearance PNOC(2) Start of Bidding Process for EPC/Maintenance PNOC
<Assumption>1. DOE assigns PNOC as the project implementing entity for Batman 1project.2. Government finance backed by Concessional Loan 3. No manjor issues on eodorsement by local government and concerned government agency.4. No major issues on project processing by stakeholders.5. Close coordination with donor.
Task AugSepFeb MarIn Charge 2012Jan Jun jul Jun
2013OctSepJul AugMayJanApr May AprFeb MarOct NovDec
Figure 10.5-1 Actions and Timelines for Implementation of the Projects
Source: Formulated by JICA study team Some of the above-mentioned tasks have already been started during the study period. The study team is currently discussing with Doe the details of the tasks that have been identified as the actions for the next step. <End of Document>