Embed Size (px)
Citation preview

Final Report of Minor Research Project 2015
Evaluation of Adsorption Capacity of Low Cost adsorbent For the Removal of Hazardous Chemicals Page 1

Final Report of Minor Research Project 2015
Evaluation of Adsorption Capacity of Low Cost adsorbent For the Removal of Hazardous Chemicals Page 2
Phone -02441-239621 E Mail: [email protected]
Anand Charitable Sanstha Ashti’s
ANANDRAO DHONDE ALIAS BABAJI MAHAVIDYALAYA
¼ ARTS, COMM. & SCI. ½
KADA, TQ-ASHTI, DIST-BEED.
NAAC Accredited C++ Grade
Secretary- Hon. Bhimrao Dhonde (M.L.A) Prin. Dr. H . G. VIDHATE.
Date : 29./07/2015.
CERTIFICATE
This is to certify that Mr. Jirekar Dattatraya
Babasaheb has satisfactory completed his minor research
project in entitled “Evaluation of adsorption capacity of low
cost adsorbent for the removal of hazardous chemicals” in
the subject of Chemistry as laid down in the regulation of
University Grand Commission during the academic year
march-2012 to 2015.
Signature of the principal Investigator
Final Report of Minor Research Project 2015
Evaluation of Adsorption Capacity of Low Cost adsorbent For the Removal of Hazardous Chemicals Page 3
1: Introduction 1-19
1.1. Introduction
1.2. Techniques of Removal of Hazardous Materials
1.3. Theories of adsorption
1.4. Thermodynamic Parameters
1.5. Kinetic model of adsorption
1.6. Selected adsorbents
References
2: Experimental Details 20-25
2.1. Preparation of adsorbents
2.2. Preparation of adsorbates
2.3. Parameters for Batch Adsorption Techniques
References
3: Experimental Results 26-37
3.1. Adsorption study of crystal violet on low cost materials
3.2. Adsorption study of methylene blue on low cost materials
3.3. Adsorption study of chromium metal ion on low cost materials
3.4. Adsorption study of nickel metal ion on low cost materials
4: Discussion 38-75
Publications

Final Report of Minor Research Project 2015
Evaluation of Adsorption Capacity of Low Cost adsorbent For the Removal of Hazardous Chemicals Page 4
Crystal Violet CV
Methylene Blue MB
Chromium Cr
Initial concentration 𝐶0
The equilibrium concentration (mg/L) 𝐶𝑒
Energy of adsorption b
Separation factor 𝑅𝐿
Adsorption capacity 𝑘𝑓
Equilibrium rate constants 𝐾𝑐
Langmuir constants relatrd to capacity of adsorption (mg/gm) 𝑄0
Freundlich equation constants (adsorption intensity) n
The amount of adsorbate adsorbed (mg/gm) at equilibrium time 𝑞𝑒
The amount of adsorbate adsorbed (mg/gm) at time t 𝑞𝑡
Gram gm
Minute min
Gibb’s free energy change ∆𝐺0
Enthalpy change ∆𝐻0
Entropy change ∆𝑆0
Concentration Conc
Gram seed husk GSH
Green gram seed husk GGSH
Black gram seed husk BGSH
Pea seed husk PSH
Masoor seed husk MsSH
Final Report of Minor Research Project 2015
Evaluation of Adsorption Capacity of Low Cost adsorbent For the Removal of Hazardous Chemicals Page 5
Evaluation of Adsorption Capacity of Low Cost adsorbent For
the Removal of Hazardous Chemicals
------------------------------------------------------------------------
1. Introduction
1.1 Introduction:
“Water is the hub of life" water is an important and life sustaining drinks to
humans and is essential to the survival of all organisms [1]. Many places water
availability is falling to crisis levels more than 80 countries, 40% of the world's
population are already facing water shortages by the year 2020, the world population will
double. The cost of water, infra-structure has risen dramatically. In the 21st century
environmental pollution is one of the major threats to human life. Among the different
types of pollution, waste water stream is one of the major problems due to the fact that
large amount of water used in our daily life. Waste water quality can be defined by
physical, chemical or biological characteristics; waste water generally contains toxic
inorganic and organic pollutants. Inorganic pollutants consist of mineral acids, inorganic
salts, finely divided metal compounds, trace elements, cyanides, nutrients, and
organometallic compounds. There are several classes of water pollutants. The first
category includes disease causing agents like bacteria, viruses, protozoa and parasitic
worms that enter sewage systems and untreated waste. The second category of water
pollutants is oxygen demanding wastes, wastes that can be decomposed by oxygen
requiring bacteria, when large populations of decomposing bacteria are converting these
wastes it can deplete oxygen levels in the water. This causes other organisms in the water
such as fish, algae, fungi etc. to die. The third class of water pollutants is water soluble
inorganic pollutants such as acids, salts, and toxic metals. Large quantities of these
compounds make water unfit to drink and cause the death of life. Another class of water
pollutants is nutrients; they are water soluble nitrates and phosphates that cause excessive
growth of algae and other water plants which deplete the water's oxygen supply. It kills
fish. If it finds in drinking water, it is fatal to children.
The introduction of waste products in the environment is a worldwide problem
that has been highlighted by various environmentalist groups. Colored organic effluent is
produced in industries such as textile, oil, rubber, paper, plastic pesticides cosmetics etc.
Discharging of dyes into water resources even in a small amount can affect the aquatic
life and food web. Dyes can also cause allergic dermatitis and skin irritation some of
them have been reported to be carcinogenic and mutagenic for aquatic organisms [2].
Finally water soluble radioactive compounds cause diseases like cancer, birth
defects and genetic damage are thus very dangerous water pollutants.
Non potable forms of waste water generated by humans may be referred to as
grey water, which is treatable and thus easily able to make potable again and black water,
Final Report of Minor Research Project 2015
Evaluation of Adsorption Capacity of Low Cost adsorbent For the Removal of Hazardous Chemicals Page 6
which generally contains sewage. Grey water is defined as wastewater produced in
bathtubs, showers, wash basins, laundry machines and kitchen sinks [3]. The primary
contaminants present in grey water are surfactants, nitrates, chlorides, phosphates and
sulphates. Grey water can hence be viewed as a valuable resource of nutrients and it can
be used for horticultural and agricultural applications. The World Health Organization
(WHO) estimates that safe water could prevent 1- 4 million child deaths from diarrhea in
every year [4].
Some of trace elements play essential role in biological process, but at higher
concentrations they may be toxic to the biota, they disturb the biochemical process and
causes hazards. These elements include metals (Cd, Cr, Co, Cu, Zn, Pd, Hg, Ni and Ag)
and metalloids (Se, As, Sb) most of the traced elements are transition metals with
variable oxidation states and co-ordination number. These metals forms complexes with
organisms in the environment there by increasing their mobility in the biota and main fest
toxic effects [5-7].
In 2006 water borne diseases were estimated to cause 1- 8 million deaths each
year while about 1.1 billion people lacked proper drinking water [8]. It is clear that
people in the developing world need to have access to good quality water in sufficient
quantity, water purification technology availability and distribution systems for water.
Water pollution by organic compounds has increased tremendously due to
increases in industrial and animal production activity. Color stuff discharged from
industries poses certain hazards and environmental problems. The colored compounds are
not only aesthetically displeasing but also inhibiting sunlight penetration into stream and
affecting aquatic ecosystem. Dyes usually have complex aromatic molecular structures
which make them more stable and difficult to biodegrade. Furthermore, many dyes are
toxic to some microorganisms and may cause direct destruction or inhibition of their
catalytic capabilities.
Many types of dye are used in textile industries such as direct reactive, acidic and
basic dyes. Most of these dyes represent acute problems to the ecological system as they
considered toxic and have carcinogenic properties which make the water inhibitory to
aquatic life. Due to their chemical structure dyes possess a high potential to resist fading
on exposure to light and water. The main sources of waste water generated by the textile
industry originate from the washing and bleaching of natural fibers and from the dyeing
and finishing steps.
Waste water effluents from different industries such as textile rubber, paper and
plastics, fertilizer, paints and pigments, wood pulp, printed circuit board, paints and
pigments contains several kinds of synthetic dyestuffs [9], activated carbon [10-12],
polymers [13,14], organic molecules [15,16], pesticides [17], dyes [18,19], cosmetics
[20,21], pharmaceutical paint electroplating [22,23], food tanneries, leather, dye
manufacturing [24], battery manufacturing [25], metal soldering, ceramics, surface
Final Report of Minor Research Project 2015
Evaluation of Adsorption Capacity of Low Cost adsorbent For the Removal of Hazardous Chemicals Page 7
treatment, electro-galvanization [26], painting, coating, mining, extractive metallurgy,
nuclear [27], and other industries. For the present study, the following dyes and metal
ions were selected their properties are given in the following pages.
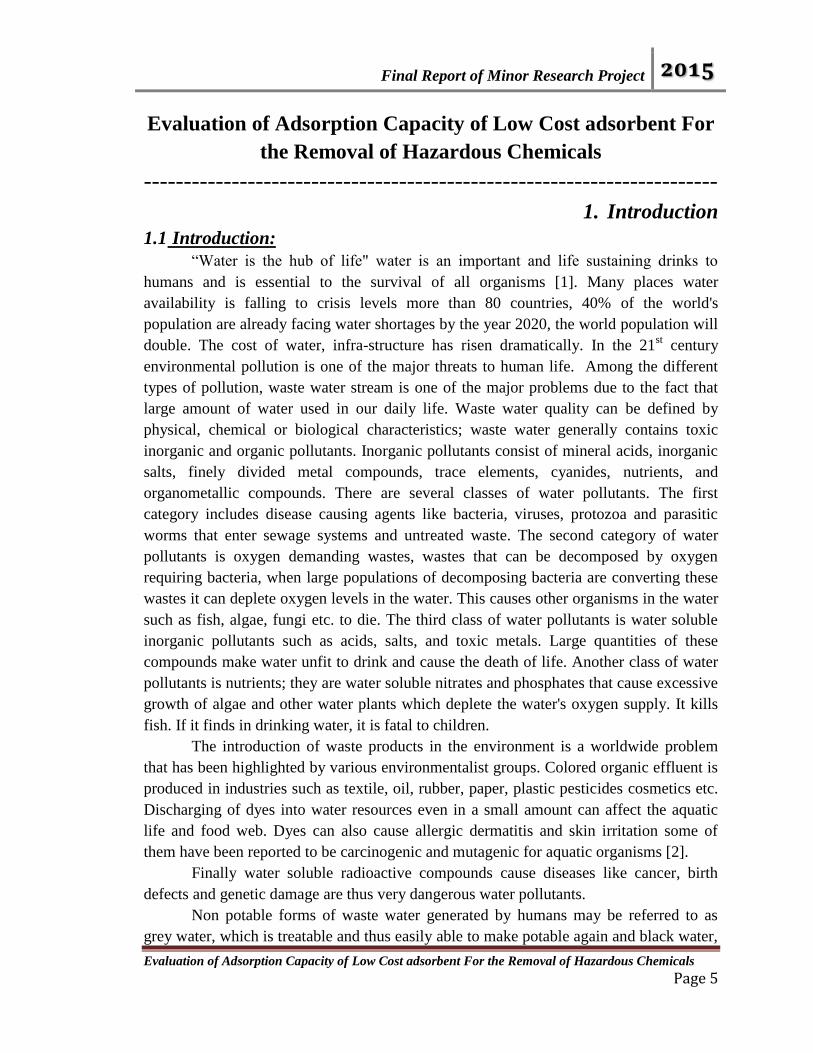
1.1.1 Crystal Violet (CV):
Crystal violet is a triarylmethane dye. It is widely used to dye paper and as a
component of navy blue and black inks for printing, ball-point pens and ink-jet printers. It
is also used to colorize diverse products such as fertilizers, anti-freezes detergents and
leather jackets. It is used medically for marking the skin for surgery, finger prints, tissue-
stain etc. The molecular formula is C25N3H30Cl and molecular weight is 407.979
gm./mole [28]. The structure of Crystal violet is shown in figure.2.
[ Tris (4-(dimethylamino) phenyl) methylium chloride ]
Figure: 1. Chemical structure of crystal violet.
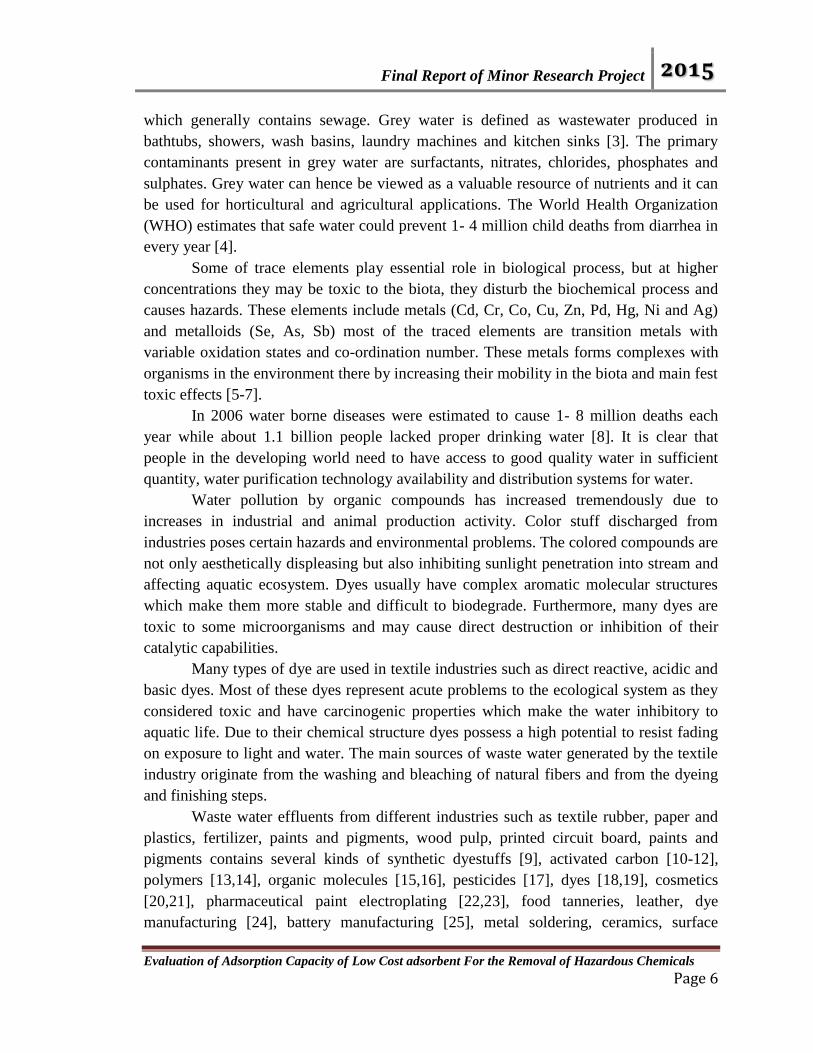
1.1.2 Methylene Blue (MB):
It is a heterocyclic aromatic chemical compound with the molecular formula
C16H18N3SCl molecular weight is 319.85 gm./mol. IUPAC name is 3,7-bis
(Dimethylamino) phenothiazin-5-ium chloride. It is a basic cationic dye, which is most
commonly used for coloring. It is widely used as a redox indicator in analytical
chemistry. It can also be used for printing calico, dyeing, printing cotton and tannin,
indicating oxidation-reduction, dyeing leather and in purified zinc-free form. It is used as
an antiseptic and for other medicinal purposes. The Chemical structure of methylene blue
is shown in figure 3.
Figure: 2. Chemical structure of methylene blue
Final Report of Minor Research Project 2015
Evaluation of Adsorption Capacity of Low Cost adsorbent For the Removal of Hazardous Chemicals Page 8
1.1.3 Chromium [Cr (VI)]:
It is the 24th
most abundant element in Earth’s crust with an average
concentration of 100 ppm Cr(VI) compounds are powerful oxidants at low or neutral pH.
Chromates are often used to manufacture, amongst other things, leather products, paints,
cement, mortar, anti-corrosives, tanning and electroplating and chrome-producing
manufactures. It has led to increase in chromium content of waste water.
1.1.4 Nickel [Ni (II)]:
Nickel is generated in the effluents from the production of stainless steel, alnico
magnets, coinage, rechargeable batteries, electric guitar strings, microphone capsules,
special alloys, plating, gas diffusion electrodes for alkaline fuel cells, catalysts for
hydrogenation reaction and inorganic chemicals manufacturing industries are also main
source of nickel pollution.
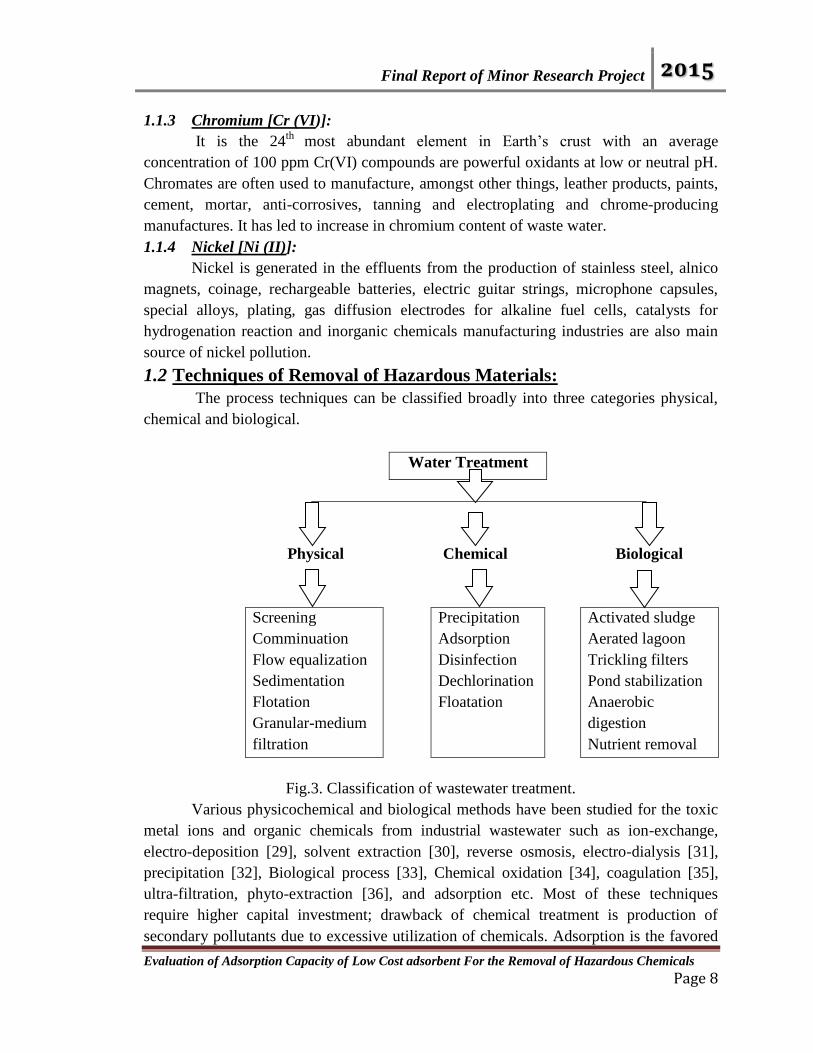
1.2 Techniques of Removal of Hazardous Materials:
The process techniques can be classified broadly into three categories physical,
chemical and biological.
Water Treatment
Physical Chemical Biological
Screening
Comminuation
Flow equalization
Sedimentation
Flotation
Granular-medium
filtration
Precipitation
Adsorption
Disinfection
Dechlorination
Floatation
Activated sludge
Aerated lagoon
Trickling filters
Pond stabilization
Anaerobic
digestion
Nutrient removal
Fig.3. Classification of wastewater treatment.
Various physicochemical and biological methods have been studied for the toxic
metal ions and organic chemicals from industrial wastewater such as ion-exchange,
electro-deposition [29], solvent extraction [30], reverse osmosis, electro-dialysis [31],
precipitation [32], Biological process [33], Chemical oxidation [34], coagulation [35],
ultra-filtration, phyto-extraction [36], and adsorption etc. Most of these techniques
require higher capital investment; drawback of chemical treatment is production of
secondary pollutants due to excessive utilization of chemicals. Adsorption is the favored
Final Report of Minor Research Project 2015
Evaluation of Adsorption Capacity of Low Cost adsorbent For the Removal of Hazardous Chemicals Page 9
technique over others because of its easy availability, widely studied mechanism, ease of
operation, simplicity in design, wider application and non-formation of by product [37,
38] as well as offering the potential for regeneration, recovery and recycling of the
adsorbent material. Hence, the use of low cost materials as possible removal of toxic
heavy metal ions and organic compounds from aqueous solution has been highlighted
recently. These materials come from agricultural products [39].
Literature survey reveals that agricultural bi-products are used for the adsorption
studies such as. Bale tree leaf powder [40], Leaves of Cauliflower [41], Bajara powder
[42], Soya been Husk [43], Maize corn cob, jatropha oil cake, sugar cane bagasse [44],
Oak wood sawdust [45], Rice straw [46], Pine Fruit [47], Almond husk [48], Banana Peel
[49], Papaya seeds [50], Babul Bark [51], Coconut leaves [52], Neem leaves [53],
Sawdust[54] Maize leaf [55], etc
1.3 Theories of adsorption:
1.3.1 Langmuir adsorption theory: - Irving Langmuir was the first to derive a
scientifically based adsorption isotherm in 1918 [56]. Langmuir adsorption isotherm
describes quantitatively the formation of a monolayer adsorbate on the outer surface of
the adsorbent and after that no further adsorption takes place. The Langmuir isotherm is
valid for monolayer adsorption onto the surface containing a finite number of identical
sites.
The linear form of the equation is given by, 𝐶𝑒
𝑞𝑒 = (
1
𝑄0) 𝐶𝑒 +
1
𝑏𝑄0 or
1
𝑞𝑒 = (
1
𝑄0) +
1
𝑏𝑄0𝐶𝑒 (1)
Where, 𝐶𝑒 (mg/L) is the equilibrium concentration of the adsorbate, 𝑞𝑒 (mg/gm) is the
amount of adsorbate adsorbed per unit mass of adsorbent, at equilibrium, 𝑄0 (mg/gm) and
b (L/mg) are Langmuir constants related to maximum monolayer adsorption capacity and
energy of adsorption respectively. The values of 𝑄0 and b are calculated from the slope
and intercept of plot of 𝐶𝑒
𝑞𝑒 against 𝐶𝑒 respectively [57, 58]. The essential features of the
Langmuir isotherm may be expressed in terms of equilibrium parameter 𝑅𝐿. Which is a
dimensionless constant referred to as separation factor or equilibrium parameter [59].
𝑅𝐿 = 1
1+𝑏𝐶0 (2)
Where, 𝐶0 is initial concentration in ppm and b is Langmuir constant related to the
energy of adsorption. 𝑅𝐿 Value indicates the adsorption nature to be either unfavorable if
𝑅𝐿 > 1, linear if 𝑅𝐿= 1, favorable if 0 < 𝑅𝐿< 1 and irreversible if, 𝑅𝐿 = 0 .
1.3.2 Freundlich adsorption isotherm theory:- The first mathematical fit to an
isotherm was published by Freundlich and Kuster in 1894, and is a purely empirical
formula for gaseous adsorbates.
𝑥
𝑚 = 𝐾𝑓𝑃1/𝑛 (3)
Final Report of Minor Research Project 2015
Evaluation of Adsorption Capacity of Low Cost adsorbent For the Removal of Hazardous Chemicals Page 10
Where, x is the quantity adsorbed, m is the mass of the adsorbent, P is the pressure of
adsorbate and 𝐾𝑓 and n are empirical constants for each adsorbent- adsorbate pair at a
given temperature.
Freundlich presented an empirical adsorption isotherm for non-ideal sorption on
heterogeneous surfaces as well as multilayer sorption and is also expressed as
𝑥
𝑚 = 𝐾𝑓𝐶𝑒
1/𝑛 (4)
Where 𝐶𝑒 is the equilibrium concentration of adsorbate (mg/L), The constants 𝐾𝑓 and n
can be obtained by taking log on both sides of equation (4) as follows,
log𝑥
𝑚 =
1
𝑛log 𝐶𝑒 + log 𝐾𝑓 (5)
The constant 𝐾𝑓 is an approximate indicator of adsorption capacity, while 1
𝑛 is a
function of the strength of adsorption in the adsorption process [60]. If 𝑛 = 1 then the
partition between the two phases are independent of the concentration. If value of 1
𝑛 is
below one, it indicates a normal adsorption, on the other hand 1
𝑛 being above one
indicates co-operative adsorption [61]. A plot of log𝑥
𝑚 against log 𝐶𝑒 gives a straight
line with an intercept on the ordinate axis. The value of n and 𝐾𝑓 can be obtained from
the slope and the intercept of the linear plot. The value of n is greater than unity, (1< n
<10), that means favorable adsorption [62].
1.4 Thermodynamic Parameters:
Thermodynamic Parameters such as Gibb's free energy change (∆𝐺0), enthalpy
change (∆𝐻0) and entropy change (∆𝑆0) were determined using the following equations
[63-66].
𝐾𝑐 = 𝐶𝑎𝑑
𝐶𝑒 (6)
∆𝐺0 = − 𝑅𝑇 ln 𝐾𝑐 (7)
Where, ∆𝐺0 = ∆𝐻0 − 𝑇∆𝑆0 (8)
log 𝐾𝑐 = ∆𝑆0
2.303𝑅 −
∆𝐻0
2.303𝑅𝑇 (9)
Where, 𝐾𝑐 is the equilibrium constant, 𝐶𝑎𝑑 is the amount of metal ion adsorbed per
liter of the solution at the equilibrium, 𝐶𝑒 is the equilibrium concentration (mg/L) of the
metal in the solution, T is the temperature in Kelvin and R is the gas constant
(8.314 J/mole).The values of ∆𝐻0 and ∆𝑆0 were determined from the slopes and
intercepts of the plot of log 𝐾𝑐 against 1
𝑇 respectively.
The Gibb's free energy change indicates the degree of spontaneity of the
adsorption process. The negative value of ∆𝐺0 indicates that the adsorption is favorable
and spontaneous [67, 68]. The positive value of ∆𝐻0 indicates physisorption and
endothermic nature of adsorption, while negative value of ∆𝐻0 suggests that the

Final Report of Minor Research Project 2015
Evaluation of Adsorption Capacity of Low Cost adsorbent For the Removal of Hazardous Chemicals Page 11
adsorption is exothermic [69, 70]. The positive value of ∆𝑆0 suggests that the increased
disorder and randomness at the solid solution interface with adsorption.
1.5 Kinetic model of adsorption:
Kinetic studies are significant for any kind of adsorption process. A kinetics study
was carried out to determine the equilibrium time required for the uptake of metals from
a liquid solution. Adsorption kinetics not only describes the adsorption mechanism but
also describes the adsorption rate which controls the contact time of adsorbate at the
solid-liquid interface [71]. The adsorption mechanism depends on the physical and
chemical characteristics of adsorbent and adsorbate, pH of medium, temperature, contact
time and mass transport process [72]. Various kinetic models can be suggested for an
adsorption including the Lagergren pseudo-first order kinetics and pseudo-second order
kinetics model [73, 74]. Pseudo-first order kinetics is present to describe the rate of
adsorption process in liquid-solid phase. The Lagergren pseudo-first order rate equation
is given as, 𝑑𝑞
𝑑𝑡 = 𝐾1(𝑞𝑒 − 𝑞𝑡) (10)
After definite integration by applications of the conditions 𝑡 = 0 to 𝑡 = 𝑡 and 𝑞 = 0 to
𝑞 = 𝑞𝑒 Equation (27) becomes,
ln(𝑞𝑒 − 𝑞𝑡) = ln 𝑞𝑒 − 𝐾1𝑡 (11)
log(𝑞𝑒 − 𝑞𝑡) = log 𝑞𝑒 − 𝐾1
2.303 𝑡 (12)
Where, 𝑞𝑒 (mg/gm) is the amount of adsorption at equilibrium, 𝑞𝑡 (mg/gm) denotes the
amount of adsorption at time t (min.) and 𝐾1 (min-1
) is the rate constant of the pseudo-
first order model. Based on experimental results, linear graphs were plotted between
log (𝑞𝑒 − 𝑞𝑡) versus t, to calculate 𝐾1, 𝑞𝑒 and 𝑅2.
The experimental data is not well fitted for pseudo-first order kinetic equation as
the low 𝑅2 values. The Kinetics data were also analyzed by pseudo-second order
equation. The pseudo-second order equation is developed by Ho can be written as 𝑑𝑞
𝑑𝑡= 𝐾2(𝑞𝑒 − 𝑞𝑡)2 (13)
Where, 𝐾2 (gm.mg-1
min-1
) is the rate constant of the pseudo-second order. Integrating
equation (30) for the boundary conditions 𝑡 = 0 to 𝑡 = 𝑡 and 𝑞 = 0 to 𝑞 = 𝑞𝑒 gives 1
(𝑞𝑒−𝑞𝑡) =
1
𝑞𝑒 + 𝐾2𝑡 (14)
The linear form of equation is 𝑡
𝑞𝑡 =
1
𝐾2 𝑞𝑒2 +
1
𝑞𝑒 t (15)
𝐾2 and 𝑞𝑒 can be obtained from the intercept and slope of plotting 𝑡 𝑞𝑡⁄ against 𝑡.
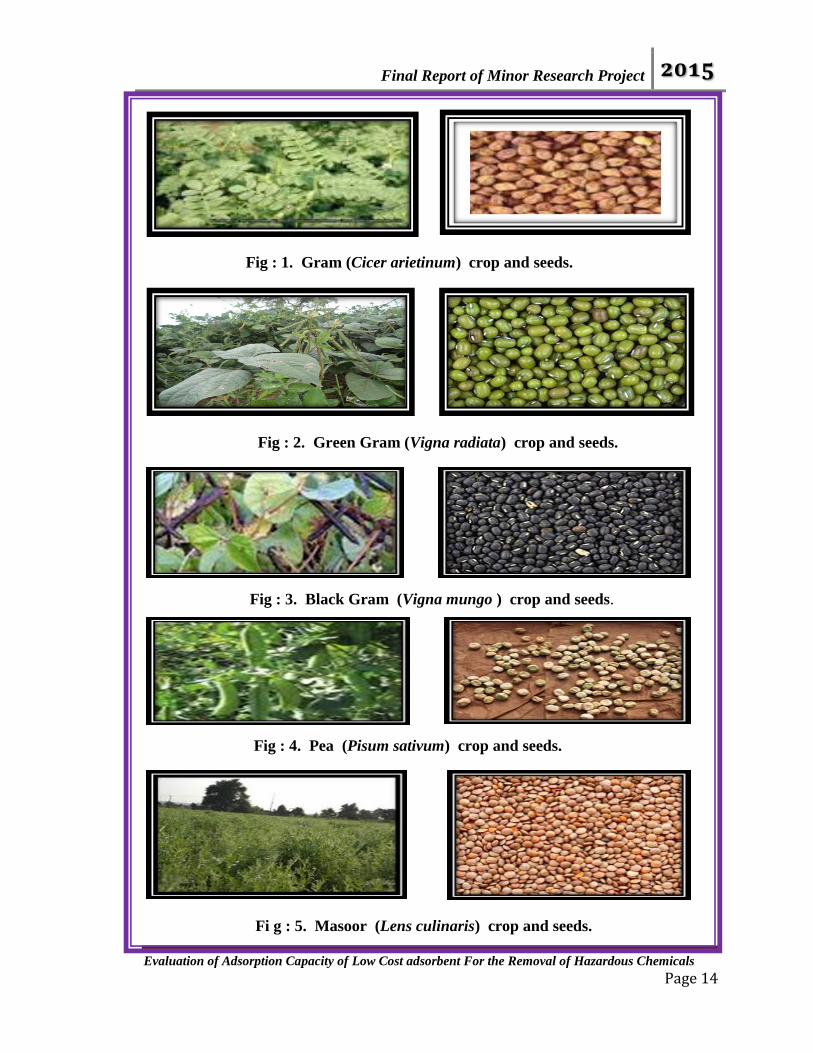
1.6 Selected adsorbents:- For the present work some low-cost agricultural
adsorbents were selected from dicotyledonous crop seeds are used to adsorption of
heavy metal ions as well as organic dyes .These are as follows.
Final Report of Minor Research Project 2015
Evaluation of Adsorption Capacity of Low Cost adsorbent For the Removal of Hazardous Chemicals Page 12
1.6.1 Gram crop:- Gram crop (Cicer arietinum) is a legume of the family
Fabaceae. Its seeds are high in proteins. It grows between 20-50 cm. high and has small
feathery leaves on either side of stem. It has white flowers with blue, violet or pink veins.
It needs a subtropical or tropical climate with more than 400 millimeters annual rain.
There are two main kinds of chickpea one is “desi” which small darker seeds and rough
coat, cultivated mostly in India,. It is also known as “Kala chana”, other is Kabuli, and
this has lighter coloured, larger seeds and smoother coat [75]. It is one of the earliest
cultivated vegetables. Husk and bits of dal are used as nutritional feed for animals. It is a
helpful source of Zinc, foliate and proteins .It has a very important role in human diet in
our country.
1.6.2 Green gram crop:- Green gram crop (Vigna radiata) is a legume of the
family Fabaceae. It is also called Mung bean. It is cultivated worldwide in tropical,
semitropical and temperate climates. Mung bean is an important grain legume in several
parts of Asia and is becoming increasingly used in many other countries due to its
nutritional values. The Plant normally produces a large number of flowers but most of
them abscise.
In India mung beans are stripped of their outer coats to make mung dal. The split
bean is green with the husk and yellow when dehusked. The mung bean contains anti-
oxidant and vitamin-E and B1, proteins, phosphorus and calcium for strong bones. As a
beauty treatment its beans are used for smooth skin, stop acne, black heals, body
slimming and to fertilize hair. Straw and husk are used as fodder for cattle.
1.6.3 Black gram crop:- Vigna mungo; known as black gram. It is a legume of
the family Fabaceae. It is an erect, sub erect or trailing, densely hairy, annual herb. The
tap root produces a branched root system with smooth, rounded nodules. The pods are
narrow, cylindrical and up to six cm long stem 30-60 cm. long, clothed with brownish
silky hairs. Leaves 3 folio late; leaflets 5–10 cm long, flowers yellow in axillary racemes,
pods subcylindric; 3.8–6.3 cm long. It is extensively cultivated all over the India. Green
pods of Udid are occasionally used as a vegetable. The black ripe pulse is split into dal
and is most fattening food.
1.6.4 Pea crop:- Pea crop (Pisum sativum) is a legume of the family Fabaceae.
Pisum sativum is an annual plant with a life cycle of one year. The pea is most commonly
the small spherical seed or the seed-pod of the pod fruit Pisum sativum. It is a cool
season crop, grown in many parts of the world planting can take place from winter to
early summer depending on location. The average height of pea crop is between 18-30
inches. It is most commonly green occasionally golden yellow in color.
The pea is most commonly the small seed or the seed pod of the pod fruit Pisum
sativum. The immature peas are used as vegetable.In India fresh peas are used in various
dishes, such as matar, matar paneer, salads etc. Peas are starchy, but high in fiber, protein,
vitamins, minerals, and lutein.
Final Report of Minor Research Project 2015
Evaluation of Adsorption Capacity of Low Cost adsorbent For the Removal of Hazardous Chemicals Page 13
1.6.5 Masoor crop:- Masoor crop (Lens esculent) is a legume of the family
Fabaceae. It is a 12-18 inch high, low bushy, weakly upright to semi-viny annual having
the general appearance of vetch. It has many soft, hairy branches with pinnately
compound leaves and numbenus oral leaflets. Flowers are white lilac pale blue the broad
smooth pods are only half inch long. Each pod bears two seeds which are thin lens
shaped usually smaller than pea seeds. Various color including brown and yellow.
Young pods used as vegetables. Its seeds are mostly eaten as dal; flour is used to
make soups, stews, purees, and mixed with cereals to make bread and cakes.
Final Report of Minor Research Project 2015
Evaluation of Adsorption Capacity of Low Cost adsorbent For the Removal of Hazardous Chemicals Page 14
Fig : 1. Gram (Cicer arietinum) crop and seeds.
Fig : 2. Green Gram (Vigna radiata) crop and seeds.
Fig : 3. Black Gram (Vigna mungo ) crop and seeds.
Fig : 4. Pea (Pisum sativum) crop and seeds.
Fi g : 5. Masoor (Lens culinaris) crop and seeds.
Final Report of Minor Research Project 2015
Evaluation of Adsorption Capacity of Low Cost adsorbent For the Removal of Hazardous Chemicals Page 15
References:
[1] Greenhalgh Alison, "Healthy liking water": B. B. C. Heath Retrieved, 2007-02-
19, (2001).
[2] Lorenc-Grabowska, E. Gra-zyna Gryglewicz, "Adsorption Characteristics of
Congo Red on coal based mesoporous activated Carbon, Dyes and pigments
74,34-40, (2007).
[3] N.Selvaraju and S. Pushpavanum; “Adsorption Characteristics on sand and brick
beds, Chem. Engg. Journal, 147, 130-138, (2009).
[4] WHO, Safe water and Global Heath, WHO int. 2008-06.25 Retiryed (2010).
[5] Arioli. S. Kinetic and thermodynamic studies on the adsorption of some metal
ions and dyes on low cost activated carbons Ph.D. Thesis, Gandhi-gram Rural
University, Gandhigram (2007).
[6] G. Sekaran K. A. Shanmugasundaram, M. Mariappan and K. Y. Raghavan
"Adsorption of dyes by buffing dust of leather industry. Ind. J. Chem. Technol., 2,
311-315, (1995).
[7] A. Arioli, P. Martin Deva, Prasath and M. Thenkuzhali "Adsorption of Chromium
ion by acid activated low cost carbon, ejeafche, 6(9), 2323-2340, (2007).
[8] U. S. Centers of Disease control and Prevention. Atlanta, Georgia "Safe Water
System" A low cost Technology for "Safe Drinking Water" fact sheet world water
forum 4 update march. (2006).
[9] Chiou M. S., Ho P. Y., Li. H. Y. "Adsorption of anionic dyes in acid solutions
using chemically cross-linked chitosan beds. Dye pigments 60, 69-84. (2004)
[10] S. Wang, H. Li. Kinetic modeling and mechanism of dye adsorption on unburned
carbon, Dyes pigments 72, 308-314, (2007).
[11] I. A. W. Tan, B. H. Hammeed, A. L. Ahmed, 'Equilibrium and kinetic studies on
basic dye adsorption by oil palm fiber activated Carbon, Chem. Eng. Journal 127,
111-119, (2007)
[12] M. J. Iqbal, M. N. Ashiq, Adsorption of dyes from aqueous solutions on activated
charcoal, J. Hazard Mater 139, 57-66, (2007)
[13] E. Y. Ozmen, M. Yilmaz, Use of β-Cyclodextrin and starch based polymers for
sorption of Congo red from aqueous solutions, J. Hazard Mater,02-042, (2007).
[14] M. Lehocky, A. Mracek, Improvement of dye adsorption on synthketic polyester
fibers by low temperature plasma pre-treatment czech. J. Phys. 56, 1277-1282,
(2006).
[15] A. Demirbas, A. Sari, O. Isildak "Adsorption thermodynamics of stearic and onto
bentonite. J. Hzard Mater, 135,226-231, (2006).
[16] F. Ayari, E. Srasra, M. Trabelsi-Ayadi, Retention of organic molecule
"Quinalizarin "by bentonitic clay saturated with different cations. Desalination,
206, 499-506, (2007).

Final Report of Minor Research Project 2015
Evaluation of Adsorption Capacity of Low Cost adsorbent For the Removal of Hazardous Chemicals Page 16
[17] E. Bojemueller, A. Nennemann, G. Lagaly, Enhanced pesticide adsorption by
thermally modified bentonites. Appl. Clay Sci.18, 277-284, (2001)
[18] Q.Y. Yue, Q. Li. B. Y. Gao. Y. Wang. Kinetics of adsorption of disperses dyes by
polyepichlorohydrin-dimethylamine cationic polymer/bentonite, Sep. Purif,
Technal, 54, 279-290, (2007).
[19] E. Eren, B. Afsin, Investigation of basic dye adsorption from aqueous solution
onto raw and pre-treated bentonite surfaces, Dyes Pigments 76, 220-225, (2008).
[20] T. Santhi, S. Manonmani, T. Smitha and K. Mahalakshami, Adsorption kinetics of
cationic dyes from aqueous solution by bio-adsorption onto activated carbon
prepared from cucumis, J. Appl. Sci. Enr. Sanitation, V(11).325-333, (2009).
[21] S. Saiful Azhar, A. Ghaniey Liew, D. Suhardy, K. Farizul Hafiz and M. D. Irfan
Hatim, Dye removal from aqueous solution by using adsorption on treated
sugarcane bagasse, Am. J. Appl. Sci. 2(11), 1499-1503, (2003).
[22] Yusra Safa and Haq Nawaz Bhatti, Factors affecting bio-sorption of direct dyes
from aqueous solution, Asian J. Chem. 22(9) 6625-6639, (2010).
[23] M. A. Tandel and B. N. Oza, Effect of powdered commercial and activated
charcoal on removal of copper and nickel from wastewater of electroplating
industry, Asian. J. Chem. 17(1). 415-422,(2005).
[24] Mas Rosemal, H. Mas Haris and Kathiresan Sathasivan, The removal of methyl
red from aqueous solutions using banana pseudo stem fibers, Am.J.Appl.Sci.6(19),
1690-1700, (2009).
[25] A. Ramesh D. J. Lee and J. W. C. Wong; Thermodynamic parameters for
adsorption equilibrium of heavy metals and dyes from wastewater with low-cost
adsorbents. J. Coll. and Interface Sci.291, 588-592, (2005).
[26] H.Hema and K. Shrinivasan; Adsorption kinetics and isotherm models for nickel
and cadmium removal from aqueous system, Int. J. Enr. Prot. 29(10), 849-858,
(2009).
[27] Mansur Anbia, Mohammad K Rofouel and Syed Waqif Husain; Mesoporous
lanthanum tungstate as a novel sorbent for removal of heavy metal ions from
aqueous media, Asian J. Chem.19(5),3862-3868,(2007).
[28] Indra Deo. Mall, Vimal Chandra Srivastara, Nitin Kumar Agarwal and Indra Mani
Mishtra, Removal of Congo red from aqueous solution by bagasse flyash and
activated carbon : Kinetic study and Equilibrium isotherm analysis, Chemosphere,
61; 492-501,(2005).
[29] Mazhar Farooqui, Sayyed Sultan, Maqdoom Farooqui and S. H. Quadri
Adsorption studies of heavy metal ion by low cost agricultural by-products Bajara
Powder, Ind. J. of Chem. Technol. 11, 190-193,(2004).

Final Report of Minor Research Project 2015
Evaluation of Adsorption Capacity of Low Cost adsorbent For the Removal of Hazardous Chemicals Page 17
[30] V. K. Gupta, C. K. Jain, I. Ali, M. Sharma, V. K. Saini, Removal of Cadmium
and nickel from wastewater using bagasse fly-ash, a sugar industry waste. J.
Colloid Interface Sci. 271(2), 321-328, (2003).
[31] H. Hasar, Adsorption of nickel (II) from aqueous solution onto activated carbon
prepared from almond husk, J. Hazard. Mater; B 97, 49-57, (2003).
[32] E. Remoudaki, A. Hatzikioseyian, K. Tsezos, M. Tsezos, The Mechanism of
metals precipitation by biologically generated alkalinity in biofilm reactors, Water
Res. 37(6) 3843-3854, (2003).
[33] Ledakowcz S., Solecka M., Zylla R., Bio-degradation, decolonization and
detoxification of textile wastewater enhanced by advanced oxidation process, J.
Biotechnol. 89,175-184, (2001).
[34] Qguz E., Keslinler B., Comparison among O3 , PAC adsorption O3=HCO3 , O3/
H2O2 and O3/ PAC processes for the removal of Bomaplex Red CR-L dye from
aqueous solution. Dyes Pigments: 74,329-334, (2007).
[35] Tak-Hyun K, Park C., Yang J., Kim S., Comparison of disperse and reactive dye
removals of chemical coagulation and Fenton oxidation , J. of Hazardous
Materials, 95-103, (2004).
[36] E. Erdem, N. Karapinar, R. Donat,The removal of heavy metal cations by natural
zeolites: J. of colloid and Interface Sci., 280, 309-314, (2004).
[37] M. Ahmaruzzamn, Adsorption of phenolic compounds on low-cost adsorbents; A
review Adv. Colloid, Intt. Sc. 143, 48-67, (2008).
[38] A. Bhatnagar and M. Sillanpaa, Utilization of agro-industrial and municipal waste
materials as potential adsorbents for water treatment, A review. Chem. Engg. J.,
157, 277- 296, (2010).
[39] Anjali S. Rajbhoj, S. T. Gaikwad and S. R. Sonone, Remoral of toxic metals from
aqueous solutions by chemically treated tur pods and banyan leaves, Asian J.
Chem. 17(4), 2415-2420,(2005).
[40] P. Senthil Kumar, K. Kirthik, Equilibrium and Kinetic Study of Adsorption of
Nickel from Aqueous Solution onto Bael Tree Leaf Powder: J. of Engi. Sci. and
Tech., 4,(4), 351-363, (2009).
[41] Mazahar Farooqui and Sandeep Kotharkar, Removal of Chromium (VI) from
Electroplating Effluent by Leaves of Cauliflower: Asian J. of Chem. 13.(3), 1237-
123, (2001).
[42] Mazahar Farooqui , Sayyad Sultan, Maqdoom Farooqui, S. H. Quadri,
Adsorption Studies of heavy metal ion by low Cost agricultural by-products-Bajra
powder: Ind. J. of Chem.Tech. ,11, 190-193, ( 2004).
[43] S. H. Quadri, Ahmed Zaheer, Mazahar Farooqui, Adsorption Studies of Some
Metal Ions on Soyabeen Husk Powder, Chemistry: An Ind. J. 1(6,) 483-
484,(2004).

Final Report of Minor Research Project 2015
Evaluation of Adsorption Capacity of Low Cost adsorbent For the Removal of Hazardous Chemicals Page 18
[44] Garg U. K., Kaur M. P, Garg V. and Suda D., Removal of hexavalent chromium
from aqueous solution by agricultural waste biomass, J. Hazard Mater, 140, 60-
68, (2007).
[45] Dulman, V., Cucu-Man, S., Popa, V. I. Sorption of some textile dyes by Oak
wood sawdust. Cellul. Chem. Technol. 36: 515-525, (2002).
[46] Gao H, Liu Y, Zeng G, Xu W, Li T and Xia W, Characterization Cr(VI) from
aqueous solutions by a surplus agricultural waste-Rice straw. J. Hazard. Mater.,
150, 446-452, (2008).
[47] Tariq S. Najim, Nazikj J. Elais and Alya A. Dawood; Adsorption of Copper and
Iron Using low Cost Material as adsorbent; E- J. of Chemistry, 6(1),161-168,
(2009).
[48] Halil Hasar, Adsorption of Nickel (II) from aqueous solution onto activated
carbon prepared from almond husk, J. of Hazard. Mater.; B97, 49-5,(2003).
[49] M. A. Hossain, H. Hao Ngo, W. S. Guo and T. V. Nguyen; Removal of Copper
from Water Adsorption onto Banana Peel as Bio-adsorbent, Int. J. of Geomate, 2,
(2),(4),227-234, (2012).
[50] Norhafizah binti Abd Hadi, Nurul Aimi binti Rohaizar, And Wong Chee
Sien, Removal of Cu (II) from Water by Adsorption on Papaya Seed; Asian Tran.
on Eng., 1(5),49-55, (2011).
[51] S. J. Patil, A. G. Bhole and G. S. Natarajan; Scavenging of Ni (II) Metal Ions by
Adsorption on PAC and Babhul Bark; J. of Environ. Sci. and Eng., 48, (3), 203-
208, (2006).
[52] Rudre Gowd, A. G. Nataraj and N. Manamohan Rao; Coconut Leaves as a low
cost Adsorbent for the Removal of Nickel from Electroplating effluents; Int. J. of
Scientific and Eng. Research,2,(12),12, (2012).
[53] Shiv Pratap Raghuvanshi, Renu Singh, and C. P. Kaushik, Adsorption of Congo
Red dye from Aqueous Solutions using Neem Leaves as Adsorbent, Asian J. of
Chem., 20, (7), 4994-5000, (2008).
[54] Ivo Safarik, Petra Lunackova, Ewa Mosiniewicz-Szablewska, Frantisek Weyda
and Mirka Safarikova, Adsorption of Water-soluble organic dyes on Ferro- fluid
modified sawdust, Hoizforschung.61,247-253, (2007).
[55] N. A. Adesola Gabardine, J. Oyebamiji Babalola and R. Adebowale Sanni, Bio-
sorption of lead ions from aqueous solutions by maize leaf, Int. J. of Physical Sci.,
(1), 023-026, (2006).
[56] Czepirdki L. Balys, M.R., Komorowska-Czepirsk E;“ Some generalization of
Langmuir a dsorption isotherm", Internet J. of Chemistry, 3(14), (2000).
[57] M. B. Ubale, J. V. Bharad and M. N. Farooqui, Adsorption studies of phenol on
goda sand a case study, Mat. Sci. Res. Ind. 02,(2), 115-120, (2004).

Final Report of Minor Research Project 2015
Evaluation of Adsorption Capacity of Low Cost adsorbent For the Removal of Hazardous Chemicals Page 19
[58] S. Amal Raj, “Adsorption behaviour of nickel on activated carbon”, Ind. J. Env.
Prot, 24, (7), 530-533, (2004).
[59] Mazhar Farooqui, Sayyad Sultan, Maqdoom Farooqui, and S. H. Quadri,
Adsorption studies of heavy metal ion by low cost agricultural by-products -
Bajara Powder, Ind. J. of Chem. Techol.11, 190-193, (2004).
[60] E. Voudrious, F. Fytionos and E. Bozani: Sorption Description isotherms of Dyes
from aqueous solutions and waste waters with Different materials, Global Nest.
The Int.Journal,4(1), 75-83, (2002).
[61] S. Mohan and J. Carthickeyan "Removal of lighin and tannin colour from aqueous
solution by adsorption on to activated carbon solution by adsorption on to
activated charcoal, Environ. pollut., 97,183-187,(1997).
[62] N. Kannan and P. Sarojini. “Studies on the removal of manganese (II) ions by
adsorption on commercial activated carbon”, Ind. Env. Prot. 30, (5), 404-408,
(2010).
[63] Sayyed Hussain, Sayyed Abed, Mazahar Farooqui, Adsorption studies of Fe (II)
on low cost biomaterials, Adv. Appl. Sci. Res.,1(3), 147-152 (2010).
[64] S. Arivoli, B. R. Venkatraman, T. Rajachandrasekar and M. Hema; Adsorption of
Ferrous Ion from Aqueous solution by loe cost Activated carbon obtained from
Natural Plant Material., Res. J. Chem. Envi.,17, 70-78, (2007).
[65] Renmin Gong, Yingzhi Sun, Jain Chen, Huijun Liu, Chao yang, Effect of
Chemical modification on Dye Adsorption Capacity of Peanut Hull., Dyes and
pigments 67, 179, 642-655, (2005).
[66] Vadivelan V, Vasanthkumar K., Equilibrium Kinetics mechanism and process
design for the sorption of Methylene Blue onto Rice Husk., J. Colloid Interf, Sci,
286,pp. 91, (2005).
[67] Y. C. Sharma, S. N. Kaul, C. H. Weng, Adsorption separation of Cadmium from
aqueous solutions and wastewaters by riverbed sand, Eng. Poll, 150, 251-257, (2007).
[68] T. Vimala, S. Agnes Pramila Mary, V. Thamizharasan and S. Arivoli; Kinetic
equilibrium and Mechanistic study for adsorption of ferrous ion, Ind. J. Env.
Prot., 27 (12), 1090-1097, (2007).
[69] P. Sivkukmar and P. N. Palanisamy; Law cost non-conventional activated carbon
for the removal of reactive red 4; Kinetic and isotherm studies, Rasayan J.
Chem.1 (4), 872-883, (2008).
[70] Zhanwang Zheng, Chunhua Xiong and Caiping Yow; Adsorption behavior of
SDA-200 resin towards p-nitrophenol in aqueous solution; Asian J. Chem.,22(3)
2003-2012, (2010).
[71] Ho, Y.S. and McKay, G. The kinetics of sorption of divalent metal ions onto
sphagnum moss flat, Water Research, 34(3), 735-742, (2000).

Final Report of Minor Research Project 2015
Evaluation of Adsorption Capacity of Low Cost adsorbent For the Removal of Hazardous Chemicals Page 20
[72] Achak M, Hafidi A, Ouazzani N., Sayadic S and Mandi L, Low cost biosorbent
banan peel for the removal of phenolic compounds from olive mill wastewater;
kinetic and equilibrium studies. J. Hazard Mate, 166, 117-125, (2009).
[73] K. K. Pandey, G. Prasad and V. N. Singh, Copper removal from aqueous solution
by flyash., Water Research, 19, 869-873, (1985).
[74] Susmita Sen Gupta, Krishna G.,Bhattacharyya, Kinetics of adsorption of metal ions
on inorganic materials: A review: Adv. in Colloid and Interface Sci., 162,39-58, (2011).
[75] Mansfelds World Data base of Agricultural and Horticultural crops, Cicer
arietinum mans feld ipk. gatersleben. Deretrieved, (2008).
********
Final Report of Minor Research Project 2015
Evaluation of Adsorption Capacity of Low Cost adsorbent For the Removal of Hazardous Chemicals Page 21
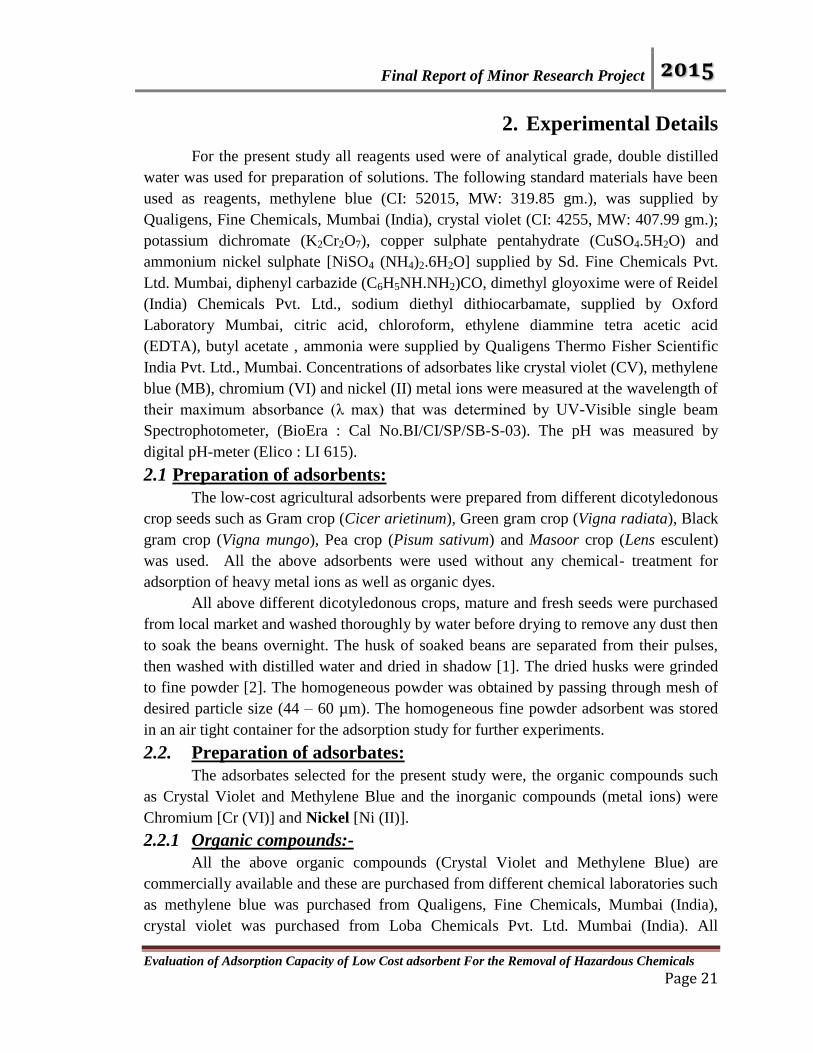
2. Experimental Details
For the present study all reagents used were of analytical grade, double distilled
water was used for preparation of solutions. The following standard materials have been
used as reagents, methylene blue (CI: 52015, MW: 319.85 gm.), was supplied by
Qualigens, Fine Chemicals, Mumbai (India), crystal violet (CI: 4255, MW: 407.99 gm.);
potassium dichromate (K2Cr2O7), copper sulphate pentahydrate (CuSO4.5H2O) and
ammonium nickel sulphate [NiSO4 (NH4)2.6H2O] supplied by Sd. Fine Chemicals Pvt.
Ltd. Mumbai, diphenyl carbazide (C6H5NH.NH2)CO, dimethyl gloyoxime were of Reidel
(India) Chemicals Pvt. Ltd., sodium diethyl dithiocarbamate, supplied by Oxford
Laboratory Mumbai, citric acid, chloroform, ethylene diammine tetra acetic acid
(EDTA), butyl acetate , ammonia were supplied by Qualigens Thermo Fisher Scientific
India Pvt. Ltd., Mumbai. Concentrations of adsorbates like crystal violet (CV), methylene
blue (MB), chromium (VI) and nickel (II) metal ions were measured at the wavelength of
their maximum absorbance (λ max) that was determined by UV-Visible single beam
Spectrophotometer, (BioEra : Cal No.BI/CI/SP/SB-S-03). The pH was measured by
digital pH-meter (Elico : LI 615).
2.1 Preparation of adsorbents:
The low-cost agricultural adsorbents were prepared from different dicotyledonous
crop seeds such as Gram crop (Cicer arietinum), Green gram crop (Vigna radiata), Black
gram crop (Vigna mungo), Pea crop (Pisum sativum) and Masoor crop (Lens esculent)
was used. All the above adsorbents were used without any chemical- treatment for
adsorption of heavy metal ions as well as organic dyes.
All above different dicotyledonous crops, mature and fresh seeds were purchased
from local market and washed thoroughly by water before drying to remove any dust then
to soak the beans overnight. The husk of soaked beans are separated from their pulses,
then washed with distilled water and dried in shadow [1]. The dried husks were grinded
to fine powder [2]. The homogeneous powder was obtained by passing through mesh of
desired particle size (44 – 60 µm). The homogeneous fine powder adsorbent was stored
in an air tight container for the adsorption study for further experiments.
2.2. Preparation of adsorbates:
The adsorbates selected for the present study were, the organic compounds such
as Crystal Violet and Methylene Blue and the inorganic compounds (metal ions) were
Chromium [Cr (VI)] and Nickel [Ni (II)].
2.2.1 Organic compounds:-
All the above organic compounds (Crystal Violet and Methylene Blue) are
commercially available and these are purchased from different chemical laboratories such
as methylene blue was purchased from Qualigens, Fine Chemicals, Mumbai (India),
crystal violet was purchased from Loba Chemicals Pvt. Ltd. Mumbai (India). All

Final Report of Minor Research Project 2015
Evaluation of Adsorption Capacity of Low Cost adsorbent For the Removal of Hazardous Chemicals Page 22
solutions were prepared in double distilled water. The concentration of dye solutions
were determined by using UV-Visible single beam Spectrophotometer, (BioEra: Cal
No.BI/CI/SP/SB-S-03). Stock solutions (500 ppm) were prepared by dissolving weighed
quantities of these organic compounds (500 mg) in double distilled water (1000 ml). The
experimental solutions were prepared by successive dilution using double distilled water.
The solutions were carried out from the stock solution to prepare solutions in different
concentrations [3]. The concentration of solution was determined from calibration curve
spectrophotometrically at their λmax that is Crystal Violet (𝜆max = 540 nm) and for
Methylene Blue (𝜆max = 570 nm).
2.2.2 Inorganic compounds (Metal ions):-
2.2.2.1 Chromium [Cr (VI)]:- Stock solution of chromium metal ion (500 ppm)
was prepared by weighing and dissolving 1.4140 gm. of potassium dichromate (K2Cr2O7)
in one liter of double distilled water in graduated volumetric flask. The dilutions were
carried out from the stock solution to prepared desired concentrations, in order to
standard the solution. 10 ml of chromium sample solution was transferred to 25 ml
standard flask; enough H2SO4 was added to make acid concentration 0.2 N on dilution up
to 25 ml. Now add one ml of diphenyl carbazide [(C6H5NH.NH2) CO] solution, it was
shacked till it got mixed with the solution, allow the solution to stand for 10 – 15
minutes. And then absorbance was determined at 540 nm. Using a reagent blank as
compared liquid [4].
2.2.2.2 Nickel [Ni (II)]:- Stock solution of nickel metal ion (100 ppm) was prepared
by weighing and dissolving 0.675 gm. of ammonium nickel sulphate [NiSO4
(NH4)2.6H2O] in one liter of double distilled water in graduated volumetric flask and used
to prepare different solutions. 10 ml of ammonium nickel sulphate solution was taken in
a beaker containing 90 ml of water, 5.0 gm. of citric acid and finally ammonia was added
to maintain the pH=7.5 Solution was transferred to a separating funnel and 20 ml
dimethyl gloyoxime solution was added. After allowing the content to stand for one
minute, 12 ml of chloroform was added with constant shaking. Again the solution was
allowed to stand for one minute. The organic phase (red chloroform) gets separated. The
absorbance was determined at 366 nm against blank was determined nickel (II) metal ion.
2.3 Parameters for Batch Adsorption Techniques:
2.3.1 Effect of contact Time:- Contact time is one of the important parameters
for the assessment of practical application of adsorption process [5-8]. Adsorbent powder
were mixed with different adsorbate solution in a glass bottles, then stirred for required
time period with the help of mechanical stirrer at room temperature, the samples were
filtered and its absorbance was then measured. The concentration was to be measured
after 5, 10, 15, 20, 25, 30, 35 minute and 24 hrs. time interval. The contact time process
was repeated at different time’s intervals. The other parameters such as adsorbent dose,
concentration of adsorbate, temperature, pH and amount of salt were kept constant. The

Final Report of Minor Research Project 2015
Evaluation of Adsorption Capacity of Low Cost adsorbent For the Removal of Hazardous Chemicals Page 23
amount of adsorbed (mg/g) was calculated using the formulae reported by Vanderborght
and Van Griekenm [9], and then the kinetic adsorption parameters were calculated.
q =𝑉(𝐶𝑜−𝐶𝑡)
𝑀
Where, q is the amount of solute adsorbed from the solution (mg/ g), Co is the
concentration before adsorption (mg/L), and Ct is concentration after adsorption. V is the
volume of adsorbate (L) and M is the weight of the adsorbent (gm).
2.3.2 Effect of amount of adsorbent:- Adsorption isotherms have many
important practical applications, for instance, it provides information on how adsorption
system proceeds, and indicates how efficiently given adsorbent interacts with adsorbate.
It also helps to estimate economic feasibility of an adsorbent for specific commercial
applications. There are a number of factors that determine the shape of isotherm. The
major factors are the number of compounds in the solution, their relative adsorb abilities,
initial concentration of adsorbate in the solution, and the degree of competition among
solutes for adsorption sites. Different isotherm equations have been tested, namely,
Langmuir, Freundlich, Temkin, etc., in order to describe the equilibrium characteristics of
adsorption. Adsorbent dose is one of the important factors because it is used to determine
capacity of an adsorbent for initial concentration of adsorbate [10].
2.3.3 Effect of initial concentration of adsorbate:- Effect of initial concentration
of organic and metal ion solution is a major part of the study. By varying the
concentration of organic and metal ion solution and keeping the amount of adsorbent
constant at constant temperature, the time growth studies of adsorption were undertaken
[11]. The percentage adsorption was calculated by following equation;
Percentage adsorption = (C0 −Ce)
C0 * 100
Where, 𝐶0 and 𝐶𝑒 are the initial and equilibrium concentrations respectively.
2.3.4 Effect of Temperature:- The adsorption experiments were performed at five
different temperatures viz., 5,10,15,20, and 25 oC above room temperature in thermostat.
The study was maintained at constant temperature and was shaken continuously till the
equilibrium was attained. The sample solutions were filtered at different time intervals
was used for measuring the corresponding concentration remaining in the solution. The
obtained values were employed for calculating the actual amount of organic dyes and
toxic heavy metal ions adsorbed on the surface of adsorbents at that time. The
experiments were carried out at different temperature to study the effect of temperature
on adsorption and to determine thermodynamic parameters such as Gibb's free energy
change (∆𝐺0), enthalpy change (∆𝐻0) and entropy change (∆𝑆0) [12-14].
2.3.5 Effect of pH:- The initial pH of the solution is an important parameter, which
controls the adsorption process, particularly the adsorption capacity [15]. he initial pH of
solution was taken as 1.0 to 11.0. The pH was adjusted with the help of HCl (0.1 N) and
NaOH (0.1 N) [16] solution. Then the adsorbent powder was (0.5 gm.) was mixed with

Final Report of Minor Research Project 2015
Evaluation of Adsorption Capacity of Low Cost adsorbent For the Removal of Hazardous Chemicals Page 24
50 ml of adsorbate solution at 30 minute time, after 30 minutes the samples were filtered
and analyzed.
References:
[1] Farid R., Zaggout; Uptake of zinc from polluted water by decaying tamrix gallica
leaves, Asian J. Chem. 17, 209-218. (2006).
[2] Suman Hossain and B. K Ghua; Removal of endrin from drinking water by GAC
using batch study, Ind, J. Env. Prot.,26,392-399,(2006).
[3] Shriram Chaurasia and Shasikant; Removal of basic dye from aqueous solution
using natural adsorbents: kinetic studies, Ind. J. Env. Prot., 27, 782-788, (2007).
[4] APHA; Standard methods for the examination of water and wastewater,
Washington, 19, 3.59-3.60, (1995).
[5] E. Voudrias, K. Fytianos and E. Bonzani., Sorption-deposition isotherms of dyes
form aqueous solutions and wastewaters with different sorbents materials, Glob.
Nest: Int. J., 4(1), 75-83, (2002).
[6] Y. Prasanna Kumar and P. King, Adsorption of cadmium by molecular sieves,
Ind. J. Env. Prot., 24 (11), 828-832, (2004).
[7] Rajeev Jain, Megha Mathur and Shalini Sikarwar, Removal of indigocarmine
from industrial effluents using low cost adsorbent, J. Scientif Indus. Res., 65, 258-
263, (2006).
[8] N.Kannan and Ramasubramanian,Removal of phenylacetic and phenoxyacetic
acids by fly ash-coal blend: a comparative study, Ind. J. Env. Prot, 21(12), 1064-
1069, (2001).
[9] M. Vanderborght and Van Grieken, Enrichment of trace metals in water by
adsorption on activated carbon. J. Anal. Chem. 49, 311-316 (1977).
[10] Megha Rai, Pathan M. Arif Khan, Mazahar Farooqui and Ahmed Zaheer, Study
of the removal of dyes by goda sand, J. Ind. Chem.Soc.,81,484-487,(2004).
[11] G. Annadurai and M. R. V. Krishnan; Adsorption of acid from aqueous solution
by chitin: equilibrium studies, Ind. Journal Chem. Tech, 4, 217-222, (1997).
[12] Mahwish Asgher, Haq Nawaz Bhatti, Ijaz Ahmad Bhatti and Munir Ahmad
Shiekh; Response surface methodology and central composite design analysis of
biosorption of reactive anthraquinone dyes by citrus sinensis waste biomass,
Asian J.Chem., 22(10), 7817-7826, (2010).
[13] Mazahar Farooqui, Sandeep Kotharkar, Ahmed Zaheer and Sanjay Ubale; Use
of leaves of cauliflower for the removal of iron from waste water, Asian J. Chem.,
14 (1), 95-98, (2002).
[14] Sayyed Hussain, Mazhar Farooqui and M A Shookur; Adsorption studies of acid
on the surface of alternenthera triandra, Asian J. Chem., 17(3), 1411-1414,(2005).

Final Report of Minor Research Project 2015
Evaluation of Adsorption Capacity of Low Cost adsorbent For the Removal of Hazardous Chemicals Page 25
[15] Jain R, Shrivastava M Adsorptive studies of hazardous dye Tropaeoline from an
aqueous phase onto coconut-husk. J. Hazard Mater. 158: 549–556, (2008).
[16] Lodeiro L., Cordero B., Barriada JL., Herrero R., Sastre de Vicente ME.,
Biosorption of cadmium by biomass of brown marine macroalgae. Bioresour.
Technol.,96, 1796-1803, (2005).
*********
Final Report of Minor Research Project 2015
Evaluation of Adsorption Capacity of Low Cost adsorbent For the Removal of Hazardous Chemicals Page 26
3. Experimental Results
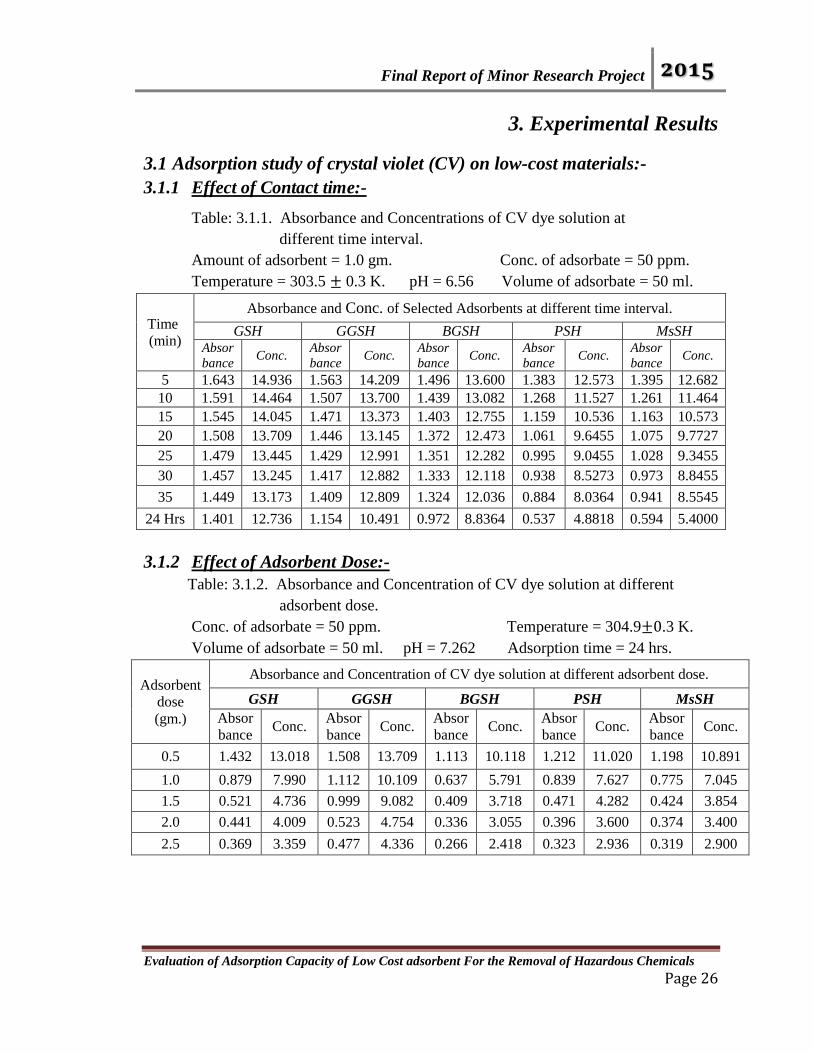
3.1 Adsorption study of crystal violet (CV) on low-cost materials:-
3.1.1 Effect of Contact time:-
Table: 3.1.1. Absorbance and Concentrations of CV dye solution at
different time interval.
Amount of adsorbent = 1.0 gm. Conc. of adsorbate = 50 ppm.
Temperature = 303.5 ± 0.3 K. pH = 6.56 Volume of adsorbate = 50 ml.
Time
(min)
Absorbance and Conc. of Selected Adsorbents at different time interval.
GSH GGSH BGSH PSH MsSH Absor
bance Conc.
Absor
bance Conc.
Absor
bance Conc.
Absor
bance Conc.
Absor
bance Conc.
5 1.643 14.936 1.563 14.209 1.496 13.600 1.383 12.573 1.395 12.682
10 1.591 14.464 1.507 13.700 1.439 13.082 1.268 11.527 1.261 11.464
15 1.545 14.045 1.471 13.373 1.403 12.755 1.159 10.536 1.163 10.573
20 1.508 13.709 1.446 13.145 1.372 12.473 1.061 9.6455 1.075 9.7727
25 1.479 13.445 1.429 12.991 1.351 12.282 0.995 9.0455 1.028 9.3455
30 1.457 13.245 1.417 12.882 1.333 12.118 0.938 8.5273 0.973 8.8455
35 1.449 13.173 1.409 12.809 1.324 12.036 0.884 8.0364 0.941 8.5545
24 Hrs 1.401 12.736 1.154 10.491 0.972 8.8364 0.537 4.8818 0.594 5.4000
3.1.2 Effect of Adsorbent Dose:-
Table: 3.1.2. Absorbance and Concentration of CV dye solution at different
adsorbent dose.
Conc. of adsorbate = 50 ppm. Temperature = 304.9±0.3 K.
Volume of adsorbate = 50 ml. pH = 7.262 Adsorption time = 24 hrs.
Adsorbent
dose
(gm.)
Absorbance and Concentration of CV dye solution at different adsorbent dose.
GSH GGSH BGSH PSH MsSH
Absor
bance Conc.
Absor
bance Conc.
Absor
bance Conc.
Absor
bance Conc.
Absor
bance Conc.
0.5 1.432 13.018 1.508 13.709 1.113 10.118 1.212 11.020 1.198 10.891
1.0 0.879 7.990 1.112 10.109 0.637 5.791 0.839 7.627 0.775 7.045
1.5 0.521 4.736 0.999 9.082 0.409 3.718 0.471 4.282 0.424 3.854
2.0 0.441 4.009 0.523 4.754 0.336 3.055 0.396 3.600 0.374 3.400
2.5 0.369 3.359 0.477 4.336 0.266 2.418 0.323 2.936 0.319 2.900
Final Report of Minor Research Project 2015
Evaluation of Adsorption Capacity of Low Cost adsorbent For the Removal of Hazardous Chemicals Page 27
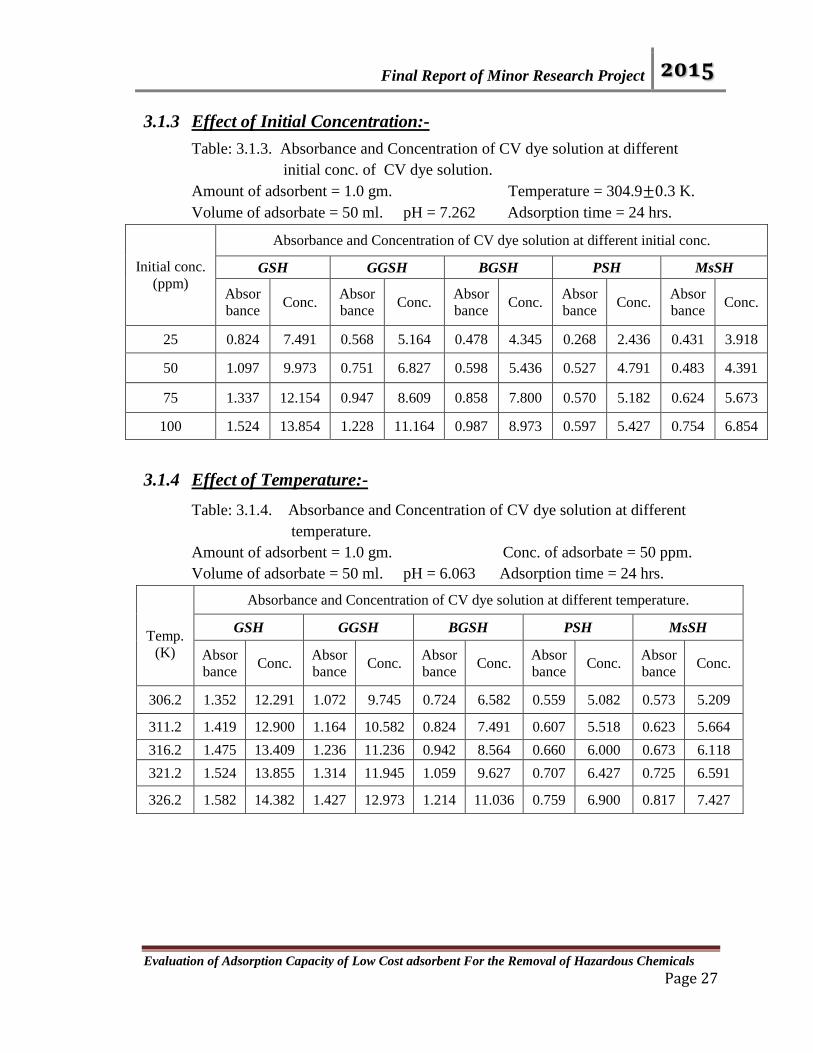
3.1.3 Effect of Initial Concentration:-
Table: 3.1.3. Absorbance and Concentration of CV dye solution at different
initial conc. of CV dye solution.
Amount of adsorbent = 1.0 gm. Temperature = 304.9±0.3 K.
Volume of adsorbate = 50 ml. pH = 7.262 Adsorption time = 24 hrs.
Initial conc.
(ppm)
Absorbance and Concentration of CV dye solution at different initial conc.
GSH GGSH BGSH PSH MsSH
Absor
bance Conc.
Absor
bance Conc.
Absor
bance Conc.
Absor
bance Conc.
Absor
bance Conc.
25 0.824 7.491 0.568 5.164 0.478 4.345 0.268 2.436 0.431 3.918
50 1.097 9.973 0.751 6.827 0.598 5.436 0.527 4.791 0.483 4.391
75 1.337 12.154 0.947 8.609 0.858 7.800 0.570 5.182 0.624 5.673
100 1.524 13.854 1.228 11.164 0.987 8.973 0.597 5.427 0.754 6.854
3.1.4 Effect of Temperature:-
Table: 3.1.4. Absorbance and Concentration of CV dye solution at different
temperature.
Amount of adsorbent = 1.0 gm. Conc. of adsorbate = 50 ppm.
Volume of adsorbate = 50 ml. pH = 6.063 Adsorption time = 24 hrs.
Temp.
(K)
Absorbance and Concentration of CV dye solution at different temperature.
GSH GGSH BGSH PSH MsSH
Absor
bance Conc.
Absor
bance Conc.
Absor
bance Conc.
Absor
bance Conc.
Absor
bance Conc.
306.2 1.352 12.291 1.072 9.745 0.724 6.582 0.559 5.082 0.573 5.209
311.2 1.419 12.900 1.164 10.582 0.824 7.491 0.607 5.518 0.623 5.664
316.2 1.475 13.409 1.236 11.236 0.942 8.564 0.660 6.000 0.673 6.118
321.2 1.524 13.855 1.314 11.945 1.059 9.627 0.707 6.427 0.725 6.591
326.2 1.582 14.382 1.427 12.973 1.214 11.036 0.759 6.900 0.817 7.427
Final Report of Minor Research Project 2015
Evaluation of Adsorption Capacity of Low Cost adsorbent For the Removal of Hazardous Chemicals Page 28
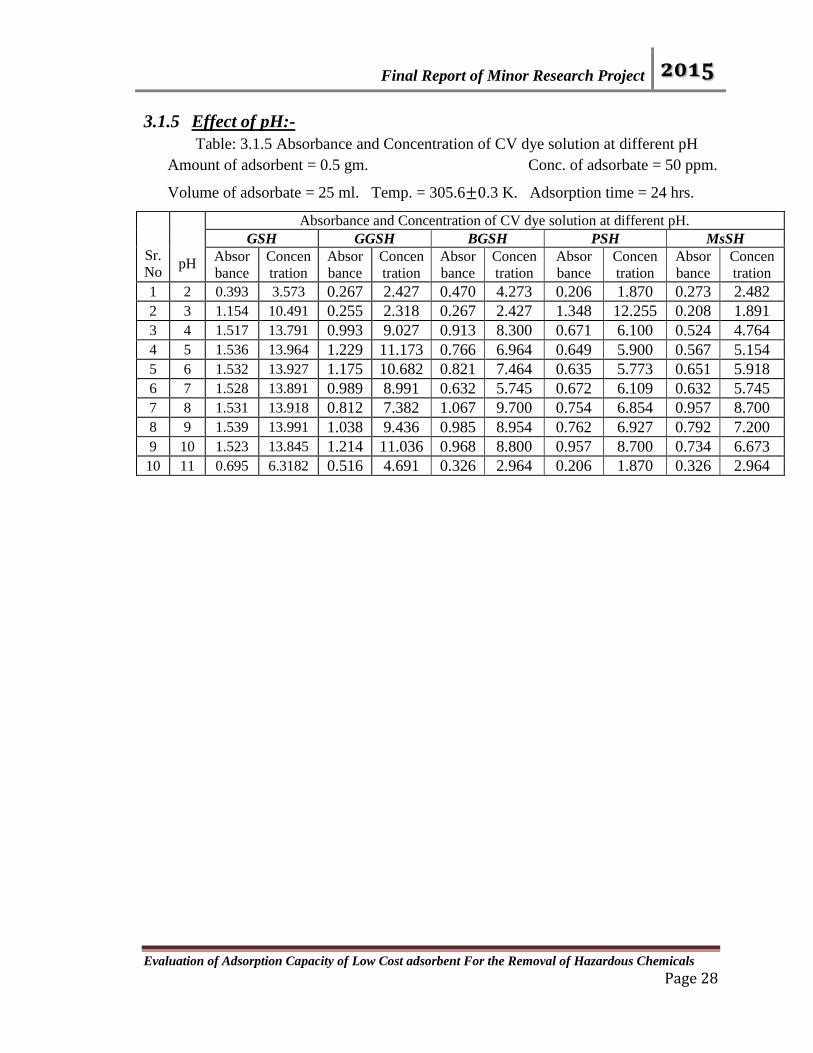
3.1.5 Effect of pH:-
Table: 3.1.5 Absorbance and Concentration of CV dye solution at different pH
Amount of adsorbent = 0.5 gm. Conc. of adsorbate = 50 ppm.
Volume of adsorbate = 25 ml. Temp. = 305.6±0.3 K. Adsorption time = 24 hrs.
Sr.
No
pH
Absorbance and Concentration of CV dye solution at different pH.
GSH GGSH BGSH PSH MsSH
Absor
bance
Concen
tration
Absor
bance
Concen
tration
Absor
bance
Concen
tration
Absor
bance
Concen
tration
Absor
bance
Concen
tration
1 2 0.393 3.573 0.267 2.427 0.470 4.273 0.206 1.870 0.273 2.482
2 3 1.154 10.491 0.255 2.318 0.267 2.427 1.348 12.255 0.208 1.891
3 4 1.517 13.791 0.993 9.027 0.913 8.300 0.671 6.100 0.524 4.764
4 5 1.536 13.964 1.229 11.173 0.766 6.964 0.649 5.900 0.567 5.154
5 6 1.532 13.927 1.175 10.682 0.821 7.464 0.635 5.773 0.651 5.918
6 7 1.528 13.891 0.989 8.991 0.632 5.745 0.672 6.109 0.632 5.745
7 8 1.531 13.918 0.812 7.382 1.067 9.700 0.754 6.854 0.957 8.700
8 9 1.539 13.991 1.038 9.436 0.985 8.954 0.762 6.927 0.792 7.200
9 10 1.523 13.845 1.214 11.036 0.968 8.800 0.957 8.700 0.734 6.673
10 11 0.695 6.3182 0.516 4.691 0.326 2.964 0.206 1.870 0.326 2.964
Final Report of Minor Research Project 2015
Evaluation of Adsorption Capacity of Low Cost adsorbent For the Removal of Hazardous Chemicals Page 29
3.2 Adsorption study of methylene blue (MB) on low-cost materials:
3.2.1 Effect of Contact time:-
Table: 3.2.1. Absorbance & conc. of MB dye solution at different time interval.
Amount of adsorbent = 1.0 gm. Conc. of adsorbate = 100 ppm.
Volume of adsorbate = 50 ml. pH = 7.170 Temperature = 297.8 ± 0.3 K.
Time
(min)
Absorbance and Concentrations of Selected adsorbents at different time interval.
GSH GGSH BGSH PSH MsSH
Absor
bance Conc.
Absor
bance Conc.
Absor
bance Conc.
Absor
bance Conc.
Absor
bance Conc.
5 1.668 34.041 1.194 24.367 1.239 25.286 0.857 17.490 1.028 20.980
10 1.607 32.796 1.092 22.286 1.153 23.531 0.793 16.184 0.832 16.980
15 1.564 31.918 1.031 21.041 1.077 21.980 0.741 15.122 0.706 14.408
20 1.541 31.449 0.984 20.082 1.019 20.796 0.719 14.673 0.663 13.531
25 1.523 31.082 0.947 19.327 0.976 19.918 0.701 14.306 0.634 12.939
30 1.511 30.837 0.933 19.041 0.953 19.449 0.687 14.020 0.617 12.592
35 1.503 30.673 0.921 18.796 0.941 19.204 0.683 13.939 0.609 12.429
24 Hrs 1.295 26.429 0.483 9.857 0.565 11.531 0.367 7.490 0.325 6.633
3.2.2 Effect of Adsorbent Dose:- Table: 3.2.2. Absorbance and Concentration of MB dye solution at different
adsorbent dose.
Concentration of adsorbate = 100 ppm Temperature = 299.4±0.3 K.
Volume of adsorbate = 50 ml. pH = 7.434 Adsorption time = 24 hrs.
Adsorbent
dose
(gm.)
Absorbance and Conc. of MB dye solution at different adsorbent dose.
GSH GGSH BGSH PSH MsSH
Absor
bance Conc.
Absor
bance Conc.
Absor
bance Conc.
Absor
bance Conc.
Absor
bance Conc.
0.5 1.361 27.776 1.075 21.939 0.962 19.633 0.919 18.750 1.104 22.531
1.0 0.706 14.408 0.561 11.449 0.501 10.224 0.478 9.755 0.521 10.630
1.5 0.465 9.490 0.369 7.531 0.334 6.816 0.315 6.429 0.339 6.918
2.0 0.353 7.204 0.275 5.612 0.247 5.041 0.233 4.755 0.256 5.224
2.5 0.279 5.694 0.217 4.429 0.196 4.000 0.186 3.796 0.203 4.143
Final Report of Minor Research Project 2015
Evaluation of Adsorption Capacity of Low Cost adsorbent For the Removal of Hazardous Chemicals Page 30
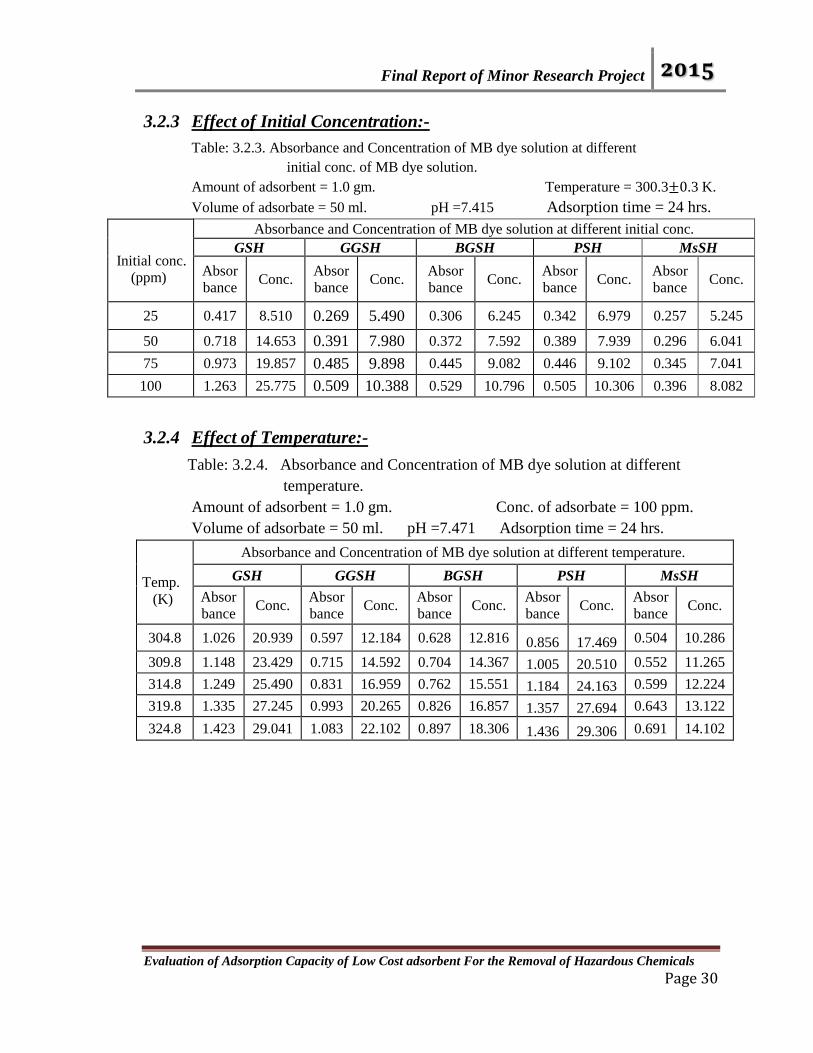
3.2.3 Effect of Initial Concentration:-
Table: 3.2.3. Absorbance and Concentration of MB dye solution at different
initial conc. of MB dye solution.
Amount of adsorbent = 1.0 gm. Temperature = 300.3±0.3 K.
Volume of adsorbate = 50 ml. pH =7.415 Adsorption time = 24 hrs.
Initial conc.
(ppm)
Absorbance and Concentration of MB dye solution at different initial conc.
GSH GGSH BGSH PSH MsSH
Absor
bance Conc.
Absor
bance Conc.
Absor
bance Conc.
Absor
bance Conc.
Absor
bance Conc.
25 0.417 8.510 0.269 5.490 0.306 6.245 0.342 6.979 0.257 5.245
50 0.718 14.653 0.391 7.980 0.372 7.592 0.389 7.939 0.296 6.041
75 0.973 19.857 0.485 9.898 0.445 9.082 0.446 9.102 0.345 7.041
100 1.263 25.775 0.509 10.388 0.529 10.796 0.505 10.306 0.396 8.082
3.2.4 Effect of Temperature:-
Table: 3.2.4. Absorbance and Concentration of MB dye solution at different
temperature.
Amount of adsorbent = 1.0 gm. Conc. of adsorbate = 100 ppm.
Volume of adsorbate = 50 ml. pH =7.471 Adsorption time = 24 hrs.
Temp.
(K)
Absorbance and Concentration of MB dye solution at different temperature.
GSH GGSH BGSH PSH MsSH
Absor
bance Conc.
Absor
bance Conc.
Absor
bance Conc.
Absor
bance Conc.
Absor
bance Conc.
304.8 1.026 20.939 0.597 12.184 0.628 12.816 0.856 17.469 0.504 10.286
309.8 1.148 23.429 0.715 14.592 0.704 14.367 1.005 20.510 0.552 11.265
314.8 1.249 25.490 0.831 16.959 0.762 15.551 1.184 24.163 0.599 12.224
319.8 1.335 27.245 0.993 20.265 0.826 16.857 1.357 27.694 0.643 13.122
324.8 1.423 29.041 1.083 22.102 0.897 18.306 1.436 29.306 0.691 14.102
Final Report of Minor Research Project 2015
Evaluation of Adsorption Capacity of Low Cost adsorbent For the Removal of Hazardous Chemicals Page 31
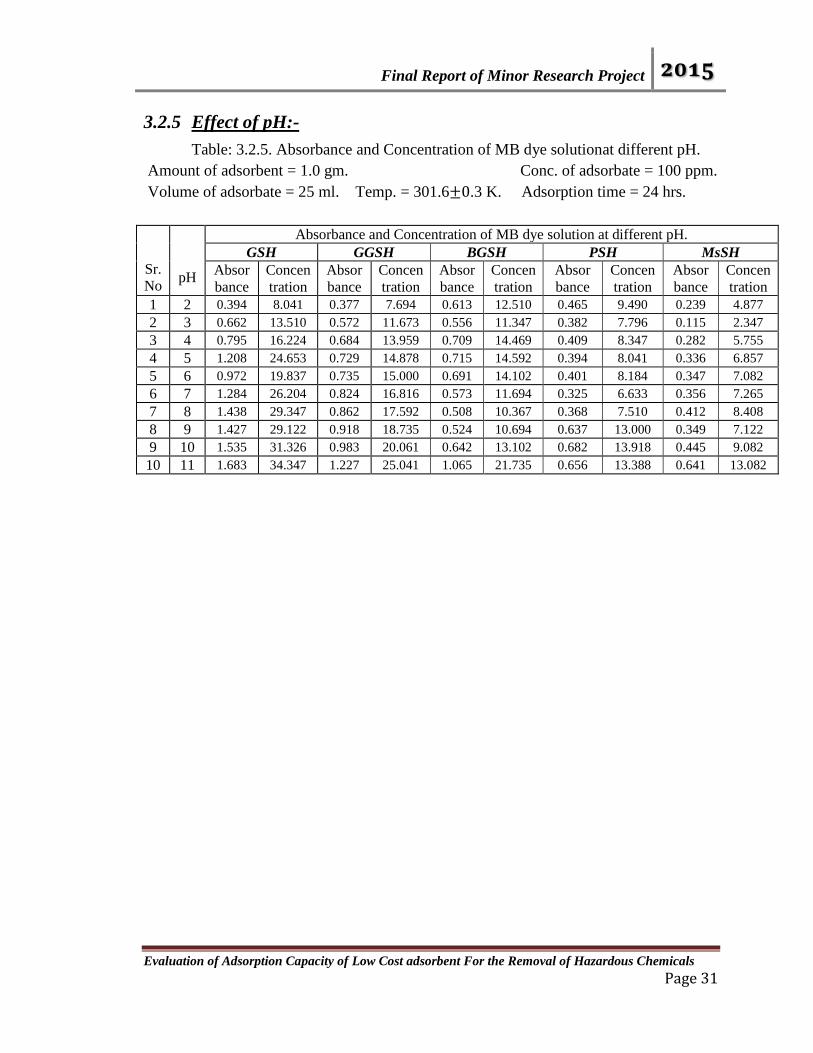
3.2.5 Effect of pH:-
Table: 3.2.5. Absorbance and Concentration of MB dye solutionat different pH.
Amount of adsorbent = 1.0 gm. Conc. of adsorbate = 100 ppm.
Volume of adsorbate = 25 ml. Temp. = 301.6±0.3 K. Adsorption time = 24 hrs.
Sr.
No
pH
Absorbance and Concentration of MB dye solution at different pH.
GSH GGSH BGSH PSH MsSH
Absor
bance
Concen
tration
Absor
bance
Concen
tration
Absor
bance
Concen
tration
Absor
bance
Concen
tration
Absor
bance
Concen
tration
1 2 0.394 8.041 0.377 7.694 0.613 12.510 0.465 9.490 0.239 4.877
2 3 0.662 13.510 0.572 11.673 0.556 11.347 0.382 7.796 0.115 2.347
3 4 0.795 16.224 0.684 13.959 0.709 14.469 0.409 8.347 0.282 5.755
4 5 1.208 24.653 0.729 14.878 0.715 14.592 0.394 8.041 0.336 6.857
5 6 0.972 19.837 0.735 15.000 0.691 14.102 0.401 8.184 0.347 7.082
6 7 1.284 26.204 0.824 16.816 0.573 11.694 0.325 6.633 0.356 7.265
7 8 1.438 29.347 0.862 17.592 0.508 10.367 0.368 7.510 0.412 8.408
8 9 1.427 29.122 0.918 18.735 0.524 10.694 0.637 13.000 0.349 7.122
9 10 1.535 31.326 0.983 20.061 0.642 13.102 0.682 13.918 0.445 9.082
10 11 1.683 34.347 1.227 25.041 1.065 21.735 0.656 13.388 0.641 13.082

Final Report of Minor Research Project 2015
Evaluation of Adsorption Capacity of Low Cost adsorbent For the Removal of Hazardous Chemicals Page 32
3.3 Adsorption study of chromium [Cr (VI)] metal ion on low-cost
materials:
3.3.1 Effect of Contact time:-
Table: 3.3.1. Absorbance of Cr (VI) ions at different time interval.
Amount of adsorbent = 0.5 gm. Conc. of adsorbate = 5 ppm.
Volume of adsorbate = 50 ml. pH = 5.489 Temperature = 301.5 ± 0.3 K
Time
(min)
Absorbance and Concentrations of Selected Adsorbents at different time interval.
GSH GGSH BGSH PSH MsSH
Absor
bance Conc.
Absor
bance Conc.
Absor
bance Conc.
Absor
bance Conc.
Absor
bance Conc.
5 0.679 2.616 0.381 1.468 0.634 2.442 1.256 4.838 0.193 0.743
10 0.472 1.818 0.210 0.809 0.517 1.991 1.229 4.734 0.152 0.585
15 0.317 1.221 0.147 0.566 0.442 1.703 1.204 4.638 0.119 0.458
20 0.232 0.894 0.105 0.404 0.391 1.506 1.189 4.580 0.098 0.377
25 0.168 0.647 0.080 0.308 0.351 1.352 1.180 4.546 0.089 0.343
30 0.140 0.539 0.067 0.258 0.336 1.294 1.175 4.526 0.080 0.308
35 0.107 0.412 0.053 0.204 0.328 1.263 1.172 4.515 0.077 0.297
24 Hrs 0.039 0.150 0.027 0.104 0.097 0.374 0.781 3.008 0.032 0.123
3.3.2 Effect of Adsorbent Dose:-
Table: 3.3.2.(a). Absorbance and Concentrations of Chromium [Cr (VI)] metal
ions at different adsorbent dose of GSH.
Conc. of adsorbate = 5 ppm Temperature = 301.5±0.3 K.
Volume of adsorbate = 50 ml pH = 7.170 Adsorption time = 24 hrs.
Adsorbent
dose
(gm.)
Absorbance and Conc. of Chromium metal ions at different adsorbent dose.
GSH GGSH BGSH PSH MsSH
Absor
bance Conc.
Absor
bance Conc.
Absor
bance Conc.
Absor
bance Conc.
Absor
bance Conc.
0.25 0.305 1.175 0.175 0.674 0.244 0.940 0.291 1.121 0.048 0.185
0.50 0.173 0.666 0.098 0.378 0.127 0.489 0.161 0.620 0.023 0.089
0.75 0.119 0.458 0.058 0.223 0.091 0.351 0.112 0.431 0.016 0.062
1.0 0.093 0.358 0.051 0.196 0.069 0.266 0.087 0.335 0.012 0.046
Final Report of Minor Research Project 2015
Evaluation of Adsorption Capacity of Low Cost adsorbent For the Removal of Hazardous Chemicals Page 33
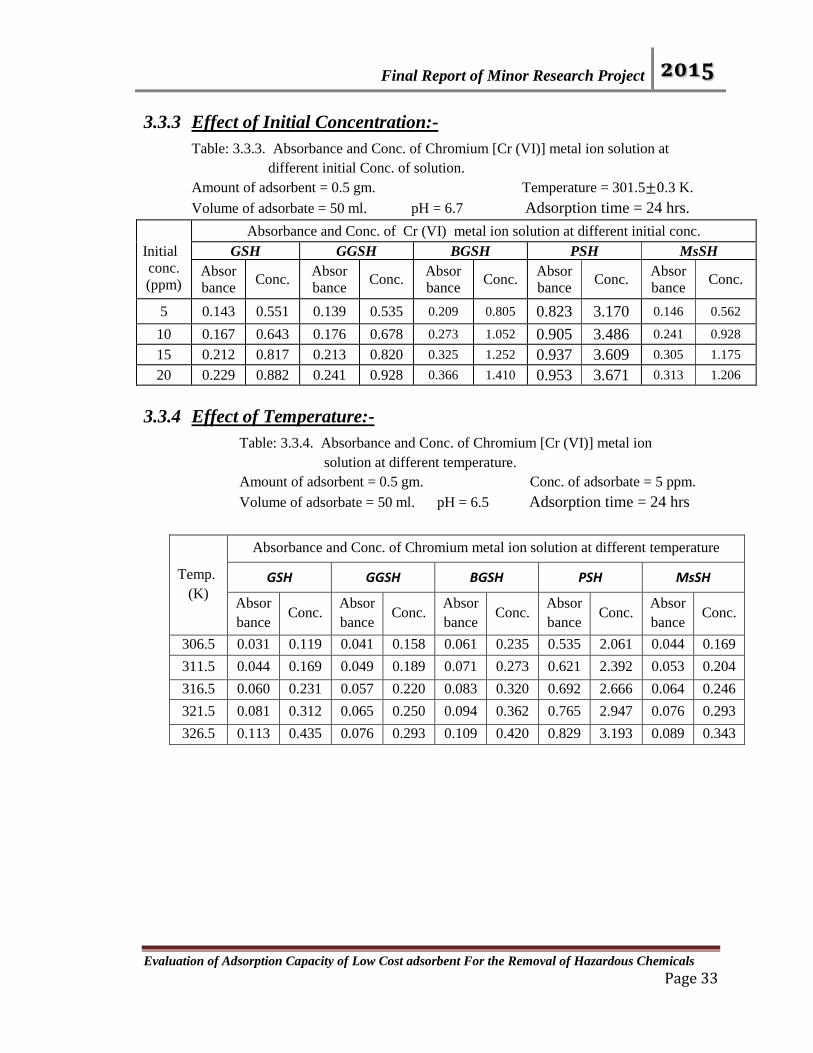
3.3.3 Effect of Initial Concentration:-
Table: 3.3.3. Absorbance and Conc. of Chromium [Cr (VI)] metal ion solution at
different initial Conc. of solution.
Amount of adsorbent = 0.5 gm. Temperature = 301.5±0.3 K.
Volume of adsorbate = 50 ml. pH = 6.7 Adsorption time = 24 hrs.
Initial
conc.
(ppm)
Absorbance and Conc. of Cr (VI) metal ion solution at different initial conc.
GSH GGSH BGSH PSH MsSH
Absor
bance Conc.
Absor
bance Conc.
Absor
bance Conc.
Absor
bance Conc.
Absor
bance Conc.
5 0.143 0.551 0.139 0.535 0.209 0.805 0.823 3.170 0.146 0.562
10 0.167 0.643 0.176 0.678 0.273 1.052 0.905 3.486 0.241 0.928
15 0.212 0.817 0.213 0.820 0.325 1.252 0.937 3.609 0.305 1.175
20 0.229 0.882 0.241 0.928 0.366 1.410 0.953 3.671 0.313 1.206
3.3.4 Effect of Temperature:-
Table: 3.3.4. Absorbance and Conc. of Chromium [Cr (VI)] metal ion
solution at different temperature.
Amount of adsorbent = 0.5 gm. Conc. of adsorbate = 5 ppm.
Volume of adsorbate = 50 ml. pH = 6.5 Adsorption time = 24 hrs
Temp.
(K)
Absorbance and Conc. of Chromium metal ion solution at different temperature
GSH GGSH BGSH PSH MsSH
Absor
bance Conc.
Absor
bance Conc.
Absor
bance Conc.
Absor
bance Conc.
Absor
bance Conc.
306.5 0.031 0.119 0.041 0.158 0.061 0.235 0.535 2.061 0.044 0.169
311.5 0.044 0.169 0.049 0.189 0.071 0.273 0.621 2.392 0.053 0.204
316.5 0.060 0.231 0.057 0.220 0.083 0.320 0.692 2.666 0.064 0.246
321.5 0.081 0.312 0.065 0.250 0.094 0.362 0.765 2.947 0.076 0.293
326.5 0.113 0.435 0.076 0.293 0.109 0.420 0.829 3.193 0.089 0.343

Final Report of Minor Research Project 2015
Evaluation of Adsorption Capacity of Low Cost adsorbent For the Removal of Hazardous Chemicals Page 34
3.3.5 Effect of pH:-
Table: 3.3.5. Absorbance and Concentration of Chromium [Cr (VI)]
metal ion solution at different pH.
Amount of adsorbent = 0.5 gm. Conc. of adsorbate = 5 ppm.
Volume of adsorbate = 25 ml. Temp. = 301.5±0.3 K. Adsorption time = 24 hrs.
Sr.
No
pH
Absorbance and Conc. of Chromium metal ion solution at different pH
GSH GGSH BGSH PSH MsSH
Absor
bance
Concen
tration
Absor
bance
Concen
tration
Absor
bance
Concen
tration
Absor
bance
Concen
tration
Absor
bance
Concen
tration
1 2 0.067 0.258 0.038 0.146 0.065 0.250 0.578 2.226 0.079 0.304
2 3 0.082 0.316 0.068 0.262 0.062 0.239 0.946 3.644 0.076 0.293
3 4 0.110 0.424 0.125 0.481 0.149 0.574 0.978 3.767 0.109 0.420
4 5 0.093 0.358 0.133 0.512 0.158 0.609 1.112 4.283 0.128 0.493
5 6 0.128 0.493 0.075 0.289 0.127 0.489 1.068 4.114 0.127 0.489
6 7 0.054 0.208 0.099 0.381 0.099 0.381 1.187 4.572 0.069 0.266
7 8 0.074 0.285 0.140 0.539 0.109 0.420 1.144 4.407 0.109 0.420
8 9 0.076 0.293 0.101 0.389 0.091 0.350 1.049 4.041 0.091 0.350
9 10 0.075 0.289 0.103 0.397 0.117 0.451 1.107 4.264 0.117 0.451
10 11 0.081 0.312 0.143 0.551 0.144 0.555 0.889 3.424 0.144 0.555
Final Report of Minor Research Project 2015
Evaluation of Adsorption Capacity of Low Cost adsorbent For the Removal of Hazardous Chemicals Page 35
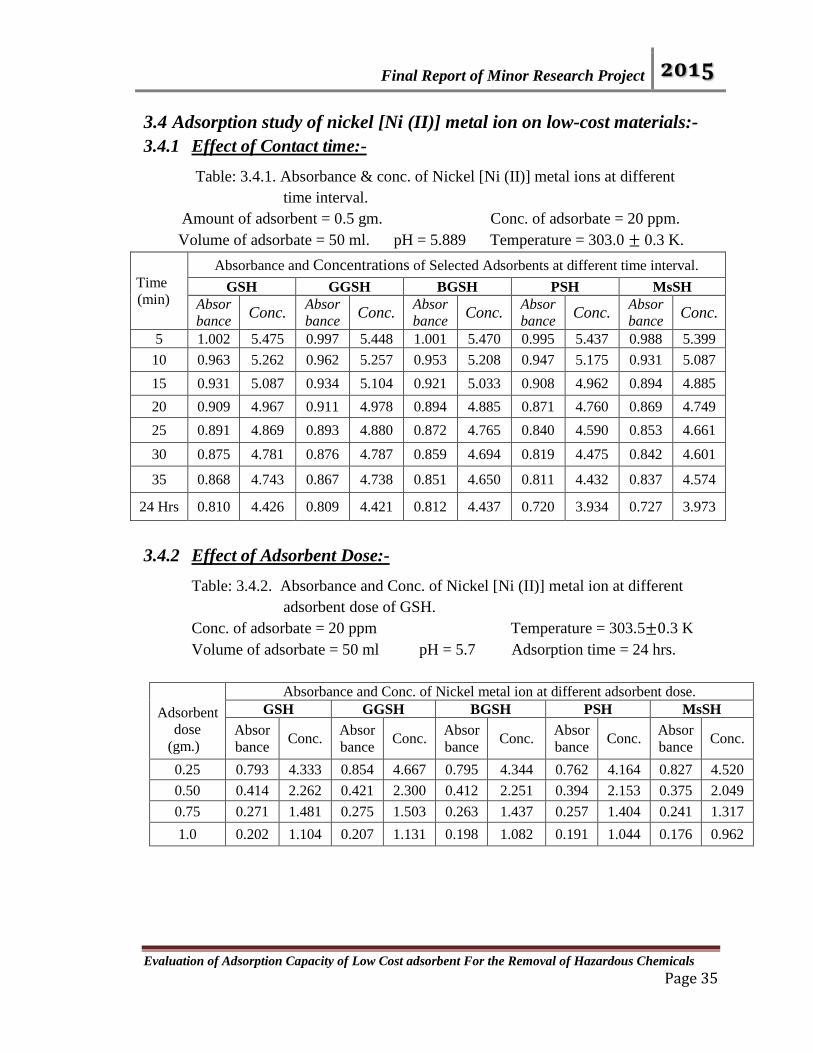
3.4 Adsorption study of nickel [Ni (II)] metal ion on low-cost materials:-
3.4.1 Effect of Contact time:-
Table: 3.4.1. Absorbance & conc. of Nickel [Ni (II)] metal ions at different
time interval.
Amount of adsorbent = 0.5 gm. Conc. of adsorbate = 20 ppm.
Volume of adsorbate = 50 ml. pH = 5.889 Temperature = 303.0 ± 0.3 K.
Time
(min)
Absorbance and Concentrations of Selected Adsorbents at different time interval.
GSH GGSH BGSH PSH MsSH
Absor
bance Conc.
Absor
bance Conc.
Absor
bance Conc.
Absor
bance Conc.
Absor
bance Conc.
5 1.002 5.475 0.997 5.448 1.001 5.470 0.995 5.437 0.988 5.399
10 0.963 5.262 0.962 5.257 0.953 5.208 0.947 5.175 0.931 5.087
15 0.931 5.087 0.934 5.104 0.921 5.033 0.908 4.962 0.894 4.885
20 0.909 4.967 0.911 4.978 0.894 4.885 0.871 4.760 0.869 4.749
25 0.891 4.869 0.893 4.880 0.872 4.765 0.840 4.590 0.853 4.661
30 0.875 4.781 0.876 4.787 0.859 4.694 0.819 4.475 0.842 4.601
35 0.868 4.743 0.867 4.738 0.851 4.650 0.811 4.432 0.837 4.574
24 Hrs 0.810 4.426 0.809 4.421 0.812 4.437 0.720 3.934 0.727 3.973
3.4.2 Effect of Adsorbent Dose:-
Table: 3.4.2. Absorbance and Conc. of Nickel [Ni (II)] metal ion at different
adsorbent dose of GSH.
Conc. of adsorbate = 20 ppm Temperature = 303.5±0.3 K
Volume of adsorbate = 50 ml pH = 5.7 Adsorption time = 24 hrs.
Adsorbent
dose
(gm.)
Absorbance and Conc. of Nickel metal ion at different adsorbent dose.
GSH GGSH BGSH PSH MsSH
Absor
bance Conc.
Absor
bance Conc.
Absor
bance Conc.
Absor
bance Conc.
Absor
bance Conc.
0.25 0.793 4.333 0.854 4.667 0.795 4.344 0.762 4.164 0.827 4.520
0.50 0.414 2.262 0.421 2.300 0.412 2.251 0.394 2.153 0.375 2.049
0.75 0.271 1.481 0.275 1.503 0.263 1.437 0.257 1.404 0.241 1.317
1.0 0.202 1.104 0.207 1.131 0.198 1.082 0.191 1.044 0.176 0.962

Final Report of Minor Research Project 2015
Evaluation of Adsorption Capacity of Low Cost adsorbent For the Removal of Hazardous Chemicals Page 36
3.4.3 Effect of Initial Concentration:-
Table: 3.4.3. Absorbance and Conc. of Nickel [Ni (II)] metal ions at different
initial Conc. of solution.
Amount of adsorbent = 0.5 gm. Temperature = 304.5±0.3 K.
Volume of adsorbate = 50 ml. pH = 5.7 Adsorption time = 24 hrs.
Initial
conc. (ppm)
Absorbance and Conc. of Nickel metal ion solution at different initial conc.
GSH GGSH BGSH PSH MsSH
Absor
bance Conc.
Absor
bance Conc.
Absor
bance Conc.
Absor
bance Conc.
Absor
bance Conc.
5 0.276 1.508 0.504 2.754 0.537 2.934 0.539 2.945 0.436 2.382
10 0.358 1.956 0.567 3.098 0.592 3.235 0.607 3.317 0.464 2.535
15 0.510 2.787 0.675 3.688 0.723 3.951 0.669 3.656 0.652 3.563
20 0.584 3.191 0.801 4.377 0.738 4.033 0.735 4.016 0.739 4.038
3.4.4 Effect of Temperature:-
Table: 3.3.4. Absorbance and Conc. of Nickel [Ni (II)] metal ions at different
temperature of solution.
Amount of adsorbent = 0.5 gm. Conc. of adsorbate = 20 ppm.
Volume of adsorbate = 50 ml. pH = 5.7 Adsorption time = 24 hrs.
Temp.
(K)
Absorbance and Concentration of Nickel metal ion solution at different temperature
GSH GGSH BGSH PSH MsSH
Absor
bance Conc
Absor
bance Conc
Absor
bance Conc
Absor
bance Conc
Absor
bance Conc
306.5 0.649 3.546 0.864 4.721 0.874 4.776 0.722 3.945 0.654 3.574
311.5 0.691 3.776 0.876 4.787 0.884 4.831 0.757 4.137 0.682 3.727
316.5 0.729 3.984 0.890 4.863 0.895 4.891 0.792 4.328 0.714 3.902
321.5 0.765 4.180 0.903 4.934 0.905 4.945 0.829 4.530 0.746 4.077
326.5 0.804 4.393 0.917 5.011 0.916 5.005 0.864 4.721 0.779 4.257

Final Report of Minor Research Project 2015
Evaluation of Adsorption Capacity of Low Cost adsorbent For the Removal of Hazardous Chemicals Page 37
3.4.5 Effect of pH:-
Table: 3.4.5. Absorbance and Conc. of Nickel [Ni (II)] metal ions at different pH
of solution.
Amount of adsorbent = 0.5 gm. Conc. of adsorbate = 20 ppm.
Volume of adsorbate = 25 ml. Temp. = 303.0±0.3K. Adsorption time = 24 hrs.
Sr.
No
pH
Absorbance and Concentration of Nickel [Ni (II)] metal ion solution at different pH.
GSH GGSH BGSH PSH MsSH
Absor
bance
Concen
tration
Absor
bance
Concen
tration
Absor
bance
Concen
tration
Absor
bance
Concen
tration
Absor
bance
Concen
tration
1 2 1.041 5.688 1.038 5.672 1.037 5.667 1.038 5.672 1.036 5.661
2 3 0.871 4.760 1.027 5.612 1.001 5.470 0.892 4.874 0.887 4.847
3 4 0.679 3.710 1.008 5.508 0.905 4.945 0.634 3.464 0.833 4.552
4 5 0.740 4.044 1.021 5.579 0.539 2.945 0.713 3.896 0.735 4.016
5 6 0.748 4.087 1.015 5.546 0.865 4.727 0.717 3.918 0.758 4.142
6 7 0.830 4.535 1.025 5.601 0.984 5.377 0.905 4.945 0.829 4.530
7 8 0.382 2.087 1.005 5.492 0.928 5.071 0.735 4.016 0.750 4.098
8 9 1.021 5.579 0.773 4.224 0.927 5.066 0.812 4.437 0.758 4.142
9 10 0.707 3.863 0.970 5.300 0.926 5.060 0.908 4.962 0.996 5.443
10 11 0.412 2.251 0.807 4.410 1.029 5.623 0.466 2.546 0.796 4.350
Final Report of Minor Research Project 2015
Evaluation of Adsorption Capacity of Low Cost adsorbent For the Removal of Hazardous Chemicals Page 38
4. Result and Discussion
4.1 Adsorption study of crystal violet (CV) on low-cost materials:-
4.1.1 Effect of contact time:- The agricultural materials such as GSH, GGSH, BGSH,
PSH, and MsSH, have been used as a adsorbents for the removal of CV from its aqueous
solutions.
The effect of contact time on the amount of CV adsorbed was investigated at
various time intervals and the remaining parameters were kept constant, samples were
taken and the absorbance was measured. The percentage adsorption of CV increased with
increase with in contact time, the results were presented in Fig. 4.1.1. The observed trend
of percentage adsorption of CV with adsorbents was PSH>MsSH>BGSH>GGSH >GSH.
4.1.2 Effect of adsorbent dose:- The effect of amount of the adsorbents was
necessary in order to observe the minimum possible amount, which shows maximum
adsorption. It was studied by using different amount of dose like 0.50, 1.0, 1.5, 2.0, 2.5
gm. for the initial concentration that is 50 mg/L.at 304.9±0.3K, pH 7.262 and contact
time 24 hours. The percentage adsorption of CV increased with increase with in the
amount of adsorbents (Fig.4.1.2.). The observed trend of percentage adsorption of CV
with adsorbents was PSH>MsSH>BGSH>GGSH>GGSH.
4.1.3 Effect of initial concentration:-The adsorption experiments were performed in
the concentration range (25-100mg/L) at pH 7.20, adsorbent dose 1.0gm and temperature
304.9±0.3K (Table 3.2.3.(a)-3.2.3.(i)), the initial CV concentration was plotted against
percentage adsorption of CV (Fig.4.1.3.). The percentage adsorption of CV increases
with increase initial concentration [1]. The observed trend shows that with adsorbents
PSH>MsSH>BGSH>GGSH>GSH. Similar observations were noted from the previous
workers [2-4].
4.1.4 Effect of temperature:- The effect of adsorption rate was carried out at different
temperatures, with rising temperature from 306.2, 311.2, 316.2, 321.2, and 326.2 K
within 24 hours for 50 mg/L, it was observed that percentage adsorption of CV decreases
with increase in temperature (Fig.4.1.4.) the observed trend shows that with adsorbents
PSH>MsSH>BGSH>GGSH>GSH.
4.1.5 Effect of pH:- The PH can influence the adsorption of CV; the experiments
were carried out at different PH (Table 4.1.2.). The observed trend shows that
MsSH>BGSH>PSH>GSH>GGSH, (Fig.4.1.5.). These were in accordance with previous
researches [5]. It was clear that the adsorption process was highly dependent on the pH of
the solution, the higher percentage adsorption in acidic range as well as basic range was
due to the fact that surface becomes negatively charged, thus making [H+] ions complete
effectively with CV cations causing increases in the adsorption .

Final Report of Minor Research Project 2015
Evaluation of Adsorption Capacity of Low Cost adsorbent For the Removal of Hazardous Chemicals Page 39
4.1.6 Adsorption kinetics:-The values of 𝑅2 with first order were in the range of
0.998 to 0.936. While for second order 𝑅2 values were in the range of 1.00 to 0.999
adsorbents.
Table: 4.1.1. Kinetic parameter values with CV:-
Amount of adsorbent = 1.0 gm. Conc. of adsorbate = 50 ppm.
Volume of adsorbate = 50 ml. pH = 6.566 Temperature = 303.5 ± 0.3 K.
Adsorbents
Pseudo-first order Pseudo-second order
K1
(min-1
)
𝒒𝒆
(mg/gm.) 𝑹𝟐 K2
(gm./mg.min)
𝒒𝒆
(mg/gm.) 𝑹𝟐
GSH 56.516*10-3
148.888 0.995 1.215*10-3
1861.840 0.999
GGSH 15.338*10-3
188.530 0.938 1.762*10-3
1873.842 0.999
BGSH 13.127*10-3
243.759 0.959 1.476*10-3
1914.700 0.999
PSH 29.870*10-3
443.374 0.998 0.425*10-3
2148.154 0.999
MsSH 27.935*10-3
401.134 0.987 5.048*10-3
2118.056 0.999
The observed trend shows that first order kinetics with adsorbents
PSH>GSH>MsSH>BGSH>GGSH. While for second order, BGSH=GGSH=PSH=GSH
=MsSH, the results were presented in Table. 4.1.1. It was confirmed that the adsorption
kinetics was pseudo second order. This observation is in agreement with many other
studies of kinetics of adsorption of CV dyes [6-9].
4.1.7 Adsorption isotherm:- Langmuir and Freundlich isotherm models were often
used to describe equilibrium adsorption isotherm. The Langmuir isotherm constants,
adsorption equilibrium (b) (L/mg), and the saturated monolayer adsorption capacity
(𝑄0 ) (mg/g), were calculated from the slope and intercept (plotting the graph between
Ce/Qe and Ce) [10]. Based on the above analysis of the adsorption, the separation factor
(RL) was calculated. There were four probabilities for the value of 𝑅𝐿 (i) for unfavorable
adsorption if RL > 1, (ii) for linear adsorption RL= 1, (iii) for favorable adsorption
0 < 𝑅𝐿< 1 and (iv) for irreversible adsorption RL = 0 [11]. RLValues were for the range of
0.998 to 0.999. (Table 4.1.2.).
Table: 4.1.2. Isotherm parameter values with CV:-
Conc. of adsorbate = 50 ppm. Volume of adsorbate = 50 ml.
Temperature = 304.9±0.3 K. pH = 7.262 Time = 24 hours.
Adsorbents
Langmuir constants Freundlich constants
Q0
(mg/gm.)
b *10-6
(L/gm.)
𝑹𝑳 𝑹𝟐 n Kf
(mg/gm.(L/gm))1/n
𝑹𝟐
GSH 434.783 8.119 0.999 0.980 1.033 6.045 0.984
GGSH 909.091 5.349 0.999 0.862 1.001 4.175 0.843
BGSH 833.333 3.062 0.999 0.997 1.006 7.936 0.997
PSH 588.235 5.281 0.999 0.977 1.002 6.522 0.968
MsSH 87.719 34.918 0.998 0.955 1.001 6.931 0.965
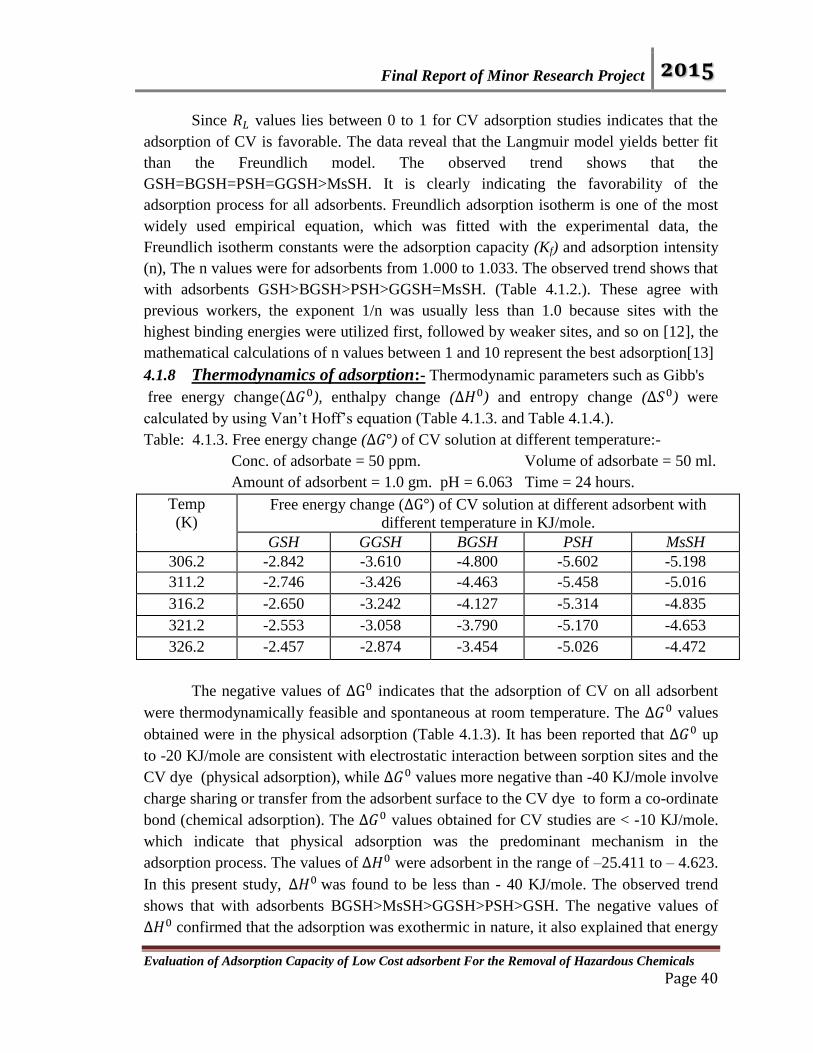
Final Report of Minor Research Project 2015
Evaluation of Adsorption Capacity of Low Cost adsorbent For the Removal of Hazardous Chemicals Page 40
Since 𝑅𝐿 values lies between 0 to 1 for CV adsorption studies indicates that the
adsorption of CV is favorable. The data reveal that the Langmuir model yields better fit
than the Freundlich model. The observed trend shows that the
GSH=BGSH=PSH=GGSH>MsSH. It is clearly indicating the favorability of the
adsorption process for all adsorbents. Freundlich adsorption isotherm is one of the most
widely used empirical equation, which was fitted with the experimental data, the
Freundlich isotherm constants were the adsorption capacity (Kf) and adsorption intensity
(n), The n values were for adsorbents from 1.000 to 1.033. The observed trend shows that
with adsorbents GSH>BGSH>PSH>GGSH=MsSH. (Table 4.1.2.). These agree with
previous workers, the exponent 1/n was usually less than 1.0 because sites with the
highest binding energies were utilized first, followed by weaker sites, and so on [12], the
mathematical calculations of n values between 1 and 10 represent the best adsorption[13]
4.1.8 Thermodynamics of adsorption:- Thermodynamic parameters such as Gibb's
free energy change(∆𝐺0), enthalpy change (∆𝐻0) and entropy change (∆𝑆0) were
calculated by using Van’t Hoff’s equation (Table 4.1.3. and Table 4.1.4.).
Table: 4.1.3. Free energy change (∆𝐺°) of CV solution at different temperature:-
Conc. of adsorbate = 50 ppm. Volume of adsorbate = 50 ml.
Amount of adsorbent = 1.0 gm. pH = 6.063 Time = 24 hours.
Temp
(K) Free energy change (∆G°) of CV solution at different adsorbent with
different temperature in KJ/mole.
GSH GGSH BGSH PSH MsSH
306.2 -2.842 -3.610 -4.800 -5.602 -5.198
311.2 -2.746 -3.426 -4.463 -5.458 -5.016
316.2 -2.650 -3.242 -4.127 -5.314 -4.835
321.2 -2.553 -3.058 -3.790 -5.170 -4.653
326.2 -2.457 -2.874 -3.454 -5.026 -4.472
The negative values of ∆G0 indicates that the adsorption of CV on all adsorbent
were thermodynamically feasible and spontaneous at room temperature. The ∆𝐺0 values
obtained were in the physical adsorption (Table 4.1.3). It has been reported that ∆𝐺0 up
to -20 KJ/mole are consistent with electrostatic interaction between sorption sites and the
CV dye (physical adsorption), while ∆𝐺0 values more negative than -40 KJ/mole involve
charge sharing or transfer from the adsorbent surface to the CV dye to form a co-ordinate
bond (chemical adsorption). The ∆𝐺0 values obtained for CV studies are < -10 KJ/mole.
which indicate that physical adsorption was the predominant mechanism in the
adsorption process. The values of ∆𝐻0 were adsorbent in the range of –25.411 to – 4.623.
In this present study, ∆𝐻0 was found to be less than - 40 KJ/mole. The observed trend
shows that with adsorbents BGSH>MsSH>GGSH>PSH>GSH. The negative values of
∆𝐻0 confirmed that the adsorption was exothermic in nature, it also explained that energy
Final Report of Minor Research Project 2015
Evaluation of Adsorption Capacity of Low Cost adsorbent For the Removal of Hazardous Chemicals Page 41
was liberated by the system during adsorption process, while the negative ∆𝑆0 values
were suggested that there was no significant changes occurred in the internal structure of
the adsorbent (Table 4.2.5). Moreover, the values of ∆𝐻0 were less than 40 KJ/ mole,
which indicated the physical adsorption [14, 15]. All these indicating that the process is
slightly exothermic in nature. This is probably due to tendency of CV molecules to
escape from the solid phase to bulk phase with an increase in temperature of the solution,
the same trend is observed for all adsorbents [16]
Table: 4.1.4. Thermodynamic parameter values with CV solution:-
Conc. of adsorbate = 50 ppm. Volume of adsorbate = 50 ml.
Amount of adsorbent = 1.0 gm. pH = 6.063 Time = 24 hours.
Thermod-ynamic parameters
∆𝐻° and ∆𝑆° values of CV solution at different
adsorbent.
GSH GGSH BGSH PSH MsSH
−∆H° KJ/mole 8.740 14.871 25.411 14.417 16.318
−∆S° J/mole 19.262 36.778 67.313 28.788 35.314
4.1.9 Conclusion:- Based on results, percentage adsorption on different adsorbents
such as GSH, GGSH, BGSH, PSH, and MsSH, were effective for percentage adsorption
of CV from aqueous solutions, the operational parameters such as contact time, adsorbent
dose, initial concentration, temperature, pH, etc. were studied. The percentage adsorption
capacity of CV increased with increasing adsorbent dosage, contact time, initial
concentration of CV solution while decreased with increasing temperature, initial pH of
CV solution. The CV adsorption equilibrium was attained after 24 hours.
The kinetics of adsorption of CV was studied by using pseudo first and pseudo
second order kinetic equations for the experimental data; pseudo second order kinetic
model provided the best correlation of the experimental data. The kinetics of CV the
adsorption fit well with the pseudo second order rate model, so the kinetic studies showed
that the adsorption followed by pseudo second order rate kinetic model. The 𝑅𝐿 values
have been calculated using Langmuir constants, the values were 0 < 𝑅𝐿< 1 showed that
the adsorbents were favorable for the adsorption of CV. The n values between 1 and 10
represent the best adsorption. The negative value of ∆H0 and ∆S0 showed the
adsorption is spontaneous and exothermic nature. The main results of investigation
showed that all adsorbents have considerable potential for the adsorption of CV from
aqueous solution. The main advantages, these low cost materials are available freely,
locally, abundantly and easy to prepare in large scale and have been proven to be much
more efficient than the conventional expensive adsorbents. Therefore a conclusion can be
drawn that all adsorbents can be successfully used for the adsorption of CV from aqueous
solution.
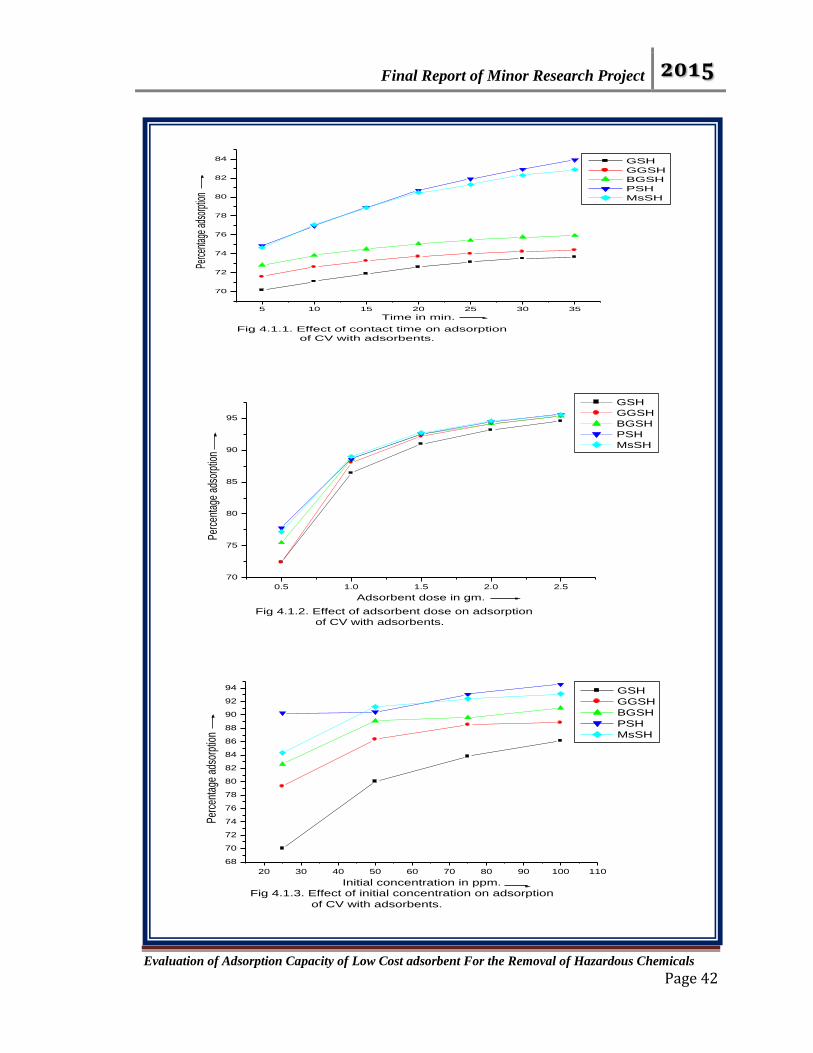
Final Report of Minor Research Project 2015
Evaluation of Adsorption Capacity of Low Cost adsorbent For the Removal of Hazardous Chemicals Page 42
5 10 15 20 25 30 35
70
72
74
76
78
80
82
84
Fig 4.1.1. Effect of contact time on adsorption
of CV with adsorbents.
Perc
enta
ge a
dsor
ption
Time in min.
GSH
GGSH
BGSH
PSH
MsSH
0.5 1.0 1.5 2.0 2.5
70
75
80
85
90
95
Fig 4.1.2. Effect of adsorbent dose on adsorption
of CV with adsorbents.
Perc
enta
ge a
dsor
ptio
n
Adsorbent dose in gm.
GSH
GGSH
BGSH
PSH
MsSH
20 30 40 50 60 70 80 90 100 110
68
70
72
74
76
78
80
82
84
86
88
90
92
94
Fig 4.1.3. Effect of initial concentration on adsorption
of CV with adsorbents.
Perc
enta
ge a
dsor
ptio
n
Initial concentration in ppm.
GSH
GGSH
BGSH
PSH
MsSH

Final Report of Minor Research Project 2015
Evaluation of Adsorption Capacity of Low Cost adsorbent For the Removal of Hazardous Chemicals Page 43
305 310 315 320 325 330
71
72
73
74
75
76
77
78
79
80
81
82
83
84
85
86
87
88
89
90
Fig 4.3.4. Effect of temperature on adsorption
of CV with adsorbents.
Pe
rce
nta
ge
ad
sorp
tion
Temperature in K.
GSH
GGSH
BGSH
PSH
MsSH
2 4 6 8 10 12
70
75
80
85
90
95
100
Fig 4.1.5. Effect of pH on adsorption
of CV with adsorbents.
Pe
rce
nta
ge
ad
sorp
tion
.
pH
GSH
GGSH
BGSH
PSH
MsSH
Final Report of Minor Research Project 2015
Evaluation of Adsorption Capacity of Low Cost adsorbent For the Removal of Hazardous Chemicals Page 44
4.2 Adsorption study of methylene blue (MB) on low-cost materials:-
4.2.1 Effect of contact time:- The agricultural materials such as GSH, GGSH, BGSH,
PSH, and MsSH have been used as a adsorbents for the removal of MB from its aqueous
solutions. All solutions were prepared in double distilled water. For each experiment, 50
ml of MB dye solution was continuously stirred with 1.0 gm. of adsorbent at room
temperature, samples were withdrawn at appropriate time intervals and filtered the
absorbance of supernant liquid was taken at λmax = 570 nm. The effect of contact time,
effect of adsorbent dose, initial concentration, effect of temperature, effect of pH, etc.
were studied likewise.
The effect of contact time on MB adsorption was shown (Table 4.2.1.), the
percentage adsorption of MB increasing with increasing in time and becomes constant
after 35 minutes (Fig.4.2.1.) It is clear that the extent of adsorption is rapid in the initial
stages and becomes slow in later stages till saturation is allowed. Hence at the beginning
of adsorption, the driving force of different MB concentrations between solution and
adsorbents were larger, so the adsorption rate was fast. The first phase was the
instantaneous adsorption stage or external surface adsorption. Then the driving force
becomes smaller and the adsorption rate was slower. The observed trends shows that with
adsorbents MsSH>PSH>GGSH>BGSH>GSH.
4.2.2 Effect of adsorbent dose:- The adsorption of MB on all adsorbents was studied
by varying the adsorbent dosage. The amount of MB adsorption increased with increase
in dosage of adsorbent. Initially the rate of percentage adsorption of dye was found to
increase rapidly with increase of adsorbent dose and slowed down latter, when the dose
increased from 0.50 to 2.50 gm. in each case. From the observation results, the optimum
dose of adsorbent fixed for all adsorbents is 1.0 gm. It can also be seen from Fig.4.2.2,
which after dosage of 1.0 gm. there was no significant changes in percentage adsorption
of dye. Through the percentage adsorption increased with increased adsorption dosage.
There are many factors which can contribute to this adsorption dose effect, (i) as the
dosage of adsorption is increased, the adsorption sites remains unsaturated during the
adsorption reaction leading to drop in adsorption capacity. (ii) The aggregation of sorbent
particles at higher doses, which would lead to decrease in the surface area and a
diffusional path length [17]. The decreasing order of percentage adsorption of MB is
PSH>BGSH>MsSH>GGSH> GSH. Similar results have been reported in literature [18].
4.2.3 Effect of initial concentration:- Initial concentration has its own importance
in adsorption process and variation in its concentration shows significant effect. The
effect of initial concentration of MB on the extent of adsorption of MB dye in terms of
percentage adsorption and the amount of MB adsorbed on prepared adsorbents viz. GSH,
GGSH, BGSH, PSH, MsSH, has been studied by varying the initial concentration of MB
dye (25-100 mg/L) and keeping the other control parameters at their optimum conditions.

Final Report of Minor Research Project 2015
Evaluation of Adsorption Capacity of Low Cost adsorbent For the Removal of Hazardous Chemicals Page 45
The percentage adsorption of MB increases with increase initial concentration [19]. The
observed trend shows that with adsorbents MsSH>BGSH>PSH>GGSH>GSH
(Fig.4.2.3). Similar observations were noted from the previous workers.
4.2.4 Effect of temperature:- Temperature has important effect on adsorption was
investigated in the temperature range of 304.2, 309.2, 314.2, 319.2, 324.2 K and 100
mg/L. It was observed that adsorption decreases with increase in temperature (Figure
4.2.4). The solubility of the adsorbate increase in temperature, this affects work in the
same direction, causing a decrease in adsorption ions n or the mobility of the large MB
increases with increase in temperature, which leads to a decrease in the adsorption
capacity of composite with further increasing temperature, the same phenomenon was
adsorbed by previous study [20, 21].
4.2.5 Effect of pH:- pH is an important factor in controlling the adsorption of MB dye
onto adsorbent. The adsorption of MB ions on GSH, GGSH, BGSH, PSH, and MsSH
was studied at a temperature of 301.6±0.3 K and 100 mg/L. concentration by varying the
pH from 2.0 to 11.0, the solution was equilibrated for 24 hours. The result indicates that
all the selected adsorbents showed good adsorption capacity in acidic medium than in
basic medium. The percentage adsorption of MB dye of adsorption on all adsorbents
progressively decreased on the pH of the solution increased from 2.00 to 11.0. At higher
pH, the percentage adsorption was found to decrease because the surface area of the
adsorbent was more protonated and competitive adsorption occurred between H+ and free
MB ions and their OH- towards the fixation sites. Therefore, H
+ ions react with anionic
functional groups on the surface of the adsorbent and results in restriction of the number
of binding sites favorable for the adsorption of MB ions. However, a favorable increase
in percentage adsorption for all adsorbents was observed below pH 7.0. The observed
trend shows that with all adsorbents the maximum percentage adsorption of MB was of
MsSH> PSH>GGSH>
BGSH>GSH (Fig. 4.2.6.).
4.2.6 Adsorption kinetics:- The kinetics of adsorption was carried out to calculate the
adsorption rate constants, the linear plot of 𝑙𝑜𝑔 (𝑞𝑒 − 𝑞𝑡) against t, and 𝑡 𝑞𝑡⁄ against 𝑡
were drawn for the first order and the second order models, respectively. The rate
constants, the correlation coefficients (R2) and calculated 𝑞𝑒 for all adsorbents are in
Table 4.2.1.
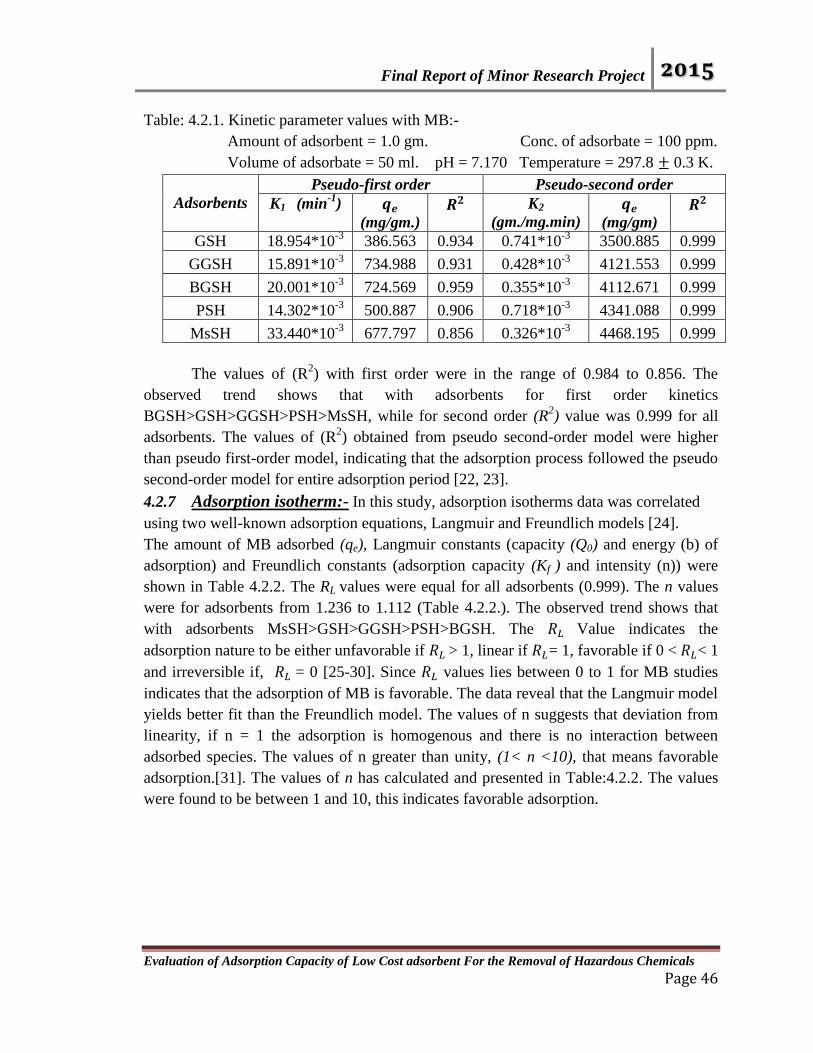
Final Report of Minor Research Project 2015
Evaluation of Adsorption Capacity of Low Cost adsorbent For the Removal of Hazardous Chemicals Page 46
Table: 4.2.1. Kinetic parameter values with MB:-
Amount of adsorbent = 1.0 gm. Conc. of adsorbate = 100 ppm.
Volume of adsorbate = 50 ml. pH = 7.170 Temperature = 297.8 ± 0.3 K.
Adsorbents
Pseudo-first order Pseudo-second order
K1 (min-1
) 𝒒𝒆
(mg/gm.) 𝑹𝟐 K2
(gm./mg.min)
𝒒𝒆
(mg/gm) 𝑹𝟐
GSH 18.954*10-3
386.563 0.934 0.741*10-3
3500.885 0.999
GGSH 15.891*10-3
734.988 0.931 0.428*10-3
4121.553 0.999
BGSH 20.001*10-3
724.569 0.959 0.355*10-3
4112.671 0.999
PSH 14.302*10-3
500.887 0.906 0.718*10-3
4341.088 0.999
MsSH 33.440*10-3
677.797 0.856 0.326*10-3
4468.195 0.999
The values of (R2) with first order were in the range of 0.984 to 0.856. The
observed trend shows that with adsorbents for first order kinetics
BGSH>GSH>GGSH>PSH>MsSH, while for second order (R2) value was 0.999 for all
adsorbents. The values of (R2) obtained from pseudo second-order model were higher
than pseudo first-order model, indicating that the adsorption process followed the pseudo
second-order model for entire adsorption period [22, 23].
4.2.7 Adsorption isotherm:- In this study, adsorption isotherms data was correlated
using two well-known adsorption equations, Langmuir and Freundlich models [24].
The amount of MB adsorbed (qe), Langmuir constants (capacity (Q0) and energy (b) of
adsorption) and Freundlich constants (adsorption capacity (Kf ) and intensity (n)) were
shown in Table 4.2.2. The RL values were equal for all adsorbents (0.999). The n values
were for adsorbents from 1.236 to 1.112 (Table 4.2.2.). The observed trend shows that
with adsorbents MsSH>GSH>GGSH>PSH>BGSH. The 𝑅𝐿 Value indicates the
adsorption nature to be either unfavorable if 𝑅𝐿 > 1, linear if 𝑅𝐿= 1, favorable if 0 < 𝑅𝐿< 1
and irreversible if, 𝑅𝐿 = 0 [25-30]. Since 𝑅𝐿 values lies between 0 to 1 for MB studies
indicates that the adsorption of MB is favorable. The data reveal that the Langmuir model
yields better fit than the Freundlich model. The values of n suggests that deviation from
linearity, if n = 1 the adsorption is homogenous and there is no interaction between
adsorbed species. The values of n greater than unity, (1< n <10), that means favorable
adsorption.[31]. The values of n has calculated and presented in Table:4.2.2. The values
were found to be between 1 and 10, this indicates favorable adsorption.
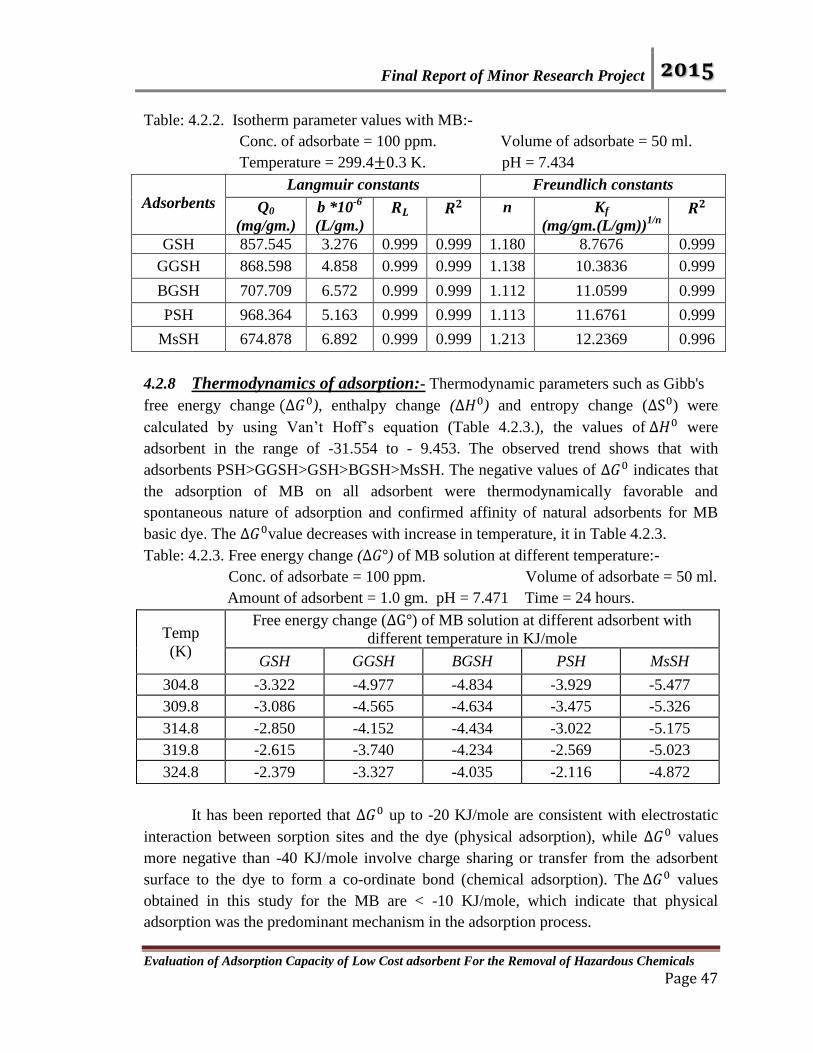
Final Report of Minor Research Project 2015
Evaluation of Adsorption Capacity of Low Cost adsorbent For the Removal of Hazardous Chemicals Page 47
Table: 4.2.2. Isotherm parameter values with MB:-
Conc. of adsorbate = 100 ppm. Volume of adsorbate = 50 ml.
Temperature = 299.4±0.3 K. pH = 7.434
Adsorbents
Langmuir constants Freundlich constants
Q0
(mg/gm.)
b *10-6
(L/gm.)
𝑹𝑳 𝑹𝟐 n Kf
(mg/gm.(L/gm))1/n
𝑹𝟐
GSH 857.545 3.276 0.999 0.999 1.180 8.7676 0.999
GGSH 868.598 4.858 0.999 0.999 1.138 10.3836 0.999
BGSH 707.709 6.572 0.999 0.999 1.112 11.0599 0.999
PSH 968.364 5.163 0.999 0.999 1.113 11.6761 0.999
MsSH 674.878 6.892 0.999 0.999 1.213 12.2369 0.996
4.2.8 Thermodynamics of adsorption:- Thermodynamic parameters such as Gibb's
free energy change (∆𝐺0), enthalpy change (∆𝐻0) and entropy change (∆S0) were
calculated by using Van’t Hoff’s equation (Table 4.2.3.), the values of ∆𝐻0 were
adsorbent in the range of -31.554 to - 9.453. The observed trend shows that with
adsorbents PSH>GGSH>GSH>BGSH>MsSH. The negative values of ∆𝐺0 indicates that
the adsorption of MB on all adsorbent were thermodynamically favorable and
spontaneous nature of adsorption and confirmed affinity of natural adsorbents for MB
basic dye. The ∆𝐺0value decreases with increase in temperature, it in Table 4.2.3.
Table: 4.2.3. Free energy change (∆𝐺°) of MB solution at different temperature:-
Conc. of adsorbate = 100 ppm. Volume of adsorbate = 50 ml.
Amount of adsorbent = 1.0 gm. pH = 7.471 Time = 24 hours.
Temp
(K)
Free energy change (∆G°) of MB solution at different adsorbent with
different temperature in KJ/mole
GSH GGSH BGSH PSH MsSH
304.8 -3.322 -4.977 -4.834 -3.929 -5.477
309.8 -3.086 -4.565 -4.634 -3.475 -5.326
314.8 -2.850 -4.152 -4.434 -3.022 -5.175
319.8 -2.615 -3.740 -4.234 -2.569 -5.023
324.8 -2.379 -3.327 -4.035 -2.116 -4.872
It has been reported that ∆𝐺0 up to -20 KJ/mole are consistent with electrostatic
interaction between sorption sites and the dye (physical adsorption), while ∆𝐺0 values
more negative than -40 KJ/mole involve charge sharing or transfer from the adsorbent
surface to the dye to form a co-ordinate bond (chemical adsorption). The ∆𝐺0 values
obtained in this study for the MB are < -10 KJ/mole, which indicate that physical
adsorption was the predominant mechanism in the adsorption process.
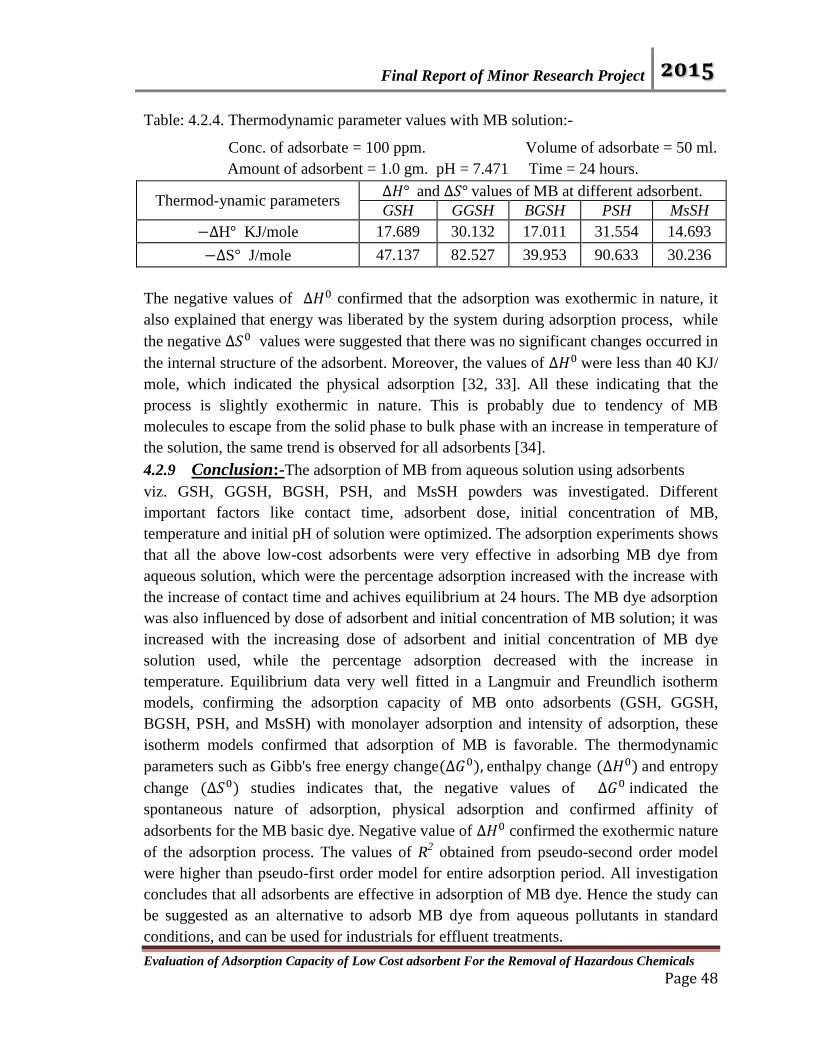
Final Report of Minor Research Project 2015
Evaluation of Adsorption Capacity of Low Cost adsorbent For the Removal of Hazardous Chemicals Page 48
Table: 4.2.4. Thermodynamic parameter values with MB solution:-
Conc. of adsorbate = 100 ppm. Volume of adsorbate = 50 ml.
Amount of adsorbent = 1.0 gm. pH = 7.471 Time = 24 hours.
Thermod-ynamic parameters ∆𝐻° and ∆𝑆° values of MB at different adsorbent.
GSH GGSH BGSH PSH MsSH
−∆H° KJ/mole 17.689 30.132 17.011 31.554 14.693
−∆S° J/mole 47.137 82.527 39.953 90.633 30.236
The negative values of ∆𝐻0 confirmed that the adsorption was exothermic in nature, it
also explained that energy was liberated by the system during adsorption process, while
the negative ∆𝑆0 values were suggested that there was no significant changes occurred in
the internal structure of the adsorbent. Moreover, the values of ∆𝐻0 were less than 40 KJ/
mole, which indicated the physical adsorption [32, 33]. All these indicating that the
process is slightly exothermic in nature. This is probably due to tendency of MB
molecules to escape from the solid phase to bulk phase with an increase in temperature of
the solution, the same trend is observed for all adsorbents [34].
4.2.9 Conclusion:-The adsorption of MB from aqueous solution using adsorbents
viz. GSH, GGSH, BGSH, PSH, and MsSH powders was investigated. Different
important factors like contact time, adsorbent dose, initial concentration of MB,
temperature and initial pH of solution were optimized. The adsorption experiments shows
that all the above low-cost adsorbents were very effective in adsorbing MB dye from
aqueous solution, which were the percentage adsorption increased with the increase with
the increase of contact time and achives equilibrium at 24 hours. The MB dye adsorption
was also influenced by dose of adsorbent and initial concentration of MB solution; it was
increased with the increasing dose of adsorbent and initial concentration of MB dye
solution used, while the percentage adsorption decreased with the increase in
temperature. Equilibrium data very well fitted in a Langmuir and Freundlich isotherm
models, confirming the adsorption capacity of MB onto adsorbents (GSH, GGSH,
BGSH, PSH, and MsSH) with monolayer adsorption and intensity of adsorption, these
isotherm models confirmed that adsorption of MB is favorable. The thermodynamic
parameters such as Gibb's free energy change(∆𝐺0), enthalpy change (∆𝐻0) and entropy
change (∆𝑆0) studies indicates that, the negative values of ∆𝐺0 indicated the
spontaneous nature of adsorption, physical adsorption and confirmed affinity of
adsorbents for the MB basic dye. Negative value of ∆𝐻0 confirmed the exothermic nature
of the adsorption process. The values of R2 obtained from pseudo-second order model
were higher than pseudo-first order model for entire adsorption period. All investigation
concludes that all adsorbents are effective in adsorption of MB dye. Hence the study can
be suggested as an alternative to adsorb MB dye from aqueous pollutants in standard
conditions, and can be used for industrials for effluent treatments.
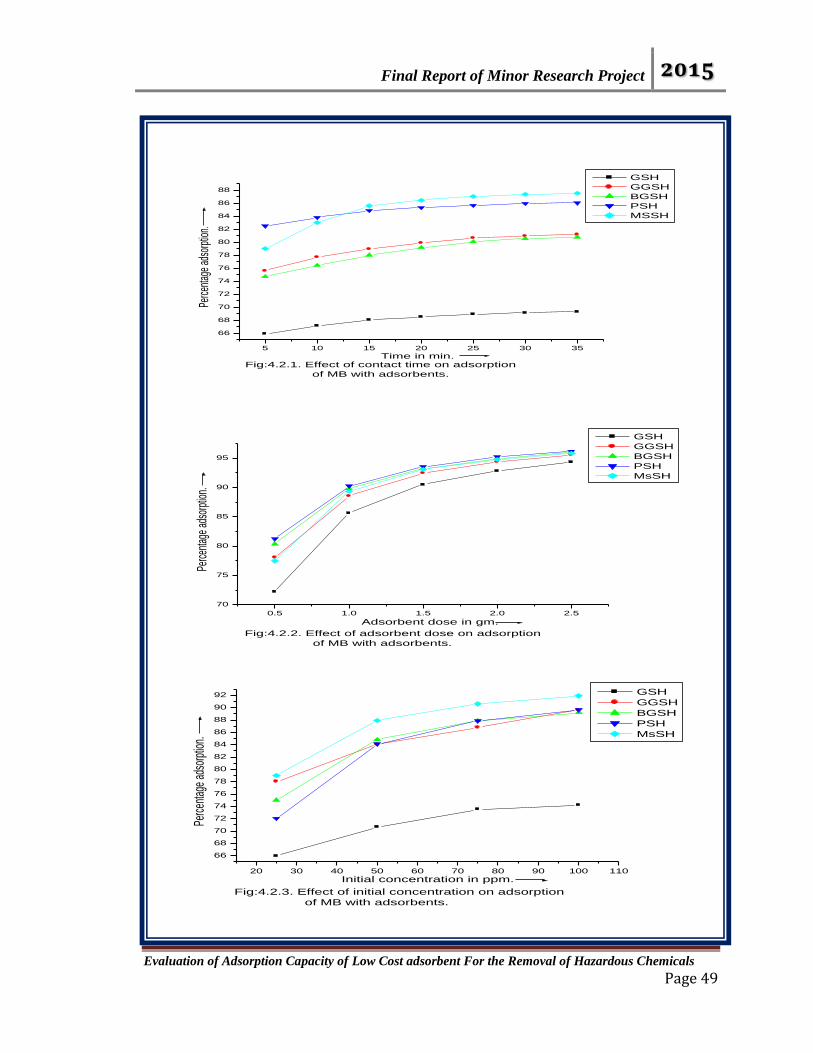
Final Report of Minor Research Project 2015
Evaluation of Adsorption Capacity of Low Cost adsorbent For the Removal of Hazardous Chemicals Page 49
5 10 15 20 25 30 35
66
68
70
72
74
76
78
80
82
84
86
88
Fig:4.2.1. Effect of contact time on adsorption
of MB with adsorbents.
Perc
enta
ge a
dsor
ption
.
Time in min.
GSH
GGSH
BGSH
PSH
MSSH
0.5 1.0 1.5 2.0 2.5
70
75
80
85
90
95
Fig:4.2.2. Effect of adsorbent dose on adsorption
of MB with adsorbents.
Perc
enta
ge a
dsor
ption
.
Adsorbent dose in gm.
GSH
GGSH
BGSH
PSH
MsSH
20 30 40 50 60 70 80 90 100 110
66
68
70
72
74
76
78
80
82
84
86
88
90
92
Fig:4.2.3. Effect of initial concentration on adsorption
of MB with adsorbents.
Perc
enta
ge a
dsor
ptio
n.
Initial concentration in ppm.
GSH
GGSH
BGSH
PSH
MsSH
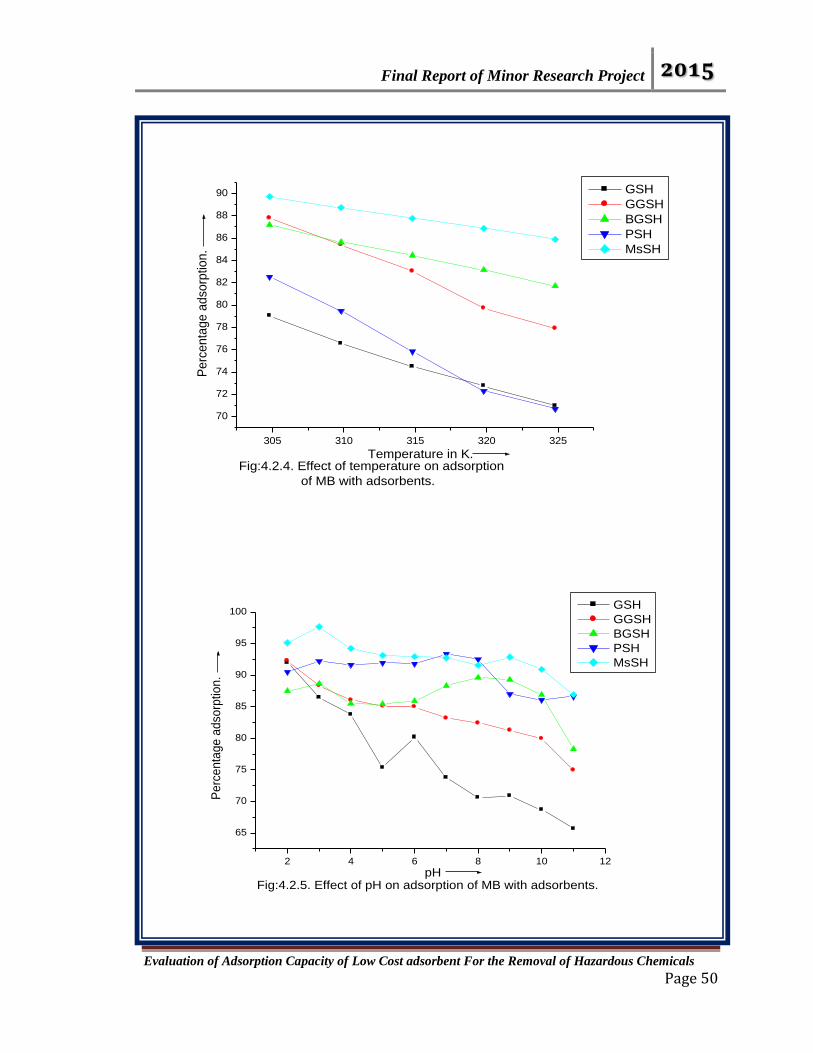
Final Report of Minor Research Project 2015
Evaluation of Adsorption Capacity of Low Cost adsorbent For the Removal of Hazardous Chemicals Page 50
305 310 315 320 325
70
72
74
76
78
80
82
84
86
88
90
Fig:4.2.4. Effect of temperature on adsorption
of MB with adsorbents.
Perc
enta
ge
ad
sorp
tion.
Temperature in K.
GSH
GGSH
BGSH
PSH
MsSH
2 4 6 8 10 12
65
70
75
80
85
90
95
100
Fig:4.2.5. Effect of pH on adsorption of MB with adsorbents.
Pe
rce
nta
ge
ad
sorp
tion
.
pH
GSH
GGSH
BGSH
PSH
MsSH

Final Report of Minor Research Project 2015
Evaluation of Adsorption Capacity of Low Cost adsorbent For the Removal of Hazardous Chemicals Page 51
4.3 Adsorption study of chromium metal ions on low-cost materials:-
4.3.1 Effect of contact time:- The various low-cost adsorbents such as GSH, GGSH,
BGSH, PSH, MsSH, have been used as a adsorbents for the removal of Cr (VI) metal
ions from its aqueous solutions. All solutions were prepared in double distilled water. For
each experiment, 50 ml of Cr (VI) solution was continuously stirred with 0.50 gm. of
adsorbent at room temperature, 10 ml of chromium sample solution was transferred to
100 ml standard flask; enough H2SO4 was added to make acid concentration 0.2 N on
dilution up to 25 ml. Now add one ml of diphenyl carbazide [(C6H5NH.NH2) CO]
solution, it was shacked till it got mixed with the solution, allow the solution to stand for
10 – 15 minutes. And samples were withdrawn at appropriate time intervals and filtered
then absorbance of supernant liquid was taken at λmax = 540 nm. The effect of contact
time, effect of adsorbent dose, initial concentration, effect of temperature, effect of pH,
etc. was studied likewise.
Contact time is one of the effective factors in batch adsorption process. In this
stage, all of the parameters except contact time, including temperature (301.5±0.3K),
adsorbent dose (0.5 gm), initial concentration (5 mg/L), pH (5.489) were kept constants.
The effect of contact time on Cr (VI) adsorption efficiency showed in Fig. 4.4.1. As it is shown,
the percentage adsorption of Cr (VI) increased with increase with in contact time, due to
large surface area available of adsorbent, percentage adsorption rate initially increased rapidly
up to 30 minute. Further increase in contact time did not increased percentage adsorption rapidly.
The observed trend of percentage adsorption of Cr (VI) with adsorbents was
MsSH>GGSH>GSH> BGSH> PSH.
4.3.2 Effect of adsorbent dose:- The effect of adsorbent dose on the adsorption was
studied by varying the amount of adsorbent from 0.50 to 2.5 gm. The adsorbent was
added to 50 ml of Cr (VI) solution of 5 mg/L. concentration and equilibrated for 24
hours. After the equilibrium time, solution was analyzed for the amount of Cr (VI) and
present adsorption was estimated. The effect of adsorbent dose on the adsorption of Cr
(VI) by presented in Fig.4.3.2. It is evident from Fig.4.3.2. that percentage adsorption of
Cr (VI) metal ion increases with increase in adsorbent dose, may be due to the increase in
adsorbent surface area of adsorbent particles and the availability of more binding sites
increases for adsorption [35]. The order of percentage adsorption of Cr (VI) metal ion by
studied adsorbent forms was MsSH>GGSH> GSH>BGSH> >PSH.
4.3.3 Effect of initial concentration:- Initial concentration is one of the effective
factors on adsorption efficiency. The experiments were done with variable Cr (VI) initial
concentration (5,10,15 and 20 mg/L) and at constant temperature (301.5±0.3 K.), pH
(6.9±0.3), adsorbent dose (0.5 gm/50 ml) and contact time (24 hours). The experimental
results of the initial concentration of Cr (VI) on adsorption efficiency were presented in
Fig.4.3.3. The Fig.4.4.3 shows that, the chromium percentage adsorption efficiency
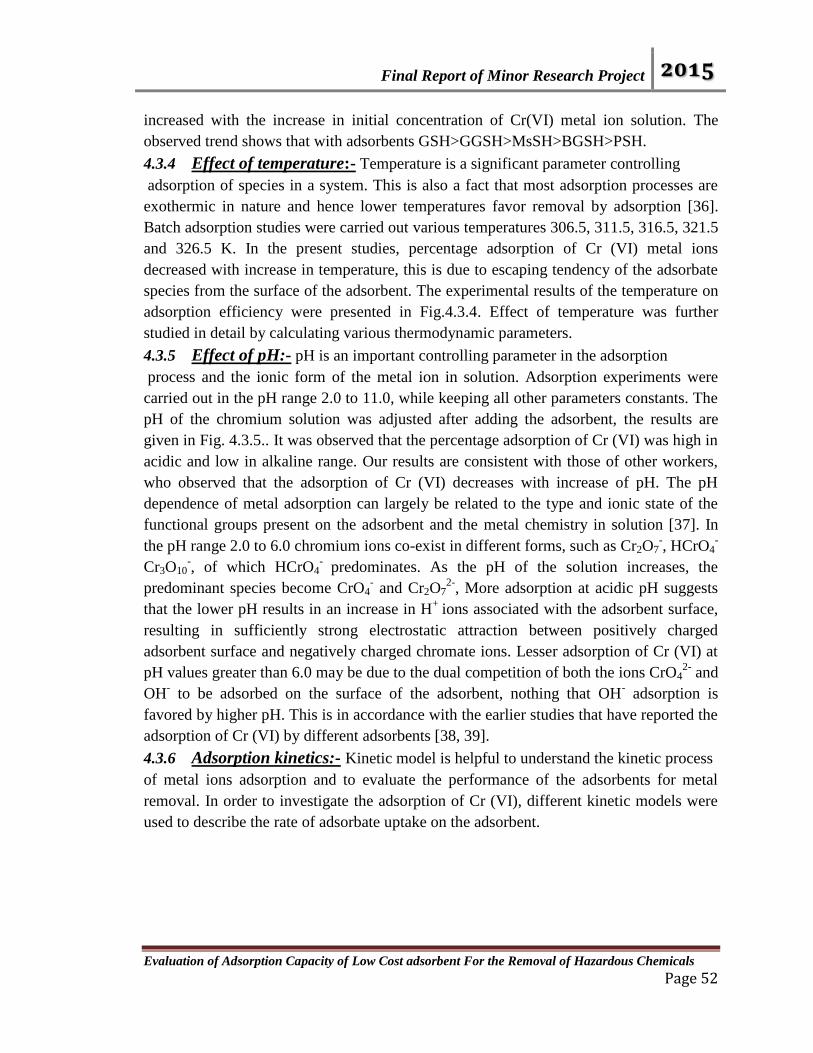
Final Report of Minor Research Project 2015
Evaluation of Adsorption Capacity of Low Cost adsorbent For the Removal of Hazardous Chemicals Page 52
increased with the increase in initial concentration of Cr(VI) metal ion solution. The
observed trend shows that with adsorbents GSH>GGSH>MsSH>BGSH>PSH.
4.3.4 Effect of temperature:- Temperature is a significant parameter controlling
adsorption of species in a system. This is also a fact that most adsorption processes are
exothermic in nature and hence lower temperatures favor removal by adsorption [36].
Batch adsorption studies were carried out various temperatures 306.5, 311.5, 316.5, 321.5
and 326.5 K. In the present studies, percentage adsorption of Cr (VI) metal ions
decreased with increase in temperature, this is due to escaping tendency of the adsorbate
species from the surface of the adsorbent. The experimental results of the temperature on
adsorption efficiency were presented in Fig.4.3.4. Effect of temperature was further
studied in detail by calculating various thermodynamic parameters.
4.3.5 Effect of pH:- pH is an important controlling parameter in the adsorption
process and the ionic form of the metal ion in solution. Adsorption experiments were
carried out in the pH range 2.0 to 11.0, while keeping all other parameters constants. The
pH of the chromium solution was adjusted after adding the adsorbent, the results are
given in Fig. 4.3.5.. It was observed that the percentage adsorption of Cr (VI) was high in
acidic and low in alkaline range. Our results are consistent with those of other workers,
who observed that the adsorption of Cr (VI) decreases with increase of pH. The pH
dependence of metal adsorption can largely be related to the type and ionic state of the
functional groups present on the adsorbent and the metal chemistry in solution [37]. In
the pH range 2.0 to 6.0 chromium ions co-exist in different forms, such as Cr2O7-, HCrO4
-
Cr3O10-, of which HCrO4
- predominates. As the pH of the solution increases, the
predominant species become CrO4- and Cr2O7
2-, More adsorption at acidic pH suggests
that the lower pH results in an increase in H+
ions associated with the adsorbent surface,
resulting in sufficiently strong electrostatic attraction between positively charged
adsorbent surface and negatively charged chromate ions. Lesser adsorption of Cr (VI) at
pH values greater than 6.0 may be due to the dual competition of both the ions CrO42-
and
OH- to be adsorbed on the surface of the adsorbent, nothing that OH
- adsorption is
favored by higher pH. This is in accordance with the earlier studies that have reported the
adsorption of Cr (VI) by different adsorbents [38, 39].
4.3.6 Adsorption kinetics:- Kinetic model is helpful to understand the kinetic process
of metal ions adsorption and to evaluate the performance of the adsorbents for metal
removal. In order to investigate the adsorption of Cr (VI), different kinetic models were
used to describe the rate of adsorbate uptake on the adsorbent.
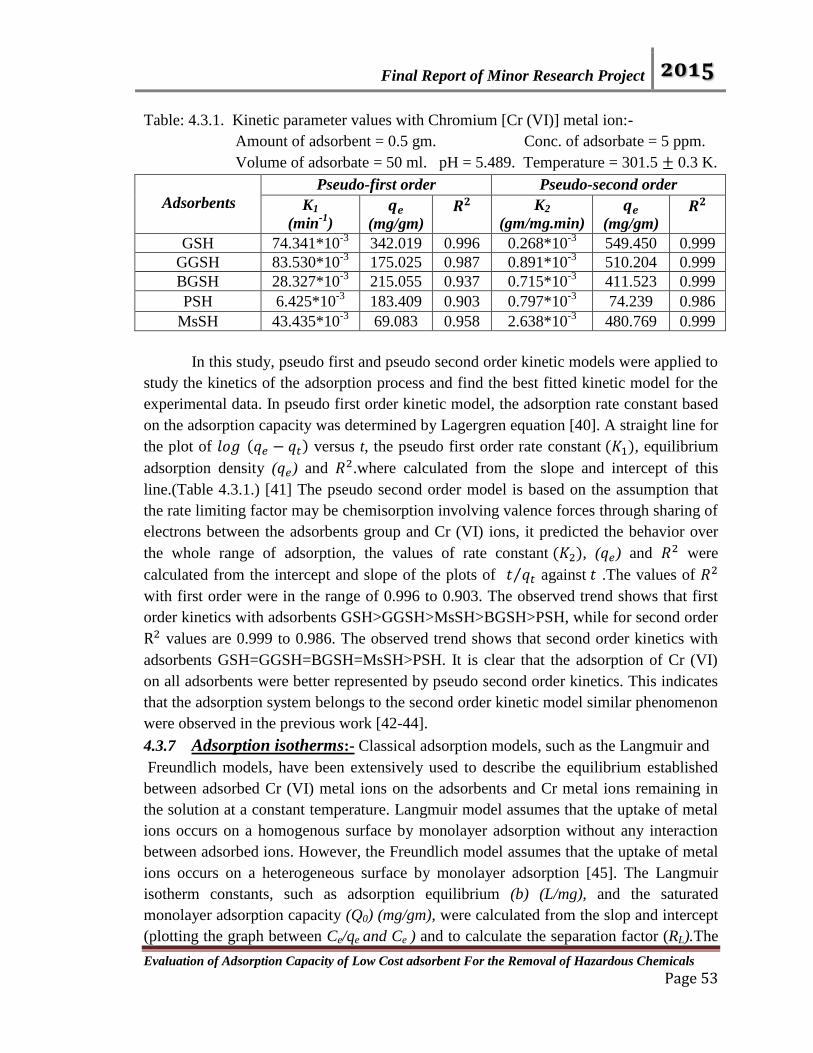
Final Report of Minor Research Project 2015
Evaluation of Adsorption Capacity of Low Cost adsorbent For the Removal of Hazardous Chemicals Page 53
Table: 4.3.1. Kinetic parameter values with Chromium [Cr (VI)] metal ion:-
Amount of adsorbent = 0.5 gm. Conc. of adsorbate = 5 ppm.
Volume of adsorbate = 50 ml. pH = 5.489. Temperature = 301.5 ± 0.3 K.
Adsorbents
Pseudo-first order Pseudo-second order
K1
(min-1
)
𝒒𝒆
(mg/gm) 𝑹𝟐 K2
(gm/mg.min)
𝒒𝒆
(mg/gm) 𝑹𝟐
GSH 74.341*10-3
342.019 0.996 0.268*10-3
549.450 0.999
GGSH 83.530*10-3
175.025 0.987 0.891*10-3
510.204 0.999
BGSH 28.327*10-3
215.055 0.937 0.715*10-3
411.523 0.999
PSH 6.425*10-3
183.409 0.903 0.797*10-3
74.239 0.986
MsSH 43.435*10-3
69.083 0.958 2.638*10-3
480.769 0.999
In this study, pseudo first and pseudo second order kinetic models were applied to
study the kinetics of the adsorption process and find the best fitted kinetic model for the
experimental data. In pseudo first order kinetic model, the adsorption rate constant based
on the adsorption capacity was determined by Lagergren equation [40]. A straight line for
the plot of 𝑙𝑜𝑔 (𝑞𝑒 − 𝑞𝑡) versus t, the pseudo first order rate constant (𝐾1), equilibrium
adsorption density (𝑞𝑒) and 𝑅2.where calculated from the slope and intercept of this
line.(Table 4.3.1.) [41] The pseudo second order model is based on the assumption that
the rate limiting factor may be chemisorption involving valence forces through sharing of
electrons between the adsorbents group and Cr (VI) ions, it predicted the behavior over
the whole range of adsorption, the values of rate constant (𝐾2), (𝑞𝑒) and 𝑅2 were
calculated from the intercept and slope of the plots of 𝑡 𝑞𝑡⁄ against 𝑡 .The values of 𝑅2
with first order were in the range of 0.996 to 0.903. The observed trend shows that first
order kinetics with adsorbents GSH>GGSH>MsSH>BGSH>PSH, while for second order
R2 values are 0.999 to 0.986. The observed trend shows that second order kinetics with
adsorbents GSH=GGSH=BGSH=MsSH>PSH. It is clear that the adsorption of Cr (VI)
on all adsorbents were better represented by pseudo second order kinetics. This indicates
that the adsorption system belongs to the second order kinetic model similar phenomenon
were observed in the previous work [42-44].
4.3.7 Adsorption isotherms:- Classical adsorption models, such as the Langmuir and
Freundlich models, have been extensively used to describe the equilibrium established
between adsorbed Cr (VI) metal ions on the adsorbents and Cr metal ions remaining in
the solution at a constant temperature. Langmuir model assumes that the uptake of metal
ions occurs on a homogenous surface by monolayer adsorption without any interaction
between adsorbed ions. However, the Freundlich model assumes that the uptake of metal
ions occurs on a heterogeneous surface by monolayer adsorption [45]. The Langmuir
isotherm constants, such as adsorption equilibrium (b) (L/mg), and the saturated
monolayer adsorption capacity (Q0) (mg/gm), were calculated from the slop and intercept
(plotting the graph between Ce/qe and Ce ) and to calculate the separation factor (RL).The
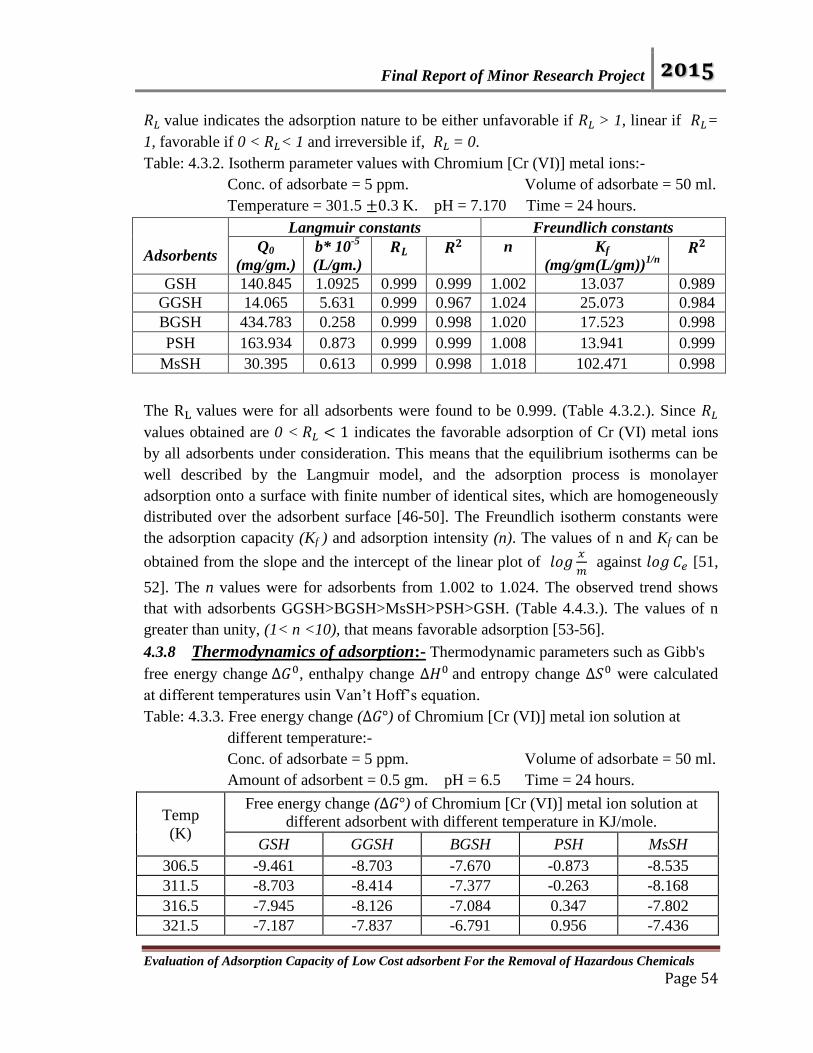
Final Report of Minor Research Project 2015
Evaluation of Adsorption Capacity of Low Cost adsorbent For the Removal of Hazardous Chemicals Page 54
𝑅𝐿 value indicates the adsorption nature to be either unfavorable if 𝑅𝐿 > 1, linear if 𝑅𝐿=
1, favorable if 0 < 𝑅𝐿< 1 and irreversible if, 𝑅𝐿 = 0.
Table: 4.3.2. Isotherm parameter values with Chromium [Cr (VI)] metal ions:-
Conc. of adsorbate = 5 ppm. Volume of adsorbate = 50 ml.
Temperature = 301.5 ±0.3 K. pH = 7.170 Time = 24 hours.
Adsorbents
Langmuir constants Freundlich constants
Q0
(mg/gm.)
b* 10-5
(L/gm.)
𝑹𝑳 𝑹𝟐 n Kf
(mg/gm(L/gm))1/n
𝑹𝟐
GSH 140.845 1.0925 0.999 0.999 1.002 13.037 0.989
GGSH 14.065 5.631 0.999 0.967 1.024 25.073 0.984
BGSH 434.783 0.258 0.999 0.998 1.020 17.523 0.998
PSH 163.934 0.873 0.999 0.999 1.008 13.941 0.999
MsSH 30.395 0.613 0.999 0.998 1.018 102.471 0.998
The RL values were for all adsorbents were found to be 0.999. (Table 4.3.2.). Since 𝑅𝐿
values obtained are 0 < 𝑅𝐿 < 1 indicates the favorable adsorption of Cr (VI) metal ions
by all adsorbents under consideration. This means that the equilibrium isotherms can be
well described by the Langmuir model, and the adsorption process is monolayer
adsorption onto a surface with finite number of identical sites, which are homogeneously
distributed over the adsorbent surface [46-50]. The Freundlich isotherm constants were
the adsorption capacity (Kf ) and adsorption intensity (n). The values of n and Kf can be
obtained from the slope and the intercept of the linear plot of 𝑙𝑜𝑔𝑥
𝑚 against 𝑙𝑜𝑔 𝐶𝑒 [51,
52]. The n values were for adsorbents from 1.002 to 1.024. The observed trend shows
that with adsorbents GGSH>BGSH>MsSH>PSH>GSH. (Table 4.4.3.). The values of n
greater than unity, (1< n <10), that means favorable adsorption [53-56].
4.3.8 Thermodynamics of adsorption:- Thermodynamic parameters such as Gibb's
free energy change ∆𝐺0, enthalpy change ∆𝐻0 and entropy change ∆𝑆0 were calculated
at different temperatures usin Van’t Hoff’s equation.
Table: 4.3.3. Free energy change (∆𝐺°) of Chromium [Cr (VI)] metal ion solution at
different temperature:-
Conc. of adsorbate = 5 ppm. Volume of adsorbate = 50 ml.
Amount of adsorbent = 0.5 gm. pH = 6.5 Time = 24 hours.
Temp
(K)
Free energy change (∆𝐺°) of Chromium [Cr (VI)] metal ion solution at
different adsorbent with different temperature in KJ/mole.
GSH GGSH BGSH PSH MsSH
306.5 -9.461 -8.703 -7.670 -0.873 -8.535
311.5 -8.703 -8.414 -7.377 -0.263 -8.168
316.5 -7.945 -8.126 -7.084 0.347 -7.802
321.5 -7.187 -7.837 -6.791 0.956 -7.436
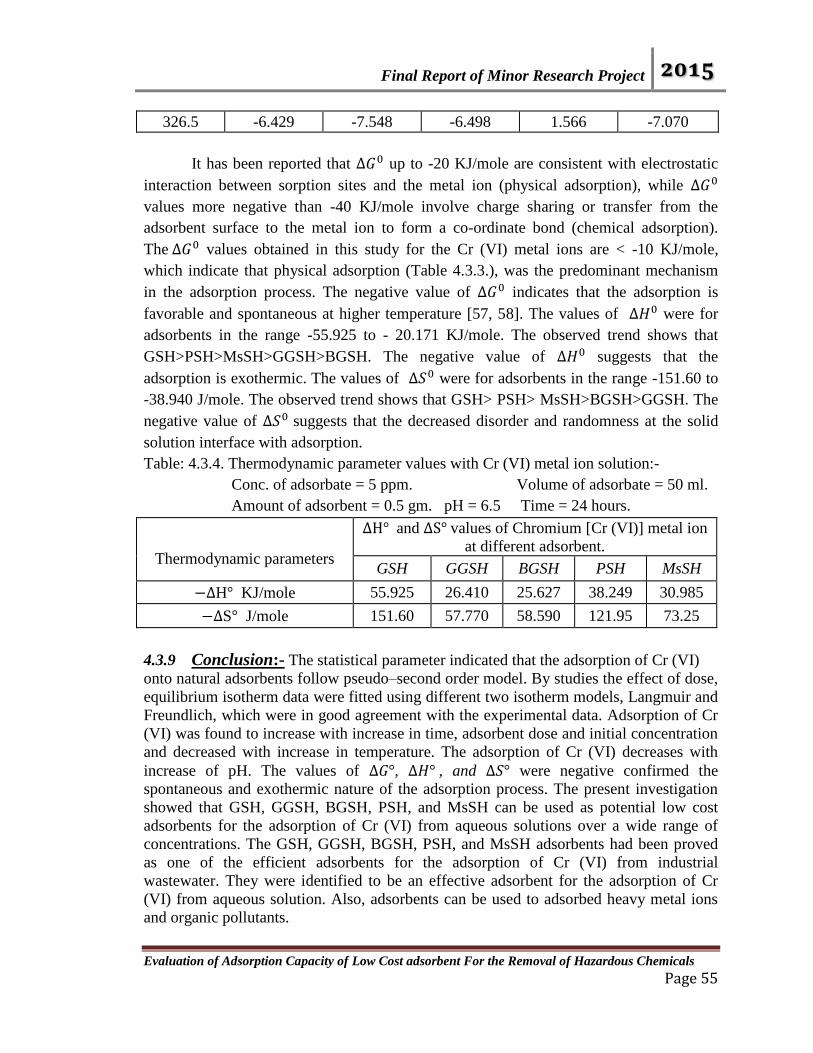
Final Report of Minor Research Project 2015
Evaluation of Adsorption Capacity of Low Cost adsorbent For the Removal of Hazardous Chemicals Page 55
326.5 -6.429 -7.548 -6.498 1.566 -7.070
It has been reported that ∆𝐺0 up to -20 KJ/mole are consistent with electrostatic
interaction between sorption sites and the metal ion (physical adsorption), while ∆𝐺0
values more negative than -40 KJ/mole involve charge sharing or transfer from the
adsorbent surface to the metal ion to form a co-ordinate bond (chemical adsorption).
The ∆𝐺0 values obtained in this study for the Cr (VI) metal ions are < -10 KJ/mole,
which indicate that physical adsorption (Table 4.3.3.), was the predominant mechanism
in the adsorption process. The negative value of ∆𝐺0 indicates that the adsorption is
favorable and spontaneous at higher temperature [57, 58]. The values of ∆𝐻0 were for
adsorbents in the range -55.925 to - 20.171 KJ/mole. The observed trend shows that
GSH>PSH>MsSH>GGSH>BGSH. The negative value of ∆𝐻0 suggests that the
adsorption is exothermic. The values of ∆𝑆0 were for adsorbents in the range -151.60 to
-38.940 J/mole. The observed trend shows that GSH> PSH> MsSH>BGSH>GGSH. The
negative value of ∆𝑆0 suggests that the decreased disorder and randomness at the solid
solution interface with adsorption.
Table: 4.3.4. Thermodynamic parameter values with Cr (VI) metal ion solution:-
Conc. of adsorbate = 5 ppm. Volume of adsorbate = 50 ml.
Amount of adsorbent = 0.5 gm. pH = 6.5 Time = 24 hours.
Thermodynamic parameters
∆H° and ∆S° values of Chromium [Cr (VI)] metal ion
at different adsorbent.
GSH GGSH BGSH PSH MsSH
−∆H° KJ/mole 55.925 26.410 25.627 38.249 30.985
−∆S° J/mole 151.60 57.770 58.590 121.95 73.25
4.3.9 Conclusion:- The statistical parameter indicated that the adsorption of Cr (VI)
onto natural adsorbents follow pseudo–second order model. By studies the effect of dose,
equilibrium isotherm data were fitted using different two isotherm models, Langmuir and
Freundlich, which were in good agreement with the experimental data. Adsorption of Cr
(VI) was found to increase with increase in time, adsorbent dose and initial concentration
and decreased with increase in temperature. The adsorption of Cr (VI) decreases with
increase of pH. The values of ∆𝐺°, ∆𝐻° , and ∆𝑆° were negative confirmed the
spontaneous and exothermic nature of the adsorption process. The present investigation
showed that GSH, GGSH, BGSH, PSH, and MsSH can be used as potential low cost
adsorbents for the adsorption of Cr (VI) from aqueous solutions over a wide range of
concentrations. The GSH, GGSH, BGSH, PSH, and MsSH adsorbents had been proved
as one of the efficient adsorbents for the adsorption of Cr (VI) from industrial
wastewater. They were identified to be an effective adsorbent for the adsorption of Cr
(VI) from aqueous solution. Also, adsorbents can be used to adsorbed heavy metal ions
and organic pollutants.

Final Report of Minor Research Project 2015
Evaluation of Adsorption Capacity of Low Cost adsorbent For the Removal of Hazardous Chemicals Page 56
5 10 15 20 25 30 35
0
10
20
30
40
50
60
70
80
90
100
Fig:4.3.1. Effect of contact time on adsorption
of Cr(VI) with adsorbents.
Perc
enta
ge a
dsor
ptio
n.
Time in min.
GSH
GGSH
BGSH
PSH
MsSH
0.2 0.3 0.4 0.5 0.6 0.7 0.8 0.9 1.0 1.1
45
50
55
60
65
70
75
80
85
90
95
100
Fig:4.3.2. Effect of adsorbent dose on adsorption
of Cr(VI) with adsorbents.
Perc
enta
ge a
dsor
ptio
n.
Adsorbent dose in gm.
GSH
GGSH
BGSH
PSH
MsSH
4 6 8 10 12 14 16 18 20 22
30
40
50
60
70
80
90
100
Fig:4.3.3. Effect of initial concentration on adsorption
of Cr(VI) with adsorbents.
Perc
enta
ge a
dsor
ptio
n.
Initial concentration in ppm.
GSH
GGSH
BGSH
PSH
MsSH
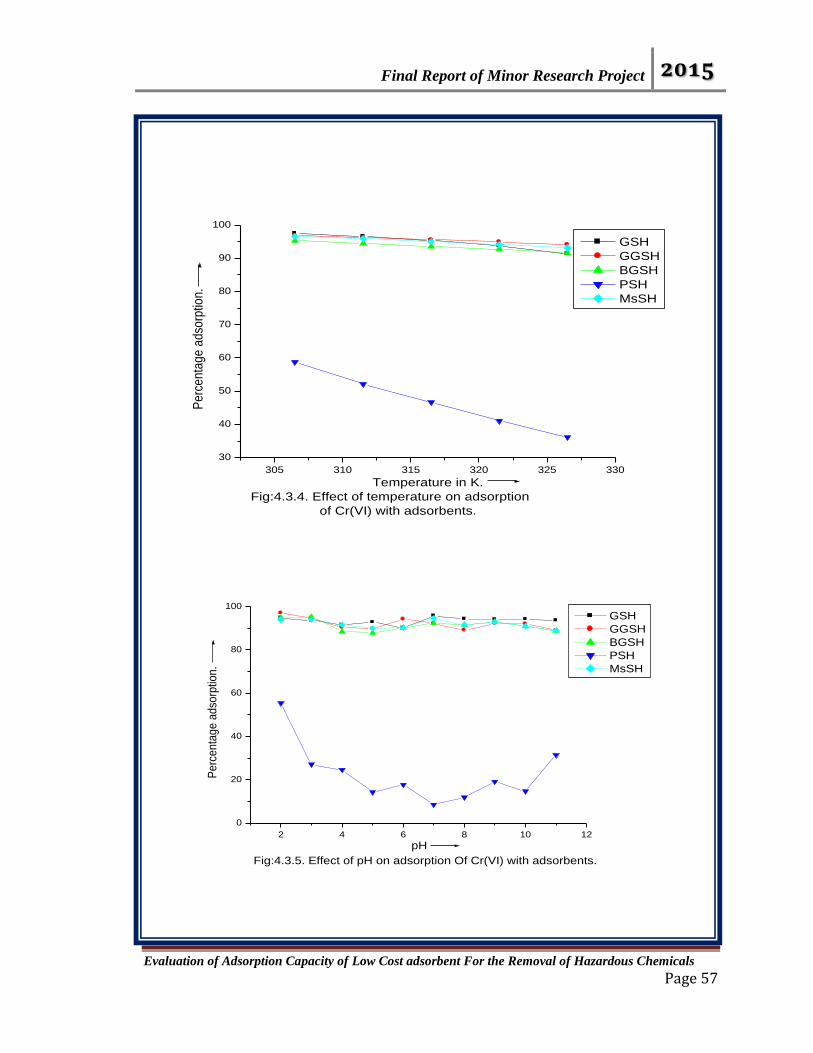
Final Report of Minor Research Project 2015
Evaluation of Adsorption Capacity of Low Cost adsorbent For the Removal of Hazardous Chemicals Page 57
305 310 315 320 325 330
30
40
50
60
70
80
90
100
Fig:4.3.4. Effect of temperature on adsorption
of Cr(VI) with adsorbents.
Pe
rce
nta
ge
ad
sorp
tion
.
Temperature in K.
GSH
GGSH
BGSH
PSH
MsSH
2 4 6 8 10 12
0
20
40
60
80
100
Fig:4.3.5. Effect of pH on adsorption Of Cr(VI) with adsorbents.
Pe
rce
nta
ge
ad
sorp
tion
.
pH
GSH
GGSH
BGSH
PSH
MsSH

Final Report of Minor Research Project 2015
Evaluation of Adsorption Capacity of Low Cost adsorbent For the Removal of Hazardous Chemicals Page 58
4.4 Adsorption study of nickel metal ions on low-cost materials:-
4.4.1 Effect of contact time:- The adsorption experiments were carried out in stirred
batch mode to perform the experiment, working solution of Ni (II) was prepared by
dissolving the respective metal sulfate in double distilled water, the GSH, GGSH, BGSH,
PSH, and MsSH powders were used as adsorbents for adsorption of Ni (II) metal ions.
The residual were withdrawn at appropriate time intervals and filtered; the absorbance of
supernant liquid was determined at λmax = 366 nm. The effect of contact time, effect of
adsorbent dose, initial concentration, effect of temperature, effect of pH, etc. was studied.
Effect of contact time on the adsorption of Ni (II) metal ion on the adsorbents
such as GSH, GGSH, BGSH, PSH, and MsSH was carried out using batch technique.
The results for the effect of contact time on the adsorption of Ni (II) metal ion adsorption
are shown in Fig.4.4.1. 0.5 gm of adsorbent, and 20 mg/L concentration were used for
this experiment in contact time 35 minute at temperature 303.0 ± 0.3 K. It is noted that
the rate of percentage adsorption of Ni metal ions increases with increase in contact time.
At the initial stage rate of percentage adsorption of Ni (II) metal ion was higher due to
availability of large number of active sites on the surface of the adsorbent and becomes
slower after 30 minutes, due to decreased number of active sites. The maximum
adsorption of Ni (II) found on BGSH adsorbent, while minimum on GSH adsorbent. The
observed trend shows that BGSH>PSH>MsSH>GGSH>GSH. Similar observation has
been reported in literature [59].
4.4.2 Effect of adsorbent dose:-The effect of adsorbent dose on the adsorption of Ni
(II) metal ion was studied by using different masses of the adsorbent in the range of 0.25
to 1.0 gm. The percentage adsorption of Ni (II) metal ion increases with increase in
adsorption dose.( Fig. 4.4.2.), this is because of the availability of more and more binding
sites for complexion of Ni (II) metal ions.
4.4.3 Effect of initial concentration:- A series of experiments were studied for the
effect of initial concentration on the adsorption of NI (II) metal ions by adsorbents such
as GSH, GGSH, BGSH, PSH, and MsSH. The initial concentration of Ni (II) metal ion
was varied from 5 to 20 mg/L, keeping all other parameters at their optimum levels. The
graph presented in Fig.4.4.3.showed that the percentage adsorption of Ni (II) metal ion
capacity increased with increase in the Ni (II) metal concentration. This was due to
higher probabilities of collision between metal ion and adsorbent. The observed trend
showed that with adsorbents GSH>MsSH>GGSH> PSH>BGSH. Similar observation
was reported in literature [60].
4.4.4 Effect of temperature:-Effect of temperature on Ni (II) metal ions adsorption
was evaluated at temperatures of 306.5, 311.5, 316.5, 321.5 and 326.5 K., the other
parameters were kept constants (Table 3.6.4. (a)- 3.6.4.(i)). The effect of temperature on
the percentage adsorption of NI (II) metal ion on adsorbents was shown in Fig. 4.4.4. The

Final Report of Minor Research Project 2015
Evaluation of Adsorption Capacity of Low Cost adsorbent For the Removal of Hazardous Chemicals Page 59
result reveals that the percentage adsorption of Ni (II) metal ion decreases with increase
in temperature, indicating that the adsorption is exothermic.
4.4.5 Effect of pH:- pH is also an important parameter that affects the adsorption of
Ni (II) metal ions from aqueous solution. The batch adsorption studies at different pH
values were carried out in the range of 2.00 to 11.00. The results are shown in Fig.4.4.5.
The maximum percentage adsorption of Ni (II) metal ions was observed at pH 6.0 and
hence this was taken as the optimum pH for subsequent studies. The percentage
adsorption of Ni (II) metal ions increased rapidly at pH 3.00 to 6.00. At lower pH value,
the H+
ions compete with Ni (II) metal cations for the surface of the adsorbent which we
hinder Ni (II) metal ion s from reaching the binding the sites of the adsorbent caused by
repulsive forces. Decrease the percentage adsorption Ni (II) metal ions at higher pH due
to the formation of soluble hydroxide complexes. The Ni metal cations are completely
released under circumstances of extreme acidic conditions.[61].
4.4.6 Adsorption kinetics:- The kinetics of adsorption was carried out to calculate the
adsorption rate constants, the linear plot of 𝑙𝑜𝑔 (𝑞𝑒 − 𝑞𝑡) against 𝑡 and 𝑡 𝑞𝑡⁄ against 𝑡,
were drawn for the first order and the second order models, respectively.
Table: 4.4.1. Kinetic parameter values with Nickel [Ni (II)] metal ion:-
Amount of adsorbent = 0.5 gm. Conc. of adsorbate = 20 ppm.
Volume of adsorbate = 50 ml. pH = 5.889 Temperature = 303.0 ± 0.3 K.
Adsorbents
Pseudo-First order Pseudo-first order
K1
(min-1
)
𝒒𝒆
(mg/gm) 𝑹𝟐 K2
(gm/mg.min)
𝒒𝒆
(mg/gm) 𝑹𝟐
GSH 40.763*10-3
124.721 0.994 1.508*10-3
1541.632 0.999
GGSH 39.842*10-3
124.371 0.998 1.502*10-3
1541.383 0.999
BGSH 53.798*10-3
132.294 0.997 1.371*10-3
1552.981 0.999
PSH 38.759*10-3
180.884 0.992 1.017*10-3
1581.008 0.999
MsSH 28.718*10-3
149.012 0.947 1.499*10-3
1560.420 0.999
The rate constants, the correlation coefficients (R2) and calculated 𝑞𝑒 for all
adsorbents are in table 4.4.1, the values of (R2) with first order were in the range of 0.999
to 0.947. The observed trend shows that with adsorbents for first order kinetics
GGSH>BGSH>GSH>PSH>MsSH, while for second order (R2) value was 0.999 for all
adsorbents. The values of (R2) obtained from pseudo second-order model were higher
than pseudo first-order model, indicating that the adsorption process followed the pseudo
second-order model for entire adsorption period [62, 63].

Final Report of Minor Research Project 2015
Evaluation of Adsorption Capacity of Low Cost adsorbent For the Removal of Hazardous Chemicals Page 60
4.4.7 Adsorption isotherm:- In order ro investigate how Ni (ii) interacts with
adsorbents, the Langmuir and Freundlich isotherm models were applied (Table 4.4.2.).
The Langmuir isotherm has been used by various workers for the adsorption study of a
variety of compounds [64]. The values of the Langmuir constants are calculated from the
intercept and slope of a the plot of 𝐶𝑒 𝑞𝑒⁄ against 𝐶𝑒 and calculate the essential
characteristics of Langmuir isotherm model, which can be explained in terms of
separation factor (RL), which was used to predict whether the adsorption system is
“favorable” of “unfavorable”, if RL value is in the range of 0 < 𝑅𝐿< 1, which indicates
that the adsorption is favorable. Since 𝑅𝐿 values lies between 0 to 1 for Ni (II) metal ion
studies, it seen that the adsorption of Ni (II) metal ion is favorable. The data reveal that
the Langmuir model yields better fit than the Freundlich model.
Table: 4.4.2. Isotherm parameter values with Nickel [Ni (II)] metal ions:-
Conc. of adsorbate = 20 ppm. Volume of adsorbate = 50 ml.
Temperature = 306.5 ±0.3 K. pH = 5.7 Time = 24 hours.
Adsorbents
Langmuir constants Freundlich constants
Q0
(mg/gm.)
b *10-3
(L/gm.)
𝑹𝑳 𝑹𝟐 n Kf
(mg/gm(L/gm))1/n
𝑹𝟐
GSH 851.4914 0.009 0.999 0.999 1.144 17.4080 0.999
GGSH 357.8330 0.020 0.998 0.999 1.210 17.3972 0.998
BGSH 404.7157 0.019 0.998 0.999 1.171 17.8649 0.999
PSH 411.2603 0.020 0.998 0.999 1.150 18.3434 0.999
MsSH 141.1769 0.064 0.993 0.997 1.317 20.0812 0.997
The obtained range of RL values for adsorbents are 0.999 to 0.993.; the observed
trend showed that with adsorbents GSH>GGSH=BGSH=PSH>MsSH. The Freundlich
isotherm model that can be used for non-ideal adsorption process, involves heterogeneous
adsorption surface and active sites with different energies, when plotted as the data are of
𝑙𝑜𝑔𝑥
𝑚 against 𝑙𝑜𝑔 𝐶𝑒, the value of n and 𝐾𝑓 can be obtained from the slope and the
intercept of the linear plot. The value of n is greater than unity, (1< n <10), that means
favorable adsorption [65]. The values of n has calculated and presented in Table:4.4.2.
The values were found to be between 1 and 10, this indicates favorable adsorption. The
result shows that the adsorption of NI (II) metal ion follows Langmuir and Freundlich
isotherm model. The n values were for adsorbents from 1.317 to 1.135; the observed
trend showed that with adsorbents MsSH>GGSH>BGSH>PSH>GSH.
4.4.8 Thermodynamics of adsorption:- Thermodynamic parameters such as Gibb's
free energy change ∆𝐺0, enthalpy change ∆𝐻0 and entropy change ∆𝑆0 were calculated
by using Van’t Hoff’s equation.
Final Report of Minor Research Project 2015
Evaluation of Adsorption Capacity of Low Cost adsorbent For the Removal of Hazardous Chemicals Page 61
Table: 4.4.3. Free energy change (∆𝐺°) of Ni (II) metal ion solution at diffent temp.:-
Conc. of adsorbate = 20 ppm. Volume of adsorbate = 50 ml.
Amount of adsorbent = 0.5 gm. pH = 5.7 Time = 24 hours.
Temp
(K)
Free energy change (∆𝐺°) of Nickel [Ni (II)] metal ion solution at different
adsorbent with different temperature in KJ/mole.
GSH GGSH BGSH PSH MsSH
306.5 -3.855 -2.992 -2.955 -3.569 -3.919
311.5 -3.749 -2.992 -2.964 -3.469 -3.835
316.5 -3.643 -2.992 -2.972 -3.370 -3.752
321.5 -3.537 -2.992 -2.981 -3.270 -3.668
326.5 -3.431 -2.992 -2.989 -3.171 -3.585
It has been reported that ∆𝐺0 up to -20 KJ/mole are consistent with electrostatic
interaction between sorption sites and the metal ion (physical adsorption), while ∆𝐺0
values more negative than -40 KJ/mole involve charge sharing or transfer from the
adsorbent surface to the metal ion to form a co-ordinate bond (chemical adsorption).
The ∆𝐺0 values obtained in this study for the Ni (II) metal ions are < -10 KJ/mole, which
indicate that physical adsorption was the predominant mechanism in the adsorption
process. The negative value of ∆𝐺0 indicates that the adsorption is favorable and
spontaneous at higher temperature [66, 67]. The values of ∆𝐻0 and ∆𝑆0 were determined
from the slopes and intercepts of the plot of 𝑙𝑜𝑔 𝐾𝑐 against 1
𝑇 respectively. The values
of ∆𝐻0 were for adsorbents in the range -25.844 to -3.228 KJ/mole. In this present
study, ∆𝐻0 was found to be less than -40 KJ/mole. This indicates physical adsorption
and adsoebate-substrate bond is long as compared with the length of covalent or ionic
bond. The observed trend shows that BGSH>GSH>PSH>MsSH >GGSH. The negative
value of ∆𝐻0 suggests that the adsorption is exothermic. The values of ∆𝑆0 were for
adsorbents in the range -25.301 to -0.940 J/mole. The observed trend shows that
GSH>PSH>MsSH>BGSH>GGSH. The negative value of ∆𝑆0 suggests that the
decreased disorder and randomness at the solid solution interface with adsorption.
Table: 4.4.4. Thermodynamic parameter values with Nickel metal ion solution:-
Conc. of adsorbate = 20 ppm. Volume of adsorbate = 50 ml.
Amount of adsorbent = 0.5 gm. pH = 5.7 Time = 24 hours.
Thermodynamic parameters
∆𝐻° and ∆𝑆° values of Nickel [Ni (II)] metal ion at
different adsorbent.
GSH GGSH BGSH PSH MsSH
−∆H° KJ/mole 11.008 3.2285 25.844 9.556 9.087
−∆S° J/mole 23.184 0.940 1.213 19.503 16.938

Final Report of Minor Research Project 2015
Evaluation of Adsorption Capacity of Low Cost adsorbent For the Removal of Hazardous Chemicals Page 62
4.4.9 Conclusion:- The experiments for the removal of Ni (II) metal ion from aqueous
solution have been carried out using GSH, GGSH, BGSH, PSH, and MsSH low-cost
adsorbents, it had been examined at different pH values, contact time, adsorbent dose, initial
metal ion concentration, and temperature. The maximum adsorption of Ni (II) metal ion is
obtained at an acidic pH of 6.0 Under our experimental conditions; the results were fitted to
various, kinetic, isotherm and thermodynamic equations to determine the best mechanisms
and correlate the experimental data. The kinetic study of the adsorption of Ni (II) metal ion
showed that the pseudo-second order kinetic model provides better correlation of the
adsorption data than the pseudo-first order kinetic model. The adsorption isotherms were
described by Langmuir and Freundlich; the present work investigate that the adsorption of Ni
(II) metal ion followed both the Langmuir and Freundlich adsorption isotherms. The
percentage adsorption efficiency of Ni (II) metal ion increased with increasing adsorbent
dosage, contact time, initial concentration of Ni (II) metal ion solution while was decreased
with increasing temperature. The Ni (II) metal ion adsorption equilibrium was attained after
24 hours. The thermodynamic parameters such as Gibb's free energy change (∆𝐺0), enthalpy
change (∆𝐻0) and entropy change (∆𝑆0) studies indicates that, the negative values of ∆𝐺0
indicated the spontaneous nature of adsorption, physical adsorption and confirmed affinity of
adsorbents for the Ni (II) metal ion. Negative value of ∆𝐻0 confirmed the exothermic nature
of the adsorption process. The investigation showed that all adsorbents were agricultural
waste, abundant, cheap, readily available and environment-friendly effective adsorbent,
which could be used as potential adsorbent for adsorption of Ni (II) metal ion from aqueous
solution and polluted water.

Final Report of Minor Research Project 2015
Evaluation of Adsorption Capacity of Low Cost adsorbent For the Removal of Hazardous Chemicals Page 63
.
5 10 15 20 25 30 35
72.5
73.0
73.5
74.0
74.5
75.0
75.5
76.0
76.5
77.0
77.5
78.0
Fig:4.4.1. Effect of contact time on adsorption of Ni (II) with adsorbents.
Perc
enta
ge a
dsor
ptio
n.
Time in min.
GSH
GGSH
BGSH
PSH
MsSH
0.2 0.3 0.4 0.5 0.6 0.7 0.8 0.9 1.0 1.1
76
78
80
82
84
86
88
90
92
94
96
Fig:4.4.2. Effect of adsorbent dose on adsorption of Ni (II) with adsorbents.
Perc
enta
ge a
dsor
ptio
n.
Adsorbent dose in gm.
GSH
GGSH
BGSH
PSH
MsSH
4 6 8 10 12 14 16 18 20 22
40
45
50
55
60
65
70
75
80
85
Fig:4.4.3. Effect of initial concentration on
adsorption of Ni (II) with adsorbents.
Perc
enta
ge a
dsor
ptio
n.
Initial concentration in ppm.
GSH
GGSH
BGSH
PSH
MsSH
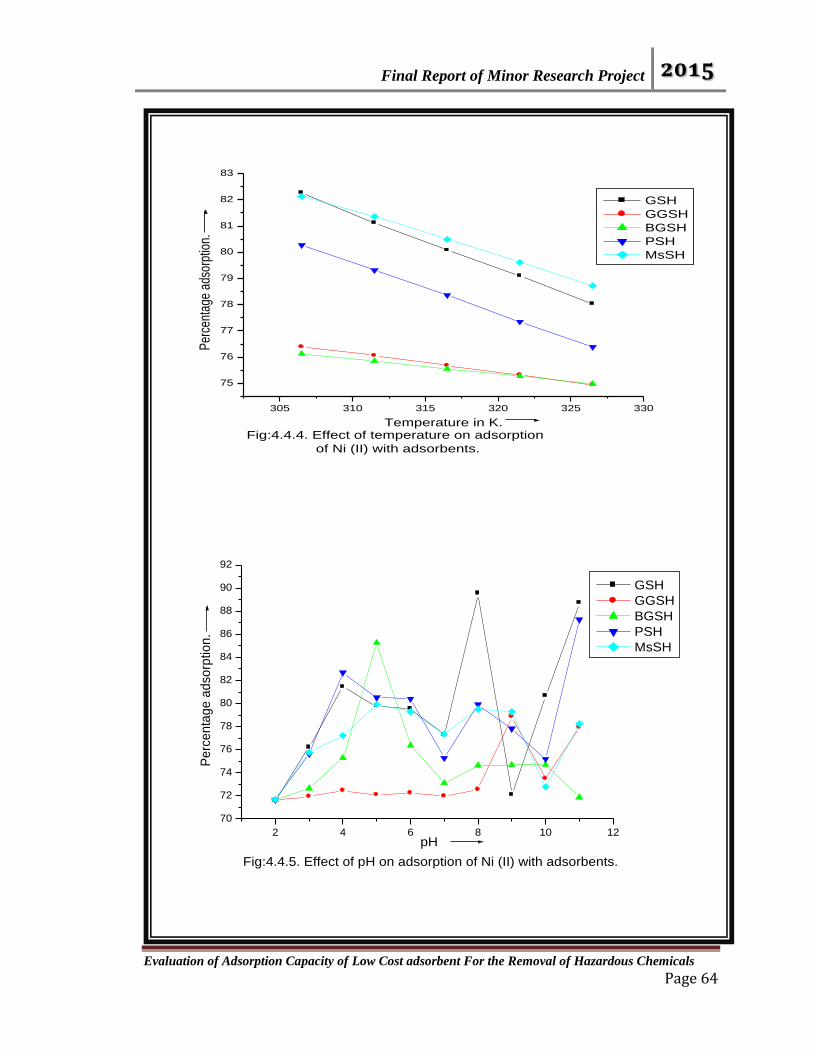
Final Report of Minor Research Project 2015
Evaluation of Adsorption Capacity of Low Cost adsorbent For the Removal of Hazardous Chemicals Page 64
305 310 315 320 325 330
75
76
77
78
79
80
81
82
83
Fig:4.4.4. Effect of temperature on adsorption
of Ni (II) with adsorbents.
Per
cent
age
adso
rptio
n.
Temperature in K.
GSH
GGSH
BGSH
PSH
MsSH
2 4 6 8 10 12
70
72
74
76
78
80
82
84
86
88
90
92
Fig:4.4.5. Effect of pH on adsorption of Ni (II) with adsorbents.
Pe
rce
nta
ge
ad
so
rptio
n.
pH
GSH
GGSH
BGSH
PSH
MsSH

Final Report of Minor Research Project 2015
Evaluation of Adsorption Capacity of Low Cost adsorbent For the Removal of Hazardous Chemicals Page 65
References:-
[1] Angelie I. Jover and Jonathan W. L. Salvacion; Adsorption capability of Gmelina
arborea Bark using Crystal Violet, IInd
Int. Confe. On Environ. and Indust. Innov.
IPCBEE. 35,87-92, (2012).
[2] Ahmad, Rais; Studies on adsorption of crystal violet dye from aqueous solution
onto coniferus pinus bark powder (CPBP), J. of haz. Mat. 171, 767-773, (2009).
[3] Mittal A., Mittal J., Malviya A., Kaur D. and Gupta V. K.; Adsorption of
hazardous dye crystal violet from waste water by waste materials., J. of Colloid
and Interf. Sci., 343, 463-473, (2010).
[4] Somasekhara Reddy M.C.; Removal of direct dye from aqueous solutions with an
adsorbent made from tamarind fruit shell, an agricultural solid waste, J. of Scienti.
and Ind. Resear. 65, 443-446,(2006).
[5] D. Ghosh, C. R. Medhi, H. Solanki and M. K. Purkait; Decolonization of crystal
violet solution by electrocoagulation, J. Env. Prot. Sci. 2, 25-35, (2008).
[6] S. Senthilkumar, P. Kalaamani and C. V. Subburaam; Liquid phase adsorption of
crystal violet onto activated carbons derived from male flowers of coconut tree, J.
Haz. Mat.,136, 800-808, (2006).
[7] Yousef Haik. Shahnaaz Qadri, Ashley Ganose, Sarmadia Ashraf and Reyad
Sawafta;Phase change material for efficient removal of crystal violet dye, J. Haz.
mat.,175, 1110-1112 (2010).
[8] Malarvizhi Ramkrishna and Sulochana Nagarajan; “Utilization of water biomass
for the removal of basic dye from water"; Woeld App. Sci. J. (Special issue for
Env.), 5, 114-120, (2009).
[9] K. V. Kumar; Pseudo second order models for the adsorption of safranin onto
activated carbon: comparison of linear and non-linear regression methods, J. Haz.
Mat., 142, 564-567, (2007).
[10] Shengfang Li: Removal of crystal violet from aqueous solution by sorption into
semi-interpenetrated networks hydrogels constituted of poly (acrylic acid-
acrylamide-methacrylate) and amylase, Bioresource Technol., 101, 2197-
2202.(2010).
[11] Hamdaoni O. Batch study of liquid phase adsorption of methylene blue using
cedar sawdust and crushed brick. J. of Hazard. Materials B135: 264-273, (2006).
[12] P. Monash and G. Pugazhenthi; Adsorption of crystal violet dye from aqueous
solution using mesoporous materials synthesized at room temperature,
Adsorption, 15, 390-405, (2009).
[13] N. Kannan and P. Sarojini. “Studies on the removal of manganese (II) ions by
adsorption on commercial activated carbon”, Ind. Env. Prot. 30, (5), 404-408,
(2010).
Final Report of Minor Research Project 2015
Evaluation of Adsorption Capacity of Low Cost adsorbent For the Removal of Hazardous Chemicals Page 66
[14] H. EI Boujaady, A. EI. Ruilassi, M. Bennani-Ziantni, R. EI Hamri, A Taitai and J.
L. Lacout; Removal of textile dye by adsorption on synthetic calcium phosphates,
Desalination, 275, 10-16, (2011).
[15] E. Eren, B. Afsin, Investigation of basic dye adsorption from aqueous solution
onto raw and pre-treated bentonite surfaces, Dyes Pigments, 76, 220-225, (2008).
[16] S. Mahesh, G. Vijay akumar and Pushpa Agarwal; “Studies on utility of plant
cellulose waste for the bio-adsorption of crystal violet dye”, J. Env. Biolog. 31,
277-280, (2010).
[17] M. Nageswara Rao, Y. Hanumantha Rao, Ch. Chakrapani, Ch. Suresh Babu, B.
V. Rajeswara Reddy, P. Haritha and Kaza Somasekhara Rao, Adsorption studies
of methylene blue by using prepared low cost activated Kaza’s Carbons, J. Chem.
Pharm. Res.,3(5), 363-375, (2011).
[18] Patil S., Renukadas S. and Patel N., Removal of methylene blue, a basic dye from
aqueous solutions by adsorption using teak tree (Tectona grandis) bark powder,
Int. J. of Envi. Sci. 1(5), 711-726 (2011).
[19] Angelie I. Jover and Jonathan W. L. Salvacion; Adsorption capability of Gmelina
arborea Bark using Crystal Violet, IInd
Int. Confe. On Environ. and Indust. Innov.
IPCBEE. 35,87-92, (2012).
[20] Li Wang, Junping Zhang and Aiqin Wang; Fast removal of methylene blue from
aqueous solution by adsorption onto chitosan-g-poly ( acrylic acid)/ attapulgite
composite, Desalination, 266,33-39 (2011).
[21] Pharm Till Hang and G.W. Brindley; methylene blue adsorption by clay minerals,
Determination of surface areas and cation exchange capacities (clay-organic
studies XVIII), Clays and Clay Miner., 18, 203-212 (1970).
[22] Jiyun Song, Weihua Zou, Yangyang Bian, Fengyun Su and Runping Han;
Adsorption characteristics of methylene blue by peanut husk in batch and column
modes, Desalination, 265, 119-125, (2011).
[23] Yamin Yasin, Mohd Zobir Hussein and Faujan Hj Ahmad; Adsorption of
methylene blue onto treated activated carbon, The Malays. J. Anal. Sci., 11 (11),
400-406, (2007).
[24] Alfin Kurniawan, Hogiartha Sutiono, Yi-Hsu, Felycia edy Soetaredjo, Aning
Ayucitra, Aditya Yudha and Suryadi Ismadji; Utilization of rarasaponin natural
surfactant for organo-bentonite preparation: application of methylene blue
removal from aqueous effluent, Microp. Mesop. Mat., 142, 184-193 (2011).
[25] Elif Yilmaz Ozmen and Mustafa Yilmaz; Use of β-cyclydextrin and starch based
polymers for sorption of congo red from aqueous solutions. J. Haz. Mat, 148,
303-310 (2007).
[26] Yuyi Yang, Guan Wang, Bing Wang Zeli Li, Xiaoming Jai, Qifa Zhou and Yuhua
Zhao; Biosorption of acid black 172 and congo red from aqueous solution by

Final Report of Minor Research Project 2015
Evaluation of Adsorption Capacity of Low Cost adsorbent For the Removal of Hazardous Chemicals Page 67
nonviable penicillium YW 01: Kinetic study, equilibrium isotherm and artificial
neural network modeling, Bioresource Technol ., 102, 828-834 (2011).
[27] Emrah Bulut, Mahmut O. zacar and I Ayhan S. engil; Equilibrium and kinetic data
and process design for adsorption of congo red onto bentonite, J. Haz. Mat., 154,
613-622 (2008).
[28] Abbas Afkhami and Razieh Moosavi; Adsorptive removal of congo red, a
carcinogenic textile dye, from aqueous solutions by maghemite nanoparticles, J.
Haz. Mat., 174, 398-403 (2010).
[29] Sandipan Chatterjee, Sudipta Chatterjee, Bishnu P. Chatterjee and Arun K.Guha;
Adsorptive removal of congo red a carcinogenic textile dye by chitosan
hydrobeads; Binding mechanism, equilibrium and kinetics, Coll. Surf. A:
Physicochem. Eng. Aspects, 299, 146-152 (2007).
[30] M. Hema and S. Arivoli; Comparative study on the adsorption kinetics and
thermodynamics of dyes onto acid activated low cost carbon, International J.
Physical Sci., 2(1), 10-17 (2007).
[31] N. Kannan and P. Sarojini.,“Studies on the removal of manganese (II) ions by
adsorption on commercial activated carbon”, Ind. Env. Prot. 30, (5), 404-408,
(2010).
[32] H. EI Boujaady, A. EI. Ruilassi, M. Bennani-Ziantni, R. EI Hamri, A Taitai and J.
L. Lacout; Removal of textile dye by adsorption on synthetic calcium phosphates,
Desalination, 275, 10-16, (2011).
[33] E. Eren, B. Afsin, Investigation of basic dye adsorption from aqueous solution
onto raw and pre-treated bentonite surfaces, Dyes Pigments, 76, 220-225, (2008).
[34] V. Vadivelan, K. V. Kumar; “Equilibrium kinetics, mechanism and process
design for the sorption of methylene blue onto rice husk”, J. Coll. Interface Sci.
286, 90-100, (2005).
[35] Garh V. K., Gupta R., Kumar R., Gupta R., K., Adsorption of chromium from
aqueous solution on treated sawdust, Bioresource Technol., 92 (1), 79-81, (2004).
[36] K. Yang, L. Zhu, B. Xing, “Sorption of sodium dodecylbenzene sulfonate by
montmorillonite”, Environ. Pollut. 145, 571-576 (2007).
[37] K. Mohanty, M. Jha, B. C. Meikap, and M. N. Biswas,“Biosorption of Cr (VI)
from aqueous solution by Eichhornia crassipes”, Chem. Eng. J.,117, 71-77,
(2006).
[38] G. Mahajan and D. Sud, “Modified agricultural waste biomass with enhanced
responsivw properties for metal ion remediation: a green approach”, Applied
water science, 2, 299-308, (2012).
[39] G. Mahajan and D. Sud, “Kinetics and equilibrium studies of Cr (VI) metal ion
remediation by arachis hypogeal shells: a green approach”, Bioresources, 6, 3324-
3338, (2011).
Final Report of Minor Research Project 2015
Evaluation of Adsorption Capacity of Low Cost adsorbent For the Removal of Hazardous Chemicals Page 68
[40] Dinesh Mohan, Shalini Rajput, Vinod K. Singh, Philip H. Steele, Charles U.
Pittman Jr, Modeling and evaluation of chromium remediation from water using
low-cost bio-char, a green adsorbent, J. Haz. Mat.,188, 319-333, (2011).
[41] C. Namasivayam, and D. Kavitha; Removal of congo red dye from water by
adsorption onto activated carbon prepared from coir pith, an agricultural solid
waste, Dyes and Pigments, 54, 47-58, (2002).
[42] Chiou M. S. and Li H. Y., “Equilibrium and kinetic modeling of adsorption of
reactive dyes on cross-linked chitosan beads”, J. Hazard.Mat., 93 (2), 233-248
(2002).
[43] Wu F. C., Tseng R. L., and Juang R. S., “Kinetics of color removal by adsorption
from water using activated clay”, Environ. Technol.,22, 721-729 (2001).
[44] Hossain M. A., Kumita M., Michigami Y., and Mori S., “Kinetics of Cr (VI)
adsorption used black tea leaves”, J., Chem. Eng. Japan, 38(6), 402-406, (2005).
[45] Bulut Y., baysal Z., Removal of Pb (II) from wastewater using wheat bran, J.
Env.Mng.,78(2), 107-113, (2006).
[46] Xin-jiang Hu, Jing-song Wang, Yun-guo Liu, Xin Li, Guang-ming Zeng, Zheng-
lei Bao, Xiao-xia Zeng, An-wei Chen and Fie Long; Adsorption of chromium
(VI) by ethylenediamine-modified cross-linked magnetic chitosan resin:
Isotherms, kinetics and thermodynamics, J. Haz. Mat., 185, 306-314 (2011).
[47] K. Selveraj, V Chandramohan and S Pattabhi; Removal of Cr (VI) from aqueous
solution and chromium plating industry wastewater using photo film waste
sludge, Ind. J. Env. Protec.,18 (9), 641-646, (1998).
[48] V. Marjanovic, S. Lazarevic, I. Jankovic-Castvan, B. Potkonjakc, D. Jankovic and
R. Petrovic; Chromium (VI) removal from aqueous solutions using
mercaptosilane functionalized sepiolites, Chem. Eng. J., 166, 198-206, (2011).
[49] Esayas Alemayehu, Soren Thiele-Bruhn and Bernd Lennartz; Adsorption
behavior of Cr (VI) onto macro and micro-vesicular volcanic rocks from water,
Separation and Purification Technol., 78, 55-61, (2011).
[50] N. Renugadevi, G. Anitha and P. Lalitha, Hexavalent chromium removal using a
low-cost activated adsorbent from areca catechu, Ind. J. Envi. Protech., 31 (1),
52-58, (2011).
[51] Levent Altas, Ahmet Kilic, Hasan Koc, Yigit and Mustafa Isik, Adsorption
behavior of Cr (VI) on ureolytic mixed culture from biocatalytic classification
reactor, Coll. and Surf. B: Biointerfaces, 86, 404-408, (2011).
[52] M. N. Tandel and B. N. Oza, Adsorption and regeneration studies for the removal
of Chromium (VI) from the wastewater of electroplating industry using granular
activated carbon, Asian J. Chem., 17 (4), 2524-2530, (2005).
Final Report of Minor Research Project 2015
Evaluation of Adsorption Capacity of Low Cost adsorbent For the Removal of Hazardous Chemicals Page 69
[53] Lili Xiao, Wei Ma, Mei Han and Zihong Cheng, The influence of ferric iron in
calcined nano-Mg/Al hydrotalcite on adsorption on Chromium (VI) from aqueous
solution, J. Haz. Mat., 186,690-698, (2011)..
[54] C. Raji and T. S. Anirudhan, “Chromium (VI) adsorption by sawdust carbon:
kinetics and equilibrium”, Ind. J. Chem. Technol., 4, 228-236, (1997).
[55] C. Ramesh Babu, P. Raghunandan and K. N. Jayaveera, Removal of toxic
chromium (VI) by the adsorption of activated carbons prepared from mahua
shells, Asian J. Chem., 16(2), 617-622 (2004).
[56] M. Vasanthy, M. Sangeetha ans C. Kavitha, Positive utilization of mixture of
sorghum vulgare spike carbon, flyash and CAC for the removal of chromium
from synthetic effluents, Ind. J. Envi. Protech., 24(7), 513-516 (2004).
[57] Y. C. Sharma, S. N. Kaul, C. H. Weng, Adsorption separation of Cadmium from
aqueous solutions and wastewaters by riverbed sand, Eng. Poll, 150, 251-257,
(2007).
[58] T. Vimala, S. Agnes Pramila Mary, V., “Thamizharasan and S. Arivoli; Kinetic
equilibrium and Mechanistic study for adsorption of ferrous ion”, Ind. J. Env.
Prot., 27 (12), 1090-1097, (2007).
[59] N. Kannan, and T. Veemaraj, Detoxification of toxic metal ions by sorption onto
activated carbon from Hevea Brasilensis bark- A comparative study, Global
NEST Journal, 12 (2), 197-205 (2010).
[60] B. thirunavukkarasu and K. Palanivelu, Biosorption of Cr (VI) from plating
effluent using marine algal mass, Ind. J. of biotechnol. 6, 359-364 (2007).
[61] M. Ajmal, R. A. K. Rao, R. Ahmad, J. Ahmad, Adsorption studies on Citrus
reticulate (fruit peel of orange): removal and recovery of Ni (II) from
electroplating wastewater, J. Haz. Mat., B79, 117-131 (2000).
[62] Jiyun Song, Weihua Zou, Yangyang Bian, Fengyun Su and Runping Han;
Adsorption characteristics of methylene blue by peanut husk in batch and column
modes, Desalination, 265, 119-125, (2011).
[63] Yamin Yasin, Mohd Zobir Hussein and Faujan Hj Ahmad; “Adsorption of
Methylene blue onto treated activated carbon”, The Malays. J. Anal. Sci., 11 (11),
400-406, (2007).
[64] Amal Raj, “Adsorption behavior of nickel on activated carbon”, Ind. J. Env. Prot.,
24 (7), 530-533 (2004).
[65] N. Lakshimi and Srinivasn, Lead removal in aqueous medium by agricultural
waste-coton seed (ciba pentandra), Ind. J. Inv. Protec, 24 (5), 379-384 (2004).
[66] Y. C. Sharma, S. N. Kaul, C. H. Weng, Adsorption separation of Cadmium from
aqueous solutions and wastewaters by riverbed sand, Eng. Poll, 150, 251-257,
(2007).

Final Report of Minor Research Project 2015
Evaluation of Adsorption Capacity of Low Cost adsorbent For the Removal of Hazardous Chemicals Page 70
[67] T. Vimala, S. Agnes Pramila Mary, V. Thamizharasan, and S. Arivoli, Kinetic
equilibrium and Mechanistic study for adsorption of ferrous ion, Ind. J. Env.
Prot., 27 (12), 1090-1097, (2007).
*********
Final Report of Minor Research Project 2015
Evaluation of Adsorption Capacity of Low Cost adsorbent For the Removal of Hazardous Chemicals Page 71

Final Report of Minor Research Project 2015
Evaluation of Adsorption Capacity of Low Cost adsorbent For the Removal of Hazardous Chemicals Page 72

Final Report of Minor Research Project 2015
Evaluation of Adsorption Capacity of Low Cost adsorbent For the Removal of Hazardous Chemicals Page 73
Final Report of Minor Research Project 2015
Evaluation of Adsorption Capacity of Low Cost adsorbent For the Removal of Hazardous Chemicals Page 74
Final Report of Minor Research Project 2015
Evaluation of Adsorption Capacity of Low Cost adsorbent For the Removal of Hazardous Chemicals Page 75