Embed Size (px)
Citation preview
Submitted by:
Honolulu, HI June 2017
Submitted to:
Naval Facilities Engineering Command Pacific under
HDR Environmental, Operations and Construction, Inc.
Contract No. N62470-10-D-3011, TO KB28
Prepared for:
Commander, U.S. Pacific Fleet
Prepared by:
Robin W. Baird1, Stephen W. Martin2, Roanne Manzano-
Roth3, Daniel L. Webster1, and Brandon L. Southall4
1Cascadia Research Collective, 218 ½ W. 4th Avenue,
Olympia, WA 98501
2National Marine Mammal Foundation, 2240 Shelter
Island Drive, San Diego, CA 92152
3SPAWAR Systems Center Pacific, San Diego, CA
4Southall Environmental Associates, Inc.,
9099 Soquel Drive, Suite 8, Aptos, CA 95003
Assessing Exposure and
Response of Three Species of
Odontocetes to Mid-Frequency
Active Sonar During Submarine
Commanders Courses at the
Pacific Missile Range Facility:
August 2013 Through
February 2015
Final Report
Suggested Citation:
Baird, R.W., S.W. Martin, R. Manzano-Roth, D.L. Webster, and B.L. Southall. 2017. Assessing
Exposure and Response of Three Species of Odontocetes to Mid-Frequency Active Sonar
During Submarine Commanders Courses at the Pacific Missile Range Facility: August 2013
Through February 2015. Prepared for U.S. Pacific Fleet, submitted to NAVFAC PAC by HDR
Environmental, Operations and Construction, Inc., Honolulu, Hawai‘i.
Cover Photo Credits:
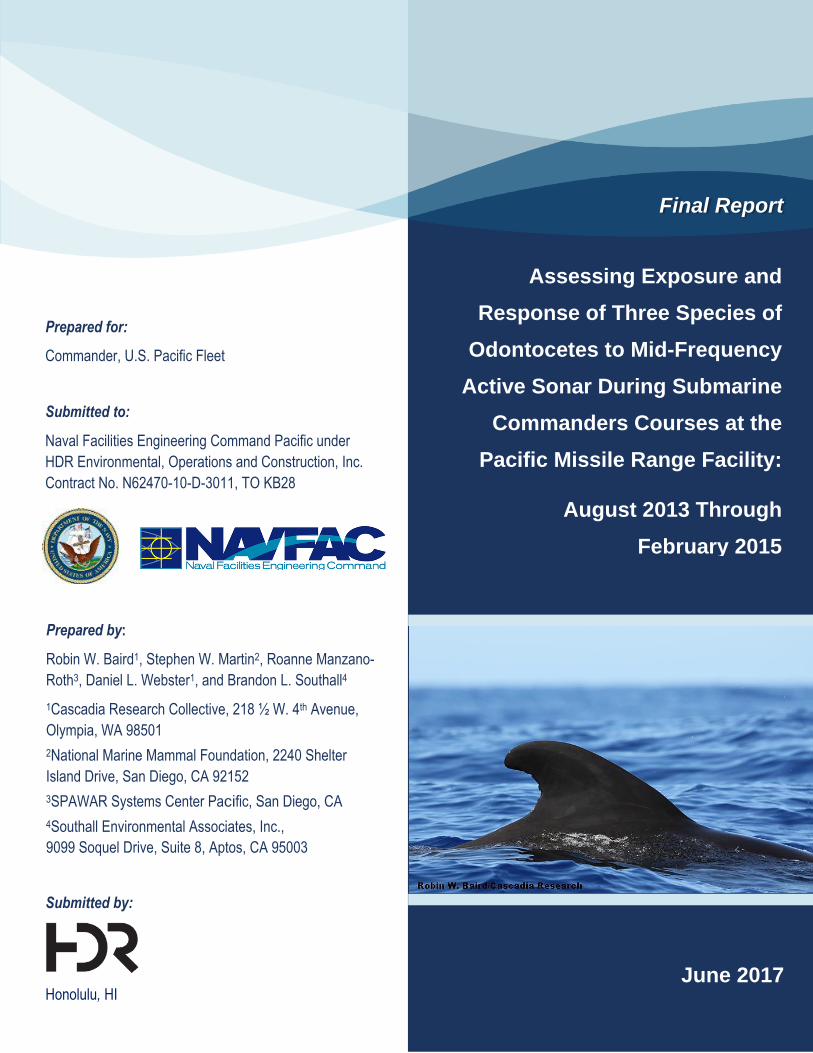
Short-finned pilot whale (Globicephala macrorhynchus) photographed north of Kaua‘i.
Photograph taken by Robin W. Baird under National Marine Fisheries Service permit no. 15330
issued to Robin W. Baird.
NAVFAC Pacific | Final Report | Assessing Exposure and Response of Three Species of Odontocetes to Mid-Frequency Active Sonar During Submarine Commanders Courses at the Pacific Missile Range Facility: August 2013 Through February 2015
June 2017 | i
Table of Contents
Acronyms and Abbreviations ................................................................................................... iii
Section 1 Abstract ...................................................................................................................... 5
Section 2 Introduction ................................................................................................................ 6
Section 3 Methods ...................................................................................................................... 8
SATELLITE TAG DATA .................................................................................................................. 8
ACOUSTIC AND SHIP TRACK DATA ............................................................................................... 9
Section 4 Results ...................................................................................................................... 11
Section 5 Discussion ................................................................................................................ 28
Section 6 Acknowledgements ................................................................................................. 30
Section 7 Literature Cited ........................................................................................................ 30
Figures
Figure 1. Distribution of RL estimates for SbTag010 for a LC1 location at 50-m depth. ............. 15
Figure 2. Distribution of RL estimates for GmTag081 for a LC2 location at 10-m depth. ........... 15
Figure 3. Filtered locations and interpolated track of false killer whale PcTag037 from 11 to
15 August 2013 prior to, during and shortly after the end of a Submarine
Commanders Course. ........................................................................................................ 17
Figure 4. Filtered locations and interpolated track of rough-toothed dolphin SbTag014 from
17 to 19 February 2015 prior to, during and shortly after the end of a Submarine
Commanders Course. ........................................................................................................ 18
Figure 5. Filtered locations and interpolated track of rough-toothed dolphin SbTag010 from
12 to 14 August 2013 prior to and during a Submarine Commanders Course. ................. 19
Figure 6. Filtered locations and interpolated track of rough-toothed dolphin SbTag015 from
16 to 20 February 2015 prior to, during and shortly after the end of a Submarine
Commanders Course. ........................................................................................................ 20
Figure 7. Filtered locations and interpolated track of short-finned pilot whale GmTag080
from 17 to 22 February 2014 prior to, during and shortly after the end of a Submarine
Commanders Course. ........................................................................................................ 22
Figure 8. Filtered locations and interpolated track of short-finned pilot whale GmTag081
from 17 to 21 February 2014 prior to, during and shortly after the end of a Submarine
Commanders Course. ........................................................................................................ 23
Figure 9. Filtered locations and interpolated track of short-finned pilot whale GmTag082
from 17 to 22 February 2014 prior to, during and shortly after the end of a Submarine
Commanders Course. ........................................................................................................ 24
Figure 10. Filtered locations and interpolated track of short-finned pilot whale GmTag083
from 17 to 22 February 2014 prior to, during and shortly after the end of a Submarine
Commanders Course. ........................................................................................................ 25
NAVFAC Pacific | Final Report | Assessing Exposure and Response of Three Species of Odontocetes to Mid-Frequency Active Sonar During Submarine Commanders Courses at the Pacific Missile Range Facility: August 2013 Through February 2015
June 2017 | ii
Figure 11. Filtered locations and interpolated track of short-finned pilot whale GmTag115
from 17 to 18 February 2014 prior to and during the beginning of a Submarine
Commanders Course. ........................................................................................................ 26
Figure 12. Box plot of day-time dive depths from short-finned pilot whale GmTag081 prior
to, during, and after the Submarine Commanders Course. ............................................... 28
Tables
Table 1. Characteristics of MFAS use during Submarine Commanders Courses ...................... 12
Table 2. Summary of MFAS exposure modeling for satellite-tagged individuals. ....................... 13
Table 3. Difference between RL estimates near the surface (10 m +/- 5 m) and at typical
deep dive depths used for each species. Values shown are grand means (and SD of
the means). Typical deep dive depths used were 50 m (+/- 5 m) for false killer whales
and rough-toothed dolphins, and 500 m (+/- 5 m) for short-finned pilot whales. ................ 13
Table 4. Comparison of RL estimates by Argos location class (LC) for rough-toothed
dolphin SbTag010. ............................................................................................................. 14
Table 5. Comparison of diving parameters pre-SCC, during the SCC, and post-SCC, for
short-finned pilot whale GmTag081. .................................................................................. 27
Table 6. Comparison of location data from short-finned pilot whale GmTag081 pre-SCC,
during-SCC, and post-SCC. ............................................................................................... 27
NAVFAC Pacific | Final Report | Assessing Exposure and Response of Three Species of Odontocetes to Mid-Frequency Active Sonar During Submarine Commanders Courses at the Pacific Missile Range Facility: August 2013 Through February 2015
June 2017 | iii
Acronyms and Abbreviations
BARSTUR Barking Sands Tactical Underwater Range
BSURE Barking Sands Underwater Range Expansion
CPA closest point of approach
CRC Cascadia Research Collective
dB decibel(s)
est. estimate
Exp. exposure
hr hour(s)
km kilometer(s)
LC location class
LIMPET Low-Impact Minimally Percutaneous External Electronics Tag
m meter(s)
MFAS mid-frequency active sonar
PAM passive acoustic monitoring
PMRF Pacific Missile Range Facility
RL received level(s)
RMS root mean square
SCC Submarine Commanders Course
SD standard deviation
SL source level(s)
SPL sound pressure level
SPOT Smart Position or Temperature Transmitting Tag
TL transmission loss
μPa micropascal

NAVFAC Pacific | Final Report | Assessing Exposure and Response of Three Species of Odontocetes to Mid-Frequency Active Sonar During Submarine Commanders Courses at the Pacific Missile Range Facility: August 2013 Through February 2015
June 2017 | iv
This page intentionally left blank.
NAVFAC Pacific | Final Report | Assessing Exposure and Response of Three Species of Odontocetes to Mid-Frequency Active Sonar During Submarine Commanders Courses at the Pacific Missile Range Facility: August 2013 Through February 2015
June 2017 | 5
Section 1 Abstract
The United States Navy’s marine species monitoring program addresses four general topics
surrounding the impact of mid-frequency active sonar (MFAS) on protected species:
occurrence, exposure, response, and consequences. Occurrence of odontocete cetaceans on
and around the Pacific Missile Range Facility (PMRF) has been studied for several years using
a combination of satellite tags and photo-identification, demonstrating the existence of resident
populations of several species of odontocetes and resulting in considerable information on
diving behavior and movement patterns of these species. In an effort to measure and evaluate
both exposures and responses to MFAS during actual military training exercises, we used data
from 20 satellite tags deployed on odontocetes prior to three Submarine Commanders Courses
(SCC) held on PMRF between August 2013 and February 2015.
MFAS use during each SCC occurred under normal operating conditions north of the Kaulakahi
Channel and spanned a three-day period. Sonar transmissions were not controlled according to
the location of tagged individuals, but this orientation provided a spatial-temporal opportunity for
individuals to avoid MFAS exposure by moving to the opposite sides of either Kaua‘i or Ni‘ihau.
Eleven of the 20 tags had either stopped transmitting prior to the start of the SCC or the tagged
individuals were far from MFAS and thus exposure levels could not be estimated. For the other
nine individuals, we combined locations obtained from satellite tags with Navy-provided data on
MFAS use and ship tracks to assess MFAS exposure and potential responses. Subjects
included: false killer whales, Pseudorca crassidens (n=1), short-finned pilot whales,
Globicephala macrorhynchus (n=5), and rough-toothed dolphins, Steno bredanensis (n=3).
Individuals from all three species were known to be part of island-resident populations, with
false killer whales from the Northwestern Hawaiian Islands population, and pilot whales and
rough-toothed dolphins from populations that generally range from Ni‘ihau to O‘ahu, but whose
core areas encompass the Kaulakahi Channel and southern portions of PMRF.
Methods used were similar to earlier analyses but with several improvements. Received levels
(RLs) were estimated using the Peregrine propagation model for each satellite tag location
within 1 hour of an MFAS transmission, allowing for calculations of thousands of RL estimates
relatively quickly. We explicitly accounted for known uncertainty associated with Argos location
classes (LCs) by calculating 1,000 RL estimates along a radial through the tagged animal
location, with the radial length reflecting the LC uncertainty. Both median and mean (with
standard deviations [SDs]) RL levels of the 1,000 estimates were used to address variability
associated with LCs. Consistency between mean and median RLs and small SDs suggest that
resulting estimates are relatively robust. Estimated RLs were determined at tagged animal
locations for both 10-meter depths (m) (+/- 5 m) and at depths representing typical dive depths
for each of the three species (false killer whale – 50 m; rough-toothed dolphin – 50 m; short-
finned pilot whale – 500 m). Estimated RLs at depth representing typical dives were generally
lower than at 10-m depth for all species.
The false killer whale was estimated to have been intermittently exposed to MFAS at distances
ranging from 6.5 to 75.4 kilometers (km) over a 1.6-day span. During the period of MFAS
exposure the false killer whale transited away from an area of relatively low exposure (starting
at an estimated RL of mean = 90.9 [7.68]; median = 89.4 decibels referenced to 1 microPascal
NAVFAC Pacific | Final Report | Assessing Exposure and Response of Three Species of Odontocetes to Mid-Frequency Active Sonar During Submarine Commanders Courses at the Pacific Missile Range Facility: August 2013 Through February 2015
June 2017 | 6
root mean square (dB re: 1 μPa RMS; hereafter dB)) to the area of highest RL (mean (SD) =
160.2 (9.55); median = 156.6 dB). The individual then moved away from the area where MFAS
was being used for several hours, then moved back through the area of exposure (to an
estimated maximum mean RL = 150.8 [7.05]; median = 157.6 dB), and then to an area of lower
RLs. The three rough-toothed dolphins were exposed to MFAS at ranges of 19.5 to 94.4 km,
with maximum estimated mean (SD) RLs at 10 meters of 150.6 (0.96), 155.3 (3.5), and 157.1
(1.5) dB. The individual with highest estimated RLs (SbTag014) moved from an area farther
from the MFAS source into an area with the maximum estimated RL before moving into an area
with lower RLs (<140 dB). The five short-finned pilot whales represented three different groups.
One of the three groups, which included three different tagged individuals, was exposed to
MFAS at ranges of 3.2 to 48.1 km, while the others were exposed at distances of 14.9 to 39.5
km and 48.0 to 57.3 km. Two individuals (GmTag081 and GmTag083) exposed at relatively
short distances had relatively high estimated RLs at 10 m (GmTag081 mean = 169 [1.41],
median = 168.9 dB; GmTag083 mean = 168.3 [1.50], median = 167.9 dB). No large-scale
movements of the individuals away from areas of relatively high RLs, for example to areas in the
lee of Kaua‘i or Ni‘ihau, were observed. An almost complete dive record spanning the period
from before to after the SCC (22, days with 1,363 dives) was obtained for only one individual,
the short-finned pilot whale (GmTag081) with the highest estimated RLs.
Clear changes in diving behavior were documented during the SCC in comparison to pre- and
post-SCC periods for the short-finned pilot whale GmTag081. Dive rates during the SCC were
lower both during the day and night in comparison to the pre- and post-SCC periods. Day-time
dive depths were significantly deeper during the SCC, while night-time dive depths were similar
for all three periods. These exposure case studies indicated no large-scale avoidance of areas
with moderately high (>150 dB) MFAS RLs where responses might be expected to be likely by
nine individuals of three species spanning two years. However, clear behavioral changes during
the SCC were observed for one individual for which detailed dive data were available. All
individuals were from populations that are generally resident to the area. Given that MFAS has
been used in Hawai‘i for many years, these individuals have likely been exposed to MFAS on
multiple previous occasions.
Section 2 Introduction
The United States (U.S.) Navy’s marine species monitoring program addresses four general
topics surrounding the question of potential adverse impacts of Navy activities, in particular the
use of mid-frequency active sonar (MFAS) on protected species. These four topics are:
occurrence – which species are in the areas where MFAS is used; exposure – what are the
MFAS conditions to which animals are exposed; response – what are the reactions to MFAS
exposure; and consequences – does exposure have individual or population-level
consequences?
Off Kaua‘i, Cascadia Research Collective (CRC) has conducted extensive studies of odontocete
cetaceans as part of the marine species monitoring program and with additional support by
other (Navy and non-Navy) sources. This work has used a combination of small-vessel surveys,
photo-identification of individuals to assess sighting histories, biopsy sampling to examine
population structure (e.g., Albertson et al. 2016; Courbis et al. 2015), and satellite tagging to
NAVFAC Pacific | Final Report | Assessing Exposure and Response of Three Species of Odontocetes to Mid-Frequency Active Sonar During Submarine Commanders Courses at the Pacific Missile Range Facility: August 2013 Through February 2015
June 2017 | 7
determine movements and diving behavior. Many of these efforts to date have primarily
addressed occurrence (see Baird 2016; Baird et al. 2016, 2017a, 2017b) and have identified
resident, island-associated populations of three species of odontocetes around Kaua‘i and
Ni‘ihau: rough-toothed dolphins (Steno bredanensis), common bottlenose dolphins (Tursiops
truncatus), and short-finned pilot whales (Globicephala macrorhynchus). Kernel density
analyses of locations from satellite tags have shown that core areas of these three populations
all partially overlap with the Pacific Missile Range Facility (PMRF) (Baird et al. 2017a). For
short-finned pilot whales, there is also evidence of an overlapping population of pelagic or open-
ocean individuals having a much larger range (Baird et al. 2017a). A fourth resident island-
associated species, spinner dolphins (Stenella longirostris), had been previously documented
based on genetics (Andrews et al. 2010). The islands are also an area of overlap between two
island-associated populations of false killer whales (Pseudorca crassidens), the endangered
Main Hawaiian Islands insular population that ranges from Ni‘ihau to Hawai‘i Island, and a
Northwestern Hawaiian Islands population that ranges from western O‘ahu at least as far west
as Gardner Pinnacles (Baird 2016). Evidence from encounter rates from surveys, photo-
identification, satellite tagging, and/or genetics also suggests that numerous additional species
do not have resident, island-associated populations off Kaua‘i and Ni‘ihau (Baird 2016; Baird et
al. 2017b). These include pantropical spotted dolphins (Stenella attenuata), Cuvier’s (Ziphius
cavirostris) and Blainville’s (Mesoplodon densirostris) beaked whales, dwarf sperm whales
(Kogia sima), sperm whales (Physeter macrocephalus), melon-headed whales (Peponocephala
electra), and pygmy killer whales (Feresa attenuata).
Passive acoustic monitoring (PAM) on the instrumented hydrophone range allows for location of
MFAS on and around PMRF, as well as detection and localization of some vocalizing marine
mammals species (e.g., Helble et al. 2013, 2016; Martin et al. 2015). The combination of data
on MFAS use, vessel tracks, and vocalizing marine mammals has allowed for opportunistic
studies of both exposure and responses to ongoing Navy training activity for several species
(Martin et al. 2015; Manzano-Roth et al. 2016). These PAM methods have also been used to
investigate baseline behavior of Blainville’s beaked whales over a three-year period (2011–
2013) and to study species-typical MFAS response relative to longer-term behaviors
(Henderson et al. 2016). The PAM data are particularly valuable given the low sighting rates of
Blainville’s beaked whales in the area (Baird et al. 2017b).
Some of CRC’s tagging efforts off Kaua‘i have been strategically conducted immediately prior to
Submarine Commanders Courses (SCCs) led by the U.S. Navy, which involve the use of
MFAS. This has allowed for analyses using satellite tagging data, MFAS use data, and ship
track information to examine both exposure and response as well (Baird et al. 2014a). These
initial analyses used data from one common bottlenose dolphin, one short-finned pilot whale,
and two rough-toothed dolphins tagged between February 2011 and February 2013 (Baird et al.
2014a). The purpose of the current assessment is to utilize additional satellite tag and MFAS
data obtained between July 2013 and February 2015 to increase the sample size both of
individuals and species examined to further evaluate exposure and response questions.
Furthermore, we have developed and adapted more sophisticated and automated methods to
estimate MFAS received levels (RLs) in a manner that more robustly integrates positional error
from tag location quality.
NAVFAC Pacific | Final Report | Assessing Exposure and Response of Three Species of Odontocetes to Mid-Frequency Active Sonar During Submarine Commanders Courses at the Pacific Missile Range Facility: August 2013 Through February 2015
June 2017 | 8
Section 3 Methods
Satellite Tag Data
Vessel-based field efforts were undertaken between July 2013 and February 2015 on three
occasions that immediately preceded SCCs. Details on field methods are available in Baird et
al. (2016). Tags used were either location-only (Smart Position or Temperature Transmitting tag
[SPOT]5, Wildlife Computers, Redmond, WA) or location-dive (Wildlife Computers Mk10A) tags
in the Low-Impact Minimally Percutaneous External electronics Tag (LIMPET) configuration,
attached with two titanium darts with backward-facing petals. Tags were programmed to
transmit from 10 to 18 hours (hr) per day depending on species and tag type, with Mk10A tags
transmitting for longer periods to maximize the likelihood of obtaining dive data. Location-dive
tags transmitted dive statistics (start and end time, maximum depth, duration) for any dives
greater than 30 meters (m) in depth, with depth readings of 3 m being used to determine the
start and end of dives. In addition, they transmitted the duration of “surface” periods (i.e., any
period for which the animal remained shallower than 30 m in depth). Prior to each field effort,
satellite-pass predictions were carried out using available Argos schedules to determine optimal
periods for transmission, given satellite overpasses for the approximately 60-day period
following the start of tag deployments.
Tags were remotely deployed with a DAN-INJECT JM Special 25 pneumatic projector (DAN-
INJECT ApS, Børkop, Denmark) from a 24-foot rigid-hulled inflatable boat. During each
encounter tagged and companion individuals were photographed for individual identification.
Photographs were compared to individual photo-identification catalogs (Baird et al. 2008a,
2008b; Mahaffy et al. 2015) to assess re-sighting histories and association patterns. Association
patterns and re-sighting histories were used to determine population identity, in combination
with previous genetic analysis of biopsy samples and movements of satellite tagged individuals
from the same social network (Baird et al. 2013; Martien et al. 2014; Van Cise et al. 2015;
Albertson et al. 2016).
Locations of tagged individuals were estimated using the Argos Data Collection and Location
System with a least-squares method and assessed for plausibility using the Douglas Argos-
Filter version 8.5 (Douglas et al. 2012) to remove unrealistic locations; this approach follows
protocols applied previously (Schorr et al. 2009; Baird et al. 2016). This filter includes four user-
defined variables:
1. Maximum redundant distance—consecutive points separated by less than a defined
distance are kept by the filter because Argos location errors rarely occur in the same
place, thus nearby temporally consecutive points are assumed to be self-confirming;
2. Standardized location classes (LCs, defined below) that are automatically retained;
3. Maximum sustainable rate of movement between consecutive locations that the animal
is expected not to exceed; and
4. Rate coefficient for assessing the angle created by three consecutive points; the rate
coefficient algorithm accounts for the fact that the farther an animal moves between
NAVFAC Pacific | Final Report | Assessing Exposure and Response of Three Species of Odontocetes to Mid-Frequency Active Sonar During Submarine Commanders Courses at the Pacific Missile Range Facility: August 2013 Through February 2015
June 2017 | 9
locations, the less likely it is to return to or near to the original location without any
intervening positions, creating an acute angle characteristic of a typical Argos error.
We automatically retained locations separated from the next location by less than a maximum
redundant distance of 3 kilometers (km), as well as LC2 and LC3 locations (i.e., estimated error
of approximately 1 km and approximately 500 m, respectively; Costa et al. 2010). LC1 locations
(i.e., with estimated error of approximately 1,200 m), as well as LC0, LCA, LCB, and LCZ
locations, were only retained if they passed the Douglas Argos-Filter process. For maximum
sustainable rate of movement, we used 20 km hr−1 for false killer whales and rough-toothed
dolphins, and 15 km hr-1 for short-finned pilot whales, based on maximum travel speeds noted
during observations of fast-traveling individuals in Hawai‘i (R.W. Baird, pers. obs.). We used the
default rate coefficient for marine mammals (Ratecoef = 25). Location data that passed the
Douglas Argos-Filter were processed with ArcGIS to determine depth and distance from shore
using 50-m resolution multibeam bathymetry data from
http://www.soest.hawaii.edu/HMRG/multibeam/bathymetry.php.
In cases where more than one individual of the same species had temporally overlapping tag
data, we assessed whether individuals were acting in concert during periods of overlap using a
combination of association data from photo-identification and satellite-tag data. We measured
straight-line distances between pairs of individuals when locations were obtained during the
same satellite overpass. Individuals that had a mean distance between them of 5 km or less
were considered associated. Association values from photo-identification data were used to
confirm individuals were from the same social group (see Mahaffy et al. 2015).
For the single individual pilot whale tagged with a location-dive tag for which a nearly complete
record of dive behavior was obtained before, during, and after the SCC, we calculated summary
statistics for both day and night, given known diel patterns in pilot whale diving behavior (Baird
2016). The percentage of time in surface bouts during the day and night was calculated by
summing the amount of time in each “surface” period (i.e., periods where the individual did not
dive >30 m) from the behavior logs obtained. Surface periods longer than 1 hr that spanned
sunrise or sunset were divided into appropriate day- and night-time categories based on the
amount of time pre- or post-sunrise or sunset. Statistical tests comparing diving depths and
durations pre-, during- and post-SCC were undertaken in Minitab 16.2.4 (Minitab, Inc., State
College, PA) using Kruskall-Wallis one-way ANOVAs given the non-normal distribution of the
data.
Acoustic and Ship Track Data
The methods for estimating MFAS RLs for satellite-tagged individuals near PMRF between
February 2011 and February 2013 were previously described (Baird et al. 2014a). The methods
utilized here were similar but with improvements in several areas, including more systematic
accounting for positional uncertainty in the animal location and the utilization of a different
propagation model that allowed batch-mode processing, outlined in detail below. Together these
two factors allow a statistical representation of the estimated MFAS exposure levels for satellite-
tagged individuals, which provided insight into the variability of each estimated RL.
NAVFAC Pacific | Final Report | Assessing Exposure and Response of Three Species of Odontocetes to Mid-Frequency Active Sonar During Submarine Commanders Courses at the Pacific Missile Range Facility: August 2013 Through February 2015
June 2017 | 10
The basic method for estimating RL for tagged individuals requires: 1) the locations of ships
capable of transmitting MFAS (provided as standard data products from PMRF); 2) times and
locations of sonar transmissions (obtained from PAM monitoring of PMRF range hydrophones);
and 3) time and estimated location for each tagged animal (using locations that passed the
Douglas Argos-Filter process). Only animal locations where the time difference between the
sonar transmission and animal tag update was less than 60 minutes were used for estimating
RLs. Modeled sound pressure levels (SPL) in decibels (dB) referenced to 1 microPascal (μPa)
root mean square (RMS), hereafter dB, were calculated as estimated RLs at two different
depths, at the frequencies of the MFAS being used (see below). All species had estimated RLs
near the surface (10 m +/- 5 m), as well as species-specific typical dive depths (also +/- 5 m),
based on data collected for these species in Hawaiian waters (see Baird 2016). The deeper dive
depths used in this analysis for each species were: rough-toothed dolphins – 50 m; false killer
whales – 50 m; and short-finned pilot whales – 500 m.
Equation 1 below provides the simplistic form of the sonar equation, where the RL is defined as
the source level (SL) of the MFAS transmission minus the transmission loss (TL) for the sound
propagating from the MFAS transmitting ship to the animal location. The TL is complex and
heavily affected by factors such as the bathymetry between the source and animal,
environmental factors, sound-velocity profiles, and bottom characteristics. Mismatches in these
factors from the actual conditions for which the model is run can result in different results of the
propagation modeling. While in situ measurements with which to compare model results would
be preferred, they were not available for this analysis given the offshore locations of animals
and the scope of this project.
RL = SL – TL (eq. 1)
Several additional assumptions were necessarily made regarding SLs for MFAS sources. Given
security concerns, sources were assumed to have no directionality in either azimuth or elevation
angles for the analysis. The depth of the MFAS source was fixed as the nominal depth of the
sonar dome of the MFAS ship. Source level values provided by the U.S. Navy (Department of
Navy 2013) for the U.S. Navy AN/SQS-53C sonar system transmitting a one-second signal is
235 dB re 1µPa at 1m for a 3 kHz signal.
Variability associated with animal location accuracy estimates for the ARGOS satellite location
classes (LC3, LC2, LC1, LC0, LCB and LCA) was explicitly integrated into RL estimates, based
upon a study of pinnipeds at-sea using Fastloc® GPS (Costa et al. 2010). Specific location code
accuracies (from Costa et al. 2010) utilized were: LC3 – 0.49 km, LC2 – 1.01 km, LC1 – 1.20
km, LC0 – 4.18 km, LCA – 6.19 km, and LCB – 10.28 km. For each tagged animal location,
1,000 estimated RLs were calculated at evenly distributed distances along a radial from the
MFAS source location through the estimated location with the radial length on either side of the
location equal to the location code accuracies noted above. For example, with LC3 locations,
1,000 estimated RLs were calculated along a radial extending from the tagged animal location
0.49 km towards and 0.49 km away from the vessel using MFAS. This allowed looking at the
estimated RL in a manner which accounts for many possible animal positions in distance as well
as the two depth regimes. In addition, RLs for each tagged animal location often were
calculated for more than one MFAS exposure if there were MFAS transmissions within the 1-
NAVFAC Pacific | Final Report | Assessing Exposure and Response of Three Species of Odontocetes to Mid-Frequency Active Sonar During Submarine Commanders Courses at the Pacific Missile Range Facility: August 2013 Through February 2015
June 2017 | 11
hour time window both before and after the tagged animal location was obtained, each with
corresponding distance between the MFAS transmitting vessel and the tagged animal location.
For comparisons of RL estimates at the near-surface (10 m) and deep-dive depths, we used the
estimate from the MFAS transmission closest in time to the tagged animal location. These
estimates were then represented statistically (e.g., means, standard deviations, medians).
Histograms were also generated, and for cases with low standard deviations (e.g., under a
couple of dB), they appear to be reasonably represented by Gaussian-like distributions. In some
cases the boxplots assume outliers as the minimum and maximum values in the estimate, and
they do not fit expected values, although they are modeled as being present due to certain
specific geometric conditions for the case. When the modeled minimum to maximum value
spans are large (e.g., >30 dB) the histograms often show multi-modal character, which is
present due to factors such as long ranges and geometric ducting, and results in two
distributions of estimated RLs.
This analysis required hundreds of propagation model runs, each with 1,000 estimates, which
was impracticable using the previous propagation model (Navy's PCIMAT standard propagation
model that was used in the Baird et al. [2014a] analysis), as it did not have a batch-processing
mode and required the analyst to input parameters for each model run. Heaney and Campbell
(2016) with the company OASIS (Ocean Acoustical Services and Instrumentation, Inc.,
Lexington, MA) developed a parabolic equation propagation model called Peregrine which
includes batch-processing capabilities. Thus, Peregrine was utilized in this analysis to generate
transmission loss estimates for all model runs. Peregrine outputs were read using a MATLAB
script and used to obtain a statistical representation of the estimated RLs.
Section 4 Results
During the three field projects (totaling 27 days of field effort) between July 2013 and February
2015, 20 satellite tags were deployed on five species of odontocetes: one Blainville’s beaked
whale, four bottlenose dolphins, six rough-toothed dolphins, one false killer whale, and eight
short-finned pilot whales. Details on the deployments can be found in Baird et al. (2014b, 2015,
2016). Of the 20 deployments, nine individuals overlapped both spatially and temporally with
MFAS from three discrete SCC events such that RLs could be estimated (Table 1). These nine
individuals included one false killer whale from the Northwestern Hawaiian Islands population
(see Baird et al. 2013; Carretta et al. 2016), five short-finned pilot whales (representing three
different groups), and three rough-toothed dolphins. Eight of the nine individuals were classified
as adult sized in the field, while the ninth (GmTag083) was considered a sub-adult in the field.
All the short-finned pilot whales were from the western main Hawaiian Islands resident
community and the rough-toothed dolphins were from the Kaua‘i and Ni‘ihau resident
community. Of the remaining 11 tags for which it was not possible to estimate RLs, six stopped
transmitting prior to the start of MFAS (three rough-toothed dolphins, and one each of
bottlenose dolphin, short-finned pilot whale, and Blainville’s beaked whale), and five were either
far enough away that RLs would have been below ambient noise levels or were in areas where
paths to MFAS were blocked by land (two short-finned pilot whales and three bottlenose
dolphin).
NAVFAC Pacific | Final Report | Assessing Exposure and Response of Three Species of Odontocetes to Mid-Frequency Active Sonar During Submarine Commanders Courses at the Pacific Missile Range Facility: August 2013 Through February 2015
June 2017 | 12
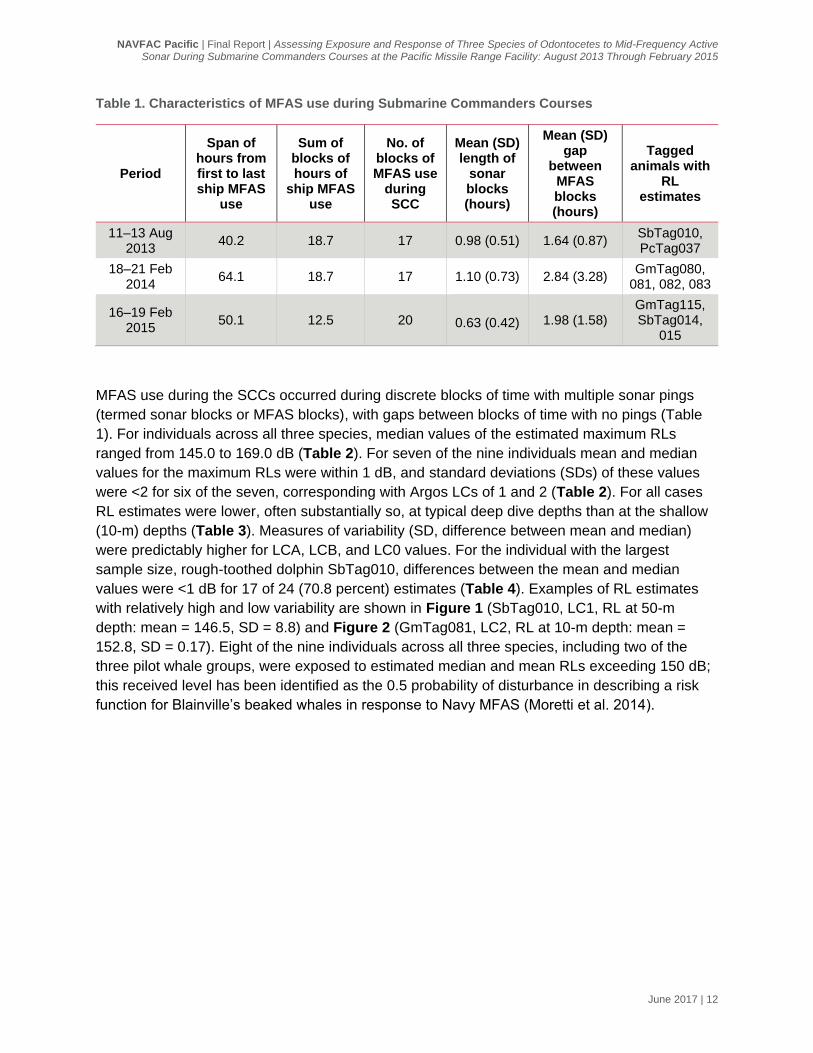
Table 1. Characteristics of MFAS use during Submarine Commanders Courses
Period
Span of hours from first to last ship MFAS
use
Sum of blocks of hours of
ship MFAS use
No. of blocks of MFAS use
during SCC
Mean (SD) length of
sonar blocks (hours)
Mean (SD) gap
between MFAS blocks (hours)
Tagged animals with
RL estimates
11–13 Aug 2013
40.2 18.7 17 0.98 (0.51) 1.64 (0.87) SbTag010, PcTag037
18–21 Feb 2014
64.1 18.7 17 1.10 (0.73) 2.84 (3.28) GmTag080,
081, 082, 083
16–19 Feb 2015 50.1 12.5 20
0.63 (0.42) 1.98 (1.58) GmTag115, SbTag014,
015
MFAS use during the SCCs occurred during discrete blocks of time with multiple sonar pings
(termed sonar blocks or MFAS blocks), with gaps between blocks of time with no pings (Table
1). For individuals across all three species, median values of the estimated maximum RLs
ranged from 145.0 to 169.0 dB (Table 2). For seven of the nine individuals mean and median
values for the maximum RLs were within 1 dB, and standard deviations (SDs) of these values
were <2 for six of the seven, corresponding with Argos LCs of 1 and 2 (Table 2). For all cases
RL estimates were lower, often substantially so, at typical deep dive depths than at the shallow
(10-m) depths (Table 3). Measures of variability (SD, difference between mean and median)
were predictably higher for LCA, LCB, and LC0 values. For the individual with the largest
sample size, rough-toothed dolphin SbTag010, differences between the mean and median
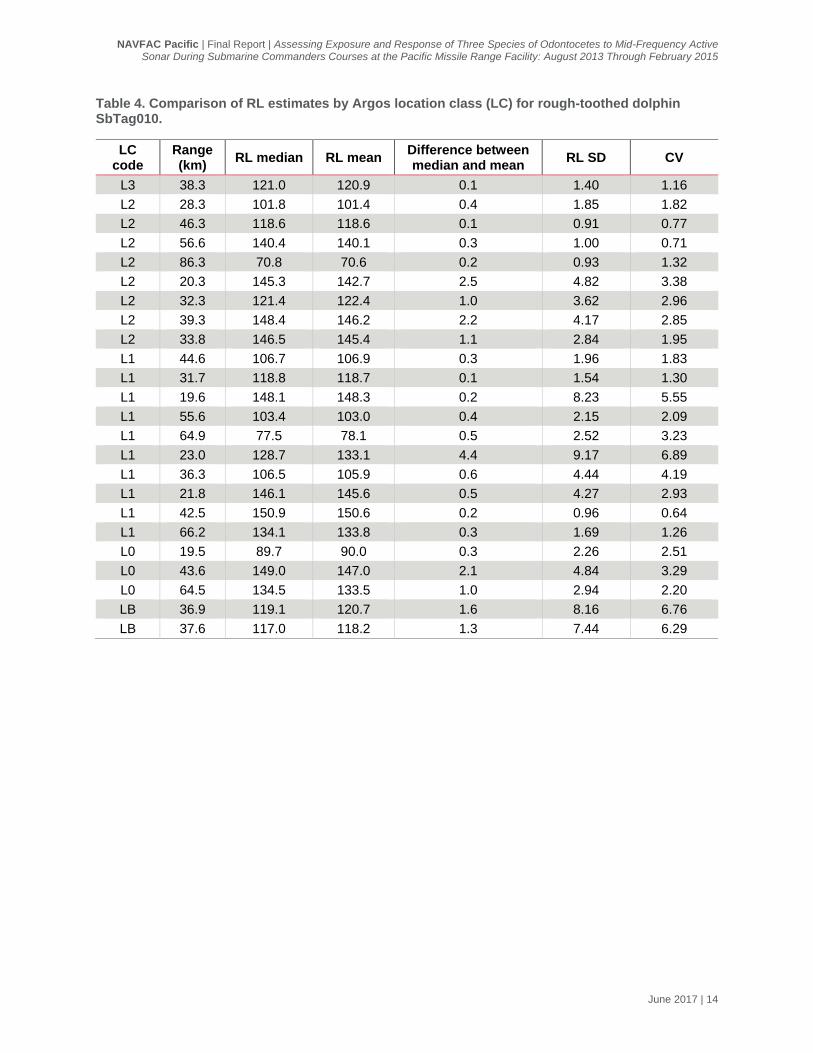
values were <1 dB for 17 of 24 (70.8 percent) estimates (Table 4). Examples of RL estimates
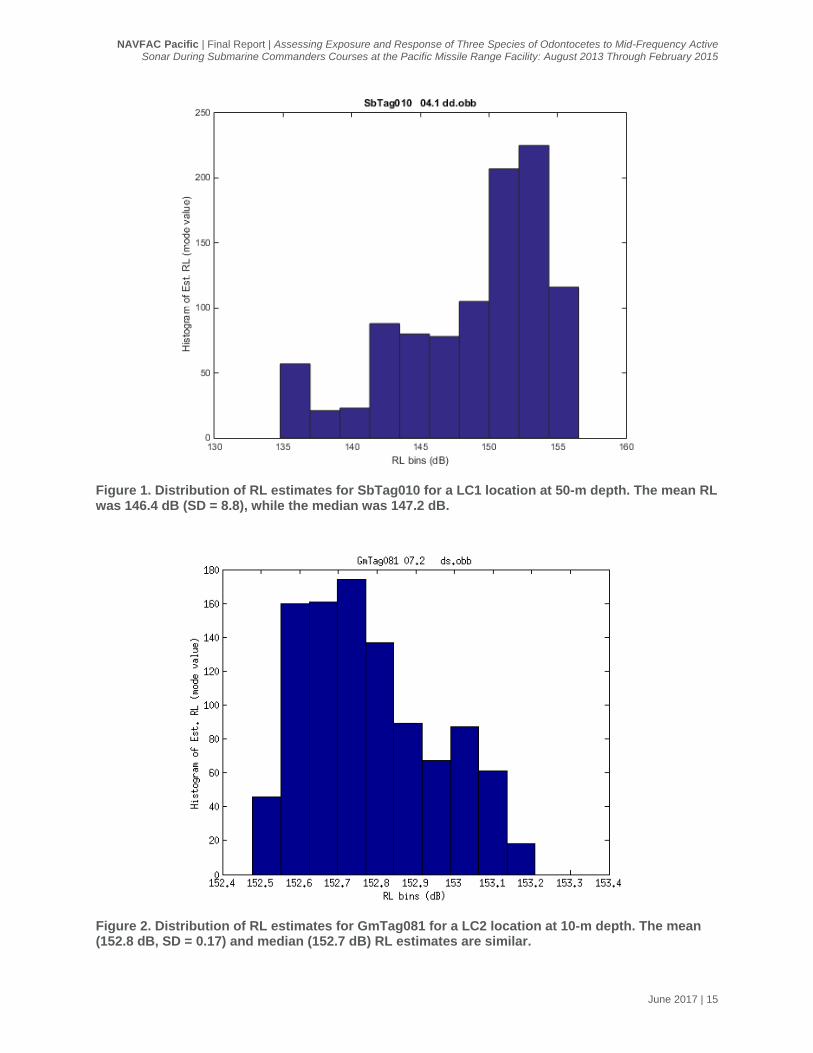
with relatively high and low variability are shown in Figure 1 (SbTag010, LC1, RL at 50-m
depth: mean = 146.5, SD = 8.8) and Figure 2 (GmTag081, LC2, RL at 10-m depth: mean =
152.8, SD = 0.17). Eight of the nine individuals across all three species, including two of the
three pilot whale groups, were exposed to estimated median and mean RLs exceeding 150 dB;
this received level has been identified as the 0.5 probability of disturbance in describing a risk
function for Blainville’s beaked whales in response to Navy MFAS (Moretti et al. 2014).
NAVFAC Pacific | Final Report | Assessing Exposure and Response of Three Species of Odontocetes to Mid-Frequency Active Sonar During Submarine Commanders Courses at the Pacific Missile Range Facility: August 2013 Through February 2015
June 2017 | 13
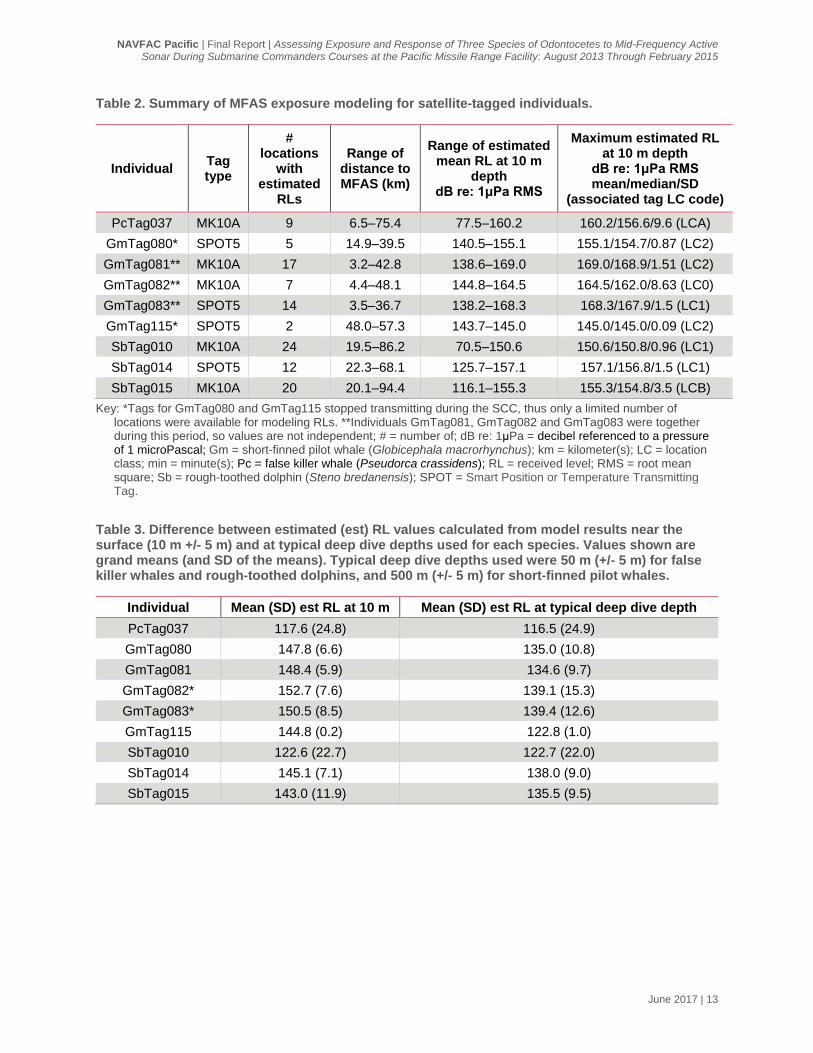
Table 2. Summary of MFAS exposure modeling for satellite-tagged individuals.
Individual Tag type
# locations
with estimated
RLs
Range of distance to MFAS (km)
Range of estimated mean RL at 10 m
depth dB re: 1μPa RMS
Maximum estimated RL at 10 m depth
dB re: 1μPa RMS mean/median/SD
(associated tag LC code)
PcTag037 MK10A 9 6.5–75.4 77.5–160.2 160.2/156.6/9.6 (LCA)
GmTag080* SPOT5 5 14.9–39.5 140.5–155.1 155.1/154.7/0.87 (LC2)
GmTag081** MK10A 17 3.2–42.8 138.6–169.0 169.0/168.9/1.51 (LC2)
GmTag082** MK10A 7 4.4–48.1 144.8–164.5 164.5/162.0/8.63 (LC0)
GmTag083** SPOT5 14 3.5–36.7 138.2–168.3 168.3/167.9/1.5 (LC1)
GmTag115* SPOT5 2 48.0–57.3 143.7–145.0 145.0/145.0/0.09 (LC2)
SbTag010 MK10A 24 19.5–86.2 70.5–150.6 150.6/150.8/0.96 (LC1)
SbTag014 SPOT5 12 22.3–68.1 125.7–157.1 157.1/156.8/1.5 (LC1)
SbTag015 MK10A 20 20.1–94.4 116.1–155.3 155.3/154.8/3.5 (LCB)
Key: *Tags for GmTag080 and GmTag115 stopped transmitting during the SCC, thus only a limited number of locations were available for modeling RLs. **Individuals GmTag081, GmTag082 and GmTag083 were together during this period, so values are not independent; # = number of; dB re: 1μPa = decibel referenced to a pressure of 1 microPascal; Gm = short-finned pilot whale (Globicephala macrorhynchus); km = kilometer(s); LC = location class; min = minute(s); Pc = false killer whale (Pseudorca crassidens); RL = received level; RMS = root mean square; Sb = rough-toothed dolphin (Steno bredanensis); SPOT = Smart Position or Temperature Transmitting Tag.
Table 3. Difference between estimated (est) RL values calculated from model results near the surface (10 m +/- 5 m) and at typical deep dive depths used for each species. Values shown are grand means (and SD of the means). Typical deep dive depths used were 50 m (+/- 5 m) for false killer whales and rough-toothed dolphins, and 500 m (+/- 5 m) for short-finned pilot whales.
Individual Mean (SD) est RL at 10 m Mean (SD) est RL at typical deep dive depth
PcTag037 117.6 (24.8) 116.5 (24.9)
GmTag080 147.8 (6.6) 135.0 (10.8)
GmTag081 148.4 (5.9) 134.6 (9.7)
GmTag082* 152.7 (7.6) 139.1 (15.3)
GmTag083* 150.5 (8.5) 139.4 (12.6)
GmTag115 144.8 (0.2) 122.8 (1.0)
SbTag010 122.6 (22.7) 122.7 (22.0)
SbTag014 145.1 (7.1) 138.0 (9.0)
SbTag015 143.0 (11.9) 135.5 (9.5)
NAVFAC Pacific | Final Report | Assessing Exposure and Response of Three Species of Odontocetes to Mid-Frequency Active Sonar During Submarine Commanders Courses at the Pacific Missile Range Facility: August 2013 Through February 2015
June 2017 | 14
Table 4. Comparison of RL estimates by Argos location class (LC) for rough-toothed dolphin SbTag010.
LC code
Range (km)
RL median RL mean Difference between median and mean
RL SD CV
L3 38.3 121.0 120.9 0.1 1.40 1.16
L2 28.3 101.8 101.4 0.4 1.85 1.82
L2 46.3 118.6 118.6 0.1 0.91 0.77
L2 56.6 140.4 140.1 0.3 1.00 0.71
L2 86.3 70.8 70.6 0.2 0.93 1.32
L2 20.3 145.3 142.7 2.5 4.82 3.38
L2 32.3 121.4 122.4 1.0 3.62 2.96
L2 39.3 148.4 146.2 2.2 4.17 2.85
L2 33.8 146.5 145.4 1.1 2.84 1.95
L1 44.6 106.7 106.9 0.3 1.96 1.83
L1 31.7 118.8 118.7 0.1 1.54 1.30
L1 19.6 148.1 148.3 0.2 8.23 5.55
L1 55.6 103.4 103.0 0.4 2.15 2.09
L1 64.9 77.5 78.1 0.5 2.52 3.23
L1 23.0 128.7 133.1 4.4 9.17 6.89
L1 36.3 106.5 105.9 0.6 4.44 4.19
L1 21.8 146.1 145.6 0.5 4.27 2.93
L1 42.5 150.9 150.6 0.2 0.96 0.64
L1 66.2 134.1 133.8 0.3 1.69 1.26
L0 19.5 89.7 90.0 0.3 2.26 2.51
L0 43.6 149.0 147.0 2.1 4.84 3.29
L0 64.5 134.5 133.5 1.0 2.94 2.20
LB 36.9 119.1 120.7 1.6 8.16 6.76
LB 37.6 117.0 118.2 1.3 7.44 6.29
NAVFAC Pacific | Final Report | Assessing Exposure and Response of Three Species of Odontocetes to Mid-Frequency Active Sonar During Submarine Commanders Courses at the Pacific Missile Range Facility: August 2013 Through February 2015
June 2017 | 15
Figure 1. Distribution of RL estimates for SbTag010 for a LC1 location at 50-m depth. The mean RL was 146.4 dB (SD = 8.8), while the median was 147.2 dB.
Figure 2. Distribution of RL estimates for GmTag081 for a LC2 location at 10-m depth. The mean (152.8 dB, SD = 0.17) and median (152.7 dB) RL estimates are similar.
NAVFAC Pacific | Final Report | Assessing Exposure and Response of Three Species of Odontocetes to Mid-Frequency Active Sonar During Submarine Commanders Courses at the Pacific Missile Range Facility: August 2013 Through February 2015
June 2017 | 16
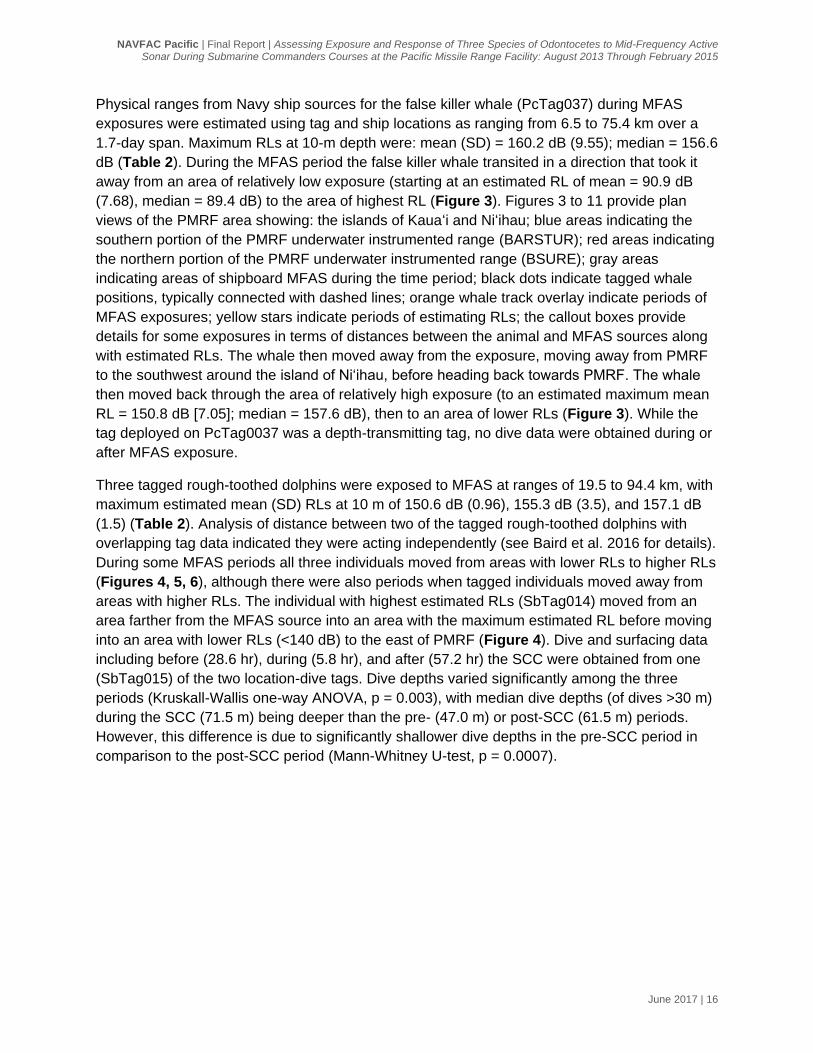
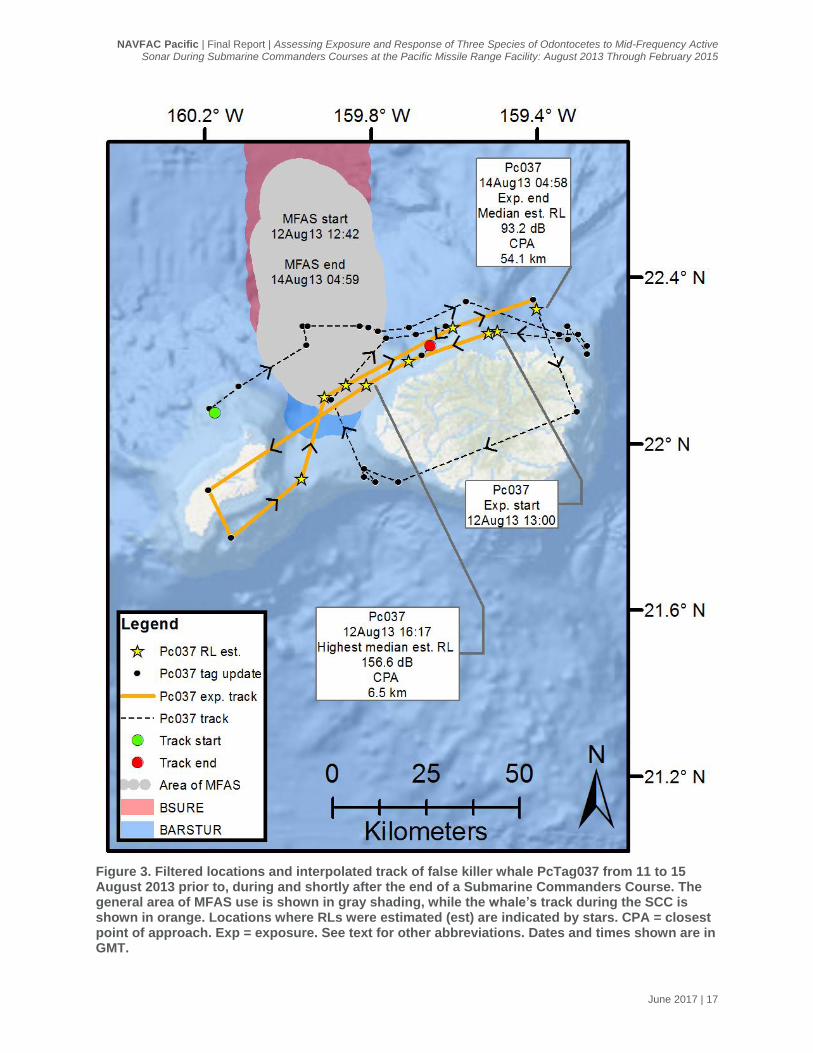
Physical ranges from Navy ship sources for the false killer whale (PcTag037) during MFAS
exposures were estimated using tag and ship locations as ranging from 6.5 to 75.4 km over a
1.7-day span. Maximum RLs at 10-m depth were: mean (SD) = 160.2 dB (9.55); median = 156.6
dB (Table 2). During the MFAS period the false killer whale transited in a direction that took it
away from an area of relatively low exposure (starting at an estimated RL of mean = 90.9 dB
(7.68), median = 89.4 dB) to the area of highest RL (Figure 3). Figures 3 to 11 provide plan
views of the PMRF area showing: the islands of Kaua‘i and Ni‘ihau; blue areas indicating the
southern portion of the PMRF underwater instrumented range (BARSTUR); red areas indicating
the northern portion of the PMRF underwater instrumented range (BSURE); gray areas
indicating areas of shipboard MFAS during the time period; black dots indicate tagged whale
positions, typically connected with dashed lines; orange whale track overlay indicate periods of
MFAS exposures; yellow stars indicate periods of estimating RLs; the callout boxes provide
details for some exposures in terms of distances between the animal and MFAS sources along
with estimated RLs. The whale then moved away from the exposure, moving away from PMRF
to the southwest around the island of Ni‘ihau, before heading back towards PMRF. The whale
then moved back through the area of relatively high exposure (to an estimated maximum mean
RL = 150.8 dB [7.05]; median = 157.6 dB), then to an area of lower RLs (Figure 3). While the
tag deployed on PcTag0037 was a depth-transmitting tag, no dive data were obtained during or
after MFAS exposure.
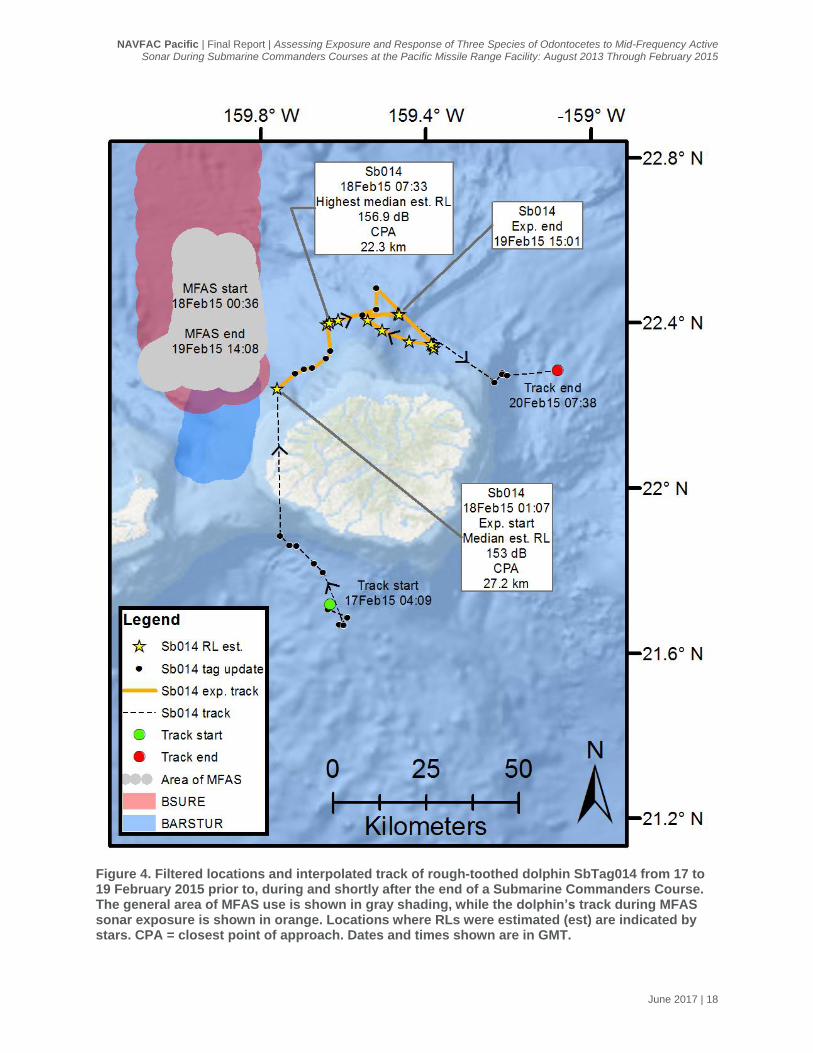
Three tagged rough-toothed dolphins were exposed to MFAS at ranges of 19.5 to 94.4 km, with
maximum estimated mean (SD) RLs at 10 m of 150.6 dB (0.96), 155.3 dB (3.5), and 157.1 dB
(1.5) (Table 2). Analysis of distance between two of the tagged rough-toothed dolphins with
overlapping tag data indicated they were acting independently (see Baird et al. 2016 for details).
During some MFAS periods all three individuals moved from areas with lower RLs to higher RLs
(Figures 4, 5, 6), although there were also periods when tagged individuals moved away from
areas with higher RLs. The individual with highest estimated RLs (SbTag014) moved from an
area farther from the MFAS source into an area with the maximum estimated RL before moving
into an area with lower RLs (<140 dB) to the east of PMRF (Figure 4). Dive and surfacing data
including before (28.6 hr), during (5.8 hr), and after (57.2 hr) the SCC were obtained from one
(SbTag015) of the two location-dive tags. Dive depths varied significantly among the three
periods (Kruskall-Wallis one-way ANOVA, p = 0.003), with median dive depths (of dives >30 m)
during the SCC (71.5 m) being deeper than the pre- (47.0 m) or post-SCC (61.5 m) periods.
However, this difference is due to significantly shallower dive depths in the pre-SCC period in
comparison to the post-SCC period (Mann-Whitney U-test, p = 0.0007).
NAVFAC Pacific | Final Report | Assessing Exposure and Response of Three Species of Odontocetes to Mid-Frequency Active Sonar During Submarine Commanders Courses at the Pacific Missile Range Facility: August 2013 Through February 2015
June 2017 | 17
Figure 3. Filtered locations and interpolated track of false killer whale PcTag037 from 11 to 15 August 2013 prior to, during and shortly after the end of a Submarine Commanders Course. The general area of MFAS use is shown in gray shading, while the whale’s track during the SCC is shown in orange. Locations where RLs were estimated (est) are indicated by stars. CPA = closest point of approach. Exp = exposure. See text for other abbreviations. Dates and times shown are in GMT.
NAVFAC Pacific | Final Report | Assessing Exposure and Response of Three Species of Odontocetes to Mid-Frequency Active Sonar During Submarine Commanders Courses at the Pacific Missile Range Facility: August 2013 Through February 2015
June 2017 | 18
Figure 4. Filtered locations and interpolated track of rough-toothed dolphin SbTag014 from 17 to 19 February 2015 prior to, during and shortly after the end of a Submarine Commanders Course. The general area of MFAS use is shown in gray shading, while the dolphin’s track during MFAS sonar exposure is shown in orange. Locations where RLs were estimated (est) are indicated by stars. CPA = closest point of approach. Dates and times shown are in GMT.

NAVFAC Pacific | Final Report | Assessing Exposure and Response of Three Species of Odontocetes to Mid-Frequency Active Sonar During Submarine Commanders Courses at the Pacific Missile Range Facility: August 2013 Through February 2015
June 2017 | 19
Figure 5. Filtered locations and interpolated track of rough-toothed dolphin SbTag010 from 12 to 14 August 2013 prior to and during a Submarine Commanders Course. The tag stopped transmitting shortly prior to the end of the SCC. The general area of MFAS use is shown in gray shading, while the dolphin’s track during MFAS sonar exposure is shown in orange. Locations where RLs were estimated (est) are indicated by stars. CPA = closest point of approach. Dates and times shown are in GMT.

NAVFAC Pacific | Final Report | Assessing Exposure and Response of Three Species of Odontocetes to Mid-Frequency Active Sonar During Submarine Commanders Courses at the Pacific Missile Range Facility: August 2013 Through February 2015
June 2017 | 20
Figure 6. Filtered locations and interpolated track of rough-toothed dolphin SbTag015 from 16 to 20 February 2015 prior to, during and shortly after the end of a Submarine Commanders Course. The general area of MFAS use is shown in gray shading, while the dolphin’s track during MFAS sonar exposure is shown in orange. Locations where RLs were estimated (est) are indicated by stars. CPA = closest point of approach. Dates and times shown are in GMT.
NAVFAC Pacific | Final Report | Assessing Exposure and Response of Three Species of Odontocetes to Mid-Frequency Active Sonar During Submarine Commanders Courses at the Pacific Missile Range Facility: August 2013 Through February 2015
June 2017 | 21
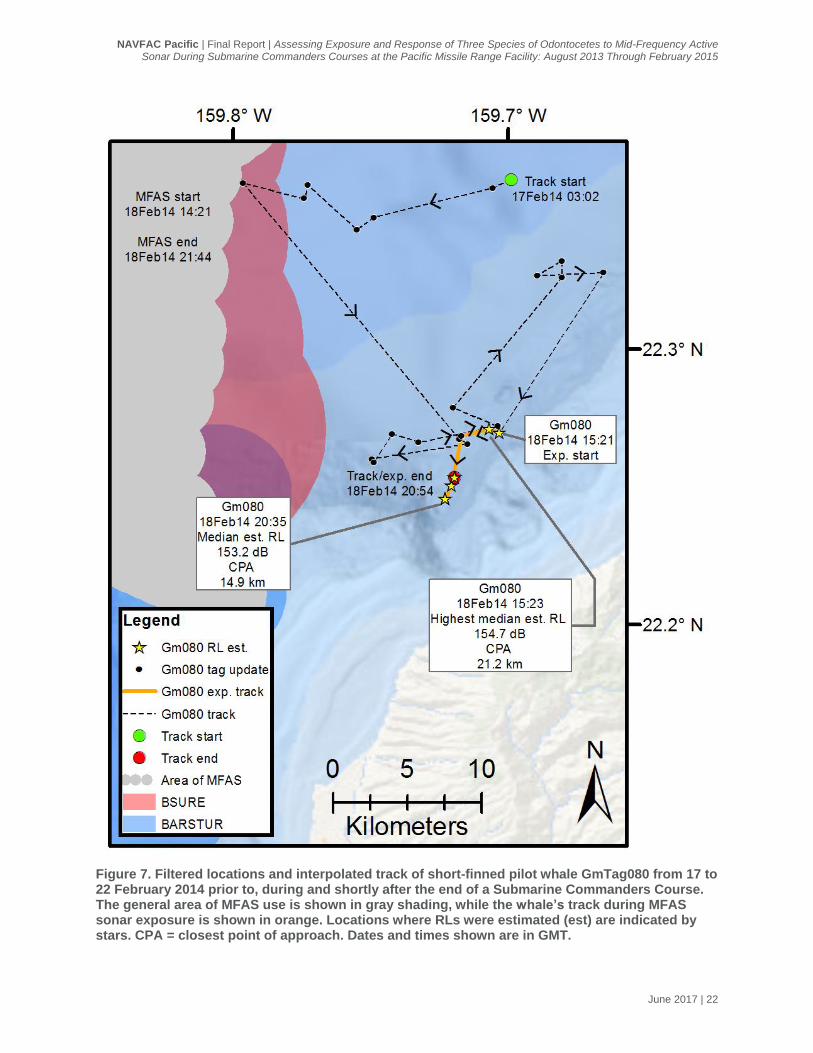
Analysis of distances between individuals and association patterns for the four individual short-
finned pilot whales tagged in February 2014 indicated they were from two different groups (see
Baird et al. 2015 for details). Thus, combined with the one individual tagged in 2015, the five
short-finned pilot whales represented three different groups. Three individuals in one group
(GmTags 081, 082 and 083) were exposed to MFAS at ranges of 3.2 to 48.1 km (Table 2). A
single individual was tagged in each of the other two groups, but in both cases the tags stopped
transmitting early in the SCCs, with distances of the tagged individuals to the MFAS transmitting
ships of 14.9 to 39.5 km (GmTag080) and 48.0 to 57.3 km (GmTag115). The individuals
(GmTag081, GmTag082, GmTag083) exposed at relatively short distances had high maximum
estimated RLs at 10 m (GmTag081 mean = 169 dB (1.41), median = 168.9 dB; GmTag082
mean = 164.5 dB [8.63], median = 162.0 dB; GmTag083 mean = 168.3 dB [1.50], median =
167.9 dB). Consistency between mean and median RLs and small SDs suggest that these
estimates are relatively robust. No large-scale movements of the individuals away from areas of
relatively high RLs, for example to areas in the lee of Kaua‘i or Ni‘ihau, were observed, and all
five individuals moved into areas with higher RLs at some point during the period of overlap with
the SCCs (Figures 7 through 11).
NAVFAC Pacific | Final Report | Assessing Exposure and Response of Three Species of Odontocetes to Mid-Frequency Active Sonar During Submarine Commanders Courses at the Pacific Missile Range Facility: August 2013 Through February 2015
June 2017 | 22
Figure 7. Filtered locations and interpolated track of short-finned pilot whale GmTag080 from 17 to 22 February 2014 prior to, during and shortly after the end of a Submarine Commanders Course. The general area of MFAS use is shown in gray shading, while the whale’s track during MFAS sonar exposure is shown in orange. Locations where RLs were estimated (est) are indicated by stars. CPA = closest point of approach. Dates and times shown are in GMT.
NAVFAC Pacific | Final Report | Assessing Exposure and Response of Three Species of Odontocetes to Mid-Frequency Active Sonar During Submarine Commanders Courses at the Pacific Missile Range Facility: August 2013 Through February 2015
June 2017 | 23
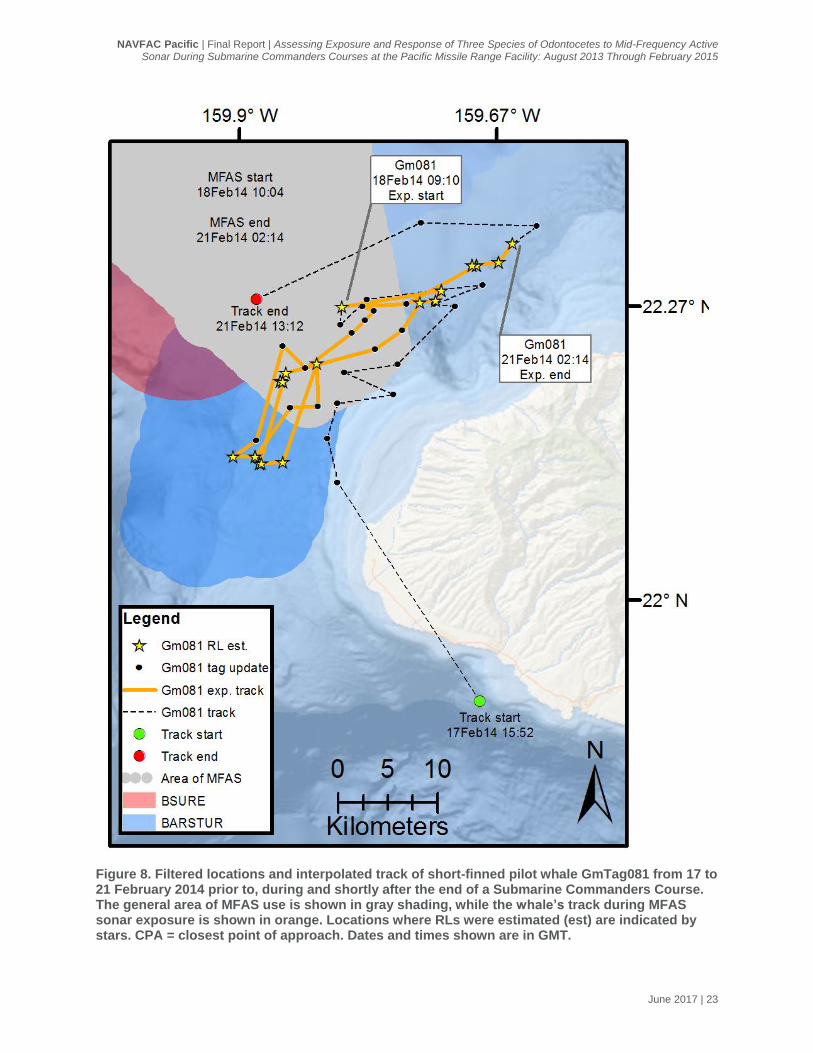
Figure 8. Filtered locations and interpolated track of short-finned pilot whale GmTag081 from 17 to 21 February 2014 prior to, during and shortly after the end of a Submarine Commanders Course. The general area of MFAS use is shown in gray shading, while the whale’s track during MFAS sonar exposure is shown in orange. Locations where RLs were estimated (est) are indicated by stars. CPA = closest point of approach. Dates and times shown are in GMT.
NAVFAC Pacific | Final Report | Assessing Exposure and Response of Three Species of Odontocetes to Mid-Frequency Active Sonar During Submarine Commanders Courses at the Pacific Missile Range Facility: August 2013 Through February 2015
June 2017 | 24
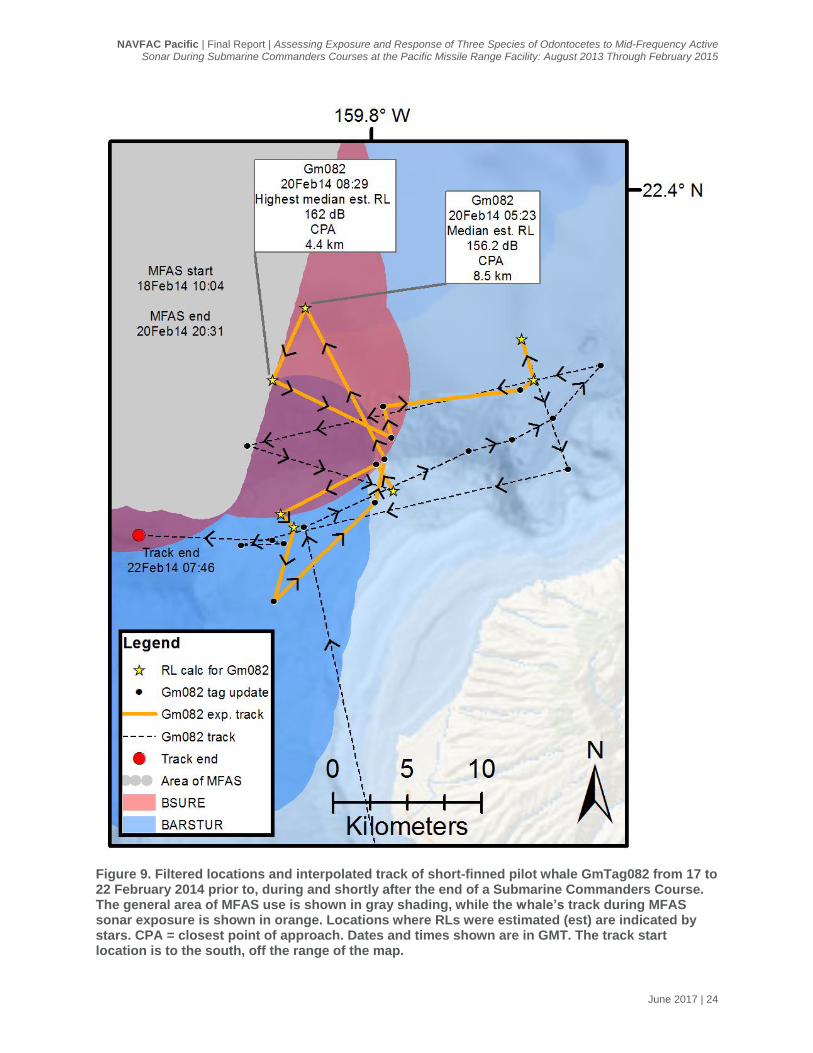
Figure 9. Filtered locations and interpolated track of short-finned pilot whale GmTag082 from 17 to 22 February 2014 prior to, during and shortly after the end of a Submarine Commanders Course. The general area of MFAS use is shown in gray shading, while the whale’s track during MFAS sonar exposure is shown in orange. Locations where RLs were estimated (est) are indicated by stars. CPA = closest point of approach. Dates and times shown are in GMT. The track start location is to the south, off the range of the map.

NAVFAC Pacific | Final Report | Assessing Exposure and Response of Three Species of Odontocetes to Mid-Frequency Active Sonar During Submarine Commanders Courses at the Pacific Missile Range Facility: August 2013 Through February 2015
June 2017 | 25
Figure 10. Filtered locations and interpolated track of short-finned pilot whale GmTag083 from 17 to 22 February 2014 prior to, during and shortly after the end of a Submarine Commanders Course. The general area of MFAS use is shown in gray shading, while the whale’s track during MFAS sonar exposure is shown in orange. Locations where RLs were estimated (est) are indicated by stars. CPA = closest point of approach. Dates and times shown are in GMT.

NAVFAC Pacific | Final Report | Assessing Exposure and Response of Three Species of Odontocetes to Mid-Frequency Active Sonar During Submarine Commanders Courses at the Pacific Missile Range Facility: August 2013 Through February 2015
June 2017 | 26
Figure 11. Filtered locations and interpolated track of short-finned pilot whale GmTag115 from 17 to 18 February 2014 prior to and during the beginning of a Submarine Commanders Course. The tag stopped transmitting after the last location shown. The general area of MFAS use is shown in gray shading, while the whale’s track during MFAS sonar exposure is shown in orange. Locations where RLs were estimated (est) are indicated by stars. CPA = closest point of approach. Dates and times shown are in GMT.
NAVFAC Pacific | Final Report | Assessing Exposure and Response of Three Species of Odontocetes to Mid-Frequency Active Sonar During Submarine Commanders Courses at the Pacific Missile Range Facility: August 2013 Through February 2015
June 2017 | 27
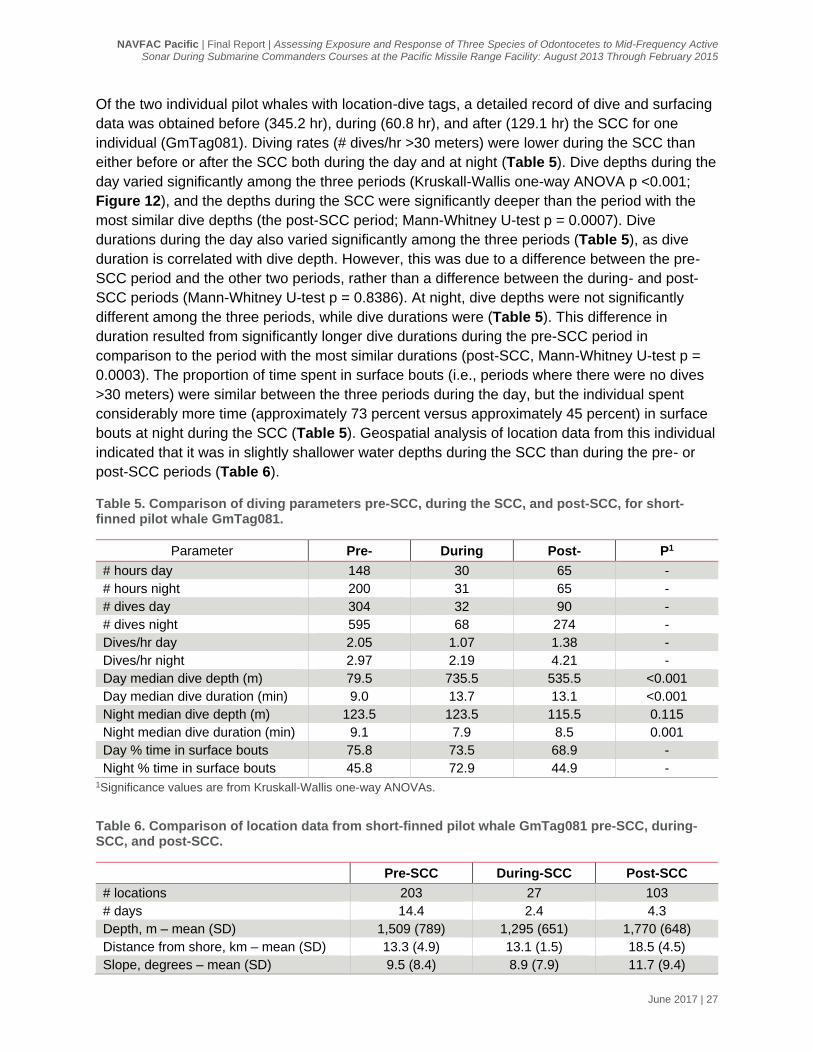
Of the two individual pilot whales with location-dive tags, a detailed record of dive and surfacing
data was obtained before (345.2 hr), during (60.8 hr), and after (129.1 hr) the SCC for one
individual (GmTag081). Diving rates (# dives/hr >30 meters) were lower during the SCC than
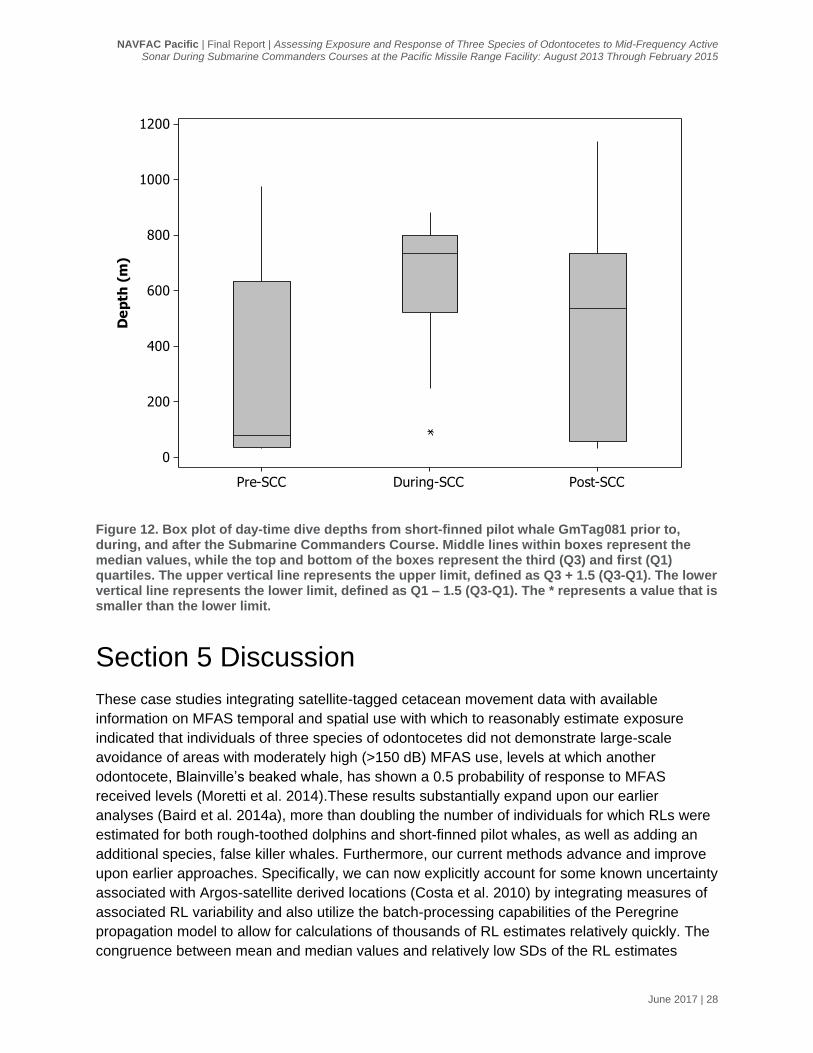
either before or after the SCC both during the day and at night (Table 5). Dive depths during the
day varied significantly among the three periods (Kruskall-Wallis one-way ANOVA p <0.001;
Figure 12), and the depths during the SCC were significantly deeper than the period with the
most similar dive depths (the post-SCC period; Mann-Whitney U-test p = 0.0007). Dive
durations during the day also varied significantly among the three periods (Table 5), as dive
duration is correlated with dive depth. However, this was due to a difference between the pre-
SCC period and the other two periods, rather than a difference between the during- and post-
SCC periods (Mann-Whitney U-test p = 0.8386). At night, dive depths were not significantly
different among the three periods, while dive durations were (Table 5). This difference in
duration resulted from significantly longer dive durations during the pre-SCC period in
comparison to the period with the most similar durations (post-SCC, Mann-Whitney U-test p =
0.0003). The proportion of time spent in surface bouts (i.e., periods where there were no dives
>30 meters) were similar between the three periods during the day, but the individual spent
considerably more time (approximately 73 percent versus approximately 45 percent) in surface
bouts at night during the SCC (Table 5). Geospatial analysis of location data from this individual
indicated that it was in slightly shallower water depths during the SCC than during the pre- or
post-SCC periods (Table 6).
Table 5. Comparison of diving parameters pre-SCC, during the SCC, and post-SCC, for short-finned pilot whale GmTag081.
Parameter Pre- During Post- P1
# hours day 148 30 65 -
# hours night 200 31 65 -
# dives day 304 32 90 -
# dives night 595 68 274 -
Dives/hr day 2.05 1.07 1.38 -
Dives/hr night 2.97 2.19 4.21 -
Day median dive depth (m) 79.5 735.5 535.5 <0.001
Day median dive duration (min) 9.0 13.7 13.1 <0.001
Night median dive depth (m) 123.5 123.5 115.5 0.115
Night median dive duration (min) 9.1 7.9 8.5 0.001
Day % time in surface bouts 75.8 73.5 68.9 -
Night % time in surface bouts 45.8 72.9 44.9 - 1Significance values are from Kruskall-Wallis one-way ANOVAs.
Table 6. Comparison of location data from short-finned pilot whale GmTag081 pre-SCC, during-SCC, and post-SCC.
Pre-SCC During-SCC Post-SCC
# locations 203 27 103
# days 14.4 2.4 4.3
Depth, m – mean (SD) 1,509 (789) 1,295 (651) 1,770 (648)
Distance from shore, km – mean (SD) 13.3 (4.9) 13.1 (1.5) 18.5 (4.5)
Slope, degrees – mean (SD) 9.5 (8.4) 8.9 (7.9) 11.7 (9.4)
NAVFAC Pacific | Final Report | Assessing Exposure and Response of Three Species of Odontocetes to Mid-Frequency Active Sonar During Submarine Commanders Courses at the Pacific Missile Range Facility: August 2013 Through February 2015
June 2017 | 28
Figure 12. Box plot of day-time dive depths from short-finned pilot whale GmTag081 prior to, during, and after the Submarine Commanders Course. Middle lines within boxes represent the median values, while the top and bottom of the boxes represent the third (Q3) and first (Q1) quartiles. The upper vertical line represents the upper limit, defined as Q3 + 1.5 (Q3-Q1). The lower vertical line represents the lower limit, defined as Q1 – 1.5 (Q3-Q1). The * represents a value that is smaller than the lower limit.
Section 5 Discussion
These case studies integrating satellite-tagged cetacean movement data with available
information on MFAS temporal and spatial use with which to reasonably estimate exposure
indicated that individuals of three species of odontocetes did not demonstrate large-scale
avoidance of areas with moderately high (>150 dB) MFAS use, levels at which another
odontocete, Blainville’s beaked whale, has shown a 0.5 probability of response to MFAS
received levels (Moretti et al. 2014).These results substantially expand upon our earlier
analyses (Baird et al. 2014a), more than doubling the number of individuals for which RLs were
estimated for both rough-toothed dolphins and short-finned pilot whales, as well as adding an
additional species, false killer whales. Furthermore, our current methods advance and improve
upon earlier approaches. Specifically, we can now explicitly account for some known uncertainty
associated with Argos-satellite derived locations (Costa et al. 2010) by integrating measures of
associated RL variability and also utilize the batch-processing capabilities of the Peregrine
propagation model to allow for calculations of thousands of RL estimates relatively quickly. The
congruence between mean and median values and relatively low SDs of the RL estimates
Post-SCCDuring-SCCPre-SCC
1200
1000
800
600
400
200
0
De
pth
(m
)

NAVFAC Pacific | Final Report | Assessing Exposure and Response of Three Species of Odontocetes to Mid-Frequency Active Sonar During Submarine Commanders Courses at the Pacific Missile Range Facility: August 2013 Through February 2015
June 2017 | 29
(Table 3) suggest that the estimates are relatively robust. However it should be noted that with
low quality tagged animal locations at relatively close distances to an MFAS source the error
associated with estimates is likely to be greater. Regardless, the substantial improvements in
analytical methods here will serve as useful examples in evaluating (uncontrolled) exposure
scenarios that may be applied to other individuals and species in other MFAS use areas and
contexts where similar evaluations may be conducted.
As with the earlier analyses, both short-finned pilot whales and rough-toothed dolphins were
known to be from populations that are resident to the area (e.g., Baird et al. 2017a, 2017b).
Similarly, the false killer whale was from the Northwestern Hawaiian Islands population, which is
known to at least occasionally visit the area around PMRF (Baird 2016). Like the individuals in
the earlier analyses, no large-scale avoidance of areas with relatively high MFAS exposure was
observed. Given that MFAS has been used off PMRF for more than 30 years, these individuals
have likely been exposed to MFAS on multiple previous occasions. As has been discussed in
relation to the occurrence data available from PMRF (Baird et al. 2017), numerous authors have
suggested that prior exposure history likely influences individual responses to MFAS exposures
(Falcone et al. 2008; DeRuiter et al. 2013; Harris and Thomas 2015; Southall et al. 2016). Thus,
we suggest that our results not be extrapolated to these species in general, particularly in areas
where sonar is used less regularly than at PMRF. Individuals from more naïve populations may
be more likely to exhibit avoidance responses where MFAS exposure is less frequent or occurs
at lower levels, including those from pelagic populations or from island-associated populations
elsewhere in Hawai‘i.
Despite the lack of any apparent broad horizontal avoidance response, an almost complete
record of dive data obtained from a short-finned pilot whale with the highest estimated MFAS
RLs (GmTag081; Figure 8) revealed numerous changes in diving behavior during the SCC
relative to pre- and post-SCC periods (Table 5; Figure 12). Similarity in habitats used over the
pre-, during-, and post-SCC periods (Table 6) suggest that these changes in diving behavior
were likely not due to the individual using substantially different types of habitat. During the SCC
this individual spent less time diving and more time in near-surface (<30-m) waters, with the
greatest change occurring at night (Table 5). However, when diving, dive depths were
statistically significantly deeper during the SCC than pre- or post-SCC periods (Figure 12).
There was statistically significant variation in dive duration both during the day and night (Table
5), but these differences were driven by the pre-SCC dive durations, rather than a difference
between the during-SCC period and the pre- and post-SCC periods. Pilot whales in Hawai‘i
typically feed throughout the night, while during the day they intersperse deep feeding with
periods of rest and socialization near the surface (Baird 2016). Given the fact that they span
several diurnal periods, overall reduced diving rates and increased amount of time spent in
surface bouts may reflect decreased foraging rates during the SCC. Such differences
demonstrate that even with a lack of obvious broad-scale avoidance of important habitat areas
during MFAS exposure, some animals that remain may exhibit changes in biologically-
meaningful behavior. The ability to investigate both potential longer-term, broader-scale spatial
avoidance as well as finer-scale individual behavior before, during, and after known sonar
events illustrates the utility of these kinds of tag sensors and analytical methods.
NAVFAC Pacific | Final Report | Assessing Exposure and Response of Three Species of Odontocetes to Mid-Frequency Active Sonar During Submarine Commanders Courses at the Pacific Missile Range Facility: August 2013 Through February 2015
June 2017 | 30
While we have considerably expanded and improved the modeling and analytical methods from
earlier analyses (Baird et al., 2014), there are a number of identified caveats and limitations to
the current approach. Here, we have modeled received RMS RL values across exposure
events. However, since MFAS use during SCCs in Hawai‘i typically occurs multiple times over
several days, calculating cumulative sound exposure levels in addition to mean and median RLs
from individual events would be additionally informative, given that such cumulative sound
exposure levels are typically one of several metrics used in exposure-risk probability functions
from behavioral-response studies (Southall et al. 2016). Further, current methods use a single
radial crossing the tagged animal position to account for known uncertainty in the Argos
satellite-derived locations. While this provides a measure of variability associated with
potentially closer or more distant actual locations, it does not incorporate uncertainty associated
with the azimuth, thus not fully representing the ellipses of Argos error (Costa et al. 2010). We
also estimated RLs for a single frequency, whereas estimates over a range of frequencies
would both better reflect actual MFAS and help reduce artificially low RL estimates that occur
due to destructive interference and have been incorporated for future analyses. Finally, it is
acknowledged that current tagging methods involve positional errors that may be relatively large
and challenging to fully quantify. Incorporating LIMPET tags with Fastloc® GPS capabilities
would largely eliminate the uncertainty associated with Argos-derived locations and could
generate locations at specified time intervals, improving upon the types of RL estimates
undertaken or envisioned here.
Section 6 Acknowledgements
A number of individuals assisted in the field or in matching photographs, but we particularly
thank Brenda Rone and Sabre Mahaffy. David Anderson assisted with dive data analyses, and
Cameron Martin prepared most of the figures. We thank Bob Kenny for a review of the report.
Satellite tagging was carried out under National Marine Fisheries Service Scientific Research
Permit No. 15330.
Section 7 Literature Cited
Albertson, R.G., R.W. Baird, M. Oremus, M.M. Poole, K.K. Martien, and C.S. Baker. 2016.
Staying close to home? Genetic differentiation of rough-toothed dolphins near oceanic
islands in the central Pacific Ocean. Conservation Genetics doi 10.1007/s10592-016-
0880-z.
Andrews, K.R., L. Karczmarski, W.W.L. Au, S.H. Rickards, C.A. Vanderlip, B.W. Bowen, E.G.
Grau, and R.J. Toonen. 2010. Rolling stones and stable homes: social structure, habitat
diversity and population genetics of the Hawaiian spinner dolphins (Stenella longirostris).
Molecular Ecology 19:732–748.
Baird, R.W. 2016. The lives of Hawai‘i's dolphins and whales: natural history and conservation.
University of Hawai‘i Press, Honolulu, Hawai‘i.
Baird, R.W., D.L. Webster, S.D. Mahaffy, D.J. McSweeney, G.S. Schorr, and A.D. Ligon.
2008a. Site fidelity and association patterns in a deep-water dolphin: rough-toothed

NAVFAC Pacific | Final Report | Assessing Exposure and Response of Three Species of Odontocetes to Mid-Frequency Active Sonar During Submarine Commanders Courses at the Pacific Missile Range Facility: August 2013 Through February 2015
June 2017 | 31
dolphins (Steno bredanensis) in the Hawaiian Archipelago. Marine Mammal Science
24:535–553.
Baird, R.W., A.M. Gorgone, D.J. McSweeney, D.L. Webster, D.R. Salden, M.H. Deakos, A.D.
Ligon, G.S. Schorr, J. Barlow, and S.D. Mahaffy. 2008b. False killer whales (Pseudorca
crassidens) around the main Hawaiian Islands: long-term site fidelity, inter-island
movements, and association patterns. Marine Mammal Science 24:591–612.
Baird, R.W., E.M. Oleson, J. Barlow, A.D. Ligon, A.M. Gorgone, and S.D. Mahaffy. 2013.
Evidence of an island-associated population of false killer whales (Pseudorca
crassidens) in the Northwestern Hawaiian Islands. Pacific Science 67:513–521.
Baird, R.W., S.W. Martin, D.L. Webster, and B.L. Southall. 2014a. Assessment of modeled
received sound pressure levels and movements of satellite-tagged odontocetes exposed
to mid-frequency active sonar at the Pacific Missile Range Facility: February 2011
through February 2013. Prepared for U.S. Pacific Fleet, submitted to NAVFAC PAC by
HDR Environmental, Operations and Construction, Inc, Honolulu, Hawai‘i.
Baird, R.W., S.M. Jarvis, D.L. Webster, B.K. Rone, J.A. Shaffer, S.D. Mahaffy, A.M. Gorgone,
and D.J. Moretti. 2014b. Odontocete studies on the Pacific Missile Range Facility in
July/August 2013: satellite-tagging, photo-identification, and passive acoustic monitoring.
Prepared for U.S. Pacific Fleet, submitted to NAVFAC PAC by HDR Environmental,
Operations and Construction, Inc., Honolulu, Hawai‘i.
Baird, R.W., A.N. Dilley, D.L. Webster, R. Morrissey, B.K. Rone, S.M. Jarvis, S.D. Mahaffy, A.M.
Gorgone, and D.J. Moretti. 2015. Odontocete studies on the Pacific Missile Range
Facility in February 2014: satellite-tagging, photo-identification, and passive acoustic
monitoring. Prepared for Commander, U.S. Pacific Fleet, submitted to Naval Facilities
Engineering Command, Pacific by HDR Environmental, Operations and Construction,
Inc., Honolulu, Hawai‘i.
Baird, R.W., D.L. Webster, S. Watwood, R. Morrissey, B.K. Rone, S.D. Mahaffy, A.M. Gorgone,
D.B. Anderson, and D.J. Moretti. 2016. Odontocete studies on the Pacific Missile Range
Facility in February 2015: satellite-tagging, photo-identification, and passive acoustic
monitoring. Prepared for Commander, U.S. Pacific Fleet, submitted to NAVFAC PAC by
HDR Environmental, Operations and Construction, Inc., Honolulu, Hawai‘i.
Baird, R.W., D.L. Webster, R. Morrissey, B.K. Rone, S.D. Mahaffy, A.M. Gorgone,
D.B. Anderson, E.E. Henderson, S.W. Martin, and D.J. Moretti. 2017a. Odontocete
studies on the Pacific Missile Range Facility in February 2016: satellite-tagging, photo-
identification, and passive acoustic monitoring. Prepared for Commander, Pacific Fleet,
under Contract No. N62470-15-D-8006 Task Order KB08 issued to HDR Inc., Honolulu,
Hawai‘i.
Baird, R.W., D.L. Webster, S.D. Mahaffy, A.M. Gorgone, E.M. Walters and D.B. Anderson.
2017b. Studies of dolphins and whales on and around the Pacific Missile Range Facility
using photo-identification and satellite tagging: evidence for resident and non-resident
species. Report prepared under Contract No. N66604-14-C0145 from the Naval
NAVFAC Pacific | Final Report | Assessing Exposure and Response of Three Species of Odontocetes to Mid-Frequency Active Sonar During Submarine Commanders Courses at the Pacific Missile Range Facility: August 2013 Through February 2015
June 2017 | 32
Undersea Warfare Center, Newport, Rhode Island, to Cascadia Research Collective,
Olympia, Washington.
Carretta, J.V., E.M. Oleson, J. Baker, D.W. Weller, A.R. Lang, K.A. Forney, M.M. Muto, B.
Hanson, A.J. Orr, H. Huber, M.S. Lowry, J. Barlow, J.E. Moore, D. Lynch, L. Carswell,
and R.L. Brownell Jr. 2016. U.S. Pacific marine mammal stock assessments: 2015.
NOAA Technical Memorandum NMFS SWFSC-561. National Marine Fisheries Service,
La Jolla, California.
Costa, D.P., P.W. Robinson, J.P.Y. Arnould, A.-L. Harrison, S.E. Simmons, J.L. Hassrick, A.J.
Hoskins, S.P. Kirkman, H. Oosthuizen, S. Villegas-Amtmann and D.E. Crocke. 2010.
Accuracy of ARGOS locations of pinnipeds at-sea estimated using Fastloc GPS. PLoS
ONE 5:e8677.
Courbis, S., R.W. Baird, F. Cipriano, and D. Duffield. 2014. Multiple populations of pantropical
spotted dolphins in Hawaiian waters. Journal of Heredity 105:627–641.
Department of the Navy. Hawaii-Southern California training and testing activities final
environmental impact statement/overseas environmental impact statement.
https://hstteis.com/Completedin2013/DocumentsandReferences/HSTTDocuments/Final
EISOEIS.aspx (Last viewed 12 June 2017).
DeRuiter, S.L., B.L. Southall, J. Calambokidis, W.M.X. Zimmer, D. Sadykova, E.A. Falcone,
A.S. Friedlaender, J.E. Joseph, D. Moretti, G.S. Schorr, L. Thomas, and P.L. Tyack.
2013. First direct measurements of behavioural responses by Cuvier’s beaked whales to
mid-frequency active sonar. Biology Letters 9:20130223.
Douglas, D.C., R. Weinzierl, S.C. Davidson, R. Kays, M. Wikelski, and G. Bohrer. 2012.
Moderating Argos location errors in animal tracking data. Methods in Ecology and
Evolution 6:999–1007.
Falcone, E.A., G.S. Schorr, A.B. Douglas, J. Calambokidis, E. Henderson, M.F. McKenna,
J. Hildebrand, and D. Moretti. 2009. Sighting characteristics and photo-identification of
Cuvier’s beaked whales (Ziphius cavirostris) near San Clemente Island, California: a key
area for beaked whales and the military? Marine Biology 156:2631–2640.
Harris, D.M., and L. Thomas. 2015. Status and future of research on the behavioral responses
of marine mammals to U.S. Navy sonar. CREEM Technical Report 2015-3, University of
St. Andrews, St. Andrews, UK.
Heaney, K.D., and R.L. Campbell. 2016. Three-dimensional parabolic equation modeling of
mesoscale eddy deflection. Journal of the Acoustical Society of America 139:918–926.
Helble, T.A., E.E. Henderson, G.R. Ierley, and S.W. Martin. 2016. Swim track kinematics and
calling behavior attributed to Bryde’s whales on the Navy’s Pacific Missile Range
Facility. Journal of the Acoustical Society of America 140:4170-4177.
NAVFAC Pacific | Final Report | Assessing Exposure and Response of Three Species of Odontocetes to Mid-Frequency Active Sonar During Submarine Commanders Courses at the Pacific Missile Range Facility: August 2013 Through February 2015
June 2017 | 33
Helble, T.A., G.R. Ierley, G.L. D’Spain, and S.W. Martin. 2016. Automated acoustic localization
and call association for vocalizing humpback whales on the Navy’s Pacific Missile Range
Facility. Journal of the Acoustical Society of America 137:11-21.
Henderson, E.E., S.W. Martin, R. Manzano-Roth, and B.M. Matsuyama. 2016. Occurrence and
habitat use of foraging Blainville’s beaked whales (Mesoplodon densirostris) on a U.S.
Navy Range in Hawaii. Aquatic Mammals 42:549–562.
Mahaffy, S.D., R.W. Baird, D.J. McSweeney, D.L. Webster, and G.S. Schorr. 2015. High site
fidelity, strong associations and long-term bonds: short finned pilot whales off the island
of Hawai‘i. Marine Mammal Science 31:1427–1451.
Manzano-Roth, R., E.E. Henderson, S.W. Martin, C. Martin, and B.M. Matsuyama. 2016.
Impacts of U.S. Navy training events on Blainville’s beaked whales (Mesoplodon
densirostris) foraging dives in Hawaiian waters. Aquatic Mammals 42:507–518.
Martin, S.W., C.R. Martin, B.M. Matsuyama, and E.E. Henderson. 2015. Minke whales
(Balaenoptera acutorostrata) respond to Navy training. Journal of the Acoustical Society
of America 137:2533–2541.
Martien, K.K., S.J. Chivers, R.W. Baird, F.I. Archer, A.M. Gorgone, B.L. Hancock-Hanser, D.
Mattila, D.J. McSweeney, E.M. Oleson, C. Palmer, V.L. Pease, K.M. Robertson, G.S.
Schorr, M.B. Schultz, D.L. Webster and B.L. Taylor. 2014. Nuclear and mitochondrial
patterns of population structure in North Pacific false killer whales (Pseudorca
crassidens). Journal of Heredity doi: 10.1093/jhered/esu029.
Moretti, D., L. Thomas, T. Marques, J. Harwood, A. Dilley, F. Neales, J. Shaffer, E. McCarthy, L.
New, S. Jarvis, and R. Morrissey. 2014. A risk function for behavioral disruption of
Blainville’s beaked whales (Mesoplodon densirostris) from mid-frequency active sonar.
PLOS ONE 9(1): e85064/ Doi: 10.1371/journal.pone.0085064.
Schorr, G.S., R.W. Baird, M.B. Hanson, D.L. Webster, D.J. McSweeney, and R.D. Andrews.
2009. Movements of satellite-tagged Blainville’s beaked whales off the island of Hawai‘i.
Endangered Species Research 10:203–213.
Southall, B.L., D.P. Nowacek, P.J.O. Miller, and P.L. Tyack. 2016. Experimental field studies to
measure behavioral responses of cetaceans to sonar. Endangered Species Research
31:293–315.
Van Cise, A.M., K.K. Martien, R.W. Baird, E. Oleson and P.A Morin. 2015. Nuclear SNPs reveal
link between social and genetic structure in Hawaiian short-finned pilot whales. Poster
presented at the 21st Biennial Conference on the Biology of Marine Mammals, San
Francisco, California, December 14-18, 2015.

NAVFAC Pacific | Final Report | Assessing Exposure and Response of Three Species of Odontocetes to Mid-Frequency Active Sonar During Submarine Commanders Courses at the Pacific Missile Range Facility: August 2013 Through February 2015
June 2017 | 34
This page intentionally left blank.