Embed Size (px)
Citation preview

Vožarski pot 12, SI-1000 Ljubljana, Slovenia Phone: +386 1 241 51 00; fax: +386 1 241 53 44; E-mail: [email protected]; www.stat.si
1/96
REPUBLIC OF SLOVENIA
FINAL QUALITY REPORT EU-SILC-2008
Slovenia Report prepared by: Rihard Inglič Rudi Seljak Stanka Intihar Document created: 22/12/2010, Last updated: 03/01/2011

Vožarski pot 12, SI-1000 Ljubljana, Slovenia Phone: +386 1 241 51 00; fax: +386 1 241 53 44; E-mail: [email protected]; www.stat.si
2/96
CONTENTS
1 COMMON LONGITUDINAL EU INDICATORS .................................................................................. 3
1.1 COMMON LONGITUDINAL EUROPEAN UNION INDICATORS BASED ON THE LONGITUDINAL COMPONENT
OF EU-SILC........................................................................................................................................................ 3 1.2 OTHER INDICATORS.............................................................................................................................. 3
1.2.1 Equivalised disposable income ....................................................................................................... 3 1.2.2 The unadjusted gender pay gap....................................................................................................... 4
2 ACCURACY................................................................................................................................................ 4
2.1 SAMPLE DESIGN.................................................................................................................................... 4 2.1.1 Type of sampling design (stratified, multi-stage, clustered)............................................................ 4 2.1.2 Sampling units (one stage, two stages) ........................................................................................... 4 2.1.3 Stratification and substratification criteria..................................................................................... 5 2.1.4 Sample size and allocation criteria ................................................................................................. 5 2.1.5 Sample selection schemes................................................................................................................ 6 2.1.6 Sample distribution over time.......................................................................................................... 7 2.1.7 Renewal of sample: rotational groups ............................................................................................ 7 2.1.8 Weighting ........................................................................................................................................ 8 2.1.9 Substitutions .................................................................................................................................. 11
2.2 SAMPLING ERRORS.............................................................................................................................. 12 2.2.1 Standard error and effective sample size ...................................................................................... 12
2.3 NON-SAMPLING ERRORS..................................................................................................................... 34 2.3.1 Sampling frame and coverage errors ............................................................................................ 34 2.3.2 Measurement and processing errors ............................................................................................. 35 2.3.3 Non-response errors...................................................................................................................... 41
2.4 MODE OF DATA COLLECTION.............................................................................................................. 75 2.5 IMPUTATION PROCEDURE.................................................................................................................... 80 2.6 IMPUTED RENT.................................................................................................................................... 80 2.7 COMPANY CARS.................................................................................................................................. 80
3 COMPARABILITY .................................................................................................................................. 81
3.1 BASIC CONCEPTS AND DEFINITIONS.................................................................................................... 81 3.2 COMPONENTS OF INCOME................................................................................................................... 85
3.2.1 Differences between the national definitions and standard EU-SILC definitions, and an assessment of the consequences of the differences mentioned will be reported for the following target variables ...................................................................................................................................................... 85 3.2.2 The source of procedure used for the collection of income variable............................................. 90 3.2.3 The form in which income variables at component level have been obtained............................... 90 3.2.4 The method used for obtaining income target variables in the required form .............................. 90
3.3 TRACING RULES.................................................................................................................................. 90
4 COHERENCE ........................................................................................................................................... 92
4.1 THE DIFFERENCES BETWEEN HBS AND EU-SILC............................................................................... 92 4.2 THE DIFFERENCES BETWEEN LFS AND EU-SILC................................................................................ 94 4.3 THE DIFFERENCES BETWEEN EU-SILC 2005, 2006, 2007 AND 2008 .................................................. 95

Vožarski pot 12, SI-1000 Ljubljana, Slovenia Phone: +386 1 241 51 00; fax: +386 1 241 53 44; E-mail: [email protected]; www.stat.si
3/96
1 Common longitudinal EU indicators
1.1 Common longitudinal European Union indicators based on the longitudinal component of EU-SILC
EU-SILC was conducted for the first time in 2005, therefore the longitudinal indicators can be calculated for 2008 (based on longitudinal data for 2005-2008). We are still discussing some methodological issues regarding the calculation of persistent at-risk-of-poverty rate with Eurostat, therefore we can not publish our results yet. In the table there are results calculated by Eurostat: Persistent at-risk-of-poverty rate, Slovenia, 2008 GENDER/TIME 2008 Total 7,7 Males 6,3 Females 9,0
Source: Eurostat
1.2 Other indicators
1.2.1 Equivalised disposable income
Total disposable net household income HY020 is the sum for all household members of net (of income tax at source and of social contribu tions) personal income components : + cash or near-cash employee income; PY010N + non-cash employee income (company car only); PY021N + cash profits or losses from self-employment; PY050N + pension from individual private plans; PY080N + unemployment benefits; PY090N + old-age benefits; PY100N + survivors' benefits; PY110N + sickness benefits; PY120N + disability benefits; PY130N + education-related allowances; PY140N net (of income tax at source and of social contribu tions) income components at household level: + income from rental of a property or land; HY040N + family/children-related allowances; HY050N + social exclusion not elsewhere classified; HY060N + housing allowances; HY070N + inter-household cash transfers received; HY080N + interests, dividends, profit from capital investments in unincorporated business; HY090N + income received by people aged under 16; HY110N deductions

Vožarski pot 12, SI-1000 Ljubljana, Slovenia Phone: +386 1 241 51 00; fax: +386 1 241 53 44; E-mail: [email protected]; www.stat.si
4/96
- regular taxes on wealth HY120N - regular inter-household cash transfer paid HY130N - repayment/receipt for tax adjustments on income HY145N Equivalised disposable income is income per equivalent household member. It is calculated by dividing total disposable net household income by the number of equivalent household members. The OECD modified scale is used for the calculation of the income per equivalent member. The scale gives to the first adult in the household weight 1, to every other person 14 or more years old weight 0.5 and to children under 14 weight 0.3. Mean and median equivalised disposable net income ( PY080 included), Slovenia, 2008
EUR PPS
Mean equivalised disposable net income 11709 14817
Median equivalised disposable net income 10893 13784
At-risk-of-poverty threshold (60% of the median equivalised net income) 6536 8271
1.2.2 The unadjusted gender pay gap
Slovenia do not provide the data for gender pay gap from EU-SILC.
2 Accuracy
2.1 Sample design
2.1.1 Type of sampling design (stratified, multi-st age, clustered)
The sample design for Slovenian EU-SILC 2008 was two-stage stratified design. In each stratum primary sampling units (PSUs) were firstly systematically selected, and in the second stage 7 persons were selected in each PSU. We have used rotational design, meaning that three waves were preserved from the previous year and just one wave was additionally selected using the described design.
2.1.2 Sampling units (one stage, two stages)
In the first stage sampling units were selected, which are clusters of enumeration areas, which are approximately of the same size, and then in the second stage 7 persons were selected in the selected PSUs. Unit of observation are selected persons living in private households in Slovenia and their households. The data are collected from all household members who were on 31st December 2007 aged 16 years or more. The selected person is also the sample person; other household members are not sample persons.

Vožarski pot 12, SI-1000 Ljubljana, Slovenia Phone: +386 1 241 51 00; fax: +386 1 241 53 44; E-mail: [email protected]; www.stat.si
5/96
2.1.3 Stratification and substratification criteria
The sampling frame of persons aged 16 years or more is divided into 6 strata, which are defined according to the size of the settlement and the proportion of agricultural households in the settlement: 1. The first stratum includes settlements with fewer then 2.000 inhabitants and with
less then 30% of agricultural households; 2. The second stratum includes settlements with fewer then 2.000 inhabitants and
with at least 30% agricultural households; 3. The third stratum includes settlements which have from 2.000 to 10.000
inhabitants; 4. The fourth stratum includes settlements which have from 10.000 to 80.000
inhabitants; 5. The fifth stratum is Maribor (the second largest city in Slovenia with approx.
93.000 inhabitants); 6. The sixth stratum is Ljubljana (Slovenia’s capital with approx. 250.000 inhabitants). When selecting the sampling units, explicit stratification according to the type of settlement was used (6 strata). Since we wanted to maintain regional representativeness, implicit stratification according to statistical region was applied. It means that the list of units within strata was sorted according to statistical regions. In Slovenia there are 12 statistical (NUTS3) regions: 1. Pomurska 2. Podravska 3. Koroška 4. Savinjska 5. Zasavska 6. Spodnjeposavska 7. Jugovzhodna Slovenija 8. Osrednjeslovenska 9. Gorenjska 10. Notranjsko-kraška 11. Goriška 12. Obalno-kraška
2.1.4 Sample size and allocation criteria
In Eurostat’s document SILC/138/04 Framework Regulation; Annex 2 on Sample Sizes, the minimal net sample size is defined according to different sample design schemes. Since in Slovenia we have a sample of persons, but in the household only the selected person is the sample person who responds to “Social” variables, we have to obtain responses from at least 6750 selected persons and their households. The sampling frame was divided into 6 strata. When we calculated the strata allocation, we took into account the responses rates from the previous year. The

Vožarski pot 12, SI-1000 Ljubljana, Slovenia Phone: +386 1 241 51 00; fax: +386 1 241 53 44; E-mail: [email protected]; www.stat.si
6/96
strata with lower response rates were thus oversampled.. Table 1 shows how the structure alters because of the oversampling of some strata. Table 1: Distribution of the settlements in six str ata according to the number of inhabitants and the proportion of rural households in the settlemen t
Strata, distribution of settlements Population struct ure Altered structure due to oversampling
Fewer then 2000 inhab., not rural 29.5% 29.4% Fewer than 2000 inhab., rural 23.2% 22.5% From 2000 to 10000 inhab. 16.1% 16.5% From 10000 to 80000 inhab. 13.4% 13.4% Maribor 4.7% 4.7% Ljubljana 12.9% 13.4%
The sample size of the new part of the sample was 5407selected persons (households). We kept 7114 households from the previous year. The total sample size in 2008 was thus 12521.
2.1.5 Sample selection schemes
The sampling frame was divided into 6 strata and each stratum was sorted by 12 statistical regions. This way we implicitly stratified the sample also by statistical region. Within each stratum we systematically selected 600 sampling units, and then in each sampling unit 7 persons were selected. Persons aged 16 years were oversampled. In each sampling unit, persons aged 16 years and others were separately selected. a … number of primary sampling units (= 600) b … number of persons, who are selected in PSU (= 7) pi … proportion of persons aged 16 in PSU i b1 … number of persons aged 16 who are selected in PSU i b2 … number of persons aged 17 or more who are selected in PSU i p16… proportion of persons aged 16 in the population
Probability of selection of person aged 16 in PSU I is iii
i
Np
b
N
Na 1.⋅
∑
Probability of selection of person aged 17 or more in PSU i is iii
i
Np
b
N
Na
)1(
. 2
−⋅
∑
Conditions:
iii
i
iii
i
Np
b
N
aNp
Np
b
N
Na
)1()1(
. 216
1
−⋅⋅+=⋅
∑∑,
21 bbb +=
We obtain a uniquely solvable system of two linear equations with two unknowns. Thus in the selected sampling unit i we select:
)1(
)1( 161
i
i
p
bppb
+⋅+
= 16-years olds and

Vožarski pot 12, SI-1000 Ljubljana, Slovenia Phone: +386 1 241 51 00; fax: +386 1 241 53 44; E-mail: [email protected]; www.stat.si
7/96
)1(
)014.01(2
i
i
p
bpb
+⋅−= persons, aged 17 or more.
Beacause of decimal number of selected persons in PSU (b1, b2), size of PSUs is between 6 and 8.
2.1.6 Sample distribution over time
Every year interviewing lasted from 1st February until 15th June. Table 2 Number of succesful interviews by month of interview
Year 2005
Year 2006
Year 2007
Year 2008
February 240 2822 3827 3369 Mach 645 1648 2329 1672 April 653 409 414 211 May 919 197 227 265 June 302 2 86 92
Source:EU-SILC longitudinal database 2005-2008
2.1.7 Renewal of sample: rotational groups
The sample has a four-year rotational design. Persons and their households remain in the sample for four years or four waves; each year one quarter of the sample is replaced. One quarter of the sample is dropped and one quarter is added each year. Each quarter of the sample is called a rotational group and has to be representative for the target population. In 2006 we should have dropped out the fourth wave from 2005, but we have decided to keep the fourth wave and divide it into three parts and reallocate them to the remaining three waves form 2005. Therefore all households which responded in 2005 were in 2006 interviewed again. Since we have decided this before data processing of the 2005 survey, we have renumbered initially selected sampling units in the way that we have instead of four three rotational groups. None of the rotational groups were dropped out in 2005. In 2006 only one new rotational group was added, so that we have four rotational groups in 2006. Table 3: Number of PSU and number of selected perso ns
Year DB075 PSU Number of selected persons
2005 3 643 4492 2006 3 630 2759 2006 4 600 4201 2007 3 652 2264 2007 4 615 2882 2007 5 643 4481 2008 3 651 1859 2008 4 658 2264 2008 5 704 2952
Source: EU-SILC longitudinal database 2005-08

Vožarski pot 12, SI-1000 Ljubljana, Slovenia Phone: +386 1 241 51 00; fax: +386 1 241 53 44; E-mail: [email protected]; www.stat.si
8/96
Rotational design 2005-2008 DB075 DB075 DB075 DB075 DB075 DB075 2005 2006 2007 2008
2.1.8 Weighting
The crossectional weights for the first wave were calculated differently as those for the consecutive waves.
2.1.8.1 Cross-sectional weights for the first wave The weights were calculated in three consecutive steps. In the first step the sampling weight (design factor), in the second the non-response adjustment factor and in the third the calibration factor was calculated. The final weight was the product of all three factors. The weights were calculated for the selected household (selected person of the household) and for all the persons included in the survey. In EU-SILC the sample of persons aged 16 years or more was selected from the Central Register of Population. Sample persons and their households were interviewed.
2.1.8.1.1 Design factor The sampling weight for the sample person PB070 is inversely proportional to the probability of selection and the weight is calculated when the person is selected in the sample. For the persons that were in the sample also in the previous year, the sampling weight is taken from the previous year, yet the sampling weights are to be calculated just for the persons that are new in the sample. Since the PPS 2-stage
1
2
3
4
1
2
3
5
2
3
4
3
4
5
6

Vožarski pot 12, SI-1000 Ljubljana, Slovenia Phone: +386 1 241 51 00; fax: +386 1 241 53 44; E-mail: [email protected]; www.stat.si
9/96
sampling was used, the sampling weight for the selected person in the particular
stratum ( h ), can simple be calculated ash
hh n
Nw = , where hN is the stratum numbers
of the persons in the sampling frame and hn is the stratum numbers of the persons in the sample. The sampling weight of the household of the selected person: DB080 Since SORS doesn’t yet have a register of households, the selection of the household is done with the selection of the person. Since households with more persons aged 16 years or more have a larger probability of selection then smaller households, this has to be corrected with weighting in such a way that all households have equal probability of being selected in the sample. Thus the probability of selection of the household is equal to the probability of selection of the person divided by the number of eligible persons (aged 16+) in the household M:
DB080=PB070 / Mh
The sampling weight for the households has to be calculated for all households in the sample, not only for the responding households. Since for the households that did not respond we do not know their size, we have calculated the average size of the household of persons aged 16 or more according to different statistical regions and type of settlement (47 classes) and we imputed this value to households that did not respond. Thus we could calculate the probability of selection also for households that did not respond.
2.1.8.1.2 Non-response adjustments The non-response factor was calculated for each stratum. First the sample was divided into three categories: responses, non-responses and out-of-scope units. The
non-response adjustment factor is calculated: rh
nrh
rh
NRn
nnw
+= , where r
hn is the
number of the responses in the stratum and nrhn number of the non- responses in the
stratum.
2.1.8.1.3 Adjustments to external data (level, variables used and sources)
The final step of the calculation of the weights was the calculation of the calibration factors. By the calibration procedures the weighted sums of some key variables are set to the known population values. These population values are obtained from the different administrative sources. For the calibration of weights we used SAS Macro Calmar. We performed calibration for the level of households, as well as for the level of the persons. For the calibration we used: 1. for households:
Vožarski pot 12, SI-1000 Ljubljana, Slovenia Phone: +386 1 241 51 00; fax: +386 1 241 53 44; E-mail: [email protected]; www.stat.si
10/96
- Family and children related allowance (HY050) from the administrative source for family and children related allowances
2. for persons: - Sex- age classes distribution from the Central Register of Population - Employee cash or near cash income minus sickness benefits from the
administrative source for incomes - Pensions from the administrative sources for pensions - Unemployment benefits (PY090) from the administrative source for
unemployment benefits - Education related allowances from the statistical source about scholarships
2.1.8.1.4 Final cross-sectional weights The cross-sectional weight for the household (DB090) is equal to the calibrated weight. The sum of weights is equal to the sum of the estimated number of households in Slovenia. With the selected person also the household which has to be interviewed is defined. All household members have the same weight, this is the cross-sectional weight. The cross-sectional weight of the person RB050, which all persons get in the household register, and the cross-sectional weight of persons aged 16 years or more PB040 in the person register are equal to the cross-sectional weight of the household.
RB050= PB040=DB090
The cross-sectional weight for the selected person PB060 is equal to the cross-sectional weight of the household of this person multiplied by the number of persons aged 16+:
PB060= DB090 * Mh
The cross-sectional weight for children who were younger than 13 years on 31st December 2005 is RL070. Weights are calculated in this way that we calculate for each age group a factor:
fi =number of children in the population/weighted number of children in the survey, i=1,2,…,12.
With this factor we multiply the cross-sectional weight RB050 of a child in the corresponding age group.
RL070=fi*RB050 , i=1,2,…,12
The base weights for the persons in the first wave are equal to the cross-sectional weights for the persons.

Vožarski pot 12, SI-1000 Ljubljana, Slovenia Phone: +386 1 241 51 00; fax: +386 1 241 53 44; E-mail: [email protected]; www.stat.si
11/96
2.1.8.2 Cross-sectional weights for the consecutive waves
2.1.8.2.1 Base weights The Base weights for the persons were calculated by taking the base weights from the previous year and then adjust these weights for the attrition in the Sex- age classes. Using the weight-share method we then calculated the weights for the immigrants, re-entries and newborns. After that for each of the rotational groups the weights were adjusted to the adequate longitudinal population counts in each Sex- age class.
2.1.8.2.2 Final cross-sectional weights The cross-sectional weights for the households were calculated by firstly taking the average of the base weights for the belonging persons and then calibrate these weights for each rotational group to the same margin values as used in 2.8.1.3. The cross-sectional weights for the persons and selected persons were calculated by the same procedure as used for the first wave.
2.1.8.3 Longitudinal weights The longitudinal weights were calculated by taking the base weights and then calibrate these weights to the Sex-age structure of the corresponding longitudinal population which was determined as the overlap of the register population in the consecutive years.
2.1.9 Substitutions
In EU-SILC we did not have substitute units.

Vožarski pot 12, SI-1000 Ljubljana, Slovenia Phone: +386 1 241 51 00; fax: +386 1 241 53 44; E-mail: [email protected]; www.stat.si
12/96
2.2 Sampling errors
2.2.1 Standard error and effective sample size
Table 4: The mean, the total number of observations (before and after imputations) and the standard errors, household level, 2008
Income components Description
Mean (weighted)
Number of observations before imputations(in the survey with value not equal 0 before imputatoins)
Number of observations after imputations (in the survey)
Standard errors
HY010 Total gross household income 27457 9010 9028 265
HY020 Total disposable household income 21105 9020 9028 171
HY022
Total disposable household income before social transfers except old age and survivor's benefits 18966 8969 8999 172
HY023
Total disposable household income before social transfers including old-age and survivor's benefits 14978 8737 8897 182
HY040G
Income from rental of a property or land – gross 2004 571 571 197
HY040N Income from rental of a property or land 1513 571 571 149
HY050G Family/Children related allowances 1921 3844 3844 59
HY050N Family/Children related allowances 1602 3840 3840 40
HY060G Social exclusion not elsewhere classified 1453 1006 1033 59

Vožarski pot 12, SI-1000 Ljubljana, Slovenia Phone: +386 1 241 51 00; fax: +386 1 241 53 44; E-mail: [email protected]; www.stat.si
13/96
Income components Description
Mean (weighted)
Number of observations before imputations(in the survey with value not equal 0 before imputatoins)
Number of observations after imputations (in the survey)
Standard errors
HY060N Social exclusion not elsewhere classified 1449 1006 1033 59
HY070G Housing allowances 964 49 49 126
HY070N Housing allowances 964 49 49 126
HY080G
Regular inter – household cash transfer received gross 1599 238 264 104
HY080N
Regular inter – household cash transfer received net 1599 238 264 104
HY090G
Interests, dividends, profit from capital investments in unincorporated business 599 3130 3365 45
HY090N
Interests, dividends, profit from capital investments in unincorporated business 509 3130 3365 37
HY100G Interest repayments on mortgage gross 3428 134 418 170
HY100N Interest repayments on mortgage net 3428 134 418 170
HY110G
Income received by people aged under 16 gross 1718 118 118 247
HY110N
Income received by people aged under 16 net 1713 118 118 247
HY120G Regular taxes on wealth gross 79 5631 7726 2
HY120N Regular taxes on wealth net 79 5631 7726 2
HY130G
Regular inter – household cash transfer paid – gross 1464 451 503 62
HY130N
Regular inter – household cash transfer paid – net 1464 451 503 62

Vožarski pot 12, SI-1000 Ljubljana, Slovenia Phone: +386 1 241 51 00; fax: +386 1 241 53 44; E-mail: [email protected]; www.stat.si
14/96
Income components Description
Mean (weighted)
Number of observations before imputations(in the survey with value not equal 0 before imputatoins)
Number of observations after imputations (in the survey)
Standard errors
HY140G tax on income and social contribution 7557 7773 7812 115
HY140N tax on income and social contribution 7557 7773 7812 115
HY145N
Repayments/receipts for tax adjustment
-118 7404 7404 9 Source: Cross sectional database 2008 Table 5: The mean, the total number of observations (before and after imputations) and the standard errors, personal level, 2008 Variable Description Mean
(weighted) Number of observations before imputations (in the survey with value not equal 0)
Number of observations after imputations (in the survey)
Standard errors
PY010G
Employee cash or near cash income gross 13007 15194 15680 119
PY010N
Employee cash or near cash income net 9094 15194 15680 69
PY020G
Non-Cash employee income net 430 2349 2561 27
PY020N
Non-Cash employee income net 369 2349 2561 23
PY035G
Contributions to individual private pensions plans gross 457 3723 5337 8
PY035N
Contributions to individual private pensions plans gross 457 3723 5337 8
PY050G
Cash benefits or losses from self-employment 4883 2891 3513 205
PY050N
Cash benefits or losses from self-employment 4052 2891 3513 152

Vožarski pot 12, SI-1000 Ljubljana, Slovenia Phone: +386 1 241 51 00; fax: +386 1 241 53 44; E-mail: [email protected]; www.stat.si
15/96
Variable Description Mean (weighted)
Number of observations before imputations (in the survey with value not equal 0)
Number of observations after imputations (in the survey)
Standard errors
PY070G
Value of goods produced by own consumption 275 7406 15600 6
PY070N
Value of goods produced by own consumption 275 7406 15600 6
PY080G
Pension from individual private plans gross 352 149 176 35
PY080N
Pension from individual private plans net 352 149 176 35
PY090G Unemployment benefits gross 2471 486 486 110
PY090N Unemployment benefits net 1817 486 486 79
PY100G Old age benefits gross 7669 4620 4682 76
PY100N Old age benefits net 7620 4620 4682 73
PY110G Survivor benefits net 5522 849 851 120
PY110N Survivor' age benefits gross 5520 849 851 120
PY120G Sickness benefits gross 1477 2789 3116 45
PY120N Sickness benefits net 998 2789 3116 30
PY130G Disability benefits gross 5434 1740 1742 85
PY130N Disability benefits net 5378 1740 1742 85
PY140G
Education related allowances gross 1617 1280 1280 27
PY140N
Education related allowances net 1617 1280 1280 27
Source: Cross sectional database 2008 Table 6: The mean, the total number of observations (before and after imputations) and the standard errors, household level, 2005, only househ olds included into the longitudinal database

Vožarski pot 12, SI-1000 Ljubljana, Slovenia Phone: +386 1 241 51 00; fax: +386 1 241 53 44; E-mail: [email protected]; www.stat.si
16/96
Income components
Description Mean (weighted)
Number of observations before imputations (in the survey with value not equal 0 before imputatoins)
Number of observations after imputations (in the survey)
Standard errors
HY010
Total gross household income
22709 2759 2759 394
HY020
Total disposable household income
17255 2759 2759 251
HY022
Total disposable household income before social transfers except old age and survivor's benefits
15213 2744 2744 248
HY023
Total disposable household income before social transfers including old-age and survivor's benefits
12070 2694 2694 258
HY040G
Income from rental of a property or land – gross 1305 142 142 221
HY040N
Income from rental of a property or land
988 142 142 167
HY050G
Family/Children related allowances
1554 1264 1264 79
HY050N
Family/Children related allowances
1362 1264 1264 56
HY060G
Social exclusion not elsewhere classified
1572 462 462 79
HY060N
Social exclusion not elsewhere classified
1572 462 462 79
HY070G Housing allowances
334 1 1 0
HY070N Housing allowances
334 1 1 0
HY080G
Regular inter – household cash transfer received gross 1653 91 91 189

Vožarski pot 12, SI-1000 Ljubljana, Slovenia Phone: +386 1 241 51 00; fax: +386 1 241 53 44; E-mail: [email protected]; www.stat.si
17/96
Income components
Description Mean (weighted)
Number of observations before imputations (in the survey with value not equal 0 before imputatoins)
Number of observations after imputations (in the survey)
Standard errors
HY080N
Regular inter – household cash transfer received net
1653 91 91 189
HY090G
Interests, dividends, profit from capital investments in unincorporated business
512 857 857 87
HY090N
Interests, dividends, profit from capital investments in unincorporated business
356 857 857 58
HY100G
Interest repayments on mortgage gross
1450 57 57 200
HY100N
Interest repayments on mortgage net
1450 57 57 200
HY110G
Income received by people aged under 16 gross 807 111 111 257
HY110N
Income received by people aged under 16 net 658 111 111 197
HY120G Regular taxes on wealth gross 58 2287 2287 2
HY120N Regular taxes on wealth net 58 2287 2287 2
HY130G
Regular inter – household cash transfer paid – gross
1426 180 180 139
HY130N
Regular inter – household cash transfer paid – net 1426 180 180 139
HY140G tax on income and social contribution 7339 2230 2233 188
HY140N tax on income and social contribution 7339 2230 2233 188
HY145N
Repayments/receipts for tax adjustment
-187 2227 2227 19 Source: Longitudinal database 2005-2008
Vožarski pot 12, SI-1000 Ljubljana, Slovenia Phone: +386 1 241 51 00; fax: +386 1 241 53 44; E-mail: [email protected]; www.stat.si
18/96
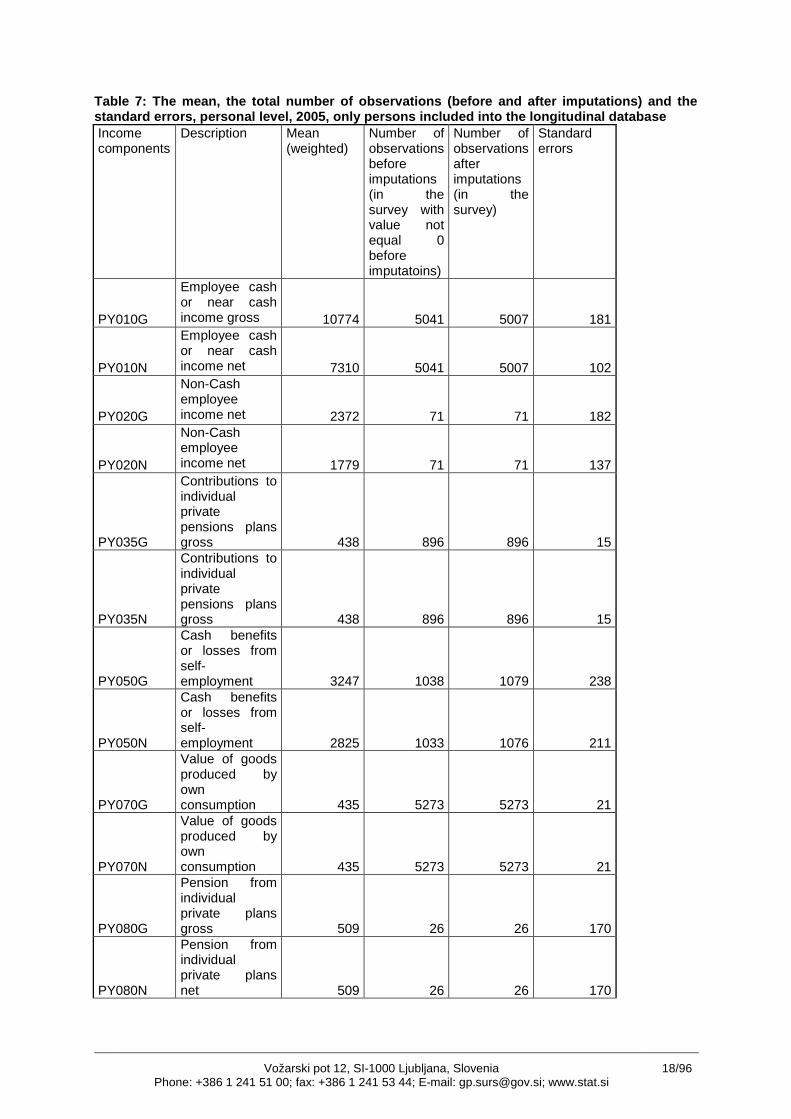
Table 7: The mean, the total number of observations (before and after imputations) and the standard errors, personal level, 2005, only persons included into the longitudinal database Income components
Description Mean (weighted)
Number of observations before imputations (in the survey with value not equal 0 before imputatoins)
Number of observations after imputations (in the survey)
Standard errors
PY010G
Employee cash or near cash income gross 10774 5041 5007 181
PY010N
Employee cash or near cash income net 7310 5041 5007 102
PY020G
Non-Cash employee income net 2372 71 71 182
PY020N
Non-Cash employee income net 1779 71 71 137
PY035G
Contributions to individual private pensions plans gross 438 896 896 15
PY035N
Contributions to individual private pensions plans gross 438 896 896 15
PY050G
Cash benefits or losses from self-employment 3247 1038 1079 238
PY050N
Cash benefits or losses from self-employment 2825 1033 1076 211
PY070G
Value of goods produced by own consumption 435 5273 5273 21
PY070N
Value of goods produced by own consumption 435 5273 5273 21
PY080G
Pension from individual private plans gross 509 26 26 170
PY080N
Pension from individual private plans net 509 26 26 170

Vožarski pot 12, SI-1000 Ljubljana, Slovenia Phone: +386 1 241 51 00; fax: +386 1 241 53 44; E-mail: [email protected]; www.stat.si
19/96
Income components
Description Mean (weighted)
Number of observations before imputations (in the survey with value not equal 0 before imputatoins)
Number of observations after imputations (in the survey)
Standard errors
PY090G Unemployment benefits gross 1798 210 210 121
PY090N Unemployment benefits net 1255 210 210 84
PY100G Old age benefits gross 6286 1410 1413 108
PY100N Old age benefits net 6242 1410 1410 103
PY110G Survivor benefits net 4938 259 259 165
PY110N Survivor' age benefits gross 4932 259 259 166
PY120G Sickness benefits gross 1426 719 719 88
PY120N Sickness benefits net 958 719 719 59
PY130G Disability benefits gross 5300 592 592 137
PY130N Disability benefits net 5017 592 592 138
PY140G
Education related allowances gross 1431 470 470 36
PY140N
Education related allowances net 1431 470 470 36
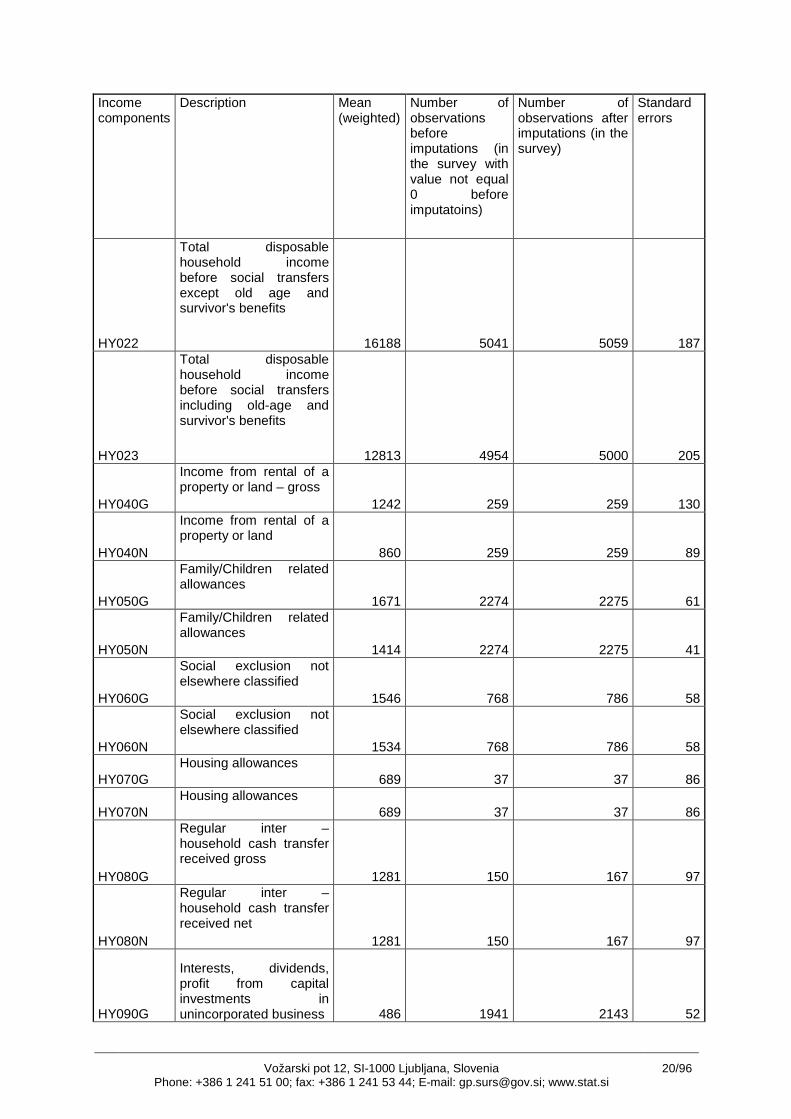
Source: Longitudinal database 2005-2008 Table 8: The mean, the total number of observations (before and after imputations) and the standard errors, household level, 2006, only househ olds included into the longitudinal database Income components
Description Mean (weighted)
Number of observations before imputations (in the survey with value not equal 0 before imputatoins)
Number of observations after imputations (in the survey)
Standard errors
HY010
Total gross household income
23613 5060 5078 298
HY020
Total disposable household income
18093 5068 5078 190
Vožarski pot 12, SI-1000 Ljubljana, Slovenia Phone: +386 1 241 51 00; fax: +386 1 241 53 44; E-mail: [email protected]; www.stat.si
20/96
Income components
Description Mean (weighted)
Number of observations before imputations (in the survey with value not equal 0 before imputatoins)
Number of observations after imputations (in the survey)
Standard errors
HY022
Total disposable household income before social transfers except old age and survivor's benefits
16188 5041 5059 187
HY023
Total disposable household income before social transfers including old-age and survivor's benefits
12813 4954 5000 205
HY040G
Income from rental of a property or land – gross
1242 259 259 130
HY040N
Income from rental of a property or land
860 259 259 89
HY050G
Family/Children related allowances
1671 2274 2275 61
HY050N
Family/Children related allowances
1414 2274 2275 41
HY060G
Social exclusion not elsewhere classified
1546 768 786 58
HY060N
Social exclusion not elsewhere classified
1534 768 786 58
HY070G Housing allowances
689 37 37 86
HY070N Housing allowances
689 37 37 86
HY080G
Regular inter – household cash transfer received gross
1281 150 167 97
HY080N
Regular inter – household cash transfer received net
1281 150 167 97
HY090G
Interests, dividends, profit from capital investments in unincorporated business 486 1941 2143 52

Vožarski pot 12, SI-1000 Ljubljana, Slovenia Phone: +386 1 241 51 00; fax: +386 1 241 53 44; E-mail: [email protected]; www.stat.si
21/96
Income components
Description Mean (weighted)
Number of observations before imputations (in the survey with value not equal 0 before imputatoins)
Number of observations after imputations (in the survey)
Standard errors
HY090N
Interests, dividends, profit from capital investments in unincorporated business 393 1941 2143 41
HY100G
Interest repayments on mortgage gross
2462 24 138 264
HY100N
Interest repayments on mortgage net
2462 24 138 264
HY110G
Income received by people aged under 16 gross 2046 52 52 300
HY110N
Income received by people aged under 16 net 2039 52 52 301
HY120G Regular taxes on wealth gross 64 3483 4249 2
HY120N Regular taxes on wealth net 64 3483 4249 2
HY130G
Regular inter – household cash transfer paid – gross
1369 254 268 98
HY130N
Regular inter – household cash transfer paid - net 1369 254 268 98
HY140G tax on income and social contribution 6069 4663 4732 127
HY140N tax on income and social contribution 6069 4663 4732 127
HY145N
Repayments/receipts for tax adjustment
-267 4656 4657 10 Source: Longitudinal database 2005-2008

Vožarski pot 12, SI-1000 Ljubljana, Slovenia Phone: +386 1 241 51 00; fax: +386 1 241 53 44; E-mail: [email protected]; www.stat.si
22/96
Table 9: The mean, the total number of observations (before and after imputations) and the standard errors, personal level, 2006, only persons included into the longitudinal database Income components
Description Mean (weighted)
Number of observations before imputations (in the survey with value not equal 0 before imputatoins)
Number of observations after imputations (in the survey)
Standard errors
PY010G
Employee cash or near cash income gross 11663 8436 8778 139
PY010N
Employee cash or near cash income net 7985 8436 8778 77
PY020G
Non-Cash employee income net 1813 94 113 172
PY020N
Non-Cash employee income net 1359 94 113 129
PY035G
Contributions to individual private pensions plans gross 509 1313 1716 22
PY035N
Contributions to individual private pensions plans gross 509 1313 1716 22
PY050G
Cash benefits or losses from self-employment 3943 1503 2229 202
PY050N
Cash benefits or losses from self-employment 3240 1503 2229 150
PY070G
Value of goods produced by own consumption 314 5172 8663 9
PY070N
Value of goods produced by own consumption 314 5172 8663 9
PY080G
Pension from individual private plans gross 828 30 37 181
PY080N
Pension from individual private plans net 828 30 37 181

Vožarski pot 12, SI-1000 Ljubljana, Slovenia Phone: +386 1 241 51 00; fax: +386 1 241 53 44; E-mail: [email protected]; www.stat.si
23/96
Income components
Description Mean (weighted)
Number of observations before imputations (in the survey with value not equal 0 before imputatoins)
Number of observations after imputations (in the survey)
Standard errors
PY090G Unemployment benefits gross 2096 342 342 101
PY090N Unemployment benefits net 1531 342 342 72
PY100G Old age benefits gross 6622 2466 2484 76
PY100N Old age benefits net 6561 2466 2484 72
PY110G Survivor benefits net 5269 508 510 121
PY110N Survivor' age benefits gross 5267 508 510 121
PY120G Sickness benefits gross 1342 1154 1284 63
PY120N Sickness benefits net 905 1154 1284 42
PY130G Disability benefits gross 4945 1011 1019 90
PY130N Disability benefits net 4900 1011 1018 91
PY140G
Education related allowances gross 1430 782 782 24
PY140N
Education related allowances net 1430 782 782 24
Source: Longitudinal database 2005-2008 Table 10: The mean, the total number of observation s (before and after imputations) and the standard errors, household level, 2007, only househ olds included into the longitudinal database Income components
Description Mean (weighted)
Number of observations before imputations (in the survey with value not equal 0 before imputatoins)
Number of observations after imputations (in the survey)
Standard errors
HY010
Total gross household income
25409 6869 6883 276
HY020
Total disposable household income
19464 6875 6883 177

Vožarski pot 12, SI-1000 Ljubljana, Slovenia Phone: +386 1 241 51 00; fax: +386 1 241 53 44; E-mail: [email protected]; www.stat.si
24/96
Income components
Description Mean (weighted)
Number of observations before imputations (in the survey with value not equal 0 before imputatoins)
Number of observations after imputations (in the survey)
Standard errors
HY022
Total disposable household income before social transfers except old age and survivor's benefits
17410 6837 6857 180
HY023
Total disposable household income before social transfers including old-age and survivor's benefits
13631 6710 6804 189
HY040G
Income from rental of a property or land – gross 2420 329 329 325
HY040N
Income from rental of a property or land
1824 329 329 244
HY050G
Family/Children related allowances
1781 2998 2994 62
HY050N
Family/Children related allowances
1518 2996 2992 43
HY060G
Social exclusion not elsewhere classified
1517 960 991 63
HY060N
Social exclusion not elsewhere classified
1506 960 991 63
HY070G Housing allowances
897 34 34 118
HY070N Housing allowances
897 34 34 118
HY080G
Regular inter – household cash transfer received gross 1525 177 205 119
HY080N
Regular inter – household cash transfer received net
1525 177 205 119

Vožarski pot 12, SI-1000 Ljubljana, Slovenia Phone: +386 1 241 51 00; fax: +386 1 241 53 44; E-mail: [email protected]; www.stat.si
25/96
Income components
Description Mean (weighted)
Number of observations before imputations (in the survey with value not equal 0 before imputatoins)
Number of observations after imputations (in the survey)
Standard errors
HY090G
Interests, dividends, profit from capital investments in unincorporated business
348 2104 2439 38
HY090N
Interests, dividends, profit from capital investments in unincorporated business
297 2104 2439 31
HY100G
Interest repayments on mortgage gross
2784 65 255 248
HY100N
Interest repayments on mortgage net
2784 65 255 248
HY110G
Income received by people aged under 16 gross 1640 81 81 201
HY110N
Income received by people aged under 16 net 1636 81 81 201
HY120G Regular taxes on wealth gross 67 4789 6028 2
HY120N Regular taxes on wealth net 67 4789 6028 2
HY130G
Regular inter – household cash transfer paid – gross
1197 364 396 56
HY130N
Regular inter – household cash transfer paid - net 1197 364 396 56
HY140G tax on income and social contribution 6828 6166 6204 116
HY140N tax on income and social contribution 6828 6166 6204 116
HY145N
Repayments/receipts for tax adjustment
-284 6015 6015 10 Source: Longitudinal database 2005-2008

Vožarski pot 12, SI-1000 Ljubljana, Slovenia Phone: +386 1 241 51 00; fax: +386 1 241 53 44; E-mail: [email protected]; www.stat.si
26/96
Table 11: The mean, the total number of observation s (before and after imputations) and the standard errors, personal level, 2007, only persons included into the longitudinal database Income components
Description Mean (weighted)
Number of observations before imputations (in the survey with value not equal 0 before imputatoins)
Number of observations after imputations (in the survey)
Standard errors
PY010G
Employee cash or near cash income gross 12406 11499 11836 125
PY010N
Employee cash or near cash income net 8524 11499 11836 71
PY020G
Non-Cash employee income net 346 1919 2011 27
PY020N
Non-Cash employee income net 310 1919 2011 24
PY035G
Contributions to individual private pensions plans gross 441 2771 3763 9
PY035N
Contributions to individual private pensions plans gross 441 2771 3763 9
PY050G
Cash benefits or losses from self-employment 3954 1957 3044 195
PY050N
Cash benefits or losses from self-employment 3177 1957 3044 137
PY070G
Value of goods produced by own consumption 301 5344 11467 8
PY070N
Value of goods produced by own consumption 301 5344 11467 8
PY080G
Pension from individual private plans gross 500 121 136 45
PY080N
Pension from individual private plans net 500 121 136 45

Vožarski pot 12, SI-1000 Ljubljana, Slovenia Phone: +386 1 241 51 00; fax: +386 1 241 53 44; E-mail: [email protected]; www.stat.si
27/96
Income components
Description Mean (weighted)
Number of observations before imputations (in the survey with value not equal 0 before imputatoins)
Number of observations after imputations (in the survey)
Standard errors
PY090G Unemployment benefits gross 2276 456 456 93
PY090N Unemployment benefits net 1669 456 456 67
PY100G Old age benefits gross 7205 3540 3587 85
PY100N Old age benefits net 7113 3540 3587 77
PY110G Survivor benefits net 5314 672 675 120
PY110N Survivor' age benefits gross 5308 672 675 119
PY120G Sickness benefits gross 1346 1888 2081 52
PY120N Sickness benefits net 900 1888 2081 34
PY130G Disability benefits gross 5184 1379 1382 88
PY130N Disability benefits net 5132 1379 1382 88
PY140G
Education related allowances gross 1585 1019 1019 26
PY140N
Education related allowances net 1585 1019 1019 26
Source: Longitudinal database 2005-2008 Table 12: The mean, the total number of observation s (before and after imputations) and the standard errors, household level, 2008, only househ olds included into the longitudinal database Income components
Description Mean (weighted)
Number of observations before imputations (in the survey with value not equal 0 before imputatoins)
Number of observations after imputations (in the survey)
Standard errors
HY010
Total gross household income
27460 5602 5609 319
HY020
Total disposable household income
21117 5606 5609 207

Vožarski pot 12, SI-1000 Ljubljana, Slovenia Phone: +386 1 241 51 00; fax: +386 1 241 53 44; E-mail: [email protected]; www.stat.si
28/96
Income components
Description Mean (weighted)
Number of observations before imputations (in the survey with value not equal 0 before imputatoins)
Number of observations after imputations (in the survey)
Standard errors
HY022
Total disposable household income before social transfers except old age and survivor's benefits
18996 5577 5595 208
HY023
Total disposable household income before social transfers including old-age and survivor's benefits
14965 5417 5537 220
HY040G
Income from rental of a property or land – gross 1982 363 363 228
HY040N
Income from rental of a property or land
1488 363 363 171
HY050G
Family/Children related allowances
1916 2383 2383 74
HY050N
Family/Children related allowances
1599 2382 2382 50
HY060G
Social exclusion not elsewhere classified
1471 598 619 77
HY060N
Social exclusion not elsewhere classified
1466 598 619 77
HY070G Housing allowances
940 32 32 135
HY070N Housing allowances
940 32 32 135
HY080G
Regular inter – household cash transfer received gross 1645 149 170 134
HY080N
Regular inter – household cash transfer received net
1645 149 170 134

Vožarski pot 12, SI-1000 Ljubljana, Slovenia Phone: +386 1 241 51 00; fax: +386 1 241 53 44; E-mail: [email protected]; www.stat.si
29/96
Income components
Description Mean (weighted)
Number of observations before imputations (in the survey with value not equal 0 before imputatoins)
Number of observations after imputations (in the survey)
Standard errors
HY090G
Interests, dividends, profit from capital investments in unincorporated business
590 2014 2212 55
HY090N
Interests, dividends, profit from capital investments in unincorporated business
504 2014 2212 45
HY100G
Interest repayments on mortgage gross
3198 70 273 201
HY100N
Interest repayments on mortgage net
3198 70 273 201
HY110G
Income received by people aged under 16 gross 1770 77 77 303
HY110N
Income received by people aged under 16 net 1765 77 77 303
HY120G Regular taxes on wealth gross 84 3174 4829 3
HY120N Regular taxes on wealth net 84 3174 4829 3
HY130G
Regular inter – household cash transfer paid – gross
1453 310 354 73
HY130N
Regular inter – household cash transfer paid - net 1453 310 354 73
HY140G tax on income and social contribution 7506 4879 4900 136
HY140N tax on income and social contribution 7506 4879 4900 136
HY145N
Repayments/receipts for tax adjustment
-120 4642 4642 11 Source: Longitudinal database 2005-2008

Vožarski pot 12, SI-1000 Ljubljana, Slovenia Phone: +386 1 241 51 00; fax: +386 1 241 53 44; E-mail: [email protected]; www.stat.si
30/96
Table 13: The mean, the total number of observation s (before and after imputations) and the standard errors, personal level, 2007, only persons included into the longitudinal database Income components
Description Mean (weighted)
Number of observations before imputations (in the survey with value not equal 0 before imputatoins)
Number of observations after imputations (in the survey)
Standard errors
PY010G
Employee cash or near cash income gross 12966 9510 9876 143
PY010N
Employee cash or near cash income net 9069 9510 9876 83
PY020G
Non-Cash employee income net 439 1455 1612 33
PY020N
Non-Cash employee income net 373 1455 1612 27
PY035G
Contributions to individual private pensions plans gross 447 2448 3779 9
PY035N
Contributions to individual private pensions plans gross 447 2448 3779 9
PY050G
Cash benefits or losses from self-employment 4937 1772 2222 253
PY050N
Cash benefits or losses from self-employment 4090 1772 2222 187
PY070G
Value of goods produced by own consumption 274 2089 10552 8
PY070N
Value of goods produced by own consumption 274 2089 10552 8
PY080G
Pension from individual private plans gross 347 112 136 39
PY080N
Pension from individual private plans net 347 112 136 39

Vožarski pot 12, SI-1000 Ljubljana, Slovenia Phone: +386 1 241 51 00; fax: +386 1 241 53 44; E-mail: [email protected]; www.stat.si
31/96
Income components
Description Mean (weighted)
Number of observations before imputations (in the survey with value not equal 0 before imputatoins)
Number of observations after imputations (in the survey)
Standard errors
PY090G Unemployment benefits gross 2486 299 299 138
PY090N Unemployment benefits net 1828 299 299 99
PY100G Old age benefits gross 7706 2949 2985 91
PY100N Old age benefits net 7655 2949 2985 88
PY110G Survivor benefits net 5578 539 539 147
PY110N Survivor' age benefits gross 5575 539 539 147
PY120G Sickness benefits gross 1411 1766 2044 52
PY120N Sickness benefits net 953 1766 2044 34
PY130G Disability benefits gross 5375 1063 1065 106
PY130N Disability benefits net 5318 1063 1065 106
PY140G
Education related allowances gross 1617 778 778 34
PY140N
Education related allowances net 1617 778 778 34
Source: Longitudinal database 2005-2008

Vožarski pot 12, SI-1000 Ljubljana, Slovenia Phone: +386 1 241 51 00; fax: +386 1 241 53 44; E-mail: [email protected]; www.stat.si
32/96
Table 14: The mean, the number of observations (bef ore and after imputations) and the standard error for the equivalised disposable incom e breakdown by sex, age groups and household size, 2007: Equivalised disposable income Mean Number of
observations after imputations
Standard error
Total 11706 28958 70
1 household member 8423 924 201
2 household members 11335 4352 130
3 household members 12566 6333 147 4 and more household members
11927 17349 94
<25 years 11504 8333 93
25-34 12557 4115 118
35-44 11852 3973 134
45-54 12210 5058 115
55-64 12139 3441 150
65+ 10292 4038 117
Male 11900 14273 78
Female 11519 14685 72 Source:Cross sectional database 2008
Table 15: The mean, the number of observations (bef ore and after imputations) and the standard error for the equivalised disposable incom e breakdown by sex, age groups and household size, 2005 only for units included into l ongitudinal database: Equivalised disposable income Mean Number of
observations after imputations
Standard error
Total 9468 9174 105
1 household member 6624 260 257
2 household members 9218 1172 199
3 household members 10284 1896 228
4 and more household members 9606 5846 134
<25 years 9081 2280 143
25-34 10165 1507 165
35-44 9472 1144 176
45-54 9798 1625 166
55-64 10292 1204 257
65+ 8526 1414 155
Male 9648 4550 115
Female 9296 4624 109 Source: Longitudinal database 2005-2008

Vožarski pot 12, SI-1000 Ljubljana, Slovenia Phone: +386 1 241 51 00; fax: +386 1 241 53 44; E-mail: [email protected]; www.stat.si
33/96
Table 16: The mean, the number of observations (bef ore and after imputations) and the standard error for the equivalised disposable incom e breakdown by sex, age groups and household size, 2006 only for units included into l ongitudinal database: Equivalised disposable income Mean Number of
observations after imputations
Standard error
Total 9979 16699 77
1 household member 7160 471 209
2 household members 9802 2198 149
3 household members 10878 3702 155
4 and more household members 10047 10328 103
<25 years 9555 4416 105
25-34 10760 2585 132
35-44 10077 2256 143
45-54 10548 2902 123
55-64 10628 2108 163
65+ 8908 2432 114
Male 10147 8287 86
Female 9818 8412 80 Source: Longitudinal database 2005-2008
Table 17: The mean, the number of observations (bef ore and after imputations) and the standard error for the equivalised disposable incom e breakdown by sex, age groups and household size, 2007 only for units included into l ongitudinal database: Equivalised disposable income Mean Number of
observations after imputations
Standard error
Total 10702 22533 71
1 household member 7688 642 193
2 household members 10550 3070 146
3 household members 11572 5058 146
4 and more household members 10788 13763 93
<25 years 10339 6194 95
25-34 11552 3366 117
35-44 10705 2957 128
45-54 11189 3990 122
55-64 11334 2816 154
65+ 9591 3210 119
Male 10875 11139 77
Female 10536 11394 75 Source: Longitudinal database 2005-2008

Vožarski pot 12, SI-1000 Ljubljana, Slovenia Phone: +386 1 241 51 00; fax: +386 1 241 53 44; E-mail: [email protected]; www.stat.si
34/96
Table 18: The mean, the number of observations (bef ore and after imputations) and the standard error for the equivalised disposable incom e breakdown by sex, age groups and household size, 2008 only for units included into l ongitudinal database: Equivalised disposable income Mean Number of
observations after imputations
Standard error
Total 11713 18156 84
1 household member 8442 547 250
2 household members 11313 2598 159
3 household members 12705 4047 183
4 and more household members 11875 10964 110
<25 years 11549 5207 111
25-34 12584 2595 143
35-44 11856 2426 167
45-54 12174 3185 139
55-64 12202 2259 178
65+ 10220 2484 140
Male 11906 8936 92
Female 11527 9220 87 Source: Longitudinal database 2005-2008
In the tables where were calculated means and standard errors PY080N (pensions from private plans) was not included into disposable income (HY020).
2.3 Non-sampling errors
2.3.1 Sampling frame and coverage errors
The basis for the sampling frame is the Central Register of Population (CRP), which is linked to the Register of Territorial Units. The sampling frame constitutes persons aged 16 years or more on 31st of December 2006. Besides the CRP we also use the frame of enumeration areas. Since some enumeration areas do not have enough inhabitants, those enumeration areas were linked with neighbouring areas into larger territorial units – i.e. sampling units, which were the sampling frame in the first stage. The quality of the CRP is difficult to measure, since the Census and the CRP are based on different methodologies. While in the Census all persons living at the address at least one year are counted, current statistics counts in the population persons who are registered in Slovenia and live in Slovenia at least three months. Therefore in the Census 2002 there are almost 31000 fewer persons than in the CRP (1.55%). The discrepancy between the Census and the CRP is 1.72%. In the CRP are also persons who moved out of Slovenia (temporarily or for good), but have not reported this to the authorities. When designing the sampling frame we did not have in the frame foreigners who live in Slovenia and are by definition the population of Slovenia. There are approximately 40.000 foreigners in Slovenia. Therefore we have approximately 2% of undercoverage in the sampling frame. Also we do not have the data in the CRP which persons are living in collective households. According to the Census 2002 there are approximately 14500 such persons. The CRP is daily updated, but SORS obtains the database every three months which is a cross-section of the CRP on a certain date. Therefore the CRP we work with is 3 months old. For EU-SILC the sampling frame was built from the CRP on 30th June

Vožarski pot 12, SI-1000 Ljubljana, Slovenia Phone: +386 1 241 51 00; fax: +386 1 241 53 44; E-mail: [email protected]; www.stat.si
35/96
2006. Before the fieldwork we updated the sampling frame with the latest available CRP data at the Ministry of the Interior; so we have excluded form the fieldwork persons who have died or moved abroad as non-response. In case that a person has changed the address, the interviewer was sent to the new address, but we maintained variables that define sample design at the old address. From the CRP we have randomly selected persons aged 16 or more. At the addresses of selected persons the selected person and his or her household were interviewed. If selected persons did not live at the address from the CRP where they are registered, we did not follow them but we considered this as non-response. Households where nobody is registered at that address were thus excluded from the sampling frame.
2.3.2 Measurement and processing errors
2.3.2.1 Measurement errors As in most surveys, the questionnaire can be one sources of potentional measurement errors. Unsatisfactory organization and design of the survey may results in output different to the reality. For the case of EU-SILC the original questionnaires were developed on the basis of the EU_SILC regulations and the EU_SILC doc 65 (Description of Target Variables: Cross-sectional and Longitudinal). They are annually adopted and revised according to changes of EUROSTAT’s requirements; feedback from interviewers or data checking procedures which indicated misinterpretations of particular items. However, the wording and phrasing of the questions can lead to misunderstandings; also different ordering of the questions can result in different answers. But we implemented various methods and procedures to reduce such effects and errors.
The data are a combination of interviews and register information (register and administrative sources). In the year 2005 the interviewers are carried out by PAPI, while in the year 2006, 2007 and 2008 are carried out by CATI or CAPI. The general mode of collection was personal interview of a selected person. The household respondent was chosen by the interviewer as the one who had the best knowledge of the household’s affairs. For part of questions for selected person the interviewers were instructed to prefer interviewing the selected person whenever possible. In the case of household that had already participated in EU-SILC, certain basic information was uploaded in the programme prior to the new round of data collection. And the interviewers just verified the information. So in this way we lessen the burden, particularly on respondents. As in all surveys there is highly possible that interviewer can influence on respondent's answers. During the collecting data phase we did regular checks on their progress.
On CATI interviewing we monitored all the time interviewers and in the same time we warned them about mistakes. In our studio we have possibility to listen the interview and in the same time we can see on the computer what interviewer enter into the computer. The interviewers do not know when they are inspected.
CAPI interviewers are obliged to send to the Office every fortnight the data which

Vožarski pot 12, SI-1000 Ljubljana, Slovenia Phone: +386 1 241 51 00; fax: +386 1 241 53 44; E-mail: [email protected]; www.stat.si
36/96
they collected. We checked frequency of some key answers and if we found out that something unexpected happened with single interviewer we asked him for the reasons.
Every year the field work began at 1st February. And before the filed work we organised several lessons for both CAPI and CATI interviewers (in the year 2005 for PAPI interviewers). Each interviewer was obliged to participate in one of those lessons, which were 2 times 4 hours long. In the first part of the lesson we instructed interviewers about purpose of the survey, definitions and methodology about each question and also the organizational part of the survey. At the second part we organized practical interviewing in the groups with 3 to 4 interviewers with lap-tops for CAPI interviewers. For CATI interviewers special lessons was organised in our studio which have the similar content as for CAPI interviewers. We prepared the questionnaires and answers in advance, that we can see if the interviewer understands meaning of the questions. Also for PAPI interviewers (year 2005) was organised similar training.
In 2005 139 PAPI interviewers were trained, in 2006, 2007 and 2008 at the same time we had approximately 60 CAPI interviewers (most of them were experienced, but some interviewers are not), and approximately 30 CATI interviewers (most of them students, whose almost all had experience with calling in households.). In the case that interviewer was changed (do now wish to be interviewer, do not work according to instructions), the additional lessons was organised.
CAPI interviewers got on the lessons advanced letters and they sent them their self to the sampled households some days before they intended visit the household. For the CATI interviewing all advanced letters were sent by Office two days before began the interviewing. To all letters are added small leaflet with the some results from previous year, where it is possible to get results and additional informations, etc.
Special training was organized also for controllers and other technical stuff. On all trainings we explained the purpose of this survey, the methodology, questionnaires and organizational part as well.
In the construction of the Slovenian questionnaire we both adapted question and design from our LFS questionnaire for personal questions (especially questions related to labour market) and HBS questionnaire for household and expenditure questions. As was mentioned before, the core of questionnaire was built according to the recommendations of Eurostat. In some cases the phrasing of questions have in some way diverge from Eurostat recommendations because of Slovenian standards. Here are listed differences when comparing our questionnaire and Eurostat recommendations.
In 2007 we changed all income variables from Slovenian tolars (SIT) to EUR. In the questionnaire it is possible that interviewee answered in SIT or in EURO. We introduce for all these variables new variable for currency and after the field work was finished we recalculate all income variables into EUR. In the databases all income variables were recalculated to EURO from 2005 ownwards.

Vožarski pot 12, SI-1000 Ljubljana, Slovenia Phone: +386 1 241 51 00; fax: +386 1 241 53 44; E-mail: [email protected]; www.stat.si
37/96
Not income variables: HH010 We had more categories, but all categories are easily translated to Eurostat categories. HH020 We had more categories, but all categories are easily translated to Eurostat categories. HH030 The room is defined as space with at least 6 square meters. Kitchen is not included in any case for all years. HH070 Total housing costs are asked with several questions – costs for cold water, costs for sewage removal, costs for refuse removal, heating, contribution to reserve fund, insurance, and interest for mortgage, rent, and regular maintenance. We summed up all variables from these questions to get HH070. HS040 – Question in our questionnaire is: Can all members of your household afford financially week’s annual holidays? In Slovenian language is quite logical that holidays should be away from home. HS050 – in the question is not mentioned phrase “chicken and fish”. HS070 – HS110 – in our survey we added some other durables (video recorder, DVD player, digital camera etc.). PB130, PB140 – we collected these data with the questionnaire, but if the data were differentiated according to the central register of population, we took the data from the register. PB190, PB210 – this data we took from register of population. PB220A, PB220B – data were collected by questionnaire for all household members. In 2005 the data were collected only for selected respondent with the questionnaire, for PB220A we imputed the data from central register of population for all persons with Slovenian citizenship. Persons who did not have Slovenian citizenship were not at that time in the CRP. PE040 – the data are from Statistical register of employment for active persons, for others we collect the data via questionnaire. Because of changing methodology for deviding education level into ISCED, the data from 2005 and 2006 in longitudinal database are not comparable with the years 2007 and 2008. PH040 – the question was splited into two questions: AC4 Was there any time when selected person during the last 12 months when he/she really needed to consult a medical specialist (except dentist)?
1. Yes � AC5 2. No � question about need of the dentist.
AC5 Did selected person get a help of a medical specialist?

Vožarski pot 12, SI-1000 Ljubljana, Slovenia Phone: +386 1 241 51 00; fax: +386 1 241 53 44; E-mail: [email protected]; www.stat.si
38/96
1. Yes 2. No.
PH060 – the question was splited into two questions: AC8 Was there any time when selected person during the last 12 months when he/she really needed to consult a dentist?
1. Yes � AC9 2. No
AC9 Did selected person get a help of a dentist?
1. Yes 2. No.
PL020 – The qeustion is from 2006 onward included into the qeustionnaire. PL025 – The question is from 2006 onward included for all household members into the questionnaire. PL030 – The qeustion is from 2006 onward included for all household members into the questionnaire. PL040 – The question is from 2006 onward included for all household members into the qeustionnaire. PL050 – for active persons we got the data about occupation from the statistical register of employment. For inactive (selected) persons we asked the question about occupation in the questionnaire. After conducting the survey, we coded the occupation into ISCO-88(com) according the description of the occupation. Coding is done by professional coders who also do the coding in the LFS. PL060 – The question is from 2006 onward included for all household members into the qeustionnaire. PL070-PL085 – It was constructed from the statistical register of employment and from the registers from Health Insurance Company. The questionnaire is a source for students. PL087 – It was constructed from PL070-PL085 and from the questionnaire. PL090 – The source for this variable is register from Health Insurance Company. PL100 –The question is from 2006 included for all household members into the questionnaire. PL210A-PL210L – Constructed from statistical register of employment and Health Insurance Company. We have state on the last day of each month. The source for students was questionnaire. The data for persons which are not in any register or any

Vožarski pot 12, SI-1000 Ljubljana, Slovenia Phone: +386 1 241 51 00; fax: +386 1 241 53 44; E-mail: [email protected]; www.stat.si
39/96
other source are imputed according to the data from last year. For the persons with several statuses, the activtiy had priority, this way we define that persons who, for example, were work (part time) and they are retired, we define them as “work”. We added the question about main status in the previous year for the persons who the first time participated in survey that we can impute the data for the persons, who do not have any data in any administrative source. The data file from Tax authority was edited in advance. Before we began the data processing with eu-silc we checked the data from tax data file. We edited impossible values (for example negative values) and some very extreme values. Some imputations were also made in advance – we did logical check and in the case of inconsistency we imputed values. These imputations are not included into the imputation factor in eu-silc database. All other income files (social allowances, pensions etc.) were not edited in advance for whole population, but only for “eu-silc” population.
2.3.2.2 Processing errors The questionnaire was programmed in Blaise. Data entry controls were built into the electronic questionnaire, and there was less need for post data control. Control of data in the programme was done in various ways and were annually adopted and revised according to the experiences with last year’s surveys. All numeric variables had absolute limits for data entry. We had several syntax checks, one of them were signals (soft errors) which gave a warning to the interviewers if the answer was either unlikely because it was extreme or because it did not correspond to answer given to questions asked earlier. These signals could be overridden if the answer in question was confirmed. And similar hard errors, which it was impossible to override. We also had several logical checks.
Here are examples of syntax checks and one logical check: Soft syntax error:
� Variable (PL060): Number of hours usually worked per week in main job: if interviewer entered less then 8 or more then 70 hours there was a signal: Really less then 8 or more then 70 hours per week in main job? The answer could be yes – suppress or no - correct the number of hours.
Hard syntax error: � Variable HB080/HB090: Person 1 and Person 2 responsible for the
accommodation: if interviewer entered two times the same person there was a hard error: Person 1 responsible for the accommodation and Person 2 responsible for the accommodation can not be same.
Logical error: � Variable PL030: Self-defined current economic status: if interviewer entered
the person aged 16 and more is a preschool child there was an error: The person is 16 or more year old so can not be a preschool child.
The second stage was done in our office by data checking in the editing process, all sources separately. The system of processing, checking and editing was programmed in SAS. We had various logical and consistency checks, we checked the extreme values of all income components and variables with amounts from

Vožarski pot 12, SI-1000 Ljubljana, Slovenia Phone: +386 1 241 51 00; fax: +386 1 241 53 44; E-mail: [email protected]; www.stat.si
40/96
questionnaire (for example total housing costs). During the checking procedures errors are corrected.
Here are some examples of checks at this stage: Checks
LK_label Table Error_decription Condition Remark LK014 gosp For tenants we need answer about
paying rent at prevailing or market rate
if (GC4 in ( 2 3 4 5 6 8) ) and (GC17= -2) and tatus_gosp=10
LK083 oseb Person can not get sickness benefits more then 252 working days
if AS3 > 252 and not (AS3 in (-2 -1))
LK150 ostali_viri Value can not be negative if (OTR < 0) LK_OP_9
dohodnina Extreme value if ((BRUTO1211 NE 0)) and not ( 112.02 =< BRUTO1211 =< 8705.32 )
After checking/editing the data from all sources separately, we compose so called integrated database with all the data. In the case of logical mistakes and inconsistency of the data, we edited the data to the most probably value.
Here are some examples of checks at this stage: Checks
LK_label Table Error_decription Condition Remark LK_I_019 int_gosp_v Housing allowances can get only
tenants or subtenants if (HY070G ne 0) and not (HH020 in (2 3 .))
LK_I_020 int_oseb_v Person must have main activity for all 12 months
if not ((PL070+PL072+PL080+PL085+PL087+PL090)=12) and (RB080<1991)
LK_I_029 int_gosp_v Total housing gross income must be equal or greater then total disposable household income
if (HY010 -HY020 lt -1) and (HY010 ne .) and (HY020 ne .)
LK_I_317 int_oseb_v Person was more then 4 months retired, but there was no benefits (old-age or survivor's or disability benefits)
if (PL085>4) and ((PY100G or PY110G or PY130G)=0)
We also compared the data with data from previous waves, especially income variables (on micro level) and if we detect errors, we corrected them. With the final datasets on the macro-level the distribution of income variables are checked with previous EU_SILC waves, tax statistics and other administrative sources to identify implausible distributions due to errors in the data editing process. Before sending the final D-, R-, H- and P- files, data files were further checked using EUROSTAT’s SAS programs to detect errors. Cases which are identified by the checking programme as probably implausible but are considered correct were commented and sent to EUROSTAT with the data transmission.

Vožarski pot 12, SI-1000 Ljubljana, Slovenia Phone: +386 1 241 51 00; fax: +386 1 241 53 44; E-mail: [email protected]; www.stat.si
41/96
2.3.3 Non-response errors
2.3.3.1 Achieved sample size
Both for households and for the individuals we were interested what the achieved sample size was. Since we have the sample of persons, and the data are obtained both from the interview and from the registers, the household is counted to be interviewed only if household questionnaire is completed and if also questionnaire for the selected person is completed. From other household members data are obtained from registers. Achieved sample size is calculated for 1. Number of selected respondents who are members of the households for which
the interview is accepted for the database (DB135 = 1), and who completed a personal interview (RB250 = 11 to 13);
2. Number of persons 16 years or older who are members of the households for which the interview is accepted for the database (DB135 = 1), and who completed a personal interview (RB250 = 11 to 13);
Table 19. Achieved sample size for total and rotati onal group breakdown
No. of selected respondents (sample persons) from who information is completed from interviews and registers
No. of persons 16+ who are members of the households for which the interview is accepted for the database and from who information is completed only from registers
No. of persons 16+ who are members of the households for which the interview is accepted for the database
Year Rotational group
DB135 = 1 & RB250=13
DB135 = 1 & RB250=12
DB135 = 1 & RB250=12,13
Total 2759 5150 7909 2005 3 2759 5150 7909
Total 5078 9307 14385 3 2196 4109 6305
2006
4 2882 5198 8080 Total 6883 12631 19514
3 1773 3282 5055 4 2158 3961 6119
2007
5 2952 5388 8340 Total 5609 10072 15681
3 1552 2781 4333 4 1840 3342 5182
2008
5 2217 3949 6166 Source: Longitudinal database 2005-2008

Vožarski pot 12, SI-1000 Ljubljana, Slovenia Phone: +386 1 241 51 00; fax: +386 1 241 53 44; E-mail: [email protected]; www.stat.si
42/96
2.3.3.2 Unit non-response For the total sample, the unit non-response will be calculated by removing, from the numerator and the denominator of the formulas described below, those units that according to the tracing rules are out of scope. � Household non-response rates (NRh) will be computed as follows:
NRh=(1-(Ra * Rh)) * 100
Where
Ra is the address contact rate. DB120 is the record of contact at the address. The Ra is: Table 20: Address contact rate Year Ra
2005 100.0% 2006 98.7% 2007 98.8% 2008 99.2%
Source: Longitudinal database 2005-2008
Condition that have to be fulfilled that the household is accepted to household register are completed both household and personal questionnaires.Variable measures proportion of households that are acceptable for the database. Percentage is calculated form eligible households on contacted addresses.
Rh is the proportion of complete household interviews accepted for the database. DB130 is the household questionnaire result, and DB135 is the household interview acceptance result. Table 21: Proportion of complete household intervie ws Year Rh
2005 63.5% 2006 77.5% 2007 76.2% 2008 82.8%
Source: Longitudinal database 2005-2008

Vožarski pot 12, SI-1000 Ljubljana, Slovenia Phone: +386 1 241 51 00; fax: +386 1 241 53 44; E-mail: [email protected]; www.stat.si
43/96
Therefore
NRh=(1-(Ra * Rh)) * 100
Table 22: Non-response rate Year NRh
2005 36.5% 2006 23.5% 2007 24.7% 2008 17.9%
Source: Longitudinal database 2005-2008
� Individual non-response rates (NRp) will be computed as follows:
NRp=(1-(Rp)) * 100
Where
Rp is the proportion of complete personal interviews within the households accepted for the database RB245 is the respondent status, and RB250 is the data status. For those Members States where a sample of persons rather than a sample of households (addresses) was selected, the individual non-response rates will be calculated for ‘the selected respondent’ (RB245=2), for all individuals aged 16 years or older (RB245=2+3) and for the nonselected respondent (RB245=3). Table 23: Complete personal interviews
Year Response Number of persons Rp
2005 7909 7909 100.0% 2006 14385 14385 100.0% 2007 19514 19514 100.0% 2008 15681 15681 100.0%
Source: Longitudinal database 2005-2008
The Rp for selected respondent and non-selected respondent is always 100%. Thus
NRp=(1-(Rp)) * 100=0
for ‘the selected respondent’ (RB245=2), for all individuals aged 16 years or older (RB245=2+3) and for the nonselected respondent (RB245=3).

Vožarski pot 12, SI-1000 Ljubljana, Slovenia Phone: +386 1 241 51 00; fax: +386 1 241 53 44; E-mail: [email protected]; www.stat.si
44/96
Overall individual non-response rates (*NRp) are: Table 24: Overall individual non-response rate Year *NRp
2005 36.55% 2006 23.50% 2007 24.73% 2008 17.89%
Source: Longitudinal database 2005-2008
Longitudinal response rates
Households:
Wave response rate
Percentage of households successfully interviewed (DB135 = 1) which were passed on to wave t (from wave t-1) or newly created or added during wave t, excluding those out of scope (under the tracing rules) or non-existent.
Table 25: Wave response rate Year W_RR
2005 61.4% 2006 73.0% 2007 71.5% 2008 79.3%
Source: Longitudinal database 2005-2008
Longitudinal follow up rate
Percentage of households which are passed on to wave t+1 for follow-up within the households received into wave t from wave t-1, excluding those out of scope (under the tracing rules) or non-existent.
Table 26: Longitudinal follow up rate Year LF_R
2005 0.0% 2006 84.7% 2007 80.1% 2008 58.6%
Source: Longitudinal database 2005-2008
Follow up ratio
Number of households passed on from wave t to wave t+1 in comparison to the number of households received for follow-up at wave t from wave t-1.

Vožarski pot 12, SI-1000 Ljubljana, Slovenia Phone: +386 1 241 51 00; fax: +386 1 241 53 44; E-mail: [email protected]; www.stat.si
45/96
Table 27: Longitudinal follow up ratio Year F_RAT
2005 0.0% 2006 84.7% 2007 80.1% 2008 58.6%
Source: Longitudinal database 2005-2008
Achieved sample size ratio
Ratio of the number of households accepted for the database (DB135 = 1) in wave t to the number of households accepted for the database (DB135 = 1) in wave t-1.
Table 28: Achieved sample size ratio Year ASS_RAT
2005 0.0% 2006 184.1% 2007 135.5% 2008 81.5%
Source: Longitudinal database 2005-2008
Persons:
Wave response rate
Percentage of sample persons successfully interviewed (RB250 = 11,12,13) among those passed on to wave t (from wave t-1) or newly created or added during wave t, excluding those out of scope (under the tracing rules).
Table 29: Wave response rate Year W_RR_SP
2005 100.0% 2006 100.0% 2007 100.0% 2008 100.0%
Source: Longitudinal database 2005-2008
Percentage of co-residents selected in wave 1 successfully interviewed (RB = 11,12,13) among those passed on to wave t (from wave t-1).
Table 30: Response rate for co-residents Year W_RR_C
2005 80.3% 2006 78.8% 2007 78.8% 2008 76.3%
Source: Longitudinal database 2005-2008
Longitudinal follow up rate
Percentage of sample persons successfully interviewed (RB250 = 11,12,13) in wave t out of all of sample persons selected, excluding those who have died or been found ineligible (out of scope), breakdown by causes of non-response.

Vožarski pot 12, SI-1000 Ljubljana, Slovenia Phone: +386 1 241 51 00; fax: +386 1 241 53 44; E-mail: [email protected]; www.stat.si
46/96
Table 31: Longitudinal follow up rate Year LF_RP_S
2005 100.0% 2006 100.0% 2007 100.0% 2008 100.0%
Source: Longitudinal database 2005-2008
Achieved sample size ratio
Ratio of the number of completed personal interviews (RB250 = 11,12,13) in wave t to the number of completed personal interviews in wave t-1. This ratio will be defined for sample persons and for all persons including non-sample persons aged 16+ and for co-residents aged 16+ selected in first wave.
Table 32: Achieved sample size ratio Year ASS_RAT_P
2005 0.0% 2006 181.9% 2007 135.7% 2008 80.4%
Source: Longitudinal database 2005-2008
Response rate for non sample persons
Table 33: Response rate for non-sample persons Year RR_NSP
2005 100.0% 2006 97.9% 2007 97.0% 2008 93.9%
Source: Longitudinal database 2005-2008

Vožarski pot 12, SI-1000 Ljubljana, Slovenia Phone: +386 1 241 51 00; fax: +386 1 241 53 44; E-mail: [email protected]; www.stat.si
47/96
2.3.3.3 Distribution of households by household sta tus (DB110), by record of contact at address (DB120), by household qeustionna ire result (DB130) and by household interview acceptance (DB135)
Table 34: Distribution of ‘household status’ by wav e
DB110=1 DB110=2 DB110=3 DB110=4 DB110=5 DB110=7 DB110=9 DB110=11 Total
2005 0 0 0 0 0 0 4492 0 4492
2006 2642 86 3 5 8 15 4201 0 6960
2007 4832 131 6 8 50 1 4481 118 9627
2008 6654 124 12 21 87 0 0 177 7075
Total 14128 341 21 34 160 16 13156 298 28154 Source: Longitudinal database 2005-2008
Table 35: Percentage of ‘household status’ by wave
DB110=1 DB110=2 DB110=3 DB110=4 DB110=5 DB110=7 DB110=9 DB110=11 Total 2005 0.0% 0.0% 0.0% 0.0% 0.0% 0.0% 100.0% 0.0% 100,0% 2006 38.0% 1.2% 0.0% 0.1% 0.1% 0.2% 60.4% 0.0% 100,0% 2007 50.2% 1.4% 0.1% 0.1% 0.5% 0.0% 46.6% 1.2% 100,0% 2008 94.0% 1.8% 0.2% 0.3% 1.2% 0.0% 0.0% 2.5% 100,0%
Total 50.2% 1.2% 0.1% 0.1% 0.6% 0.1% 46.7% 1.1% 100,0% Source: Longitudinal database 2005-2007
DB110=1 At the same address as last interview DB110=2 Entire household moved to a private household within the country DB110=3 Entire household moved to a collective household or institution within the country DB110=4 Household moved outside the country DB110=5 Entire household died DB110=7 Household unable to access DB110=9 New address added to sample this wave or first wave DB110=11 Lost household (no information on record or what happened to the household)

Vožarski pot 12, SI-1000 Ljubljana, Slovenia Phone: +386 1 241 51 00; fax: +386 1 241 53 44; E-mail: [email protected]; www.stat.si
48/96
Table 36: Distribution of original units by ‘record of contact at address'. Rotational group and total, 2008
Total Rotational group
3 Rotational group 4
Rotational group 1
Rotational group 2
Number % Number % Number % Number % Number %
Total (DB120 = 11 to 23) 12520 100.0 1897 100.0 2264 100.0 2952 100.0 5407 100.0
Address contacted (DB120 = 11) 11596 92.6 1822 96.0 2185 96.5 2808 95.1 4781 88.4
Address non-contacted (DB120 = 21 to 23) 924 7.4 75 4.0 79 3.5 144 4.9 626 11.6
Total address non-contacted (DB120 = 21 to 23) 924 7.4 75 4.0 79 3.5 144 4.9 626 11.6
Address cannot be located (DB120= 21) 266 2.1 11 0.6 12 0.5 30 1.0 213 3.9
Address unable to access (DB120 = 22) 6 0.0 0 0.0 0 0.0 0 0.0 6 0.1 Address does not exists or is non-residential address or is unoccupied or not principal residence (DB120 = 23) 652 5.2 64 3.4 67 3.0 114 3.9 407 7.5
Source: Cross sectional database 2008
Table 37: Distribution of interview acceptance by r otational group, 2008
Total Rotational group 3
Rotational group 4
Rotational group 1
Rotational group 2
Number % Number % Number % Number % Number %
Total 9028 100.0 1581 100.0 1840 100.0 2217 100.0 3390 100.0
Interview accepted for data base (DB135 = 1) 9028 100.0 1581 100.0 1840 100.0 2217 100.0 3390 100.0
Interview rejected (DB135 = 2)
0 0.0 0 0.0 0 0.0 0 0.0 0 0.0 Source: Cross sectional database 2008

Vožarski pot 12, SI-1000 Ljubljana, Slovenia Phone: +386 1 241 51 00; fax: +386 1 241 53 44; E-mail: [email protected]; www.stat.si
49/96
Table 38: Distribution of original units by ‘record of contact at address' by wave
Year DB120=11 DB120=21 DB120=22 DB120=23 Total
2005 4348 0 0 124 4492 2006 3907 74 1 305 4287 2007 4198 88 0 326 4612 2008 124 0 0 0 124
Total 12577 162 1 775 13515 Source: Longitudinal database 2005-2008
Table 39: Percentage of original units by ‘record o f contact at address' by wave
Year DB120=11 DB120=21 DB120=22 DB120=23 Total
2005 96.8% 0.0% 0.0% 3.2% 100.0% 2006 91.1% 1.7% 0.0% 7.1% 100.0% 2007 91.0% 1.9% 7.1% 3.1% 100.0% 2008 100.0% 0.0% 0.0% 0.0% 100.0%
Total 93.1% 1.2% 0.0% 5.7% 100.0% Source: Longitudinal database 2005-2007
DB120=11 address contacted DB120=21 address cannot be located DB120=22 address unable to access DB120=23 Address does not exist or is non-residental address or is unoccupied or not principal residence DB120=23 include also households where selected person died or moved to instituion or abroad.
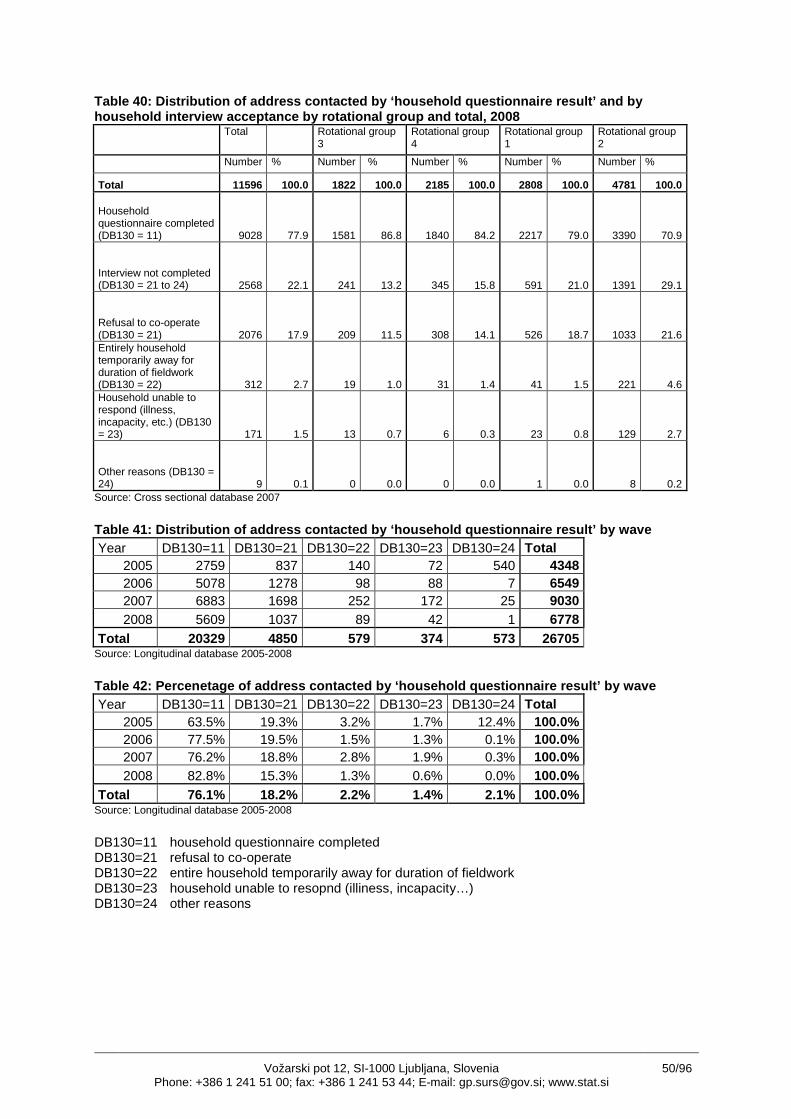
Vožarski pot 12, SI-1000 Ljubljana, Slovenia Phone: +386 1 241 51 00; fax: +386 1 241 53 44; E-mail: [email protected]; www.stat.si
50/96
Table 40: Distribution of address contacted by ‘hou sehold questionnaire result’ and by household interview acceptance by rotational group and total, 2008
Total Rotational group 3
Rotational group 4
Rotational group 1
Rotational group 2
Number % Number % Number % Number % Number %
Total 11596 100.0 1822 100.0 2185 100.0 2808 100.0 4781 100.0
Household questionnaire completed (DB130 = 11) 9028 77.9 1581 86.8 1840 84.2 2217 79.0 3390 70.9
Interview not completed (DB130 = 21 to 24) 2568 22.1 241 13.2 345 15.8 591 21.0 1391 29.1
Refusal to co-operate (DB130 = 21) 2076 17.9 209 11.5 308 14.1 526 18.7 1033 21.6 Entirely household temporarily away for duration of fieldwork (DB130 = 22) 312 2.7 19 1.0 31 1.4 41 1.5 221 4.6 Household unable to respond (illness, incapacity, etc.) (DB130 = 23) 171 1.5 13 0.7 6 0.3 23 0.8 129 2.7
Other reasons (DB130 = 24) 9 0.1 0 0.0 0 0.0 1 0.0 8 0.2
Source: Cross sectional database 2007
Table 41: Distribution of address contacted by ‘hou sehold questionnaire result’ by wave Year DB130=11 DB130=21 DB130=22 DB130=23 DB130=24 Total
2005 2759 837 140 72 540 4348 2006 5078 1278 98 88 7 6549 2007 6883 1698 252 172 25 9030 2008 5609 1037 89 42 1 6778
Total 20329 4850 579 374 573 26705 Source: Longitudinal database 2005-2008
Table 42: Percenetage of address contacted by ‘hous ehold questionnaire result’ by wave Year DB130=11 DB130=21 DB130=22 DB130=23 DB130=24 Total
2005 63.5% 19.3% 3.2% 1.7% 12.4% 100.0% 2006 77.5% 19.5% 1.5% 1.3% 0.1% 100.0% 2007 76.2% 18.8% 2.8% 1.9% 0.3% 100.0% 2008 82.8% 15.3% 1.3% 0.6% 0.0% 100.0%
Total 76.1% 18.2% 2.2% 1.4% 2.1% 100.0% Source: Longitudinal database 2005-2008
DB130=11 household questionnaire completed DB130=21 refusal to co-operate DB130=22 entire household temporarily away for duration of fieldwork DB130=23 household unable to resopnd (illiness, incapacity…) DB130=24 other reasons

Vožarski pot 12, SI-1000 Ljubljana, Slovenia Phone: +386 1 241 51 00; fax: +386 1 241 53 44; E-mail: [email protected]; www.stat.si
51/96
2.3.3.4 Distribution of persons for membership stat us (RB110): Table 43: Frequency of persons for membership statu s (RB110) by wave
year=2005
year=2006
year=2007
year=2008 Total
Was in this household in previous waves or current household member RB110=1 9174 16520 22224 17720 65638
Move into this household from outside sample since previous wave RB110=3 0 133 235 305 673
Newly born into this household since last wave RB110=4 0 46 74 131 251
Moved out since previous wave or last interview if not contacted in previous wave RB110=5 0 148 286 502 936
Died RB110=6 0 15 46 78 139
Lived in the household at least 3 months druing the income reference period RB110=7 0 32 57 70 159 Total 9174 16894 22922 18806 67796
Source: Longitudinal database 2005-2008 Table 44: Percentage of persons for membership stat us (RB110) by wave
year=2005
year=2006
year=2007
year=2008 Total
Was in this household in previous waves or current household member RB110=1
100.0% 97.8% 97.0% 94.2% 96.8%
Move into this household from outside sample since previous wave RB110=3
0.0% 0.8% 1.0% 1.6% 1.0%
Newly born into this household since last wave RB110=4
0.0% 0.3% 0.3% 0.7% 0.4%
Moved out since previous wave or last interview if not contacted in previous wave RB110=5
0.0% 0.9% 1.2% 2.7% 1.4%
Died RB110=6 0.0% 0.1% 0.2% 0.4% 0.2% Lived in the household at least 3 months druing the income reference period RB110=7
0.0% 0.2% 0.2% 0.4% 0.2%
Total 100.0% 100.0% 100.0% 100.0% 100.0% Source: Longitudinal database 2005-2007

Vožarski pot 12, SI-1000 Ljubljana, Slovenia Phone: +386 1 241 51 00; fax: +386 1 241 53 44; E-mail: [email protected]; www.stat.si
52/96
2.3.3.5 Item non-reponse Table 45: Distribution of item non-response (unweig hted values), EU-SILC cross sectional 2008 database Variable Description % of HHS
having received an amount
% of HHS with missing values (before imputations)
Total % of HHs with partial information (before imputations) - imputed 10% or more of amount
Total % of HHs with partial information (before imputations) - imputed less than 10% of amount
Total % of HHs with full information (before imputations)
The income were decreased after imputations
HHS with missing value/HHS who received amount
HHS with missing value/HHS who received amount
HHS with missing value/HHS who received amount
HHS where value decreased/HHS who received amount
HY010 Total gross household income 100.0% 0.2% 15.1% 32.1% 52.0% 0.6%
HY020 Total disposable household income 100.0% 0.1% 17.1% 29.2% 42.7% 10.9%
HY022
Total disposable household income before social transfers except old age and survivor's benefits 99.7% 0.3% 19.1% 27.1% 42.6% 10.8%
HY023
Total disposable household income before social transfers including old-age and survivor's benefits 98.5% 1.8% 23.0% 23.7% 42.2% 9.2%
HY040G Income from rental of a property or land – gross 6.3% 0.0% 0.0% 0.0% 100.0% 0.0%
HY040N Income from rental of a property or land – net 6.3% 0.0% 0.0% 0.0% 100.0% 0.0%
HY050G Family/Children related allowances - gross 42.6% 0.0% 0.0% 0.0% 100.0% 0.0%
HY050N Family/Children related allowances - net 42.5% 0.0% 0.0% 0.0% 100.0% 0.0%
HY060G
Social exclusion not elsewhere classified – gross 11.4% 2.6% 0.1% 0.0% 97.2% 0.1%
HY060N
Social exclusion not elsewhere classified – net 11.4% 2.6% 0.1% 0.0% 97.2% 0.1%
HY070G Housing allowances – gross 0.5% 0.0% 0.0% 0.0% 100.0% 0.0%
HY070N Housing allowances – net 0.5% 0.0% 0.0% 0.0% 100.0% 0.0%
HY080G
Regular inter – household cash transfer received – gross 2.9% 10.2% 6.1% 0.0% 81.1% 2.7%

Vožarski pot 12, SI-1000 Ljubljana, Slovenia Phone: +386 1 241 51 00; fax: +386 1 241 53 44; E-mail: [email protected]; www.stat.si
53/96
Variable Description % of HHS having received an amount
% of HHS with missing values (before imputations)
Total % of HHs with partial information (before imputations) - imputed 10% or more of amount
Total % of HHs with partial information (before imputations) - imputed less than 10% of amount
Total % of HHs with full information (before imputations)
The income were decreased after imputations
HHS with missing value/HHS who received amount
HHS with missing value/HHS who received amount
HHS with missing value/HHS who received amount
HHS where value decreased/HHS who received amount
HY080N
Regular inter – household cash transfer received - net 2.9% 10.2% 6.1% 0.0% 81.1% 2.7%
HY090G
Interest, dividends, profit form capital investments in unincorporated business -gross 37.3% 7.0% 5.6% 1.8% 85.1% 0.6%
HY090N
Interest, dividends, profit form capital investments in unincorporated business - net 37.3% 7.0% 6.0% 1.4% 85.1% 0.6%
HY100G Interest repayments on mortgage gross 4.6% 68.4% 20.8% 0.0% 8.4% 2.4%
HY100N Interest repayments on mortgage net 4.6% 68.4% 20.8% 0.0% 8.4% 2.4%
HY110G
Income received by people aged under 16 gross 1.3% 0.0% 0.0% 0.0% 100.0% 0.0%
HY110N
Income received by people aged under 16 net 1.3% 0.0% 0.0% 0.0% 100.0% 0.0%
HY120G Regular taxes on wealth gross 85.6% 27.1% 2.7% 0.2% 69.9% 0.1%
HY120N Regular taxes on wealth net 85.6% 27.1% 2.7% 0.2% 69.9% 0.1%
HY130G
Regular inter – household cash transfer paid – gross 5.6% 10.3% 3.4% 0.0% 83.3% 3.0%
HY130N
Regular inter – household cash transfer paid - net 5.6% 10.3% 3.4% 0.0% 83.3% 3.0%
HY140G Tax on income and social contribution 86.5% 0.5% 12.2% 4.1% 82.8% 0.4%
HY140N Tax on income and social contribution 86.5% 0.5% 12.2% 4.1% 82.8% 0.4%
HY145N Repayments/receipts for tax adjustment 82.0% 0.0% 0.0% 0.0% 100.0% 0.0%
Source: Cross sectional database 2008

Vožarski pot 12, SI-1000 Ljubljana, Slovenia Phone: +386 1 241 51 00; fax: +386 1 241 53 44; E-mail: [email protected]; www.stat.si
54/96
Table 46: Distribution of item non-response (unweig hted values), EU-SILC cross sectional 2008 database Variable Description % of
persons having received an amount
% of persons with missing values (before imputations)
Total % of persons with partial information (before imputations) - imputed 10% or more of amount
Total % of persons with partial information (before imputations) - imputed less than 10% of amount
Total % of persons with full information (before imputations)
The income were decreased after imputations
persons with missing value/persons who received amount
persons with missing value/persons who received amount
persons with missing value/persons who received amount
persons with too high value/persons who received amount
PY010G
Employee cash or near cash income – gross 62.7% 3.2% 11.3% 17.1% 68.1% 0.3%
PY010N
Employee cash or near cash income –net 62.7% 3.2% 15.4% 12.8% 68.4% 0.3%
PY020G Non-Cash employee income – net 10.2% 8.3% 2.9% 0.1% 88.8% 0.0%
PY020N Non-Cash employee income – net 10.2% 8.3% 2.1% 0.3% 89.4% 0.0%
PY021G Company car - gross 1.3% 46.3% 2.2% 0.0% 49.4% 2.2%
PY021N Company car - net 1.3% 46.3% 2.2% 0.0% 49.4% 2.2%
PY035G
Contributions to individual private pensions plans – gross 21.3% 30.3% 0.0% 0.0% 69.6% 0.1%
PY035N
Contributions to individual private pensions plans - net 21.3% 30.3% 0.0% 0.0% 69.6% 0.1%
PY050G
Cash benefits or losses from self-employment - gross 14.0% 17.8% 14.9% 2.7% 64.0% 0.6%
PY050N
Cash benefits or losses from self-employment - net 14.0% 17.8% 15.2% 2.4% 64.0% 0.6%
PY070G
Value of goods produced by own consumption - gross 62.4% 52.5% 1.8% 0.8% 41.6% 3.2%
PY070N
Value of goods produced by own consumption - net 62.4% 52.5% 1.8% 0.8% 41.6% 3.2%
PY080G
Pension from individual private plans – gross 0.7% 15.3% 2.8% 0.0% 79.0% 2.8%
PY080N
Pension from individual private plans – net 0.7% 15.3% 2.8% 0.0% 79.0% 2.8%
PY090G Unemployment benefits – gross 1.9% 0.0% 0.0% 0.0% 100.0% 0.0%
PY090N Unemployment benefits – net 1.9% 0.0% 0.0% 0.0% 100.0% 0.0%
PY100G Old age benefits – gross 18.7% 1.3% 0.0% 0.0% 98.7% 0.0%
PY100N Old age benefits - 18.7% 1.3% 0.0% 0.0% 98.7% 0.0%

Vožarski pot 12, SI-1000 Ljubljana, Slovenia Phone: +386 1 241 51 00; fax: +386 1 241 53 44; E-mail: [email protected]; www.stat.si
55/96
Variable Description % of persons having received an amount
% of persons with missing values (before imputations)
Total % of persons with partial information (before imputations) - imputed 10% or more of amount
Total % of persons with partial information (before imputations) - imputed less than 10% of amount
Total % of persons with full information (before imputations)
The income were decreased after imputations
persons with missing value/persons who received amount
persons with missing value/persons who received amount
persons with missing value/persons who received amount
persons with too high value/persons who received amount
net
PY110G Survivor' age benefits - gross 3.4% 0.2% 0.0% 0.0% 99.8% 0.0%
PY110N Survivor' age benefits - net 3.4% 0.2% 0.0% 0.0% 99.8% 0.0%
PY120G Sickness benefits - gross 12.5% 10.5% 3.5% 0.0% 85.9% 0.0%
PY120N Sickness benefits - net 12.5% 10.5% 3.1% 0.0% 86.3% 0.0%
PY130G Disability benefits - gross 7.0% 0.1% 0.1% 0.0% 99.8% 0.1%
PY130N Disability benefits - net 7.0% 0.1% 0.1% 0.0% 99.8% 0.1%
PY140G Education related allowances - gross 5.1% 0.0% 0.0% 0.0% 100.0% 0.0%
PY140N Education related allowances- net 5.1% 0.0% 0.0% 0.0% 100.0% 0.0%
Source: Cross sectional database 2008
Table 47: Distribution of item non-response (unweig hted values), household level, EU-SILC longitudinal 2005- 2008 database Year Variable Description % of
HHS having received an amount
% of HHS with missing values (before imputations)
Total % of HHs with partial information (before imputations) - imputed 10% or more of amount
Total % of HHs with partial information (before imputations) - imputed less than 10% of amount
No imputations
The income were decreased after imputations
Imputation factor=0.00000
Imputation factor=0.00001 to 0.90000
Imputation factor =0.90001 to 0.99999
Imputation factor = 1.00000
Imputation factor > 1.00000
2005 HY010 Total gross household income 100.0% 0.4% 13.6% 39.1% 44.3% 2.6%
2005 HY020 Total disposable household income 100.0% 0.3% 16.7% 36.0% 29.1% 17.9%
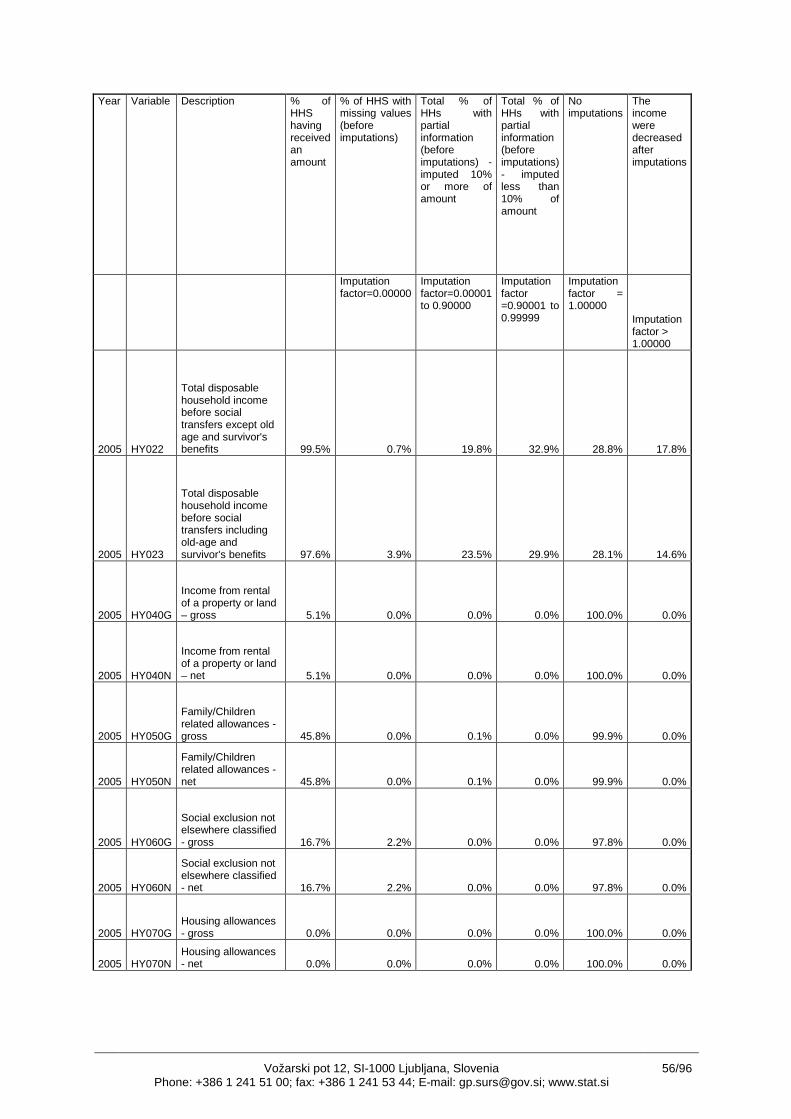
Vožarski pot 12, SI-1000 Ljubljana, Slovenia Phone: +386 1 241 51 00; fax: +386 1 241 53 44; E-mail: [email protected]; www.stat.si
56/96
Year Variable Description % of HHS having received an amount
% of HHS with missing values (before imputations)
Total % of HHs with partial information (before imputations) - imputed 10% or more of amount
Total % of HHs with partial information (before imputations) - imputed less than 10% of amount
No imputations
The income were decreased after imputations
Imputation factor=0.00000
Imputation factor=0.00001 to 0.90000
Imputation factor =0.90001 to 0.99999
Imputation factor = 1.00000
Imputation factor > 1.00000
2005 HY022
Total disposable household income before social transfers except old age and survivor's benefits 99.5% 0.7% 19.8% 32.9% 28.8% 17.8%
2005 HY023
Total disposable household income before social transfers including old-age and survivor's benefits 97.6% 3.9% 23.5% 29.9% 28.1% 14.6%
2005 HY040G
Income from rental of a property or land – gross 5.1% 0.0% 0.0% 0.0% 100.0% 0.0%
2005 HY040N
Income from rental of a property or land – net 5.1% 0.0% 0.0% 0.0% 100.0% 0.0%
2005 HY050G
Family/Children related allowances - gross 45.8% 0.0% 0.1% 0.0% 99.9% 0.0%
2005 HY050N
Family/Children related allowances - net 45.8% 0.0% 0.1% 0.0% 99.9% 0.0%
2005 HY060G
Social exclusion not elsewhere classified - gross 16.7% 2.2% 0.0% 0.0% 97.8% 0.0%
2005 HY060N
Social exclusion not elsewhere classified - net 16.7% 2.2% 0.0% 0.0% 97.8% 0.0%
2005 HY070G Housing allowances - gross 0.0% 0.0% 0.0% 0.0% 100.0% 0.0%
2005 HY070N Housing allowances - net 0.0% 0.0% 0.0% 0.0% 100.0% 0.0%

Vožarski pot 12, SI-1000 Ljubljana, Slovenia Phone: +386 1 241 51 00; fax: +386 1 241 53 44; E-mail: [email protected]; www.stat.si
57/96
Year Variable Description % of HHS having received an amount
% of HHS with missing values (before imputations)
Total % of HHs with partial information (before imputations) - imputed 10% or more of amount
Total % of HHs with partial information (before imputations) - imputed less than 10% of amount
No imputations
The income were decreased after imputations
Imputation factor=0.00000
Imputation factor=0.00001 to 0.90000
Imputation factor =0.90001 to 0.99999
Imputation factor = 1.00000
Imputation factor > 1.00000
2005 HY080G
Regular inter – household cash transfer received - gross 3.3% 14.3% 3.3% 0.0% 82.4% 0.0%
2005 HY080N
Regular inter – household cash transfer received - net 3.3% 14.3% 3.3% 0.0% 82.4% 0.0%
2005 HY090G
Interest, dividends, profit form capital investments in unincorporated business -gross 31.1% 12.5% 0.2% 0.0% 87.3% 0.0%
2005 HY090N
Interest, dividends, profit form capital investments in unincorporated business - net 31.1% 12.5% 0.2% 0.0% 87.3% 0.0%
2005 HY100G Interest repayments on mortgage gross 2.1% 49.1% 0.0% 0.0% 50.9% 0.0%
2005 HY100N Interest repayments on mortgage net 2.1% 49.1% 0.0% 0.0% 50.9% 0.0%
2005 HY110G
Income received by people aged under 16 gross 4.0% 0.0% 0.0% 0.0% 100.0% 0.0%
2005 HY110N
Income received by people aged under 16 net 4.0% 0.0% 0.0% 0.0% 100.0% 0.0%
2005 HY120G Regular taxes on wealth gross 82.9% 43.7% 0.7% 0.1% 55.2% 0.4%
2005 HY120N Regular taxes on wealth net 82.9% 43.7% 0.7% 0.1% 55.2% 0.4%
2005 HY130G
Regular inter – household cash transfer paid – gross 6.5% 3.9% 0.0% 0.0% 96.1% 0.0%
2005 HY130N
Regular inter – household cash transfer paid - net 6.5% 3.9% 0.0% 0.0% 96.1% 0.0%

Vožarski pot 12, SI-1000 Ljubljana, Slovenia Phone: +386 1 241 51 00; fax: +386 1 241 53 44; E-mail: [email protected]; www.stat.si
58/96
Year Variable Description % of HHS having received an amount
% of HHS with missing values (before imputations)
Total % of HHs with partial information (before imputations) - imputed 10% or more of amount
Total % of HHs with partial information (before imputations) - imputed less than 10% of amount
No imputations
The income were decreased after imputations
Imputation factor=0.00000
Imputation factor=0.00001 to 0.90000
Imputation factor =0.90001 to 0.99999
Imputation factor = 1.00000
Imputation factor > 1.00000
2005 HY140G Tax on income and social contribution 80.9% 3.2% 7.7% 1.9% 84.2% 3.0%
2005 HY140N Tax on income and social contribution 80.9% 3.2% 7.7% 1.9% 84.2% 3.0%
2005 HY145N Repayments/receipts for tax adjustment 80.7% 0.0% 0.0% 0.0% 100.0% 0.0%
2006 HY010 Total gross household income 100.0% 0.4% 13.2% 23.9% 61.9% 0.7%
2006 HY020 Total disposable household income 100.0% 0.2% 15.0% 22.4% 53.3% 9.1%
2006 HY022
Total disposable household income before social transfers except old age and survivor's benefits 99.6% 0.4% 16.4% 20.9% 53.6% 8.8%
2006 HY023
Total disposable household income before social transfers including old-age and survivor's benefits 98.5% 0.9% 19.1% 18.6% 53.3% 8.0%
2006 HY040G
Income from rental of a property or land – gross 5.1% 0.0% 0.0% 0.0% 100.0% 0.0%
2006 HY040N
Income from rental of a property or land – net 5.1% 0.0% 0.0% 0.0% 100.0% 0.0%
2006 HY050G
Family/Children related allowances - gross 44.8% 0.0% 0.1% 0.0% 99.1% 0.7%
2006 HY050N
Family/Children related allowances - net 44.8% 0.0% 0.1% 0.0% 99.1% 0.8%

Vožarski pot 12, SI-1000 Ljubljana, Slovenia Phone: +386 1 241 51 00; fax: +386 1 241 53 44; E-mail: [email protected]; www.stat.si
59/96
Year Variable Description % of HHS having received an amount
% of HHS with missing values (before imputations)
Total % of HHs with partial information (before imputations) - imputed 10% or more of amount
Total % of HHs with partial information (before imputations) - imputed less than 10% of amount
No imputations
The income were decreased after imputations
Imputation factor=0.00000
Imputation factor=0.00001 to 0.90000
Imputation factor =0.90001 to 0.99999
Imputation factor = 1.00000
Imputation factor > 1.00000
2006 HY060G
Social exclusion not elsewhere classified - gross 15.5% 2.3% 0.0% 0.0% 97.6% 0.1%
2006 HY060N
Social exclusion not elsewhere classified - net 15.5% 2.3% 0.0% 0.0% 97.6% 0.1%
2006 HY070G Housing allowances - gross 0.7% 0.0% 0.0% 0.0% 97.3% 2.7%
2006 HY070N Housing allowances - net 0.7% 0.0% 0.0% 0.0% 97.3% 2.7%
2006 HY080G
Regular inter – household cash transfer received - gross 3.3% 10.2% 0.6% 0.0% 88.6% 0.6%
2006 HY080N
Regular inter – household cash transfer received - net 3.3% 10.2% 0.6% 0.0% 88.6% 0.6%
2006 HY090G
Interest, dividends, profit form capital investments in unincorporated business -gross 42.2% 9.4% 0.0% 0.0% 90.4% 0.1%
2006 HY090N
Interest, dividends, profit form capital investments in unincorporated business - net 42.2% 9.4% 0.0% 0.0% 90.4% 0.1%
2006 HY100G Interest repayments on mortgage gross 2.7% 84.1% 12.3% 0.0% 1.4% 2.2%
2006 HY100N Interest repayments on mortgage net 2.7% 84.1% 12.3% 0.0% 1.4% 2.2%
2006 HY110G
Income received by people aged under 16 gross 1.0% 0.0% 0.0% 0.0% 100.0% 0.0%
2006 HY110N
Income received by people aged under 16 net 1.0% 0.0% 0.0% 0.0% 100.0% 0.0%

Vožarski pot 12, SI-1000 Ljubljana, Slovenia Phone: +386 1 241 51 00; fax: +386 1 241 53 44; E-mail: [email protected]; www.stat.si
60/96
Year Variable Description % of HHS having received an amount
% of HHS with missing values (before imputations)
Total % of HHs with partial information (before imputations) - imputed 10% or more of amount
Total % of HHs with partial information (before imputations) - imputed less than 10% of amount
No imputations
The income were decreased after imputations
Imputation factor=0.00000
Imputation factor=0.00001 to 0.90000
Imputation factor =0.90001 to 0.99999
Imputation factor = 1.00000
Imputation factor > 1.00000
2006 HY120G Regular taxes on wealth gross 83.7% 18.0% 1.9% 0.2% 79.8% 0.1%
2006 HY120N Regular taxes on wealth net 83.7% 18.0% 1.9% 0.2% 79.8% 0.1%
2006 HY130G
Regular inter – household cash transfer paid – gross 5.3% 5.2% 0.0% 0.0% 91.4% 3.4%
2006 HY130N
Regular inter – household cash transfer paid - net 5.3% 5.2% 0.0% 0.0% 91.4% 3.4%
2006 HY140G Tax on income and social contribution 93.2% 1.5% 11.7% 2.0% 82.3% 2.5%
2006 HY140N Tax on income and social contribution 93.2% 1.5% 11.7% 2.0% 82.3% 2.5%
2006 HY145N Repayments/receipts for tax adjustment 91.7% 0.0% 0.0% 0.0% 100.0% 0.0%
2007 HY010 Total gross household income 100.0% 0.2% 12.9% 28.7% 57.3% 0.9%
2007 HY020 Total disposable household income 100.0% 0.1% 15.3% 25.7% 49.4% 9.4%
2007 HY022
Total disposable household income before social transfers except old age and survivor's benefits 99.6% 0.3% 17.1% 24.1% 49.4% 9.1%
2007 HY023
Total disposable household income before social transfers including old-age and survivor's benefits 98.9% 1.4% 20.2% 21.0% 49.3% 8.1%

Vožarski pot 12, SI-1000 Ljubljana, Slovenia Phone: +386 1 241 51 00; fax: +386 1 241 53 44; E-mail: [email protected]; www.stat.si
61/96
Year Variable Description % of HHS having received an amount
% of HHS with missing values (before imputations)
Total % of HHs with partial information (before imputations) - imputed 10% or more of amount
Total % of HHs with partial information (before imputations) - imputed less than 10% of amount
No imputations
The income were decreased after imputations
Imputation factor=0.00000
Imputation factor=0.00001 to 0.90000
Imputation factor =0.90001 to 0.99999
Imputation factor = 1.00000
Imputation factor > 1.00000
2007 HY040G
Income from rental of a property or land – gross 4.8% 0.0% 0.0% 0.0% 100.0% 0.0%
2007 HY040N
Income from rental of a property or land – net 4.8% 0.0% 0.0% 0.0% 100.0% 0.0%
2007 HY050G
Family/Children related allowances - gross 43.5% 0.0% 0.1% 0.0% 99.2% 0.7%
2007 HY050N
Family/Children related allowances - net 43.5% 0.0% 0.1% 0.0% 99.2% 0.7%
2007 HY060G
Social exclusion not elsewhere classified - gross 14.4% 3.1% 0.0% 0.0% 96.7% 0.2%
2007 HY060N
Social exclusion not elsewhere classified - net 14.4% 3.1% 0.0% 0.0% 96.7% 0.2%
2007 HY070G Housing allowances - gross 0.5% 0.0% 0.0% 0.0% 97.1% 2.9%
2007 HY070N Housing allowances - net 0.5% 0.0% 0.0% 0.0% 97.1% 2.9%
2007 HY080G
Regular inter – household cash transfer received - gross 3.0% 13.7% 6.3% 0.0% 77.6% 2.4%
2007 HY080N
Regular inter – household cash transfer received - net 3.0% 13.7% 6.3% 0.0% 77.6% 2.4%
2007 HY090G
Interest, dividends, profit form capital investments in unincorporated business -gross 35.4% 13.7% 0.4% 0.0% 85.5% 0.3%

Vožarski pot 12, SI-1000 Ljubljana, Slovenia Phone: +386 1 241 51 00; fax: +386 1 241 53 44; E-mail: [email protected]; www.stat.si
62/96
Year Variable Description % of HHS having received an amount
% of HHS with missing values (before imputations)
Total % of HHs with partial information (before imputations) - imputed 10% or more of amount
Total % of HHs with partial information (before imputations) - imputed less than 10% of amount
No imputations
The income were decreased after imputations
Imputation factor=0.00000
Imputation factor=0.00001 to 0.90000
Imputation factor =0.90001 to 0.99999
Imputation factor = 1.00000
Imputation factor > 1.00000
2007 HY090N
Interest, dividends, profit form capital investments in unincorporated business - net 35.4% 13.7% 0.4% 0.0% 85.5% 0.3%
2007 HY100G Interest repayments on mortgage gross 3.7% 74.5% 16.5% 0.0% 4.3% 4.7%
2007 HY100N Interest repayments on mortgage net 3.7% 74.5% 16.5% 0.0% 4.3% 4.7%
2007 HY110G
Income received by people aged under 16 gross 1.2% 0.0% 0.0% 0.0% 100.0% 0.0%
2007 HY110N
Income received by people aged under 16 net 1.2% 0.0% 0.0% 0.0% 100.0% 0.0%
2007 HY120G Regular taxes on wealth gross 87.6% 20.6% 2.0% 0.0% 77.3% 0.1%
2007 HY120N Regular taxes on wealth net 87.6% 20.6% 2.0% 0.0% 77.3% 0.1%
2007 HY130G
Regular inter – household cash transfer paid – gross 5.8% 8.1% 3.5% 0.0% 85.9% 2.5%
2007 HY130N
Regular inter – household cash transfer paid - net 5.8% 8.1% 3.5% 0.0% 85.9% 2.5%
2007 HY140G Tax on income and social contribution 90.1% 0.6% 6.5% 3.7% 88.7% 0.5%
2007 HY140N Tax on income and social contribution 90.1% 0.6% 6.5% 3.7% 88.7% 0.5%
2007 HY145N Repayments/receipts for tax adjustment 87.4% 0.0% 0.0% 0.0% 100.0% 0.0%
2008 HY010 Total gross household income 100.0% 0.1% 16.6% 36.2% 46.6% 0.6%

Vožarski pot 12, SI-1000 Ljubljana, Slovenia Phone: +386 1 241 51 00; fax: +386 1 241 53 44; E-mail: [email protected]; www.stat.si
63/96
Year Variable Description % of HHS having received an amount
% of HHS with missing values (before imputations)
Total % of HHs with partial information (before imputations) - imputed 10% or more of amount
Total % of HHs with partial information (before imputations) - imputed less than 10% of amount
No imputations
The income were decreased after imputations
Imputation factor=0.00000
Imputation factor=0.00001 to 0.90000
Imputation factor =0.90001 to 0.99999
Imputation factor = 1.00000
Imputation factor > 1.00000
2008 HY020 Total disposable household income 100.0% 0.1% 18.9% 32.7% 34.7% 13.6%
2008 HY022
Total disposable household income before social transfers except old age and survivor's benefits 99.8% 0.3% 21.1% 30.3% 34.7% 13.5%
2008 HY023
Total disposable household income before social transfers including old-age and survivor's benefits 98.7% 2.2% 26.0% 26.2% 34.2% 11.4%
2008 HY040G
Income from rental of a property or land – gross 6.5% 0.0% 0.0% 0.0% 100.0% 0.0%
2008 HY040N
Income from rental of a property or land – net 6.5% 0.0% 0.0% 0.0% 100.0% 0.0%
2008 HY050G
Family/Children related allowances - gross 42.5% 0.0% 0.0% 0.0% 100.0% 0.0%
2008 HY050N
Family/Children related allowances - net 42.5% 0.0% 0.0% 0.0% 100.0% 0.0%
2008 HY060G
Social exclusion not elsewhere classified - gross 11.0% 3.4% 0.0% 0.0% 96.6% 0.0%
2008 HY060N
Social exclusion not elsewhere classified - net 11.0% 3.4% 0.0% 0.0% 96.6% 0.0%
2008 HY070G Housing allowances - gross 0.6% 0.0% 0.0% 0.0% 100.0% 0.0%

Vožarski pot 12, SI-1000 Ljubljana, Slovenia Phone: +386 1 241 51 00; fax: +386 1 241 53 44; E-mail: [email protected]; www.stat.si
64/96
Year Variable Description % of HHS having received an amount
% of HHS with missing values (before imputations)
Total % of HHs with partial information (before imputations) - imputed 10% or more of amount
Total % of HHs with partial information (before imputations) - imputed less than 10% of amount
No imputations
The income were decreased after imputations
Imputation factor=0.00000
Imputation factor=0.00001 to 0.90000
Imputation factor =0.90001 to 0.99999
Imputation factor = 1.00000
Imputation factor > 1.00000
2008 HY070N Housing allowances - net 0.6% 0.0% 0.0% 0.0% 100.0% 0.0%
2008 HY080G
Regular inter – household cash transfer received - gross 3.0% 12.9% 5.9% 0.0% 78.2% 2.9%
2008 HY080N
Regular inter – household cash transfer received - net 3.0% 12.9% 5.9% 0.0% 78.2% 2.9%
2008 HY090G
Interest, dividends, profit form capital investments in unincorporated business -gross 39.4% 9.0% 6.8% 2.0% 81.7% 0.5%
2008 HY090N
Interest, dividends, profit form capital investments in unincorporated business - net 39.4% 9.0% 7.2% 1.5% 81.7% 0.5%
2008 HY100G Interest repayments on mortgage gross 4.9% 74.4% 16.8% 0.0% 7.0% 1.8%
2008 HY100N Interest repayments on mortgage net 4.9% 74.4% 16.8% 0.0% 7.0% 1.8%
2008 HY110G
Income received by people aged under 16 gross 1.4% 0.0% 0.0% 0.0% 100.0% 0.0%
2008 HY110N
Income received by people aged under 16 net 1.4% 0.0% 0.0% 0.0% 100.0% 0.0%
2008 HY120G Regular taxes on wealth gross 86.1% 34.3% 3.7% 0.2% 61.7% 0.1%
2008 HY120N Regular taxes on wealth net 86.1% 34.3% 3.7% 0.2% 61.7% 0.1%
2008 HY130G
Regular inter – household cash transfer paid – gross 6.3% 12.4% 4.5% 0.0% 79.9% 3.1%

Vožarski pot 12, SI-1000 Ljubljana, Slovenia Phone: +386 1 241 51 00; fax: +386 1 241 53 44; E-mail: [email protected]; www.stat.si
65/96
Year Variable Description % of HHS having received an amount
% of HHS with missing values (before imputations)
Total % of HHs with partial information (before imputations) - imputed 10% or more of amount
Total % of HHs with partial information (before imputations) - imputed less than 10% of amount
No imputations
The income were decreased after imputations
Imputation factor=0.00000
Imputation factor=0.00001 to 0.90000
Imputation factor =0.90001 to 0.99999
Imputation factor = 1.00000
Imputation factor > 1.00000
2008 HY130N
Regular inter – household cash transfer paid - net 6.3% 12.4% 4.5% 0.0% 79.9% 3.1%
2008 HY140G Tax on income and social contribution 87.4% 0.4% 13.3% 4.6% 81.3% 0.3%
2008 HY140N Tax on income and social contribution 87.4% 0.4% 13.3% 4.6% 81.3% 0.3%
2008 HY145N Repayments/receipts for tax adjustment 82.8% 0.0% 0.0% 0.0% 100.0% 0.0%
Source: Longitudinal database 2005-2008

Vožarski pot 12, SI-1000 Ljubljana, Slovenia Phone: +386 1 241 51 00; fax: +386 1 241 53 44; E-mail: [email protected]; www.stat.si
66/96
Table 48: Distribution of item non-response (unweig hted values), personal level, EU-SILC longitudinal 2005- 2008 database Year Variable Description % of
persons having received an amount
% of persons with missing values (before imputations)
Total % of persons with partial information (before imputations) - imputed 10% or more of amount
Total % of persons with partial information (before imputations) - imputed less than 10% of amount
No imputations
The income were decreased after imputations
Imputation factor=0.00000
Imputation factor=0.00001 to 0.90000
Imputation factor =0.90001 to 0.99999
Imputation factor = 1.00000
Imputation factor > 1.00000
2005 PY010G
Employee cash or near cash income - gross
63.3% 5.5% 10.1% 25.1% 59.3% 1.1%
2005 PY010N
Employee cash or near cash income -net
63.3% 5.5% 18.3% 17.0% 59.3% 1.1%
2005 PY020G
Non-Cash employee income - net
0.9% 19.7% 33.8% 4.2% 39.4% 2.8%
2005 PY020N
Non-Cash employee income - net
0.9% 19.7% 33.8% 4.2% 39.4% 2.8%
2005 PY021G Company car - gross
0.0% NA NA NA NA NA
2005 PY021N Company car - net
0.0% NA NA NA NA NA
2005 PY035G
Contributions to individual private pensions plans - gross
11.3% 25.4% 0.0% 0.0% 73.2% 1.3%
2005 PY035N
Contributions to individual private pensions plans - net
11.3% 25.4% 0.0% 0.0% 73.2% 1.3%
2005 PY050G
Cash benefits or losses from self-employment - gross
13.6% 27.0% 5.5% 0.7% 67.3% 1.4%
2005 PY050N
Cash benefits or losses from self-employment - net
13.6% 27.4% 5.8% 0.5% 67.1% 1.1%

Vožarski pot 12, SI-1000 Ljubljana, Slovenia Phone: +386 1 241 51 00; fax: +386 1 241 53 44; E-mail: [email protected]; www.stat.si
67/96
Year Variable Description % of persons having received an amount
% of persons with missing values (before imputations)
Total % of persons with partial information (before imputations) - imputed 10% or more of amount
Total % of persons with partial information (before imputations) - imputed less than 10% of amount
No imputations
The income were decreased after imputations
Imputation factor=0.00000
Imputation factor=0.00001 to 0.90000
Imputation factor =0.90001 to 0.99999
Imputation factor = 1.00000
Imputation factor > 1.00000
2005 PY070G
Value of goods produced by own consumption - gross
66.7% 1.0% 78.0% 19.8% 1.2% 0.0%
2005 PY070N
Value of goods produced by own consumption - net
66.7% 1.0% 78.0% 19.8% 1.2% 0.0%
2005 PY080G
Pension from individual private plans - gross
0.3% 0.0% 0.0% 0.0% 100.0% 0.0%
2005 PY080N
Pension from individual private plans - net
0.3% 0.0% 0.0% 0.0% 100.0% 0.0%
2005 PY090G Unemployment benefits – gross
2.7% 0.0% 0.0% 0.0% 100.0% 0.0%
2005 PY090N Unemployment benefits - net
2.7% 0.0% 0.0% 0.0% 100.0% 0.0%
2005 PY100G Old age benefits - gross
17.9% 0.2% 0.0% 0.0% 99.8% 0.0%
2005 PY100N Old age benefits - net
17.8% 0.0% 0.0% 0.0% 100.0% 0.0%
2005 PY110G Survivor' age benefits - gross
3.3% 0.0% 0.0% 0.0% 100.0% 0.0%
2005 PY110N Survivor' age benefits - net
3.3% 0.0% 0.0% 0.0% 100.0% 0.0%
2005 PY120G Sickness benefits - gross
9.1% 0.8% 0.0% 0.0% 99.2% 0.0%
2005 PY120N Sickness benefits - net
9.1% 0.8% 0.0% 0.0% 99.2% 0.0%
2005 PY130G Disability benefits - gross
7.5% 0.0% 0.0% 0.0% 100.0% 0.0%
2005 PY130N Disability benefits - net
7.5% 0.0% 0.0% 0.0% 100.0% 0.0%
2005 PY140G
Education related allowances - gross
5.9% 0.0% 0.0% 0.0% 100.0% 0.0%

Vožarski pot 12, SI-1000 Ljubljana, Slovenia Phone: +386 1 241 51 00; fax: +386 1 241 53 44; E-mail: [email protected]; www.stat.si
68/96
Year Variable Description % of persons having received an amount
% of persons with missing values (before imputations)
Total % of persons with partial information (before imputations) - imputed 10% or more of amount
Total % of persons with partial information (before imputations) - imputed less than 10% of amount
No imputations
The income were decreased after imputations
Imputation factor=0.00000
Imputation factor=0.00001 to 0.90000
Imputation factor =0.90001 to 0.99999
Imputation factor = 1.00000
Imputation factor > 1.00000
2005 PY140N
Education related allowances- net
5.9% 0.0% 0.0% 0.0% 100.0% 0.0%
2006 PY010G
Employee cash or near cash income - gross
61.0% 4.0% 5.5% 11.3% 79.0% 0.2%
2006 PY010N
Employee cash or near cash income -net
61.0% 4.0% 8.2% 8.6% 79.0% 0.2%
2006 PY020G
Non-Cash employee income - net
0.8% 16.8% 0.0% 0.0% 83.2% 0.0%
2006 PY020N
Non-Cash employee income - net
0.8% 16.8% 0.0% 0.0% 83.2% 0.0%
2006 PY021G Company car - gross
0.0% NA NA NA NA NA
2006 PY021N Company car - net
0.0% NA NA NA NA NA
2006 PY035G
Contributions to individual private pensions plans - gross
11.9% 23.5% 0.1% 0.0% 76.3% 0.2%
2006 PY035N
Contributions to individual private pensions plans - net
11.9% 23.5% 0.1% 0.0% 76.3% 0.2%
2006 PY050G
Cash benefits or losses from self-employment - gross
15.5% 33.1% 8.1% 1.4% 56.6% 0.9%
2006 PY050N
Cash benefits or losses from self-employment - net
15.5% 33.1% 8.3% 1.3% 56.6% 0.9%
2006 PY070G
Value of goods produced by own consumption - gross
59.5% 39.5% 1.3% 0.6% 54.0% 4.5%

Vožarski pot 12, SI-1000 Ljubljana, Slovenia Phone: +386 1 241 51 00; fax: +386 1 241 53 44; E-mail: [email protected]; www.stat.si
69/96
Year Variable Description % of persons having received an amount
% of persons with missing values (before imputations)
Total % of persons with partial information (before imputations) - imputed 10% or more of amount
Total % of persons with partial information (before imputations) - imputed less than 10% of amount
No imputations
The income were decreased after imputations
Imputation factor=0.00000
Imputation factor=0.00001 to 0.90000
Imputation factor =0.90001 to 0.99999
Imputation factor = 1.00000
Imputation factor > 1.00000
2006 PY070N
Value of goods produced by own consumption - net
59.5% 39.5% 1.3% 0.6% 54.0% 4.5%
2006 PY080G
Pension from individual private plans - gross
0.3% 18.9% 10.8% 0.0% 70.3% 0.0%
2006 PY080N
Pension from individual private plans - net
0.3% 18.9% 10.8% 0.0% 70.3% 0.0%
2006 PY090G Unemployment benefits - gross
2.4% 0.0% 0.0% 0.0% 99.7% 0.3%
2006 PY090N Unemployment benefits - net
2.4% 0.0% 0.0% 0.0% 99.7% 0.3%
2006 PY100G Old age benefits - gross
17.3% 0.7% 0.0% 0.0% 99.2% 0.0%
2006 PY100N Old age benefits - net
17.3% 0.7% 0.0% 0.0% 99.2% 0.0%
2006 PY110G Survivor' age benefits - gross
3.5% 0.4% 0.8% 0.2% 97.8% 0.8%
2006 PY110N Survivor' age benefits - net
3.5% 0.4% 0.8% 0.2% 97.8% 0.8%
2006 PY120G Sickness benefits - gross
8.9% 10.1% 0.0% 0.0% 89.9% 0.0%
2006 PY120N Sickness benefits - net
8.9% 10.1% 0.0% 0.0% 89.9% 0.0%
2006 PY130G Disability benefits - gross
7.1% 0.8% 0.5% 0.1% 98.5% 0.1%
2006 PY130N Disability benefits - net
7.1% 0.8% 0.5% 0.1% 98.6% 0.0%
2006 PY140G
Education related allowances - gross
5.4% 0.0% 0.0% 0.0% 99.6% 0.4%
2006 PY140N
Education related allowances- net
5.4% 0.0% 0.0% 0.0% 99.6% 0.4%

Vožarski pot 12, SI-1000 Ljubljana, Slovenia Phone: +386 1 241 51 00; fax: +386 1 241 53 44; E-mail: [email protected]; www.stat.si
70/96
Year Variable Description % of persons having received an amount
% of persons with missing values (before imputations)
Total % of persons with partial information (before imputations) - imputed 10% or more of amount
Total % of persons with partial information (before imputations) - imputed less than 10% of amount
No imputations
The income were decreased after imputations
Imputation factor=0.00000
Imputation factor=0.00001 to 0.90000
Imputation factor =0.90001 to 0.99999
Imputation factor = 1.00000
Imputation factor > 1.00000
2007 PY010G
Employee cash or near cash income - gross
60.7% 2.9% 6.9% 15.0% 74.6% 0.5%
2007 PY010N
Employee cash or near cash income -net
60.7% 2.9% 10.8% 11.2% 74.6% 0.5%
2007 PY020G
Non-Cash employee income - net
10.3% 4.6% 1.3% 0.1% 93.9% 0.0%
2007 PY020N
Non-Cash employee income - net
10.3% 4.6% 1.1% 0.0% 94.3% 0.0%
2007 PY021G Company car - gross
0.8% 37.7% 0.0% 0.0% 62.3% 0.0%
2007 PY021N Company car - net
0.8% 37.7% 0.0% 0.0% 62.3% 0.0%
2007 PY035G
Contributions to individual private pensions plans - gross
19.3% 26.4% 0.1% 0.0% 73.2% 0.3%
2007 PY035N
Contributions to individual private pensions plans - net
19.3% 26.4% 0.1% 0.0% 73.2% 0.3%
2007 PY050G
Cash benefits or losses from self-employment - gross
15.6% 36.1% 7.3% 1.3% 54.2% 1.2%
2007 PY050N
Cash benefits or losses from self-employment - net
15.6% 36.1% 7.4% 1.1% 54.2% 1.2%
2007 PY070G
Value of goods produced by own consumption - gross
57.5% 52.4% 1.5% 0.7% 41.8% 3.7%
2007 PY070N
Value of goods produced by own consumption –
57.5% 52.4% 1.5% 0.7% 41.8% 3.7%

Vožarski pot 12, SI-1000 Ljubljana, Slovenia Phone: +386 1 241 51 00; fax: +386 1 241 53 44; E-mail: [email protected]; www.stat.si
71/96
Year Variable Description % of persons having received an amount
% of persons with missing values (before imputations)
Total % of persons with partial information (before imputations) - imputed 10% or more of amount
Total % of persons with partial information (before imputations) - imputed less than 10% of amount
No imputations
The income were decreased after imputations
Imputation factor=0.00000
Imputation factor=0.00001 to 0.90000
Imputation factor =0.90001 to 0.99999
Imputation factor = 1.00000
Imputation factor > 1.00000
net
2007 PY080G
Pension from individual private plans - gross
0.7% 11.0% 0.0% 0.0% 85.3% 3.7%
2007 PY080N
Pension from individual private plans - net
0.7% 11.0% 0.0% 0.0% 85.3% 3.7%
2007 PY090G Unemployment benefits - gross
2.3% 0.0% 0.0% 0.0% 100.0% 0.0%
2007 PY090N Unemployment benefits - net
2.3% 0.0% 0.0% 0.0% 100.0% 0.0%
2007 PY100G Old age benefits - gross
18.4% 1.3% 0.0% 0.0% 98.7% 0.0%
2007 PY100N Old age benefits - net
18.4% 1.3% 0.0% 0.0% 98.7% 0.0%
2007 PY110G Survivor' age benefits – gross
3.5% 0.4% 0.0% 0.0% 99.3% 0.3%
2007 PY110N Survivor' age benefits - net
3.5% 0.4% 0.0% 0.0% 99.3% 0.3%
2007 PY120G Sickness benefits - gross
10.7% 9.3% 0.0% 0.0% 89.9% 0.8%
2007 PY120N Sickness benefits - net
10.7% 9.3% 0.0% 0.0% 89.9% 0.8%
2007 PY130G Disability benefits - gross
7.1% 0.2% 0.1% 0.0% 99.6% 0.1%
2007 PY130N Disability benefits - net
7.1% 0.2% 0.1% 0.0% 99.6% 0.1%
2007 PY140G
Education related allowances - gross
5.2% 0.0% 0.0% 0.0% 100.0% 0.0%
2007 PY140N
Education related allowances- net
5.2% 0.0% 0.0% 0.0% 100.0% 0.0%

Vožarski pot 12, SI-1000 Ljubljana, Slovenia Phone: +386 1 241 51 00; fax: +386 1 241 53 44; E-mail: [email protected]; www.stat.si
72/96
Year Variable Description % of persons having received an amount
% of persons with missing values (before imputations)
Total % of persons with partial information (before imputations) - imputed 10% or more of amount
Total % of persons with partial information (before imputations) - imputed less than 10% of amount
No imputations
The income were decreased after imputations
Imputation factor=0.00000
Imputation factor=0.00001 to 0.90000
Imputation factor =0.90001 to 0.99999
Imputation factor = 1.00000
Imputation factor > 1.00000
2008 PY010G
Employee cash or near cash income - gross
63.0% 3.7% 12.3% 19.6% 64.0% 0.4%
2008 PY010N
Employee cash or near cash income -net
63.0% 3.7% 17.1% 14.5% 64.2% 0.4%
2008 PY020G
Non-Cash employee income - net
10.3% 9.7% 3.0% 0.1% 87.2% 0.0%
2008 PY020N
Non-Cash employee income - net
10.3% 9.7% 2.3% 0.3% 87.7% 0.0%
2008 PY021G Company car - gross
1.5% 52.2% 2.2% 0.0% 45.2% 0.4%
2008 PY021N Company car - net
1.5% 52.2% 2.2% 0.0% 45.2% 0.4%
2008 PY035G
Contributions to individual private pensions plans - gross
24.1% 35.2% 0.0% 0.0% 64.6% 0.1%
2008 PY035N
Contributions to individual private pensions plans - net
24.1% 35.2% 0.0% 0.0% 64.6% 0.1%
2008 PY050G
Cash benefits or losses from self-employment - gross
14.2% 20.4% 16.0% 3.2% 59.6% 0.9%
2008 PY050N
Cash benefits or losses from self-employment - net
14.2% 20.4% 16.3% 2.8% 59.6% 0.9%
2008 PY070G
Value of goods produced by own consumption - gross
65.1% 79.5% 2.0% 0.8% 16.5% 1.3%

Vožarski pot 12, SI-1000 Ljubljana, Slovenia Phone: +386 1 241 51 00; fax: +386 1 241 53 44; E-mail: [email protected]; www.stat.si
73/96
Year Variable Description % of persons having received an amount
% of persons with missing values (before imputations)
Total % of persons with partial information (before imputations) - imputed 10% or more of amount
Total % of persons with partial information (before imputations) - imputed less than 10% of amount
No imputations
The income were decreased after imputations
Imputation factor=0.00000
Imputation factor=0.00001 to 0.90000
Imputation factor =0.90001 to 0.99999
Imputation factor = 1.00000
Imputation factor > 1.00000
2008 PY070N
Value of goods produced by own consumption - net
65.1% 79.5% 2.0% 0.8% 16.5% 1.3%
2008 PY080G
Pension from individual private plans - gross
0.9% 17.6% 3.7% 0.0% 75.0% 3.7%
2008 PY080N
Pension from individual private plans - net
0.9% 17.6% 3.7% 0.0% 75.0% 3.7%
2008 PY090G Unemployment benefits - gross
1.9% 0.0% 0.0% 0.0% 100.0% 0.0%
2008 PY090N Unemployment benefits - net
1.9% 0.0% 0.0% 0.0% 100.0% 0.0%
2008 PY100G Old age benefits - gross
19.0% 1.2% 0.0% 0.0% 98.8% 0.0%
2008 PY100N Old age benefits - net
19.0% 1.2% 0.0% 0.0% 98.8% 0.0%
2008 PY110G Survivor' age benefits - gross
3.4% 0.0% 0.0% 0.0% 100.0% 0.0%
2008 PY110N Survivor' age benefits - net
3.4% 0.0% 0.0% 0.0% 100.0% 0.0%
2008 PY120G Sickness benefits - gross
13.0% 13.6% 3.0% 0.0% 83.3% 0.0%
2008 PY120N Sickness benefits - net
13.0% 13.6% 2.6% 0.0% 83.7% 0.0%
2008 PY130G Disability benefits - gross
6.8% 0.2% 0.0% 0.0% 99.7% 0.1%
2008 PY130N Disability benefits - net
6.8% 0.2% 0.0% 0.0% 99.7% 0.1%
2008 PY140G
Education related allowances - gross
5.0% 0.0% 0.0% 0.0% 100.0% 0.0%
2008 PY140N
Education related allowances- net
5.0% 0.0% 0.0% 0.0% 100.0% 0.0%
Source: Longitudinal database 2005-2008

Vožarski pot 12, SI-1000 Ljubljana, Slovenia Phone: +386 1 241 51 00; fax: +386 1 241 53 44; E-mail: [email protected]; www.stat.si
74/96
The reason why decreased disposable income (HY020) in relatively a lot of numbers of households were in fact that HY120 were relatively often imputed and this caused that HY020 decreased. In the first stage we imputed: In the case of partial non-response were imputed next income variables:
• Income from farming (in the questionnaire) • Reimbursement for travel to/from work • Allowance for meal • Non-cash employee income (company car) – components (value of the car,
months of use it) • Regular inter household transfers received • Regular inter household transfer paid • Contribution to private pensions plans • Sickness benefits (numbers of days when person get sickness leave) • Tax on wealth • Interests paid for mortgage (components to calculate interests) • Interests (received) • Consumption from own production (all components to calculate own
production) We imputed in 2008 also the following non income variables:
• Number of rooms • Leaking roof, damp walls/floors/foundation, or rot in window frames or floor • Arrears on utility bills • Arrears on hire purchase instalments or other loan payments • Capacity to afford paying for one week annual holiday away from home • Capacity to affrord a meal with meat, chicken… • Problems with the dwelling:too dark, not enough light • Noise from neighborus or from street • Pollution, grime or other enviromental problems • Crime violence or vandalism in the area • Total housing costs (all components from the questionnaire) • Subjective rent • Telephone • Colour TV • PC • Washing machine • Car • Lowest monthly income to make ends meet • Child care • Activity status during the income reference period (PL210A-PL210L) • Year when highest level of education was attained • Highest ISCED level attained • When bagan first regular job • Number of years spent in paid work

Vožarski pot 12, SI-1000 Ljubljana, Slovenia Phone: +386 1 241 51 00; fax: +386 1 241 53 44; E-mail: [email protected]; www.stat.si
75/96
• General health • Varibales in ad hoc module
In the second stage of imputations we imputed: PY010 in the case that person received reimbursement for travel to/from work or allowance for meal or that PL070 is not 0 and PY010 is 0. PY050 in the case that self employed person do not have any income (no profit, no wage, no social or family benefits, unemployed benefits). In such cases we imputed the values of minimal social benefits. We have large share of the households where some income are imputed. We found out that the most frequently were imputed reimbursement for travel to/from work and tax on wealth. For income variables where we collected the data in the questionnaires by open questions and after that we have a scale as help the imputations factors were calculated according to the open question. This mean, that in the case that person answer on the question on the scale, looks like that the all amount was imputed. Imputations factors also include manual editing and corrections of the extreme values. In the last case the imputation factor has value higher than 1. Special case is PY070G/N, where we transmited the data from year to year in the case that household respond that had the approximately the same quantities of own production. This is the reason why PY070 looks like that is in so many cases completely imputed. We found out that is very difficult to ask all qeuestion about mortgage (HY100G/N). There we had several qeustions about mortage and we found out that in the most cases miss interest rate which we need to calculate interest of mortgage. We asked also some other necessary variables to calculate the interest, but usually other variables do not make troubles for interviewers.
2.4 Mode of data collection We used in 2006, 2007 and 2008 CAPI, CATI and other administrative sources. Each household participated in EU-SILC were interviewed face-to-face or by phone. CAPI were interviewed households in the first wave, all households who were moved to another address, hoseholds who did not inform us last year about phone number (did not wish to answer on the quesiton about phone number or did not have phone) and the households to whom we did not make a contact by phone during the inteviewing period for CATI interviewing. In 2005 completely field work was done by PAPI. Except the questionnaire we used also the following administrative sources from different institutions:
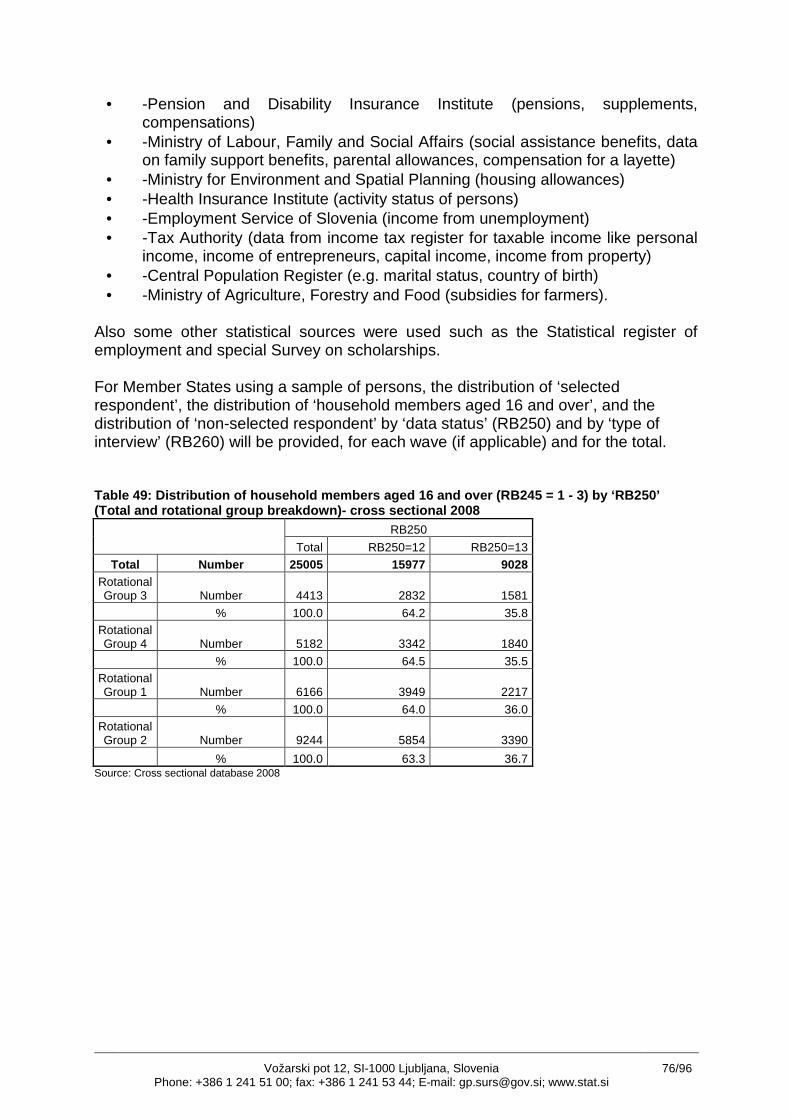
Vožarski pot 12, SI-1000 Ljubljana, Slovenia Phone: +386 1 241 51 00; fax: +386 1 241 53 44; E-mail: [email protected]; www.stat.si
76/96
• -Pension and Disability Insurance Institute (pensions, supplements, compensations)
• -Ministry of Labour, Family and Social Affairs (social assistance benefits, data on family support benefits, parental allowances, compensation for a layette)
• -Ministry for Environment and Spatial Planning (housing allowances) • -Health Insurance Institute (activity status of persons) • -Employment Service of Slovenia (income from unemployment) • -Tax Authority (data from income tax register for taxable income like personal
income, income of entrepreneurs, capital income, income from property) • -Central Population Register (e.g. marital status, country of birth) • -Ministry of Agriculture, Forestry and Food (subsidies for farmers).
Also some other statistical sources were used such as the Statistical register of employment and special Survey on scholarships. For Member States using a sample of persons, the distribution of ‘selected respondent’, the distribution of ‘household members aged 16 and over’, and the distribution of ‘non-selected respondent’ by ‘data status’ (RB250) and by ‘type of interview’ (RB260) will be provided, for each wave (if applicable) and for the total. Table 49: Distribution of household members aged 16 and over (RB245 = 1 - 3) by ‘RB250’ (Total and rotational group breakdown)- cross secti onal 2008 RB250
Total RB250=12 RB250=13 Total Number 25005 15977 9028
Rotational Group 3 Number 4413 2832 1581
% 100.0 64.2 35.8 Rotational Group 4 Number 5182 3342 1840
% 100.0 64.5 35.5 Rotational Group 1 Number 6166 3949 2217
% 100.0 64.0 36.0 Rotational Group 2 Number 9244 5854 3390
% 100.0 63.3 36.7 Source: Cross sectional database 2008

Vožarski pot 12, SI-1000 Ljubljana, Slovenia Phone: +386 1 241 51 00; fax: +386 1 241 53 44; E-mail: [email protected]; www.stat.si
77/96
Table 50: Distribution of household members aged 16 and over (RB245 = 2) by ‘RB250’ (Total and rotational group breakdown)- cross sectional 20 07 RB250
Total RB250=13
Total Number 9028 9028 Rotational Group 3 Number 1581 1581
% 100.0 100.0 Rotational Group 4 Number 1840 1840
% 100.0 100.0 Rotational Group 1 Number 2217 2217
% 100.0 100.0 Rotational Group 2 Number 3390 3390
% 100.0 100.0 Source: Cross sectional database 2008
Table 51: Distribution of household members aged 16 and over (RB245 = 3) by ‘RB250’ (Total and rotational group breakdown)- cross sectional 20 07 RB250
Total RB250=12
Total Number 15977 15977 Rotational Group 3 Number 2832 2832
% 100.0 100.0 Rotational Group 4 Number 3342 3342
% 100.0 100.0 Rotational Group 1 Number 3949 3949
% 100.0 100.0 Rotational Group 2 Number 5854 5854
% 100.0 100.0 Source: Cross sectional database 2008
Table 52: Distribution of household members aged 16 and over (RB245 = 1 - 3) by ‘RB250’ by wave RB010 RB250=12 RB250=13 Total
2005 5150 2759 7909 2006 9307 5078 14385 2007 12631 6883 19514 2008 10072 5609 15681
Total 37160 20329 57489 Source: Longitudinal database 2005-2008

Vožarski pot 12, SI-1000 Ljubljana, Slovenia Phone: +386 1 241 51 00; fax: +386 1 241 53 44; E-mail: [email protected]; www.stat.si
78/96
Table 53: Distribution of household members aged 16 and over (RB245 = 2) by ‘RB250’ by wave RB010 RB250=12 RB250=13 Total
2005 2 2757 2759 2006 0 5078 5078 2007 0 6883 6883 2008 0 5609 5609
Total 2 20327 20329 Source: Longitudinal database 2005-2008 Table 54: Distribution of household members aged 16 and over (RB245 = 3) by ‘RB250’ by wave RB010 RB250=12 RB250=13 Total
2005 5148 2 5150 2006 9307 0 9307 2007 12631 0 12631 2008 10072 0 10072
Total 37158 2 37160 Source: Longitudinal database 2005-2008 RB250=12 information completed only from registers RB250=13 information completed from both: interview and registers Table 55: Distribution of household members aged 16 and over by ‘RB260’ (Total and rotational group breakdown) cross sectional 2008 RB260
Total RB260=2 RB260=3 RB260=5
Total Number 9028 3562 3391 2075
% 100 39.5 37.6 23.0 Rotat.
Group 3 Number 1581 182 1005 394
% 100.0 11.5 63.6 24.9 Rotat.
Group 4 Number 1840 284 1077 479
% 100.0 15.4 58.5 26.0 Rotat.
Group 1 Number 2217 361 1309 547
% 100.0 16.3 59.0 24.7 Rotat.
Group 2 Number 3390 2735 0 655
% 100.0 80.7 0.0 19.3 Source: Cross sectional database 2008
Table 56: Distribution of household members aged 16 and over (RB245 = 1 – 3) by ‘RB260’ and wave Year RB260=1 RB260=2 RB260=3 RB260=5 Total
2005 2060 0 0 699 2759 2006 0 2627 1211 1240 5078 2007 0 2664 2406 1813 6883 2008 0 820 3373 1416 5609
Total 2060 6111 6990 5168 20329 Source: Longitudinal database 2005-2008

Vožarski pot 12, SI-1000 Ljubljana, Slovenia Phone: +386 1 241 51 00; fax: +386 1 241 53 44; E-mail: [email protected]; www.stat.si
79/96
Table 57: Distribution of household members aged 16 and over (RB245 = 2) by ‘RB260’ and wave Year RB260=1 RB260=2 RB260=3 RB260=5 Total
2005 2059 0 0 698 2757 2006 0 2627 1211 1240 5078 2007 0 2664 2406 1813 6883 2008 0 820 3373 1416 5609
Total 2059 6111 6990 5167 20327 Source: Longitudinal database 2005-2008 Table 58: Distribution of household members aged 16 and over (RB245 = 3) by ‘RB260’ and wave Year RB260=1 RB260=2 RB260=3 RB260=5 Total
2005 1 0 0 1 2 2006 0 0 0 0 0 2007 0 0 0 0 0 2008 0 0 0 0 0
Total 1 0 0 1 2 Source: Longitudinal database 2005-2008 RB260=1 face to face interview PAPI RB260=2 face to face interview CAPI RB260=3 CATI, telephone interview RB260=5 proxy interview
Vožarski pot 12, SI-1000 Ljubljana, Slovenia Phone: +386 1 241 51 00; fax: +386 1 241 53 44; E-mail: [email protected]; www.stat.si
80/96
2.5 Imputation procedure We used different types of the imputations for different kinds of variables. In general we used three different methods with different parameterizations: Hot-deck method (or Nearest Neighbour version) with different imputation cells defined; Trimmed average method with different imputation cells and different trim-threshold defined; Logical imputations. For incomes variable we used several stages of imputations. In the first stage we imputed the allowances for transport to/from work and lunch allowance. In the second stage we imputed the incomes for employed and self-employed persons who received no income. When we imputed wages we calculated the average wages according to different categories (gender, age, education) and we imputed the (trimmed) average instead of missing values. For self-employed persons without any income we imputed the income in the level of minimal social benefit (logical imputations). The percentages of the imputed values are given in the tables 47 and 48.
2.6 Imputed rent Variable in 2005 and 2006 was not recorded. In 2007 was this variable introduced into the EU-SILC. We used stratification method. As outside source for rents we used additional survey about tenants, which was conducted in 2003. We adjusted the prices from that time to year 2007 and 2008 as well. In SILC we used the following to define stratums: 1) Ljubljana, not Ljubljana (Ljubljana is capital of Slovenia) 2) Have central heating, do not have central heating 3) numbers of room – garsonniere,1,2,3,more than 3.
2.7 Company cars We asked in the questionnaire several questions about company cars. We asked for make, model of the car, months of use it, year of production of the car. After that we use the national tax rules about depreciation of the car to calculate the benefit.

Vožarski pot 12, SI-1000 Ljubljana, Slovenia Phone: +386 1 241 51 00; fax: +386 1 241 53 44; E-mail: [email protected]; www.stat.si
81/96
3 Comparability
3.1 Basic concepts and definitions The reference population The reference population is persons in central register of population aged 16 years or more. In the central register of population were included only persons with Slovenian citizenship for years 2005 and 2006. In 2007 we included also persons with foreign citizenship. The private household definition There were no divergences from the common definition. The household membership There were no divergences from the common definition. The income reference period used The income reference period in EU-SILC is one year before conducting survey; this means that in 2005 the refrence income period was 2004, in 2006 the income reference period was 2005, in 2007 incomre reference period was 2006 and in 2008 income period was 2007. The period for taxes on income and social insurance contribution The period in all EU-SILC excercises were the same as income reference period. The reference period for taxes on wealth The reference period for taxes on wealth was previous calendar year. These data we collected in 2006 for period 2005 and adjusted to for the year 2004. In the beginning we derogated this variable, but after that we decided what should be tax on wealth in Slovenia. In 2006 we began with the regular collection of these data. The reference period is the same as income refrence period. The lag between the income reference period and current variables The lag between the income reference period and current variables ranges from 2 to 6 months. Because we collected the income data from of incomes registers, this lag is not so important.

Vožarski pot 12, SI-1000 Ljubljana, Slovenia Phone: +386 1 241 51 00; fax: +386 1 241 53 44; E-mail: [email protected]; www.stat.si
82/96
Table 59: Distribution of households according to t he month of interview in 2005, PAPI interviewing Month of interview Frequency Percent Cumulative
frequency Cumulative percent
February 1109 13.39 1109 13.39 March 2238 27.01 3347 40.40 April 2038 24.60 5385 65.00 May 2304 27.81 7689 92.81 June 596 7.19 8285 100.00 Source: Cross sectional database 2005
Table 60: Distribution of households according to t he month of interview in 2006, CAPI+CATI interviewing Month of interview Frequency Percent Cumulative
frequency Cumulative percent
February 5316 56.09 5316 56.09 March 3077 32.46 8393 88.55 April 732 7.72 9125 96.28 May 350 3.69 9475 99.97 June 3 0.03 9478 100.00 Source: Cross sectional database 2006
Table 61: Distribution of households according to t he month of interview in 2006, CAPI interviewing Month of interview Frequency Percent Cumulative
frequency Cumulative percent
February 1807 43.37 1807 43.37 March 1274 30.58 3081 73.96 April 732 17.57 3813 91.53 May 350 8.40 4163 99.93 June 3 0.07 4166 100.00 Source: Cross sectional database 2006
Table 62: Distribution of households according to t he month of interview in 2006, CATI interviewing Month of interview Frequency Percent Cumulative
frequency Cumulative percent
February 3509 66.06 3509 66.06 March 1803 33.94 5312 100.00 Source: Cross sectional database 2006
Table 63: Distribution of households according to t he month of interview in 2007, CAPI+CATI interviewing Month of interview Frequency Percent Culumutive
frequency Cumulutive percent
February 4947 56.8 4947 56.8 March 2933 33.7 7880 90.5 April 441 5.1 8321 95.6 May 272 3.1 8593 98.7 June 114 1.3 8707 100.0 Source: Cross sectional database 2007

Vožarski pot 12, SI-1000 Ljubljana, Slovenia Phone: +386 1 241 51 00; fax: +386 1 241 53 44; E-mail: [email protected]; www.stat.si
83/96
Table 64: Distribution of households according to t he month of interview in 2007, CAPI interviewing Month of interview Frequency Percent Comulutive
frequency Comulutive percent
February 1663 45.0 1663 45.0 March 1206 32.6 2869 77.6 April 441 11.9 3310 89.5 May 272 7.4 3582 96.9 June 114 3.1 3696 100.0 Source: Cross sectional database 2007
Table 65: Distribution of households according to t he month of interview in 2007, CATI interviewing Month of interview Frequency Percent Comulutive
frequency Comulutive percent
February 3284 65.5 3284 65.5 March 1727 34.5 5011 100.0 Source: Cross sectional database 2007
Table 66: Distribution of households according to t he month of interview in 2008 CATI+CAPI Month of interview Frequency Percent Total 9028 100.0
2 February 4994 55.3 3 March 2740 30.4 4 April 731 8.1 5 May 385 4.3 6 June 178 2.0
Source: Slovenian cross-sectional databases 2008
Table 67: Distribution of households according to t he month of interview in 2008 CAPI Month of interview Frequency Percent Total 4396 48.7
2 February 1891 20.9 3 March 1211 13.4 4 April 731 8.1 5 May 385 4.3 6 June 178 2.0
Source: Slovenian cross-sectional databases 2008
Table 68: Distribution of households according to t he month of interview in 2008 CATI Month of interview Frequency Percent Total 4632 51.3
2 February 3103 34.4 3 March 1529 16.9
Source: Slovenian cross-sectional databases 2008
Table 69: Distribution of households according to t he month of interview by wave in longitudinal database 2005 - 2008
Year 2005
Year 2006
Year 2007
Year 2008
February 240 2822 3827 3369 Mach 645 1648 2329 1672 April 653 409 414 211 May 919 197 227 265 June 302 2 86 92
Source: Longitudinal database 2005-2008

Vožarski pot 12, SI-1000 Ljubljana, Slovenia Phone: +386 1 241 51 00; fax: +386 1 241 53 44; E-mail: [email protected]; www.stat.si
84/96
The total duration of the data collection of the sample The field work in 2005 lasted from February 2005 to June 2006 and in 2006 field work lasted from February 2006 to June 2006 and in 2007 field work lasted from February 2007 to June 2007 and in 2008 field work lasted from February 2008 to June 2008. Basic information on activity status during the income reference period This information was collected from outside sources. We took the data on the last day of the each month from Statistical register of employment and from National Health Insurance Company.

Vožarski pot 12, SI-1000 Ljubljana, Slovenia Phone: +386 1 241 51 00; fax: +386 1 241 53 44; E-mail: [email protected]; www.stat.si
85/96
3.2 Components of income
3.2.1 Differences between the national definitions and st andard EU-SILC definitions, and an assessment of the consequences of the differences mentioned will be reported for the foll owing target variables
This section gives an detailed overview of how the income data from registers have been organised in order to be comparable to the income concepts outlined in the SILC guidelines. In addition references are made to any digression from these guidelines. Most of the data derived from registers are recorded gross at component level. All income data are collected at the individual level (i.e. the person registered as the receiver of the income). This also concerns typically “household” related incomes such as housing benefits and social assistance. The datafile from Tax authority was edited in advance. Before we began to data processing in accordance with SILC guidelines we checked the data from tax datafile. We edited impossible values (for example negative values) and some very extreme values. Some imputations were made in advance – we did logical checks between two registers – tax register and statistical register of employment. These imputations are not included into the imputation factor in the EU-SILC database. All other income files (social allowances, pensions etc.) were not edited in advance. After the data were included into EU-SILC databases, we used BANFF programm to reduce extreme values and these changes from other sources are included into imputations factors.. Variable Description HY010 Total gross
household income HY010=PY010G+PY020G (only car)+PY050G+PY090G+PY100G+PY110G+PY120G+PY130G+PY140G (for all households members) +HY040G+HY050G+HY060G+HY070G+HY080G+HY090G+HY110G
HY020 Total disposable household income
HY020=PY010N+PY020N (only car)+PY050N+PY090N+PY100N+PY110N+PY120N+PY130N+PY140N (for all households members) +HY040N+HY050N+HY060N+HY070N+HY080N+HY090N+HY110N-HY120G-HY130G-HY145N
HY022 Total disposable household income before social transfers except old age and survivor's benefits
HY022=HY020-PY090N-PY120N-PY130N-PY140N (variables PYxxxN for all household members) – HY050N-HY060N-HY070N

Vožarski pot 12, SI-1000 Ljubljana, Slovenia Phone: +386 1 241 51 00; fax: +386 1 241 53 44; E-mail: [email protected]; www.stat.si
86/96
HY023 Total disposable household income before social transfers including old-age and survivor's benefits
HY023=HY020-PY090N-PY100N-PY110N-PY120N-PY130N-PY140N (variables PYxxxN for all household members) – HY050N-HY060N-HY070
HY040G Income from rental of a property or land – gross
Tax declaration: Income reference period: HB010-1 (year of survey – 1)
HY040N Income from rental of a property or land – net
Tax declaration: Income reference period: HB010-1 (year of survey – 1)
HY090G Interest, dividends, profit form capital investments in unincorporated business
Interest from questionnaire Dividends and profits from tax declaration Income reference period: HB010-1 (year of survey – 1)
HY090N Interest, dividends, profit form capital investments in unincorporated business
Interest from questionnaire Dividends and profits from tax declaration Income reference period: HB010-1 (year of survey – 1)
HY050G Family/Children related allowances
Administrative source from Ministry for labour, family and social affairs. Income reference period: HB010-1 (year of survey – 1)
HY050N Family/Children related allowances
Administrative source from Ministry for labour, family and social affairs. Income reference period: HB010-1 (year of survey – 1)
HY060G Social exclusion not elsewhere classified
Humanitarian aid from questionnaire Social exclusion from administrative sources Income reference period: HB010-1 (year of survey – 1)
HY060N Social exclusion not elsewhere classified
Humanitarian aid from questionnaire Social exclusion from administrative sources Income reference period: HB010-1 (year of survey – 1)
HY070G Housing allowances
Administrative source Income reference period: HB010-1 (year of survey – 1)
HY070N Housing allowances
Administrative source Income reference period: HB010-1 (year of survey – 1)
HY080G Regular inter – household cash transfer received gross
Questionnaire Income reference period: HB010-1 (year of survey – 1)
HY080N Regular inter – household cash transfer received net
Questionnaire Income reference period: HB010-1 (year of survey – 1)
HY100G Interest repayments on mortgage gross
Questionnaire It was asked for principal, year when household hired the loan, interests rate, total numbers of repayment the mortgage, monthly amount of repayment
HY100N Interest repayments on mortgage net
Questionnaire It was asked for principal, year when household hired the loan, interests rate, total numbers of repayment the mortgage, monthly amount of repayment

Vožarski pot 12, SI-1000 Ljubljana, Slovenia Phone: +386 1 241 51 00; fax: +386 1 241 53 44; E-mail: [email protected]; www.stat.si
87/96
HY110G Income received by people aged under 16 gross
Tax declaration Income reference period: HB010-1 (year of survey – 1)
HY110N Income received by people aged under 16 net
Tax declaration Income reference period: HB010-1 (year of survey – 1)
HY120G Regular taxes on wealth gross
Questionnaire Income reference period: HB010-1 (year of survey – 1)
HY120N Regular taxes on wealth net
Questionnaire Income reference period: HB010-1 (year of survey – 1)
HY130G Regular inter – household cash transfer paid – gross
Questionnaire Income reference period: HB010-1 (year of survey – 1)
HY130N Regular inter – household cash transfer paid - net
Questionnaire Income reference period: HB010-1 (year of survey – 1)
HY140G tax on income and social contribution
Tax declaration Income reference period: HB010-1 (year of survey – 1)
HY140N tax on income and social contribution
Tax declaration Income reference period: HB010-1 (year of survey – 1)
HY145N Repayments/receipts for tax adjustment
Tax declaration Income reference period: HB010-1 (year of survey – 1)
Variable Description PY010G Employee cash
or near cash income gross
Tax declaration: wage in previous year, reimbursement for holidays, student's work organized by special student’s organizations , contract work, Questionnaire: reimbursement for transport, allowance for meal In the questionnaire it was asked for average monthly amount and then we calculated on the annual level – according to the months when person was in employment. From 2006 onwards wages for self-emplyed persons are included into PY050G.
PY010N Employee cash or near cash income net
Tax declaration: wage in previous year, reimbursement for holidays, student's work organized by special student’s organizations , contract work, Questionnaire: reimbursement for transport, allowance for meal In the questionnaire it was asked for average monthly amount and then we calculated on the annual level – according to the months when person was in employment. From 2006 onwards wages for self-emplyed persons are included into PY050G.
PY020G Questionnaire - only company car We asked different data about company car (year of issue, values of new such car, how many month person use company car for the private purposes)
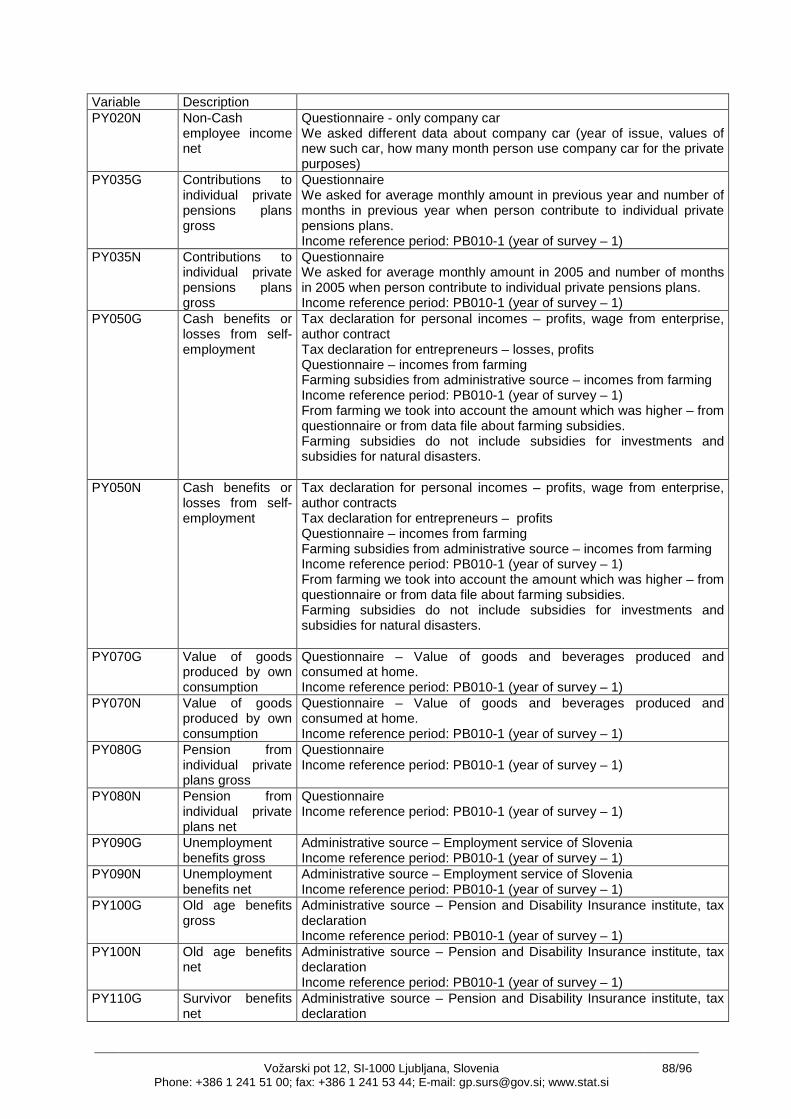
Vožarski pot 12, SI-1000 Ljubljana, Slovenia Phone: +386 1 241 51 00; fax: +386 1 241 53 44; E-mail: [email protected]; www.stat.si
88/96
Variable Description PY020N Non-Cash
employee income net
Questionnaire - only company car We asked different data about company car (year of issue, values of new such car, how many month person use company car for the private purposes)
PY035G Contributions to individual private pensions plans gross
Questionnaire We asked for average monthly amount in previous year and number of months in previous year when person contribute to individual private pensions plans. Income reference period: PB010-1 (year of survey – 1)
PY035N Contributions to individual private pensions plans gross
Questionnaire We asked for average monthly amount in 2005 and number of months in 2005 when person contribute to individual private pensions plans. Income reference period: PB010-1 (year of survey – 1)
PY050G Cash benefits or losses from self-employment
Tax declaration for personal incomes – profits, wage from enterprise, author contract Tax declaration for entrepreneurs – losses, profits Questionnaire – incomes from farming Farming subsidies from administrative source – incomes from farming Income reference period: PB010-1 (year of survey – 1) From farming we took into account the amount which was higher – from questionnaire or from data file about farming subsidies. Farming subsidies do not include subsidies for investments and subsidies for natural disasters.
PY050N Cash benefits or losses from self-employment
Tax declaration for personal incomes – profits, wage from enterprise, author contracts Tax declaration for entrepreneurs – profits Questionnaire – incomes from farming Farming subsidies from administrative source – incomes from farming Income reference period: PB010-1 (year of survey – 1) From farming we took into account the amount which was higher – from questionnaire or from data file about farming subsidies. Farming subsidies do not include subsidies for investments and subsidies for natural disasters.
PY070G Value of goods produced by own consumption
Questionnaire – Value of goods and beverages produced and consumed at home. Income reference period: PB010-1 (year of survey – 1)
PY070N Value of goods produced by own consumption
Questionnaire – Value of goods and beverages produced and consumed at home. Income reference period: PB010-1 (year of survey – 1)
PY080G Pension from individual private plans gross
Questionnaire Income reference period: PB010-1 (year of survey – 1)
PY080N Pension from individual private plans net
Questionnaire Income reference period: PB010-1 (year of survey – 1)
PY090G Unemployment benefits gross
Administrative source – Employment service of Slovenia Income reference period: PB010-1 (year of survey – 1)
PY090N Unemployment benefits net
Administrative source – Employment service of Slovenia Income reference period: PB010-1 (year of survey – 1)
PY100G Old age benefits gross
Administrative source – Pension and Disability Insurance institute, tax declaration Income reference period: PB010-1 (year of survey – 1)
PY100N Old age benefits net
Administrative source – Pension and Disability Insurance institute, tax declaration Income reference period: PB010-1 (year of survey – 1)
PY110G Survivor benefits net
Administrative source – Pension and Disability Insurance institute, tax declaration

Vožarski pot 12, SI-1000 Ljubljana, Slovenia Phone: +386 1 241 51 00; fax: +386 1 241 53 44; E-mail: [email protected]; www.stat.si
89/96
Variable Description By calculation PY110G we consider the legalislation in Slovenia and we did not exclude these incomes from PY110G in the case that person is older than it should be for reach old age benefits, thus survivor benefits were included in all cases in PY110G, it was not important how old person is. Income reference period: PB010-1 (year of survey – 1)
PY110N Survivor' age benefits gross
Administrative source – Pension and Disability Insurance institute, tax declaration By calculation PY110N we consider the legalislation in Slovenia and we did not exclude these incomes from PY110N in the case that person is older than it should be for reach old age benefits, thus survivor benefits were included in all cases in PY110N, it was not important how old person is. Income reference period: PB010-1 (year of survey – 1)
PY120G Sickness benefits gross
Computing from questionnaire according to the data from tax declaration
PY120N Sickness benefits net
Computing from questionnaire according to the data from tax declaration
PY130G Disability benefits gross
Administrative source – Pension and Disability Insurance institute, tax declaration By calculation PY130G we consider the legalislation in Slovenia and we did not exclude these incomes from PY130G in the case that person is older than it should be for reach old age benefits, thus survivor benefits were included in all cases in PY130G, it was not important how old person is. Income reference period: PB010-1 (year of survey – 1)
PY130N Disability benefits net
Administrative source – Pension and Disability Insurance institute, tax declaration By calculation PY130N we consider the legalislation in Slovenia and we did not exclude these incomes from PY130N in the case that person is older than it should be for reach old age benefits, thus survivor benefits were included in all cases in PY130N, it was not important how old person is. Income reference period: PB010-1 (year of survey – 1)
PY140G Education related allowances gross
Statistical survey on scholarship. It is asked for monthly income in December and then it is calculated according to the numbers of month in which person was in education.
PY140N Education related allowances net
Statistical survey on scholarship. It is asked for monthly income in December and then it is calculated according to the numbers of month in which person was in education.

Vožarski pot 12, SI-1000 Ljubljana, Slovenia Phone: +386 1 241 51 00; fax: +386 1 241 53 44; E-mail: [email protected]; www.stat.si
90/96
3.2.2 The source of procedure used for the collecti on of income variable All income variables were collected from registers except: Reimbursements for the travel to/from work (PY010) Allowances (in cash) for meal (PY010) Non cash employee income (company car – PY020) Contributions to private pensions plans (PY035) Pensions from individual private plans (PY080) Sickness benefits (PY120) - partly - All these variables were collected on personal level. Value of goods produced by own consumption (PY070) Income from agriculture (PY50) Social exclusion not elsewhere classified (HY060) – incomes from humanitary organisations Interests (HY090) Regular interhousehold cash transfer – received (HY080) Regular interhousehold cash transfer – paid (HY130) - These variables were collected on household level.
3.2.3 The form in which income variables at compone nt level have been obtained
All data are recorded into the data file gross and net. Some of variables have the same values for the gross and for the net, because from some kind of income the taxes were not paid.
3.2.4 The method used for obtaining income target v ariables in the required form
Only for PY020G and PY020N we convert the gross amount into the net amount. We took into account 25% tax, which is usually paid in advance to tax authority.
3.3 Tracing rules Due to the fact that in Slovenia we use sample of persons and each household has only one selected person, we traced only the selected person. These persons are at least 16 years old .We trace to such person, if he/she move in the theriotory of Slovenia. If the sample person moved permanently into institution or collective housheold, such household was excluded from survey. We excluded from survey also housholds where the sampled person died. In the case that sampled person moved interviewers (CAPI) had to fill in special form, where they wrote new address, if they found it from persons who live in the address or from neighbours. They sent to the office these forms with new addresses and in

Vožarski pot 12, SI-1000 Ljubljana, Slovenia Phone: +386 1 241 51 00; fax: +386 1 241 53 44; E-mail: [email protected]; www.stat.si
91/96
the office we prepared additional list of sampled persons which we sent to appropritate interviewer. In the case that move person who was interviewed by phone, interviewer wrote the new address into the computer program and after the CATI interviewing period was finished, we sent all lists to the appropriate itnerviewers. In the case that interviewer could not get a new address, in the Statistical office we tried to find new address from other sources. This way all selected persons and their households who moved are interviewed face to face under condition that we got new address.

Vožarski pot 12, SI-1000 Ljubljana, Slovenia Phone: +386 1 241 51 00; fax: +386 1 241 53 44; E-mail: [email protected]; www.stat.si
92/96
4 Coherence
4.1 The differences between HBS and EU-SILC The main difference between HBS and EU-SILC is the source of the data for income. In HBS we collected all the data by CAPI (computer assisted personal interviewing), but in EU-SILC 2008 we used several sources. One part was collected by face to face interviewing. The majority of the data on income were collected from administrative sources. We calculate the results from HBS from three consecutive annual surveys. For reference year 2007 data from three years (2006 – 2008) are calculated to the middle year (2007). In the HBS we have different income reference periods. Some of the data are asked only for last month and then this amount is multiplied with the number of months when person receives the amount, for some of the incomes icome reference period is defined as the last 12 months. In EU-SILC the only income reference period is the year 2007 – year of conducting survey minus one year. Table 70: Average income per household in EUR, 2008 Variable Description EU-SILC HBS Notes HY010 Total gross household
income 27 457 NA
HY020 Total disposable household income
21 105 17108 In HBS, all non-cash employee income is included. Only inter-household cash transfers paid are subtracted from net income. Regular taxes on wealth and repayments/receipts for tax adjustment are not included in HBS.
HY040G Income from rental of a property or land – gross
134 NA
HY040N Income from rental of a property or land – net
101 47
HY090G Interest, dividends, profit form capital investments in unincorporated business gross
215 NA
HY090N Interest, dividends, profit form capital investments in unincorporated business net
182 38
HY050G Family/Children related alowances gross
717 NA
HY050N Family/Children related alowances net
597 470
HY060G Social exclusion not elsewhere classified gross
147 NA
HY060N Social exclusion not elsewhere classified net
146 169
HY070G Housing allowances gross 9 NA HY070N Housing allowances net 9 NA HY080G Regular inter – household 53 NA

Vožarski pot 12, SI-1000 Ljubljana, Slovenia Phone: +386 1 241 51 00; fax: +386 1 241 53 44; E-mail: [email protected]; www.stat.si
93/96
Variable Description EU-SILC HBS Notes cash transfer received gross
HY080N Regular inter – household cash transfer received net
53 56
HY100G Interest repayments on mortgage gross
161 NA
HY100N Interest repayments on mortgage net
161 NA
HY110G Income received by people aged under 16 gross
24 NA In HBS it is not available as a separate variable.
HY110N Income received by people aged under 16 net
24 NA
HY120G Regular taxes on wealth gross
66 NA
HY120N Regular taxes on wealth net 66 NA HY130G Regular inter – household
cash transfer paid – gross 91 NA
HY130N Regular inter – household cash transfer paid - net
91 115
HY140G Tax on income and social contribution gross
6 195 NA
HY140N Tax on income and social contribution net
6 195 NA
HY145N Repayments/receipts for tax adjustment net
-91 NA
Source: EU-SILC cross sectional database 2008 and HBS 2006-2008 Table 71: Average income per household member, 2008 Variable Description EU-SILC HBS Notes PY010G Employee cash or near
cash income gross 6 656 NA
PY010N Employee cash or near cash income net
4 653 4089
PY020G Non-Cash employee income gross
37 NA
PY020N Non-Cash employee income net
32 87
PY035G Contributions to individual private pensions plans gross
83 NA
PY035N Contributions to individual private pensions plans net
83 NA
PY050G Cash benefits or losses from self-employment gross
542 NA
PY050N Cash benefits or losses from self-employment net
449 396 In HBS we get income from farming from the questionnaire. In EU-SILC we get income from farming from questionnaire and administrative data on farming subsidies.
PY070G Value of goods produced by own consumption gross
135 NA
PY070N Value of goods produced by own consumption net
135 181
PY080G Pension from indivdual private plans gross
3 NA
PY080N Pension from indivdual private plans net
3 NA

Vožarski pot 12, SI-1000 Ljubljana, Slovenia Phone: +386 1 241 51 00; fax: +386 1 241 53 44; E-mail: [email protected]; www.stat.si
94/96
Variable Description EU-SILC HBS Notes PY090G Unemployment benifits
gross 42 NA
PY090N Unemployment benifits net 31 42 PY100G Old age benefits gross 1 305 NA PY100N Old age benefits net 1 296 NA PY110G Survivor’s benefits gross 204 NA PY110N Survivor’s benefits net 204 NA PY120G Sickness benefits gross 162 NA PY120N Sickness benefits net 109 NA PY130G Disability benefits gross 340 NA PY130N Disability benefits net 336 NA Pensions
(PY100N+PY110N+PY130N)
1 836 1586
PY140G Education related allowances gross
57 NA
PY140N Education related allowances net
57 45
Source: EU-SILC cross sectional database 2008 and HBS 2006-2008
Coherence with HBS – for variables HS070, HS080, HS 090, HS100, HS110, percentage of households who have certain durable Table 72: Coherence with HBS EU-SILC 2008 HBS 2006-2008 Telephone (including mobile phone) 98.6 98,6 Colour TV 97.5 96.5 Computer 63.9 56.9 Washing machine 98.4 96.7 Car 82.7 80.1 Source: EU-SILC cross sectional database 2008 and HBS 2006-2008
HBS data are representative for year 2007.
4.2 The differences between LFS and EU-SILC Coherence with LFS for variable PL030 – self define d current economic status (%): Table 73: Coherence with LFS EU-SILC 2008 LFS 1st quarter 2008 Total 100.0 100.0 Work 50.3 52.0 Unemployed 6.3 6.4 Pupil, student 12.0 10.3 Retired 28.7 28.7 Disabled for work 0.4 1.0 Fullfilling domestic tasks 1.8 1.4 Other inactive person 0.4 0.2 Source: EU-SILC cross sectional database 2008 and LFS

Vožarski pot 12, SI-1000 Ljubljana, Slovenia Phone: +386 1 241 51 00; fax: +386 1 241 53 44; E-mail: [email protected]; www.stat.si
95/96
4.3 The differences between EU-SILC 2005, 2006, 2007 and 2008 Table 74: Some income variables in Eur on HH level in EU-SILC 2005-2008, includng all households Variable EU-SILC 2005 EU-SILC 2006 EU-SILC 2007 EU-SILC 2008 Median HY010 19 018 20 230 21 843 23 504 Median HY020 15 431 16 638 17 742 19 220 Median HY022 13 095 14 375 15 385 16 743 Median HY023 9 504 10 640 11 426 12 830 Source: EU-SILC cross sectional databases for 2005, 2006, 2007 and 2008 Table 75: Some income variables in Eur on HH level in EU-SILC 2005-2008, includng only households, who received definite amount Variable EU-SILC 2005 EU-SILC 2006 EU-SILC 2007 EU-SILC 2008 Median HY040G 547 601 1 002 675 Median HY050G 826 843 921 942 Median HY060G 1 142 1 177 1 049 1039 Median HY090G 67 137 93 150 Source: EU-SILC cross sectional databases for 2005, 2006, 2007 and 2008 Table 76: Some income variables in Eur on personal level in EU-SILC 2005-2008, includng only persons, who received definite amount Variable EU-SILC 2005 EU-SILC 2006 EU-SILC 2007 EU-SILC 2008 Median PY010G 9 254 10 194 10 805 11 320 Median PY050G 962 1 063 931 1 351 Median PY100G 5 833 6 159 6 764 7 152 Median PY110G 4 404 4 580 4 776 4 895 Median PY120G 665 632 579 665 Median PY130G 4 750 4 608 4 822 5 062 Median PY140G 1 412 1 494 1 562 1 582 Source: EU-SILC cross sectional databases for 2005, 2006, 2007 and 2008 Table 77: Variable PL030 (Self defined current econ omic status) in EU-SILC 2005-2008 EU-SILC 2005 EU-SILC 2006 EU-SILC 2007 EU-SILC 2008 Total 100.0 100.0 100.0 100.0 Working full time 46.7 47.5 48.1 48.8 Working part time 1.1 1.3 1.5 1.5 Unemployed 8.4 7.9 7.2 6.3 Pupil, student, further training, unpaid work experience
11.3 11.3 12.0 12.0
In retirement or in early retirement or has given up bussines
29.4 29.0 28.7 28.7
Permanently disabled or/and outfit to work
0.2 0.5 0.4 0.4
In compulsory military community or service
0.0 0.0 0.0 0.0
Fulfilling domestic tasks and care responsibilities
2.3 2.1 1.8 1.8
Other inactive person
0.6 0.4 0.3 0.4
Source: EU-SILC cross sectional databases for 2005, 2006, 2007 and 2008

Vožarski pot 12, SI-1000 Ljubljana, Slovenia Phone: +386 1 241 51 00; fax: +386 1 241 53 44; E-mail: [email protected]; www.stat.si
96/96
Table 78: Variable HH010 (Dwelling type) in EU-SILC 2005-2008 EU-SILC 2005 EU-SILC 2006 EU-SILC 2007 EU-SILC 2008 Total 100.0 100.0 100.0 100.0 Detached house 63.5 65.8 64.7 64.2 Semi detached or terraced house
3.6 3.8 3.9 4.2
Appartment or flat in a building with less than 10 dwellings
8.7 8.0 8.6 8.3
Appartment or flat in a building with 10 or more dwellings
23.9 22.1 22.3 22.8
Some other kind of accomodation
0.3 0.3 0.5 0.5
Source: EU-SILC cross sectional databases for 2005, 2006, 2007 and 2008 Table 79: Variable HS040 (Capacity to afford paying for one week annual holiday away from home) in EU-SILC 2005-2008 EU-SILC 2005 EU-SILC 2006 EU-SILC 2007 EU-SILC 2008 Total 100.0 100.0 100.0 100.0 Yes 65.0 66.1 67.7 66.7 No 35.0 33.9 32.3 33.3 Source: EU-SILC cross sectional databases for 2005, 2006, 2007 and 2008 Table 80: Variable HS110 (Do you have a car?) in EU -SILC 2005-2008 EU-SILC 2005 EU-SILC 2006 EU-SILC 2007 EU-SILC 2008 Total 100.0 100.0 100.0 100.0 Yes 79.5 81.1 82.1 82.7 No – cannot afford 5.2 5.1 5.5 5.0 No – other reason 15.3 13.8 12.4 12.3 Source: EU-SILC cross sectional databases for 2005, 2006, 2007 and 2008