Embed Size (px)
Citation preview

8/6/2019 Final Project Trupti
http://slidepdf.com/reader/full/final-project-trupti 1/39
1
CHAPTER: 1 INTRODUCTION
AQUA CARE RO Water System Pvt. Ltd. established since 2007. At Plot no
1, 8, 9, Opp. Centre point at Nadida Crossing, Bardoli. They are doing
business in Water Purifying.
Aqua care RO technologies Pvt. Ltd. Makes Domestic, commercial &
industrial RO plant.
Company is having “ISO: 9001 2008” certified company in design,
manufacturing, marketing and after sales service.
Company is also having Membership of Water Quality Association-USA &
Indian water works Association, Mumbai.
We are collaborating & designing of RO plant & spare part development with
USA, Taiwan & Korea’s water Treatment Company.
Company has huge workshop with manufacturing & assembling of
domestic, commercial & industrial RO plant, UV, softener and DM plant.
Objective:
Main objective is to manufacture and assemble the best quality Domestic
commercial and industrial RO plant.
Special Features:
Standard quality product.
Good quality product.
Best after sales & service.
Tailor made RO plant as per client’s requirement.
1.1 Company Profile
8/6/2019 Final Project Trupti
http://slidepdf.com/reader/full/final-project-trupti 2/39
2
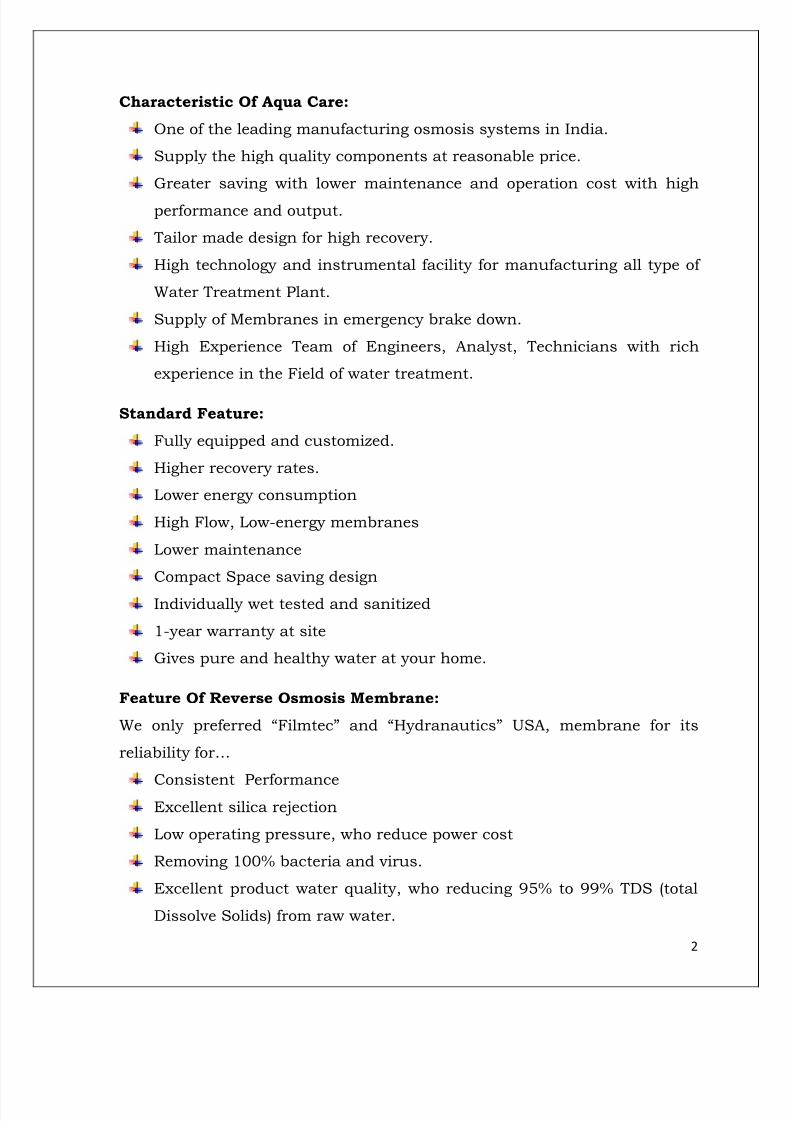
Characteristic Of Aqua Care:
One of the leading manufacturing osmosis systems in India.
Supply the high quality components at reasonable price.
Greater saving with lower maintenance and operation cost with high
performance and output.
Tailor made design for high recovery.
High technology and instrumental facility for manufacturing all type of
Water Treatment Plant.
Supply of Membranes in emergency brake down.
High Experience Team of Engineers, Analyst, Technicians with rich
experience in the Field of water treatment.
Standard Feature:
Fully equipped and customized.
Higher recovery rates.
Lower energy consumption
High Flow, Low-energy membranes
Lower maintenance
Compact Space saving design
Individually wet tested and sanitized
1-year warranty at site
Gives pure and healthy water at your home.
Feature Of Reverse Osmosis Membrane:
We only preferred “Filmtec” and “Hydranautics” USA, membrane for its
reliability for…
Consistent PerformanceExcellent silica rejection
Low operating pressure, who reduce power cost
Removing 100% bacteria and virus.
Excellent product water quality, who reducing 95% to 99% TDS (total
Dissolve Solids) from raw water.

8/6/2019 Final Project Trupti
http://slidepdf.com/reader/full/final-project-trupti 3/39
3
After Sales And Service:
We believe that the higher sales are not a step towards goal in such a
business, a step is providing satisfied after sales service.
We have infrastructure as per ISO 9001:2008 standards.
In case of any problem, the system is put back into operation immediately
without any long period of break down and production loss. Our service
system is regular as:
We have team of experienced Engineers, Welders, Electricians,
Technicians and Filters to repair.
Annual Maintenance Contract after the end of the warranty period if
required.
Regular Free Service after every two months (In Warranty Period)
Department Information
Personnel Department
Personnel Department is also known has human resource management.
HRM is concern with the people dimension in the organization. It includes
recruitment selection, labor relation activities, transfer- promotion,
maintainers of employee’s records & personnel data, safety measure.
Labor welfare Measure:
Tea is served twice a day.
Lunch time is not fixed but it is of 1 hr.
Advance is paid to worker as per their need.
Company provides group insurance for the safety.
Company provides facility for picking up n dropping employees at
their home.
One facility like bus facility.
Loan facility is provided to the employees having more than five years
of experiences.
8/6/2019 Final Project Trupti
http://slidepdf.com/reader/full/final-project-trupti 4/39
4
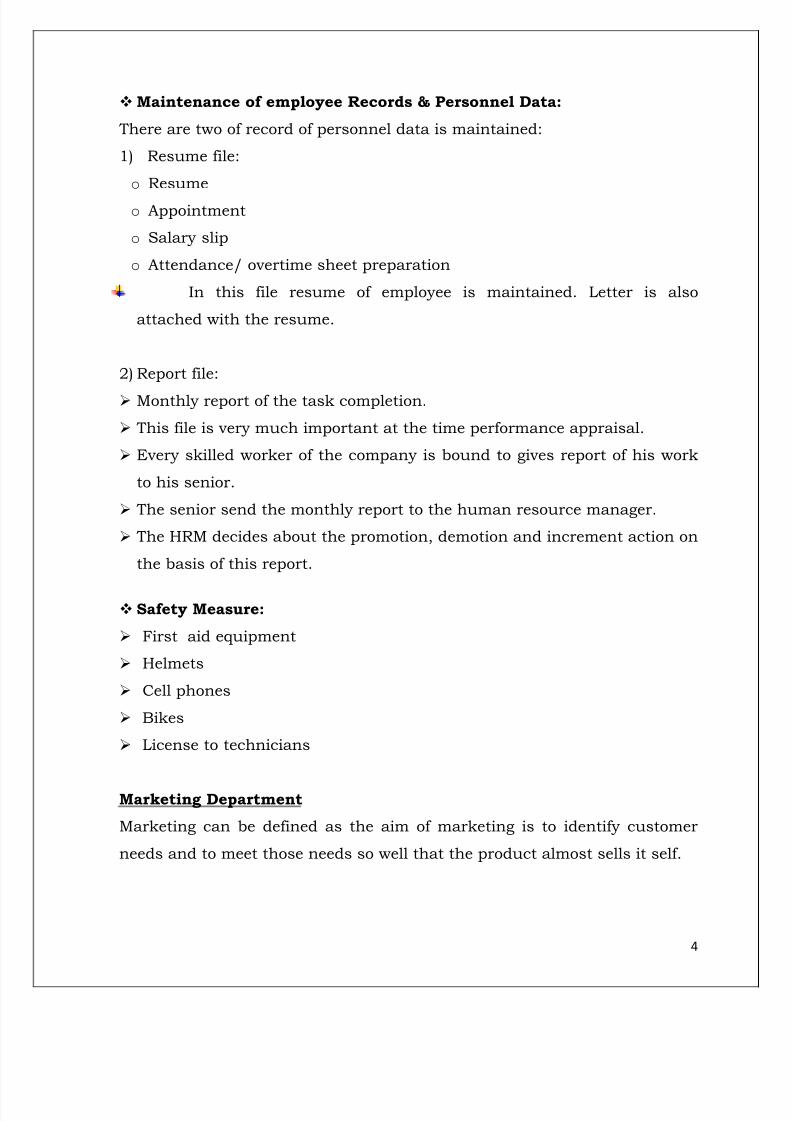
Maintenance of employee Records & Personnel Data:
There are two of record of personnel data is maintained:
1) Resume file:
o Resume
o Appointment
o Salary slip
o Attendance/ overtime sheet preparation
In this file resume of employee is maintained. Letter is also
attached with the resume.
2) Report file:
Monthly report of the task completion.
This file is very much important at the time performance appraisal.
Every skilled worker of the company is bound to gives report of his work
to his senior.
The senior send the monthly report to the human resource manager.
The HRM decides about the promotion, demotion and increment action on
the basis of this report.
Safety Measure:
First aid equipment
Helmets
Cell phones
Bikes
License to technicians
Marketing Department Marketing can be defined as the aim of marketing is to identify customer
needs and to meet those needs so well that the product almost sells it self.

8/6/2019 Final Project Trupti
http://slidepdf.com/reader/full/final-project-trupti 5/39
5
Marketing is the system of activities. It is designed to plan, price, promote
and distribute any goods and services. Marketing activities are taken place
where goods and services are offered for sell.
Reporting System:
Marketing manager takes the daily report from both assistant and that
manager has to report to managing director. As per the following format the
daily report is prepared.
Daily report card:
A part from that weekly and monthly evaluation of each activity.
Pricing Policy:
The price is fixed as per the Market Rate and condition. They considering all
the factors and fixes the prices which remain fixed. All the order same type
of industry has to follow this price. In this situation, the company whose
production cost is lower will get more profit and who’s higher will get less
profit.
Organization: Name:
Date: Department:

8/6/2019 Final Project Trupti
http://slidepdf.com/reader/full/final-project-trupti 6/39
6
Production Department
Production is the process of conversion input of raw material, machinery,
information, manpower etc, into output like semi finished goods and
services.
Production is done on the planning, organizing, directing and controlling
activities of production function.
Production Plan:
The plan is started with the market demand and dealers. The information of
their demand is collect by marketing staff. And after that as per this order
production staff has to follow the rest.
According to that demand, the production is made. If customer or dealer want to continue the contract for one month than as per that contract
production is run. Company gets order through telephone.

8/6/2019 Final Project Trupti
http://slidepdf.com/reader/full/final-project-trupti 7/39
7
Production Process:

8/6/2019 Final Project Trupti
http://slidepdf.com/reader/full/final-project-trupti 8/39
8
Finance Department:
Finance is regarded as the lifeblood of a business organization. Financial
management is concerned with the efficient use of an important economic
resource. That means how to manage whole capital fund of an organization.
Where, when and how to utilize the capital of an organization that
maximum profit could be earn.
Hierarchy Of Finance Department:
Activities:
Budgeting and Planning
Accounting
Prepare balance sheet and annual general report
Working capital management
Maintain debt. / Equity ratio
Providing funds to different department

8/6/2019 Final Project Trupti
http://slidepdf.com/reader/full/final-project-trupti 9/39
9
Computer Software:
TALLY 7.2 software is used to assist financial data and also it is used for
accounting data. This software is providing so many features for the
maintain a financial and accounting data.
Sources of Fund:
For working capital management, they are using the following two sources
of funds that are:
Loan from Bank
Retain Earnings
Partner personal Investment
Bank Cash Credit facilities
Unsecured loan
Relationship with other Department:
Finance management is an important part of the overall management, and
is not independent areas, it depend to all other various department of the
company such as personnel, production, marketing etc.
In other department purchase, storage, dispatch etc. department is also
included and they also required finance for their various activities.
Relationship with personnel Department:
In personnel department finance is useful in the form of wages, salaries,
perquisites, allowances, bonus etc. The personnel manager and finance
manager has jointly take the decision about the scale of the organization;
they also decide that how extra benefits to be provided to them.
Relationship with Production Department:
The production manager has to be interlinked with each other and they take
joint decision related to make or purchase decision about plant expansion,repair and maintenance of machinery etc. the finance manager helps to
minimize production costs, cash flow, storage cost, inventory management
etc.

8/6/2019 Final Project Trupti
http://slidepdf.com/reader/full/final-project-trupti 10/39
10
Relationship with marketing Department:
Finance is also linked with marketing department because finance is needed
for every step of marketing. In finance capital budgeting involves planning
the availability, controlling of long term investment funds for promoting
product through advertisement , selling, giving free samples , the finance is
first aspects to be takes care. At the time of deciding cash discount on
different quantity, both finance and marketing manager sitting together.
Accounting policies:
Fixed assets are stated at cost of acquisition or purchase, including cost of
improvement which substantially increases the life of assets. Cost of
installation is also capitalized.
Depreciation is provided on straight line method on assets acquired.
Valuation of assets:
o Finish goods: cost or realizations value whichever is lower.
o Raw material: at cost
o Goods in transit: at material cost
1. Name Of The Product:
WATER TREATMENT RO PLANT.
2. Sales Volume:
Here sales volume is based on small scale.
3. Product Line:
Firm is using product line that is making product related to 1 channel.
4. Types Of Product:
Four types of product
a) Domestic
1.2 Product Profile

8/6/2019 Final Project Trupti
http://slidepdf.com/reader/full/final-project-trupti 11/39
11
b) Commercial
c) Industrial Ro plant
d) Cooler with RO
5. Raw Material:
a) Membrane
b) Membrane housing
c) Filter
d) Filter housing
e) Pump
f) Motor
g) Cabinet
6. Major Customer:
The product mostly purchase by following
Colleges and school
Resident areas
Hospital
7. Method Doing Production:
Straight line
8. Other Related Features Of Product:
Making small range of Domestic RO plant for home use.
Making medium range of Domestic Ro plant for office, hotel, Apartment,
Temple, Mosque, Bus station, Railway station, Airport etc.
Making High range of RO plant, Softener & DM plant for commercial &
industrial use. Our all components filter & filter’s, Vessels and other parts
are food grade certified components.

8/6/2019 Final Project Trupti
http://slidepdf.com/reader/full/final-project-trupti 12/39
12
Ratio Analysis
Introduction Of Ratio Analysis:
An integral aspect of fundamental analysis involves performing what many
would call “ratio analysis”. This involves calculating a number of different
industry standard ratios and comparing them to various benchmarks. The
benchmarks can be the ratios of other competitors, industry average ratios,
or industry “rules-of-thumb”. There’s no set procedure for performing ratio
analysis because it all depends on the type of company you’re analyzing –
certain industries have industry specific ratios. Regardless, this article will
give you an overview of some of the standard ratios and what they may tell
us about a company.
Four categories used to evaluate the different facets of a company’s
performance and overall condition: liquidity, Profitability, leverage, and
efficiency ratio.
Liquidity Ratios:
Being liquid is same as being able to pay your bills when they become due.
Current Ratio
The Current Ratio is the perhaps best-known measure of a company’sliquidity.
sliabilitieCurrent
assetsCurrent RatioCurrent
1.3 About Topic

8/6/2019 Final Project Trupti
http://slidepdf.com/reader/full/final-project-trupti 13/39
13
This ratio gives you a sense of the company’s abilities to pay its short-term
liabilities. A value of less than 1 indicates that the company may have
trouble meeting its short-term obligations and could be facing a liquidity
crisis. As a general rule-of-thumb look for companies with a current ratio of
2 or more.
Quick Ratio
The Quick Ratio is a more stringent measure of a company’s short-term
liquidity position.
sliabilitieCurrent
ReceivableAccountsSecuritiesMarketableCash RatioQuick
Like the current ratio, it’s generally better to have a high quick ratio. Both
ratios measure the same thing, but the quick ratio ignores inventory and
other assets included in Current Assets that may not be all that liquid, and
thus may not be easily sold to meet short-term obligations. Look for
companies with ratios of 1 or more.
One thing to note is that while it’s favorable to have high current and quick
ratios, ratios that are too high could indicate that a company isn’t being
efficient and that it’s just sitting on a hoard of cash or inventory.
Cash Ratio
sliabilitieCurrent
balancebankandCash RatioCash
This ratio includes only cash.
Profitability Ratios:
Profitability Ratios measure how effectively a firm’s management is
generating profits on sales, total assets, and stock holders’ equity.

8/6/2019 Final Project Trupti
http://slidepdf.com/reader/full/final-project-trupti 14/39

8/6/2019 Final Project Trupti
http://slidepdf.com/reader/full/final-project-trupti 15/39
15
firm.
Long-term debt -to-equity ratio:
Equity
debttermLongequity todebttermLong
This is the ratio of debt financing to equity financing.
Debt ratio:
employedcapital Total
debttermLongRatioDebt
This is the ratio of total debt to equity financing.
Efficiency Ratios
These ratios indicate how efficient the firm is in using its assets by
comparing the asset value to the revenue these assets are producing.
Total Asset Turnover Ratio
assets Total
Sales Ratio TurnoverAsset Total
Generally, the higher is the better.
Assets turnover ratio is a measurement of how well the firm is utilizing its
total assets (i.e. fixed and current assets) to produce sales.
Fixed Assets Turnover Ratio
assetsfixedNet
Sales Ratio TurnoverAssetsFixed
Fixed assets turnover ratio is a measurement of how well the firm is utilizing
its fixed assets (i.e. property, plant, equipment and intangibles) to produce
sales.

8/6/2019 Final Project Trupti
http://slidepdf.com/reader/full/final-project-trupti 16/39
16
Inventory Turnover Ratio:
Inventory Turnover measures how efficient the firm is in processing
inventory and inventory management. It measures how lean the firm runs
with respect to inventory and how quickly it can sell its inventory.
inventory
Sales Ratio TurnoverInventory
Generally, turnover ratios that are closest to the industry norm are ideal.
Inventory turnover ratios that are too low may indicate that the firm has too
much capital tied up in inventory and the inventory may be obsolete. A ratio
that is too low, on the other hand, may suggest the firm has inadequate
stock on hand to meet sales. Note: average inventory in this case would just
be the average of the inventory balances shown on the current period’s and
last period’s balance sheets.
1) Financial Analysis of National Grid Group Plc
The objective of paper was to understand the future aspect of investment in
the National grid group with the help of ratio analysis of balance sheet and
profit and loss account for last two years.
Many ratios were calculated like Investment Ratio, P/E Ratio, Gearing Ratio,
Liquidity Ratio and many more to understand the position of the company.
The findings that came out with the help of trend ratio analysis were that
the researcher came to know about the pitfalls of payout ratio. The
suggestions were to decrease the payout ratio and increase the retained
earnings, which would help the company to increase the wealth of the share
holders.
1.4 Literature Review
8/6/2019 Final Project Trupti
http://slidepdf.com/reader/full/final-project-trupti 17/39
17
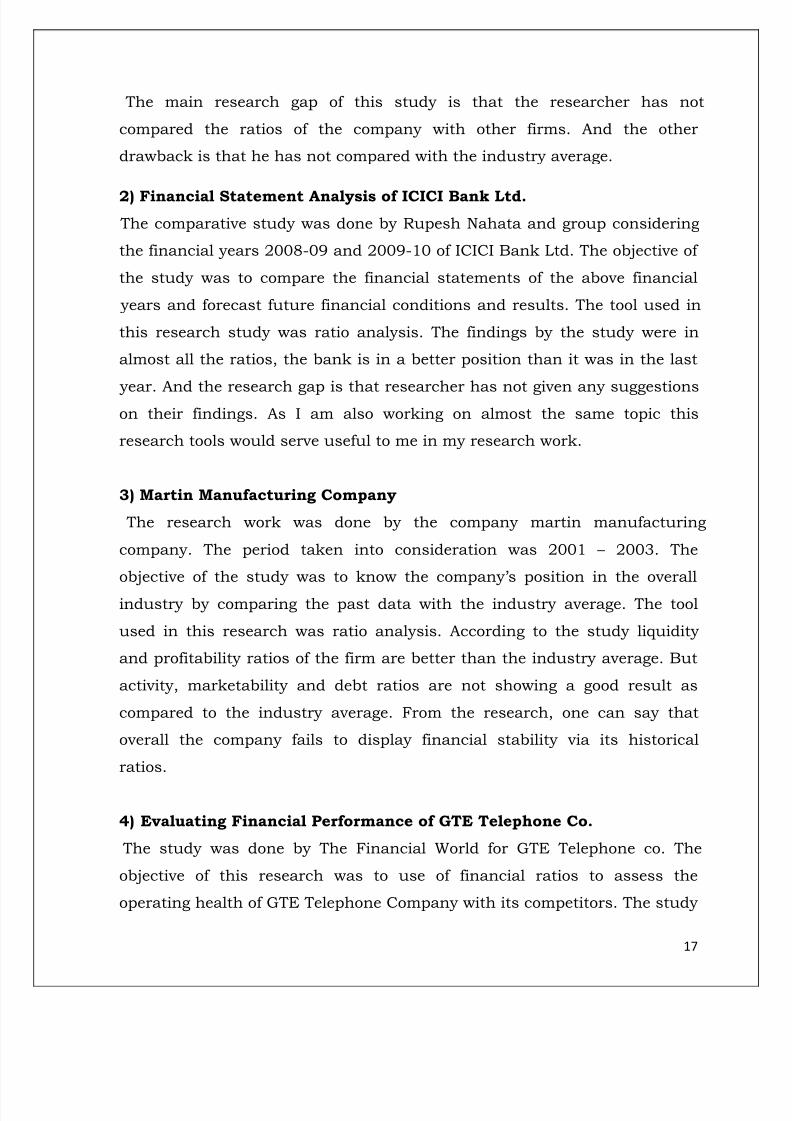
The main research gap of this study is that the researcher has not
compared the ratios of the company with other firms. And the other
drawback is that he has not compared with the industry average.
2) Financial Statement Analysis of ICICI Bank Ltd.
The comparative study was done by Rupesh Nahata and group considering
the financial years 2008-09 and 2009-10 of ICICI Bank Ltd. The objective of
the study was to compare the financial statements of the above financial
years and forecast future financial conditions and results. The tool used in
this research study was ratio analysis. The findings by the study were in
almost all the ratios, the bank is in a better position than it was in the last
year. And the research gap is that researcher has not given any suggestionson their findings. As I am also working on almost the same topic this
research tools would serve useful to me in my research work.
3) Martin Manufacturing Company
The research work was done by the company martin manufacturing
company. The period taken into consideration was 2001 – 2003. The
objective of the study was to know the company’s position in the overall
industry by comparing the past data with the industry average. The tool
used in this research was ratio analysis. According to the study liquidity
and profitability ratios of the firm are better than the industry average. But
activity, marketability and debt ratios are not showing a good result as
compared to the industry average. From the research, one can say that
overall the company fails to display financial stability via its historical
ratios.
4) Evaluating Financial Performance of GTE Telephone Co.
The study was done by The Financial World for GTE Telephone co. The
objective of this research was to use of financial ratios to assess the
operating health of GTE Telephone Company with its competitors. The study

8/6/2019 Final Project Trupti
http://slidepdf.com/reader/full/final-project-trupti 18/39
18
was done for the year 1994. The tool that was used here was inter firm ratio
analysis. The analysis on the GTE’s continuous profitable growth and
company’s operating health is fair and accurate. From the article, it looks
like GTE is positioning itself to prosper in deregulated world. The industry
growth rate is 30% and GTE’s growth rate is 25%, so still there is a room for
betterment.
5) Cash Flows: Another Approach to Ratio Analysis.
The study was done by Don E. Giacomino, David E. Mielke. The objective of
the study was to find new ways to interpret the ratios by not using balance
sheet and profit and loss account rather using cash flows statements; Cash-
flow-based ratios are useful in evaluating a company's financial strength
and profitability. The tool used was ratio analysis on accrued cash flow. The
findings from the study was Relative performance evaluation is one
important use of cash flow ratios, which can be viewed in terms of
sufficiency and efficiency. Another finding from cash flows ratio was how
much effect is there on cash flow when new machinery is bought against the
amortization funds, lesser the effect company is considered to be more
efficient. This is a new way of ratio analysis which can be useful in
companies.

8/6/2019 Final Project Trupti
http://slidepdf.com/reader/full/final-project-trupti 19/39
19
CHAPTER: 2. RESEARCH METHODOLOGY
2.1 Research Topic:
To study the Financial Performance of AQUA CARE RO Water systemPvt. Ltd by ratio analysis.
2.2 Research Objective:
2.2.1 Primary Objective
To analyze the AQUA CARE RO Water system Pvt. Ltd. by using ratio
analysis for three years.
2.2.2 Secondary Objectives:
To analyze the liquidity of the company To study the assets turnover of the company
To know the profitability of the company
To study the financial leverage of the company.
2.3 Research Design:
The research design is the plan structure and strategy of investigation
conceived so as to obtain answers to research questions and to control
variance.
Here in this particular topic of Ratio Analysis the liquidity of the company,
profitability of the company, its market performance, and about its financial
ratios. So the research design is used in this topic is descriptive research
design.
2.4 Data Collection Method:
The main thing in the research is the method by which the data is collected
and that is known as data collection method. There are mainly two methods
by which the data is collected. Here in this analysis I want to use secondary
data collection.

8/6/2019 Final Project Trupti
http://slidepdf.com/reader/full/final-project-trupti 20/39
20
Secondary data is gathered through company the previous project reports.
Through this source I will gather the data about the company history and
its background and the detail about the different departments.
2.5 Period of the Study:
This study is based on secondary data, which have been obtained from
published sources i.e. Annual report for the period of Three years (2008-09,
2009-10 and 2010-11). The collected data has been analyzed with the help
of ratio analysis.
2.6 Source of Data:
There are two types of data, primary data and secondary data. The data
which is freshly collected by the researcher for some particular research is
known as primary data. The data which is already been collected by some
other researcher for some other study and now is been used for some other
research it is called secondary data. Secondary data can be collected
through two source they are internal source and external source. In this
study we are going to use secondary data.
Here, in this study secondary data will be used which would be from
internal as well as from external source. The annual reports, i.e. balancesheet and profit and loss accounts of the firm will be collected from internal
source. The competitors’ balance sheet and profit and loss account will be
collected from external source, mainly through the internet. Moreover some
reference books have helped to clear my basic theoretical knowledge.
2.7 Tools Used For Analysis:
Analysis of Financial Statements is done in two parts:
Ratio Analysis of AQUA CARE RO Water system Pvt. Ltd. for three years
from 2007-2008, 2008-09 and 2009-10 including the following ratios:
Current Ratio
Assets Turnover Ratio

8/6/2019 Final Project Trupti
http://slidepdf.com/reader/full/final-project-trupti 21/39
21
Return on Equity
Debt Equity Ratio
Return on Assets (ROA)
Profit Margin Ratio
Quick Ratio
Cash Ratio
2.8 Limitations of the Study:
Although I got an opportunity of working with AQUA CARE RO Water
system Pvt. Ltd., but it was not easy to gain information in each and every
area. And due to shortage of time, it was not able to cover all the
operations. But brief information is provided for the same.Due to unavailability of all data, the research could not be done on a
detailed basis.
This study is limited to three years.
The study is restricted to the application of ratio analysis.
The data of this study has been primarily taken from published annual
reports only.

8/6/2019 Final Project Trupti
http://slidepdf.com/reader/full/final-project-trupti 22/39
22
CHAPTER: 3 Data Analysis & Interpretation
Liquidity Ratios:
Current Ratio:
sliabilitieCurrent
balancebankandCash RatioCash
Table No-1
Year Current Assets Current Liabilities Current Ratio
2007-2008 8541478 2759135 3.095708619
2008-2009 13171886 2345610 5.615548194
2009-2010 25526421 11345499 2.249916112
Graph:

8/6/2019 Final Project Trupti
http://slidepdf.com/reader/full/final-project-trupti 23/39
23
Interpretation:-
From chart it can show that in the year 2007-08 ratio is 3.09 which shows
that firm has sufficient assets to meet the day to day requirements. It
increases in the year 2008-09 which also shows efficiency of the firm but in
the recent year 2009-10 ratio is decreases but able to idle ratio and in year
2009-10 firm has 2.25% which shows good position.
Quick Ratio:
sliabilitieCurrent
ReceivableAccountsSecuritiesMarketableCash RatioQuick
Table No-2
Year Cash
Account
Receivable
Current
Liabilities Total Ratio
2007-2008 208742 1291541 2759135 1500283 0.543751
2008-2009 87614 4814779 2345610 4902393 2.090029
2009-2010 420000 16342227 11345499 16762227 1.477434
Graph:

8/6/2019 Final Project Trupti
http://slidepdf.com/reader/full/final-project-trupti 24/39
24
Interpretation:-
Quick Ratio is that which indicates that firm can pay it current asset from
current liabilities. It is good position for firm to be in the year 2007-08 firm
not able to achieve the 1% which not good for firm but afterwards firm has
concentrate on its liabilities so it increases the ability in the year 2008-09
which is good. And in the year 2009-10 it decrease but firm able to achieve
more than 1 which is good.
Cash Ratio:
sliabilitieCurrent
balancebankandCash RatioCash
Table No-3
Year Cash
Current
Liabilities Ratio
2007-2008 208742 2759135 0.07565487
2008-2009 87614 2345610 0.037352331
2009-2010 420000 11345499 0.037019086
8/6/2019 Final Project Trupti
http://slidepdf.com/reader/full/final-project-trupti 25/39
25
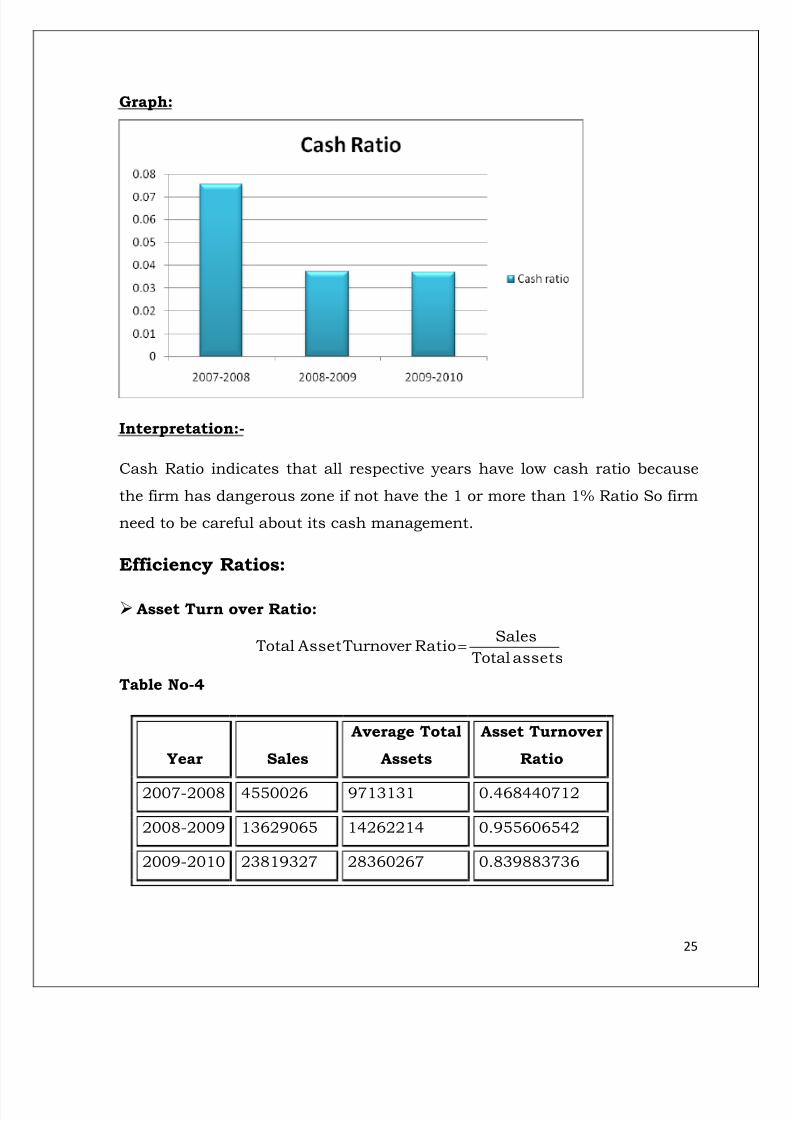
Graph:
Interpretation:-
Cash Ratio indicates that all respective years have low cash ratio because
the firm has dangerous zone if not have the 1 or more than 1% Ratio So firm
need to be careful about its cash management.
Efficiency Ratios:
Asset Turn over Ratio:
assets Total
Sales Ratio TurnoverAsset Total
Table No-4
Year Sales
Average Total
Assets
Asset Turnover
Ratio
2007-2008 4550026 9713131 0.468440712
2008-2009 13629065 14262214 0.955606542
2009-2010 23819327 28360267 0.839883736

8/6/2019 Final Project Trupti
http://slidepdf.com/reader/full/final-project-trupti 26/39
26
Graph:
Interpretation:-
This ratio simply compares the turnover with the asset that the business
has used to generate that turnover. In the year 2008-09 the ratio is increase
than 2007-08. It means firm has increases it’s turnover in 2008-09 but in
the year 2009-10 it deceases which means company’s turnover is less than
2008-09. It may affect the firm’s profit.
Fixed Asset Turn over Ratio:
assetsfixedNet
Sales Ratio TurnoverAssetsFixed
Table No-5
Year Sales
Average
Fixed
Assets
Fixed Assets Turnover
Ratio
2007-2008 4550026 1171653 3.883424529
2008-2009 13629065 1090328 12.4999679
2009-2010 23819327 2833846 8.405300429

8/6/2019 Final Project Trupti
http://slidepdf.com/reader/full/final-project-trupti 27/39
27
Graph:
Interpretation:-
This ratio compares the sales with the fixed assets that the business has
used to generate that sale. In the year 2008-09 ratio is increases from 2007-
08 which is good. But in 2009-10 it decreases which may be not good for
the firm.
Inventory Turn over Ratio:
inventory
Sales Ratio TurnoverInventory
Table No-6
Year Cost Of Sales
Average
Inventory
Inventory
Turnover Ratio
2007-2008 863123 5616930 0.153664546
2008-2009 8780377 7252604 1.21065165
2009-2010 19055461 7680796 2.48092268

8/6/2019 Final Project Trupti
http://slidepdf.com/reader/full/final-project-trupti 28/39
28
Graph:
Interpretation:-
This ratio shows that a low turnover implies poor sales and therefore excess
inventory. But here sales are increase in all three years with increase in
inventory so it is good for the company.
Profitability Ratios:
Profit Margin Ratio:
Sales
incomeNet RatioMarginProfit
Table No-7
Year Net Income Sales
Profit Margin
Ratio
2007-2008 4559088 4550026 1.001991637
2008-2009 13630063 13629065 1.000073226
2009-2010 23819327 23819327 1

8/6/2019 Final Project Trupti
http://slidepdf.com/reader/full/final-project-trupti 29/39
29
Graph:
Interpretation:-
Net profit margin ratio tells us the amount of net profit per rupee of
turnover a business has earned. The net profit margin is the ratio of net
profits to sales. This is the best indicator of the company’s efficiency in that
net profit takes in to the consideration all expenses of the company. The
firm is enabling the normal margin of profit in all the three years it remains
constant but if it increases in future, it will be good for firm. But it is also
good that firm is able to maintain its margin.
Return on Equity Ratio:
Equity
incomeNet EquityonturnRe

8/6/2019 Final Project Trupti
http://slidepdf.com/reader/full/final-project-trupti 30/39
30
Table No-8
Year Net Income Average Equity
Return On Equity
Ratio
2007-2008 4559088 7502430 0.607681511
2008-2009 13630063 8940729 1.524491236
2009-2010 23819327 10000000 2.3819327
Graph
Interpretation:-
This ratio shoes the return on the eqity to shareholder of the company.
From the year 2007 firm is able to return more in increasing proportion. It
is beneficial to shareholder of the company. This is a good sign for the
equity shareholders and for company.

8/6/2019 Final Project Trupti
http://slidepdf.com/reader/full/final-project-trupti 31/39
31
Return on Asset Ratio:
assets Total
interestNetincome AssetsonReturn
Table No-9
Year Net Income Interest Total
Total
Asset
Return On
Asset Ratio
2007-2008 4550026 9062 4559088 9713131 0.469373676
2008-2009 13629065 998 13630063 14262214 0.955676517
2009-2010 23819327 0 23819327 28360267 0.839883736
Graph:
Interpretation:-
It shows the return of the firm on its assets. Firm is able to use its assets in
well manner because from the year 2007 till 2010, firm has increased its
return on assets. From that it can say that firm using the efficient assets.
This is favorable to the firm.

8/6/2019 Final Project Trupti
http://slidepdf.com/reader/full/final-project-trupti 32/39
32
LEVERAGE RATIOS:
Long term Debt to Equity Ratio:
Equity
debttermLong
equitytodebttermLong
Table No-10
Year Long Term Debt Equity
Long Term Debt
To Equity Ratio
2007-2008 1291541 7502430 0.17214969
2008-2009 4814779 8940729 0.538521971
2009-2010 16342227 10000000 1.6342227
Graph:
Interpretation:-
It indicates the company is aggressive in financing their growth by using
long term debt in this or not. In the year 2007 and 2008 firm is not able to

8/6/2019 Final Project Trupti
http://slidepdf.com/reader/full/final-project-trupti 33/39
33
finance it by using debt more than equity but in the year 2009 it successful
because it has ratio more than “1”. And this situation is good for firm to
achieve long term debt financing.
Long term Debt Ratio:
Equity debttermLong
debttermLongratiodebttermLong
Table-11
year
Long term
debt
Long term
debt +equity Long term debt ratio
2007-2008 1291541 8793971 0.146866643
2008-2009 4814779 13755508 0.350025532
2009-2010 16342227 16442227 0.993918099
Graph:

8/6/2019 Final Project Trupti
http://slidepdf.com/reader/full/final-project-trupti 34/39

8/6/2019 Final Project Trupti
http://slidepdf.com/reader/full/final-project-trupti 35/39
35
Graph:
Interpretation:-
It shows the debt of company. It is the total of firms’ long term and short
term debt. The firm has good position if it able to maintain minimum ratio.
Even though debt to equity is good and overall performance of the firm total
debt are increasing year by year.

8/6/2019 Final Project Trupti
http://slidepdf.com/reader/full/final-project-trupti 36/39
36
CHAPTER: 4 FINDINGS
By analyzing the different liquidity ratios ,I have found that the overall
liquidity of the company is lower because the different ratios shows
that the company has not the sufficient current assets to pay its
current liabilities.
From Asset turnover ratio I found that the company’s receivable
turnover is low and the accounts receivables are inefficient.
The average collection period of the company is very high so that the
company is not able to generate revenue quickly which is a lacking
point for the company.
From leverage ratio I have found that the company’s debt is not more
than its assets and the debt of the company is not higher than the
equity in the year 2010 so in this particular year the return of the
shareholders is not affected.
The gross profit margin in all the three year is 1 which is not more
sufficient to the firm so that the profitability of the company is low.
90% from the total sales based on the credit so, it’s lake in liquidity
for the company because they can not recover cash early.
The net profit margin ratio of the company in the year 2009-2010 is
very low net profit margin earned by the company per rupee of the
turnover is that almost 1% and in the year 2010 they faces loss so
there is no net profit margin. So looking at the net profit margin ratios
of all the three years the efficiency in terms of net profit margin of the
company is low.
The cash to current assets ratio shows decreasing trends 0.03 in
2008-09 compare 0.07 in 2007-08.

8/6/2019 Final Project Trupti
http://slidepdf.com/reader/full/final-project-trupti 37/39
37
CHAPTER: 5 CONCLUSIONS
From the overall analyses I can say that the company risk is high in
terms of the liquidity, low profitability prevailing in the company and
the high proportion of debt in the capital structure which affects the
return of the shareholders.
Finally it can say that firm is able to earn profit and it has managed
its liquidity, efficiency, profitability and leverage position but it has to
focus on cash management for future.

8/6/2019 Final Project Trupti
http://slidepdf.com/reader/full/final-project-trupti 38/39
38
CHAPTER: 6 RECOMMEDATIONS
Firm can increase its investment in short term sources for cash
requirement.
Fixed assets are well managed but for current assets firm should take
action so that turn over can increases.
The another main thing that I would like to recommend to the
company that in the capital structure of the company should use
such proportion of debt and the equity so that the return of the
shareholder is not adversely affected.
Firm can reinvest its reserves and surplus in higher return sources.
From the analysis and interpretation it can conclude that firm has
good liquidity position expect the proper management of cash so firm
need to focus more on cash position rather assets. Firm’s efficiencies
are good in fixed assets. Also the inventory management is good but
firm need to focus on its turnover. it can be say Firm’s profitability is
good from all its profitability ratios. It is favorable to firm. Also the
firm’s leverage position is good because it has maintained the debt,
equity to debt and also the total debt.

8/6/2019 Final Project Trupti
http://slidepdf.com/reader/full/final-project-trupti 39/39
BIBLIOGRAPHY
Books:
I M. Pandey (Eight edition). Financial management.
Vikas Publishing House Pvt Ltd.
Pandian p. (2008) Security analysis and portfolio management,
Vikas Publishing House Pvt Ltd. (Page no. 237-243)
Company’s Financial Statements:
Balance sheetProfit and loss a/c
Sales records
Sites:
www.windwell.com
www.investopedia.com/terms/v/valueinvesting.asp/liquidator.asp
www.search/searchresults.asp
www.wickepedia.org
www.wickepedia.org/wiki/financial/ratios/beginnersinvest.about.com/
www.financialratio.htm