Embed Size (px)
Citation preview
DOE Award No.: FP00003995
Final Project Scientific / Technical Report
PROPERTIES OF SEDIMENTS CONTAINING METHANE HYDRATE, WATER, AND GAS SUBJECTED TO CHANGING GAS COMPOSITIONS
Project Period (May 1, 2016 to September 30, 2018)
Submitted by: Timothy J. Kneafsey
_____________________________________
Signature
Lawrence Berkeley National Laboratory DUNS #:xxxxxxx
1 Cyclotron Road Berkeley CA 94720
Email: [email protected] Phone number: (510) 486-4414
Prepared for:
United States Department of Energy National Energy Technology Laboratory
OIL & GAS
November 26, 2018
Office of Fossil Energy
DISCLAIMER
“This report was prepared as an account of work sponsored by an agency of the United States Government. Neither the United States Government nor any agency thereof, nor any of their employees, makes any warranty, express or implied, or assumes any legal liability or responsibility for the accuracy, completeness, or usefulness of any information, apparatus, product, or process disclosed, or represents that its use would not infringe privately owned rights. Reference herein to any specific commercial product, process, or service by trade name, trademark, manufacturer, or otherwise does not necessarily constitute or imply its endorsement, recommendation, or favoring by the United States Government or any agency thereof. The views and opinions of authors expressed herein do not necessarily state or reflect those of the United States Government or any agency thereof.”
1
ProjectSummaryReport
LBNL-KIGAMCollaborationintheInvestigationoftheGasProductionPotentialofHydrateDepositsintheKoreanEastSea
Submittedtothe
KoreaInstituteofGeoscienceandMineralResources(KIGAM)
and
NationalEnergyTechnologyLaboratory(NETL)
by
LawrenceBerkeleyNationalLaboratory(LBNL)
EnergyGeosciencesDivision
1CyclotronRd.
Berkeley,California94720
USA
PrincipalInvestigator:TimothyJ.Kneafsey
Co-PI:GeorgeJ.Moridis
Co-PI:MatthewT.Reagan
WithcontributionfromJihoonKim(TAMU)
September30,2018
2
Executive Summary ThisreportsummarizesactivitiescarriedoutintheprojectentitledLBNL-KIGAMCollaborationintheInvestigationoftheGasProductionPotentialofHydrateDepositsintheKoreanEastSea.ProjectperformersincluderesearchersatLawrenceBerkeleyNationalLaboratoryandTexasA&MUniversity.ThisreportdiscussestwogroupsoftaskshavingthegoalofimprovingunderstandingofthefutureproductionofmethanefromhydratedepositsintheUlleungBasin(UB).Thefirstgroupoftasksarenumerical,performedusingTOUGH+HYDRATEandothercodesdevelopedatLawrenceBerkeleyNationalLaboratory.Thesecondgroupoftasksareexperimental,performedinlaboratoriesatLawrenceBerkeleyNationalLaboratory.AlltaskswereperformedincollaborationwithorwithinputsfromKIGAM.CodeDevelopmentandSimulationTobettersimulatehydrate-relatedbehaviorrelevanttotestingandproductionofgasfromtheUlleungBasin,thecapabilitiesoftheT+H/pT+Hcodesrequiredenhancementsthroughtheadditionalofseveralnon-Darcyfloweffects.ItisimportanttonotethatthenewsimulationcapabilitiesleveragedrecentNETL-fundedworkoncoupledT-H-Msimulationofshalegasandshaleoilsystems.NumerousenhancementsweremadetotheTOUGH+HYDRATEcode(T+H),andthesehavebeendescribedinajournalpaper.UsingT+H+Millstoneandthewellboremodel,theLBNLteamconductedsimulationsofgasproductionsandtheassociatedgeomechanicalsystemresponseduringgasproductionfromhydratesattheUlleungbasinusingthemostrecentgeologicalmodelandtheflow,andgeomechanicalpropertiesprovidedbyKIGAMresearchers.TheseresultshavebeensubmittedasapapertoJ.Pet.Sci.Eng.OurteammateatTexasA&MUniversitysuccessfullysimulatedthebehaviorofcoupledflowandgeomechanicsatUBGH2-6.Consideringmoreaccurateaxisymmetricformulation,thesameconclusionasinthepreviousstudy-thatthewellboremightnotbestable,whichcansufferfromsignificantverticalslip–wasobtained.Thus,carefulconsiderationofgeomechanicsbehaviorisrequired.Currently,moresimulationwithvariousproductionscenariosandfurtherin-depthanalysisareongoingtoinvestigategeomechanicalbehaviorsuchassubsidence,evolutionofeffectivestress,andanypotentialofgeologicalfailureincludingwellborecollapse.
LaboratorystudiesTwostudieswereperformedtopartiallyaddresstheessentialquestion:Cangasbeeffectivelyproducedfromthelayeredsand/mudsystem?Theseincludestudiesofparticletransportinsand/mudlayeredsystems,andhydratedissociationtestsin
3
sand/mudsystemsatdifferentratestomodeldifferentflowsresultingfromproductionmethodsanddistancefromthewell.
Inourstudiesunderrelevanteffectivestressesinthesand/mudandsandparticlesystemsinvestigated,particlemigrationincludingkaoliniteparticles,diatoms,andmicron-scalebariteparticleswasnotgeomechanicallysignificant.Geomechanicalsystemfailurewasfrequentlyobservedwhensandcontrolwaspoor.Productionofmudalsooccurred,butparticletransportthroughthesandlayerwasminimal.Thetestsdidnotcovereveryforeseeablecondition,however,andtheseresultsareincontrastwithseveralotherstudies.
4
Table of Contents
LBNL-KIGAMCollaborationintheInvestigationoftheGasProductionPotentialofHydrateDepositsintheKoreanEastSea..........................................................................1
ExecutiveSummary........................................................................................................................2
ProjectDescription.........................................................................................................................5
Task1: Enhancedflowsimulationcapabilitiesforthesimulationofcomplexmud/silt/sandhydrate-bearingsystems...............................................................................6
Task2: EnhancedgeomechanicalcapabilitiesforthepredictivesimulationofpotentialUBGHfieldtestsites(fundedbyKIGAM)..........................................................10
Task3: ProjectManagement,Communication,ReportingandTechnologyTransfer(fundedbyUSDOE)...................................................................................................18
Task4: Gasproductionfromasandlayerinasand/mudlayeredsystem..........19Task5: Mechanicalandchemicalbehaviorofdiatomaceousmediumandfiltrationbehaviorofsand………………….…………………………………………………………….35
LBNL-KIGAMCollaborationintheInvestigationoftheGasProductionPotentialofHydrateDepositsintheKoreanEastSea.......................................................................42
5
Project Description This report presents the results of five tasks performed to support investigation into the potential field test and gas production from layered sands and muds as found in the Ulleung Basin. Knowledge gained from this work will benefit KIGAM and USDOE in their consideration of natural gas production from suboceanic deposits containing methane hydrate. The five tasks include improvements to hydrate multiphase flow simulators that include geomechanical modeling, and simulations of test cases of interest. Laboratory tasks investigating the behavior of hydrate-bearing layered sand/mud systems, and particle transport in these systems were performed. The tasks are: Task1: Enhanced flow simulation capabilities for the simulation of complex
mud/silt/sandhydrate-bearingsystemsSubtask1.1:Non-DarcycapabilitiesforT+HcodesSubtask1.2:Simulationofcomplexmud/silt/sanddeposits
Task2: EnhancedgeomechanicalcapabilitiesforthepredictivesimulationofpotentialUBGHfieldtestsites
Task3: Project Management, Communication, Reporting and TechnologyTransfer
Task4: Gasproductionfromasandlayerinasand/mudlayeredsystemTask5: Mechanical and chemical behavior of diatomaceous medium and
filtrationbehaviorofsand
TheworkwasperformedoverthetimeperiodofMay2017toSeptember2018.Althoughoriginallytheprojectwastostartearlier,contractingandfundingissuesdelayedtheprojectstart.Eachtaskispresentedindividuallybelow.Journalpapersthatwerepartiallyfundedunderthisprojectareincludedasattachments,andnotfurthersummarizedherein.
6
Task 1: Enhanced flow simulation capabilities for the simulation of complex mud/silt/sand hydrate-bearing systems
GeorgeMoridis,MattReaganSubtask1.1:Non-DarcycapabilitiesforT+Hcodes(LBNLportion-fundedbyUSDOE)Subtask1.2:Simulationofcomplexmud/silt/sanddeposits(fundedbyUSDOE)
TheTOUGH+HYDRATEcode(T+H)receivedextensivephysicalpropertiesupgrades,non-Darcyflowcapabilities,andworkflowenhancements.T+Hnowincludesseveralnewphysicalpropertiesrelationships:1. Newwaterpropertiesformulations(IAPWS,2008to2014)2. Newgasviscosityestimationoption:Frictiontheory(Quinones[2000])3. NewadditiontothegasEOSoptions:Lee-Kessler(1975),newdefaultfor
hydrocarbongasenthalpy4. Newmethodsforcomputinghydratethermophysicalproperties:Data-Gupta
(2008);Ballard(2011)5. Newactivity-basedoptionstodeterminegassolubilityinH2Oinadditionto
standardHenry’slaw6. Newcapabilitiestofullyaccountfortheeffectsofhighsalinityonhydrate
formationTheT+Hcodehasalsobeenexpandedbytheinclusionofnon-Darcyflowcapabilities,includingturbulentflowandgas-slippageeffects(wheneffectivepermeabilitiesarebelowthemicro-Darcylevel)coveringthespectrumfromKlinkenbergflowtoKnudsendiffusion(Maleketal.,2003).Thedrift-fluxmodel(Shietal.,2005)hasbeenincorporatedintothecodeforthesimulationofcoupledwellboreinteractions,andForchheimerflowhasbeenaddedtohandlehighfluidvelocitiesinhigh-permeabilitymedia(Barree,andConway,2004).Workflowenhancementstothecodeincludetime-variableboundaryconditions,monitoringof3Dregionsofvaryingshapes,monitoringofflowthroughuser-defined2Dand3Dinterfaces,andnewoutputformats(conversiontoVTKandsilofiles).ThelatestversionofT+HwasreleasedinJanuary2018anddocumentedinthefollowingpaper:Moridis,G.J.,Queiruga,A.F.,Reagan,M.T.,“TheT+H+MCodefortheAnalysisof
CoupledFlow,Thermal,ChemicalandGeomechanicalProcessesinHydrate-BearingGeologicMedia,”Proc.9thInt.ConferenceonGasHydrates,Denver,CO,1-3June2017.
WehavealsocompleteddevelopmentofthelatestT+MsimulatorbycouplingthelatestT+HsimulatortoMillstone,anewgeomechanicalcodethatoffersnew
7
abilitiesandfixesmanycomputationalandmathematicalshortcomingsofearliercodesusedtodescribethegeomechanicalresponseofhydrate-bearingsystems.Thenewformulationincludestheabilitytoperformgeomechanicalsimulationswith2Dradiallysymmetricmeshestorepresent3Dverticalwellproblem,increasingnumericalefficiency.ThenewT+H/Millstoneplatformisdescribedinarecentlysubmittedpaper:Moridis,G.J.,Reagan,M.T.,Queiruga,A.F.,“TheTOUGH+MillstoneCodeforthe
AnalysisofCoupledFlow,Thermal,ChemicalandGeomechanicalProcessesinHydrate-BearingGeologicMedia,PartI:TheHydrateSimulator,”submittedtoTransportinPorousMedia.
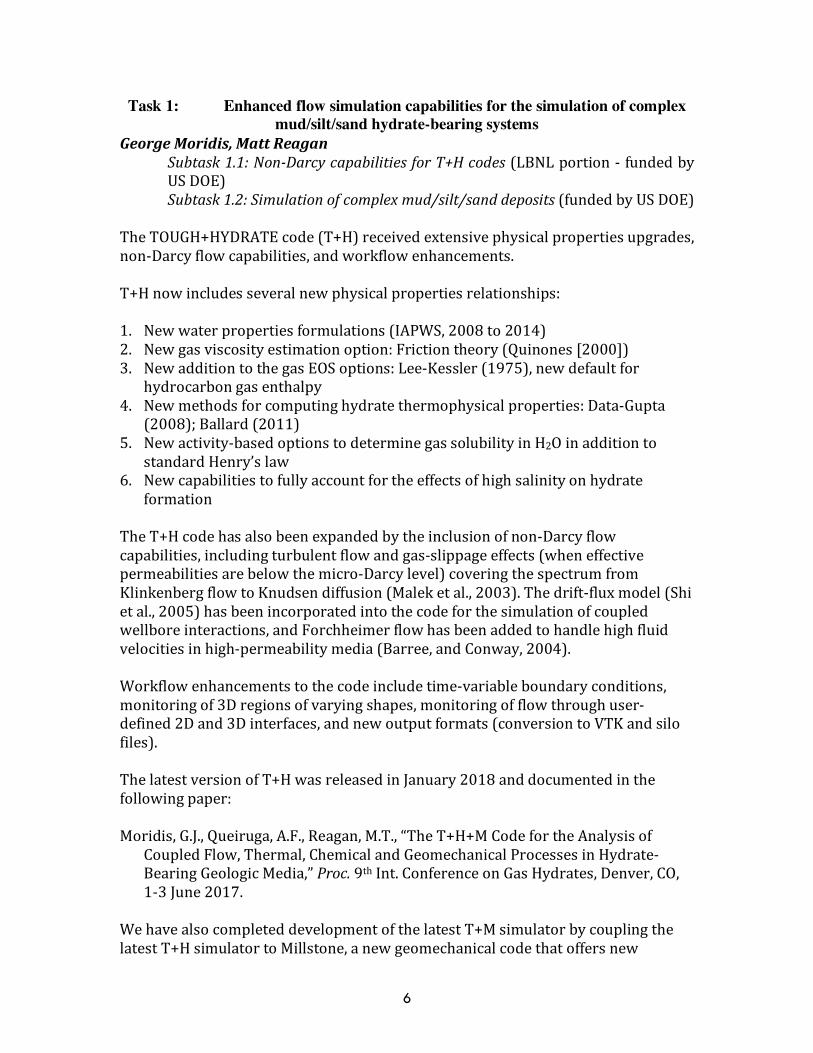
UsingT+H+Millstoneandthewellboremodel,theLBNLteamhasbeenconductingsimulationofgasproductionsoftheassociatedgeomechanicalsystemresponseduringgasproductionfromhydratesattheUlleungbasinusingthemostrecentgeologicalmodelandtheflowandgeomechanicalpropertiesprovidedbyKIGAMresearchers.ThecoupledMillstonecodeallowsforseparateflowandmechanicsmeshes,resultingingreaternumericalefficiency(Figure1.1).Thesimulationsconsideredlarge-deformationgeomechanics(notfullyconsideredinearlierstudies)andplasticity.Thenew,moreefficientformulationofMillstone,whichusesanaxisymmetric/cylindrical2Dmodelinsteadofa3Dwedge,issubstantiallymorephysicallyandnumericallyaccurateindescribingthenear-wellregionaroundaverticalwellandalsocomputationallymoreefficient.Thus,someearliersimulationswerere-runusingthenewcode..
Figure1.1.DomainoftheflowproblemasaTOUGH+meshdomain(black,centered)
insetinalargergeomechanicaldomainwithafiniteelementmeshsolvedbyMillstone(blue,cuthalfwaywithextentoutlined).
8
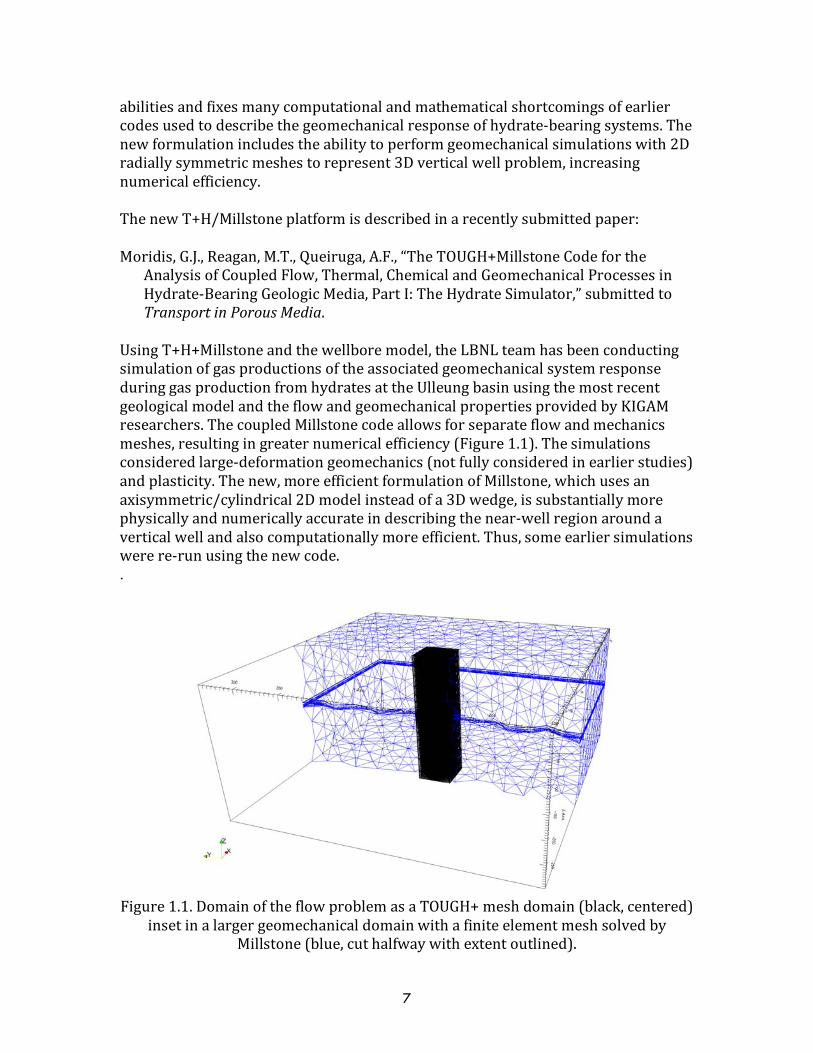
Inaddition,usinganewpost-processingcapabilityforcouplingflowandgeomechanics,werevisitedearliersimulations(documentedina2016report)andperformeda1-waycouplingofthe2016productionsimulationresultstothenewMillstonegeomechanicalsimulatorusingthetough-convertanalysispackage.
Figure1.2.CasekfS: Hydratesaturation(SH)distributionsonthex-zplaneaty=40
mduringthe14-daylongproductiontest(Pw=9MPa). Thesimulationresultsshowthat:1. Thegasreleaseandproductionratesaregenerallylowandtheaffectedregionof
thereservoirislimited(Figure1.2).2. Thewaterproductionaccompanyinggasproductionfromthisdepositappears
manageable(intermsofabsoluteratesandvolumes)underallthescenariosinvestigatedinthisstudy;however,inrelativetermsthewater-to-gasratioisveryhighduringthe14-dayproductiontestandstabilizesrelativelyearly.
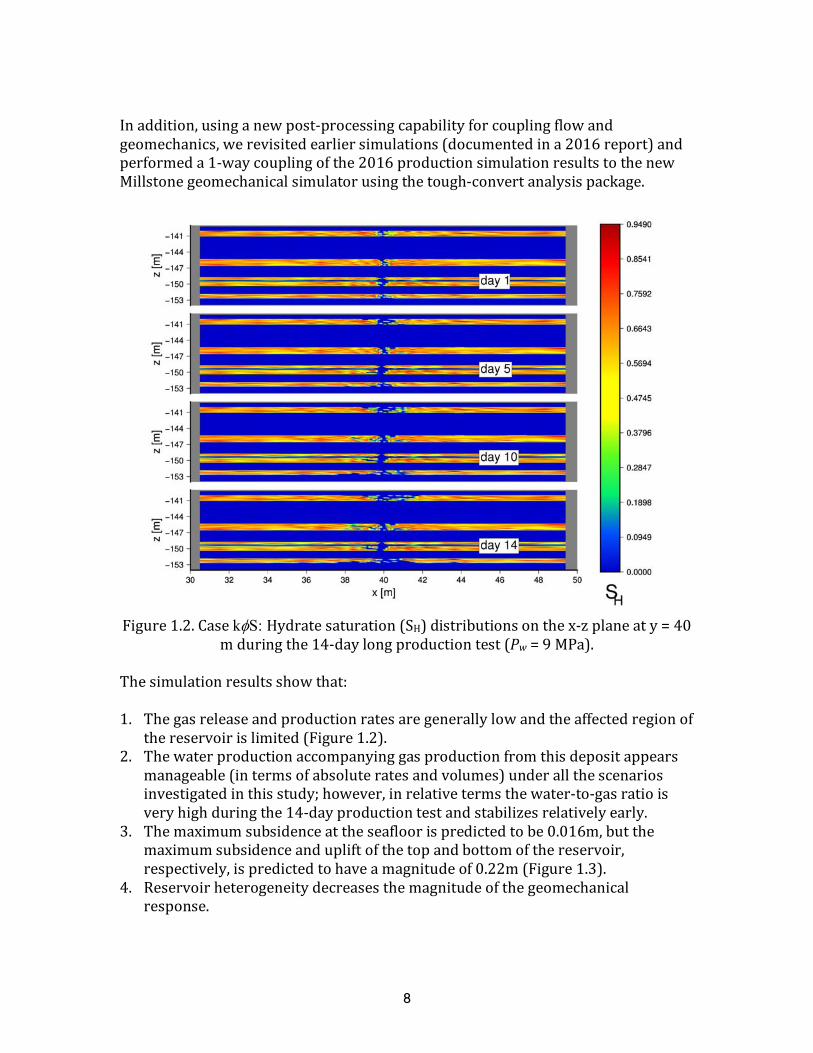
3. Themaximumsubsidenceattheseafloorispredictedtobe0.016m,butthemaximumsubsidenceandupliftofthetopandbottomofthereservoir,respectively,ispredictedtohaveamagnitudeof0.22m(Figure1.3).
4. Reservoirheterogeneitydecreasesthemagnitudeofthegeomechanicalresponse.
9
Figure1.3:Verticaldisplacementhistoryofthesystemofbothcasesattheseafloor(z=0m),topofthereservoir(z=-140m),andbottomofthereservoir(z=-153m).ThenewresultsweresubmittedasapapertoJ.Pet.Sci.Eng.:Moridis,G.J.,Reagan,M.T.,Queiruga,A.F.,Kim,S.-J.“SystemResponsetoGasProductionfromaHeterogeneousHydrateAccumulationattheUBGH2-6SiteintheUlleungBasinoftheKoreanEastSea,”inpress,J.Pet.Sci.Eng.
10
Task 2: Enhanced geomechanical capabilities for the predictive simulation of potential UBGH field test sites (funded by KIGAM)
JihoonKim(TexasA&MUniversity)NumericalinvestigationofdepressurizationandgasproductionatUBGH2-6:Coupledflow-geomechanicssimulation
Introduction
Weemploytheaxisymmetricdomainofsimulation,consideringgasproductionwithaverticalwell.Inthepreviousstudy,thegeomechanicsdomaindidnotfullyfollowtheformulationofaxisymmetricgeomechanics.Inotherwords,weusedtheCartesiancoordinatesystemforthegeomechanicsproblem,whichFLAC3Donlyallows,wherethegeomechanicsdomainwaslikeasliceofapie.Asaresult,inaccuracynearthewellareamightexist.Inthisstudy,wetaketheexactformulationofaxisymmetricgeomechanicsinordertohavemoreaccurateresults.Precisely,wetakethecylindricalcoordinatesystemofstressandmomentumbalancetocalculatedeformationandstressnearthewellboreappropriately.Also,weuseanin-housesimulatorofcoupledflowandgeomechanics(TOUGH+Hydrate-ROCMECH),whileT-F(TOUGH+Hydrate-FLAC3D)wasusedinthepreviousstudy.
Fromnumericalresults,forlongproductionofdepressurization,weidentifysmallsubsidenceatthesurfacebutsignificantverticaldisplacementabovethehydratezones.Thus,asfoundinthepreviousstudy,carefulconsiderationforwellborestabilityisrequired.
Numericalsimulation
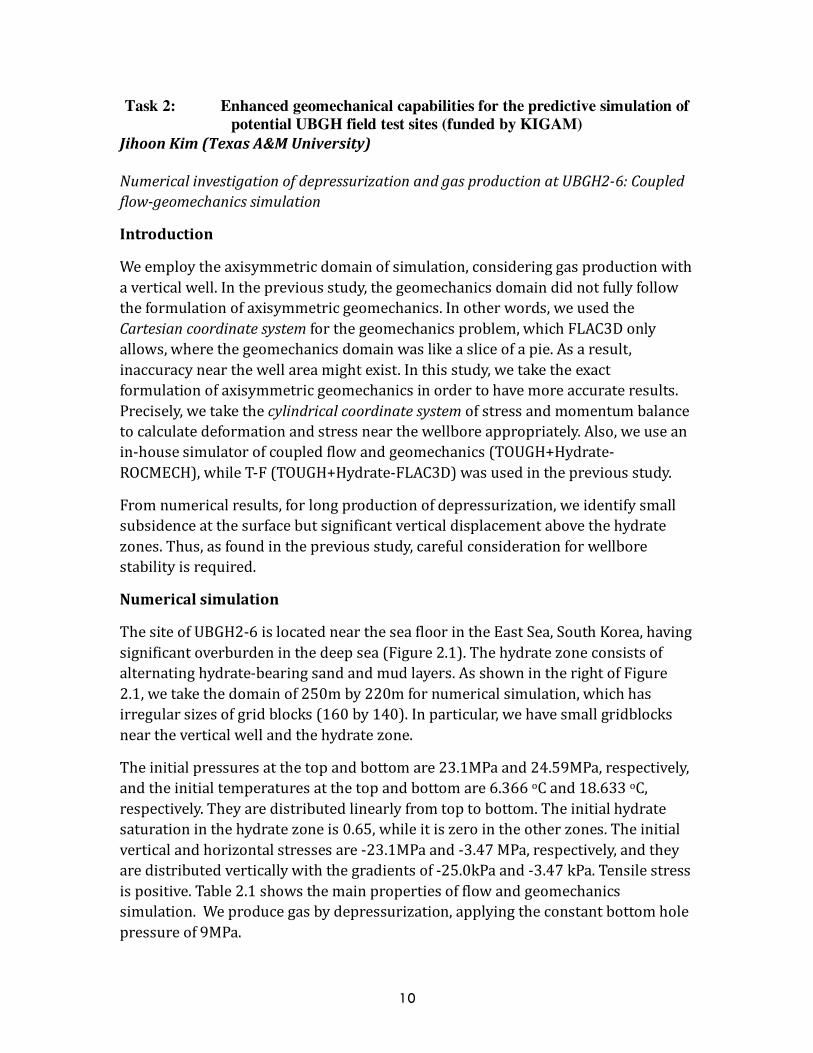
ThesiteofUBGH2-6islocatedneartheseafloorintheEastSea,SouthKorea,havingsignificantoverburdeninthedeepsea(Figure2.1).Thehydratezoneconsistsofalternatinghydrate-bearingsandandmudlayers.AsshownintherightofFigure2.1,wetakethedomainof250mby220mfornumericalsimulation,whichhasirregularsizesofgridblocks(160by140).Inparticular,wehavesmallgridblocksneartheverticalwellandthehydratezone.
Theinitialpressuresatthetopandbottomare23.1MPaand24.59MPa,respectively,andtheinitialtemperaturesatthetopandbottomare6.366oCand18.633oC,respectively.Theyaredistributedlinearlyfromtoptobottom.Theinitialhydratesaturationinthehydratezoneis0.65,whileitiszerointheotherzones.Theinitialverticalandhorizontalstressesare-23.1MPaand-3.47MPa,respectively,andtheyaredistributedverticallywiththegradientsof-25.0kPaand-3.47kPa.Tensilestressispositive.Table2.1showsthemainpropertiesofflowandgeomechanicssimulation.Weproducegasbydepressurization,applyingtheconstantbottomholepressureof9MPa.
11
Figure2.1Left:geologicalinformationofUBGH2-6Right:discretizeddomainforflow
Table2.1.Materialpropertiesforflowandgeomechanics
Property Overburden Hydratelayer Mud-Interlayer
Underburden
Drainedbulkmodulus,SH=0%
15.55MPa 27MPa 20MPa 22MPa
Drainedshearmodulus,SH=0%
5.185MPa 16MPa 6.667MPa 7.407MPa
Drainedbulkmodulus,SH=100%
285MPa 933.33MPa 285MPa285MPa
Drainedshearmodulus,SH=100%
99.75MPa 560MPa 99.75MPa 99.75MPa
Permeability,SH=0% 0.02mD 500mD 0.14mD 0.02mD
Initialporosity 0.76 0.45 0.67 0.0
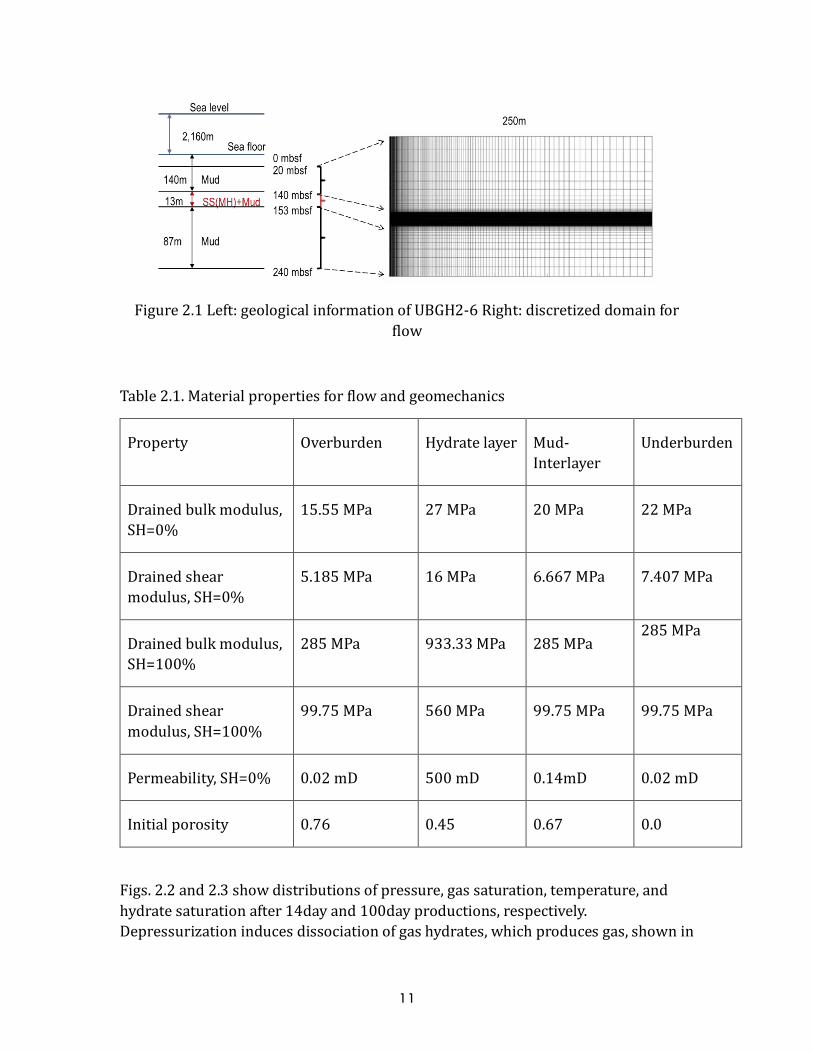
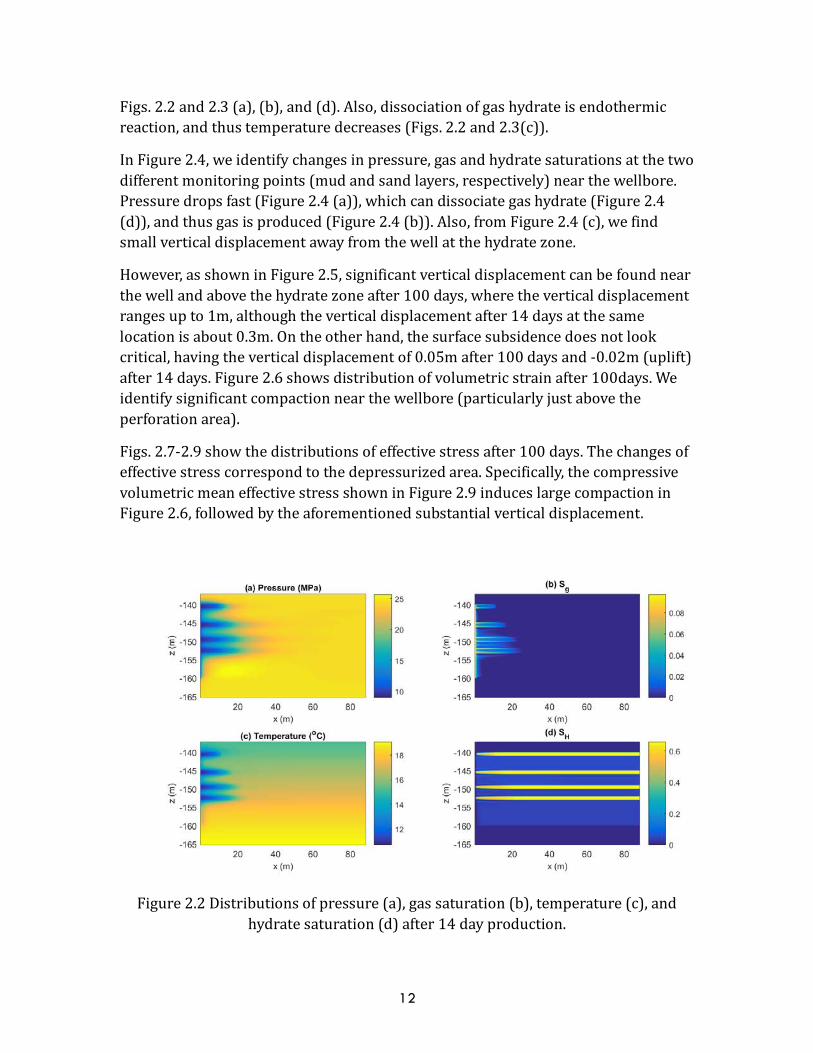
Figs.2.2and2.3showdistributionsofpressure,gassaturation,temperature,andhydratesaturationafter14dayand100dayproductions,respectively.Depressurizationinducesdissociationofgashydrates,whichproducesgas,shownin
12
Figs.2.2and2.3(a),(b),and(d).Also,dissociationofgashydrateisendothermicreaction,andthustemperaturedecreases(Figs.2.2and2.3(c)).
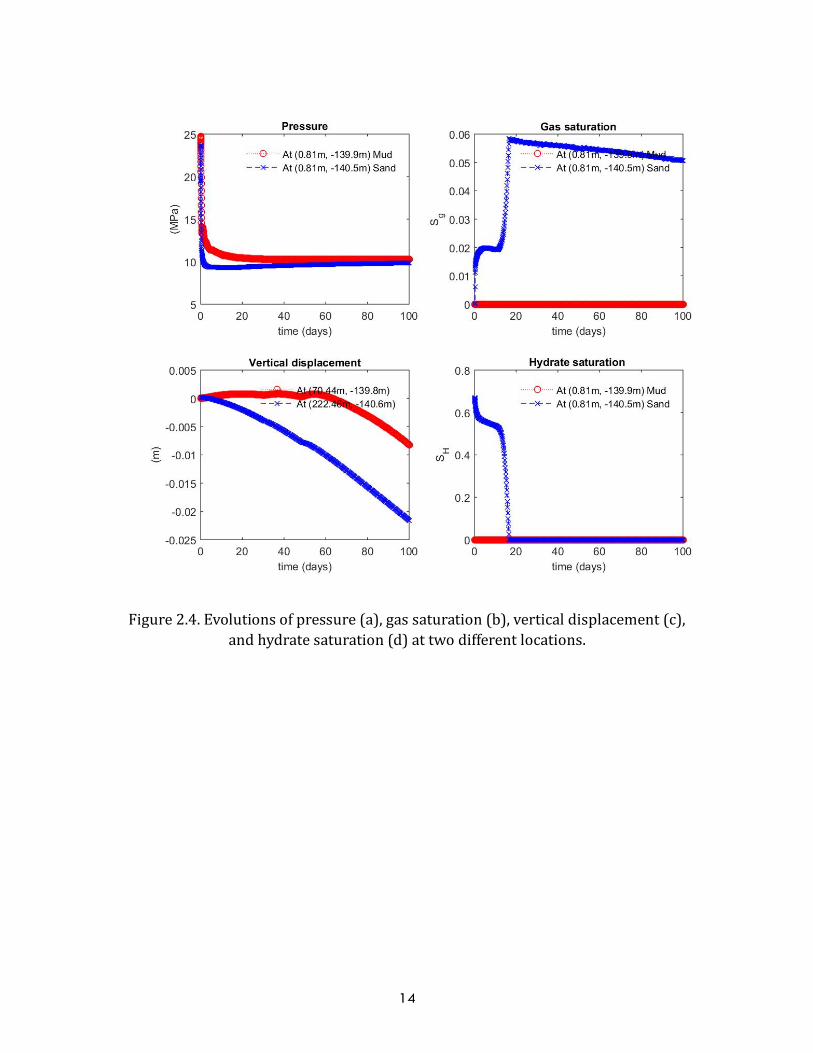
InFigure2.4,weidentifychangesinpressure,gasandhydratesaturationsatthetwodifferentmonitoringpoints(mudandsandlayers,respectively)nearthewellbore.Pressuredropsfast(Figure2.4(a)),whichcandissociategashydrate(Figure2.4(d)),andthusgasisproduced(Figure2.4(b)).Also,fromFigure2.4(c),wefindsmallverticaldisplacementawayfromthewellatthehydratezone.
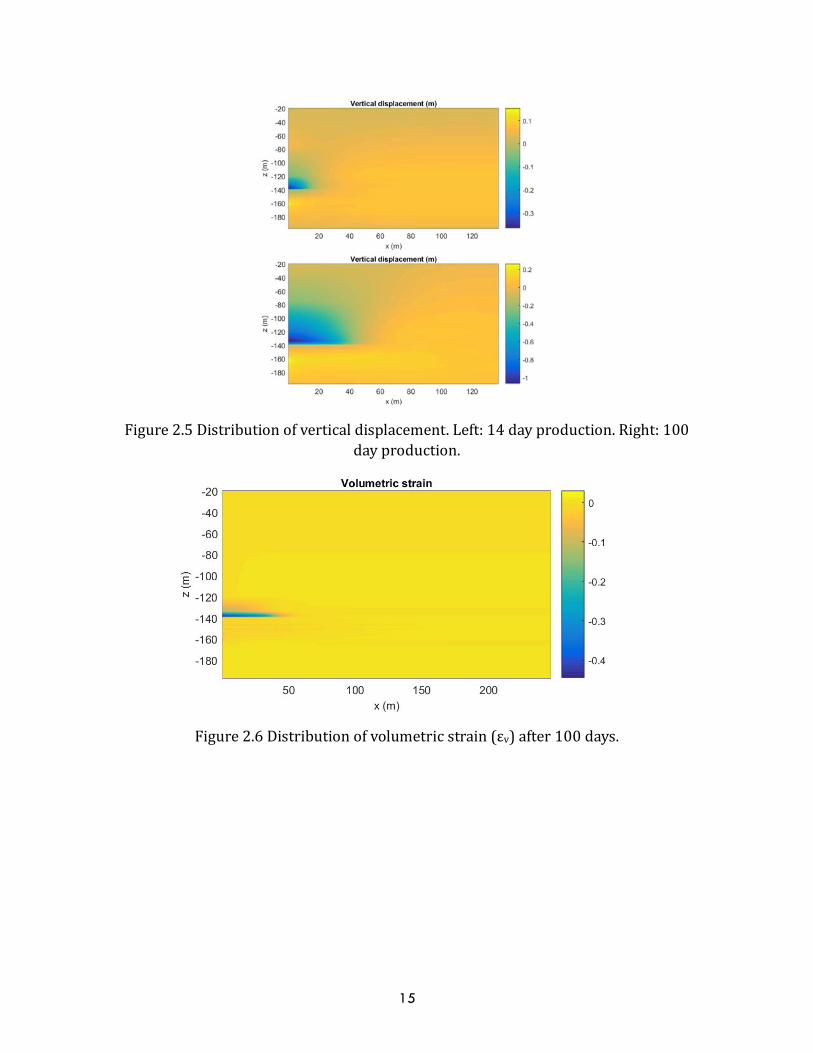
However,asshowninFigure2.5,significantverticaldisplacementcanbefoundnearthewellandabovethehydratezoneafter100days,wheretheverticaldisplacementrangesupto1m,althoughtheverticaldisplacementafter14daysatthesamelocationisabout0.3m.Ontheotherhand,thesurfacesubsidencedoesnotlookcritical,havingtheverticaldisplacementof0.05mafter100daysand-0.02m(uplift)after14days.Figure2.6showsdistributionofvolumetricstrainafter100days.Weidentifysignificantcompactionnearthewellbore(particularlyjustabovetheperforationarea).
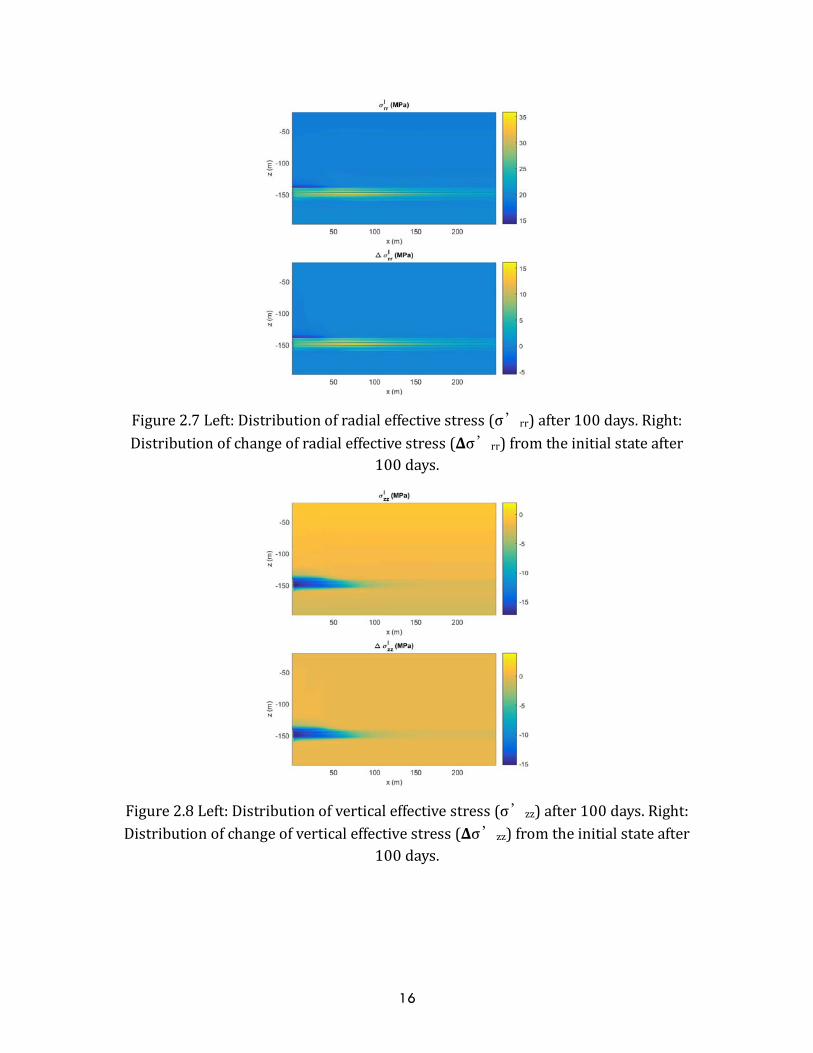
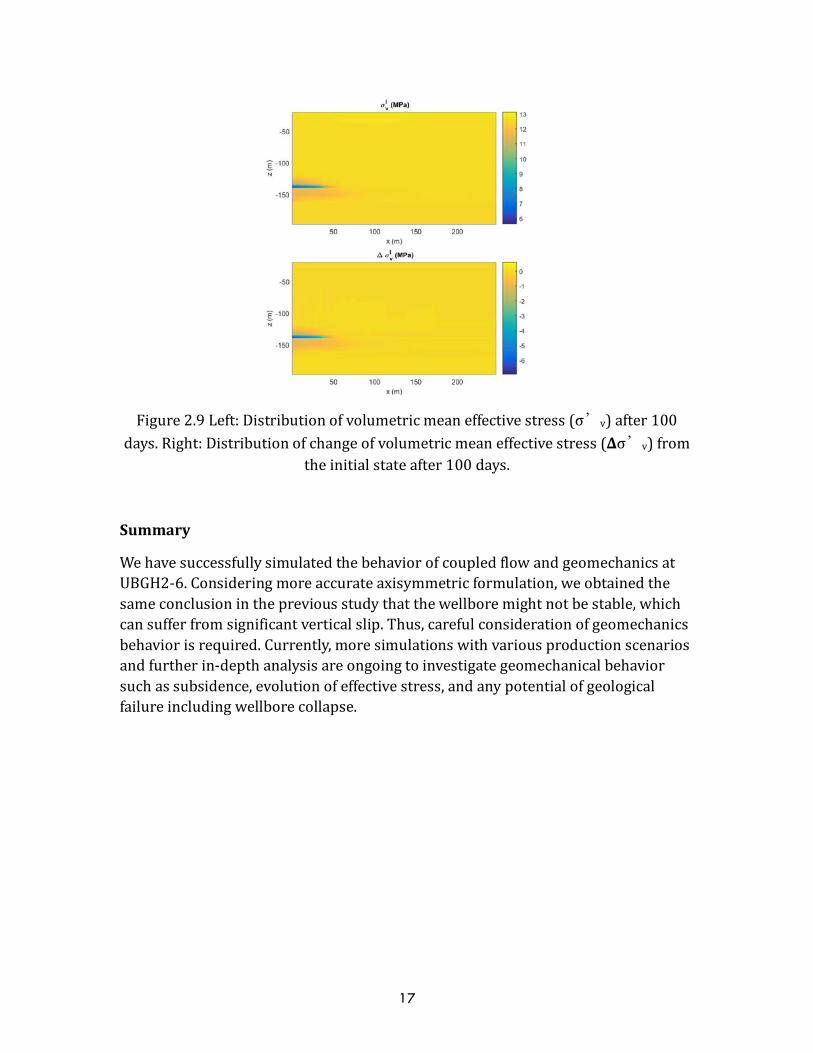
Figs.2.7-2.9showthedistributionsofeffectivestressafter100days.Thechangesofeffectivestresscorrespondtothedepressurizedarea.Specifically,thecompressivevolumetricmeaneffectivestressshowninFigure2.9induceslargecompactioninFigure2.6,followedbytheaforementionedsubstantialverticaldisplacement.
Figure2.2Distributionsofpressure(a),gassaturation(b),temperature(c),andhydratesaturation(d)after14dayproduction.
13
Figure2.3Distributionsofpressure(a),gassaturation(b),temperature(c),andhydratesaturation(d)after100dayproduction.
14
Figure2.4.Evolutionsofpressure(a),gassaturation(b),verticaldisplacement(c),andhydratesaturation(d)attwodifferentlocations.
15
Figure2.5Distributionofverticaldisplacement.Left:14dayproduction.Right:100dayproduction.
Figure2.6Distributionofvolumetricstrain(εv)after100days.
16
Figure2.7Left:Distributionofradialeffectivestress(σ’rr)after100days.Right:Distributionofchangeofradialeffectivestress(𝚫σ’rr)fromtheinitialstateafter
100days.
Figure2.8Left:Distributionofverticaleffectivestress(σ’zz)after100days.Right:Distributionofchangeofverticaleffectivestress(𝚫σ’zz)fromtheinitialstateafter
100days.
17
Figure2.9Left:Distributionofvolumetricmeaneffectivestress(σ’v)after100days.Right:Distributionofchangeofvolumetricmeaneffectivestress(𝚫σ’v)from
theinitialstateafter100days.
Summary
WehavesuccessfullysimulatedthebehaviorofcoupledflowandgeomechanicsatUBGH2-6.Consideringmoreaccurateaxisymmetricformulation,weobtainedthesameconclusioninthepreviousstudythatthewellboremightnotbestable,whichcansufferfromsignificantverticalslip.Thus,carefulconsiderationofgeomechanicsbehaviorisrequired.Currently,moresimulationswithvariousproductionscenariosandfurtherin-depthanalysisareongoingtoinvestigategeomechanicalbehaviorsuchassubsidence,evolutionofeffectivestress,andanypotentialofgeologicalfailureincludingwellborecollapse.

18
Task 3: Project Management, Communication, Reporting and Technology Transfer (funded by US DOE)
ThistasksupportedprojectcoordinationbetweenLBNL,NETL,KIGAM,andTAMU,andreports.
19
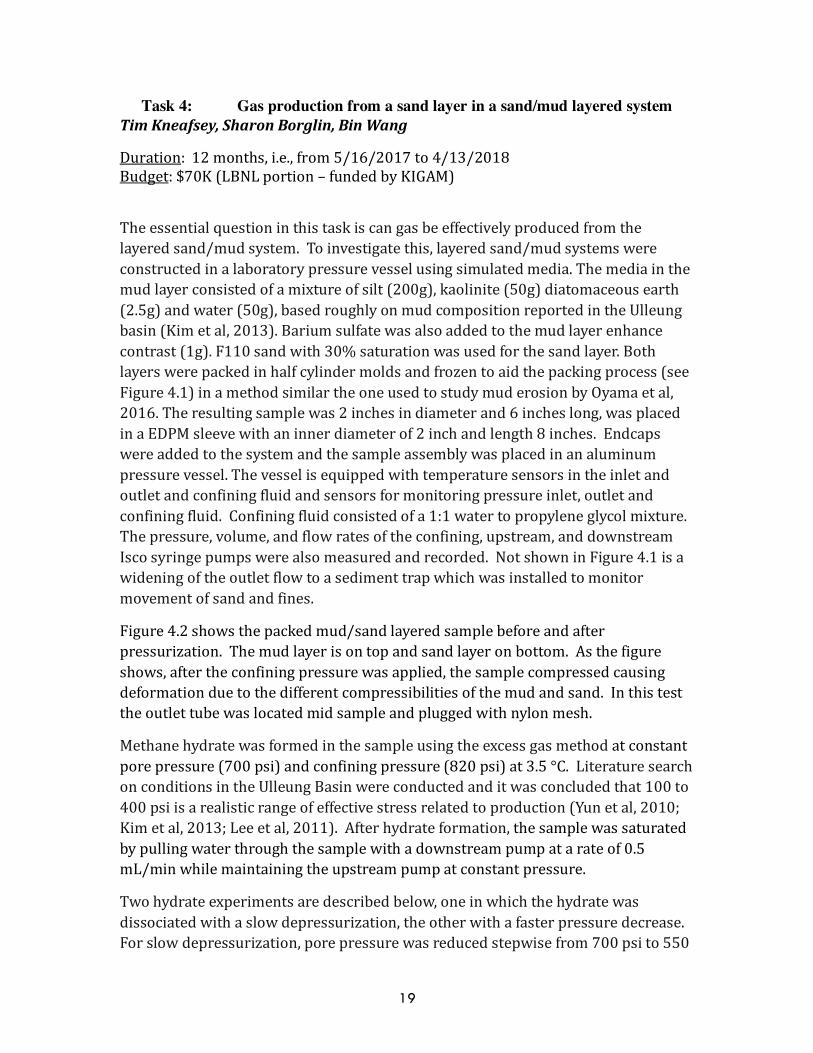
Task 4: Gas production from a sand layer in a sand/mud layered system TimKneafsey,SharonBorglin,BinWang
Duration: 12months,i.e.,from5/16/2017to4/13/2018Budget:$70K(LBNLportion–fundedbyKIGAM)
Theessentialquestioninthistaskiscangasbeeffectivelyproducedfromthelayeredsand/mudsystem.Toinvestigatethis,layeredsand/mudsystemswereconstructedinalaboratorypressurevesselusingsimulatedmedia.Themediainthemudlayerconsistedofamixtureofsilt(200g),kaolinite(50g)diatomaceousearth(2.5g)andwater(50g),basedroughlyonmudcompositionreportedintheUlleungbasin(Kimetal,2013).Bariumsulfatewasalsoaddedtothemudlayerenhancecontrast(1g).F110sandwith30%saturationwasusedforthesandlayer.Bothlayerswerepackedinhalfcylindermoldsandfrozentoaidthepackingprocess(seeFigure4.1)inamethodsimilartheoneusedtostudymuderosionbyOyamaetal,2016.Theresultingsamplewas2inchesindiameterand6incheslong,wasplacedinaEDPMsleevewithaninnerdiameterof2inchandlength8inches.Endcapswereaddedtothesystemandthesampleassemblywasplacedinanaluminumpressurevessel.Thevesselisequippedwithtemperaturesensorsintheinletandoutletandconfiningfluidandsensorsformonitoringpressureinlet,outletandconfiningfluid.Confiningfluidconsistedofa1:1watertopropyleneglycolmixture.Thepressure,volume,andflowratesoftheconfining,upstream,anddownstreamIscosyringepumpswerealsomeasuredandrecorded.NotshowninFigure4.1isawideningoftheoutletflowtoasedimenttrapwhichwasinstalledtomonitormovementofsandandfines.
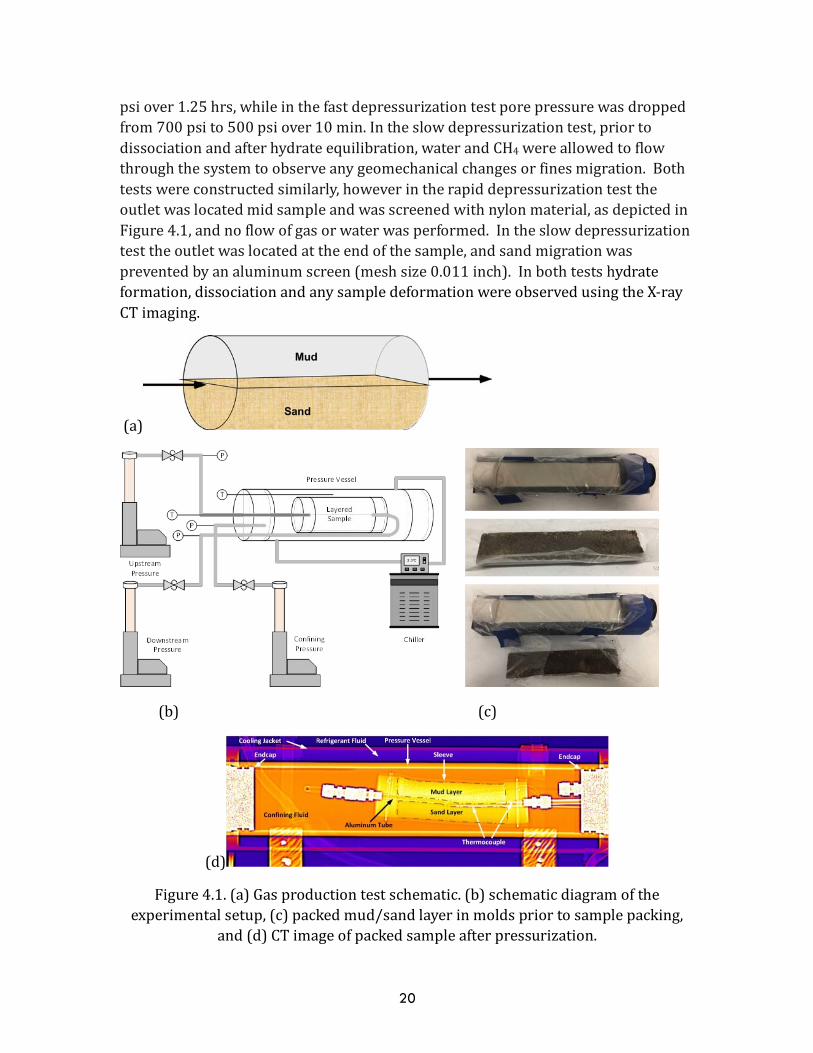
Figure4.2showsthepackedmud/sandlayeredsamplebeforeandafterpressurization.Themudlayerisontopandsandlayeronbottom.Asthefigureshows,aftertheconfiningpressurewasapplied,thesamplecompressedcausingdeformationduetothedifferentcompressibilitiesofthemudandsand.Inthistesttheoutlettubewaslocatedmidsampleandpluggedwithnylonmesh.
Methanehydratewasformedinthesampleusingtheexcessgasmethodatconstantporepressure(700psi)andconfiningpressure(820psi)at3.5°C.LiteraturesearchonconditionsintheUlleungBasinwereconductedanditwasconcludedthat100to400psiisarealisticrangeofeffectivestressrelatedtoproduction(Yunetal,2010;Kimetal,2013;Leeetal,2011).Afterhydrateformation,thesamplewassaturatedbypullingwaterthroughthesamplewithadownstreampumpatarateof0.5mL/minwhilemaintainingtheupstreampumpatconstantpressure.
Twohydrateexperimentsaredescribedbelow,oneinwhichthehydratewasdissociatedwithaslowdepressurization,theotherwithafasterpressuredecrease.Forslowdepressurization,porepressurewasreducedstepwisefrom700psito550
20
psiover1.25hrs,whileinthefastdepressurizationtestporepressurewasdroppedfrom700psito500psiover10min.Intheslowdepressurizationtest,priortodissociationandafterhydrateequilibration,waterandCH4wereallowedtoflowthroughthesystemtoobserveanygeomechanicalchangesorfinesmigration.Bothtestswereconstructedsimilarly,howeverintherapiddepressurizationtesttheoutletwaslocatedmidsampleandwasscreenedwithnylonmaterial,asdepictedinFigure4.1,andnoflowofgasorwaterwasperformed.Intheslowdepressurizationtesttheoutletwaslocatedattheendofthesample,andsandmigrationwaspreventedbyanaluminumscreen(meshsize0.011inch).Inbothtestshydrateformation,dissociationandanysampledeformationwereobservedusingtheX-rayCTimaging.
(a)
(b)(c)
(d)
Figure4.1.(a)Gasproductiontestschematic.(b)schematicdiagramoftheexperimentalsetup,(c)packedmud/sandlayerinmoldspriortosamplepacking,
and(d)CTimageofpackedsampleafterpressurization.
21
(a)
(b)
Figure4.2.Thepackedmud/sandlayeredsample(a)Initialcondition(b)Afterincreasingtheeffectivestressto120psi.
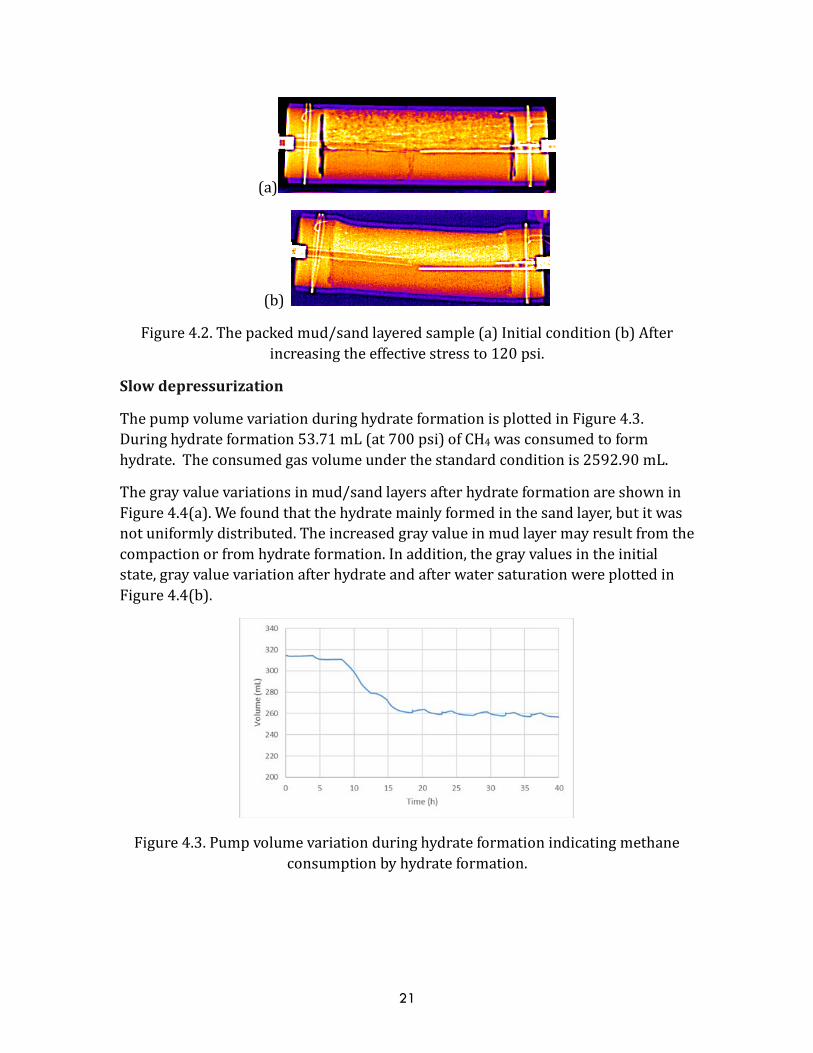
Slowdepressurization
ThepumpvolumevariationduringhydrateformationisplottedinFigure4.3.Duringhydrateformation53.71mL(at700psi)ofCH4wasconsumedtoformhydrate.Theconsumedgasvolumeunderthestandardconditionis2592.90mL.
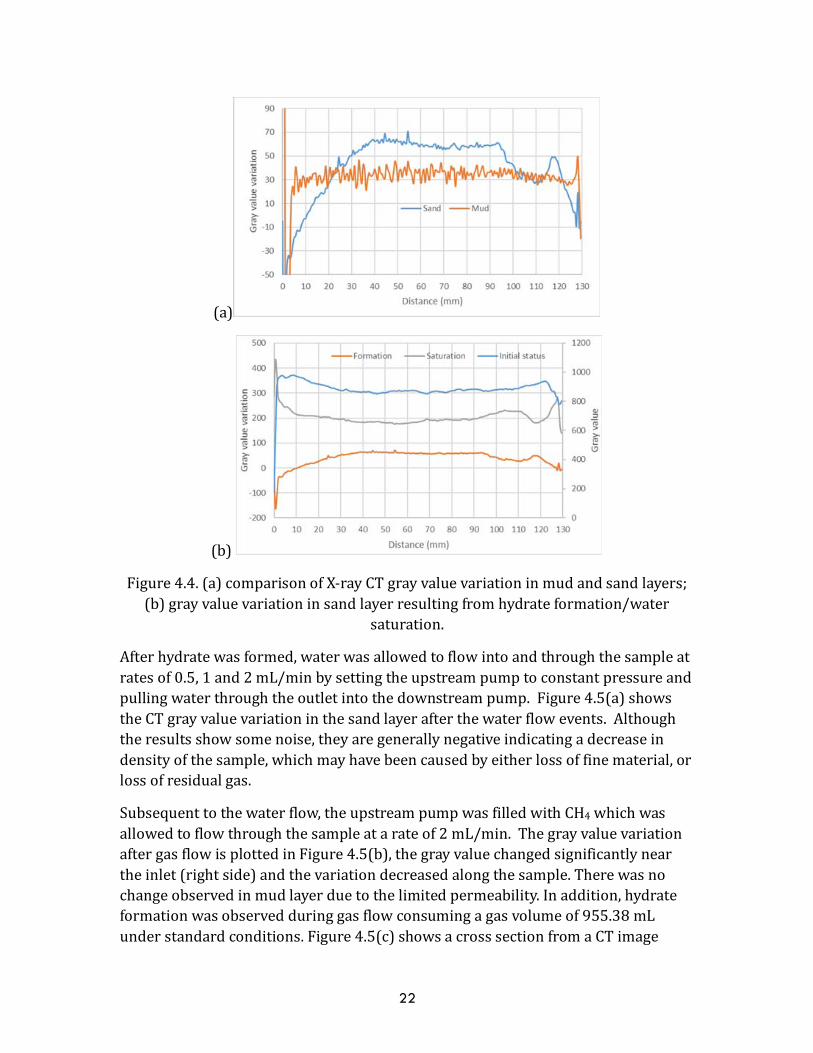
Thegrayvaluevariationsinmud/sandlayersafterhydrateformationareshowninFigure4.4(a).Wefoundthatthehydratemainlyformedinthesandlayer,butitwasnotuniformlydistributed.Theincreasedgrayvalueinmudlayermayresultfromthecompactionorfromhydrateformation.Inaddition,thegrayvaluesintheinitialstate,grayvaluevariationafterhydrateandafterwatersaturationwereplottedinFigure4.4(b).
Figure4.3.Pumpvolumevariationduringhydrateformationindicatingmethaneconsumptionbyhydrateformation.
22
(a)
(b)
Figure4.4.(a)comparisonofX-rayCTgrayvaluevariationinmudandsandlayers;(b)grayvaluevariationinsandlayerresultingfromhydrateformation/water
saturation.
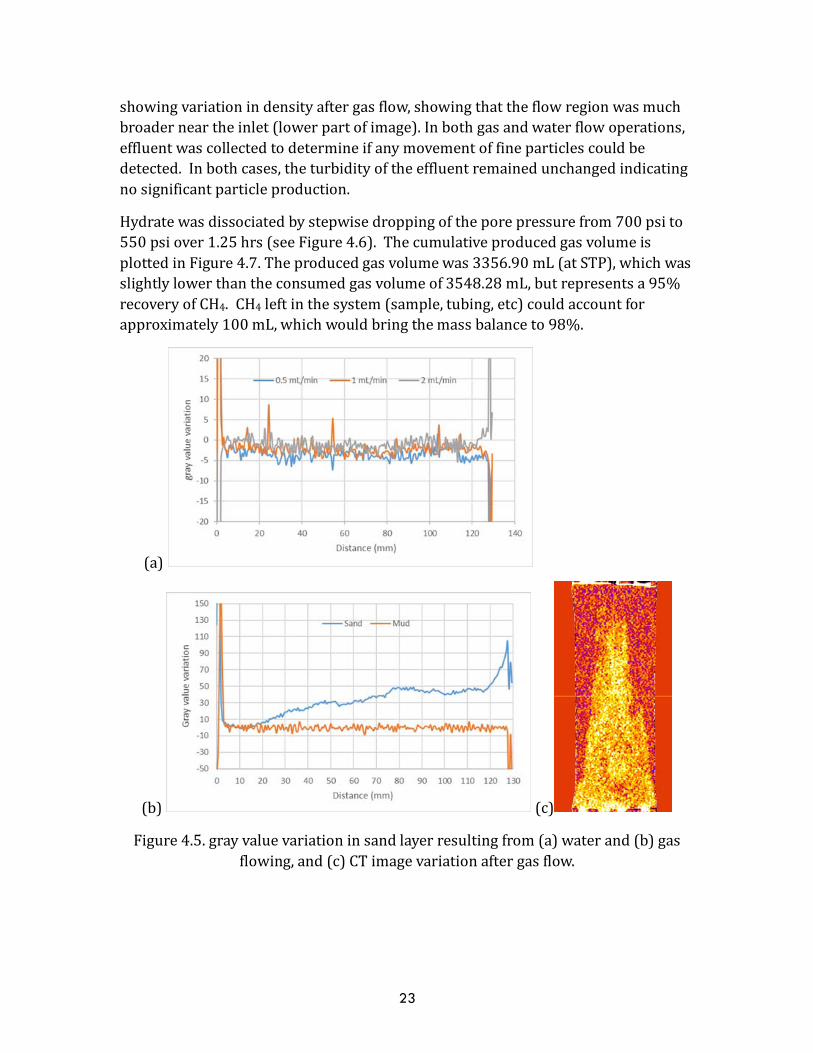
Afterhydratewasformed,waterwasallowedtoflowintoandthroughthesampleatratesof0.5,1and2mL/minbysettingtheupstreampumptoconstantpressureandpullingwaterthroughtheoutletintothedownstreampump.Figure4.5(a)showstheCTgrayvaluevariationinthesandlayerafterthewaterflowevents.Althoughtheresultsshowsomenoise,theyaregenerallynegativeindicatingadecreaseindensityofthesample,whichmayhavebeencausedbyeitherlossoffinematerial,orlossofresidualgas.
Subsequenttothewaterflow,theupstreampumpwasfilledwithCH4whichwasallowedtoflowthroughthesampleatarateof2mL/min.ThegrayvaluevariationaftergasflowisplottedinFigure4.5(b),thegrayvaluechangedsignificantlyneartheinlet(rightside)andthevariationdecreasedalongthesample.Therewasnochangeobservedinmudlayerduetothelimitedpermeability.Inaddition,hydrateformationwasobservedduringgasflowconsumingagasvolumeof955.38mLunderstandardconditions.Figure4.5(c)showsacrosssectionfromaCTimage
23
showingvariationindensityaftergasflow,showingthattheflowregionwasmuchbroaderneartheinlet(lowerpartofimage).Inbothgasandwaterflowoperations,effluentwascollectedtodetermineifanymovementoffineparticlescouldbedetected.Inbothcases,theturbidityoftheeffluentremainedunchangedindicatingnosignificantparticleproduction.
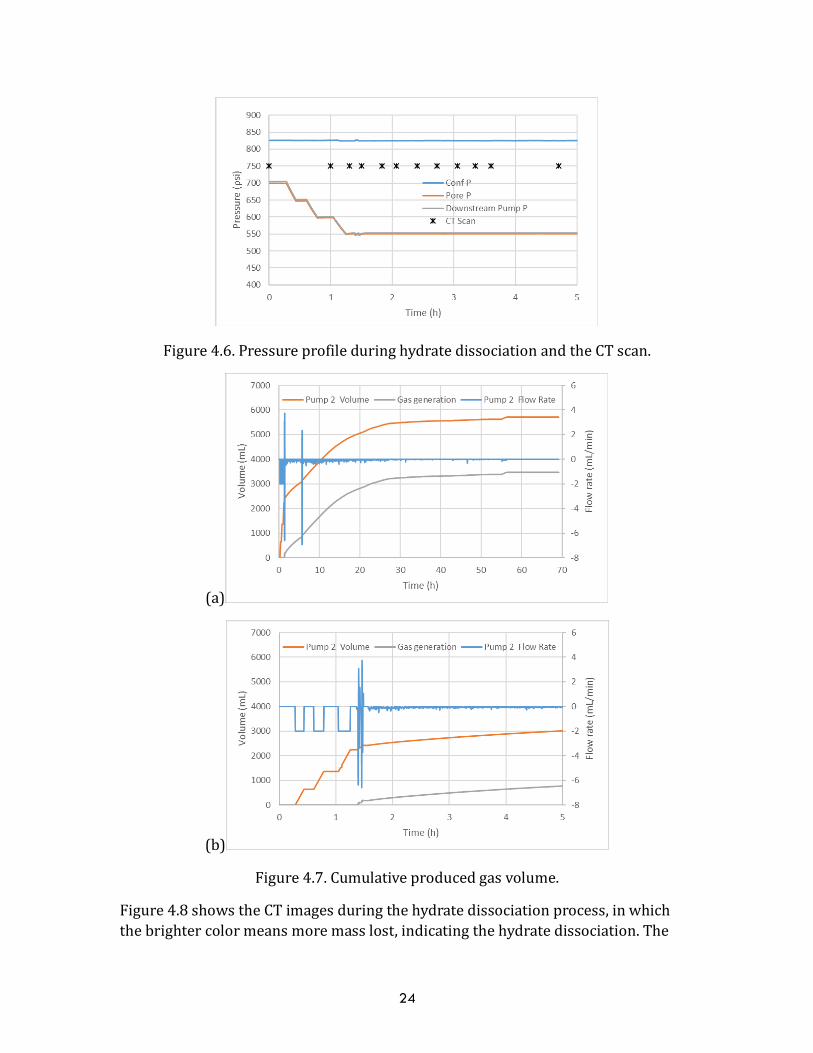
Hydratewasdissociatedbystepwisedroppingoftheporepressurefrom700psito550psiover1.25hrs(seeFigure4.6).ThecumulativeproducedgasvolumeisplottedinFigure4.7.Theproducedgasvolumewas3356.90mL(atSTP),whichwasslightlylowerthantheconsumedgasvolumeof3548.28mL,butrepresentsa95%recoveryofCH4.CH4leftinthesystem(sample,tubing,etc)couldaccountforapproximately100mL,whichwouldbringthemassbalanceto98%.
(a)
(b) (c)
Figure4.5.grayvaluevariationinsandlayerresultingfrom(a)waterand(b)gasflowing,and(c)CTimagevariationaftergasflow.
24
Figure4.6.PressureprofileduringhydratedissociationandtheCTscan.
(a)
(b)
Figure4.7.Cumulativeproducedgasvolume.
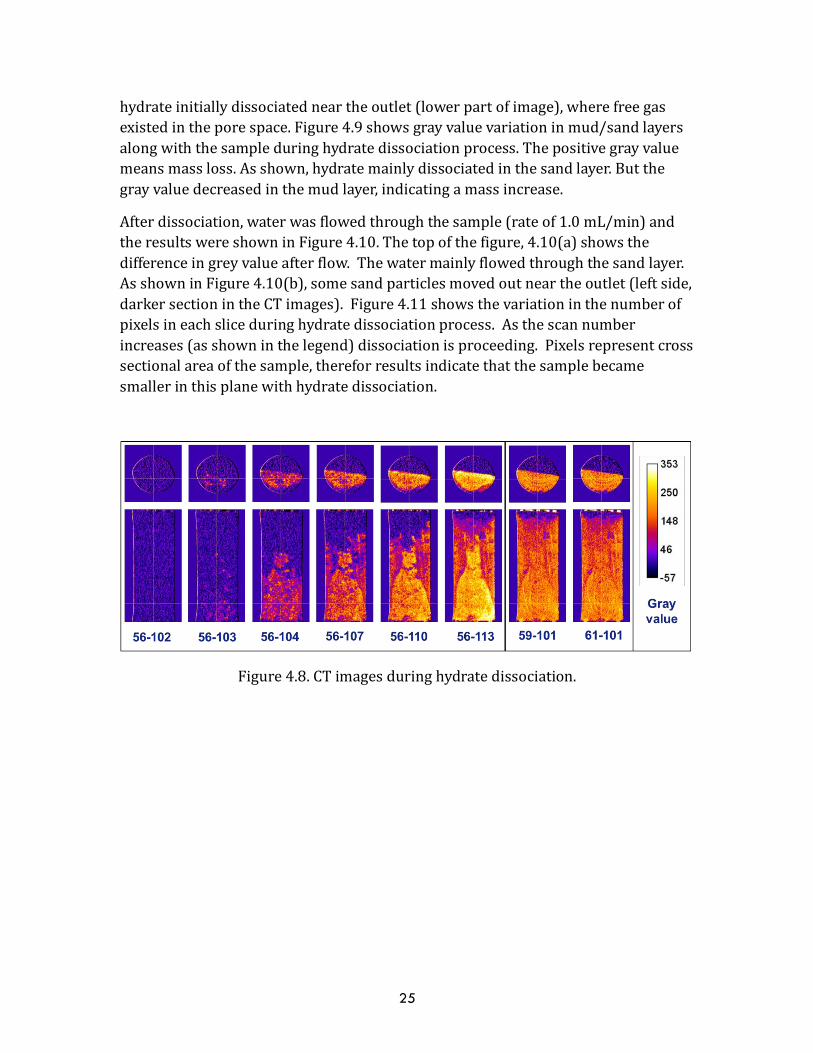
Figure4.8showstheCTimagesduringthehydratedissociationprocess,inwhichthebrightercolormeansmoremasslost,indicatingthehydratedissociation.The
25
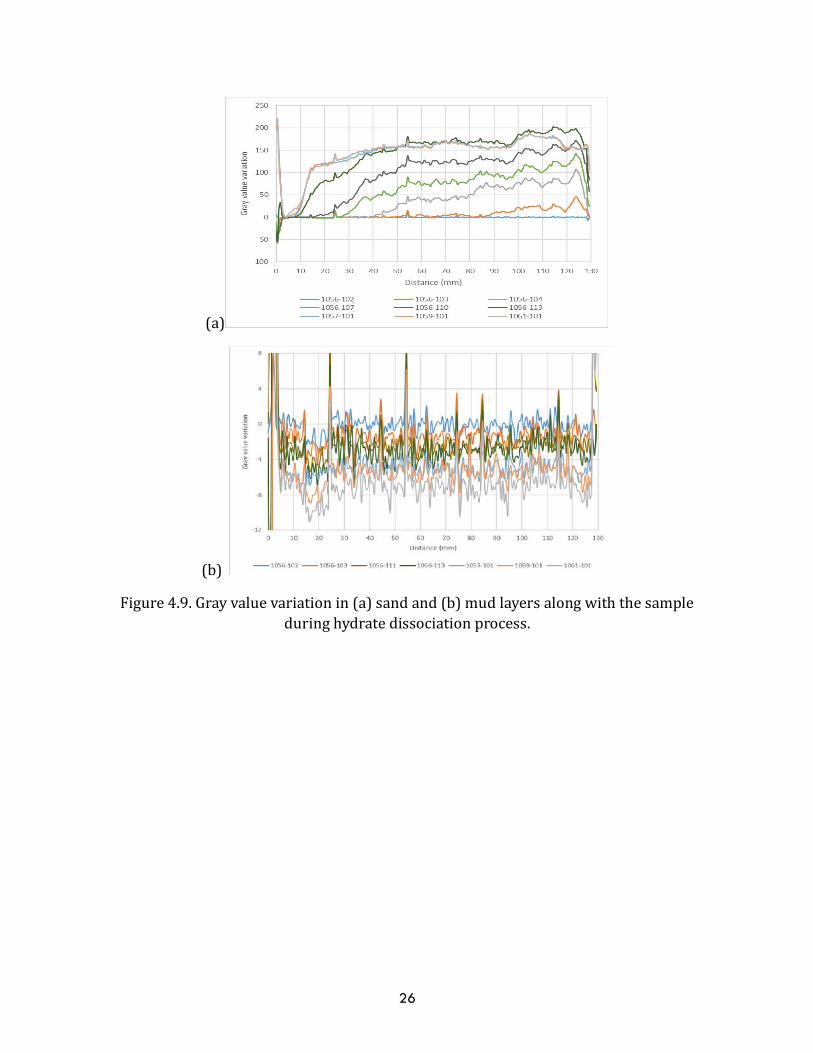
hydrateinitiallydissociatedneartheoutlet(lowerpartofimage),wherefreegasexistedintheporespace.Figure4.9showsgrayvaluevariationinmud/sandlayersalongwiththesampleduringhydratedissociationprocess.Thepositivegrayvaluemeansmassloss.Asshown,hydratemainlydissociatedinthesandlayer.Butthegrayvaluedecreasedinthemudlayer,indicatingamassincrease.
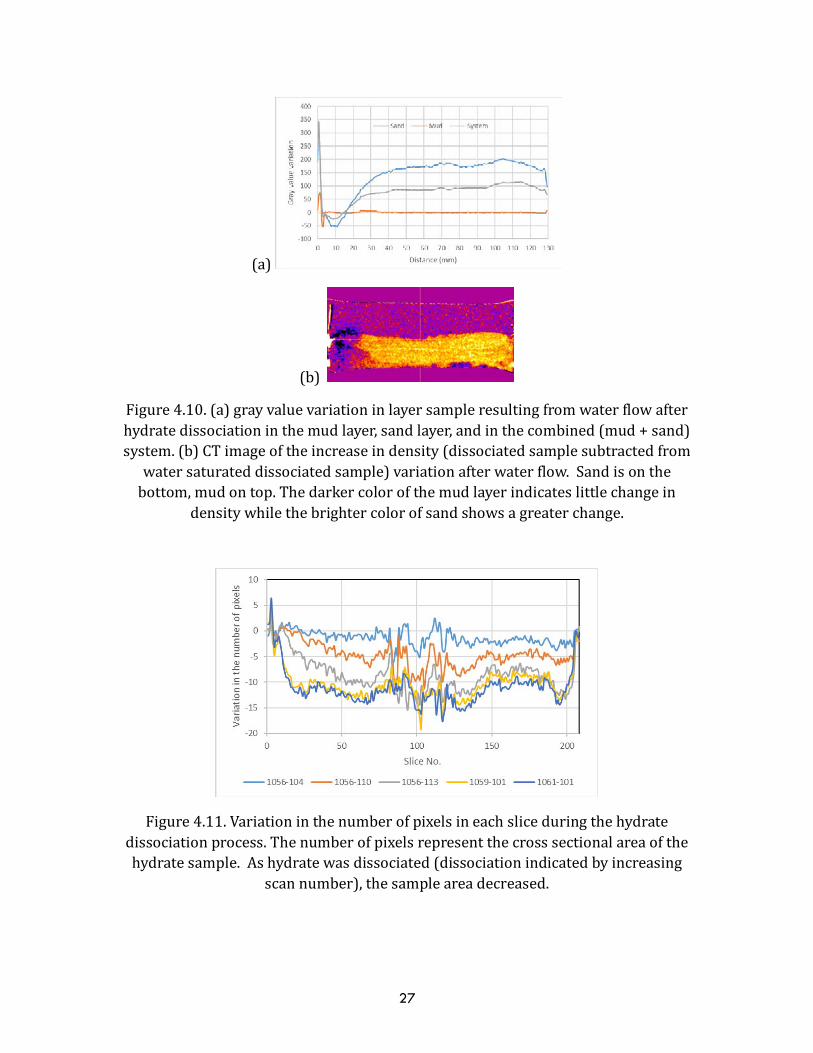
Afterdissociation,waterwasflowedthroughthesample(rateof1.0mL/min)andtheresultswereshowninFigure4.10.Thetopofthefigure,4.10(a)showsthedifferenceingreyvalueafterflow.Thewatermainlyflowedthroughthesandlayer.AsshowninFigure4.10(b),somesandparticlesmovedoutneartheoutlet(leftside,darkersectionintheCTimages).Figure4.11showsthevariationinthenumberofpixelsineachsliceduringhydratedissociationprocess.Asthescannumberincreases(asshowninthelegend)dissociationisproceeding.Pixelsrepresentcrosssectionalareaofthesample,thereforresultsindicatethatthesamplebecamesmallerinthisplanewithhydratedissociation.
Figure4.8.CTimagesduringhydratedissociation.
26
(a)
(b)
Figure4.9.Grayvaluevariationin(a)sandand(b)mudlayersalongwiththesampleduringhydratedissociationprocess.
27
(a)
(b)
Figure4.10.(a)grayvaluevariationinlayersampleresultingfromwaterflowafterhydratedissociationinthemudlayer,sandlayer,andinthecombined(mud+sand)system.(b)CTimageoftheincreaseindensity(dissociatedsamplesubtractedfromwatersaturateddissociatedsample)variationafterwaterflow.Sandisonthebottom,mudontop.Thedarkercolorofthemudlayerindicateslittlechangein
densitywhilethebrightercolorofsandshowsagreaterchange.
Figure4.11.Variationinthenumberofpixelsineachsliceduringthehydratedissociationprocess.Thenumberofpixelsrepresentthecrosssectionalareaofthehydratesample.Ashydratewasdissociated(dissociationindicatedbyincreasing
scannumber),thesampleareadecreased.
28
RapidDepressurization
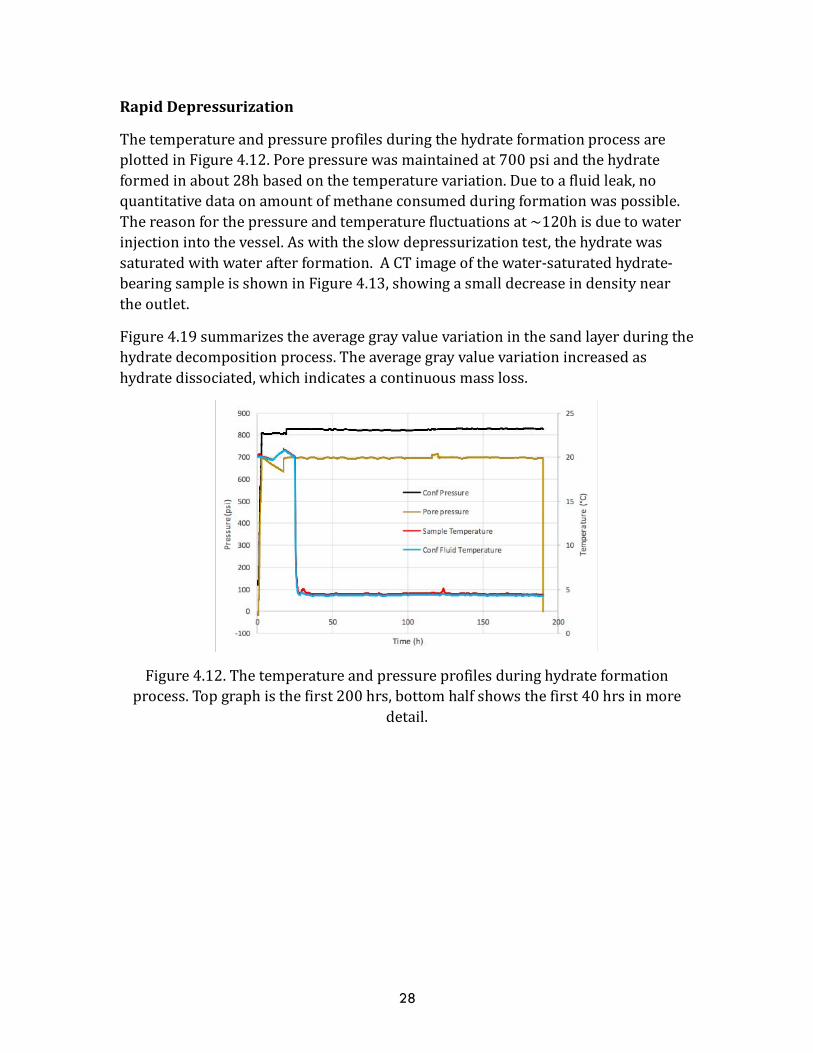
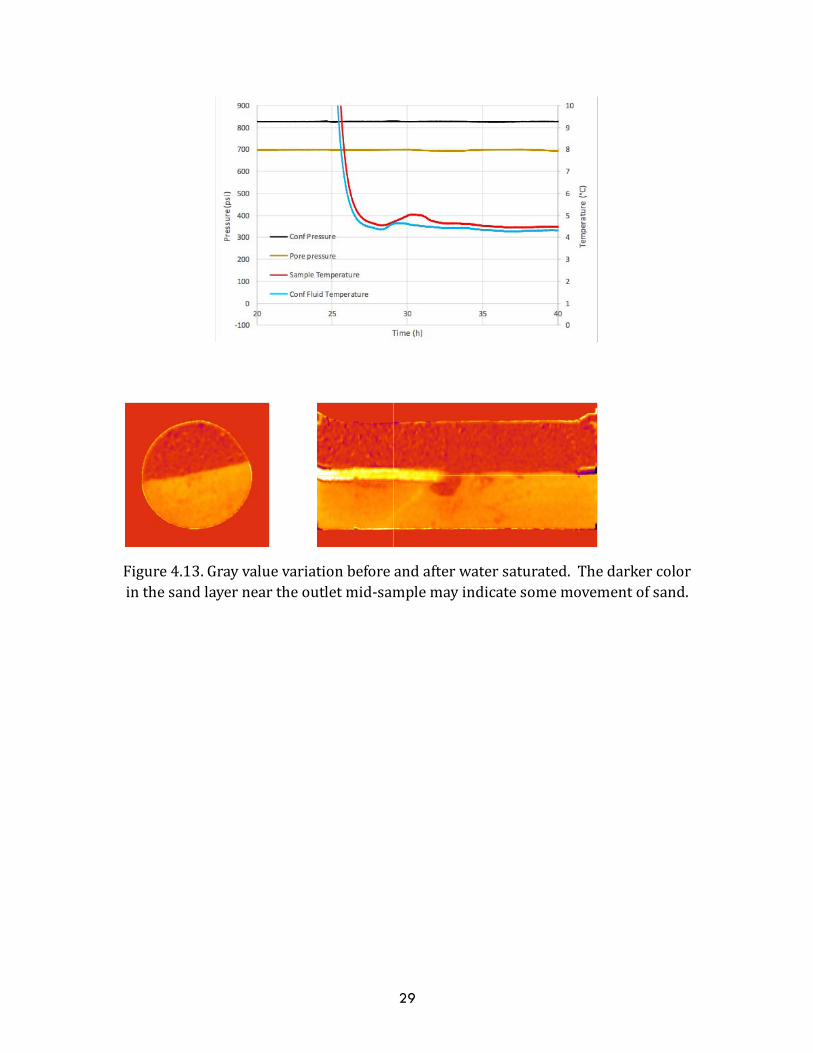
ThetemperatureandpressureprofilesduringthehydrateformationprocessareplottedinFigure4.12.Porepressurewasmaintainedat700psiandthehydrateformedinabout28hbasedonthetemperaturevariation.Duetoafluidleak,noquantitativedataonamountofmethaneconsumedduringformationwaspossible.Thereasonforthepressureandtemperaturefluctuationsat~120hisduetowaterinjectionintothevessel.Aswiththeslowdepressurizationtest,thehydratewassaturatedwithwaterafterformation.ACTimageofthewater-saturatedhydrate-bearingsampleisshowninFigure4.13,showingasmalldecreaseindensityneartheoutlet.
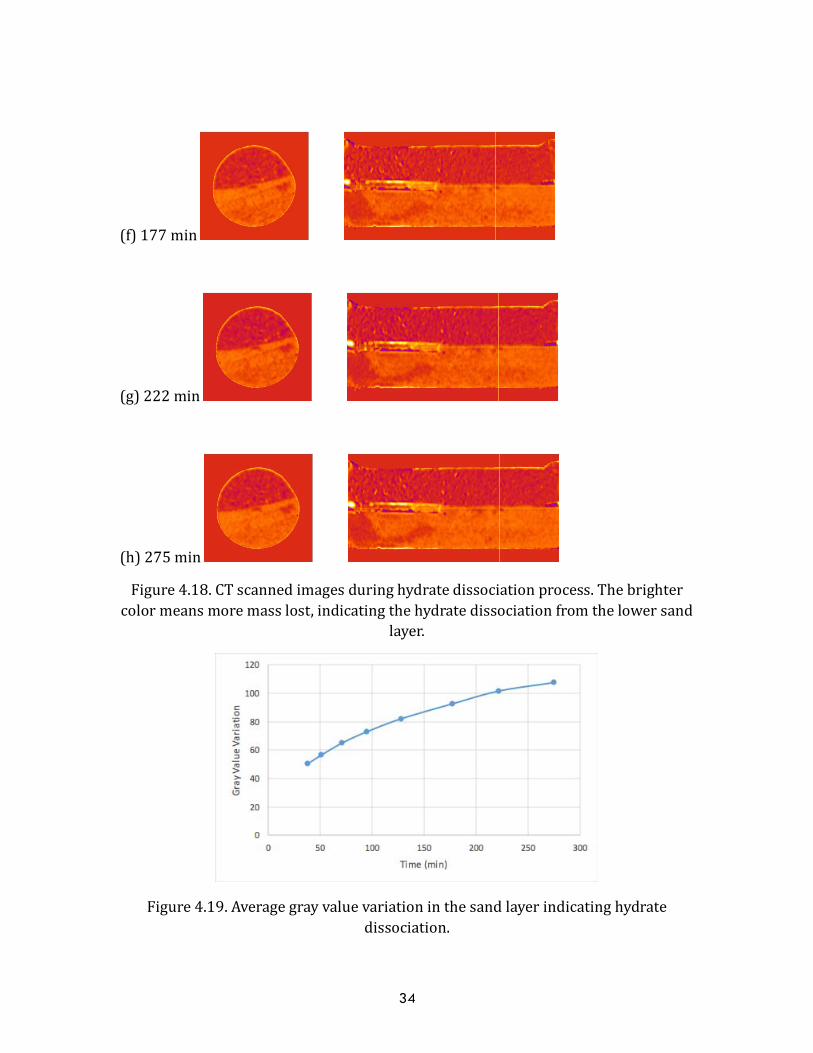
Figure4.19summarizestheaveragegrayvaluevariationinthesandlayerduringthehydratedecompositionprocess.Theaveragegrayvaluevariationincreasedashydratedissociated,whichindicatesacontinuousmassloss.
Figure4.12.Thetemperatureandpressureprofilesduringhydrateformationprocess.Topgraphisthefirst200hrs,bottomhalfshowsthefirst40hrsinmore
detail.
29
Figure4.13.Grayvaluevariationbeforeandafterwatersaturated.Thedarkercolorinthesandlayerneartheoutletmid-samplemayindicatesomemovementofsand.
30
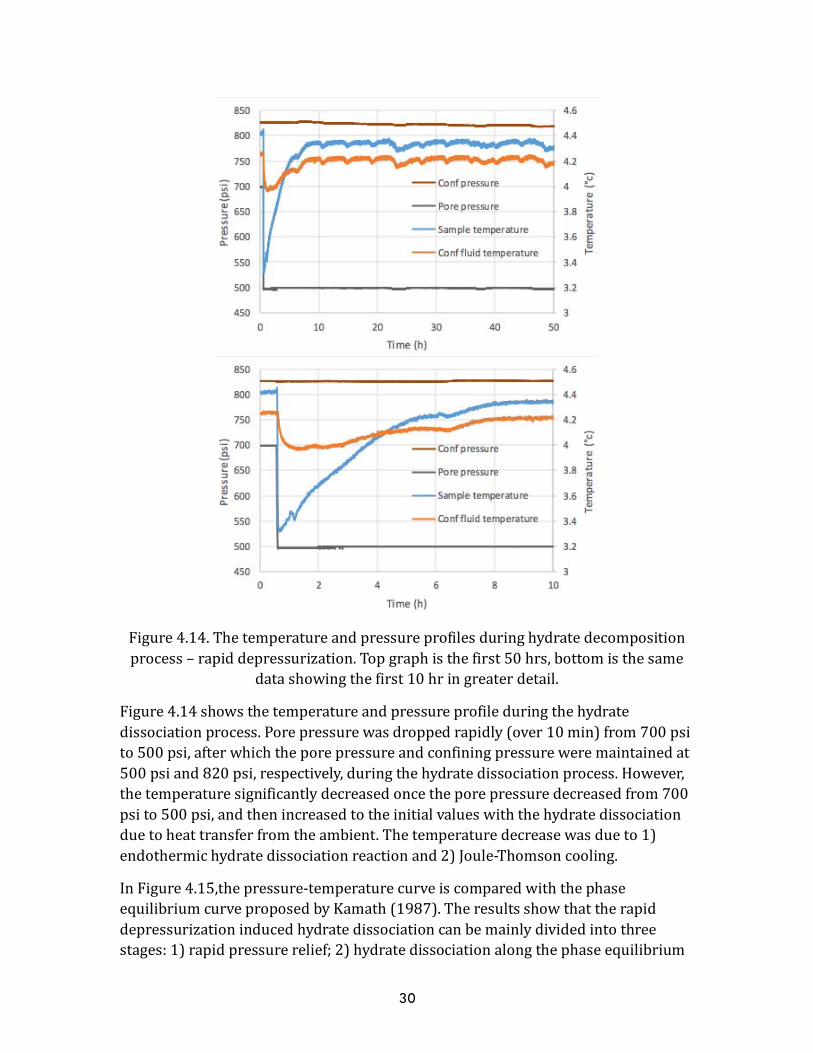
Figure4.14.Thetemperatureandpressureprofilesduringhydratedecompositionprocess–rapiddepressurization.Topgraphisthefirst50hrs,bottomisthesame
datashowingthefirst10hringreaterdetail.
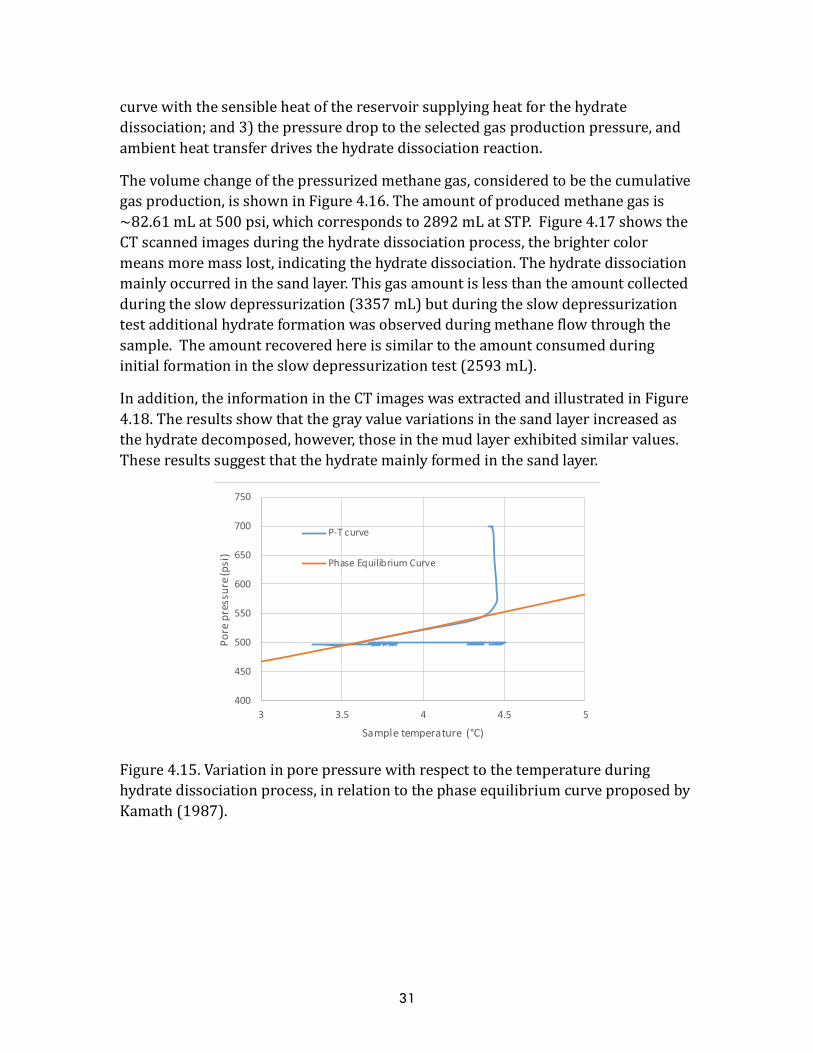
Figure4.14showsthetemperatureandpressureprofileduringthehydratedissociationprocess.Porepressurewasdroppedrapidly(over10min)from700psito500psi,afterwhichtheporepressureandconfiningpressureweremaintainedat500psiand820psi,respectively,duringthehydratedissociationprocess.However,thetemperaturesignificantlydecreasedoncetheporepressuredecreasedfrom700psito500psi,andthenincreasedtotheinitialvalueswiththehydratedissociationduetoheattransferfromtheambient.Thetemperaturedecreasewasdueto1)endothermichydratedissociationreactionand2)Joule-Thomsoncooling.
InFigure4.15,thepressure-temperaturecurveiscomparedwiththephaseequilibriumcurveproposedbyKamath(1987).Theresultsshowthattherapiddepressurizationinducedhydratedissociationcanbemainlydividedintothreestages:1)rapidpressurerelief;2)hydratedissociationalongthephaseequilibrium
31
curvewiththesensibleheatofthereservoirsupplyingheatforthehydratedissociation;and3)thepressuredroptotheselectedgasproductionpressure,andambientheattransferdrivesthehydratedissociationreaction.
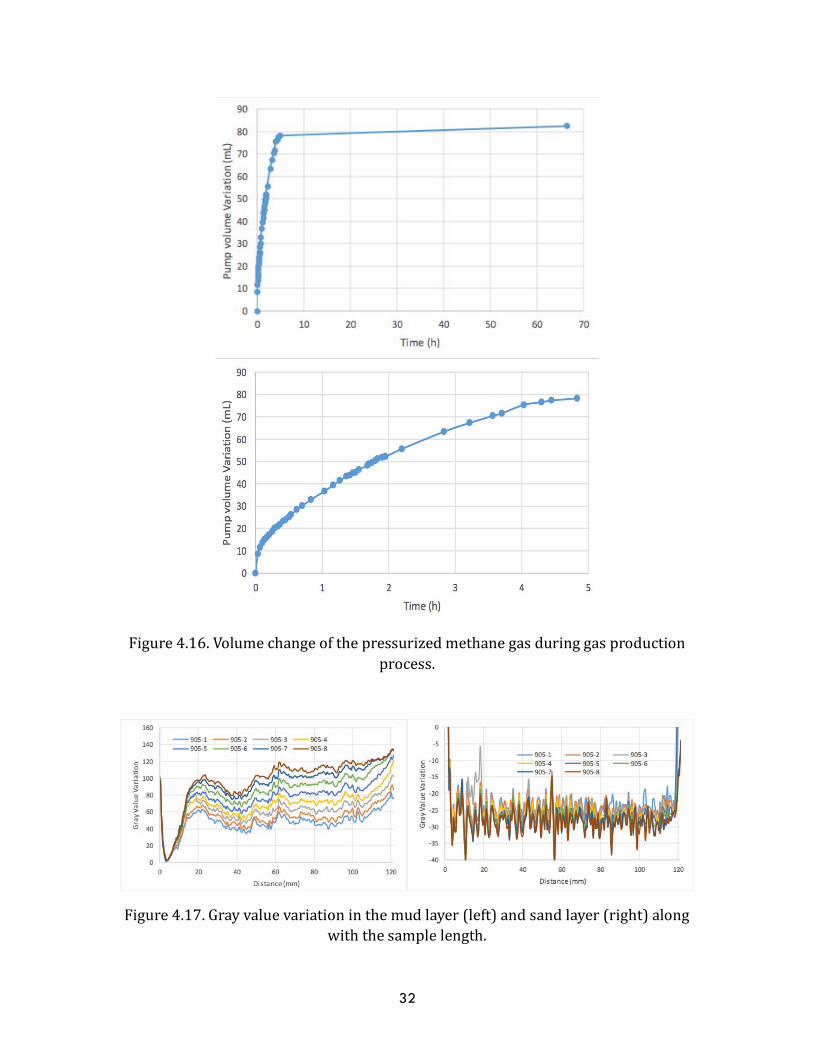
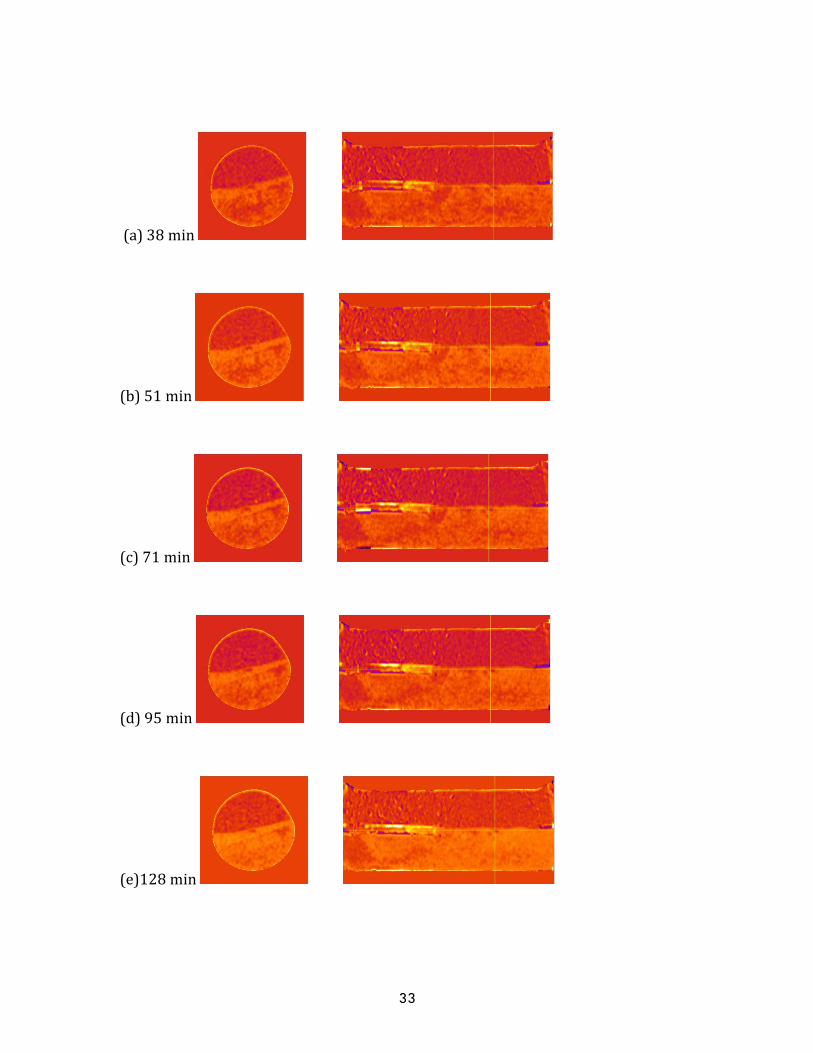
Thevolumechangeofthepressurizedmethanegas,consideredtobethecumulativegasproduction,isshowninFigure4.16.Theamountofproducedmethanegasis~82.61mLat500psi,whichcorrespondsto2892mLatSTP.Figure4.17showstheCTscannedimagesduringthehydratedissociationprocess,thebrightercolormeansmoremasslost,indicatingthehydratedissociation.Thehydratedissociationmainlyoccurredinthesandlayer.Thisgasamountislessthantheamountcollectedduringtheslowdepressurization(3357mL)butduringtheslowdepressurizationtestadditionalhydrateformationwasobservedduringmethaneflowthroughthesample.Theamountrecoveredhereissimilartotheamountconsumedduringinitialformationintheslowdepressurizationtest(2593mL).
Inaddition,theinformationintheCTimageswasextractedandillustratedinFigure4.18.Theresultsshowthatthegrayvaluevariationsinthesandlayerincreasedasthehydratedecomposed,however,thoseinthemudlayerexhibitedsimilarvalues.Theseresultssuggestthatthehydratemainlyformedinthesandlayer.
Figure4.15.Variationinporepressurewithrespecttothetemperatureduringhydratedissociationprocess,inrelationtothephaseequilibriumcurveproposedbyKamath(1987).
400
450
500
550
600
650
700
750
3 3.5 4 4.5 5
Pore
pre
ssur
e (ps
i)
Sample temperature (°C)
P-T curve
Phase Equilibrium Curve
32
Figure4.16.Volumechangeofthepressurizedmethanegasduringgasproductionprocess.
Figure4.17.Grayvaluevariationinthemudlayer(left)andsandlayer(right)alongwiththesamplelength.
33
(a)38min
(b)51min
(c)71min
(d)95min
(e)128min
34
(f)177min
(g)222min
(h)275min
Figure4.18.CTscannedimagesduringhydratedissociationprocess.Thebrightercolormeansmoremasslost,indicatingthehydratedissociationfromthelowersand
layer.
Figure4.19.Averagegrayvaluevariationinthesandlayerindicatinghydratedissociation.
35
Task5: Mechanicalandchemicalbehaviorofdiatomaceousmediumandfiltrationbehaviorofsand
SharonBorglin,BinWang,TimKneafsey
Introduction
Thistaskrequestedthatrealisticeffectivestresschangesbeappliedtosampleswithsandanddiatomaceousearth(DE)toinvestigatecompactionofDEandpossiblemovementoffines.Inaddition,claycompositioninthebasinwastobereviewedandlaboratorytestsusingrealsedimentstoinvestigatethedegreeofswellingweretobeperformed.Finally,usingrealorsimulatedmedia(sediments)themagnitudetheeffectoffinesproductionwasassessed.
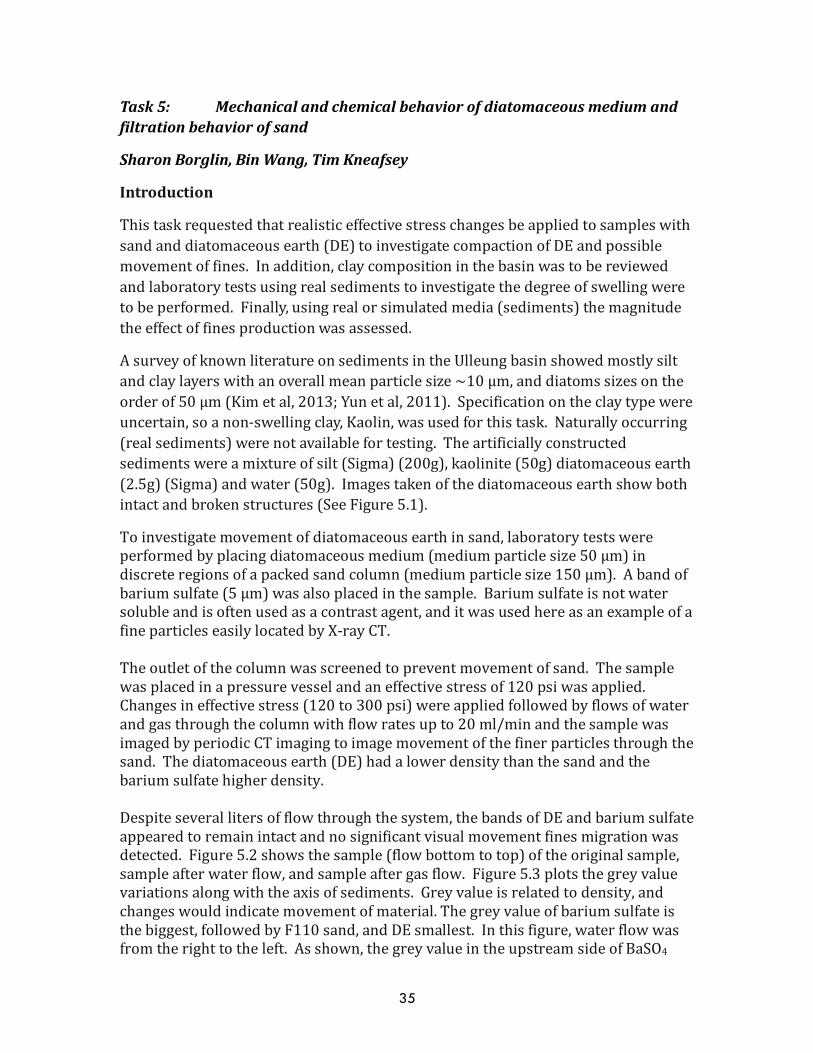
AsurveyofknownliteratureonsedimentsintheUlleungbasinshowedmostlysiltandclaylayerswithanoverallmeanparticlesize~10µm,anddiatomssizesontheorderof50µm(Kimetal,2013;Yunetal,2011).Specificationontheclaytypewereuncertain,soanon-swellingclay,Kaolin,wasusedforthistask.Naturallyoccurring(realsediments)werenotavailablefortesting.Theartificiallyconstructedsedimentswereamixtureofsilt(Sigma)(200g),kaolinite(50g)diatomaceousearth(2.5g)(Sigma)andwater(50g).Imagestakenofthediatomaceousearthshowbothintactandbrokenstructures(SeeFigure5.1).
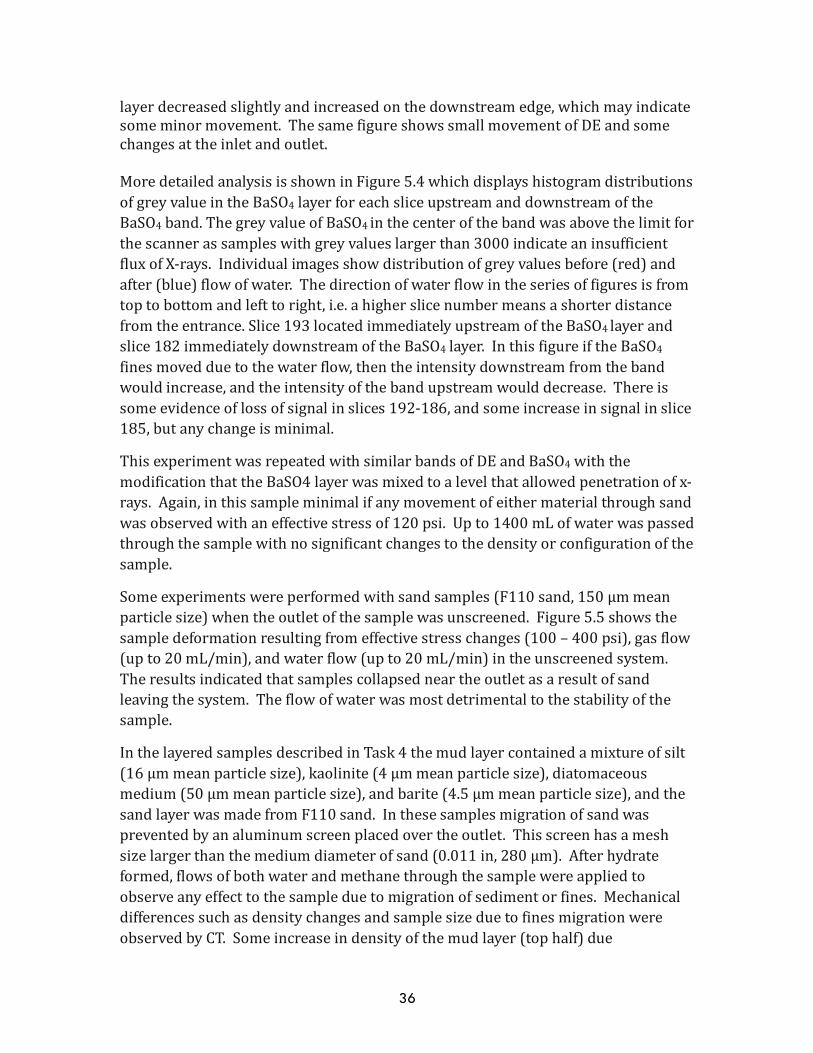
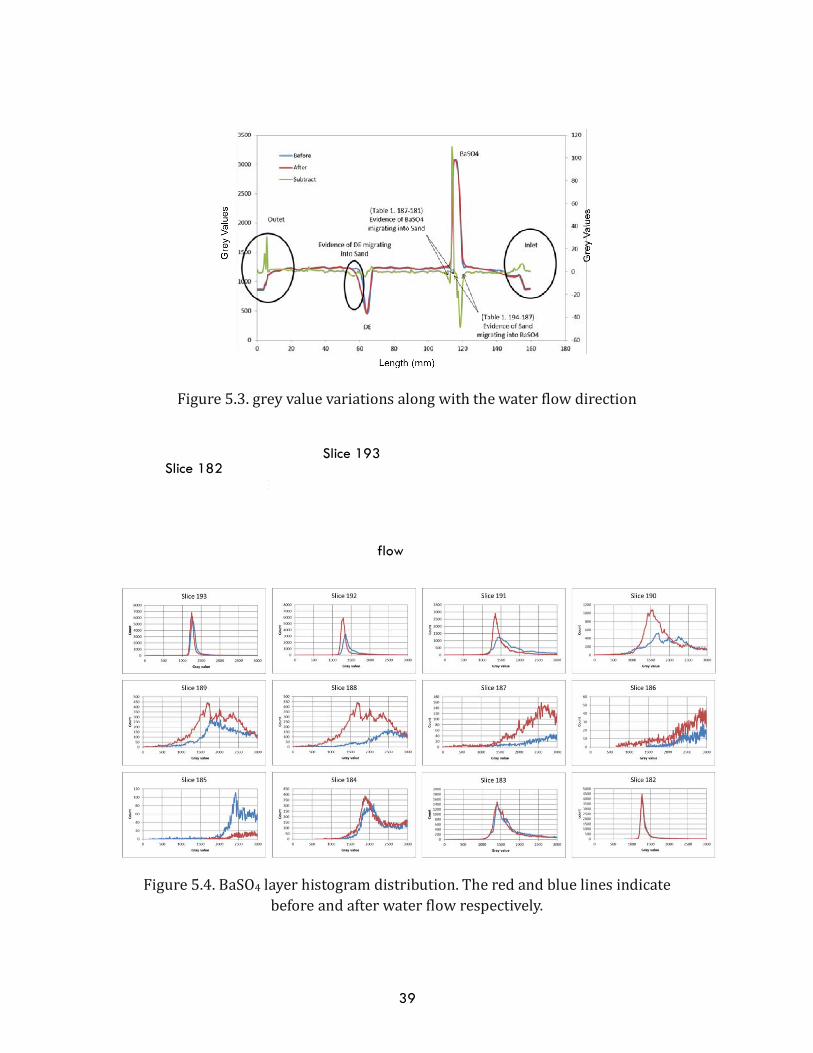
Toinvestigatemovementofdiatomaceousearthinsand,laboratorytestswereperformedbyplacingdiatomaceousmedium(mediumparticlesize50µm)indiscreteregionsofapackedsandcolumn(mediumparticlesize150µm).Abandofbariumsulfate(5µm)wasalsoplacedinthesample.Bariumsulfateisnotwatersolubleandisoftenusedasacontrastagent,anditwasusedhereasanexampleofafineparticleseasilylocatedbyX-rayCT.Theoutletofthecolumnwasscreenedtopreventmovementofsand.Thesamplewasplacedinapressurevesselandaneffectivestressof120psiwasapplied.Changesineffectivestress(120to300psi)wereappliedfollowedbyflowsofwaterandgasthroughthecolumnwithflowratesupto20ml/minandthesamplewasimagedbyperiodicCTimagingtoimagemovementofthefinerparticlesthroughthesand.Thediatomaceousearth(DE)hadalowerdensitythanthesandandthebariumsulfatehigherdensity.Despiteseverallitersofflowthroughthesystem,thebandsofDEandbariumsulfateappearedtoremainintactandnosignificantvisualmovementfinesmigrationwasdetected.Figure5.2showsthesample(flowbottomtotop)oftheoriginalsample,sampleafterwaterflow,andsampleaftergasflow.Figure5.3plotsthegreyvaluevariationsalongwiththeaxisofsediments.Greyvalueisrelatedtodensity,andchangeswouldindicatemovementofmaterial.Thegreyvalueofbariumsulfateisthebiggest,followedbyF110sand,andDEsmallest.Inthisfigure,waterflowwasfromtherighttotheleft.Asshown,thegreyvalueintheupstreamsideofBaSO4
36
layerdecreasedslightlyandincreasedonthedownstreamedge,whichmayindicatesomeminormovement.ThesamefigureshowssmallmovementofDEandsomechangesattheinletandoutlet.MoredetailedanalysisisshowninFigure5.4whichdisplayshistogramdistributionsofgreyvalueintheBaSO4layerforeachsliceupstreamanddownstreamoftheBaSO4band.ThegreyvalueofBaSO4inthecenterofthebandwasabovethelimitforthescannerassampleswithgreyvalueslargerthan3000indicateaninsufficientfluxofX-rays.Individualimagesshowdistributionofgreyvaluesbefore(red)andafter(blue)flowofwater.Thedirectionofwaterflowintheseriesoffiguresisfromtoptobottomandlefttoright,i.e.ahigherslicenumbermeansashorterdistancefromtheentrance.Slice193locatedimmediatelyupstreamoftheBaSO4layerandslice182immediatelydownstreamoftheBaSO4layer.InthisfigureiftheBaSO4finesmovedduetothewaterflow,thentheintensitydownstreamfromthebandwouldincrease,andtheintensityofthebandupstreamwoulddecrease.Thereissomeevidenceoflossofsignalinslices192-186,andsomeincreaseinsignalinslice185,butanychangeisminimal.
ThisexperimentwasrepeatedwithsimilarbandsofDEandBaSO4withthemodificationthattheBaSO4layerwasmixedtoalevelthatallowedpenetrationofx-rays.Again,inthissampleminimalifanymovementofeithermaterialthroughsandwasobservedwithaneffectivestressof120psi.Upto1400mLofwaterwaspassedthroughthesamplewithnosignificantchangestothedensityorconfigurationofthesample.
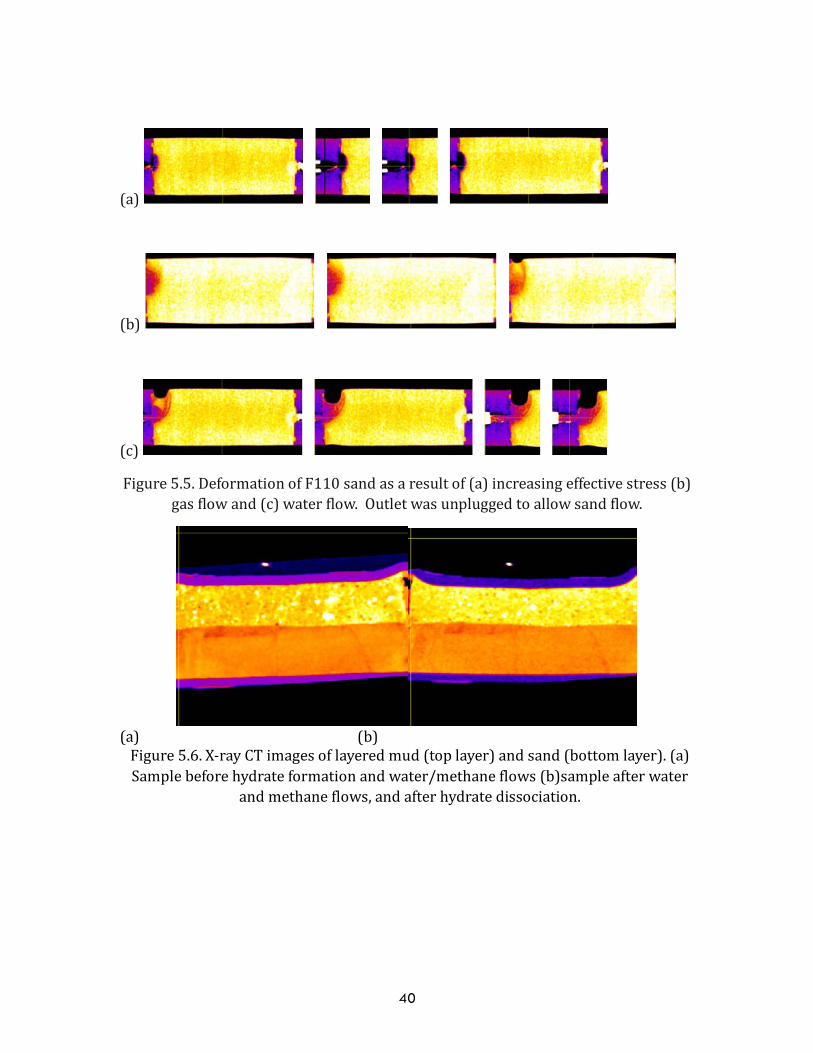
Someexperimentswereperformedwithsandsamples(F110sand,150µmmeanparticlesize)whentheoutletofthesamplewasunscreened.Figure5.5showsthesampledeformationresultingfromeffectivestresschanges(100–400psi),gasflow(upto20mL/min),andwaterflow(upto20mL/min)intheunscreenedsystem.Theresultsindicatedthatsamplescollapsedneartheoutletasaresultofsandleavingthesystem.Theflowofwaterwasmostdetrimentaltothestabilityofthesample.
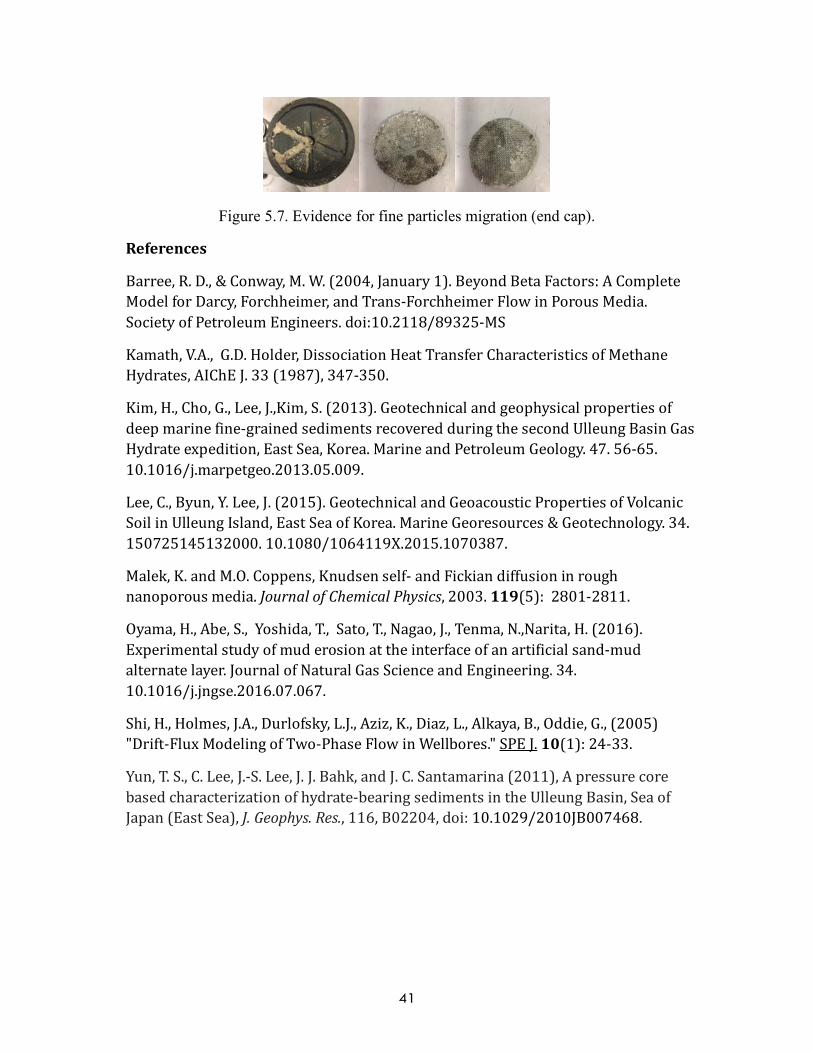
InthelayeredsamplesdescribedinTask4themudlayercontainedamixtureofsilt(16µmmeanparticlesize),kaolinite(4µmmeanparticlesize),diatomaceousmedium(50µmmeanparticlesize),andbarite(4.5µmmeanparticlesize),andthesandlayerwasmadefromF110sand.Inthesesamplesmigrationofsandwaspreventedbyanaluminumscreenplacedovertheoutlet.Thisscreenhasameshsizelargerthanthemediumdiameterofsand(0.011in,280µm).Afterhydrateformed,flowsofbothwaterandmethanethroughthesamplewereappliedtoobserveanyeffecttothesampleduetomigrationofsedimentorfines.MechanicaldifferencessuchasdensitychangesandsamplesizeduetofinesmigrationwereobservedbyCT.Someincreaseindensityofthemudlayer(tophalf)due
37
compactionofthesamplewasobserved,butthiswasdifficulttoquantifyduetothepresenceofthebarite(Figure5.6).
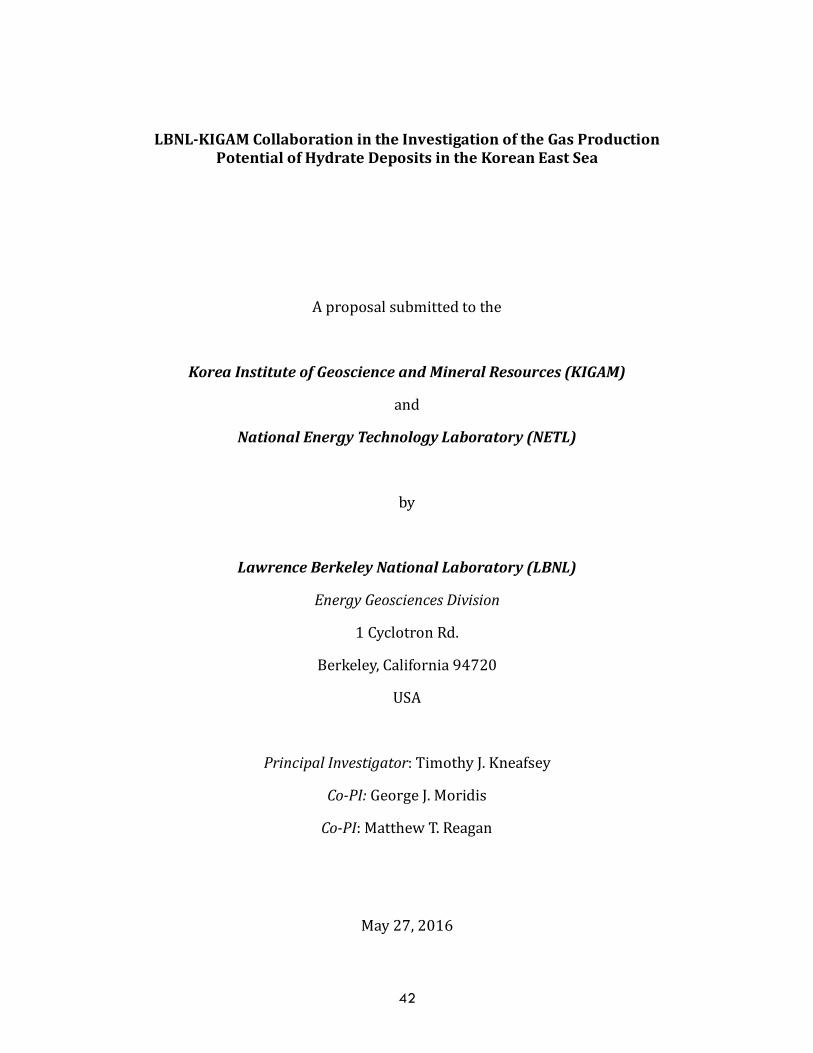
Tofurtherassessfineparticleorsandmovement,asandtrapwasplaceddownstreamfromtheoutletduringthehydratetestsinlayeredsystems.Visualinspectionsandturbiditymeasurementsweremadeoneffluentsamplescollectedinthistrap.Turbidityvalueswerebarelyabovethebackgroundwatermeasurements,andoverallthesedimentshowednoappreciableaccumulationofmaterial.Particlesizeanalysiswasdoneonsamplesfromthemudandsandlayersfrombeforeandafterhydrateformation(seeTable5.1)whichshowedminorchangesinoverallcomposition.However,intheCTscancrosssection,somemovementofsandthroughthescreenlocatedattheoutletcanbeseen,andphysicalinspectionoftheendcapshowsthatsomesanddidmigratethroughthescreen(Figure5.7).
Conclusion
Overall,despitewaterandgasflows,hydratedissociationandeffectivestresschanges,themovementofsandandfinematerialswasnotsignificantinourexperimentalsystemsiftheoutletofthesamplewasphysicallyconstrainedbyaplugorscreen.
Table 5.1. Particle size distribution of the samples before and after hydrate formation. Changes in particle size distribution show minor changes in the fines (less than 50 um) in both the sand and the mud layer.
Size range Pre sand Post sand Pre mud Post mud
Less than 2 um 0 0 6.84% 6.08%
Between 2 and 50 um
0.78% 0.03% 59.41% 53.73%
Between 50-100 um
17.12% 18.51% 15.7% 16.79%
Between 100-250 um
74.27% 74.18% 15.9% 17.61%
Between 250 and 500 um
7.84% 7.28% 2.16% 5.76%
38
Sand
DE
Sand
Barium Sulfate
Sands
Figure5.1.Microscopicimagesofdiatomaceousearth.
Saturatedsample. After2000mLofwater
flow,20mL/minAfter1000mLofairflow,20mL/min
Figure5.2.Crosssectionofsandsamplecontainingalayerofdiatomaceousearth(DE)andbariumsulfate.Flowwasfromthebottomtothetopofthesample.
39
Figure5.3.greyvaluevariationsalongwiththewaterflowdirection
Figure5.4.BaSO4layerhistogramdistribution.Theredandbluelinesindicatebeforeandafterwaterflowrespectively.
flow
Slice 193
w Slice 182
40
(a)
(b)
(c)
Figure5.5.DeformationofF110sandasaresultof(a)increasingeffectivestress(b)gasflowand(c)waterflow.Outletwasunpluggedtoallowsandflow.
(a)(b)Figure5.6.X-rayCTimagesoflayeredmud(toplayer)andsand(bottomlayer).(a)Samplebeforehydrateformationandwater/methaneflows(b)sampleafterwater
andmethaneflows,andafterhydratedissociation.
41
Figure 5.7. Evidence for fine particles migration (end cap).
References
Barree,R.D.,&Conway,M.W.(2004,January1).BeyondBetaFactors:ACompleteModelforDarcy,Forchheimer,andTrans-ForchheimerFlowinPorousMedia.SocietyofPetroleumEngineers.doi:10.2118/89325-MS
Kamath,V.A.,G.D.Holder,DissociationHeatTransferCharacteristicsofMethaneHydrates,AIChEJ.33(1987),347-350.
Kim,H.,Cho,G.,Lee,J.,Kim,S.(2013).Geotechnicalandgeophysicalpropertiesofdeepmarinefine-grainedsedimentsrecoveredduringthesecondUlleungBasinGasHydrateexpedition,EastSea,Korea.MarineandPetroleumGeology.47.56-65.10.1016/j.marpetgeo.2013.05.009.
Lee,C.,Byun,Y.Lee,J.(2015).GeotechnicalandGeoacousticPropertiesofVolcanicSoilinUlleungIsland,EastSeaofKorea.MarineGeoresources&Geotechnology.34.150725145132000.10.1080/1064119X.2015.1070387.
Malek,K.andM.O.Coppens,Knudsenself-andFickiandiffusioninroughnanoporousmedia.JournalofChemicalPhysics,2003.119(5):2801-2811.
Oyama,H.,Abe,S.,Yoshida,T.,Sato,T.,Nagao,J.,Tenma,N.,Narita,H.(2016).Experimentalstudyofmuderosionattheinterfaceofanartificialsand-mudalternatelayer.JournalofNaturalGasScienceandEngineering.34.10.1016/j.jngse.2016.07.067.
Shi,H.,Holmes,J.A.,Durlofsky,L.J.,Aziz,K.,Diaz,L.,Alkaya,B.,Oddie,G.,(2005)"Drift-FluxModelingofTwo-PhaseFlowinWellbores."SPEJ.10(1):24-33.
Yun,T.S.,C.Lee,J.-S.Lee,J.J.Bahk,andJ.C.Santamarina(2011),Apressurecorebasedcharacterizationofhydrate-bearingsedimentsintheUlleungBasin,SeaofJapan(EastSea),J.Geophys.Res.,116,B02204,doi:10.1029/2010JB007468.
42
LBNL-KIGAMCollaborationintheInvestigationoftheGasProductionPotentialofHydrateDepositsintheKoreanEastSea
Aproposalsubmittedtothe
KoreaInstituteofGeoscienceandMineralResources(KIGAM)
and
NationalEnergyTechnologyLaboratory(NETL)
by
LawrenceBerkeleyNationalLaboratory(LBNL)
EnergyGeosciencesDivision
1CyclotronRd.
Berkeley,California94720
USA
PrincipalInvestigator:TimothyJ.Kneafsey
Co-PI:GeorgeJ.Moridis
Co-PI:MatthewT.Reagan
May27,2016
43
PROJECTDESCRIPTION
I. IntroductionThis proposal discusses two groups of tasks having the goal of improvingunderstanding of the future production ofmethane from hydrate deposits in theUlleungBasin (UB).The firstgroupof tasksarenumerical, tobeperformedusingTOUGH+HYDRATE and other codes developed at Lawrence Berkeley NationalLaboratory. The second group of tasks are experimental, to be performed inlaboratoriesatLawrenceBerkeleyNationalLaboratory.AlltasksaretobeperformedincollaborationwithorwithinputsfromKIGAM.NumericalSimulationsLawrenceBerkeleyNationalLaboratory(LBNL)isaworldleaderinhydrateresearchand the developer of the TOUGH+HYDRATE code [Moridis et al., 2008] for thesimulation of fluid and heat flow and transport in hydrate-bearing sediments.TOUGH+HYDRATE(T+H)wasdesignedtomodelnon-isothermalCH4release,phasebehavior and flow under conditions typical of CH4-hydrate deposits (i.e., in thepermafrostandindeepoceansediments)bysolvingthecoupledequationsofmassandheatbalance,andisamongthemostadvancedhydratecodesintheworld.T+His currently involved in practically every hydrate-related research project in theworld. Because of its very large computational requirements of the T+H code, aparallelversion,pT+H,[Zhangetal.,2008]hasbeendevelopedandisusedbyseveralresearchorganizations.
TheT+HcodehasbeencoupledwiththeFLAC3Dgeomechanicalcode[RutqvistandMoridis,2009; Rutqvist et al.,2009;Kim et al., 2012a] to investigate coupled flow,thermalandgeomechanicalprocessesfortheanalysisofthemechanicalstabilityoftheHBSandofthewellboreassembliesinhydratedepositsunderproduction,andtodeterminetheenvelopeofgeomechanicallysafeoperations.Morerecently,T+HwascoupledwithROCMECH[Kimetal.,2012b],apowerfulgeomechanicscodedevelopedatLBNL,whichhastheaddedbenefitofparallelization(aproblemwithFLAC3D).
A multi-year collaboration between KIGAM and LBNL has resulted in extensiveresearch into the potential for production from gas hydrates for several UBreservoirs.Tocontinuethiscollaborativework,theobjectivesofthisproposedstudyare:(a) LeveragerecentLBNLworkinthesimulationofshalegas/shaleoilsystemsto
addnon-Darcy flow, inertial effects, turbulent, andotherphysicsof flow invery high-k and low-k porous media to T+H/pT+H. This will allow more
44
realisticmodelingofthenear-wellborezoneinthethinlybeddedmud/sandsystemsfoundinUBgashydratesystems.
(b) To improve the reliability of the prediction of production behavior andwellborestabilityinUBgashydratesystems.Forthis,wewillincorporatethemostcompletegeomechanicalmodelingcapabilitiesintothecoupledpT+H-ROCMECH simulator, implement a detailed, realistic representation of thewellboreitself,andfurtherinvestigatetheeffectofhydratedissociationonthereservoirandthestabilityofthewellassembly.
(c) Via(a)-(c),createcapabilitiestobeusedinfuturecollaborativeworkbetweenKIGAMand LBNL—in the planning ofupcomingUB expeditions and in thedesignoffuturefieldtests.
(d) ToparticipateinapossibleDOE-ledcodecomparisonstudyforgeomechanicalsimulatorsandcoupledflow-geomechanical(T-H-M)codes.
TheresultsofthisworkinformsKIGAM’sProductionTechnologyStudy,whichwilldesign optimal production schemes and evaluate the safety and stability ofboreholes/wellsandthestabilityofthereservoirduringproduction.Assuchitcanhelpdeterminelocationsbestsuitedtotheupcoming3rdUBGHDrillingExpeditionandthefutureproductionfieldtest.
ExperimentalStudies
SedimentscontainingmethanehydrateintheUBhavebeendescribedtobehighplasticityclayeysiltswithaclayfractionlessthan10-20%andasandfractionlessthan10%andhavingpermeabilitiesontheorderof10-3to10-1mD,[Kwon,Leeetal.2011],organicclayofmediumtohighplasticityordiatomaceoussiltyclay[Yun,Leeetal.2011],andhigh-plasticitysiltswithspecificsurfaceSa~21to31m2/gconsistingofmicrofossilswithsomeillite,kaolinite,andchlorite.Diatomsdetermineparticlesizedistributionandcausebothadualporositymicrostructure,andhighinitialvoidratio[Leeetal.2011].Otherdescriptionsincludemethanehydratecontainedin~meter-scalethicksandlayersbetweenlayersofsedimentsasdescribedabove.
Forgasproductionfromhydrate,issuesassociatedwiththesestratigraphiesincludepermeablemudslimitingtheeffectivenessoftheseal,finesmigrationwithfluidsremoval,reductioninsedimentstrengthwithhydratedissociationandgasmigration,andthepossiblelackofgas-flowpathways.Strategiestoextractandcollectgasfromnoduleandvein-fillinghydrateconfigurationsareunderconsiderationandaddressedinthenumericalsimulations,butnoidealstrategyhasbeendeveloped.Approachingthelower-hangingfruitofproducinggasfromhydrate-bearingsandbetweenclayandsand-containingplasticsiltsisconsideredhere.
45
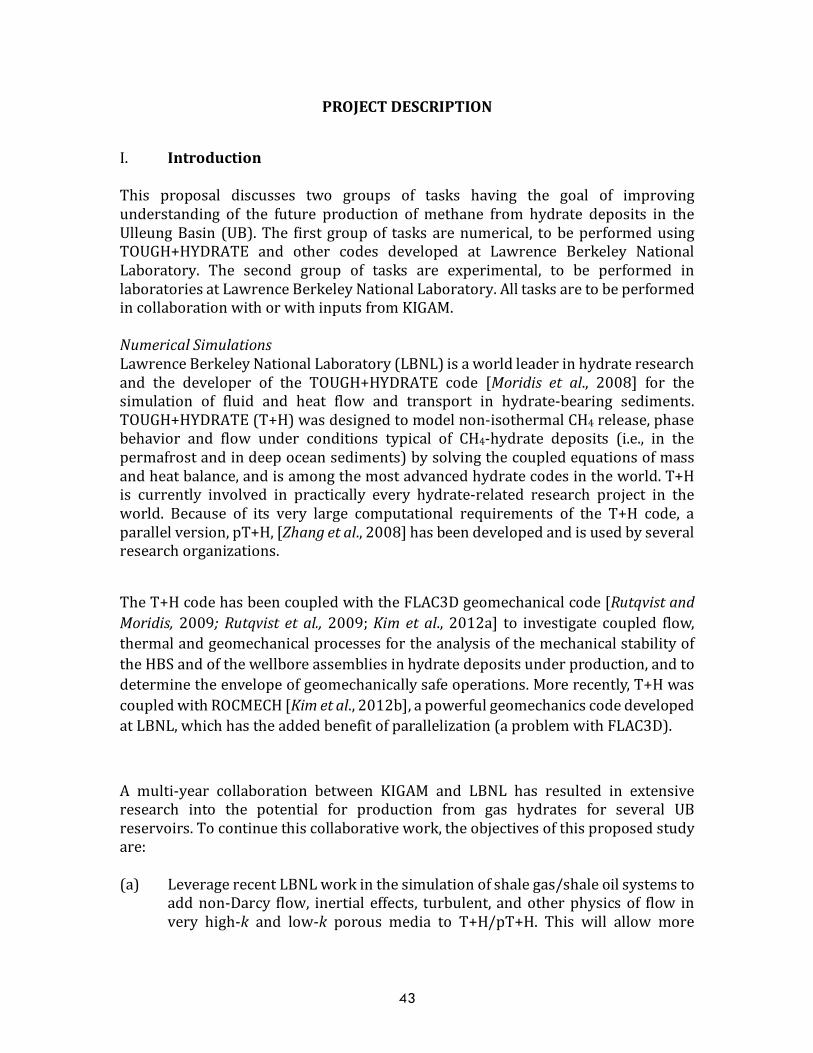
Hydrateproductionusingdepressurizationisconsideredherebecauseitismorelikelytohaveagreaterreachfromawellthaninhibitororthermaltechniques.Twoconfigurationsareconsidered–verticalwellsandmulti-stagehorizontalwells(Figure1).Intheverticalwellgeometry,awellisdrilledintoandfinishedinthehydrate-bearinglayer.Fluidextraction(orintroduction)isthroughthewell,andasimpleconceptualmodelofflowisradial.Fluidflowtoorfromthewellwillhavethegreatesteffectintheimmediatevicinityofthewell,thusanydamagetherefrommechanicalfailureofthemediumorwellwillaffectfutureproduction.Inthemulti-stagehorizontalwell,ahorizontalwellwouldbedrilledandfinishedwithalumberofstagesinthehydrate-bearingzone,probablytowardsthetoptotakeadvantageofgasbuoyancy.Fluidproductionthroughthefirststage(atthefarend)wouldbeperformedinitially.Ifmechanicalfailureofthewellorsedimentinthatvicinityoccurred,thatstagewouldbeshutoffandproductionfromthesecondstageimplemented.Thiswouldcontinueuntilproductionreachedstage“n”atwhichtimeanotherhorizontalmulti-stagelateralwouldbecompletedinanotherdirectionandtheprocessrepeated.Ifthehydrate-bearinglayeristhin,thismethodarrangesthewelltobeclosertoalargerquantityofthehydrateresource,andallowsformechanicalfailurewithouttotalsystemfailure.Analternativemethodforproducinggasfromalternatingmud-sandsedimentlayerswithaverticalwellistoproducegasatmultiplestagesfromdeeperlevelsoftheverticalwell.Similarlytothehorizontalwellcase,thesectionofthewellisabandonedasthereservoirisdepletedandthesedimentssubside.Toavoidshearingofthecasing,productionschedulesfrommultiplewellsneedtobecoordinatedcarefully,withmonitoringofthereservoircompactionandseafloorsubsidence.Thistypeofreservoirmanagementhasbeenproposedandimplementedinoilfieldswithshalelayerswhichcauseswellshearfailureduetoslipatsedimentaryboundariesinducedbysubsidence.Systemoptimizationwouldberequiredincludingunderstandingofthegeometries,mechanicalandhydrologicalcharacteristicsofthedeposit,andeconomicsofoperation.
46
Figure1.(Left)multi-stageverticalwellgeometry,(Right)multi-stagehorizontal
wellgeometry,(Bottom)Multi-stagewelleliminatingendstage.
Regardlessofthewellgeometry,anumberofissuesneedtobeaddressed:mechanicalandhydrologicalbehaviorofthereservoirmaterialsunderproducingconditions.
II. ProjectTasksTheproposedprojectisacontinuationofongoingLBNL-KIGAMcollaborativestudiesonthesubjectofgasproductionfromhydrates.Intheensuingdiscussion,referencesto“effort”aretoindicatethetimeneededbyLBNLscientiststoaccomplishthetasksdescribedlaterinthissection.NumericalsimulationstudiesaredescribedinTasks1-3, and Laboratory studies are described in Tasks 4 and 5. Regarding some of thegeomechanicalnumericalsimulationworkinTask2,LBNLwillcoordinatewiththeresearchteamofDr.KimatTexasA&MUniversityforbettercouplingalgorithmfornumerical stability and accuracy, and LBNL will also share and discuss thegeomechanicalsimulationresultswithDr.Kim,asrequired.NumericalSimulationTasksTask1: Enhanced flow simulation capabilities for the simulation of complex
mud/silt/sandhydrate-bearingsystemsSubtask1.1:Non-DarcycapabilitiesforT+HcodesDuration: 6months,i.e.,from10/1/2016to3/31/2017Budget:$25K(LBNLportion-fundedbyUSDOE)
47
Previousstudieshavedemonstratedthetechnicalfeasibilityofgasproductionfromhydrate deposits in general, and the feasibility of production from the reservoirsidentifiedintheUBGH1andUBGH2drillingexpeditions.Thesystemsmodeledtodateinvolved sandy production zones layered betweenmud/silt barriers, and have berepresentedbytraditionalDarcy’sLawtreatmentofflowinporousmedia.Currentwork at KIGAM involves review of UBGH1 and UBGH2 data (sedimentology andgeochemical analysis, geophysical inversion and seismicmodeling) and geologicalmodeldevelopmenttobetterunderstandandcharacterizethesereservoirs.Tomodelsuchdepositsmay requiremoreadvancedsimulation capabilities that include thecomplex behavior of low effective permeability fracturedmud/clay systems, low-permeability/high-saturation hydrate inclusions, and transport through high-permeability pathways.We propose to expand the capabilities of the T+H/pT+Hcodesthroughtheadditionalofseveralnon-Darcyfloweffects:(1) Implementation of non-Darcy flow effects for high-permeability media
(fracturedhydrates,verticalpathwaysinfracturedmuds/silts),including:(a) The Drift-Flux model [Shi et al., 2005; Livescu et al., 2010] to allow the
simulationoffluidflowandaccuratephasesegregationinhigh-permeabilitypathways,i.e.,wellboreflowandflowinpathwayscreatedbydissociationofhydrates.
(b) Forchheimer flow; for the representation of high-velocity turbulent flowthroughhigh-kmedia,particularlyinhydrate-freeregionsnearthewellbore.
(2) Implementation of non-Darcy flow effects for very low-k media (muds, highhydratesaturation,otherlow-effectivepermeability),including:(a) Knudsendiffusion;forsystemswherethegasmean-freepathiscomparable
totheporediameter.(b) Klinkenberg effects; to correctly represent gas flow in low-
permeability/tightmedia.Theinclusionofsuchinertialeffectsisdeemedimportantbecausetheeffectivepermeabilitiesofhydrate-bearingmedia(HBM)areoftenatalevelcomparabletothatofultra-tightmedia(suchasshalegasreservoirs),andbecausetheyareapossibleexplanationofthehigherthanexpectedpermeabilitiesobservedinHBMunderproduction.
Notethat,althoughthedurationofthisprojectisshortandthebudgetislimited,thenewsimulationcapabilitieswillleveragerecentNETL-fundedworkoncoupledT-H-Msimulationofshalegasandshaleoilsystems.Thecapabilitiesneededtorepresentmud/clay systems are similar to those currently implemented in theTOUGH+RealGasBrine and TOUGH+MultiComponentMultiphase simulators, andthesefeatureswillbeadaptedtoT+H/pT+H.Subtask1.2:Simulationofcomplexmud/silt/sanddepositsDuration: 6months,i.e.,from12/1/2016to6/30/2017Budget:$25K(LBNLportion-fundedbyUSDOE)
48
UsingthecapabilitiesdevelopedinSubtask1.1andgeologicalmodelsdevelopedincollaborationwithKIGAM, this subtaskwill evaluate via numerical simulation theproduction behavior the mud/silt/sand discovered in the previous UBGH1 & 2expeditions. Given the limited budget and duration, a limited set of “schematic”systemswillbeexaminedtodeterminetheeffectoftheadditionalmodeledprocesseslistedinSubtask1.1,andtodeterminethepotentialproductivityofsuchsystems.Iftheseresultsprovetobepromising,futurecollaborativeworkmaybeproposedtofurtherevaluatetheimportanceoftheseeffects.This taskwill also leverage the resultsof the laboratorywork proposed by otherKIGAMcollaborators(Kneafsey,Seol)andincorporateanynewinformationgainedabout effective permeability and flow through sand/mud/silt systems. Suchlaboratory data, if suitable, will be incorporated as options (describing newrelationshipsbetweenkeffandSHformud/siltsystems)intotheT+Hcodeandwillbeusedtovalidateavailableflowmodelsandre-analyzetheresultsofearliertests.Task2: Enhancedgeomechanicalcapabilitiesforthepredictivesimulationof
potentialUBGHfieldtestsitesDuration: 6months,i.e.,from5/16/2017to11/31/2017Budget:$80K(fundedbyKIGAM)Recent collaborative studies between KIGAM and LBNL have demonstrated theimportanceofconsideringgeomechanicsduringproductionfromgashydrates,andhowgeomechanicalstabilitylimitationsmay inhibitproduction fromanotherwisepromisinghydratedeposit.Themost recentUBGH2simulations,performed in3Dwithcoupledgeomechanics(usingT+H-ROCMECH) indicatethatsubsidenceof theoverburdenandpotentialupliftoftheunderburdenmayjeopardizewellborestabilityforsystemswithcertaingeomechanicalproperties.DiscussionswithKIGAMindicatethatwellborestability isofparticularconcern infield-testdesign.Inthistask,weproposedtoimplementarealisticrepresentationofthewellboretobetterunderstandthehazardscreatedduringproduction fromUBreservoirs.ThesimulationsinthistaskaretobeconductedusingT+HcoupledtotheROCMECHcode(Kimetal.,2012).Inaddition,thistaskwillleverageotherresearchbeing conducted at LBNL and we will consider the use of new, more advancedgeomechanicalsimulatorsthatarecurrentlyunderdevelopmentifsuchmethodsaredeemedmoresuitabletosolvingthisproblem.Withthefull-wellboretreatmentinplacefortheUBGH2-6case,wewillassesswellstability and the possibility of cement failure during production for variousproductionscenariosusing3Dparallelcoupledflow-geomechanicalsimulation.Wewillalsore-evaluatethegeomechanicalstabilityoftheformationandtheproductivityofthereservoirbyconsideringplasticityandlarge-deformationgeomechanics.ThisworkwillalsoincludeanefforttovalidatecoupledTOUGH+ROCMECHvs.thepre-existingexperimentaldata.
49
Becauseoftheverydemandingcomputationalrequirementsofthiswork,itwillnotbe possible to analyze the geomechanical behavior ofmore than one deposit. Toleverage previous work, we propose to limit the simulations to the UBGH2-6reference case developed during the previous round of LBNL-KIGAM collaboratorstudies.Task3: Project Management, Communication, Reporting and Technology
TransferDuration: 20months,i.e.,from10/1/2016to5/30/2018Budget:$5K(LBNLportion–fundedbyUSDOE)As in any collaborative project, significant communications and interactions arenecessary between LBNL and KIGAM. These include telephone discussions,telephone- and video-conferencing, e-mail communications, in addition to reviewmeetings(attheLBNLcampusand,possibly,attheKIGAMheadquartersinKorea)forjointstudiesandforprojectprogressreview.Reportingrequirementsinclude(a)theLBNLsubmissionofquarterlyprogressreportstotheKIGAMteambye-mailand(b)afinalprojectreportby6/1/2017,inadditionto(c)notificationswhensignificantmilestonesarereached.Technologytransferincludesthepublicationofpapersandscientific presentations at professional meetings. Technology transfer may alsoincludetrainingofKIGAMscientistsintheuseoftheenhancedLBNLT-H-Mcodes(possiblyconductedatLBNLfacilitiesinBerkeley,afteracommensurateincreaseintheprojectbudget).LaboratoryStudyTasksTask4: Gasproductionfromasandlayerinasand/mudlayeredsystem
Duration: 12months,i.e.,from5/16/2017to4/13/2018Budget:$70K(LBNLportion–fundedbyKIGAM)
Theessentialquestionis:Cangasbeeffectivelyproducedfromthelayeredsand/mudsystem?
Proposedstudy:
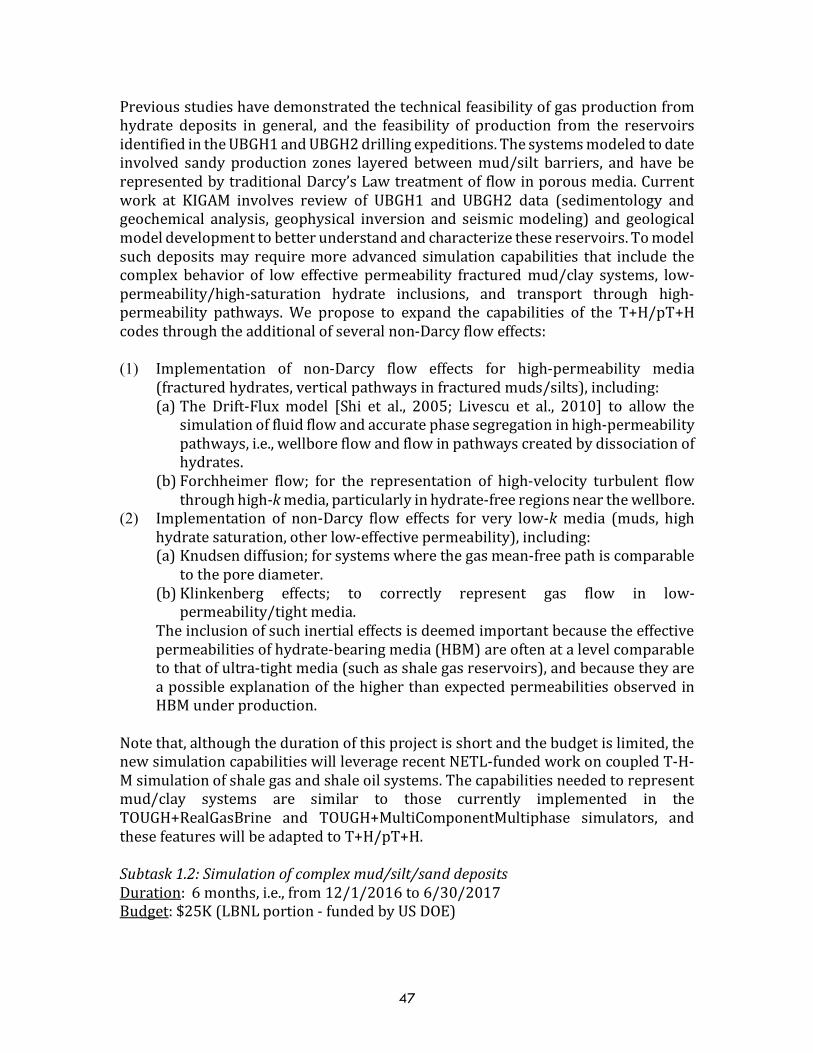
Alayeredsand/mudsystemwillbeconstructedinalaboratorypressurevesselusingreal(fromKorea)orsimulatedmedia.Itisenvisionedthata2-layersystembeinitiallyinvestigatedbecausethatcontainstheessenceoftheproblem.Oneofthelayerswillbecomposedofsiltsanddiatoms,theotherofsandalsocontainingsomesiltsanddiatoms(Figure2).Methanehydratewillbeformedinthesample(primarilyinthesandusingtheexcessgasmethod),andthesamplewillthenbe
50
saturatedwithwater.Uponwatersaturation,thesamplewillbeflowedinitiallyunderconditionswheregashydrateisstable,examininganyfinesmigrationusingX-rayCTandpossiblyanopticalmethodintheflowingfluid.Aftereitherequilibrationorasufficienttime,thesystemwillbe1.slowly,or2.rapidlydepressurizedtomimica1.smalleror2.largerchangeineffectivestressrepresentingdistancefromthewell.Theexcessstresswillbecarefullycontrolledandthefluids,solids,andgasproductionwillbeobservedusingavarietyoftechniques.
Figure2.Gasproductiontestschematic.
Followingeachtest,bothsandandmudfractionswillbecarefullysampledforfurtheranalysisbyKIGAMworkingwiththeUSGStoevaluatethetransportoffinesinbothmedia.
Task5: Mechanicalandchemicalbehaviorofdiatomaceousmediumandfiltrationbehaviorofsand
Duration: 12months,i.e.,from10/1/2016to8/30/2017Budget:$70K(LBNLportion–fundedbyUSDOE)
Mechanicalbehavior:Theliteraturecitedhereindicatesthatthediatomaceousnatureofthemediummustbeconsidered,asthediatomsarelikelytobreakunderreasonablestress[Kwonetal.2011,Leeetal.2011,Yunetal.2011]causingcompaction,andproductionofsmallerfinesthatmaybetransported.
Chemicalbehavior:TheeffectoffresheningwasbroughtupbyKwonetal.[2011].Althoughitwasnotpossibletodifferentiatetheeffectofmediumalterationbygasgenerationandfreshening,thiswasusedtopartiallyexplainhighercompressionindicesuponhydratedissociation.
Filtration:Apumpedwellwilldrawfluidthroughthesand,andthatfluidmaycarryfines.Productionofgasinthehydratemaystirupthemedium(typicallysand)
51
whichisunderloweffectivestress,orgasbubblesmaymechanicallyscrubparticlesfromsandgrains,allowingthemtobetransported.
Proposedstudy:
a. UsingnumericalsimulationofrealisticUBconditionseitherfromtheliteratureorfromKIGAM,asetofrealisticeffectivestresschangesrelatedtoproductionwillbedetermined.Thesewillbecomparedtotheliteraturefordiatomaceousporousmediumbehaviortoestimatetheextentofthisissue.Notethatforeitherwellgeometry,conditionsnearthewellarecritical.Forahorizontalwellinsand,thechangeineffectivestressonthediatomaceousmediumwillbemitigatedbythepresenceofthesandlayer.Laboratorytestswillbeperformedtoexaminecompactionofreal(suppliedbyKorea)orsimulateddiatomaceousporousmedia,andtheproductionandtransportofcreatedfines.Asdiatomaceousearthisafiltermaterial,transportmaynotbeanissue,howeverthistransportduringconsolidationparticularlywherepossiblediatombreakagecouldoccurhasnotbeeninvestigated.
b. Thecompositionofclaysintheanalysesrevieweddoesnotindicateastrongswellingfraction.Theinitialpartofthestudywillinvolvereviewingclaycompositionfromliteratureandreportsanddeterminingthemagnitudeofpotentialswelling.Laboratorytestsusingrealpreservedsedimentsaredesiredtoexaminethemagnitudeoftheswellingeffect.Inthesetests,themediumwillbeappropriatelycompactedintoinanoedometric(~zero-lateralstrain)cell,andsaturatedwithwaterhavingadesiredsalinity(e.g.seawater).Thesamplewillbeloadedcompressively,andthenfreshwatersuppliedwhilemonitoringswelling.
c. UsingrealisticconditionsfromnumericalmodelingorsuppliedfromKIGAM,thepotentialforfinesmigrationwillbeconsidered.Usingreal(suppliedbyKorea)orsimulatedmedia,themagnitudeofthisproblemandhowitcouldaffectgasproductionfromhydratewillbeinvestigatedusingsimplifiedsetups.
V. DeliverablesThedeliverablesofthisprojectinclude:
(1) AminimumofonepaperonthetopicofT-H-MmodelingofproductionandwellborestabilityinUBgashydratereservoirs,submittedforpublicationinapeer-reviewedjournal.
(2) Samplesfromtestsperformedforanalysis(e.g.Task4)byKIGAM.
(3) AreportonthenumericalsimulationstoKIGAMby10/31/2017.(4) Shortmid-termprogressreporttoKIGAMby10/31/17.(5) Finalreportincludingall5tasksbyMay30,2018.
52
VI. ProjectLocation,DurationandBudgetTheprojectwilllastfromOctober1,2016toMay30,2018.MostoftheworkwillbeconductedattheLBNLcampusinBerkeley,California.Thetotalrequestedbudgetfortheprojectis$275K.Ofthe$275K,$150KwillbeprovidedbyKIGAM;theremaining$125KwillbeprovidedbytheU.S.DepartmentofEnergy(DOE)astheircontributiontotheU.S.-Koreacollaborativestudiesongasproductionfromhydrates.TheKIGAM-fundedportionincludes$30KfundingwithinTask2forDr.KimatTexasA&MUniversity.Theeffortrequirementsdescribedinthisproposalcorrespondtotheentireproject,andnotonlytothepartfundedbyKIGAM.
References:Kim,J.,Moridis,G.J.,Yang,D.,Rutqvist,J.(2012a).“NumericalStudiesonTwo-WayCoupledFluidFlowandGeomechanicsinHydrateDeposits.”SPEJ.June2012,485-501.
Kim,J.,Moridis,G.J.,Rutqvist,J.(2012b).“CoupledflowandgeomechanicalanalysisforgasproductioninthePrudhoeBayUnitL-106wellUnitCgashydratedepositinAlaska.”J.Pet.Sci.Eng.92-93,143-157.
Kwon,T.-H.,K.-R.Lee,G.-C.ChoandJ.Y.Lee(2011)."GeotechnicalpropertiesofdeepoceanicsedimentsrecoveredfromthehydrateoccurrenceregionsintheUlleungBasin,EastSea,offshoreKorea."MarineandPetroleumGeology28(10):1870-1883.
Lee,C.,T.S.Yun,J.-S.Lee,J.J.BahkandJ.C.Santamarina(2011)."GeotechnicalcharacterizationofmarinesedimentsintheUlleungBasin,EastSea."EngineeringGeology117(1–2):151-158.
Livescu,S.,Durlofsky,L.J.,Aziz,K.,Ginestra,J.C.(2010)."Afullycoupledthermalmultiphasewellboreflowmodelforuseinreservoirsimulation."J.Pet.Sci.Eng.71:138-146.
Moridis,G.J.,Kowalsky,M.B.,Pruess,K.,(2008)."TOUGHþHYDRATEv1.0User’sManual:ACodefortheSimulationofSystemBehaviorinHydrate-BearingGeologicMedia."ReportLBNL-00149E,LawrenceBerkeleyNationalLaboratory,Berkeley,CA.
RutqvistJ.,MoridisG.J.(2009)."NumericalStudiesontheGeomechanicalStabilityofHydrate-BearingSediments."SPEJ.14:267-282.SPE-126129.(2009).
Rutqvist,J.,Moridis,G.J.,Grover,T.,Collett,T.(2009)."Geomechanicalresponseofpermafrost-associatedhydratedepositstodepressurization-inducedgasproduction."J.PEt.Sci.Eng.67:1-12.
Shi,H.,Holmes,J.A.,Durlofsky,L.J.,Aziz,K.,Diaz,L.,Alkaya,B.,Oddie,G.,(2005)"Drift-FluxModelingofTwo-PhaseFlowinWellbores."SPEJ.10(1):24-33.
Yun,T.S.,C.Lee,J.-S.Lee,J.J.BahkandJ.C.Santamarina(2011)."Apressurecorebasedcharacterizationofhydrate-bearingsedimentsintheUlleungBasin,SeaofJapan(EastSea)."JournalofGeophysicalResearch:SolidEarth116(B2):n/a-n/a.
53
Zhang,K.,Moridis,G.J.(2008)."Adomaindecompositionapproachforlarge-scalesimulationsofcoupledprocessesinhydrate-bearinggeologicmedia."Proc.6thInternationalConferenceonGasHydrates,July6–10.Vancouver,BritishColumbia,Canada.

National Energy Technology Laboratory
626 Cochrans Mill Road
P.O. Box 10940
Pittsburgh, PA 15236-0940
3610 Collins Ferry Road
P.O. Box 880
Morgantown, WV 26507-0880
1450 Queen Avenue SW Albany, OR 97321-2198
Arctic Energy Office
420 L Street, Suite 305
Anchorage, AK 99501
Visit the NETL website at:
www.netl.doe.gov
Customer Service Line:
1-800-553-7681