Embed Size (px)
Citation preview

DE-FE0005958 Final Technical Report
No proprietary or classified information, or any information subject to export control are included in this report.
1
“Improved Mobility Control for Carbon Dioxide (CO2) Enhanced Oil Recovery Using Silica-Polymer-Initiator
(SPI) Gels”
Final Scientific / Technical Report
Reporting Period Start Date: October 1, 2010 Reporting Period End Date: January 31, 2014 Date Report Issued: May 30, 2014 Principal Author: Kenneth D. Oglesby, PE
DOE Award Number: DE-FE0005958 Name and Address of Submitting Organizations:
Impact Technologies LLC PO Box 35505, Tulsa, OK 74153-0505
Clean Tech Innovations, LLC 6105 SE Nowata Road, Bartlesville, OK 74006
Rendezvous Resources, LLC PO Box 1347, Pawhuska, OK 74056
DE-FE0005958 Final Technical Report
No proprietary or classified information, or any information subject to export control are included in this report.
2
DISCLAIMER This report was prepared as an account of work sponsored by an agency of the United States Government. Neither the United States Government nor any agency thereof, nor any of their employees, makes any warranty, express or implied, or assumes any legal liability or responsibility for the accuracy, completeness, or usefulness of any information, apparatus, product, or process disclosed, or represents that its use would not infringe privately owned rights. Reference herein to any specific commercial product, process, or service by trade name, trademark, manufacturer, or otherwise does not necessarily constitute or imply its endorsement, recommendation, or favoring by the United States Government or any agency thereof. The views and opinions of authors expressed herein do not necessarily state or reflect those of the United States Government or any agency thereof. Note: All units are given in SI units with customary US units in ( ), where possible.
SI is an abbreviation for "Le Systeme International d'Unites."

DE-FE0005958 Final Technical Report
No proprietary or classified information, or any information subject to export control are included in this report.
3
ABSTRACT SPI gels are multi-component silicate based gels for improving (areal and vertical) conformance in oilfield enhanced recovery operations, including water-floods and carbon dioxide (CO2) floods, as well as other applications. SPI mixtures are like-water when pumped, but form light up to very thick, paste-like gels in contact with CO2. When formed they are 3 to 10 times stronger than any gelled polyacrylamide gel now available, however, they are not as strong as cement or epoxy, allowing them to be washed / jetted out of the wellbore without drilling. This DOE funded project allowed 8 SPI field treatments to be performed in 6 wells (5 injection wells and 1 production well) in 2 different fields with different operators, in 2 different basins (Gulf Coast and Permian) and in 2 different rock types (sandstone and dolomite). Field A was in a central Mississippi sandstone that injected CO2 as an immiscible process. Field B was in the west Texas San Andres dolomite formation with a mature water-alternating-gas miscible CO2 flood. Field A treatments are now over 1 year old while Field B treatments have only 4 months data available under variable WAG conditions. Both fields had other operational events and well work occurring before/ during / after the treatments making definitive evaluation difficult. Laboratory static beaker and dynamic sand pack tests were performed with Ottawa sand and both fields’ core material, brines and crude oils to improve SPI chemistry, optimize SPI formulations, ensure SPI mix compatibility with field rocks and fluids, optimize SPI treatment field treatment volumes and methods, and ensure that strong gels set in the reservoir. Field quality control procedures were designed and utilized. Pre-treatment well (surface) injectivities ranged from 0.39 to 7.9 MMCF/psi. The SPI treatment volumes ranged from 20.7 cubic meters (m3, 5460 gallons/ 130 bbls) to 691 m3 (182,658 gallons/ 4349 bbls). Various size and types of chemical/ water buffers before and after the SPI mix ensured that pre-gelled SPI mix got out into the formation before setting into a gel. SPI gels were found to be 3 to 10 times stronger than any commercially available cross-linked polyacrylamide gels based on Penetrometer and Bulk Gel Shear Testing. Because of SPI’s unique chemistry with CO2, both laboratory and later field tests demonstrated that multiple, smaller volume SPI treatments maybe more effective than one single large SPI treatment. CO2 injectivities in injection well in both fields were reduced by 33 to 70% indicating that injected CO2 is now going into new zones. This reduction has lasted 1+ year in Field A. Oil production increased and CO2 production decreased in 5 Field A production wells, offsets to Well #1 injector, for a total of about 2,250 m3 (600,000 gallons/ 14,250 bbls) of incremental oil production- a $140 / SPI bbl return. Treated marginal production well, Field A Well #2, immediately began showing increased oil production totaling 238 m3 (63,000 gallons/ 1500 BBLs) over 1 year and an immediate 81% reduced gas-oil ratio.

DE-FE0005958 Final Technical Report
No proprietary or classified information, or any information subject to export control are included in this report.
4
TABLE OF CONTENTS
EXECUTIVE SUMMARY…………………………………………………..……5
EXPERIMENTAL METHODS………………………………………………..…8 Laboratory Tests…………………………………………………………8 Data Collection, Evaluation and Selection ………………………..14 Injectivity Definition Inter-Well Capacity Definition Field and Well Selection Criteria Prior Competitor Gel Treatments Design SPI Field Treatment Plans…………………………………..18 Field Treatment Equipment Designs ……………………….………21 RESULTS AND DISCUSSION…………………………………………….….24 Laboratory Tests………………………………………………………..24 Field SPI Treatments……………………………………………...……36 Well Information Summary SPI Treatment Summary SPI Treatments in Field A SPI Treatments in Field B SPI Treatment Costs and Market……………………………….…...66 Comparison of SPI Gels to Other Conformance Gels…….……..69 SPI Mixing and Pumping Methods……………………………...…..71 Pictures of SPI Treatments in the Field…………………….…..….74 CONCLUSIONS………………………………………………………………..79
GRPHICAL MATERIALS LIST……………………………………………….86
BIBLIOGRAPHY / REFERENCES…………………………………….….….89
ACRONYMS AND ABBREVIATIONS……………………………….………94

DE-FE0005958 Final Technical Report
No proprietary or classified information, or any information subject to export control are included in this report.
5
EXECUTIVE SUMMARY
The purpose of performing SPI treatments in enhanced oil recovery CO2 floods is to increase oil production and ultimate oil recovery. SPI gels do this by redirecting injected CO2 away from already swept zones in the reservoir rock with no oil left to recover and into new unswept zones. Enhanced oil recovery operations using CO2 are expensive. Once started CO2 would continue to flow through the same oil-depleted zone because of CO2’s very low viscosity and high mobility relative to the oil and water in the reservoir. As this process continues the operation would become more and more inefficient and eventually becomes too costly to continue operation. Improving that recovery efficiency by blocking that depleted zone will allow the enhanced recovery operation to continue at a profitable level and recover additional oil from new zones of the reservoir rock.
Silicate-Polymer-Initiator (SPI) gels are multi-component silicate based gels for improving (areal and vertical) conformance in oilfield enhanced recovery operations, including waterfloods and carbon dioxide (CO2) floods, drilling well problems and other applications. They were originally developed under a DOE funded Striper Well Consortium project in 2006 and have been continuously improved. They are patent pending and are environmentally friendly with many food grade components. SPI gels are pumped as a water-like liquid into the oil-depleted zones of the formation which can then be triggered by an initiator (e.g. CO2) to lower its pH and form light gels up to very thick paste-like gels. SPI gels can be 3 to 10+ times harder (per penetrometer tests) than any cross-linked polyacrylamide gel now available allowing it to seal in difficult applications where PAM systems would break down. However, the hardest SPI gel is not as strong as cement or epoxy, allowing it to be chemically washed/ jetted and/ or otherwise be removed out of the wellbore without drilling.
This DOE funded project allowed field testing a total of 8 SPI treatments in 6 wells (5 injection wells and 1 production well) in a relatively new central Mississippi sandstone immiscible CO2 flood and in a mature west Texas San Andres dolomite water-alternating-gas/ CO2 (WAG) miscible flood. The SPI treatment sizes ranged from 20.7 m3 (5460 gallons/ 130 bbls) to 691 m3 (182,658 gallons/ 4349 bbls). Chemical and water buffers before and after the SPI mix ensured that the pre-gelled SPI mix got placed out into the formation before contacting CO2 and setting into a hard gel.
Clean Tech Innovations’ laboratory performed static bottle/ beaker tests to improve the SPI chemistry and find new chemicals for easier field treatments. Tests were also done on core rock material, brine and crude oil samples from both fields to ensure compatibility in the field tests. Brookfield Viscometer readings showed that even high concentration SPI gels had viscosities near water at reservoir temperatures. But once set, Penetrometer tests showed that SPI gels were 3 to 10 times stronger than commercially available cross-linked high molecular weight (HMW) polyacrylamide (PAM) gels allowing use in difficult applications. Additives were developed to prevent

DE-FE0005958 Final Technical Report
No proprietary or classified information, or any information subject to export control are included in this report.
6
significant losses into tighter zones of the reservoir.
Laboratory sand pack equipment and procedures were developed to perform dynamic flow tests with a 0.27 m (0.89 foot) by 0.457 m (1.5 inch) internal diameter holder having an internal 2.56 mPa (400 psi) overburden sleeve, outer heat tape with insulation and a CO2 back pressure valve. Dynamic flow tests in this equipment with Ottawa sand (crushed and sieved to 20-40 mesh) showed permeability reduction from 737 milli-darcies to 8 milli-darcies with one low concentration SPI treatment that was initiated with CO2. A 2nd SPI treatment reduced that permeability down to only 2 milli-darcies. This calculates to be residual resistance factors (Frr) of 92 for the 1st SPI treatment, 4 for the 2nd treatment and 450 overall for the Ottawa sand. Dynamic testing with Field A (at 43oC/ 110oF) sandstone showed an overall Frr of 123 and with Field B San Andres dolomite (at 41oC/ 105oF) the overall Frr was 2425, both with 2 SPI treatments.
The overall goal of this program was to test SPI gels in as wide a variety of CO2 flood field conditions as possible- injector/ producer, sandstone/ limestone, basins, operators, miscible/ immiscible, fractured/ tighter matrix flow, high / low injectivity, etc. In this regard we were very successful. The earliest (November 2012- March 2013) field treatments were in Field A, a central Mississippi sandstone that is about 1524 meters (5,000 feet) deep. The sandstone reservoir matrix has a Dykstra-Parson ratio of 0.97 and there are multiple natural fractures in the area of the SPI treated wells. It is a fairly new (2011) immiscible CO2 flood with no water injection. Most producers are forced flow with a few on artificial lift. These earliest SPI field treatments are now over 1 year old. The later (September to November 2013) west Texas treatments were in the San Andres dolomite formation also at about 1524 meters (5,000 feet) deep. These were in a mature, miscible, water-alternating-gas (WAG) injection cycle CO2 flood. We have only 4 months injection and production data available under these variable WAG conditions- insufficient to fully evaluate the treatments. We continue to monitor this field to finalize the evaluations. Both fields had other operational events and offset well work occurring during both the treatment and evaluation periods that complicated the treatment evaluations. Field A, injector Well #1’s SPI Treatments SPI1 of 950 bbls and SPI3 of 3842 bbls showed: 1) 58% CO2 injectivity reduction indicating that the injected CO2 is now going into new, lower permeable zones/ paths. That reduction has lasted 1 year so far; 2) Increased oil production in five offset/ area production wells totaling about 2,250 m3 (600,000 gallons/ 14,250 bbls) over the 1 year period. Offset work complicated this evaluation and the total impact of the treatment was reduced accordingly. The value of that incremental oil is estimated at $1.283US million (at $90/bbl sold); and 3) A reduction in the produced gas-oil ratio in five offset producers indicating a direct operation cost savings and improved CO2 utilization in the reservoir. Operator A

DE-FE0005958 Final Technical Report
No proprietary or classified information, or any information subject to export control are included in this report.
7
estimated the CO2 recycle cost to be $3.18 US/ 1000 m3 ($90/MMCF) in Field A “because it is a compression limited operating environment. The primary value for reducing the GOR is the additional oil resulting from more efficient use of the compressed gas”. Redirecting the injected gas should cause long term benefits of increased oil production. Field A, marginal producer Well #2’s SPI2 treatment of 691 m3 (182,658 gals/ 4349 bbls) showed: 5) Increased oil production totaling 238 m3 (63,000 gals/ 1500 bbls); and 6) Initial 81% gas-oil ratio reduction that dropped down to 44% then trailed down to its pre-treatment level by 1 year. In west Texas Field B we are still collecting data on 21 offset/ area production wells and 9 injectors to evaluate the total impact of the 5 SPI treatments in 4 wells in the field. However, to date, we have seen: 7) The 4 treated injection wells (Wells #3, 4, 5 and 6) showed 23% to 71% reductions in CO2 injectivity after the treatments, with some reductions to date; 8) One offset production well has already showed increased oil production from 4.5 m3 per day (LPD, 28.5 BOPD) up to 7.5 m3/day (47.3 BOPD) post-treatment or a 66% increase, for an incremental 233 m3 (61,656 gallons,1468 BBLs) recovered equal to $132,000 for only the 90 days monitored; 9) One offset production well showed a decrease in water production from a pre-treatment 70 WOR= 67 m3/D water (420 BWPD) down to an 11 WOR= 17.5 m3/day (110 BWPD); and 10) Ten (12 total including the 2 above) offset production wells are showing increasing/ positive trends that we will continue monitoring for up to 1 year. In addition, we were able to compare the SPI treatments to other competitor treatments performed in those same fields and, in some cases, in the same wells. Competitor treatments included one MarcitTM treatment, a few PolyCrystalsTM treatments and many high molecular weight cross-linked polyacrylamide (PAM) treatments. In summary for both fields, 29 conformance jobs were performed from 2007 to 2011, but only 4-5 treatments were considered by the operator to be successful to some level. Two wells have direct comparisons to SPI treatments- Field A Well #1 had a MarcitTM treatment in 2010 that did not change CO2 injectivity nor impact any offset production wells and Field B Well #3 had a cross-linked PAM gel treatment which did reduce water injectivity, but not CO2 injectivity, adversely increased offset well GOR and GLR and recovered NO incremental crude oil. However, SPI gel treatments in both fields, and specifically in those 2 direct comparison wells, showed injectivity decreases and some impact on their offset wells. We have also been able to directly measure some incremental oil recovery in Field A where we have 1 year of data.

DE-FE0005958 Final Technical Report
No proprietary or classified information, or any information subject to export control are included in this report.
8
EXPERIMENTAL METHODS
This section describes the laboratory equipment and tests utilized to improve the SPI chemistry and ensure its optimization for the field treatments. It also covers the basic methods utilized for the designs and equipment used in this project to perform the field treatments. Laboratory Tests- All laboratory work was performed at Clean Tech Innovations LLC laboratory (CTI) in Bartlesville OK and supervised by Lyle Burns, Talee Redcorn and advised by Dr. Betty Felber. The goals of the laboratory work were to improve and optimize the gel chemistry via bottle/ beaker tests, develop the dynamic flow sandpack equipment and procedures, and flow test those optimal SPI chemistries with the actual field water, crude oil and reservoir rock obtained. Specifically, improvements in gel strength, lower syneresis, easier chemicals to mix in the field, and improved tolerance to multi-divalent ions in field brines for easier mixing and lower cost while maintaining maximum gel strength were desired.
Figures 1-A & B. Low to Medium Concentration SPI Gel Samples. A-internal initiator; B-CO2 external initiator.
SPI gels are silicate based true gels that are pumped as a high pH, low viscosity liquid. Once in place its gelation process can be initiated by a reduction in pH via an internal or external chemical. In this project case the desired initiator is the carbon dioxide (CO2) in the reservoir and that is pumped into wells. Upon contact, CO2 dissolves into the water phase of the SPI mixture to form carbonic acid which causes the drop in pH and the initiation of the unique SPI gelation process. Figure 1 shows that there is no difference between an internal initiated and an external CO2 initiated SPI gel. The following tests and methods/ procedures were used in the laboratory to reach these goals with a review of some prior test results: Static bottle tests were used to mix various components (primarily various polymers, initiators, additives and substitutes for those components) at different concentrations

DE-FE0005958 Final Technical Report
No proprietary or classified information, or any information subject to export control are included in this report.
9
and at room or elevated temperatures (in an oven). Typically Bartlesville, OK tap water was used in all baseline comparison tests, except where field waters were utilized. Optimal gel formation and rated those gel qualities as: H= Hard; E= Elastic; R= Ringing; V = Very; VV=Very Very; N= No gel. Water separation or gel syneresis were measured as volume losses recorded as ccs. Precipitation and other reactions were studied to determine maximum % field brine possible in the SPI mix. Static bottle tests with crude oils from the fields were mixed with SPI solutions to look for incompatibilities, such as precipitation and spontaneous emulsification. Titration tests using 0.1M NaOH into field brines and solutions with crushed field rocks were made to determine their reactions with high pH NaOH and SPI solutions.
Figure 2. Clean Tech Innovations Laboratory Facility with Marcus Burns.
Brookfield Viscosity tests of pre-gel SPI solutions were found to be relatively low and near water at elevated reservoir temperatures. In the previous 2009 SBIR Phase I report the SPI solution viscosity at 3, 6, and 12 RPMs for Formulation 5 was 18, 9, and 7.5 centipoise (cp), respectively; for Formulation 7 it was 28, 14 and 11.5 cp respectfully. Prior testing showed good control over the SPI gelation process and that the actual gelation occurs very fast and not gradual once the pH level is triggered. Such standard viscosity measurement tests were utilized in this study. Examples of the viscosity of the SPI gelation process are seen in Figures 3 and 4 below.

DE-FE0005958 Final Technical Report
No proprietary or classified information, or any information subject to export control are included in this report.
10
Figure 3. Previous SBIR Phase I Project Viscosity Tests showing Gel Time.
Figure 4. Prior project testing showing Viscosity of low SPI concentration (1/3 of currently field systems) solutions at 40oC (104oF) in the Brookfield Viscometer from mix time to gelation.
DE-FE0005958 Final Technical Report
No proprietary or classified information, or any information subject to export control are included in this report.
11
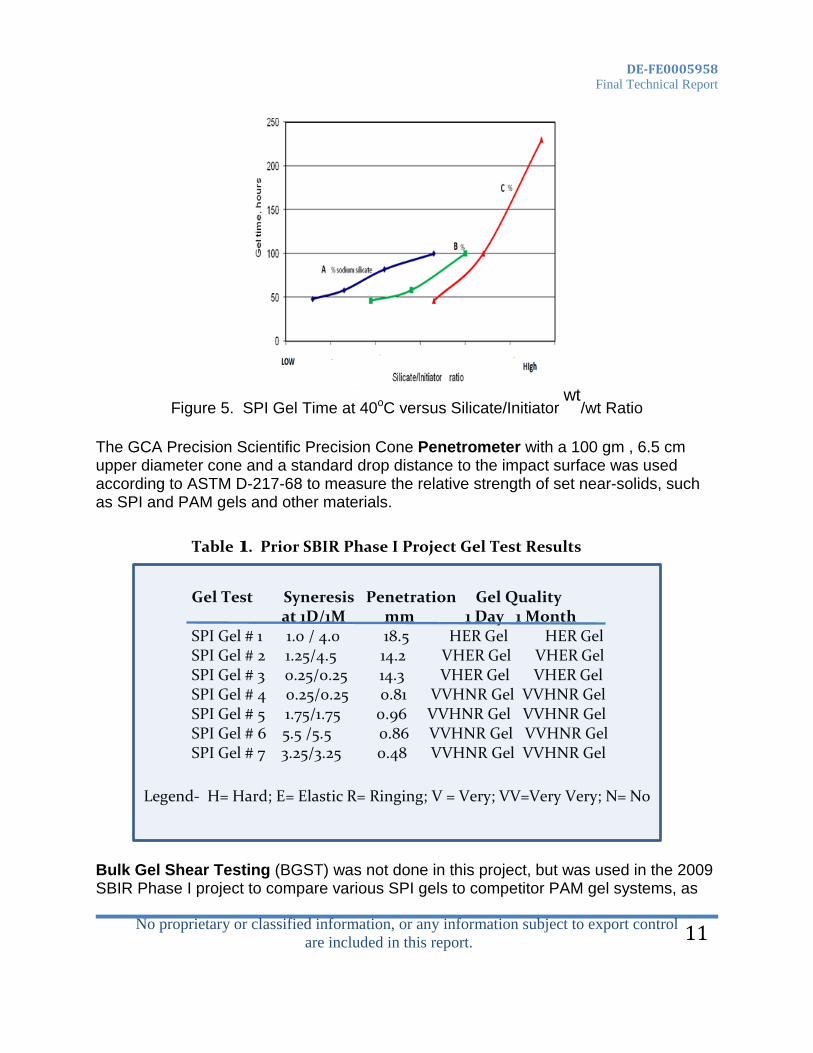
Figure 5. SPI Gel Time at 40oC versus Silicate/Initiator
wt/wt Ratio
The GCA Precision Scientific Precision Cone Penetrometer with a 100 gm , 6.5 cm upper diameter cone and a standard drop distance to the impact surface was used according to ASTM D-217-68 to measure the relative strength of set near-solids, such as SPI and PAM gels and other materials. Table 1. Prior SBIR Phase I Project Gel Test Results
Gel Test Syneresis Penetration Gel Quality at 1D/1M mm 1 Day 1 Month SPI Gel # 1 1.0 / 4.0 18.5 HER Gel HER Gel SPI Gel # 2 1.25/4.5 14.2 VHER Gel VHER Gel SPI Gel # 3 0.25/0.25 14.3 VHER Gel VHER Gel SPI Gel # 4 0.25/0.25 0.81 VVHNR Gel VVHNR Gel SPI Gel # 5 1.75/1.75 0.96 VVHNR Gel VVHNR Gel SPI Gel # 6 5.5 /5.5 0.86 VVHNR Gel VVHNR Gel SPI Gel # 7 3.25/3.25 0.48 VVHNR Gel VVHNR Gel Legend- H= Hard; E= Elastic R= Ringing; V = Very; VV=Very Very; N= No Bulk Gel Shear Testing (BGST) was not done in this project, but was used in the 2009 SBIR Phase I project to compare various SPI gels to competitor PAM gel systems, as

DE-FE0005958 Final Technical Report
No proprietary or classified information, or any information subject to export control are included in this report.
12
seen below in Figures 6 and 7. These tests are based on the referenced SPE 13567 paper by Jean Meister and entitled “Bulk Gel Strength Tester” (BGST). These tests provide a means of measuring and comparing near-solid gel viscosities. Aluminum Citrate initiated PAM gels were made according to SPE 13567 and showed a BGST apparent viscosity of 6083 cp at room temperature, and not very shear sensitive. These low concentration SPI gels (75% of current field LOW concentration levels) showed BGST viscosities from 11,440 to 27,452 cp and showed some shear thinning characteristics. Furthermore these prior BGST tests, as shown in Figures 6 and 7 below, showed that 20,000 ppm cross linked PAM system just flowed through the screen while SPI gels (at a low concentration) were sheared by the wire screen, then (partially) retained some strength and/ or reformed after passing through the screen. This indicates that SPI gels may provide sealing and strength even after being sheared.
Figure 6. PAM cross-linked with Figure 7. SPI Gel through BGST and Aluminum-Citrate tested through BGST partially reformed into a block From these prior Penetration and BGST tests it was found that even weak SPI gels were about 2 to 4.5 times stronger than that standard PAM gel system. Those tests also found that SPI gels initially form within a few minutes of the trigger pH level, but gain strength rapidly until day 3-5. Strength continues to slowly improve over the next 30 days. Dynamic Flow or Sand Pack Testing- CTI and Redcorn built, tested and performed multiple dynamic flow / sand pack tests with a 1.5"ID X 10.734" long cylinder with an Aflas overburden sleeve with back pressure to maintain an overburden pressures up to 2.56 mPa (400 psi) over the internal pressure in the sandpack. This equipment and layout are seen in Figures 8 and 9. Shifted 20-40 mesh Ottawa sandstone or crushed & sieved field core materials were packed into this test cell and used to optimize SPI gel formulation and the treatment method. In these tests the sandpack was saturated with tap water or field formation salt

DE-FE0005958 Final Technical Report
No proprietary or classified information, or any information subject to export control are included in this report.
13
water. Standard core analysis (porosity and permeability) procedures were performed before SPI injection and water testing. The heater was set to the desired reservoir temperature and the discharge back pressure valve set to the desired reservoir pressure. Rates, pressures (upstream from the pump and discharge/ downstream pressure) and volumes were recorded over the length of test period. That volume-time data was converted into rates and velocities and plotted against the upstream pressure. An example procedure from 25March2013 is provided:
1. Crush and sieve Field B’s San Andreas dolomite core material to 20-40 mesh; 2. Load and pack the core material into the cylinder; 3. Heat the cylinder with the wrapped and insulated heat strips to the Field B’s 40.6oC
(105oF) reservoir temperature; 4. Set a 2.56 mPa (400 psi) hydraulic overburden pressure on the internal sleeve over
the pack length; 5. Inject Bartlesville tap water sequentially at 1 to 3 foot per day (darcy velocity)
through the unconsolidated core overnight to ensure full water saturation in all pores;
6. Inject tap water to determine pre-treatment permeability at various rates, 1 foot/ day used as basis, and measured pressure drop;
7. Inject 2 PV (280 cc) of pre-flush diluted brine (3000 ppm NaCl, 20 ppm CaCl, 1 ppm Mg in deionized water, representing buffer diluted formation water) solution was pumped through the sand pack;
8. Inject 2 PVs (280 cc) low concentration SPI gel premix at 1-3 foot per day rates. Note that medium to high SPI concentrations were too strong to test in sandpacks as they could not be displaced within the pressure limits of the equipment;
9. Inject 0.24PV (33 cc) of supercritical CO2 maintaining 1600 psig (Field B reservoir pressure) using the back pressure valve to initiate the gelling process;
10. Allow the CO2 to soak over 24 hours (sometimes over the weekend- 3 days) to fully gel the SPI pre-mix; and
11. After full gellation (most of the 5 day strengthening period) pump Bartlesville tap water across the SPI treated pack at sequentially increasing rates to determine post-treatment sand pack permeability. Record pressures at all rates.
12. Calculate effective permeability and the residual resistance factor of each treatment test.
13. Repeat Steps 8-12 for a 2nd SPI treatment, if desired. Permeability (K) was calculated as K = (QµL)/((P1 - P2)A), where Q= rate, µ= viscosity, P1=upstream pump pressure, P2= downstream pressure set by back pressure valve, L=length of sand pack=0.89 feet and A= interstitial internal area of the sandpack (1.5” diameter area * porosity of the pack). Residual resistance factor (Frr), calculated as Frr= K untreated/ K treated, compared the

DE-FE0005958 Final Technical Report
No proprietary or classified information, or any information subject to export control are included in this report.
14
original pre-treatment permeability to the post treatment effective permeability at the same conditions. This was used to determine the relative benefit obtained by the treatment.
Figure 8. Sand Pack Setup with Talee Redcorn (front) and Mike Burns (back).
Data Collection, Evaluation and Selection Criteria of Field/ Reservoir/ Wells – It should be first noted that getting CO2 flood operators to allow testing of a new product in the field is very difficult. The first step is to find an internal advocate engineer or manager that has conformance problems and is willing to try a new product. Most operators (engineering advocates or managers) will not want to go to this level of effort for a new unproven product, even if it is ‘free’. When they are willing to accept that risk, inconvenience, they must dedicate technical and field personnel time, provide and sharing data, providing internal and third party field costs and obtaining all legal / internal approvals. Keeping the internal advocate in the same job and pushing the project forward is difficult, as advocates in both fields had job/ position changes and

DE-FE0005958 Final Technical Report
No proprietary or classified information, or any information subject to export control are included in this report.
15
new advocates were found. It is also difficult to get the field / operating units interested and then participating in the project since they have fires to fight. Once the management approvals and legal contracting was completed both operators provided all the data requested and that was available. For this we are truly thankful for the operators and their internal champions who accepted this challenge. Unfortunately, they wish to remain anonymous at this time. The various data needed to select basins, fields, reservoirs and wells, as well as how to treat the selected reservoirs and wells, was collected from technical literature, state regulatory agencies and the operators. Specifically, in our selection of fields and wells, we wanted as wide a range of basins, different rocks and both injectors and producers. The range of data obtained for both fields included- reservoir information including pressures and temperatures; field brine, crude oil and fresh water sample; reservoir core material (very difficult to obtain) and core analyses; then for all potential wells - well schematics and historical production (oil, water, gas, GOR, WOR) and injection (rate, fluid, pressures) monthly data going back several years; and logs of various types including open hole, production and injection profile logs. Once this data it was delivered it was evaluated by Impact PI and Dr. Felber. Injectivity Definition and Calculations- The furnished data was used to categorize and rank wells by means of calculated/ evaluated factors or terms. This factor relates the size/ open-ness of the flow path and its connectivity to the low pressure of the producer. The length of the flow path also has an indirect influence on this term. It indicates the relative strength of the gel required to block that flow path and the amount of wall interactions occurring during treatment. If the treatment is to be in a WAG project, it is important to test for both water injectivity and CO2 injectivity when they are at their maximum saturations (i.e. at the end of that cycle), where possible. If water injectivity is not known, then a water step rate test must be run. This set the maximum injection rate of the SPI solutions and the restart CO2 rates. Injector Injectivity can be calculated by the 3 methods given in Table 2 below, but only the last wellhead pressure basis is available for most all wells to allow direct comparisons. The most accurate method of calculating injectivity is the top equation. It utilizes downhole conditions to take out the influence of hydrostatic head, flow friction and pressure influences on density, etc. It also includes an accurate static reservoir pressure. The data required to calculate this term is not normally available from the operators. The middle calculation method of injectivity can be used where a static surface pressure is utilized to approximate (as a surface expression) reservoir pressure, but it is only valid if the same density fluid as the dynamic flow pressure existed in the tubing. The last calculation method is the simplest, the most inaccurate, and the most available- It will be used in this project report.

DE-FE0005958 Final Technical Report
No proprietary or classified information, or any information subject to export control are included in this report.
16
Table 2. Methods of Calculating Injectivity of a Well (#1 = Best Method)
Figure 9. Sand Pack Schematic not showing Overburden Sleeve Setup

DE-FE0005958 Final Technical Report
No proprietary or classified information, or any information subject to export control are included in this report.
17
Interwell capacity definition and calculation method- This is a new term and not widely used. Inter-Well Capacity is an expression of the SIZE of the problem and the relative SPI gel VOLUME needed to plug or block that flow path. This volume calculation represents the length times average diameter (or length X heighth X width) of the flow path between the wells. It is the time*rate or volume it takes for an injector fluid/rate change to be seen in an offset target producer. Time can be converted into a volume by multiplication of the average injection rate in that period of time or by measuring the cumulative volume difference in the injector. The default assumption is that all injector volume goes to the one target producer AND that producer is only affected by that one injector. If multiple producers are affected by the injector (i.e. flow is split) a factor must be used. If a producer is affected by multiple injectors, that must be factored into the equation as well. Many other assumptions of compressibility, distribution of flow, etc. are also required. Overall Field and Well Selection Criteria- The specific goal of the project was to perform, record data and evaluate SPI treatments in different conditions- reservoir lithology, basins/ states, depths, operators, completion methods, lift methods, miscible/ immiscible recovery, injector / producer treatments, buffer types and sizes, SPI concentrations and formulations, and SPI treatment volumes relative to the calculated factors or terms. This data would then be used to evaluate the suitability of SPI gels for conformance treatments. After many discussions with many operators to outline SPI and the project criteria, we found only 2 companies (herein referred to Operator A of Field A in central Mississippi and Operator B of Field B in west Texas) with an internal advocate/ champion that had some initial management support. The internal advocates then internally discussed various fields with their operating units and they selected one field that best fit our criteria. Since we only found a champion and support within two CO2 flood operating companies and they offered one field each in which to perform SPI treatments within the 2 years of project effort- these fields were gratefully accepted. Once the paperwork and approvals were in place, the operators provided all the field and reservoir data we requested. The initial selection of wells within those fields was generally left to the operator to list their top 5-6 problem wells that they identified as needing conformance corrections and therefore were candidates for SPI treatments. The operators then provided field and reservoir data and samples as well as required data on all candidate and offset wells. Both operators were interested in production well treatments and included some in their list of potential wells for treatment. Of course, we were obtaining problem wells and not the best wells in each field, which is problematic with production wells, as they are on

DE-FE0005958 Final Technical Report
No proprietary or classified information, or any information subject to export control are included in this report.
18
their last leg of existence. Furthermore, we wanted treated wells to be as far apart from each other as possible to avoid interference between treatments and causing difficulty in evaluating the results. The alternative, not initially desired, was to have them close together in the same zone to gauge an overall impact. Impact PI and Dr. Felber analyzed the field and reservoir data to determine the best areas to perform the treatments, then narrowed the list down to the 1 or 2 wells best suited for SPI treatment, keeping some lower ranked wells as backup. The general criteria for well selection were -
List of Criteria and Screening Parameters for Selecting Sweep Improvement Candidates
(per Dr. Betty Felber) o Well(s) must produce large volumes of fluid. o Wells that cannot be pumped off with existing equipment are excellent candidates. o Wells that exhibit dramatic increase in water or gas with drop in oil production as water and gas production increased have the best potential for increased oil production. o Wells high on structure and above water oil contact but still make lots of water and gas are excellent candidates. o Production wells with bottom water drives in fractured dolomitic-limestones. (If and only if treatments can be conducted in carbonates) o Substantial movable oil saturation (So) o Unexpectedly low oil recovery in the field o Early CO2 gas or water breakthrough o High fluid levels in wellbore o Overall, the worse the conformance problem is-
• Normally, the greater the amount of moveable oil is present • The greater the potential for treatments to be successful • Well candidates with ugly conformance problems can be good candidates • Proper diagnosis of the problem is necessary to determine technology to be used.
David Smith with ConocoPhillips stated that the best candidate injection wells for conformance treatments are those that are NOT AT THEIR HIGHEST POSSIBLE INJECTION PRESSURE (i.e. injection rate reduced with a surface choke by restricting injection wellhead pressure). Worded differently, best candidates have a CO2 injection wellhead pressure lower than its available CO2 system pressure. This is normally done to conserve CO2 for other injection wells and patterns. This restricting action sets a pre-treatment delta-pressure (injector to producer) across all open zones in that injection well that is less than it would be if full system pressure was on the well. The reasoning to add this criteria is that once the highest perm zone is plugged off by the SPI

DE-FE0005958 Final Technical Report
No proprietary or classified information, or any information subject to export control are included in this report.
19
conformance treatment it allows the wellhead injection pressure to be increased to full system pressure (i.e. choke open fully) which increases the delta-pressure between the wells in all remaining zones. This will hopefully see an increase in CO2 flow into the remaining zones and higher oil recovery. Design SPI Field Treatment Plans Treatment design for a given well depends on the SPI chemistry/ formulation utilized and the well/ reservoir conditions determined to exist in that well and reservoir area. SPI chemistry and formulation was optimized based on the well injectivity calculations indicating openness of the primary flow path/ channel. A lower SPI concentration creating a less strong gel would be used for a tighter flow path and a stronger set gel would be used for a higher injectivity flow path. In addition, the unique chemistry of the SPI gels, which sets only with direct CO2 (supercritical at reservoir P&T is best) contact, allows a lot of latitude in the treatment design. The CTI laboratory tests optimized various SPI formulations for different well and reservoir conditions. Lost circulation chemicals can be added if there is concern of SPI entering low permeability zones connected to the primary flow path. The unique chemistry with CO2 also means that the total SPI mix slug/ volume will primarily be set at the front, tail ends and along the walls of the flow path. The front edge of the SPI mixture will be set by the CO2 that is already in the reservoir from prior injection/ or from cross flow from another well. The tail end of the SPI mix will be set by the invasion of higher mobility CO2 that is injected post-treatment and worked its way through the post-buffer. Residual CO2 along the rock walls of the flow path can and will set SPI on the side edges, which will restrict flow, however if high shear exists at that location, then the gelation process will be delayed or disrupted. If the flow path is very wide then significant volumes of unset SPI mix may exist in the middle of the slug for a long time, or until one of the edge seal breaks down and the ungelled SPI mix is initiated with new CO2. This can be counteracted by using an internal initiator. If the flow path is very narrow, early setup of the injecting SPI mix in the flow path may increase pressure too fast to continue and finish the job. H2S can also set SPI gels. However, low pH reservoir brine / water will dilute the SPI mix to a sludge, maybe precipitate some of the silicate, but will not form a strong gel. SPI will not gel in the presence of crude oil. Therefore, in general there is a lower SPI mix volume limit that is set by excessive dilution of the desired pre-gelled volume with the front and tail buffers and formation waters, leaving too little volume of strong SPI gels in the desired flow path and allowing seal breakdown or early bypass. There is also a maximum SPI mix volume set by economics where too much un-initiated/ un-set SPI gel exists in the middle of the

DE-FE0005958 Final Technical Report
No proprietary or classified information, or any information subject to export control are included in this report.
20
pumped mixture. That ungelled SPI mix may later move, contact new CO2 and gel in a new flow path, but it does not help the economics of the current treatment. Also, higher SPI concentrations and additives are needed for strength in the higher injectivity paths which have higher delta-pressure and wider diameter flow paths. Lower SPI concentrations and additives are needed for tighter, thinner width flow paths. Also, to optimize the volume of strong gels resulting from an SPI treatment it is expected that multiple, smaller volume SPI treatments (subject to the minimum limit) maybe the best option, See Figure 10 below. That will prevent over-treating a given well, possibly over restricting or even shutting off all injection. While it is true that small volumes or lengths of even strong SPI gels would allow for earlier bypass of CO2 injection around the plug, multiple treatments properly spaced would resolve that issue. However, some operator engineers want the primary flow path completely or largely sealed off on the first job, if economically possible. To do this efficiently with SPI gels may require use of an internal initiator, in addition to the available CO2 and multiple treatments. However, the direct goal of these project field tests was to prove the CO2 initiation capability of SPI gels (saves money because of no initiator cost) and improved placement (sets only with direct contact of CO2) in primary CO2 flow paths. Therefore no internal initiated SPI treatments were planned in this project.
Figure 10. Schematic of Multiple, Smaller SPI Treatments in a Simplified CO2 Flood Treatment design for a given well specifically depends on the well/ reservoir conditions determined to exist around that well. This is the flow path size and connectivity that exists between the treated injection well and the lower pressure production well that it

DE-FE0005958 Final Technical Report
No proprietary or classified information, or any information subject to export control are included in this report.
21
adversely affects. The parameters identified to design the treatments were injectivity and inter-well capacity, both defined earlier, which also allow comparisons of treatments between wells. It should also be noted that this is a new process and this is an experimental field test to obtain valuable information to improve treatment designs in the future. The information obtained from the operators allowed treatments to be designed to fit the well and provide a variety of mixing methods and procedures, SPI concentrations, pump rates, pre- and post- buffer sizes and types, pumping pressures, and post-treatment well conditioning and CO2 / initiator injection rates, shut-in times, and even non-CO2 initiation variables to evaluate. In all tests, concentrations and volumes of all fluids and chemicals were measured and recorded; injection rates and wellhead pressures were recorded; fluid samples were taken of the key chemicals and final mixes; and problems were identified and noted. Summaries of the well information, well characteristics and SPI treatments performed are given in the Results Section later. During this data collection and operator contact process, an agreement was made with second largest silicate supplier in the US, Occidental Chemicals (OXYchem). That agreement was facilitated by the interest of Operator B in participating in this project. Field Treatment Equipment Designs Both slip-stream and batch mixing methods can be utilized depending on total injection rates and total volumes for the specified well treatment. In the slip-stream method each chemical is sequentially injected into the pressurized water stream via metering pumps and then mixed with inline mixers before the next chemical is added. This method can be used for any rate and any volume, however, this method is more difficult to keep within the specified chemistry/ component concentrations ranges. Some version of the slip-stream method is needed when using an internal initiator (not used in this project). Typically, recirculation of fresh water from the triplex injection pump discharge back to the storage frac tank via an adjustable choke was used to control water flow rate to the mixing skid. That water rate was measured with a turbine meter on the skid to automatically adjust the chemical injection rates. Multiple inline mixers were used to ensure full mixing between any chemical addition and prior to going downhole. Sampling access at various points on the skid were installed to obtain samples of specific chemicals and the final mixture before going downhole. The flow turbine, pipes and chemical metering pumps were all pressure rated for the treatment pressures expected- 18.62+ mPa (2700+ psi). They were designed for the specific rates expected- water turbines and inline mixers at 38.15 to 281.5 m3/day (250 to 381.5 BPD), chemical pumps and hoses at 7.57 lpm (2 gpm) to 75.7 lpm (20 gpm). Compatibility of all components with the full range of high pH to low pH solutions required stainless steel

DE-FE0005958 Final Technical Report
No proprietary or classified information, or any information subject to export control are included in this report.
22
for the higher pressure items while low pressure allowed use of polyethylene. Low pressure chemical polyethylene/ polypropolyene storage tanks were used for the water and chemicals. Liquid chemicals were preferred to be used to the highest extent possible so that pumping, not dry induction/ hopper additions, was possible. Such equipment was purchased and assembled for this purpose. Batch mixing can be accomplished by sequentially adding and mixing water and all chemical vigorously in a clean tank using volumes measurements. Once mixed, the SPI solution can be pumped downhole directly with a charge pump and sometimes through a turbine meter. This method can best be used for lower rates and any volume. Higher rates can use this method only if the total volume is not excessive (>2000 bbls per treatment as a rough initial rule)- up to 4 rental acid tanks premixed. See Figures 11-15 show the field treatment equipment before going to the field. Figure 15 was taken of the fully assembled equipment for slip-stream operation during testing at Impact’s Tulsa shop.
Figure 11. UET In-Line Stainless Steel Internal Static Mixer
rated for 2700+ psi and 3000 BPD, installed on the Mixing Skid.

DE-FE0005958 Final Technical Report
No proprietary or classified information, or any information subject to export control are included in this report.
23
Figure 12. Four 5025 gallon (120 bbls) Norwesco Polyethylene Chemical Storage Tanks
(blue front) w/steel base skid added later. White 25 bbl polycarbonate water tank.
Figure 13. Three Hydra-Cell Diaphragm-type (positive displacement) Chemical
Metering pumps with Variable Speed Controllers

DE-FE0005958 Final Technical Report
No proprietary or classified information, or any information subject to export control are included in this report.
24
Figure 14. Stainless Steel and Polyethylene low pressure, high rate gear-type transfer
pumps - electric powered. Not shown-gas powered Polyethylene gear pump.
Figure 15. Full SPI Slip-Stream equipment Setup in Impact’s Yard during Testing
DE-FE0005958 Final Technical Report
No proprietary or classified information, or any information subject to export control are included in this report.
25
RESULTS AND DISCUSSION
The previous section covered the methodology of how we prepared for the field treatments while this section covers the results of what we actually did, what we found and what it means. It covers the broad area of the Laboratory Tests and Field Tests (Summary Results, Field A Results and Field B Results). Laboratory Tests- Over 1000 tests at CTI’s Bartlesville laboratory were conducted during the project. Laboratory data, chemical additives and specific formulations are considered proprietary due to ongoing patenting and commercialization efforts and, therefore will not be disclosed in this public report. The majority of the chemistry optimization tests and the Field A tests were completed and reported by January 2012. However, additional tests to perform bottle and dynamic flow sand pack tests on Field B’s west Texas San Andreas dolomite core material were conducted in late 2012 and into March 2013. CTI found optimized SPI chemistry composition for CO2 interactions, improved SPI gel strength to very-very-hard gels, lower syneresis of the created gels, higher hardness ion tolerance, etc. CTI also found improved chemicals for easier/ faster mixing in the field, including non-polymer additives. Specific in preparing for the field tests, CTI performed bottle tests to evaluate compatibility of SPI gels with Fields A and B formation water and crude oil. CTI found no incompatibilities with either field fluid or rocks, but we still could not mix SPI gels in 100% field waters in either field. CTI performed beaker titration tests of the obtained field core rock material to determine the relative ion exchange capacity of the field rocks (crushed) and field brine water. The results of these tests are seen in Figures 16 and 17. Figure 18 shows a ‘titration’ test through a sandpack with Field A core material- taking 2.2 PV to stabilize at a 12 pH level. The conclusion is that field brines/ waters will consume much more of the SPI mix than the reservoir rock. Buffers should prevent most of that concern by displacing and diluting the brine in the reservoir prior to contact. Neither set of tests found a serious level of concern for pumping the SPI mixture into either reservoir.

DE-FE0005958 Final Technical Report
No proprietary or classified information, or any information subject to export control are included in this report.
26
Figure 16. Titration with 0.1M NaOH into 100 grams of Field A Brine
Figure 17. Titration with 0.1M NaOH into 250 ml Deionized Water with 25 grams of
Field A’s Crushed Sandstone

DE-FE0005958 Final Technical Report
No proprietary or classified information, or any information subject to export control are included in this report.
27
Figure 18. Titration of 0.1 N NaOH across a Sandpack with Field A sand material.
The Penetrometer was used to test the strength of various SPI gels and compare then to Cr6+ cross linked PAMs gels and other materials. For reference in these tests, standard chromium gels were made from sodium dichromate, partially hydrolyzed polyacrylamide and a sodium bisulfite reducing agent as given in Table 3. Several concentrations of reagents were used increasing the polymer to one percent, where a very thick polymer solution existed- probably too thick to pump. When most chromium gels were tested in the penetrometer, the needle cone went all the way to the bottom of the sample giving a reading of 48.0 mm, which is maximum penetration through the sample for that test and therefore not useable for comparison. The results of the CO2 initiated SPI gel samples are given in Table 8 (Field Quality Test section below) and pictured in Figure 19. They show a 2 to 10? times higher strength (as measured in mm penetration) than the highest, unpumpable, 20,000 ppm PAM gel prepared for this test.
Field A

DE-FE0005958 Final Technical Report
No proprietary or classified information, or any information subject to export control are included in this report.
28
Figure 19. Penetrometer Test on an SPI gel
Dynamic tests using Ottawa sandstone and both fields’ crushed core samples- all sorted to 20-40 mesh- were used as described in the prior Methods section for gel treatment and for post-treatment water injectivity testing. Tested only late in this study and at too low a pressure range, but suggested for future sandpack testing, was a change in test procedure to use constant pressure instead of constant rate to perform the post-treatment injectivity tests. This is because the dynamics of injecting with a constant rate with a positive displacement pump against a ‘solid’ causes immediate pressure spikes that breaks down the already formed strong gels at the pack face with pressures exceeding the overburden sleeve pressure. This forces flow around the sandpack, along the sleeve and creates a flow channel along the outer diameter- not measuring the gel. This is similar to fracturing the surrounding rock to inject through wellbore damage. Initial bottle/ beaker, Penetrometer and sandpack tests were performed using Ottawa

DE-FE0005958 Final Technical Report
No proprietary or classified information, or any information subject to export control are included in this report.
29
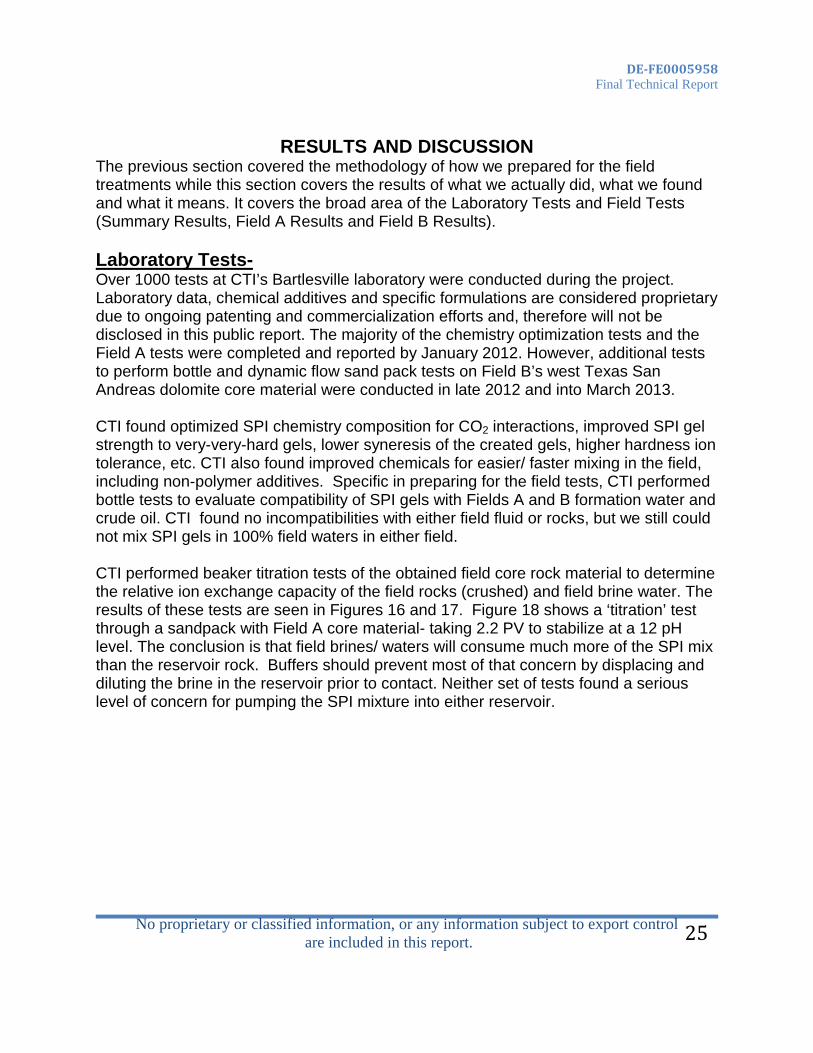
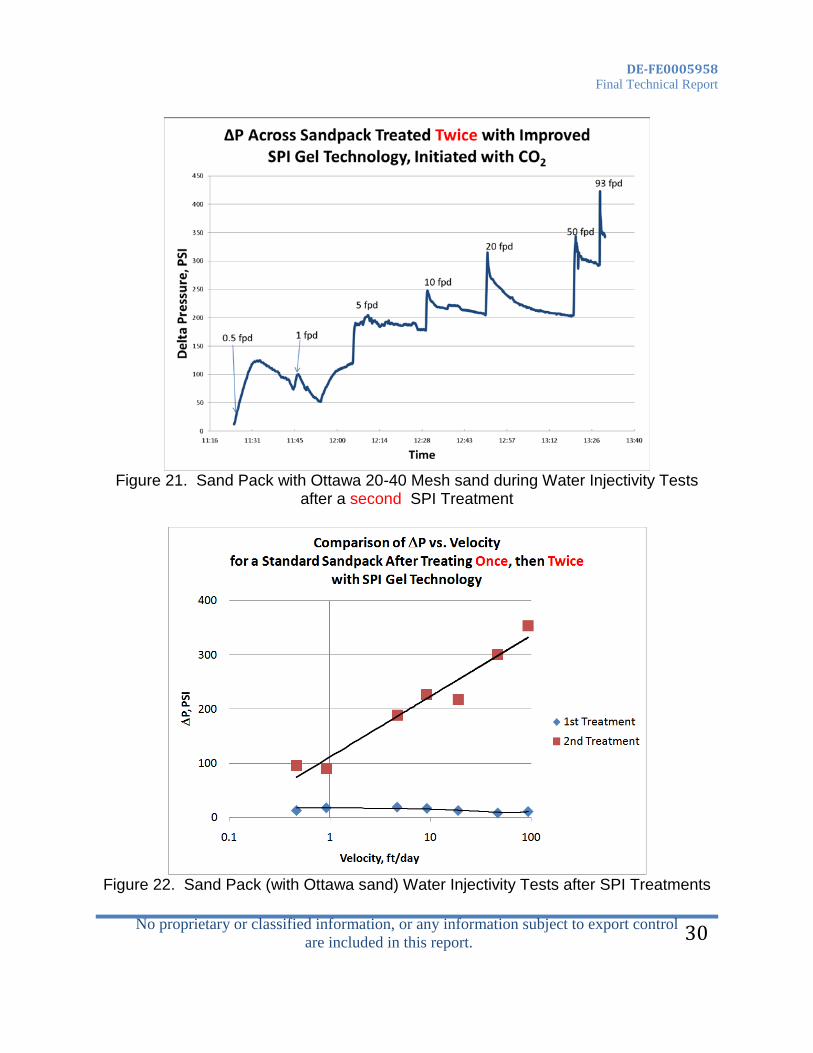
sandstone at 20-40 mesh before any field core materials were made available. The sand pack test results in various rock materials (Ottawa sand, Field A sand, Field B dolomite) are shown below in Figures 20 through 26 and Tables 4 through 7. Water injectivity tests after one and two SPI treatments (each performed as described in the earlier Methods section) are showed. These tests indicate that the flow of the low viscosity per-gel SPI mix is not fully uniform as it filled the highest permeability paths leaving some lower permeability paths open. Injection of even lower viscosity CO2 follows that same highest permeability path to initiate the SPI mix and plug those paths, but not the next lower set. A second SPI treatment fills and plugs those still open higher permeability paths. Note that a higher viscosity SPI mix (truly possible) would have a more uniform flow path coverage through the sandpack for a higher permeability reduction from the first treatment- not a valid option due to pressure limits in the lab and in the field. Note that reservoir velocities over 5 ft/day in the sand pack may induce turbulence causing higher pressure drops as well as destruction of the formed gels.
Figure 20. Sand Pack with 20-40 Mesh Ottawa Sand during Water Injectivity Tests
after one SPI Treatment.
DE-FE0005958 Final Technical Report
No proprietary or classified information, or any information subject to export control are included in this report.
30
Figure 21. Sand Pack with Ottawa 20-40 Mesh sand during Water Injectivity Tests
after a second SPI Treatment
Figure 22. Sand Pack (with Ottawa sand) Water Injectivity Tests after SPI Treatments

DE-FE0005958 Final Technical Report
No proprietary or classified information, or any information subject to export control are included in this report.
31
Table 4. Sand Pack Flow Test Results with 20-40 mesh Ottawa Sand
Dynamic flow through sand pack tests were made using Field A’s crushed and sieved to 20-40 mesh size sand core material at Field A’s reservoir conditions of 43oC (110oF) and 17.23 mPa (2500 psi) and using the 2.56 mPa (400 psi) overburden pressure (over internal pressure) for one and two SPI treatments. The water injectivity tests following the second SPI treatment in the Field A sand pack are shown in Figure 23. The comparisons of water injectivity tests in sand packs with Field A and Ottawa sands after a 1st and 2nd SPI Treatment are given in Figures 24 and 25 and Table 5.
Figure 23. Water Injectivity Tests in a Sandpack with Field A sand material
after two SPI Treatments

DE-FE0005958 Final Technical Report
No proprietary or classified information, or any information subject to export control are included in this report.
32
Figure 24. Field A Sandstone and Ottawa Sand Pack Water Injectivity Tests
after 1st SPI Treatment
Figure 25. Field A Sandstone and Ottawa Sand Pack
Water Injectivity Tests after 2nd SPI Treatment
Field A Core material -Versus -Ottawa Sand
Ottawa sand
Field A Sand Core Material and Ottawa Sand Tests
Ottawa Sand Field A Core

DE-FE0005958 Final Technical Report
No proprietary or classified information, or any information subject to export control are included in this report.
33
Table 5. Sandpack Injectivity Testing comparing SPI gel treatments.
Ottawa Sand and Field A Sandstone core material crushed and sieved to 20-40 mesh. Rate is equivalent to 1 foot/ day in the Reservoir.
The same sand pack tests with a 1st and 2nd SPI treatment were run with Field B San Andres dolomite material crushed and sieved to 20-40 mesh are summarized in Table 6. These tests showed much higher permeability reduction results from each SPI treatment. A second Field B sand pack test is shown in Figure 26 and Table 7.
Table 6. Field B San Andres Dolomite SandPack Water Injectivity Tests
with one and two SPI Treatments

DE-FE0005958 Final Technical Report
No proprietary or classified information, or any information subject to export control are included in this report.
34
Table 7. Field B Dolomite Sandpack Water Injectivity Test
Retest with Constant Pressures preceding Constant Rates.

DE-FE0005958 Final Technical Report
No proprietary or classified information, or any information subject to export control are included in this report.
35
Figure 26. Water Injectivity re-Test of Field B Dolomite Sand Pack with early Constant
Pressure Period before Constant Rate, following 2nd SPI Treatment. In summary, in all sand pack tests (either with Ottawa sandstone, Field A sandstone or Field B dolomite) a first low concentrated SPI treatment resulted in a strong reduction of the sand pack permeability. That one SPI treatment permeability caused a permeability reduction factor (Frr) of 90 for Ottawa sandstone, 44 for Field A sandstone and 43 for Field B dolomite. Following a second SPI treatment Frr (compared to the post-1st SPI treatment permeability) was 5 for Ottawa, 3 for Field A and 56 for Field B. Overall both SPI treatments produced an Frr of 450 for Ottawa, 123 for Field A and 2425 for Field B. This trend was later confirmed in the field treatments. It is interesting that only the Field B dolomite tests showed a fairly balanced Frr for each SPI treatment. Quality Control- CTI Laboratory also prepared field quality test equipment, chemicals and procedures to make field tests of sampled mixes to ensure that the proper formulation was being followed. Following the SPI Treatment #2 in Field A, Well #2 several samples were taken during the treatment that were later delivered to CTI lab for quality control testing and analysis in January 2013. The samples were- DB1 = KCL+chem Flush Water from the frac tank, Post SPI treatment, post-Acid Job DB2 = 10% Diluted from standard Polymer from tank, 12 Dec 2012 at 4:30pm

DE-FE0005958 Final Technical Report
No proprietary or classified information, or any information subject to export control are included in this report.
36
DB3 = 10% Diluted from standard Polymer from pump, 12 Dec 2012 4:50pm DB4 = Silica Sample from pump sample port, 12Dec2012 about 4:30pm DB5 = Medium Concentration SPI mix at mixing skid sample port, 10 Dec2012 9:30pm DB6 = Medium Concentration SPI mix at mixing skid sample port, 11 Dec 2012 Noon DB7 = Medium Concentration SPI mix at mixing skid sample port, using 10% diluted polymer due to extreme cold conditions, 12 Dec 2012 4:30pm DB8 = High Concentration SPI mix at mixing skid sample port, using 10% diluted polymer, 13 Dec 2012 2:36pm Table 8. Post-Field A Treatment Quality Control Tests/ Comparison of SPI Gel to standard chrome gelled PAM gel strengths. 5000
ppm 6 RPM Vis, cp
5000 ppm 12 RPM Vis, cp
5000 ppm 6 RPM Vis, cp
5000 ppm
12 RPM Vis, cp
Density Syneresis Bubbling Time
Gel Time
Penetrometer, mm
pH
HMW PAM
950 725 DB-1 0 0 1.038 DB-2 250 265 DB-3 1700 1175 DB-4 160 218 DB-5 0 0 0 0 1.078 2 ml 7 min 30 Sec 13.3 12 DB-6 0 0 0 0 1.073 1.5 ml 6 min 30 Sec 12.6 12 DB-7 0 0 0 0 1.071 3.2 ml 6 min 30 Sec 11.2 12 DB-8 0 0 0 0 1.078 2.4 ml 6 min 30 Sec 10.3 12 Polymer
Wt% Na2Cr2O7
Wt% NaHSO3
Wt%
113-90-1 0.2 0.03 0.03 48.0 113-90-2 0.4 0.06 0.06 48.0 113-90-3 0.6 0.09 0.09 48.0 113-90-4 0.798 0.12 0.12 48.0 113-90-5 0.997 0.15 0.15 48.0 113-90-7 1.492 0.25 0.25 42.5 113-90-8 1.987 0.31 0.31 36.0
Note that 48 is the penetration reading where the dropped cone goes through the full sample. Test procedures were: Viscosities test were ran on the samples DB 1-4 at room temperature. Viscosities ran on samples DB 5-8 at Field A reservoir temperature of 43oC (110oF). Samples DB 5-8 were then gelled/ initiated with gaseous CO2 at room temperature then heated in an oven. Penetrometer tests were taken after 24 hours, then the samples were cooled and described, with density and pH tests made. Chromium cross-linked PAM gels (test numbers 113-90 –1 through 5) were made as described in Table 8 below and tested with the penetrometer to compare to the CO2

DE-FE0005958 Final Technical Report
No proprietary or classified information, or any information subject to export control are included in this report.
37
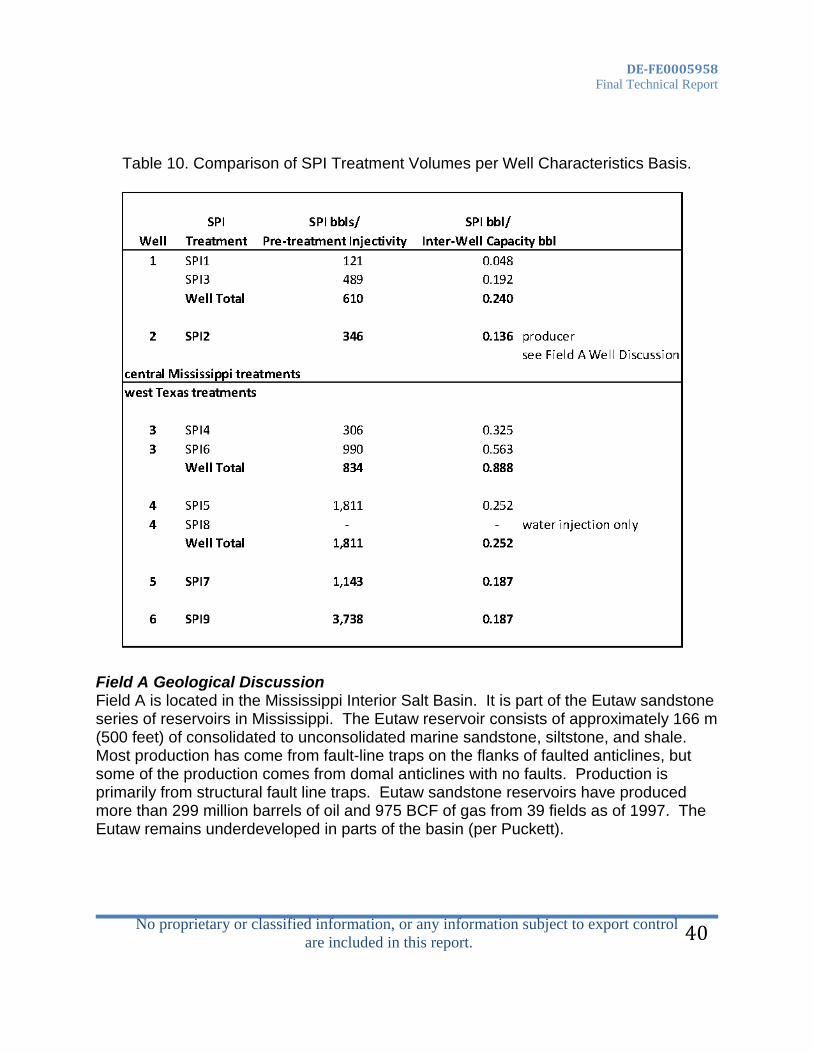
initiated SPI gels from the field. From Table 8 it can be seen that the SPI mixture density of this high concentration mixture is about 1.07 specific gravity. The CO2 activated SPI gels had penetrometer values of 10-13.3 mm while the strongest (but un-pumpable) PAM had 36 mm. This indicates a 3.6X level of SPI gel strength over this competitor gel. Field SPI Treatments Well Data and SPI Treatment Summaries With the selection of a fractured sandstone CO2 flood in central Mississippi and a dolomite WAG CO2 flood in west Texas, the selection variations desired were obtained. Both fields were about at the same depth of 1524 m (5000 feet). These two fields also held a wide variety of injectivities and inter-well capacities to compare. Table 8 was deleted and not shown due to proprietary concerns as it contains the details of the treatments – the pre-flush buffer types and volumes, SPI concentrations, additives, post-treatment buffers, initiation and restart procedures and cleanup tests. Table 9 summarizes the variety of well characteristics of each treated well, the actual SPI treatment volumes utilized and the outcomes from those SPI treatments. Treatment volumes ranged from 20.67 m3 (130 bbls) in SPI 4 (Well #3, first well in Field B, volume limited due pressure increase thought due to chemical reactions to solids in the tankers/ frac tanks/ wellbores) up to 691 m3 (4349 bbls) in SPI2 (Well #2, producer, highest injectivity well). Two wells were retreated- Well #1 (SPI1 and SPI3) at the request of the operator to reduce injectivity further and Well #3 (SPI4 and SPI6) with cleaner tanks and a higher maximum treatment pressure limit to increase total SPI treatment volume. SPI7 in Well #5 was prematurely stopped due to confusion by Impact on the maximum treatment pressure, so the well could have taken much more. In SPI1 and SPI4, both the first wells in each field to be treated, and where there were possible chemical reactions with dirty transports/ tanks/ wellbores that starting during the pre-flush and affected the remaining treatment. In both cases, the rate was continuously reduced to keep within the initially low maximum treatment pressure given by the operator. That pressure limit was increased for later treatments, but that change would not have much altered the outcomes of those treatments due to the created solids. As discussed in Method section, the required SPI treatment volume to seal a given flow path would seem to be related to its estimated Inter-Well Capacity. The pressure response to the treatment would seem related to the well’s pre-treatment injectivity. Comparing the total treatment volumes for all wells on the SPI bbl per pre-treatment Injectivity and on the SPI bbl per Inter-Well Capacity bbl basis is given in Table 10. Note that Well #2 injectivity and capacity values were taken as a 1.6 multiple of Well #1 based on a pre-treatment injectivity tests performed.

DE-FE0005958 Final Technical Report
No proprietary or classified information, or any information subject to export control are included in this report.
38
It is not known what the ideal treatment volume would be from this information, however from Tables 9 and 10 it can be seen that, based on a comparable inter-well capacity basis, Well #3 (lowest injectivity of all wells) was highly over-treated, while Well #2 (producer and highest injectivity well treated) was the lowest treated well. Well #5 (prematurely stopped) and Well #6 (stopped with last of chemicals) were slightly under treated, as compared to the other wells. Any treatment size evaluation will need to include evaluation of the treatment pressures and offset responses to those treatments. No comparison of the pressure response to either well factor was performed due to the system cleanliness issue, possibly affecting pressure more than the chemicals. Figures 27 and 28 show the injection pressures versus cumulative injected volumes during each SPI treatment. Both pressure and injected volume axes are normalized/ zeroed to the time/ conditions where the SPI gels first hits the formation face or wellbore mid-perforations (about 20.4 bbls after start of SPI pumping for both fields). This normalization mostly takes out the different densities and pressure losses in the wellbore of the non-SPI fluids. It shows any increased friction in the wellbore, viscosity effects and chemical reactions after that time. It should be noted that post-treatment quality control showed that high concentration SPI density is closer to 1.07 gm/cc than the 1.04 expected prior to the field treatments, affecting calculated hydrostatic pressures. The types and volumes all buffers are considered proprietary and will not be given in detail herein. The formulations and concentrations of SPI gels are also considered proprietary and will also not be provided in this report. In these plots, it is interesting to note that SPI3, retreatment of Well #1, started to have a pressure response similar to the rapid response seen in SPI1, but apparently sufficient high pH volume was injected to remove (dissolve or push out of the way) that prior damage allowing the treatment to continue at a low pressure response the entire job. That lower pressure response would appear to match a fractured or very, very high permeability system, as expected. During SPI Treatment #2 in Well #2, severe cold weather occurred at about 700-1100 bbls cumulative injection that necessitated reducing injection rate and diluting certain chemicals. If heaters were available, then no reduction would be required. The remaining part of the treatment went smoothly until all chemicals were consumed. High volume treatments seen in SPI2, SPI3 and SPI9 occurred after all process problems (ie solids contamination, mixing procedures, etc…) were resolved and they occurred in high injectivity and high capacity wells.

DE-FE0005958 Final Technical Report
No proprietary or classified information, or any information subject to export control are included in this report.
39
Tab
le 9
.
DE-FE0005958 Final Technical Report
No proprietary or classified information, or any information subject to export control are included in this report.
40
Table 10. Comparison of SPI Treatment Volumes per Well Characteristics Basis.
Field A Geological Discussion Field A is located in the Mississippi Interior Salt Basin. It is part of the Eutaw sandstone series of reservoirs in Mississippi. The Eutaw reservoir consists of approximately 166 m (500 feet) of consolidated to unconsolidated marine sandstone, siltstone, and shale. Most production has come from fault-line traps on the flanks of faulted anticlines, but some of the production comes from domal anticlines with no faults. Production is primarily from structural fault line traps. Eutaw sandstone reservoirs have produced more than 299 million barrels of oil and 975 BCF of gas from 39 fields as of 1997. The Eutaw remains underdeveloped in parts of the basin (per Puckett).

DE-FE0005958 Final Technical Report
No proprietary or classified information, or any information subject to export control are included in this report.
41
Figure 27. Normalized Plot of Injection Pressure versus Cumulative Injection for all SPI Treatments. Volumes prior to zero are pre-treatment phases. End volumes are post-treatment phases.

DE-FE0005958 Final Technical Report
No proprietary or classified information, or any information subject to export control are included in this report.
42
Figure 28. Normalized Plot of Injection Pressure versus Cumulative Injection for all SPI Treatments- Focused on early times of treatments

DE-FE0005958 Final Technical Report
No proprietary or classified information, or any information subject to export control are included in this report.
43
Eight Eutaw fields along this fault trend have produced more than 45 million barrels of oil and 2.4 BCF of gas. Along the regional peripheral fault trend Eutaw reservoirs range from porous and permeable fine- to medium-grained glauconitic sandstones to less permeable silty-marine sandstones and siltstones that thin and grade down dip into shales. The sandstones range from continuous and easily correlatable to discontinuous and lenticular. These reservoirs are primarily productive in the southern or southwestern portion of the Mississippi Interior Salt Basin. The local structural fabric was produced by halokinesis. Halokinesis has produced a complex array of structures in the northeastern Gulf of Mexico region (per Martin) which include features such as pillows, anticlines, diapirs, domes, and extensional fault and half graben systems. These features serve as principal petroleum traps in the northeastern Gulf of Mexico region. Field A is a large salt-cored anticline that is divided into western and eastern segments due to subsequent faulting. Most of the past and current production comes from the Eutaw, Selma Chalk and Christmas sands at depths from 3,500’ to 5,000’. Geological assessment determined significant heterogeneity in the Eutaw Formation, and documented relatively thin, variably lithified, well-laminated sandstone interbedded with heavily-bioturbated, clay-rich sandstone and shale. A core taken from of the Cook-McCormick well in East Heidelberg with petrographic analysis reveals that quartz overgrowths are more abundant in sandstones without oil than those with oil. Oyster shells are found in the core, and calcite cement associated with those shells can completely occlude porosity, however, calcite cement is never present in sandstones with oil, even when shells are present. The Stanley zone contains glaconite and siderite which are nearly ubiquitous. This poorly crystalline, iron rich clay may be problematic in CO2 floods. The possible reactions with CO2 have never been investigated. The pore and throat spaces are 10-20 μm diameter. A three-dimensional image showed the pore and throat network of a dry Stanley sandstone sample. It was constructed at the Mississippi State University High Performance Computing Collaboratory. The cross sectional image is approximately 4 x 4 x 4 mm (per Schmitz).
Depositional environmental analysis indicates that there are 4 types of sands. They are Distributary Mouth Bar, Shallow Marine Shelf/ Interridge, Tidal Sand Ridge, and Shallow Marine Shelf. Field A Reservoir Discussion The main formation consists of tight sandstone layers with very high permeability contrast, 1463 meters (4800 foot) depth (our treated wells closer to 5000 foot mid-perf), large field with 122 production wells and 47 injection wells, 28% porosity, 300 milli-darcies. The CO2 flood recovery method is based on an immiscible gas process.

DE-FE0005958 Final Technical Report
No proprietary or classified information, or any information subject to export control are included in this report.
44
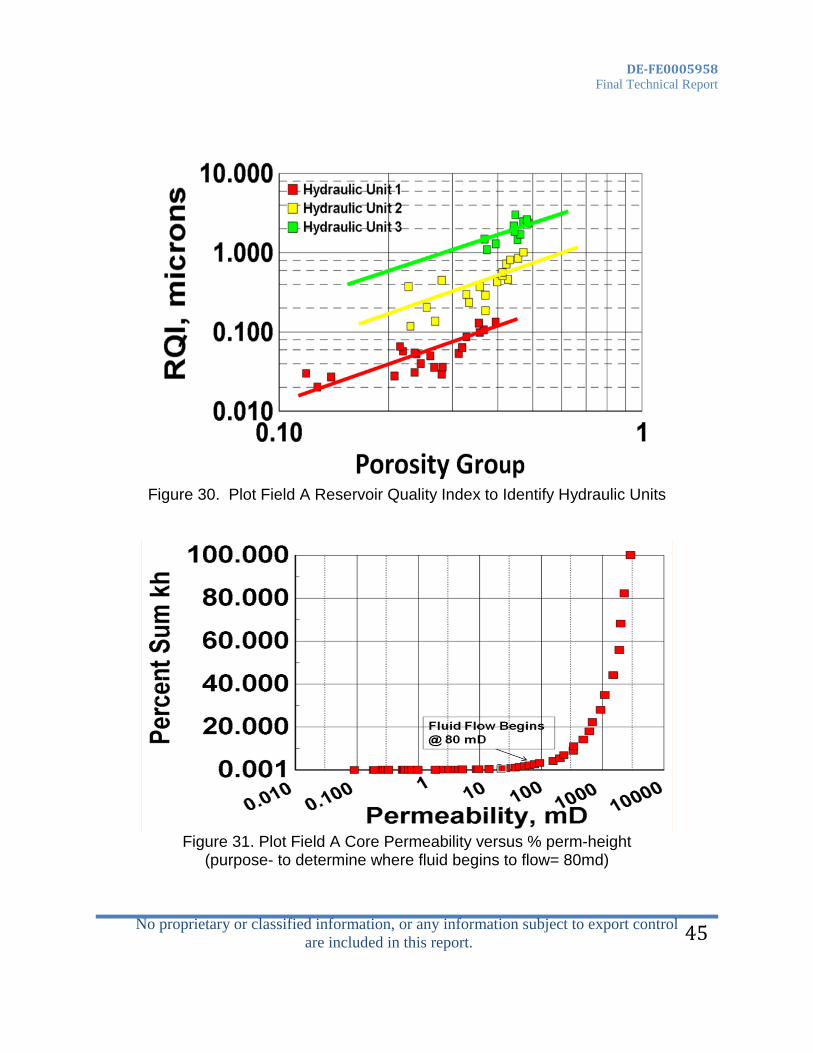
Dr. Felber’s took the Field A core data and analyzed it using reference- “A Systematic Laboratory Core And Fluid Analysis Program For The Design Of Cost Effective Treatment And Cleanup Guidelines For A Produced Water Disposal Scheme”, SPE 35369, with authors Ohen, Nnabuihe, Felber, Ososanwo and Holmgren. In this analysis she used the Kozeny-Carman equation to determine the Reservoir Quality Index and Porosity Groups that showed that there are 3 hydraulic units dispersed throughout the cored wellbore. Her analysis is shown in Figures 29- 33. Overall, this study showed that the field is very heterogeneous based on Dykstra-Parson’s ratio of 0.97 and Lorenz coefficient determinations of 0.95.
Figure 29. Field A Permeability versus Porosity from Core Analysis
Inter-Well capacity numbers were studied for several patterns in the field. Figure 33 shows a given Field A area pattern with response times determined from injection/ production plots. Wells completed in different zones are color coded- pink versus green. Note the fracture system in the area. Note that the fastest time was along a fault line while the closest well (550 feet) took the longest time to respond- possibly because it is completed in a non-injected zone. At an injection rate of 800 bpd, these response times (unallocated by contribution) indicate inter-well capacities of 9,600 bbls (12 days), 31,200 bbls (39 days) and 52,000 bbls (65 days). One Field A engineer stated that “there are potentially ten zones in this field. There is certainly the potential for significant cross-flow between wells between zones. It is extremely difficult to accurately track these issues with proper diagnostics, but that is what we are trying to do. “ In addition, a company geologist noted that they do not know if any given fracture in the reservoir is sealing or not. There were no inter‐well tracer surveys run in the field.
DE-FE0005958 Final Technical Report
No proprietary or classified information, or any information subject to export control are included in this report.
45
Figure 30. Plot Field A Reservoir Quality Index to Identify Hydraulic Units
Figure 31. Plot Field A Core Permeability versus % perm-height
(purpose- to determine where fluid begins to flow= 80md)

DE-FE0005958 Final Technical Report
No proprietary or classified information, or any information subject to export control are included in this report.
46
Figure 32. Plot of Field A Permeability Distribution
Figure 33. Plot of Field A Capillary Pressure by Depth and Brine Saturation
90 50
1000
10,000
100

DE-FE0005958 Final Technical Report
No proprietary or classified information, or any information subject to export control are included in this report.
47
Field A Well Discussion Field A wells were first drilled in 1944 with many new directionally drilled wells in the 2011-2013 time period. Both selected wells to treat in this field are newly drilled directional wells and are completed in one or more of the three zones described above. They were previously water-flooded and much later / more recently placed under carbon dioxide injection. All wells considered for treatment had high CO2 injectivity of 8 psi/ MCFPD of CO2 and very high 20,000+ bbls high inter-well capacity. The CO2 flood is non-miscible. Most production wells are forced flow, with some gas lifted and hydraulic long-stroke pumps. Doubtful that any gas is at the perforations or near-bore /in formation in Field A production wells.
Figure 34. Field A Structure Map of one pattern with Response Times shown.
Red triangles=injectors;Round=producers with different colors indicating different zones. Distances between pattern wells in Field A are highly variable, see Figure 35. There is no specific pattern due to the highly fractured reservoir. Many wells were reviewed but we selected and twice treated an injector (Well #1) in the northern part of the field, see Figure 36, that was isolated in ( i.e. only open in) the TR zone. We then selected a producer (Well #2) in the southern part of the field that was open in all the lower zones and later treated it with SPI gels (SPI2). These 2 treated wells were at far ends of the

DE-FE0005958 Final Technical Report
No proprietary or classified information, or any information subject to export control are included in this report.
48
field, in different zones and would thus not interfere with each other. Water injectivity tests at various rates with a downhole pressure and temperature sensors for both Field A’s Well #1 and Well #2 are shown in Figure 36. Notice that Well #2 has a much higher water injectivity than Well #1- on the order of (Well #1 pressure 2800 psi /Well #2 pressure=1800 psi)= 1.6 times higher at 1 BPM.
Figure 35. Field A Map showing Distances between Wells in one pattern

DE-FE0005958 Final Technical Report
No proprietary or classified information, or any information subject to export control are included in this report.
49
Figure 36. Field A Structure Map showing Well #1 and some Offset Production Wells
Figure 37. Comparison of Field A’s Well #1 and Well #2 Water Injectivities

DE-FE0005958 Final Technical Report
No proprietary or classified information, or any information subject to export control are included in this report.
50
Field A Well #1 SPI Treatments Well #1’s location was shown in Figure 36. Its well construction schematic is given in Figure 38. Notice that this well is only completed and injecting into the top TR zone, i.e. only one 6 foot interval taking fluid. Therefore, except for cross flow in and behind wells and in fractures, only offset production wells completed with this specific zone open would respond to the SPI treatments performed. Figure 39 shows Well #1’s’ open hole logs and 2 prior period profile logs before it was recompleted into only the TR zone. Field A’s high injectivity (allowing high treatment rates) and inter-well capacities (high treatment volumes anticipated), use of Operator A’s triplex high rate water pump, use of Operator A’s rented 500 bbl square frac tank for water storage and their pumped fresh water from nearby supply wells determined that the slipstream method was optimal for Field A treatments. Well #1’s historical injection plot (rate, wellhead pressure and calculated injectivity) into early 2014 is given in Figure 40. Stars show when the two SPI treatments were performed- SPI1 injected 950 bbls of SPI mix on 6-11 November 2012. At the request of the operator to lowr the injectivity further, SPI3 injected 3842 bbls of SPI mix on 23-28 February 2013. Previous Table 9 and Figure 28 reported these treatments, but the results of these treatments can be seen in Well #1’s injectivity in Figure 40 and offset production well data in Figures 41 and 42 (oil rate, BOPD) and Figures 43 and 44 (GOR).

DE-FE0005958 Final Technical Report
No proprietary or classified information, or any information subject to export control are included in this report.
51
TOC @ 300', Strong to 3900' (CBL 4/07)
11" hole
2 7/8" tbg
1.875" X Nipple @ 5029'PermaPkr Nickel plated @ 5032'1.875" X Nipple @ 5040'1.875" XN Nipple @ 5047'WL guide @ 5047'
EUTAW PERFS:
5,096- 08' Travis5110' Sand Plug5,138 - 47' CB 15,154 - 60' CB 25,163 - 68' CB 35,178 - 86' CB 4
5,205 - 222 Stan 1
7 7/8" hole
TD @ 5438'
Field A Well #1
ETOCWeight Grade Threads Top
Directional Well
8 5/8" 24# J-55 8rd
Bottom CementSize0'
J-55 0'8rd0'5 1/2" 15.5# J-55 8rd
IPC tbg5047'
WELL HISTORYTUBULARS
16" 55# F-25 8rd
2 7/8" 6.5#
40'0' 509' 175 sks
5438' 945 sks
API # 23-061-210190100
4/18/07 - Spud6/19/07 - Completed
4/07 - Tag at 5393'. Ran CBL and perforated Travis perfs 5100-06'. Set anchor and run 2" insert pump.
7/10 - Tag bottom @ 5300'. Test csg to 500 psi - OK. Ran csg insp log. Perf St 1: 5205 - 22', CB 4: 5178 - 86', CB 3: 5163 - 68', CB 2: 5154 - 60', CB 1: 5138 - 47', TV: 5096 -08'. Set pkr w/ pump out plug in at 5030'. Ran new IPC tbg. Test to 500 psi for MIT.
11/11 Set sand plug @ 5110'. Ppd gell treatment, see file for amount of water and gel ppd.
Figure 38. Wellbore Schematic for Field A, Well #1 Injector

DE-FE0005958 Final Technical Report
No proprietary or classified information, or any information subject to export control are included in this report.
52
Figure 39. Well #1 Openhole Logs and Production Profile Logs pre-SPI treatments
Figures 40 - 44 below (unlabeled due to lot sizing and page space) are for Field A, Well #1 Treatment Evaluation Plots, of Well #1 and its offset producers (BOPD, GOR):

DE-FE0005958 Final Technical Report
No proprietary or classified information, or any information subject to export control are included in this report.
53
Field A, Well #1 Historical Plot

DE-FE0005958 Final Technical Report
No proprietary or classified information, or any information subject to export control are included in this report.
54

DE-FE0005958 Final Technical Report
No proprietary or classified information, or any information subject to export control are included in this report.
55
A discussion of the response on each Well #1 offset production well follows: 771- Open in all zones (TR-EUT-ST). North 1540 feet and downdip of Well #1. No oil
response seen from the treatments. Pre-SPI1 the well had moderate GOR rise, but flatter rise after the SPI1 treatment. Minor value and not counted.
772- North-north-west 850 feet and downdip of Well #1. Open in all zones until Feb 2013 when the ST (lowest) zone was mechanically plugged off (with a thru tubing plug in casing) between the SPI1 and SPI3 treatments in the TR zone in Well #1. The oil rate had a strong decline prior to the SP1 treatment and flat trend afterwards. The mechanical workover in Feb 2013 did cut off some gas, but did not change the oil production rate or trend. This indicates that the affected gas was coming from the ST zone and the oil was and is coming from the upper TR and EUT zones. The later SPI3 treatment (also in Feb 2013, but 15 days after the mechanical workover) did not change the oil or gas rate or trend, but may have extended the beneficial oil rate. The gas reduction will not be claimed as a benefit to the SPI treatments, however the incremental oil production benefit started before and maintained it through the Feb 2013 workover and can be

DE-FE0005958 Final Technical Report
No proprietary or classified information, or any information subject to export control are included in this report.
56
claimed. This value is estimated at (9855 bbls over 1 year period less 180 bbls as pre-SPI1 treatment base = 8055 bbls net incremental, at $90/ bbl)=) $724,950.
782- North-East 650 feet and updip of Well #1. Closest producer to Well #1. Open in EUT only the full evaluation time period. Highly variable oil rate and GOR during full period, to such an extent that the impact of the Nov 2012 SP1 treatment could not be seen, if it occurred. The well was shut-in with a high GOR just prior to the SP3 treatment.
783- North-East 1250 feet and updip of Well #1. Open in EUT only the full evaluation time period. Steep oil rate decline prior to the SP1 treatment in Nov 2012 was seen with some possible stabilization (still highly variable) afterwards. It was shut-in just before the SP3 treatment with a 246 GOR before the new oil and gas trends could be determined.
791- South-East 975 feet and updip of Well #1.Open in All zones (TR-EUT-ST) prior to and immediately after the November 2012 SPI1 treatment. The pre-treatment oil rate trend was in a steady, but very steep decline. Two months after the SPI treatment the trend reversed, but the well was shut-in in Feb 2013 with a declining GOR, just prior to the requested second SPI treatment-SP3 on its offset injector. Therefore no lingering benefit on this well can be determined. The well was reworked to isolate the TR zone (resulting in EUT-ST zones producing) in April 2013 with no benefit in oil rate, but achieving a lower GOR.
792- North-East 1250 feet and updip of Well #1.Open in All zones (TR-EUT-ST) for the full evaluation period. Prior to the first SPI treatment it had a fairly flat oil trend and a steadily rising GOR trend. Both SP1 and SP3 treatments initially impacted the GOR, but it returned to an even flatter GOR then a declining GOR post treatments. The oil rate took a big jump (80 BOPD up to about 125 BOPD) after SP1 then declined back to 92 BOPD. This added 870 bbls incremental oil for a value of $78,300. However, within 1 month of SP3 the rate declined and held very flat and steady for the rest of the year. It is not known if the treatments kept this oil rate so steady for so long.
6133- South-East 3150 feet, up-dip and along a fault line with Well #1. This is the furthest monitored producer from Well #1. Open in all zones prior to May 2013, when the TR zone was isolated, leaving only EU - ST open. Due to the highly variable oil and GOR trends, it cannot be determined if SP1 and SP3 had any impact on this well. Prior to being shut-in, the SP3 treatment may have flattened out the GOR, but too little time was allowed to verify that impact. That result of that mechanical well was a lower oil rate and no impact the high and variable GOR. The well work in 6133 also negatively impacted its offset 6134 production well, evident only by concurrent timing.
6134- South-East 2200 feet and updip of Well #1. Open only in TR-EUT zones for the full evaluation time period. This well is across a fault from the SPI treated Well#1. It is not known if the fault is sealing or a flow conduit. The pre-SP1 oil rate was

DE-FE0005958 Final Technical Report
No proprietary or classified information, or any information subject to export control are included in this report.
57
stable at about 35 BOPD, but jumped to 65 BOPD at 2 months after the SP1 treatment in Well #1. The oil rate also increased after the SP3 treatment. The oil rate then declined to 52 BOPD for 3000 bbls incremental oil for $270,000 increased value until May2013 when the rate abruptly dropped, possibly due to the offset 6133 well work. The SP1 and SP3 treatments may have also flattened the well’s GOR trend, but insufficient data was obtained since the GOR got significantly worse after the offset 6133 workover to isolate the TR zone.
7163- South-East 2310 feet, near strike and along a fault line with Well #1. Open in All zones until May2013 when both the TR and ST zones were isolated, leaving only the EUT zone open. Prior to the offset SP1 treatment the oil rate was steadily declining and the GOR was rising strongly. After the SP1 treatment the oil rate was flat and stable and the GOR was immediately converted to a downward trend- until the May 2013 workover. The larger SP3 treatment had only a minor apparent impact on this well. The estimated incremental value of the treatments impacting this well is 2340 bbls for $210,600 at $90/bbl. After the workover the oil rate increased slightly with an increase in the GOR variability, but no overall change in the GOR level.
Total response value attributed to the two SPI treatments in just Well #1, even with truncated evaluation periods in some wells due to offset well work, is estimated at up to 14,264 incremental barrels of oil for an estimated maximum value of $1,283,800, and calculated at $90/bbl oil. However, such a field is a complex mixture of geology, wellbores and continuing surface operations. It is difficult to know how much of this benefit is due to the SPI treatments or to other operational changes. It is sufficient to point out that just these 2 treatments (and mostly just SP1) had a significant impact on the Field A’s performance in this area, sufficient to justify the price of such treatment(s). It is interesting to also note that the large SPI3 re-treatment in Well #1 was pumped at a relatively low pressure- which indicates that a very, very high permeable zone was taking it. SPI gels set with CO2 contact, so unless the SPI mix went into a water zone, it set hard and is blocking some of that flow path. Because of the higher volume injected it could have traveled a long distance along a fracture and be affecting wells outside of the monitored area. Field A, Well #2 SPI Treatments Well #2 in Field A is located in the southern-most part of the field in a highly fractured area, see Figure 45. It is not known if these faults are sealing or not, but the very high injectivity (1.6 times higher than Well #1) would indicate they provide a good flow path to an unidentified injector(s). This was and is a forced flow well with a packer installed, as seen in Figure 45 in the well schematic. It was shut-in prior to the SPI treatment due to excessive GOR- over 400 Mcf/ BBL and was reactivated just for this field test. It was

DE-FE0005958 Final Technical Report
No proprietary or classified information, or any information subject to export control are included in this report.
58
our project ‘Hail-Mary’ well. An injectivity test is shown in Figure 47 that confirms that it is the highest injectivity well of all treated in this project. Its 4349 bbl SPI2 treatment was described in prior Figures and Tables. It is important to note that the SPI gel was initiated with a strong acid on the tail end (nearest the wellbore). This initiation method is not as effective as using CO2, but IT DID WORK. Figure 48 is the production history of this well with the timing of SPI2 shown as a light green star. The prior-treatment declining oil rate was stabilized. The prior-treatment increasing CO2 / gas production rate immediately dropped 66% and stayed flat as GOR immediately dropped 81%. However, by the end of 1 year Well #2’s GOR was back to its pre-treatment level.
Figure 45. Field A Structure Map showing Well #2’s location.

DE-FE0005958 Final Technical Report
No proprietary or classified information, or any information subject to export control are included in this report.
59
DIRECTIONAL HOLE
11" Hole
2 7/8" IPC tbg
Bottom Hole Assembly13 chrome X Nipple PermaPac Pkr Ni plated @ 4870'6' pup Ni plated13 chrome X Nipple 6' pup Ni plated13 chrome XN Nipple Pump-out plug/WL guide Ni plated
Eutaw Perfs:4,943' - 60' TR
5,042' - 60' ST 15,074' - 84' ST 25,089' - 5,107' ST 35,116' - 19' ST 45,124' - 41 ST 5
7 7/8" HolePBTD @TD @ 5393'
Field A Well #2
WELL HISTORYTUBULARS
16" 75# J-55 0' 40'
BottomSize
5 1/2" 17# J-552 7/8" 6.5# J-55 8rd
0' 5392' 805 sxsIPC tbg w /Pro KC0'
3281'
ETOCWeight Grade Threads Top Cement
760 sxs circ8 5/8" 24# K-55 0'
API # ###############0
Spudded 03/25/11 Completed
2/11 - Drilled well to 5393'. Ran CBL and perforated w/ 4 spf, 60o
phasing. Completed as CO2 driven producer w/ Ni plated permanent packer and TK-99 IPC tubing.
Figure 46. Wellbore Schematic for Field A, Well #2 Producer
The value of the response of the Well #2 SPI Treatment is estimated at 1,465 bbls of incremental crude oil recovery over the prior treatment decline trend for a value of $131,400 (at $90/bbl oil price). The deferred 600 MCFPD CO2 gas not produced in this well had to go somewhere else, hopefully to contact and moving crude oil that otherwise would not be recovered.

DE-FE0005958 Final Technical Report
No proprietary or classified information, or any information subject to export control are included in this report.
60
Figure 47. Field A, Well #2’s (Production Well) pre-SPI Treatment
Water Step Rate Test with bottom-hole pressure/ temperature bomb/ sensor.
Figure 48. Field A, Well #2 Production History (with SPI2 shown as a green star).
Field A, Well #2

DE-FE0005958 Final Technical Report
No proprietary or classified information, or any information subject to export control are included in this report.
61
SPI Treatments in Field B Field B Geological Discussion The San Andres dolomite in west Texas is very large and well known. Many SPE papers on the San Andres have been published- SPE#12015 “Comprehensive Geological and Reservoir Engineering Evaluation of the Lower San Andres Dolomite Reservoir, Mallet Lease, Slaughter Field, Hockley County, Texas” by authors Behm E.J., Ebanks W.J., in 1983. Other literature for CO2 floods in this zone are- SPE#11987, 13132, 17349, 20377 and 35189 - all provided in the bibliography. Field B Reservoir Discussion This field is on a 5-spot up to a 9-spot pattern. This is a long established and mature miscible CO2 flood that is under Water-Alternating-Gas (WAG) operation now. There was a 2011 study of problem conformance problems in the field that was made available to Impact for aiding in understanding the field and in selecting wells to treat. The dominate flow path is northwest to southeast, possibly due to early fracturing, but all wells identified for SPI treatment had a strong trend for injection to flow towards the southeast. Most all production wells utilize beam pumping units with fluid levels that are not pumped down. Well CO2 injectivities in this field are about 1/8 or less than what was found in Field A, as well as much lower inter-well capacities. Field B Well Selection Our advocate engineer(s) also wanted to also treat a producer, but safety concerns required that a 900 foot temporary steel CO2 line to the well be laid, welded and buried which would take 6 months, leaving no time to treat the well and measure the outcome in remaining time of the project. We looked at hauling CO2 by truck and pumping it into the well, but the cost to do that was almost $100,000, so that effort was stopped. Also, in Field B we took a different path in selecting the wells to treat since the developed flow paths were so well defined. We initially selected two wells in the same zone and that were in adjacent patterns. In Field B we initially selected 2 injection wells (Well #3 and #4) with the lowest injectivity of the group of wells provided and are shown in the map in Figure 49. Note that all these wells were all in the same basic zone and were basically neighbors- about 900 feet on average from injector to producer. Left over SPI chemicals from the first 2 well treatments allowed treatment of the higher injectivity back-up wells, which was fortunate. Without a tracer survey before and after, and as close as the wells are, it is doubtful that we will exactly know which treated injection well impacted any given change in offset production wells. These are old wells that may have paraffin and oil carryover in the wellbore or deposited on the formation near the wellbore. This may need a stronger cleanup plan prior to SPI treatments. Core material and core analyses were obtained. Well logs and injection

DE-FE0005958 Final Technical Report
No proprietary or classified information, or any information subject to export control are included in this report.
62
profile logs over time were obtained as well. Field B’s low injectivity (indicating lower treatment rates) and lower inter-well capacities (indicating lower volumes) on the initial wells offered the use of the batch treatment method using Impact’s injection triplex pumps. Equipment for low pressure inline mixing and in-tank heating (to avoid cold weather pumping problems) were also designed and built, but not utilized to date.
Figure 49. Field B Map showing Location of all SPI Treated Injection Wells
Figures 50 to 53 (un-labeled) below are injection well historical plots of all treated wells showing rate (blue), wellhead pressure (red-brown) and the calculated injectivity (green). Red / blue arrows at the top show the treatment dates. These are WAG injection wells (except Well #5 that had only water injection due to earlier high gas breakthrough) so the lower set of rate/pressure values are (most likely for) water injection and the higher set is for CO2 injection. After SPI treatments, only CO2 gas was injected for many months, until the normal WAG process was restarted. Note that the field supply of CO2 is always short and needs to be spread out (by alternating with water to maintain pressure) to many wells. It should be noted that near the beginning of the SPI treatments the area gas processing plant went down for maintenance, but Operator B tried to keep that even more limited CO2 supply going into this area uninterrupted.
A change in injector injectivity, increase in offset oil production or decrease in offset

DE-FE0005958 Final Technical Report
No proprietary or classified information, or any information subject to export control are included in this report.
63
GOR were desired as an outcome of these treatments. One engineer previously associated with this area said that responses in this field take up to 7 months- we only have about 4 months to date to evaluate. The change in injectivity in these Field B injection wells was varied but can be seen in the following discussion and plots (Figures 50-53 unlabeled)-
Well #3 (SPI4 and SPI6) injector responded immediately to the SPI treatments and continues to demonstrate a reduced injectivity, especially considering the length of time that it has been on CO2. Previously connected to producer A039.
Well #4 (SPI5 and SPI8-water only) initially showed a lower injectivity but has since gone back to its prior injectivity trend. This and another injector are connected and feed the targeted producer. The other injector was shut-in during this treatment. It might be best to slowing inject CO2 to ensure a SPI gel set at the flow path junction. Previously connected to producer A049.
Well #5 (SPI7) had not been on water injection only for many years due to a strong breakthrough problem gassing out offset producers when injecting CO2. The treatment definitely had an impact on the well’s injectivity as it is lower than other nearby injectors. Previously connected to A057.
Well #6 (SPI9) well injectivity changed in early 2013 with CO2 injection. Unknown if CO2 injectivity has changed. No information on previously affected connected producers. Highest injectivity well that was treated in this field.

DE-FE0005958 Final Technical Report
No proprietary or classified information, or any information subject to export control are included in this report.
64
Well #5, SPI7 Treatment

DE-FE0005958 Final Technical Report
No proprietary or classified information, or any information subject to export control are included in this report.
65
Figures 54 to 56 below (un-labeled) show the treated injectors’ offset producers historical plots (oil rate, GOR and WOR) since January 2013. Insufficient data has been obtained since the treatments to evaluate their impacts, however a few potential trend changes have been identified-
• Increase in oil production rates over prior trending- Producers A027, A031, A034, A044, A197, A198, A360.
• Changes in GOR over prior trending- Producers A052, A060, • Reductions in water rates over prior trending- Producers A057, A198
All wells will continue to be studied to cover the agreed 1 year time monitoring period.

DE-FE0005958 Final Technical Report
No proprietary or classified information, or any information subject to export control are included in this report.
66

DE-FE0005958 Final Technical Report
No proprietary or classified information, or any information subject to export control are included in this report.
67
SPI Treatment Costs and Market
The total cost of SPI treatments in this project was about $120/ bbl of SPI mix pumped. This included non-reoccurring CTI / Redcorn research, DOE reporting, overhead, designing and construction/ fabricating equipment costs. It also included non-optimal mobilization, setup/ teardown and water/ chemical delivery methods field costs, as we were early on the learning curve. It does include almost all high concentration SPI chemicals in all field project treatments, which lab tests shows may not be needed. It did include the standard 24/7 mixing and pumping operations and chemicals. Significant cost was expended in cleaning up dirty tanks, tankers and wellbores, which can be reduced or eliminated in moving forward into commercialization.
Taking out the non-reoccurring costs of about $80/bbl brings the SPI treatment cost down to about $40/bbl. Reducing or improving the mobilization, setup/teardown, delivery and tank/ well cleanup costs, but adding back into that total equipment depreciation, marketing costs and profit brings the estimated SPI treatment cost to about $25/ bbl.
Obtaining multiple (both concurrent/ parallel and in series) well treatments in a given area/ field, optimize chemical deliveries, determine optimized SPI concentrations less

DE-FE0005958 Final Technical Report
No proprietary or classified information, or any information subject to export control are included in this report.
68
than ‘high’ and additives for a given field, order higher chemical volumes for improved discounts and obtain improved personnel training can lower the commercial cost further to below $20/bbl. Imbedding SPI operations with the field personnel and their operations can further reduce costs due to improved efficiencies with multi-well packages.
Investing in water and chemical delivery trucks/ drivers and personnel OR making dedicated agreements with national or regional chemical trucking companies can bring the cost down further.
The above cost estimation is only for injection wells estimated at 8,638 injection wells in USA CO2 floods (per Oil and Gas Journal, April 2014, pages 81-82). If only 10% of those wells are treated every year with an average of only 2000 bbls/ treatment at $20/bbl SPI mix, that represents an annual SPI services market of $34.6 million.
This leaves out the most beneficial SPI treatments possible treatments in the 12,980 production wells in CO2 floods in the US only, not including a significant number in Canada. With an estimated added treatment cost of $10/bbl of SPI mix, these wells could be treated and would show immediate benefits (lower GOR, higher oil rate without decreasing field CO2 injectivity) to the operator without the risk of losing field injectivity or increasing CO2 system pressure unnecessarily. Under the same 10% condition, this would increase the annual market of SPI services by $78.8 million to $113.4 million total. This could be accomplished by concentrating key personnel and equipment in only 2 field locations, plus Houston for sales/marketing, engineering/design and back office activities.
Comparison of SPI Gels to Other Conformance Gels
Both operators had a variety of prior conformance gel treatments in the treated wells, as well as nearby offset injectors, that they were willing to share. Operator A performed a 4180 bbl Tiroco MarcitTM Treatment in Well #1, Field A in 2011. They planned to inject a total of 10,000 bbls, but terminated injection due to pressure increases greater than expected. This MarcitTM treatment was identified in the earlier Figure 40, but is given again for convenience in Figure 57 below, and because it is so descriptive of the results difference to SPI gels. The sum of both SPI1 and SPI3 treatment volumes on this same well totaled 4792 bbls, or about the MarcitTM treatment volume. Detailed description of the Marcit product and that specific treatment are given below. It is important to note that the pressure response of these treatments was about the same. However, as seen in Figure 57, the impacts or results are just the opposite-The MarcitTM treatment had no effect on the Well #1’s injectivity nor on any offset producer. Both SPI treatments had demonstrated CO2 injectivity decreases and demonstrated positive impacts in offset producers.

DE-FE0005958 Final Technical Report
No proprietary or classified information, or any information subject to export control are included in this report.
69
MarcitTM is an acronym for Marathon Conformance Improvement Treatment. Generally these treatments are composed of a polymer with an internal cross linker. They are mixed and pumped in fresh water. Marcit gel is formulated with a medium molecular weight anionic polymer. It is resistant to H2S, CO2, high TDS and is viable to 210oF. The gel treatment for Well #1 was made-up of 3,844 lbs of EOR 204 (polymer) and 805 lbs of EOR 684 (crosslinker). The company report stated that the polymer/cross-linker ratio was 40:1.
Operator A’s Well #1 completion information for the Marcit treatment-
November 10, 2011 Rig up to dump 2250# 20/40 sand and 400# 100 mesh sand to cover lower perfs in preparation of Marcit treatment. TR zone only exposed. Note that no completion change was made to Well #1 after this Marcit treatment and thus the SPI treatments treated the same zone.
November 10, 2011 Marcit treatment preparation- moved in 4 frac tanks and fresh water
November 14, 2011 Moved in Tiroco pump equipment. Began pumping buffer November 15, 2011 Began pumping Marcit gel treatment November 19, 2011 Completed pumping Marcit treatment
Operator A’s Well #1 Marcit Treatment Summary The goal was 10,000 bbls of gel to be pumped. 500 bbls per flush. Actual pumped was- 200 bbl Stage #2 1500 ppm 64 bbls Stage #3 3000 ppm 1500 bbls Stage #4 1500 ppm 415 bbls Stage #5 1500 ppm 30 bbls Stage #6 Water Flush 1592 bbls Stage #7 3000 ppm 309 bbls State #8 4500 ppm 100 bbls Stage #9 Post flush 4810 total bbls in job= 4180 bbls with polymer and 630 bbls water flush.
In 2012 operator B performed a comprehensive review of conformance problems in Field B and shared that report with Impact. It is noted that Impact did SPI treatments on 3 injection wells (Wells #3, #4 and #5) that were deemed needing “urgent” remedy for conformance issues in that study. That study included 28 conformance treatments in the field that were performed between 2006-2011 that included generic ‘gel jobs’, PolycrystalsTM and foam cement. Tiroco and Eclipse were specifically listed as service providers on a few treatments. Only 4-5 jobs were noted to be successful, with a few others seen as marginally responsive to some level. Only Well #6 was not determined ‘urgent’ at that time and never had a prior conformance treatment, as reported in that

DE-FE0005958 Final Technical Report
No proprietary or classified information, or any information subject to export control are included in this report.
70
study.
Field B, Well #3 has had SPI treatments, a 2007 PolyCrystal treatment, a 2008 PolyCrystal treatment and an early 2010 gel job to combat a severe conformance issue with a producer to its immediate southeast. The PolyCrystal jobs had no effect while the gel job reduced water injectivity, but not CO2 injectivity. That 2010 gel job did adversely ‘increase the offset producer’s GOR and GLR and decreased runtime’ of the pumping unit, but apparently did not impact oil production either way. SPI treatments have had a significant impact on CO2 injectivity and we are monitoring offset producers.
Figure 57. Field A, Well #1 Injection History Plot showing both MarcitTM and SPI gel Treatments
Field B, Well #4 also has had prior conformance issues with a producer to the southeast and in 2010 an Eclipse gel job and in 2011 a Tiorco gel job were performed. Water injectivity changed only from these efforts. Also reported in the study –“Similar gas production’, ‘drastic run time decrease and higher GOR/GLR’ on the offset production well. The 2013 SPI treatment impacted Co2 injectivity and we are monitoring offset producers.
Well #5 had a gel job performed in 2010 with no resulting change in oil production or in run time of the offset producer, per the 2012 study. It was reported that Well #5 had the ‘same injectivity’ and no change in profile. It should be noted that the last steady CO2
Field Shut-in

DE-FE0005958 Final Technical Report
No proprietary or classified information, or any information subject to export control are included in this report.
71
injection in this well was in 2008, but it was turned on briefly to test the 2010 gel job, as it was for this SPI treatment in 2013-2014. There was no strong change identified in CO2 injectivity from the SPI treatment, but we are monitoring its long term response and its offset producers.
Table 11. Summary of Conformance Treatments in Field B, Well #3
SPI Mixing and Pumping Methods
From the laboratory and field tests we now think that the best treatment course with the unique SPI gel chemistry in CO2 floods maybe to perform multiple smaller volumes. This maximizes the immediate benefit of each barrel of SPI pumped. The exact optimal volume per treatment has not been established and will be different for each field and each well. This project helped identify and measure the criteria to set optimal volumes for different well characteristics.
Also from this project we now have developed and tested the methods to efficiently mix SPI solutions in the field. These methods are based on the chemicals desired, the form that they arrive in the field and at the wellsite, the rates expected for the treatment and the total volumes expected to be injected in that treatment. In all treatments with SPI solutions, the tanks / transports and wells must be clean. The SPI chemicals will clean down to the steel, not causing corrosion, but removing all scale, other deposits and loose coatings. To improve efficiency it is desired that all chemicals be offloaded directly

DE-FE0005958 Final Technical Report
No proprietary or classified information, or any information subject to export control are included in this report.
72
from transports to the pumps.
For large SPI volume (>1000 bbls) treatments at very high rates (>3bpm) we would use the slipstream mixing approach. This is where the desired water type is pumped at the treatment pressure and rate desired; chemical A would be added at the desired rate to match the incoming water rate and mixed with an inline mixer; chemical B would be added at the desired rate and mixed as before; repeated for each chemical for a final mix then going downhole. All chemicals would be added at treatment pressure and thus the pump and lines must all be rated for that pressure. We would utilize as much field brine as possible, based on lab testing, to lower the cost of hauling fresh water and any solids precipitation can help SPI gel formation and ultimate gel strength. A rental high volume triplex pump would be needed to achieve that higher treatment rates. SPI mixtures would be at high concentrations to match the corresponding high well injectivity. Impact’s smaller triplex pumps can be used to add the required chemicals at the right concentration to form the desired SPI mix. Also, internal initiators may be added to ensure gelation of the full injected volumes. Simple in-line mixers can be used to ensure full mixing before going downhole. Offsite mixing of some chemicals can be performed. Onsite personnel would be required 24/7 during pumping.
For large volume (>1000 bbls) treatments at low rates (down to 0.25 BPM), we can also use the slipstream mixing method, but would require fresh water for mixing. Impact’s smaller metering pumps would be required to add the chemicals. Impact’s 200-500 bpd triplex pumps can be used for the water injection. Mostly onsite mixing would be used for this method. No internal initiators would be used for these treatments.
For small volume treatments (<1000bbls) at high rate we would use a batch mixing system. This method is where the full SPI mix (sans initiator) would be mixed ahead of time and stored for later injection. If an internal initiator is desired, it would be added in a slip stream mode by an Impact triplex pump. A high rate rental triplex pump would be needed.
For all other well treatments in between these ranges, Impact will need to evaluate the options.
Figures 58 to 68 (unlabeled) show the various mixing and pumping configurations used in the field to-date. The Mississippi Well #1 and Well #2 SPI treatments utilized the slip stream method to meter, mix and pump the chemicals downhole. This is because of the high rates possible and the large volume anticipated as well as the Operator’s triplex pump and rental frac tank. All west Texas, Field B SPI treatments utilized a separate batch mixing with only a tank and pump (and monitoring RV) at each well’s location.
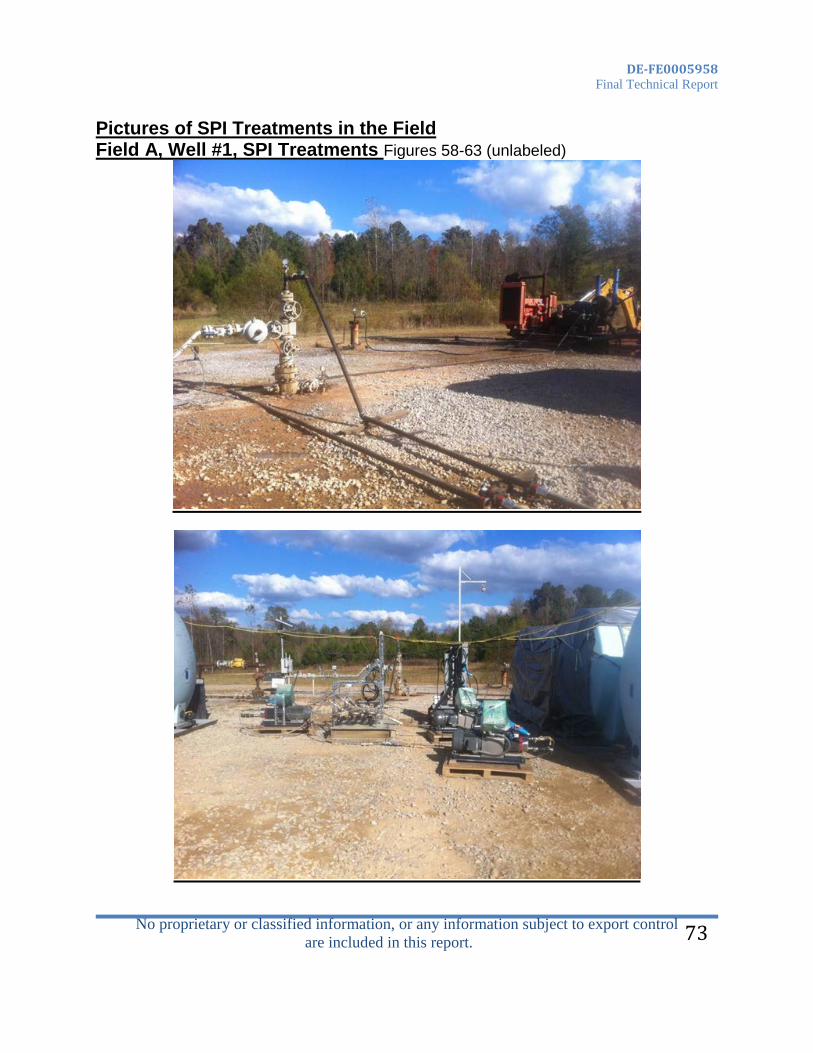
DE-FE0005958 Final Technical Report
No proprietary or classified information, or any information subject to export control are included in this report.
73
Pictures of SPI Treatments in the Field Field A, Well #1, SPI Treatments Figures 58-63 (unlabeled)
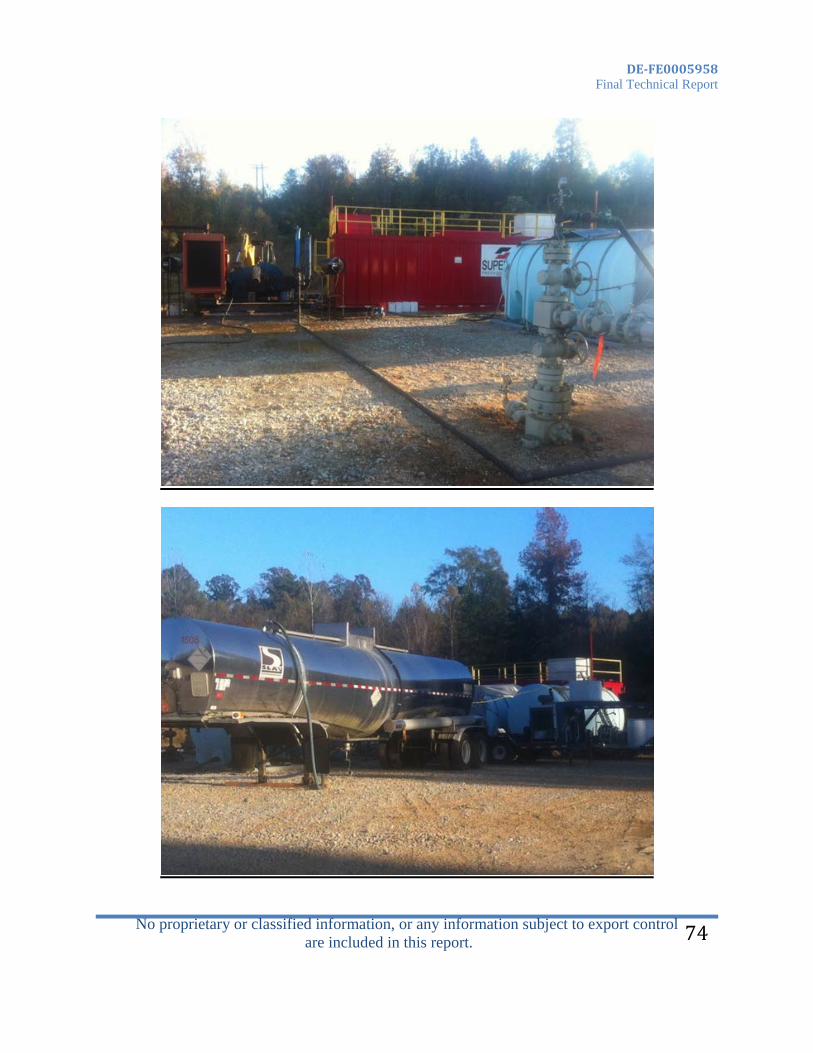
DE-FE0005958 Final Technical Report
No proprietary or classified information, or any information subject to export control are included in this report.
74

DE-FE0005958 Final Technical Report
No proprietary or classified information, or any information subject to export control are included in this report.
75

DE-FE0005958 Final Technical Report
No proprietary or classified information, or any information subject to export control are included in this report.
76
Field A, Well #2 SPI Treatment, central Mississippi, Figure 64-67 (un Labeled)

DE-FE0005958 Final Technical Report
No proprietary or classified information, or any information subject to export control are included in this report.
77

DE-FE0005958 Final Technical Report
No proprietary or classified information, or any information subject to export control are included in this report.
78
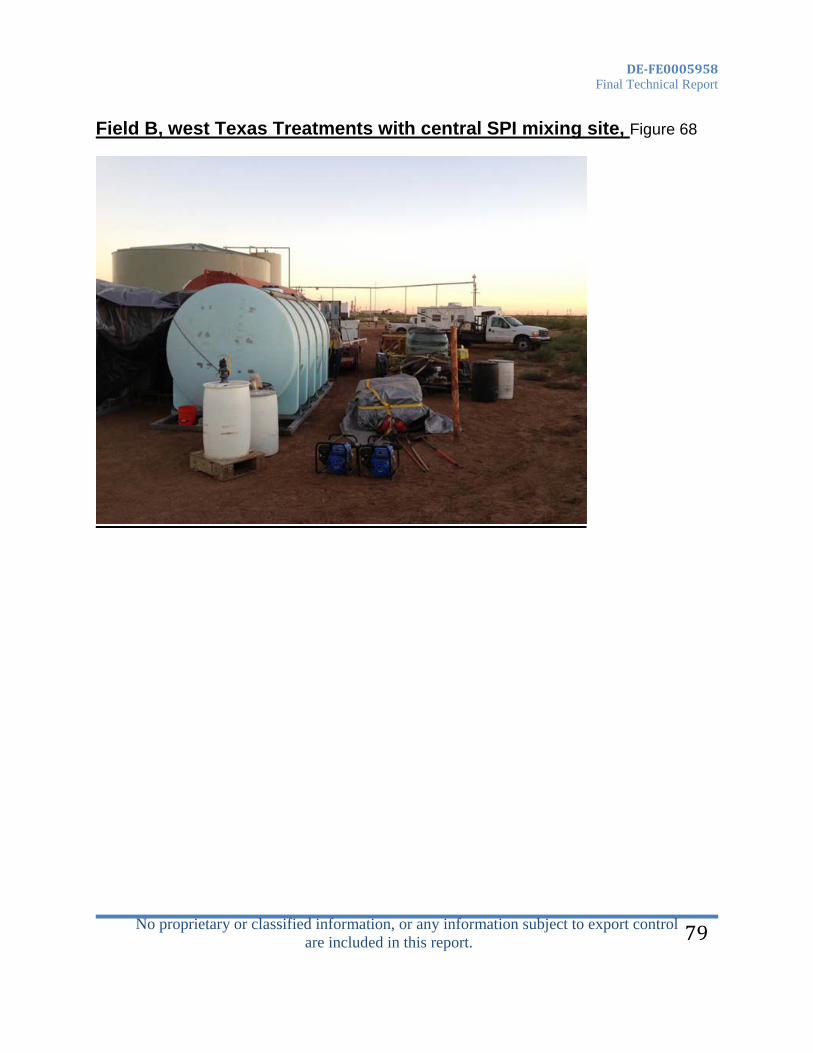
DE-FE0005958 Final Technical Report
No proprietary or classified information, or any information subject to export control are included in this report.
79
Field B, west Texas Treatments with central SPI mixing site, Figure 68

DE-FE0005958 Final Technical Report
No proprietary or classified information, or any information subject to export control are included in this report.
80
CONCLUSIONS This project has proven that SPI gels are unique and can provide conformance solutions for CO2 floods and wells that have difficult conformance issues. The detailed conclusions from this project effort are given in the categories of - SPI Gel Chemistry, SPI Field Treatments and SPI Commercialization. SPI Gel Chemistry • SPI gel chemistry is unique. It is a silicate based gel that is not a cross-linked gel
system. Its pH triggered gelation process and the methods to manipulate that process provide a wide range of formulations for various applications. All chemical components are environmentally friendly, with most of the base materials suitable for food grade. It is pumped at a near water-like viscosity and later sets to a very strong true gel.
• SPI mixtures can use internal initiators for a time/ temperature based gelation. The current internal initiators provide fairly short (minutes up to 36 hours) gel times based on temperature and concentrations of the mixture. However, with certain controls, there is strong evidence that such a time constraint is not a strong concern.
• SPI mixtures can use external initiators. For an especially good benefit in CO2 oilfield floods and sequestration projects, the fact that the available gas can be the initiator for the gel is a strong cost savings benefit and it ensures that the SPI mix will only set in the direct presence of that gas, thereby blocking CO2 flow paths.
• SPI gels are selective of where to set. SPI gels will only set in direct contact with an initiator and will set in that path. If the SPI mix enters a water zone it will be diluted and form, at best, a slush of precipitates in a dilute polymer-like water. If SPI mix contacts crude oil it will not set at all.
• SPI gels are very effective in plugging off permeability paths in sandpack flow tests (also proved in the field tests). Typical permeability reduction factors (Frr) of 90 / 44/ 43 (for Ottawa sand/ Field A sandstone/ Field B San Andres dolomite, respectively) occur after one SPI treatment, all at 1 foot per day (fpd).
• Two SPI treatments are even more effective resulting in Frr of 450/ 123/ 2425 (Ottawa sand/ Field A sandstone/ Field B San Andres dolomite, respectively) when compared back to untreated sandpack condition, after a second SPI treatment, all at 1 foot per day (fpd).
• SPI gels are strong. Lower concentration SPI gels can hold over 400 psi across 0.89 feet (450+ psi/foot of gel in a high porosity sandpack) based on sandpack tests using either internal or external initiators. Those lower concentration SPI gels are 2 to 4.5 times stronger than 20,000 ppm PAM gels based on the BGST extrusion and Penetrometer testing. Higher concentration SPI gels are much stronger than low concentration SPI gels and any common gelled PAM system used commercially, as based on penetrometer (cone-drop type) testing. This means that SPI gels can seal and then hold the required pressure drop even across larger flow path openings,

DE-FE0005958 Final Technical Report
No proprietary or classified information, or any information subject to export control are included in this report.
81
such as fractures. • SPI gels obtain a large part of their ultimate strength with a few minutes of reaching
its trigger pH level. However, it still gains strength over 3 days and reaches its near-term maximum strength in 5 days. It will get slightly stronger over the next few months. Once a SPI mix is pumped and initiated (CO2 or internal) it is best to let SPI gels become static/ still for those initial 3-5 days to develop most of their strength. Then injection or production can resume. SPI gel jar samples have maintained their strength and ringing properties over several years.
• Multiple SPI treatments maybe better than a single treatment of SPI gels for CO2 floods. This is because of SPI’s unique chemistry, its low pregel viscosity and its initiation method using CO2 where it sets on the edges. Multi-staging prevents over-treating and allow building up and monitoring the level of diversion to the level desired.
• Smaller SPI treatments volumes are recommended in CO2 floods. Combining the attributes of the unique SPI chemistry- low viscosity and use of external CO2 as the initiator setting on the edge contact surfaces. SPI mixtures will only set where it directly contacts CO2- at the boundaries (front, back, sides) with some penetration. Everything not contacted by CO2 is held-in-waiting until some future event brings it in contact with CO2, but that excess in economic terms is wasted, as it does not meet the immediate economic need of the operator.
• Set SPI gels can be mechanically and/ or chemically removed if set in the wellbore tubing or casing or in surface equipment. Good fact – this has never happened with Impact. SPI gels have a lower yield point than cements or epoxies and can be pumped through/ frac’ed with reasonable pressure. Once flow has been established a flow path will be created and selected chemicals can be used to break the gel down further. Jetting with water or selected chemicals would also be very effective for cleanout in wellbores, pipes or tanks.
• Cleanliness is important in field operations because of the SPI chemistry as well as the normal concerns of pumping solids downhole. Silicates are known for their steel protective capabilities, as they were the original corrosion protector and are still used today for that purpose. However, silicate solutions also will clean scale and other deposits and loose coatings off of steel in pipes, tanks, and wellbore tubulars. These can come loose and be pumped downhole causing injectivity issues.
• From its unique formulation, SPI gels have a wide range of applications – oilfield CO2 floods, oilfield water floods, oilfield high WOR primary production wells, mud drilling wells (oilfield, geothermal, other) with lost circulation zones, underbalanced drilling wells with zone of high fluid influx. SPI Field Treatments
• SPI gels were shown effective in the field in fractured sandstone and dolomite fields. • SPI gels were shown effective in the field in Gulf Coast and Permian Basins. • SPI gels were shown effective in the field in both injection and production wells.

DE-FE0005958 Final Technical Report
No proprietary or classified information, or any information subject to export control are included in this report.
82
• SPI gels were shown effective in the field in injection wells to reduce injectivity and to beneficially impact offset producers’ GOR, oil production rate and ultimate recovery.
• SPI gels showed an average injectivity reduction in field injection wells of 23% to 71% for SPI treatments of 355 to 4792 bbls.
• SPI gels were shown very effective in treating injection wells with volumes as low as 355 – or even 950 bbls.
• SPI gels were shown effective in recovering some portion of 14,264 bbls of incremental oil at a value of about $1,284,000 in Field A alone. This is about $140 in return value per bbl of injected SPI mix. Field B does not have sufficient history recorded since the treatments to determine any outcome, but there are some positive indicators in offset producers.
• SPI gels were shown effective in treating even very marginal production wells. Even using non-optimal initiation methods, SPI immediately lowered GOR by 81%, produced gas rate by 66% and increase oil production sufficient to recover 3,660 bbls of incremental oil within 1 year.
• SPI gel treatments were shown to last over one year (and running) in a difficult fractured sandstone system. Laboratory gel samples confirm that life.
• Before SPI treatments, ensure that all tanks are clean (not just oilfield clean) by visually initially inspecting all tanks and tankers/ transports. Ensure that they are kept clean by inspecting and filtering all deliveries. Contract for and demand dedicated delivery tankers and drivers from the trucking company or own /manage those truck/ tankers/ transports. Where possible utilize stainless steel tankers dedicated to chemicals delivery.
• Do not use square 500 bbl frac tanks with internal baffling. Best to use only 500 bbl horizontal round Acid Tanks without internal piping and baffles. Standard steel is acceptable, if clean and not rusty. Plastic tanks- possibly bag type- are acceptable. Verify type of internal coatings in pipes and tanks as being compatible with high pH fluids and visually inspect the lining to ensure it is not loose.
• Heat chemicals with indirect heaters as needed for cold weather operations to prevent cavitation pumping problems and chemical damage.
• The cost of mobilization (transportation to location, setup, teardown, chemical deliveries, and transportation back) is high. For improved efficiency and to lower the $/bbl cost for the operator, suggest multiple well treatments in the same or nearby fields be pumped in sequential or near parallel operation.
• Tanker/ Transport truck chemicals if the well delivery site is within 500 miles of the manufacturing point. Otherwise it is best to rail car deliver chemicals to near the well site, then truck to where needed. Once larger volume, multiple well treatment and longer schedules are set, then choose rail delivery since it can have the lowest cost.
• For multiple treatments in various nearby wells, set up an offsite central mixing plant that is close to rail car chemical delivery and/ or a good water source, but within reasonable distance to all treated wells. Best to set this mixing site outside of the

DE-FE0005958 Final Technical Report
No proprietary or classified information, or any information subject to export control are included in this report.
83
field boundary for personnel and safety concerns. • SPI operational costs during the project were estimated at a high $50-70/bbl of SPI
mix pumped. This included some direct lab testing, travel, fuel, pumps, personnel, daily allowance, hotels and transportation. Personnel costs were the highest cost component of the field tests, followed by chemical cost. The $/ bbl of SPI mix injected was lower where the mix water was available via a supply well and pumped to location. Distance to chemical providers also plays a role in the $/bbl SPI mix injected cost.
• Set-up/ teardown operations for mixing and pumping were non-optimal and costly during these field trials as each action took about 144 man-hours per site. On a commercial basis this cost is unacceptable. SPI Commercialization
• It is imperative to lower the cost per bbl of SPI treatments below the project cost. It is anticipated that cost can be driven down to below $20/bbl SPI mix with optimized practices, multiple concurrent/ consecutive treatments in one field and larger chemical volumes. That $20/bbl pricing is competitive with other gel systems, but, as demonstrated, SPI gels have proven advantages over those systems.
• The economics of treating producers in CO2 floods with SPI gels is too great to ignore. In such treatments the operator sees almost immediate benefits of oil production and/ or GOR reduction without any reduction in field injectivity. The operators already know this advantage, but are currently unable to access it. To treat production wells Impact must make investments in specific equipment, personnel and training.
• Demonstrate and market the effectiveness of smaller SPI volumes with multiple treatments to operators, as part of a larger overall chemical volume with multiple concurrent/ subsequent/ sequential wells and repeat well treatment package.
• Develop longer trigger internal initiators for waterfloods, drilling well problems and where a CO2 operator wants single large SPI treatments with the insurance that all of the gel volume sets. Impact is already working on solving this problem.
• Personnel cost for set-up/tear-down and running an on-site 24/7 mixing and pumping operation is the highest single cost component of the SPI treatment operation. Many operators’ requirements for onsite pumping operations specify monitoring by two people (buddy system) around the clock- three 8 hour shifts for two persons= 6 man-days per site per 24 hour cycle. Each well can take up to 5 days to pump for 30 man-days of cost. With multiple and nearby parallel injection operations, Impact should inquire of operators if a roving pair of personnel can monitor and adjust multiple active treatment/ pumping sites even better than onsite. Additional instrumentation and sensors on the pumping skids may be needed. This may even be safer and more beneficial than continuous onsite personnel for each site, considering the continuous onsite CO2 and safety concerns.
DE-FE0005958 Final Technical Report
No proprietary or classified information, or any information subject to export control are included in this report.
84
GRAPHICAL MATERIALS LIST
Figure 1 A&B. Low to Medium Concentration SPI Gel Samples with A-internal initiator or B-CO2 external initiator Figure 2. Clean Tech Innovations Laboratory Facility. Figure 3. Previous SBIR Phase I Project Viscosity Tests showing Gel Times at RT Figure 4. Prior project testing showing Viscosity of very low SPI concentration Solutions at 40oC in the Brookfield Viscometer Figure 5. SPI Gel Time at 40oC versus Silicate/Initiator wt/wt Ratio Figure 6. PAM cross-linked with Aluminum-Citrate tested through BGST Figure 7. SPI Gel through BGST (partially reformed into a block) Figure 8. Sand Pack Setup. Figure 9. Sand Pack Schematic not showing Overburden Sleeve Setup Figure 10. Schematic of Multiple, Smaller SPI Treatments in a Simplified CO2 Flood Figure 11. UET In-Line Stainless Steel Internal Static Mixer, 2700psi & 3000BPD Figure 12. Four 5025 gallon (120 bbls) Norwesco Polyethylene Chemical Storage Tanks w/ steel base skid added later. Figure 13. Three Hydra-Cell Diaphragm-type (positive displacement) Chemical Metering pumps with Variable Speed Controllers Figure 14. Stainless Steel & Polyethylene low pressure/high rate gear Transfer Pumps Figure 15. Full SPI Slip-Stream Setup in Impact’s Yard during Testing Figure 16. Titration with 0.1M NaOH into 100 grams of Field A Brine Figure 17. Titration with 0.1M NaOH into 250 ml Deionized Water with 25 grams of Field A’s Crushed Sandstone Figure 18. Titration of 0.1 N NaOH across a Sandpack with Field A sand material Figure 19. Penetrometer Test on an SPI gel Figure 20. Sand Pack with 20-40 Mesh Ottawa Sand during Water Injectivity Tests after one SPI Treatment Figure 21. Sand Pack with Ottawa 20-40 Mesh Sand during Water Injectivity Tests after a second SPI Treatment Figure 22. Sand Pack (with Ottawa sand) Water Injectivity Tests after SPI Treatments Figure 23. Water Injectivity Tests in a SandPack with Field A Sand material after two SPI Treatment Figure 24. Field A Sandstone and Ottawa Sand Pack Water Injectivity Tests after 1st SPI Treatment Figure 25. Field A Sandstone and Ottawa Sand Pack Water Injectivity Tests after 2nd SPI Treatment Figure 26. Water Injectivity re-Test of Field B Dolomite Sand Pack with early Constant Pressure Period before Constant Rate, following 2nd SPI Treatment Figure 27. Normalized Plot of Injection Pressure versus Cumulative Injection for all SPI Treatments

DE-FE0005958 Final Technical Report
No proprietary or classified information, or any information subject to export control are included in this report.
85
Figure 28. Normalized Plot of Injection Pressure versus Cumulative Injection for all SPI Treatments- Focused on early times of treatments Figure 29. Field A Permeability versus Porosity from Core Analysis Figure 30. Plot Field A Reservoir Quality Index to Identify Hydraulic Units Figure 31. Plot Field A Core Permeability versus % perm-height Figure 32. Plot of Field A Permeability Distribution Figure 33. Plot of Field A Capillary Pressure by Depth and Brine Saturation Figure 34. Field A Structure Map of one pattern with Response Times shown Figure 35. Field A Map showing Distances between Wells Figure 36. Field A Structure Map showing Well #1 and some Offset Production Wells Figure 37. Comparison of Field A’s Well #1 and Well #2 Water Injectivities Figure 38. Wellbore Schematic for Field A, Well #1 Injector Figure 39. Well #1 Open Hole Logs and Production Profile Log data pre-SPI treatments Figure 40. Field A, Well #1 Historical Production Plot with SPI1, SPI3 & Marcit Trtmts Figure 41. Field A, Well #1’s All Offset Producers’ Historical Plot, BOPD Figure 42. Field A, Well #1’s Selected Offset Producers’ Historical Plot, BOPD Figure 43. Field A, Well #1’s All Offset Producers’ Historical Plot, GOR Figure 44. Field A, Well #1’s Selected Offset Producers’ Historical Plot, GOR Figure 45. Field A Structure Map showing Well #2’s location Figure 46. Wellbore Schematic for Field A, Well #2 Producer Figure 47. Field A, Well #2’s pre-SPI Treatment Water Step Rate Test Figure 48. Field A, Well #2 Production History with SPI2 Figure 49. Field B Map showing Location of all SPI Treated Wells Figure 50. Field B, Well #3 Historical Injection Plot Figure 51. Field B, Well #4 Historical Injection Plot Figure 52. Field B, Well #5 Historical Injection Plot Figure 53. Field B, Well #6 Historical Injection Plot Figure 54. Field B offset producers’ Oil Rate historical plot Figure 55. Field B offset producers’ GOR historical plot Figure 56. Field B offset producers’ WOR historical plot Figure 57. Field A, Well #1 Injection History Plot showing both MarcitTM and SPI gel
Treatments Figure 58-63. Field A, Well #1 SPI Treatments Figure 64-67. Field A, Well #2 SPI Treatment, central Mississippi Figure 68. Field B, west Texas SPI Treatments with Central Mixing Site
Table 1. Prior SBIR Phase I Project Gel Test Results Table 2. Methods of Calculating Injectivity of a Well Table 3. Penetrometer Testing on SPI Gels Table 4. Sand Pack Flow Test Results with 20-40 mesh Ottawa Sand Table 5. Sandpack Injectivity Testing comparing SPI gel treatments with Ottawa Sand and Field A Sandstone core material

DE-FE0005958 Final Technical Report
No proprietary or classified information, or any information subject to export control are included in this report.
86
Table 6. Field B San Andres Dolomite SandPack Water Injectivity Tests with one and two SPI Treatments Table 7. Field B Dolomite Sandpack Water Injectivity Test Retest with Constant Pressures preceding Constant Rates. Table 8. Post-Field A Treatment Quality Control Tests/ Comparison of SPI Gel to standard chrome gelled PAM gel strengths Table 9. SPI Treatment History Summary Table 10. Comparison of SPI Treatment Volumes per Well Characteristics Table 11. Summary of Conformance Treatments in Field B, Well #3
DE-FE0005958 Final Technical Report
No proprietary or classified information, or any information subject to export control are included in this report.
87
BIBLIOGRAPHY / REFERENCES
1. Sweatman, Parker and Crookshank, “Industry Experience With CO2-Enhanced Oil Recovery Technology”, SPE126446 2009 SPE International Conference on CO2 Capture, Storage and Utilization, San Diego, CA 2-4November 2009.
2. Hargrove, Meltzer and Whitman, “A Status Report on North American CO2 EOR Production and CO2 Supply”, 16th Annual CO2 Flooding Conference , 9-10 December2010
3. Burns L., Johnson B., Oglesby K., Rychel D., “Chemical Method to Improve CO2 Flooding Sweep Efficiency for Oil Recovery Using SPI-CO2 Gels”, Contract Number-SW-FG02-08ER84957, Final Report for SBIR Phase I April 2009.
4. http://intro.chem.okstate.edu/ChemSource/rocks/demonst.htm#bk2 5. http://www.chromatography-online.org/topics/silicic/acid.h 6. Shimada K. and Tarutani T., “Formation of Gelled Silicate Polymers in the Presence of
Organic Polymers”, Bulletin of the Chemical Society of Japan Vol.53, No.12(1980) pp.3488-3491
7. http://gsa.confex.com/gsa/2003AM/finalprogram/abstract_64588.htm 8. Iler R.K., The Colloid Chemistry of Silica and Silicates, Cornell University Press, Ithaca,
New York, 1955, p 59. 9. Meister J., “Bulk Gel Strength Tester,” SPE 13567, International Symposium on Oilfield
and Geothermal Chemistry, Phoenix, AZ, April 9 – 11, 1985. 10. Vail, J.G., Soluble Silicates, Reinhold, 1952, New York. 11. Patterson R.E., “Preparation and Uses of Silica Gels and Precipitated Silicas”, The
Colloid Chemistry of Silica, Chapter 32, 1994. 12. Gronewald P., Hamilton J., Mansure A., “High-Temperature Plug Formation With
Silicates”, Proceedings, Thirtieth Workshop on Geothermal Reservoir Engineering Standford University, Standford, California, January 31–February 2, 2005.
13. Mills R.A., “Process of Excluding Water From Oil & Gas Wells”, US Patent 1,421,706, July 4, 1922.
14. Krumrine P.H, and Boyce S.D., “Profile Modification and Water control With Silica Gel-Based Systems”, SPE 13578, April 9-11, 1985.
15. Falkowicz S., Cicha-Szot R., Dubiel S., and Bailey S., “Biocatalized Silicate Gels In Oil & Geothermal Industry”, http://www.min-pan.krakow.pl/Wydawnictwa/GSM254/falkowicz-i-inni.pdf
16. Vinot B., Schechter R.S., Lake L.W., “Formation on Water/Soluble Silicate Gels by the Hydrolysis of a Diester of Dicarboxylic Acid Solubilized as Microemulsion”. SPE 14236, 1989.
17. Anderson K.H., “Method of Oil Recovery”, US Patent 2,402,588, June 25, 1946. 18. Boston W.G., Method For Oil Recovery”, US Patent 3,285,338, November 15, 1966. 19. Elfrink E.B., Selective Plugging Method”, US Patent 3,261,400, July 19, 1966. 20. Islam M.R., Farouq Ali S.M., “Use of Silica Gel for Improving Waterflooding
Performance of Bottom-Water Reservoirs, Journal of Petroleum Science and

DE-FE0005958 Final Technical Report
No proprietary or classified information, or any information subject to export control are included in this report.
88
Engineering”, Vol. 8, p. 303–313. 1993. 21. Merrill R.C., Spencer R.W., “Gelation of Sodium Silicate: Effect of Sulfuric Acid,
Hydrochloric Acid, Ammonium Sulfate and Sodium Aluminate”, Journal of Physical Chemistry Vol. 54, p. 806– 812.
22. Beecroft W.H., Maier L.F., US Patent Priority Number 19690808312. 23. Sandiford B.B., “Selectively Controlling Fluid Flow Through the Higher Permeability
Zones of Subterranean Reservoirs”, US Patent 4,332,297 June 1, 1982. 24. Sandiford B.B., “Plugging High Permeability Zones of Reservoirs Having Heterogeneous
Permeability”, US Patent 4069869 January 24, 1978. 25. Bernard G.C., “Method for Water Flooding Heterogeneous Petroleum Reservoirs”, US
Patent 353093, September 29, 1970. 26. Sarem A.H., “Mobility Controlled Caustic Flood”, US Patent 3805893, April 23, 1974. 27. Lawrence D.D., Felber B.J., “Formation Treatment With Silicate Activated
Lignosulfonate Gel” US Patent 4257813 March 24, 1981. 28. Sydansk R.D., Gucwa P.R., Stonecipher S.A., “Process For Selectively Reducing The
Permeability Of A Subterranean Sandstone Formation”, US Patent 4301867, November. 24, 1981.
29. Vinot B., Schechter R.S., Lake L.W., “Formation Of Water/Soluble Silicate Gels By The Hydrolysis Of A Diester Of Dicarboxylic Acid Solubilized As Microemulsion. SPE Technical Paper 14236, 1989.
30. Nasr-El-Din H.A., Taylor K.C., “Evaluation Of Sodium Silicate/Urea Gels Used For Water Shut-Off Treatments”, Journal of Petroleum Science and Engineering Vol. 48, Issue 3–4, p. 141–160, 2005.
31. Nasr-El-Din H.A., Bitar G.E., Bou-Khamsin F., Al-Mulhim A.K., Hsu J., Field “Application of Gelling Polymers in Saudi Arabia”. SPE 39615, 136–146, 1998.
32. Taylor K.C., Nasr-El-Din H.A., “Thermally Responsive Aqueous Silicate Mixture”, US Patent 6660694, December 9, 2003.
33. Al-Nuntasheri G.A., Hussein I.A., Nasr-El-Din H.A., Amin M.B., “Viscoelastic Properties Of A High Temperature Cross-Linked Water Shut-Off Polymeric Gel”, Journal of Petroleum Science and Engineering Vol. 55, Issues 1–2, January, p. 56–66, 2007.
34. Samuel Ameri, Khashayar Amirdan, James A. Wasson and David L. Durham, “Improved CO2 Enhanced Oil Recovery – Mobility Control By In-Situ Chemical Precipitation”, June 1991. Department of Petroleum and Natural Gas Engineering, West Virginia University Work Performed Under Contract No. DE-AC21-85MC22044, http://www.netl.doe.gov/KMD/cds/disk22/G-CO2%20&%20Gas%20Injection/MC22044_15.pdf
35. http://www.grace.com/EngineeredMaterials/MaterialSciences/SilicaGel/Default.aspx 36. Jurinak J.J., Summers L.E., Bennett K.E., “Laboratory Testing of Colloidal Silica Gel for
Oilfield Application” SPE 18505 Supplement 2, 1991. 37. Jurinak J.J., Summers L.E., “Oilfield Applications Of Colloidal Silica Gel”. SPE
Production Engineering, Vol. 6, No. 4, p. 406–412, 1991.

DE-FE0005958 Final Technical Report
No proprietary or classified information, or any information subject to export control are included in this report.
89
38. Bennett K., Fitzjohn J.L., Harmon R.A., Yates P.C., Jr., “Colloidal Silica Based Fluid Diversion”, US 4,732,213, March 22, 1988,, Assignee: Conoco, Inc.
39. Parris M.D., Hutchins R.D., “Enhancing Gel Strength”, US 6,011,075 July 4, 2000, Assign: Schlumberger Technology Corp.
40. Davies S.N., Hughes T., Lekkerkerker H., Bruggen M.V., Der Beken A.V., “Delayed-Gelation Solution”, US 7,273,101, September 25, 2007, Assign: Schlumberger Technology Corp.
41. Odeh N., Chan K.S., Enkababian P., “Tight Formation Water Shut Off Method With Silica Gel”, US 11,740,346 , February 14, 2008, Assign: Schlumberger Technology Corporation.
42. Rose P.E. and Bour D.L., “Geothermal Well Diversion Agent Formed From In Situ Decomposition of Carbonyls at High Temperature”, US 12,544,553, Feb. 25, 2010.
43. Sharp L.G., Assign Mobil Oil Co., “Sealing of Deep Permeable Earth Formations”, US 3,244,230, April 5, 1966.
44. Laramay M.; “Method of Preventing Gas Coning and Fingering in a High Temperature Hydrocarbon Bearing Formation”, US 5,320,171 June 1,1994, Assign: Halliburton.
45. Huang T., et. al., “Using Nanoparticles for Water Flow control In Subterranean Formations”, US 12,122,847, Nov 19, 2009, Assign: Baker Hughes Inc.
46. Burns L.D., Burns M., Wilhite P., McCool S., Oglesby K.D., Glass J., “New Generation Silicate Gel System for Casing Repairs and Water Shutoff”, SPE Paper 113490, 2008 SPE IOR Symposium Tulsa, OK, April 19-23, 2008
47. Burns L.D., Oglesby K.D., “Chemical Method to Improve CO2 Flooding Sweep Efficiency for Oil Recovery Using SPI- CO2 Gels”, DOE SBIR Phase I (DE-FG02-08ER84957, Topic No. 60, Topic Area: EOR, Oil Shale, Oil and Natural Gas Technologies, Subtopic: CO2 Flooding For the Recovery of Oil, July 1, 2008-March 29, 2009, Final Report.
48. Oglesby K.D., Burns L.D., Glass J., “Extended Application of Proven Low Cost Water Mitigation Treatment”, Stripper Well Consortium contract 3022-IT-DOE-2098, June 1, 2005 through December 31, 2006 , Final report.
49. Oglesby K.D., Burns L.D., Glass J., “Novel Single Stage Water Mitigation Treatment”, Stripper Well Consortium contract 3180-IT-USDOE-2098, July 1, 2006 through December 31, 2007, Final Report.
50. Oglesby K.D., Burns L.D., Glass J., “Novel Silicate Gels for Casing Repairs”, Oklahoma Center for the Advancement of Science and Technology contract AR062-077/ 6807, 6917 and 7149, July 1, 2006 through October 31, 2009, Final Report.
51. Man R.L., “Methods and Compositions for Well Completion”, US 3,146,828, Sept. 1, 1964.
52. Felber B.J., et al., “Lignosulfonate Gels For Sweep Improvement in Flooding Operations”, US 3,897,827, August 5, 1975.
53. Lawrence D.D. and Felber B.J., “Formation Treatment with Silicate Activated Lignosulfonate Gel”, US 4,257,813, March 24, 1981.
54. Hoskin D.H., “Stabilizing Agent For Profile Control Gels and Polymeric Gels of

DE-FE0005958 Final Technical Report
No proprietary or classified information, or any information subject to export control are included in this report.
90
Improved Stability”, US 4,928,766, May 29, 1990 55. Huang T., et al., “Compositions and Methods For Water Shut-Off in Subterranean
Wells”, US 10,610,951, February 19, 2004. 56. Everett D.M., et. al., “Compositions and Methods for Plugging and Sealing A
Subterranean Formation”, US 11,048,583, August 3, 2006. 57. Winston A.E., “Aqueous Cleaning Concentrates”, US 5,431,847, July 11, 1995. 58. Zhou Z., “Process For Reducing Permeability In A Subterranean Formation”,
US 6,143,699, November 7, 2000. 59. Laktos I., Lakatos-Szabo J., Tiszai G., Palasthy G., Kosztin B., Tromboczky S., Bodala
M., Patterman-Farkas G., “Application of Silicate-Based Well Treatment Techniques at the Hungarian Oil fields”, SPE 56739, October 3, 1909.
60. Taylor K.C., et.al., “Methods and Compositions For Well Completion”, US 3,146,828, September 1, 1964.
61. http://www.heraproject.com/ExecutiveSummaryPrint.cfm?ID=186 62. Hydra-Cell Diaphragm Metering Pumps, Operating Manual. 63. Nnabuihe L. (Shell Nigeria), Felber B.J. (US DOE), Ososanwo D. (Shell Nigeria),
Holmgren C.M. (Allied Energy) and Ohen H.A. (Core Laboratories), “A Systematic Laboratory Core and Fluid Analysis Program for the Design of Cost Effective Treatment and Cleanup Guidelines for a Produced Water Disposal Scheme”, SPE DOE 35369.
64. Martin R.G., “Northern and Eastern Gulf of Mexico Continental Margin: Stratigraphic and Structural Framework”, American Association of Petroleum Geologists, Bulletin Studies In Geology, V. 7, P. 21-42, 1978.
65. Puckett T.M., Bearden B.L., Mancini E.A., and Panetta B.J., “Topical Report 3 – Petroleum Plays and Underdeveloped Reservoirs In The Mississippi Interior Salt Basin”, DE-FG22-96BC14946, August 2000.
66. Schmitz D., Brown L.R., Lynch F.L., Kirkland B.L., Collins K.M., and Funderburk W.K., “Improvement of Carbon Dioxide Sweep Efficiency by Utilization of Microbial Permeability Profile Modification to Reduce the Amount of Oil Bypassed during Carbon Dioxide Flood”, DE-FC26-06NT15458, Final Report.
67. http://intro.chem.okstate.edu/ChemSource/rocks/demonst.htm#bk2 68. http://www.chromatography-online.org/topics/silicic/acid.htm 69. Kanichi S. and Toshikazu T., “Formation of Gelled Silicate Polymers in the Presence of
Organic Polymers” Bulletin of the Chemical Society of Japan Vol.53, No.12(1980) pp.3488-3491
70. http://gsa.confex.com/gsa/2003AM/finalprogram/abstract_64588.htm 71. Huang E.T.S., Holm L.W., “ Effect of WAG Injection and Rock Wettability on Oil
Recovery During CO2 Flooding”, SPE 15491-PA, SPE Journal Paper, 1988. 72. Anderson M.S., “Reactivity of San Andres Dolomite”, SPE Journal Paper 20115-PA,
1991. 73. Mathis, R.L. and Sears, S.O., “Effect of CO2 Flooding on Dolomite Reservoir Rock,
Denver Unit, Wasson (San Andres) Field, TX “, SPI13132-MS, 1984. 74. Mohamed I. M., He J., Nasr-El-Din H.A., “Carbon Dioxide Sequestration in Dolomite

DE-FE0005958 Final Technical Report
No proprietary or classified information, or any information subject to export control are included in this report.
91
Rock”, IPTC 14924-MS, 2011. 75. Behm E.J. and Ebanks W.J., “Comprehensive Geological and Reservoir Engineering
Evaluation of the Lower San Andres Dolomite Reservoir, Mallet Lease, Slaughter Field, Hockley County, Texas” SPE12015-MS, 1983.
76. Magruder, J.B., Stiles, L.H., Yelverton T.D., “ Review of the Means San Andres Unit CO2 Tertiary Project”, SPE17349-PA, 1990.
77. Kittridge M.G.,”Quantitative CO2 Flood Monitoring, Denver Unit, Wasson (San Andres) Field”, SPE24644-PA, 1993.
78. Filho, R.D.F., “Effects of Dissolution on the Permeability and Porosity of Limestone and Dolomite in High Pressure CO2/Water Systems”, SPE 160911-STU, 2012.
79. Johnston, J.W., “A Review of the Willard (San Andres) Unit CO2 Injection Project”, SPE 6388-MS, 1977.
80. Keeling, R.J., “CO2 Miscible Flooding Evaluation of the South Welch Unit, Welch San Andres Field”, SPE12664-MS, 1984.
81. Stiles L.H., Chiquito R.M., George C.J., Long L.D.,”Design and Operation of a CO2 Tertiary Pilot: Means San Andres Unit”, 11987-MS SPE Conference Paper – 1983.
82. Srivastava R.K., Huang S.S., Dong M., “Asphaltene Deposition During CO2 Flooding”,SPE 59092-PA, 1999.
83. Ghedan S.G., “Global Laboratory Experience of CO2-EOR Flooding”,SPE 125581-MS, 2009.
84. Folger L.K. and Guillot S.N., “A Case Study of the Development of the Sundown Slaughter Unit CO2 Flood Hockley County, Texas”, SPE 35189-MS, 1996.
85. Kuo M.C.T., Dulaney J.P., Dee, M.W., Evans B.S., Granquist M.R., “Optimization of Waterflood Performance and CO2-Flood Design Using a Modeling Approach, Mallet Unit, Slaughter Field”, SPE20377-MS, 1990.

DE-FE0005958 Final Technical Report
No proprietary or classified information, or any information subject to export control are included in this report.
92
ACRONYMS AND ABBREVIATIONS BBL or bbl- industry standard, US barrel, 42 gallons BCF- billion cubic feet (of gas) BGST- Bulk Gel Shear Test, method to test and compare gel strengths BOPD – barrels of oil per day rate BPD or bpd- barrels per day rate BPM- barrel per minute rate BWPD- barrel of water per day rate cp- centipoise unit of viscosity CO2- carbon dioxide CTI- Clean Tech Innovations, LLC Field A- central Mississippi immiscible CO2 flood where SPI1, SPI2 and SPI3 performed Field B- west Texas miscible CO2 field where SPI4-SPI8 per performed fpd- feet per day of velocity Frr- residual resistance factor= pre-treatment permeability/ post-treatment permeability Gal- gallon volume GLR- produced gas to liquid ratio GOR- produced gas to oil ratio H2S - hydrogen sulfide, a dangerous toxic gas HMW- high molecular weight (of PAM) Impact- Impact Technologies LLC Injectivity- measure of ease of injecting a fluid, or ease of flow, variously calculated Inter-Well Capacity- measure of reservoir volume between wells, variously calculated LPD- liter per minute rate LPM- liter per minute rate MMcf- million of cubic feet volume MCFPD- thousand of cubic feet per day rate PAM- polyacrylamide polymer Ppm- parts per million concentration PV- pore volume of sandpack PI- Principal Investigator (me, the one writing this novel) SPE - Society of Petroleum Engineers SPI- Silicate Polymer Initiator solution SPI1, SPI2, SPI3, SPI4, SPI5, SPI6, SPI7, SPI8- SPI treatments in the project wells WAG- water-alternating-gas, a cyclic CO2 flooding injection method WOR- water to oil ratio produced from production wells.