Embed Size (px)
Citation preview
Schroders2010 Annual Results
Michael DobsonChief Executive
10 March 2011
trusted heritageadvanced thinking

1
2010: record year
• 81% of funds outperforming over 3 years
• Net new business £27.1bn (2009: £15.0bn)
• Funds under management £196.7bn (2009: £148.4bn)
• Profit before tax £406.9m (2009: £137.5m)
• Earnings per share 111.8p (2009: 34.3p)
• Dividend 37.0p per share (2009: 31.0p)
• Investment in organic growth
• Focus on investment performance
• Broad product range
• Proven distribution capability
• Global franchise
• Strong financial position

2
Asset class diversification: gross inflows
£bn
2009 20102008200720060
10
20
30
40
50
60
70
80
Equities Fixed Income Multi-Asset Alternatives Private Banking
38.0
56.6
41.6
54.1
77.9

3
Asset class diversification: net inflows
0
2
4
6
8
10
12
Q1 2010 Q2 2010 Q3 2010 Q4 2010Equities Fixed Income AlternativesMulti-asset Private Banking
£bn
9.7
6.45.4 5.6

4
Regional diversification: net inflows76% from clients outside the UK
NorthAmerica£4.0bn
South America£1.8bn
ContinentalEurope£4.4bn
UK£6.5bn
Asia Pacific £9.5bnMiddle
East£0.9bn
5
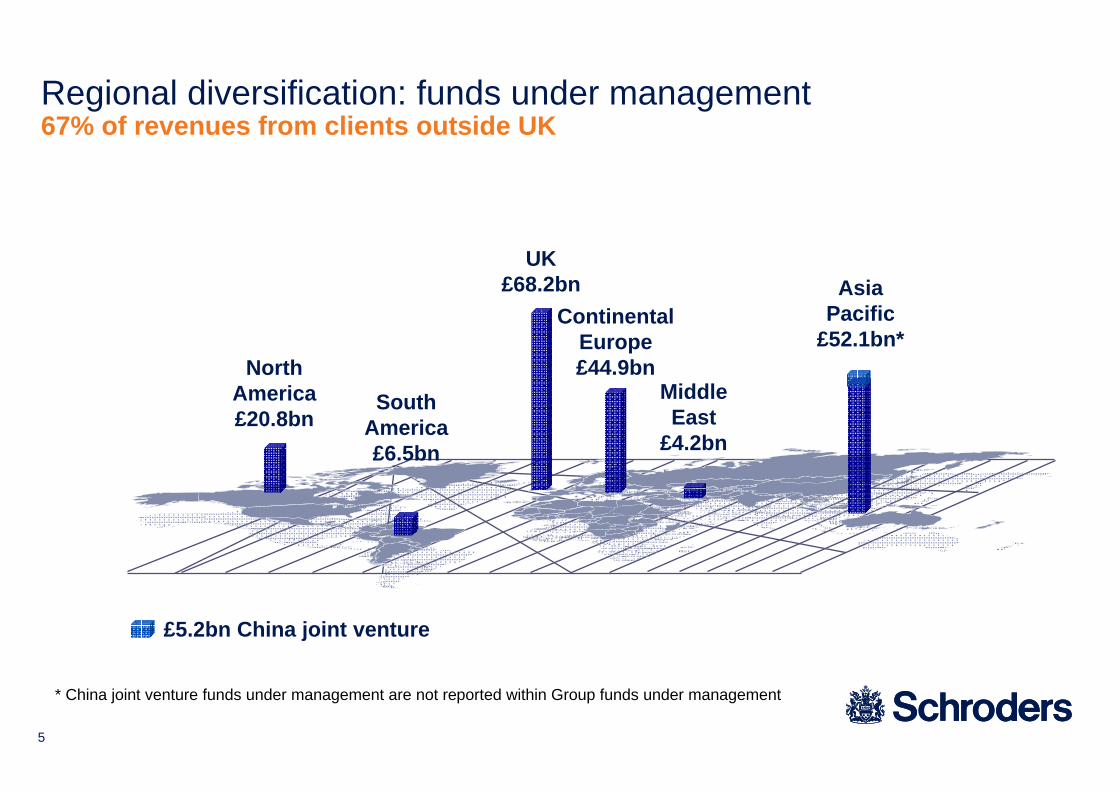
£5.2bn China joint venture
* China joint venture funds under management are not reported within Group funds under management
NorthAmerica£20.8bn
South America£6.5bn
ContinentalEurope£44.9bn
UK£68.2bn Asia
Pacific £52.1bn*
MiddleEast
£4.2bn
Regional diversification: funds under management67% of revenues from clients outside UK

6
InstitutionalFunds under management: £106.4bn (2009: £76.7 bn)
16.8
31.4
11.6 11.7
18.5
-14.6
-22.2
-15.5-13.6
4.9
-3.8
-10.6
-25
-20
-15
-10
-5
0
5
10
15
20
25
30
35
2007 2008 2009 2010
Gross inflows Gross outflows Net inflows
£bn
• Shift from DB pensions to sovereign wealth funds, financial institutions
• Mandates from large clients
• Momentum in fixed income, emerging market equities, alternatives and new asset classes
– quant equities
– multi-asset
– LDI
• Revenue margins unchanged

7
IntermediaryFunds under management: £74.1bn (2009: £59.1bn)
7.9
39.341.0
23.3
29.0
-31.4-32.2-29.5
-19.4
9.6
-6.2
8.8
-40
-30
-20
-10
0
10
20
30
40
50
2007 2008 2009 2010
Gross inflows Gross outflows Net inflows
£bn
• Gross sales up 36%
• Top 3 year in net sales
• Redemptions in Asia
• Progress in sub-advisory in US, Japan
• Growth potential with insurance partners, pre and post retirement market
• High capacity, scalable products

8
Private BankingFunds under management: £16.2bn (2009: £12.6 bn)
• Strength of investment and client service proposition
• Additional client facing private bankers
• Record level of net new business
• Reduction in revenue margins
– lower management fees on large mandates
– lower interest income
– lower transaction fees
• Higher staff costs
• Doubtful debt provisions in the UK
• Business positioned for increased profitability in 2011

Schroders
Kevin ParryChief Financial Officer
10 March 2011
2010 Annual Results
10
Cost: operating revenues ratio (%)
2008 2009 20102007
71 7379
70
2007 2008 2009 2010
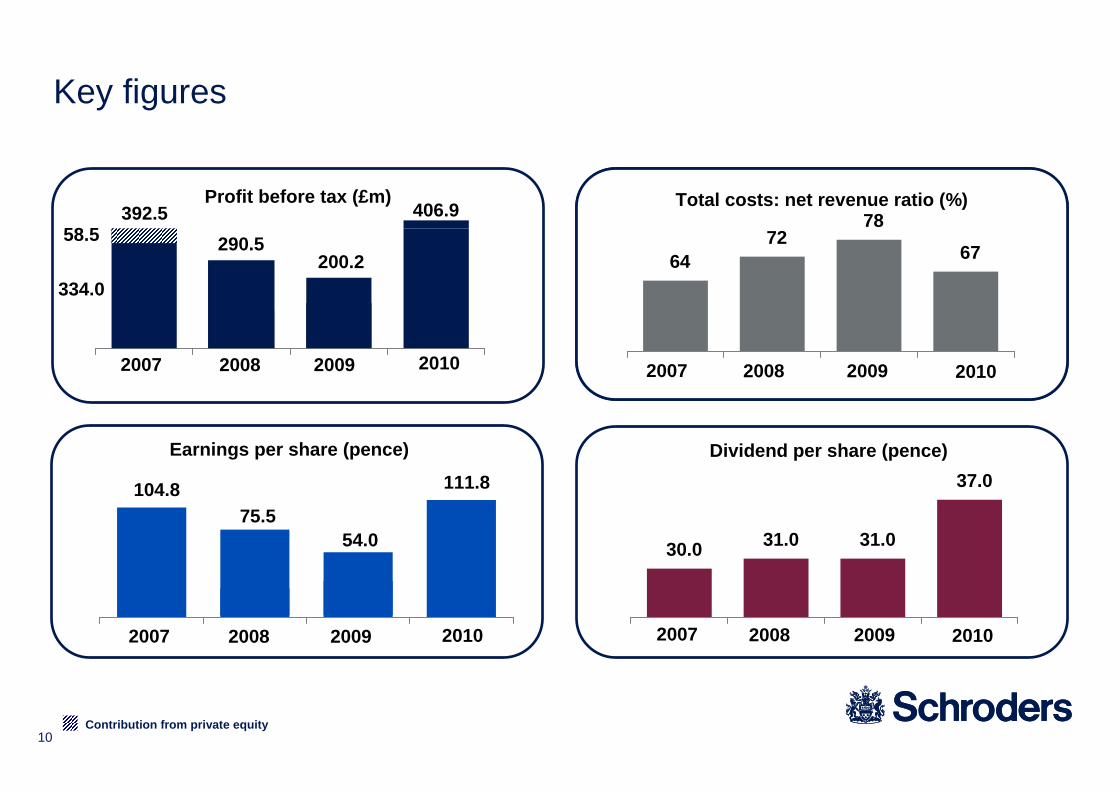
Profit before tax (£m)392.5
137.5
406.9
123.1
Contribution from private equity
200.2290.5
334.0
58.5
Earnings per share (pence)
2008 2009 20102007
104.8
27.5 34.3
111.8
75.554.0
Key figures
6472
7867
Total costs: net revenue ratio (%)
2008 2009 20102007
Dividend per share (pence)
2008 2009 20102007
30.0 31.0 31.0
37.0

11
Profit before tax
0
100
200
300
400
500
600
PBT 2010
£407mPBT2009
£138m
Net revenue£367m
Significant increase in net revenue
PBT2009
£200m
Exceptional items£62m
£m

12
0
200
400
600
800
1,000
1,200
1,400
Significant increase in net revenue
Netrevenue
2009
£789m
Netrevenue
2010
£1,156m
Net new business
£154m
Markets and FX £129m
Performance fees £39m
Group revenue
£45m
Before exceptional items
£m

13
Profit before tax
£m
0
100
200
300
400
500
600
Before exceptional items
Net revenue£367m
PBT2009
£200m
Comp. costs£115m
PBT2010
£407m
Revenue growth flows through to the bottom line
Other costs£44m
Net finance income
£1m
Compensation costs: operating revenue
reduced from 49% (2009) to 45% (2010)
14
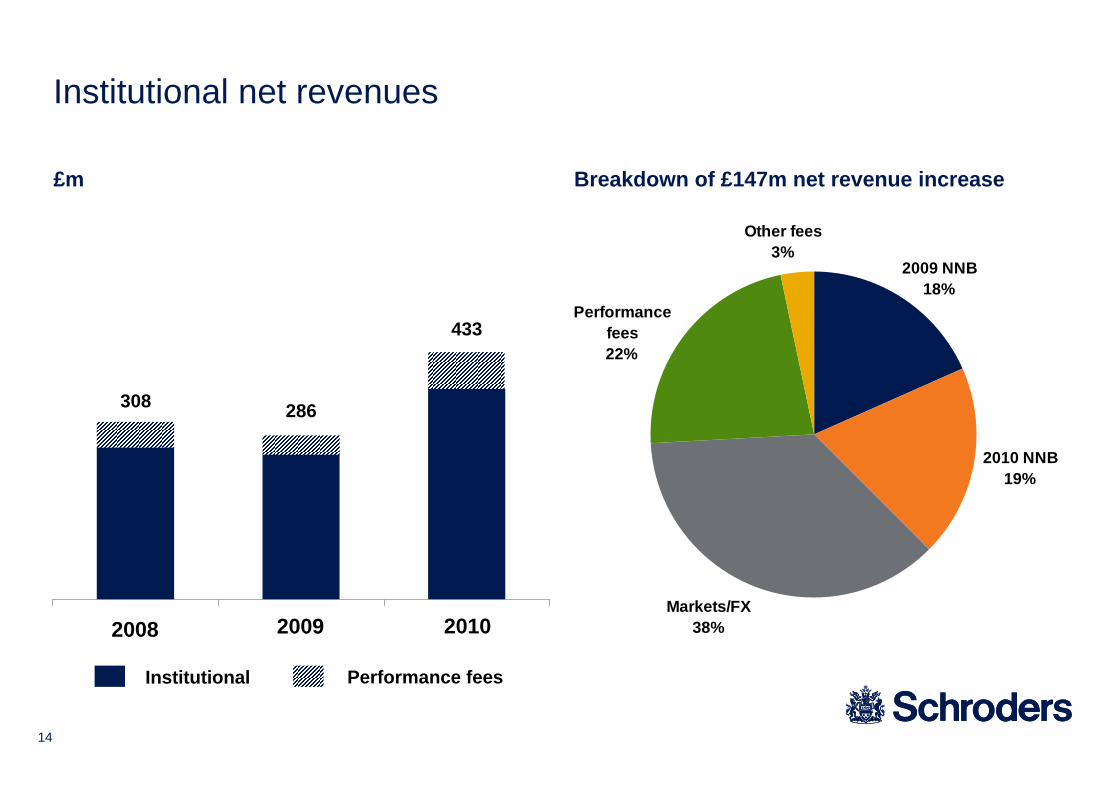
Institutional net revenues
Institutional Performance fees
2010 NNB19%
Markets/FX38%
Other fees3%
Performance fees22%
2009 NNB18%
308 286
433
Breakdown of £147m net revenue increase£m
2008 2009 2010

15
Intermediary net revenues
441393
563
Intermediary
Breakdown of £170m net revenue increase£m
2010 NNB18%
Markets/FX40%
Other fees2%
Performance fees3%
2009 NNB37%
2008 2009 2010

16
Institutional and Intermediary net revenues
Institutional Intermediary
Performance fees
308
441
286
393433
563
£m Asset Management net revenue marginsexcluding performance fees
59bps59bps62bps
2008 2009 20102008 2009 2010

17
Institutional and Intermediary net revenues
Institutional Intermediary
Performance fees
308
441
286
393433
563
£m Asset Management net revenue margins
63bps62bps66bps
2008 2009 20102008 2009 2010

18
67%
45%
774.0
17.5
251.0
505.5
2010
-4%49%Compensation cost: operating revenue ratio
-11%78%Cost:net revenue ratio
+26%
-11%
+23%
+29%
2010 vs 2009
204.7Other costs
19.7Depreciation and amortisation
615.1
390.7
2009£m
Staff costs
Total
Operating expenses before exceptional items
Non-recurring20%
Regulatory and legal burden
40%
Client facing and IT19%
Other21%
Breakdown of increase in costs

19
Private Banking segment
Management fees Net interest incomeTransaction fees
£m – net revenue
111.3
97.7103.3
28.7 25.723.3
52.754.0
64.7
19.315.328.6
2008 2009 2010Compensation costs Other costs Doubtful debt provisions
£m – costs
71.6
77.693.2
40.7 44.355.5
1.26.3
7.529.7
27.0
30.2
2008 2009 2010

20
34.3p(19.7)p54.0p111.8pEarnings per share
5.8%18.1%Return on capital (%)
311.2
23.5%
(95.7)
406.9
2010
2009
(41.8)7.8(49.6)Tax
30.4%12.4%24.8%Effective tax rate(%)
95.7(54.9)150.6Profit after tax
137.5(62.7)200.2Profit before tax
Exceptional items
Before exceptional
items Total
£m
Tax charge and earnings per shareBenefit of higher profitability

21
Groupcapital Dec ’09
£1,649m
500
750
1,000
1,250
1,500
1,750
2,000
2,250
GroupCapital
2009£1,649m
GroupCapital
2010£1,800m
Movement in Group Capital
PAT£311m
Dividends£88m
FX£28m
Pensions and other
£7m
Share issues£45m
Sharepurchases
£152m

22
35%
20%3%8%
10%
10%
12%2%
Cash and cash equivalents Seed capital: alpha exposuresLong Opus fixed income Long global macroLong only EMD absolute return Long only multi-asset absolute returnLegacy private equity Other
Group capital allocation
Investment capital breakdown (%)
1,800
162
864
774
Dec 2010
1,649
126
709
814
Dec 2009
Statutory Group capital
£m
Investment capital*
Asset Management & Private Banking operational capital
Other (intangibles etc.)
* Not included in FUM

Outlook
Michael DobsonChief Executive

24
Outlook
• Economic recovery continues but markets remain volatile
• Continued investment in:
– talent
– IT infrastructure
– risk & compliance
• Well positioned for long-term growth

25
Private Asset Manager Client service quality and
Image and reputation awards - UHNW

26
Forward-Looking Statements
These presentation slides may contain forward-looking statements with respect to the financial condition and results of the operations and businesses of Schroders plc
These statements and forecasts involve risk and uncertainty because they relate to events and depend upon circumstances that may occur in the future
There are a number of factors that could cause actual results or developments to differ materially from those expressed or implied by those forward-looking statements and forecasts. Forward-looking statements and forecasts are based on the Directors’ current view and information known to them at the date of this presentation. The Directors do not make any undertaking to update or revise any forward-looking statements, whether as a result of new information, future events or otherwise. Nothing in this presentation should be construed as a profit forecast