Embed Size (px)
Citation preview


ISSN 0974-0775
Bimonthly
(International Journal of Applied Agricultural & Horticultural Sciences)
GREEN FARMING
May-June 2016
CONTENTS
Number 3Volume 7
Screening of pigeonpea genotypes for drought stress at early vegetative phase in Alfisol and Vertisol
Heterosis, combining ability and molecular characterization in fieldpea ( L. var arvense)
Assessment of variability, heritability and divergence among the traditional rice genotypes using PVC pipes under
control and low-moisture stress condition
Genetic variability for yield and related attributes in rice under aerobic and normal condition
Pattern of relationship among yield and yield component traits in rice ( ) under drought condition
Evaluation of landraces of rice ( L.) for genetic diversity
Inter-relationship of yield and its component characters in French bean ( L.)
Correlation and path analysis studies for growth and quality traits in sweet sorghum ( )
Combining ability analysis and gene action of yield and yield contributing characters in popcorn ( var. )
Correlation and path coefficient analysis among maize ( ) hybrids for yield and yield components
Study of genetic variability parameters among linseed ( ) genotypes for yield & yield components
Induction of mutations for yield attributing characters in groundnut ( L.)
Studies on genetic diversity in groundnut ( L.) germplasm
Genetic variability, heritability, genetic advance and correlation of yield and quality traits in segregating generation
of upland cotton
Genetic variability and correlation studies in biparental progenies of eggplant ( L.)
Combining ability, gene action and heterosis studies involving SI and CMS lines and testers in cabbage
Stability analysis for fruit yield and its components in tomato ( L.)
�
�
�
�
�
�
�
�
�
�
�
�
�
�
�
�
�
M.G. MULA, S.B. PATIL, J. ADEN, A. RATHORE , ANILKUMAR VEMULA and R.V. KUMAR
SURABHI CHAUHAN, A.M. PATEL, SWETA MISHRA, P.T. PATEL, TARUN J. KHATRANI and D.J. JOSHI
UDAY KUMAR H.R., GANGAPRASAD S., RAGHAVENDRA P. and SHASHIDHAR H.E.
KHUSHBOO CHANDRA, NILANJAYA and RAJESH KUMAR
SANTOSH KUMAR, N.K. SINGH, RAJESH KUMAR, NILANJAYA, CHANDAN KUMAR and PRITI KUMARI
E. UMARANI, K. RADHIKA, V. PADMA and L.V. SUBBARAO
M.G. PATIL, KUSHAL, K. KAVITA, S.S. PATIL, Y. PAMPANNA and R.P. JAIPRAKASHNARAYAN
S.B. ZADE, S.S. AMBEKAR, D.G. INGOLE and S.A. KADAM
M. SRIDHAR, K. MURALI KRISHNA, RAZIA SULTANA and M.H.V. BHAVE
K. SRAVANTI, I. SWARNALATHA DEVI, M.R. SUDARSHAN and K. SUPRIYA
NIMIT KUMAR and SATISH PAUL
M.R. KHARADE, V.V. UJJAINKAR and S.N. DESHMUKH
MUKESH BHAKAL, G.M. LAL and P.K. RAI
K.S. USHARANI, P. AMALABALU and N.M. BOOPATHI
AANCHAL CHAUHAN and K.S. CHANDEL
HAMENT THAKUR and VIDYASAGAR
SONAM SPALDON, R.K. SAMNOTRA, SANJEEV KUMAR, SANDEEP CHOPRA and ANIL BHUSHAN
Pisum sativum
Oryza sativa
Oryza sativa
Phaseolus vulgaris
Sorghum biocolor
Zea mays Everta
Zea mays
Linum usitatissimum
Arachis hypogaea
Arachis hypogaea
Solanum melongena
Solanum lycopersicum
Contd. ....
Previous issue :
Vol. No. pp. 254-5067, 2,Research Papers
......... 507
......... 520
......... 527
......... 532
......... 537
......... 541
......... 546
......... 551
......... 555
......... 512
........ 569
........ 574
........ 580
........ 586
........ 558
NAAS Rating : 4.79
(Abbreviation : )Green Farming Int. J.
........ 562
........ 566
Genetic divergence in ( (L.) Gaertn.)
Studies on genetic variability in M generation for yield characters in rice ( L.)
Genetic diversity analysis in blackgram [ (L.) Hepper] based on quantitative traits
Genetic variability, heritability and genetic advance studies in brinjal ( L.)
Impact of land configuration and nutrient management on productivity, quality and moisture use efficiency of cotton
Response of time of application and different N levels through fertigation on growth, cob yield & WUE of sweet corn
Effect of different fertility levels and weed management practices on productivity, profitability, soil fertility
and weed dynamics in winter maize ( L.)
Effect of zinc and sulphur on the biochemical characteristics of Indian mustard ( L.) Czern and Coss
Determination of critical limits of boron for in soils of Kumoun region of Uttarakhand
Effect of fertility levels and weed management practices on physiological growth parameters of irrigated wheat
Yield maximization of late sown wheat through INM approach and its consequence on physico-chemical
properties of soil
Workload of women in conventional and organic farming in the selected agro-climatic zones of northern Karnataka
Tree plantation for the control of soil salinity and water table in canal commands, India
Nutritional status of apple orchards in district Shimla of Himachal Pradesh
Yield and economics of organic nutrition in direct seeded rice
Evaluation studies of oriental pickling melon ( ) genotypes for growth, yield and quality traits
Character association and path analysis studies in wild melon ( subsp. )
Assessment of different chinese cabbage genotypes for growth, yield and quality
Growth, flowering and corm production of gladiolus as influenced by various planting time and chemicals
ragi Eleusine coracana
Oryza sativa
Vigna mungo
Solanum melongena
Bt
Zea mays
Brassica juncea
Brassica napus
Cucumis melo
Cucumis melo agrestis
�
�
�
�
�
�
�
�
�
�
�
�
�
�
�
�
�
�
�
�
K. IMTIAZ AHMED, N.V. NAIDU, V. RAJA RAJESWARI and K.H.P. REDDY
LAISANGBAM BANDANA DEVI, RAVI BISHNOI and G. SURESH BABU
ASIF HADIMANI, C.R. KONDA, J.M. NIDAGUNDI and RAJENDRAGOUDA PATIL
M.H. IBAAD, V. SRINIVASA and H.T. SHRUTHI
W.N. NARKHEDE, S.K. NAYAK, V.K. SUTAR and B.R. JAWARE
J.R. PATEL, G.J. PATEL, K.N. PRAJAPATI and K.P. PATEL
SANJU KUMAWAT, A.C. SADHU, SEEMA SHARMA and HANSA LAKHRAN
MANJULA UDIKERI, B.G. KOPPALKAR, B.K. DESAI and KESHAVAMURTHY G.M.
N.A. KHAN, RAJA HUSAIN, NITIN VIKRAM, AKHTAR ALI, KUNVAR GYANENDRA and SHIVANI
SHILPI GUPTA, P.C. SRIVASTAVA and D.K. SINGH
JANMEJAY SHARMA, S.S. TOMAR, R.L. RAJPUT, BHUSHAN LAL PRAJAPATI and SHASHI YADAV
U.P. SHAHI, DESHRAJ, ASHISH DWIVEDI, B.P. DHYANI, ASHOK KUMAR and ROOP KISHORE
RAJESHWARI DESAI and SUMANGALA P.R.
M.V. MANJUNATHA, M. HEBBARA, V.B. KULIGOD and S.G. PATIL
KANWAR SINGH, J.N. RAINA and ASHOK KUMAR NANGLIYA
M.A. NISHAN, L. GIRIJADEVI and V.L. GEETHAKUMARI
SHRUTI P.G., V.M. GANIGER, BHUVANESHWARI G., M.B. MADALAGERI, Y.K. KOTIKAL, MANJUNATHA G.
and KANTESH G.
SHIVAPPA M. KARADI, V.M. GANIGER, SIDDAPPA, VITTAL MANGI and BHUVANESHWARI G.
S. BASFORE, U. THAPA and S.B. CHATTOPADHYAY
M. RAJA NAIK, D. SREEDHAR and M. RAMAIAH
3
Yield and yield components of pigeonpea as influenced by nutrient management practices in pigeonpea
and clusterbean intercropping system
Contd. ....
........ 595
........ 598
........ 602
........ 606
........ 611
........ 615
........ 619
........ 628
........ 623
........ 633
........ 638
........ 642
........ 649
........ 654
........ 591
........ 659
........ 663
........ 666
........ 670
........ 673
Study of INM on growth, yield and quality in China aster ( ) cv. “Phule Ganesh Pink”
Growth, yield & quality of Kalmegh ( Nees.) as influenced by seedling treatment with
plant growth promoting rhizobacteria
Integrated management of wilt of chickpea ( L.) caused by f. sp.
Effects of antagonistic and compatibility of some native spp. under Terai agro-ecological region of W.B.
Nutrients changes during off-season flowering in custard apple cv. Arka Sahan induced by pruning and defoliation
Effect of rooting media on growth, survival and economics production of air layers of guava cv. Sardar
Genetic variability and correlation studies for fruit yield and quality parameters in mango ( L.)
Physical properties of 'Rajapuri' & 'Kesar' mango fruits and testing of weight fruit grader based on the physical properties
Effect of pre-harvest foliar application of calcium on post-harvest life of guava fruits
Physical, functional, nutrient and sensory characteristics of ready to eat flakes of little millet ( L.)
Development of low gluten biscuits using Buckwheat ( : Safety and quality studies
Studies on low temperature storage and duration on flower and bulb production in cv 'Elite'
Supercritical fluid extraction (SFE) of bioactive flavonoids from mulberry ( L.) leaf powder
Production of tea vinegar by semicontinuous fermentation using immobilized cells of
Development and standardization of tulsi-kokum herbal tea
Shelf-life and cost of production of blended with coconut by sensory evaluation
Phytochemicals in noni fresh fruit juice and their composition in response to applied nutrients
Effect of age of seedlings on growth, yield and quality of onion ( ) in under North Gujarat condition
Natural Farming : A Key to Uplift Rural India
Callistephus chinensis
Andrographis paniculata
Cicer arietinum Fusarium oxysporum ciceri
Trichoderma
Mangifera indica
Panicum miliare
Fagropyrum esculentum)
Asiatic Lilium
Morus alba
Acetobacter aceti
khoa burfi
Allium cepa rabi
�
�
�
�
�
�
�
�
�
�
�
�
�
�
�
�
�
�
�
�
�
ILA PITHIYA, D.K. VARU and MITAL VAGHASIYA
MANJUNATHA B., MALLIKARJUNA GOWDA A.P., HAREESH D. and T.N. RANJINI
P.N. SHYLA, FATIMA SADATULLA, PALLAVI and BHANUPRAKASH K.J.
D.S. THAWARE, O.D. KOHIRE and V.M. GHOLVE
M.K. ROY, S. HEMBRAM, S. DUTTA and S. RAY
G.M. VINAY, R. CHITHIRAICHELVAN, ENETTE GEETHIKA SEQUIRA and JAGANATH S.
M.C. PATEL, D.A. PATEL, K.V. PATEL, N.V. SONI, B.N. SATODIYA and R.G. JADAV
SUNKAM MAHESH, KULAPATI HIPPARAGI, I.B. BIRADAR, S.R. PATIL and BALESH GOUDAPPANAVAR
V.B. BHALODIYA, D.C. JOSHI and B.L. JANI
K.A. DAPEWAR, S.G. BHARAD, K. SATKAR and P.M. VARANE
KAVITA PATIL and BHARATI CHIMMAD
QURAAZAH AKEEMU AMIN, HAFIZA AHSAN, TOWSEEF A. WANI and QAZI NISSAR
K.M. MALIK, M.Q. SHIEKH and I.T. NAZKI
RAMYAV., UDAYKUMAR NIDONI, JAYARAMANAIK N.,ASHOKAJ., SHARANAGOUDAHIREGOUDAR,
RAMACHANDRA C.T., LAVANYA V. and GOUDRA PROMOD GOUDA
NAVEET KAUSHAL and R.P. PHUTELA
P.P. THAKUR, P.N. SATWADHAR and H.W. DESHPANDE
S.S. TALEKAR, S.P. PATIL, N.S. SHIKALGAR and D.V. BAINWAD
H.R. BHOOMIKA, M. VASUNDHARA and K.G. SANTOSH
B.R. KUMBHKAR, N.M. PATEL and S.G. MORE
NARENDRA SINGH RATHORE
RAVINDRANATH N., S.N. PATIL, SATISH P., ANUPAMA H. and SUNKAM M.
Growth and yield parameters of V mulberry and rearing performance of silkworm L. as influenced
by customized fertilizers
1 Bombyx mori
Effect of mango variety and time of grafting on graft-take, leaves & girth of rootstock in polyhouse and shade net
Strategic Vision Message : 33
........ 680
........ 683
........ 687
........ 694
........ 698
........ 702
........ 706
........ 715
........ 710
........ 720
........ 725
........ 729
........ 733
........ 738
........ 743
........ 747
........ 751
........ 755
........ 758
Back Inner Page
........ 677
Rice ( L.), the most important staple food
crop of the globe. Nearly 90 per cent of world's rice is grown
and consumed with 60 per cent of population, where, about
two-thirds of world's poor live in Asian subcontinent. Hence,
'Rice is life' for human world (Khush and Virk, 2000). World
wide there are 54 million ha of rainfed lowlands, which
contribute 19% of the world's total rice production and 14
million ha of rainfed uplands, which contribute 4% of the
world's total rice production (Maclean , 2002). Rainfed
low lands are characterised by uncertain and erratic rainfall,
which destabilises the yield in yearly fluctuations. Therefore,
drought is considered to be one of the major constrains for
rice production in worldwide areas (Herdt, 1991). Breeding for
drought tolerance is really a challenging task because of
complexity involved in the genetics of its component traits.
The genotypic coefficient of variation measures the range
of variability available in a crop and also enables to compare
the amount of variability present in different characters. The
phenotypic expression of the character is the result of
interaction between genotype and environment. Hence, the
total variance needs to be partitioned into heritable and non-
heritable components to assess the inheritance pattern of the
particular character under study. Heritability indicates the
relative degree at which a character is transmitted from
parent to offspring. Hence, it is essential to know the degree of
diversity and variability present if local germplasm lines,
which forms the basis for selecting desirable genotypes. In
this context the present study was undertaken to study the
diversity and variability parameters among the 64 selected
local rice cultivars.
Oryza sativa
et al.
ABSTRACT
The nature and magnitude of variability and genetic divergence were estimated in 64 rice genotypes by considering 10 traits
under controlled condition (PVC pipes).Analysis of variance found to be significant for all the characters under both in control
and low-moisture stress condition. The higher magnitude of PCV and GCV was recorded for traits like root length, root
number, root volume, dry root weight and grain yield indicates the presence of considerable degree of variability. High
heritability coupled with high genetic advance as per cent mean was registered for root length, root number, root volume, dry
root weight and grain yield suggested preponderance of additive gene action in the expression of these characters. Based on
D values, 64 genotypes were grouped into 12 clusters in control and 13 clusters in low-moisture stress indicates that
genotypes under study were genetically diverse. The maximum inter-cluster D value of 34.78 between cluster II and cluster
VIII under control condition, whereas 42.45 between cluster V and cluster XI under low-moisture stress condition indicated
wider genetic diversity among the genotypes between these groups. Cluster IV with overall score of 112.5 in control and 98 in
low-moisture stress condition across the 10 characters received highest rank, indicating the presence of most promising
genotypes in this clusters. Among the traits studied, grain yield contributed maximum to divergence in both contrasting
moisture regimes, hence importance has to be given for this during selection. In all the studied genotypes, Azucena, SKAU-
98, Bangaradagundu, Kougisaale, Navalaisaale, Mukkanna, Sampige and Doddiga could be utilized for further breeding
programmes to obtain suitable varieties for drought.
2
2
Key words : Diversity, Drought tolerant, Moisture stress, Rice genotype, Root traits, PVC pipes, Variability.
INTRODUCTION
Received : 06 November 2015 ; Revised accepted : 09 April 2016
Green Farming Vol. (3) : 520-526 ;7 May-June, 2016
UDAY KUMAR H.R. , GANGAPRASAD S. RAGHAVENDRA P. and SHASHIDHAR H.E.a1* b2 a3+ a4
,a
b
Department of Genetics and Plant Breeding, University of Agricultural Sciences, Bangalore - 560065
Deptt. of Genetics and plant breeding, College of Agriculture, Shivamogga, (UAS, Bangalore) - 560 065 (Karnataka)
Research Paper
Assessment of variability, heritability and divergence among
the traditional rice genotypes using PVC pipes under control
and low-moisture stress condition
1,3
2,4
P.G. Student *([email protected])
([email protected]), Professor+
19

MATERIALS AND METHODS
RESULTS AND DISCUSSION
Plate 1
& 2
Plate 3
Genetic variability parameters for grain yield and root
related characters : Table 1
Table 2
The material for the present study consisted of 64
traditional rice genotypes drawn from the rice germplasm
maintained at Organic Farm Research Centre, Zonal Agric.
Res. Station, Navile, Shimoga. This experiment was
conducted during season 2012, under rain water
shelter at Deptt. of Biotechnology, College of Agriculture,
UAS, G.K.V.K, Bangalore. The experiment was carried out
using PVC pipes in 8 x 8 Simple Lattice Design. PVC pipes of
60cm length and 18cm diameter were arranged in 8 columns
and 8 rows under rain water shelter with two replications for
control and low-moisture stress conditions. The pipes were
filled with a mixture of sandy clay loam and FYM in 4:1
proportion. Seeds were directly sown into the pipes. Few
days after germination seedlings were thinned out leaving
only one seedling in each pipe. (Hemamalini 2000). The
low-moisture stress was imposed thirty days after sowing by
withholding the irrigations and the plants were irrigated only
when they showed wilting symptoms, whereas in control
treatments the plants were irrigated once in two days (
).
The sampling in both the condition was done at maturity
stage. The pipes were removed carefully and put in water
over night to loosen the soil. The next day, roots were cleaned
thoroughly and carefully using fine jet of water. The intact root
system and separated roots of each plant were collected and
stored in poly bags containing water for recording
observations ( ).
The observations were recorded on sample plant of each
genotype for yield & root related characters.
The data collected on sample plant of
each genotype were subjected to the statistical analysis by
using WINDOSTAT software for estimation of genetic variability
parameters and diversity analysis using Mahalanobis D (1936)
method.
As evident from the the analysis of
variance are given for various morphological characters were
statistically tested and found to be significant for all the
characters under both in control and low-moisture stress
condition.
The genetic variability parameter for all the 10 traits under
control and low-moisture stress conditions are furnished in the
.
The variability parameters revealed that a narrow difference
between phenotypic and genotypic coefficient of variation for
most of the characters studied indicated that lesser influence of
environment for those traits. The higher magnitude of
phenotypic and genotypic coefficient of variation was recorded
for traits like root length, root number, root volume, dry root
weight and grain yield indicates the presence of considerable
degree of variability. The same was reported by Latha (1996)
and Gireesha (2000). However moderate estimates were
observed for plant height, number of tillers per plant and
number of productive tillers per plant indicated that presence of
considerable variability. Whereas for days to 50 per cent
flowering and days to maturity showed lower estimates of
phenotypic and genotypic coefficient of variation indicated
lower degree of variability in both control and low moisture
stress condition (Table 2).
The proportion of genetic variability which is transmitted
from parents to offspring is reflected by heritability (Lush 1949).
Heritability and genetic advance as per cent mean when
calculated together would prove more useful in predicting the
resultant effect of selection on phenotypic expression (Johnson
1955). Based on this consideration high heritability
coupled with high genetic advance as per cent mean was
registered for root length, root number, root volume, dry root
kharif
et al.,
et al.
et al.,
Method of sampling and recording of observations :
Statistical analysis :
2
521 Kumar et al.
20
Green Farming 7 (3)
Plate 1. Method of filling PVC pipes for root study
Plate 2. Over view of 64 traditional rice genotypes
evaluated for root morphological characters
Plate 3. Method of root sampling

weight and grain yield. Similarly Hemamalini (1997) reported
high heritability and genetic advancement as per cent mean for
root number, root volume and dry root weight, suggesting the
preponderance of additive gene action in the expression of
these characters. Therefore selection may be effective through
these characters. Whereas, high heritability associated with
moderate genetic advancement as per cent mean was
observed for plant height, whereas days 50 per cent flowering
and days to maturity recorded high heritability and low genetic
advancement as per cent mean in both control and low
moisture stress condition which revealed that non-additive
gene action in the expression of these characters in their
inheritance, hence in this case selection may not be effective
(Table 2). These findings were in agreement with the findings of
earlier researchers Khare (2014); Pratap (2012);
Gangashetty (2013); Vaithiyalingal & Nadarajan (2006).
In the present experiment the higher phenotypic and
genotypic coefficient of variability for number of productive tillers
per plant, root volume, dry root weight and grain yield with high
heritability coupled with very high genetic advancement as per
cent mean was observed under low-moisture stress condition
as compared to control condition, hence direct selection for
these characters improves the stress tolerance (Table 2).
et al. et al.
et al.
21 Green Farming
522May-June 2016
Source of variation dfDays to 50% flowering Days to maturity Plant height (cm) Root length (cm) Root number
C S C S C S C S C S
Replication 1 0.031 31.00 0.07 116.28 6.57 4.88 101.53 1.12 731.53 38.28
Genotypes (unadjusted) 63 97.98** 86.08** 214.61** 104.93** 290.10** 254.99** 542.56** 456.01** 1872.15** 1127.71**
Blocks within adjusted 14 4.66 8.30 13.92 8.41 4.00 3.85 11.02** 4.84 5.89 15.89
Error intra block 49 7.97 6.31 10.21 7.07 5.87 5.23 3.10 6.48 5.22 8.47
CD (5%) 5.20 5.18 6.61 5.44 4.61 4.41 3.81 4.92 4.65 6.14
CV (%) 2.74 3.02 2.40 2.18 2.78 2.98 2.97 4.16 2.60 4.14
Source of variation dfNo. of tiller/plant No. of productive Tiller/plant Root volume Dry root weight Grain yield (g)/plant
C S C S C S C S C S
Replication 1
Genotypes (unadjusted) 63
Blocks within adjusted 14
Error intra block 49
CD (5%)
CV (%)
0.78 29.07 1.53 27.19 279.19 39.38 128.00 6.57 105.12 45.12
21.95** 27.73** 13.47** 15.24** 789.47** 473.46** 116.30** 70.47** 44.19** 38.63**
4.90 1.33 4.94* 2.17 68.31 2.33 6.47** 2.29 1.65 1.75
2.74 3.38 2.20 1.99 83.24 5.25 2.53 3.32 2.40 1.72
3.48 3.00 3.16 2.86 17.88 3.91 3.411 3.47 2.95 2.64
9.30 9.49 11.66 13.611 20.55 6.66 9.09 18.102 9.88 16.49
** Significance at 1 %, * Significance at 5 % C-control, S-low-moisture stress
Table 1. Analysis of variance for yield and root related characters in traditional rice genotypes evaluated by using PVC
pipes under control and low-moisture stress condition
Variability, heritability and divergence among rice genotypes using PVC pipes
Sr.Characters
Mean ± SE Range PCV (%) GCV (%)h broad
GAM (%)
C S C S C S C S C S C S
2
No.sense (%)
1 Days to 50% flowering 94.59±2.59 85.16±2.57 75.50-110.50 70.50-100.00 7.66 7.99 7.12 7.39 86.24 85.45 13.62 14.08
2 Days to maturity 136.85±3.28123.96±2.70 111.50-164.50105.00-144.00 7.76 6.04 7.37 5.63 90.22 86.86 14.42 10.81
3 Plant height (cm) 82.30±2.29 73.50±2.19 62.50-111.50 51.50-103.50 14.77 15.50 14.49 15.21 96.31 96.21 29.30 30.73
4 Root length (cm) 63.81±1.89 58.78±2.45 34.00-109.00 25.00-95.50 25.92 25.86 25.69 25.51 98.22 97.35 52.45 51.86
5 Root number 89±2.31 73.00±3.05 21.50-153.50 21.50-125.50 34.42 32.32 34.32 32.03 99.43 98.22 70.51 65.41
6 No. of tillers per plant 18.65±1.73 15.74±1.49 9.00-27.50 10.00-23.50 19.01 24.87 16.40 22.37 74.37 80.90 29.13 41.44
7 No. of productive tillers 13.50±1.57 10.47±1.42 5.50-20.50 5.50-16.50 21.14 28.05 17.10 24.52 65.42 76.43 28.49 44.17
8 Root volume 43.30±8.9 29.24±1.9 11.50-89.00 6.50-71.00 46.99 52.87 46.69 52.35 98.69 98.07 95.55 106.81
9 Dry root weight 18.67±1.69 9.55±1.73 6.00-33.50 2.50-31.00 32.39 63.47 40.79 60.75 90.37 91.59 60.29 119.76
10 Grain yield (g)/plant 14.87±1.47 7.69±1.31 5.50-29.50 2.50-25.50 32.39 56.37 30.79 53.90 90.37 91.44 60.29 106.18
per plant
C-control, S-low-moisture stress
Table 2. Estimates of range, mean, variability, heritability and genetic advance for yield and root related characters in
traditional rice genotypes evaluated by using PVC pipes under control and low-moisture stress condition
22
523
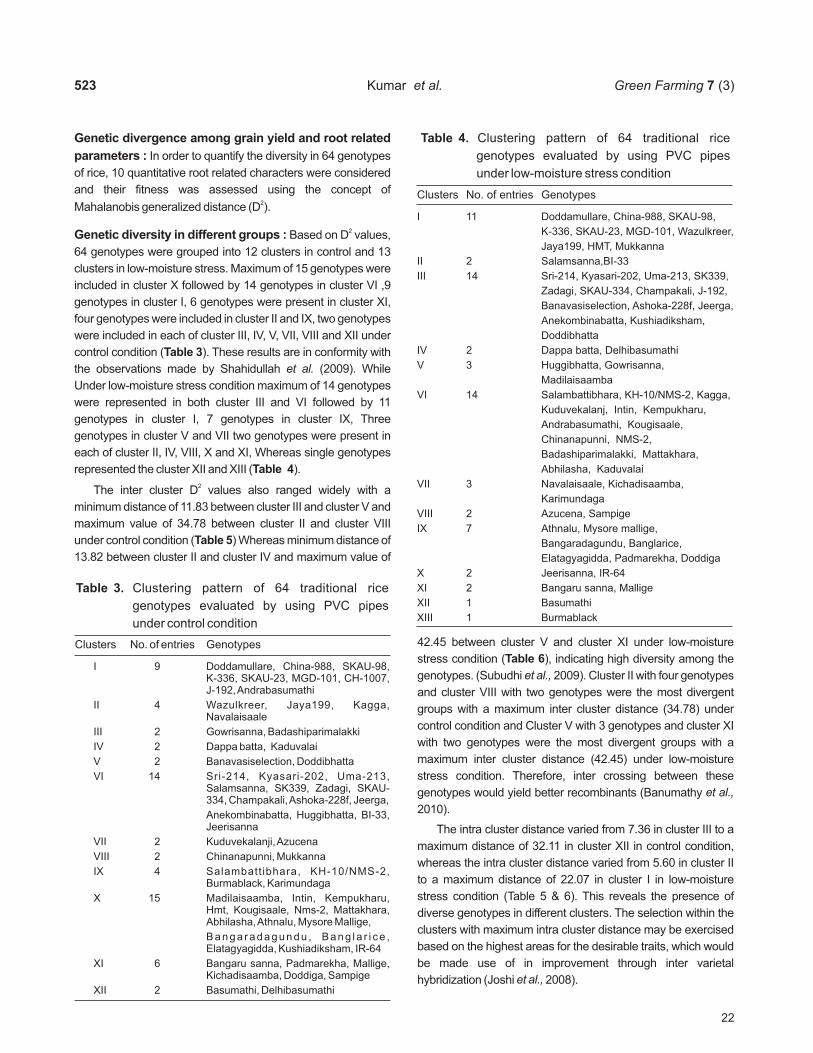
Genetic divergence among grain yield and root related
parameters :
Genetic diversity in different groups :
In order to quantify the diversity in 64 genotypes
of rice, 10 quantitative root related characters were considered
and their fitness was assessed using the concept of
Mahalanobis generalized distance (D ).
Based on D values,
64 genotypes were grouped into 12 clusters in control and 13
clusters in low-moisture stress. Maximum of 15 genotypes were
included in cluster X followed by 14 genotypes in cluster VI ,9
genotypes in cluster I, 6 genotypes were present in cluster XI,
four genotypes were included in cluster II and IX, two genotypes
were included in each of cluster III, IV, V, VII, VIII and XII under
control condition ( ). These results are in conformity with
the observations made by Shahidullah (2009). While
Under low-moisture stress condition maximum of 14 genotypes
were represented in both cluster III and VI followed by 11
genotypes in cluster I, 7 genotypes in cluster IX, Three
genotypes in cluster V and VII two genotypes were present in
each of cluster II, IV, VIII, X and XI, Whereas single genotypes
represented the cluster XII and XIII ( ).
The inter cluster D values also ranged widely with a
minimum distance of 11.83 between cluster III and cluster V and
maximum value of 34.78 between cluster II and cluster VIII
under control condition ( ) Whereas minimum distance of
13.82 between cluster II and cluster IV and maximum value of
42.45 between cluster V and cluster XI under low-moisture
stress condition ( ), indicating high diversity among the
genotypes. (Subudhi 2009). Cluster II with four genotypes
and cluster VIII with two genotypes were the most divergent
groups with a maximum inter cluster distance (34.78) under
control condition and Cluster V with 3 genotypes and cluster XI
with two genotypes were the most divergent groups with a
maximum inter cluster distance (42.45) under low-moisture
stress condition. Therefore, inter crossing between these
genotypes would yield better recombinants (Banumathy
2010).
The intra cluster distance varied from 7.36 in cluster III to a
maximum distance of 32.11 in cluster XII in control condition,
whereas the intra cluster distance varied from 5.60 in cluster II
to a maximum distance of 22.07 in cluster I in low-moisture
stress condition (Table 5 & 6). This reveals the presence of
diverse genotypes in different clusters. The selection within the
clusters with maximum intra cluster distance may be exercised
based on the highest areas for the desirable traits, which would
be made use of in improvement through inter varietal
hybridization (Joshi 2008).
2
2
2
Table 3
Table 4
Table 5
Table 6
et al.
et al.,
et al.,
et al.,
Green Farming 7 (3)Kumar et al.
Clusters No. of entries Genotypes
I 9 Doddamullare, China-988, SKAU-98,K-336, SKAU-23, MGD-101, CH-1007,J-192,Andrabasumathi
II 4 Wazulkreer, Jaya199, Kagga,Navalaisaale
III 2 Gowrisanna, Badashiparimalakki
IV 2 Dappa batta, Kaduvalai
V 2 Banavasiselection, Doddibhatta
VI 14 Sri-214, Kyasari-202, Uma-213,Salamsanna, SK339, Zadagi, SKAU-334, Champakali,Ashoka-228f, Jeerga,
Anekombinabatta, Huggibhatta, BI-33,Jeerisanna
VII 2 Kuduvekalanji,Azucena
VIII 2 Chinanapunni, Mukkanna
IX 4 Salambatt ibhara, KH-10/NMS-2,Burmablack, Karimundaga
X 15 Madilaisaamba, Intin, Kempukharu,Hmt, Kougisaale, Nms-2, Mattakhara,Abhilasha,Athnalu, Mysore Mallige,
Banga radagundu , Bang la r i ce ,Elatagyagidda, Kushiadiksham, IR-64
XI 6 Bangaru sanna, Padmarekha, Mallige,Kichadisaamba, Doddiga, Sampige
XII 2 Basumathi, Delhibasumathi
Table 3. Clustering pattern of 64 traditional rice
genotypes evaluated by using PVC pipes
under control condition
Clusters No. of entries Genotypes
I 11 Doddamullare, China-988, SKAU-98,
K-336, SKAU-23, MGD-101, Wazulkreer,
Jaya199, HMT, Mukkanna
II 2 Salamsanna,BI-33
III 14 Sri-214, Kyasari-202, Uma-213, SK339,
Zadagi, SKAU-334, Champakali, J-192,
Banavasiselection, Ashoka-228f, Jeerga,
Anekombinabatta, Kushiadiksham,
Doddibhatta
IV 2 Dappa batta, Delhibasumathi
V 3 Huggibhatta, Gowrisanna,
Madilaisaamba
VI 14 Salambattibhara, KH-10/NMS-2, Kagga,
Kuduvekalanj, Intin, Kempukharu,
Andrabasumathi, Kougisaale,
Chinanapunni, NMS-2,
Badashiparimalakki, Mattakhara,
Abhilasha, Kaduvalai
VII 3 Navalaisaale, Kichadisaamba,
Karimundaga
VIII 2 Azucena, Sampige
IX 7 Athnalu, Mysore mallige,
Bangaradagundu, Banglarice,
Elatagyagidda, Padmarekha, Doddiga
X 2 Jeerisanna, IR-64
XI 2 Bangaru sanna, Mallige
XII 1 Basumathi
XIII 1 Burmablack
Table 4. Clustering pattern of 64 traditional rice
genotypes evaluated by using PVC pipes
under low-moisture stress condition

Analysis of cluster means :
Contribution of characters towards divergence :
All the genotypes were spread
over 12 clusters in control and 13 clusters in low-moisture stress
condition and means were scored across the clusters for all the
10 characters. The highest cluster mean was given the first rank
and next cluster possessing next best means were given 2 , 3
and so on for all the traits (except for days to 50 per cent
flowering and days to maturity where least mean was given
score 1). Based on the overall score across 10 traits, the
clusters were ranked. The lowest scoring cluster were given first
rank and next cluster possessing the score above the previous
one were 2 , 3 and so on. Accordingly, cluster IV with overall
score of 112.5 in control and 98 in low-moisture stress condition
across the 10 characters received highest rank, indicating the
presence of most promising genotypes in this cluster (
). Overall, the clusters could be regarded as useful sources of
genes for yield and its components and the genotypes from
these clusters, therefore, could be used in crop improvement
programmes to incorporate superior drought tolerant traits.
Among
the 10 quantitative characters studied, the most important
character contributing to the divergence under control condition
was grain yield. This was followed by root volume, dry root
weight, root number. Whereas under low-moisture stress
condition most important character contributing to the
divergence was grain yield, followed by dry root weight, root
volume, root length, these traits are responsible for increasing
yield under stress ( ). Hence, these characters should bend rd
nd rd
Table 7 &
8
Table 9
May-June 2016 524
23 Green Farming
Cluster I II III IV V VI VII VIII IX X XI XII
I 32.73 22.23 25.26 21.80 27.80 24.63 25.30 30.80 25.98 30.92 25.49
II 33.07 40.21 28.28 38.85 29.17 34.78 25.71 31.99 24.90 32.75
III 14.02 11.83 21.71 27.24 17.08 26.05 22.47 27.46 21.01
IV 16.59 24.10 31.35 23.99 31.52 26.97 34.26 22.12
V 23.71 24.45 21.66 22.09 22.06 23.93 20.12
VI 28.39 23.59 33.91 27.15 34.55 27.15
VII 23.87 31.45 23.14 29.94 25.77
VIII 29.31 22.78 29.79 23.76
IX 29.84 25.44 28.59
X 29.92 25.38
XI 30.24
XII
26.80
18.88
7.36
7.76
8.62
27.87
9.54
9.71
27.15
25.29
28.17
32.11
Table 5. Average inter and intra cluster distances for yield and root related characters in traditional rice genotypes
evaluated by using PVC pipes under control condition
* Diagonal values indicate intra cluster distances, * Above diagonal values indicate inter cluster distances
Variability, heritability and divergence among rice genotypes using PVC pipes
Cluster I II III IV V VI VII VIII IX X XI XII XIII
I 20.79 20.88 19.45 23.65 20.73 22.44 29.01 20.56 22.07 30.66 20.46 29.50
II 20.30 13.82 28.43 20.81 15.19 19.39 20.18 21.57 21.12 21.40 19.89
III 18.68 22.23 20.02 22.47 30.63 20.55 19.68 31.92 19.31 31.10
IV 25.09 17.80 15.81 23.83 18.90 20.20 25.87 15.83 27.63
V 21.76 31.30 38.06 21.31 21.10 42.45 19.18 41.17
VI 22.69 30.04 19.23 21.26 31.89 18.03 31.45
VII 23.44 23.26 23.55 21.73 23.98 21.21
VIII 28.15 34.75 19.92 27.13 20.33
IX 22.56 31.18 19.24 30.36
X 37.62 21.39 33.96
XI 33.70 15.22
XII 34.17
XIII
22.07
5.60
20.36
6.49
16.43
19.57
19.13
11.18
19.32
11.89
12.37
0.00
0.00
Table 6. Average inter and intra cluster distances for yield and root related characters in traditional rice genotypes
evaluated by using PVC pipes under low-moisture stress condition
* Diagonal values indicate intra cluster distances, * Above diagonal values indicate inter cluster distances
Sr.No. CharacterContribution (%)
C S
1 Days to 50 per cent flowering 0.24 1.38
2 Days to maturity 0.14 0.79
3 Plant height 3.27 6.00
4 Root length (cm) 8.82 10.46 (IV)
5 Root number 13.19 (IV) 2.67
6 No. of tiller per plant 0.19 0.74
7 No. of productive tiller per plant 0.00 0.49
8 Root volume 22.22 (II) 15.02 (III)
9 Dry root weight 18.05 (III) 18.65 (II)
10 Grain yield (g) 33.82 (I) 44.19 (I)
Total 100 100
*C-control, S-low-moisture stress
Table 9. Per cent contribution of each character towards
divergence in traditional rice genotypes
evaluated by using PVC pipes
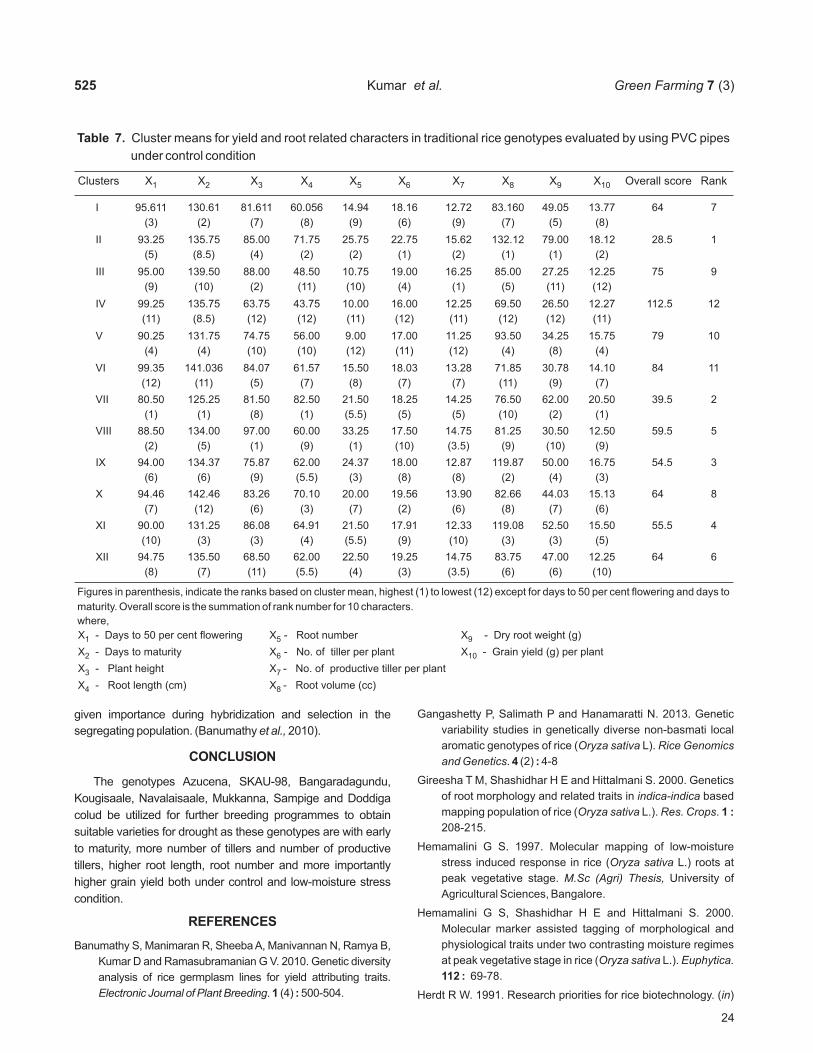
given importance during hybridization and selection in the
segregating population. (Banumathy 2010).
The genotypes Azucena, SKAU-98, Bangaradagundu,
Kougisaale, Navalaisaale, Mukkanna, Sampige and Doddiga
colud be utilized for further breeding programmes to obtain
suitable varieties for drought as these genotypes are with early
to maturity, more number of tillers and number of productive
tillers, higher root length, root number and more importantly
higher grain yield both under control and low-moisture stress
condition.
et al.,
CONCLUSION
REFERENCES
Banumathy S, Manimaran R, Sheeba A, Manivannan N, Ramya B,
Kumar D and Ramasubramanian G V. 2010. Genetic diversity
analysis of rice germplasm lines for yield attributing traits.
. (4) 500-504.
Gangashetty P, Salimath P and Hanamaratti N. 2013. Genetic
variability studies in genetically diverse non-basmati local
aromatic genotypes of rice ( L).
. (2) 4-8
Gireesha T M, Shashidhar H E and Hittalmani S. 2000. Genetics
of root morphology and related traits in based
mapping population of rice ( L.). .
208-215.
Hemamalini G S. 1997. Molecular mapping of low-moisture
stress induced response in rice ( L.) roots at
peak vegetative stage. University of
Agricultural Sciences, Bangalore.
Hemamalini G S, Shashidhar H E and Hittalmani S. 2000.
Molecular marker assisted tagging of morphological and
physiological traits under two contrasting moisture regimes
at peak vegetative stage in rice ( L.).
69-78.
Herdt R W. 1991. Research priorities for rice biotechnology. ( )Electronic Journal of Plant Breeding
Oryza sativa Rice Genomics
and Genetics
indica-indica
Oryza sativa Res. Crops
Oryza sativa
M.Sc (Agri) Thesis,
Oryza sativa Euphytica.
in1 :
4 :
1 :
112 :
525
24
Green Farming 7 (3)Kumar et al.
Clusters X X X X X X X X X X Overall score Rank1 2 3 4 5 6 7 8 9 10
I 95.611
(3) (2) (7) (8) (9) (6) (9) (7) (5) (8)
II 93.25
(5) (8.5) (4) (2) (2) (1) (2) (1) (1) (2)
III 95.00
(9) (10) (2) (11) (10) (4) (1) (5) (11) (12)
IV 99.25
(11) (8.5) (12) (12) (11) (12) (11) (12) (12) (11)
V 90.25
(4) (4) (10) (10) (12) (11) (12) (4) (8) (4)
VI 99.35
(12) (11) (5) (7) (8) (7) (7) (11) (9) (7)
VII 80.50
(1) (1) (8) (1) (5.5) (5) (5) (10) (2) (1)
VIII 88.50
(2) (5) (1) (9) (1) (10) (3.5) (9) (10) (9)
IX 94.00
(6) (6) (9) (5.5) (3) (8) (8) (2) (4) (3)
X 94.46
(7) (12) (6) (3) (7) (2) (6) (8) (7) (6)
XI 90.00
(10) (3) (3) (4) (5.5) (9) (10) (3) (3) (5)
XII 94.75
(8) (7) (11) (5.5) (4) (3) (3.5) (6) (6) (10)
130.61 81.611 60.056 14.94 18.16 12.72 83.160 49.05 13.77 64 7
135.75 85.00 71.75 25.75 22.75 15.62 132.12 79.00 18.12 28.5 1
139.50 88.00 48.50 10.75 19.00 16.25 85.00 27.25 12.25 75 9
135.75 63.75 43.75 10.00 16.00 12.25 69.50 26.50 12.27 112.5 12
131.75 74.75 56.00 9.00 17.00 11.25 93.50 34.25 15.75 79 10
141.036 84.07 61.57 15.50 18.03 13.28 71.85 30.78 14.10 84 11
125.25 81.50 82.50 21.50 18.25 14.25 76.50 62.00 20.50 39.5 2
134.00 97.00 60.00 33.25 17.50 14.75 81.25 30.50 12.50 59.5 5
134.37 75.87 62.00 24.37 18.00 12.87 119.87 50.00 16.75 54.5 3
142.46 83.26 70.10 20.00 19.56 13.90 82.66 44.03 15.13 64 8
131.25 86.08 64.91 21.50 17.91 12.33 119.08 52.50 15.50 55.5 4
135.50 68.50 62.00 22.50 19.25 14.75 83.75 47.00 12.25 64 6
Table 7. Cluster means for yield and root related characters in traditional rice genotypes evaluated by using PVC pipes
under control condition
Figures in parenthesis, indicate the ranks based on cluster mean, highest (1) to lowest (12) except for days to 50 per cent flowering and days to
maturity. Overall score is the summation of rank number for 10 characters.
X - Days to 50 per cent flowering X - Root number X - Dry root weight (g)
X - Days to maturity X - No. of tiller per plant X - Grain yield (g) per plant
X - Plant height X - No. of productive tiller per plant
X - Root length (cm) X - Root volume (cc)
1 5 9
2 6 10
3 7
4 8
where,

Rice Biotechnology.
Agron. J
Oryza.
Oryza sativa SAARC J.Agri.
Crop Improvement
M. Sc. (Agri.) Thesis
Proc. 8 Congr. Genet Heriditas.
Oryza sativa
SAARC Journal ofAgriculture.
African J. Biotech.
Oryza.
Crop Res.
G. S. Kush and G. H. Toenniessen (ed).
CAB International, Wallingford, UK. pp. 19-54.
Johnson H W, Robinson H F and Comstock R E. 1955. Estimates
of genetic and environmental variability in soybean.
(7) 314-318.
Joshi M A, Singh Pritpal, Sarao N K, Sharma R C and Bharaj T S.
2008. Genetic diversity among the rice varieties cultivated in
Punjab. (4) 277-279.
Khare R, Singh A K, Eram S and Singh P K. 2014 Genetic
variability, association and diversity analysis in upland rice
( L.) (2) 40-51 .
Khush G S and Virk P S. 2000, Rice breeding achievements and
future strategies. . 115-144.
Latha J. 1996. Genetic purification and characterisation of
traditional lowland rice accessions. ,
Univ.Agric. Sci., Bangalore.
Lush J L. 1949. Heritability of quantitative characters in farm
animals. . pp. 35.
Maclean J L, Dawe D C, Hardy B and Hettel G P (Eds). 2002.
Sourcebook for the most Important Economic Activity on
Earth, 3 Edn. CABI Publishing, Wallingford, England,
Published in association with: International Rice Research
Institute, West Africa Rice Development Association,
International Centre for Tropical Agriculture and FAO of the
United Nations. pp. 253.
Mahalanobis P C. 1936. On the generalized distance od
statistics. In the proceedings 2 (pp 49-55) India: National
Institute of Science.
Pratap N, Singh P K, Shekhar R, Soni S K and Mall A K. 2012.
Genetic variability, character association and diversity
analyses for economic traits in rice ( L.).
(2) 83-94
Shahidullah S M, Hanafi M M, Ashrafuzzaman M, Ismail M R and
Salam M A. 2009. Phenological characters and genetic
divergence in aromatic rice’s. (14)-
3199-3207.
Subudhi H N, Meher J, Bose L K and Das Sanjukta. 2009.
Genetic diversity studies of promising varieties of eastern
India based on quality characters. (4) 271-274.
Vaithiyalingan M and Nadarajan N. 2006. Genetic variability,
heritability and genetic advance in F population of inter sub-
specific crosses of rice. (3) 476-477.
7 :
45 :
12 :
27 :
10 :
8
46 :
31 :
th
rd
2
25 Green Farming
May-June 2016 526Variability, heritability and divergence among rice genotypes using PVC pipes
Clusters X X X X X X X X X X Overall score Rank1 2 3 4 5 6 7 8 9 10
I
II 95.25 136.00 74.50 54.25 19.50 21.25 14.75 80.50 38.25 7.50 66 5
(13) (13) (6) (10) (3) (1) (1) (6) (4) (9)
III 87.14
(10) (10) (4) (9) (3) (1) (1) (6) (4) (9)
IV 92.50
(12) (11.5) (12) (7) (9.5) (13) (12) (5) (6) (10)
V 88.33 126.50 73.16 65.33 6.50 14.16 10.00 39.66 14.16 9.00 90.5 0
(11) (9) (8.5) (4) (13) (9) (7) (13) (12) (4)
VI 81.53 122.32 72.14 60.64 7.25 17.82 12.10 73.35 24.50 7.60 68.5 7
(4) (4) (10) (6) (9.5) (5) (3) (8) (11) (8)
VII 85.50 123.16 73.16 48.33 9.16 14.33 9.83 96.66 36.83 8.83 67 6
(7.5) (5) (8.5) (12) (6) (7) (8) (3) (5) (5)
VIII 79.75 123.50 60.75 74.50 26.50 15.50 10.25 90.75 67.50 12.25 41.5 2
(3) (6) (11) (1) (1.5) (6) (6) (4) (1) (2)
IX 84.35 125.00 75.78 69.00 13.14 18.14 11.57 73.42 27.21 10.28 49 4
(5) (8) (3) (2) (5) (3) (4) (7) (9) (3)
X 85.50 128.75 73.50 29.75 7.50 12.50 8.00 55.25 10.00 13.75 97 11
(7.5) (11.5) (7) (13) (8) (12) (13) (11) (13) (1)
XI 85.25 124.75 84.50 68.50 14.50 18.00 11.25 122.50 63.50 3.76 46 3
(6) (7) (2) (3) (4) (4) (5) (1) (2) (12)
86.22 119.22 75.09 58.40 8.18 14.31 9.50 71.95 29.22 8.40 72.5 8
(9) (3) (5) (8) (7) (8) (9.5) (9) (8) (6)
126.64 75.28 54.28 6.92 14.03 9.14 67.25 25.46 6.14 97 12
128.75 57.75 58.75 7.25 12.25 8.75 86.75 35.50 6.75 98 13
XII 75.50 118.50 52.50 64.50 7.00 14.00 9.50 54.00 35.00 3.50 84.5 9
(1) (2) (13) (5) (11) (11) (9.5) (12) (7) (13)
XIII 76.50 111.00 90.50 50.50 26.50 18.50 12.50 113.50 48.50 8.00 32.5 1
(2) (1) (1) (11) (1.5) (2) (2) (2) (3) (7)
Table 8. Cluster means for yield and root related characters in traditional rice genotypes evaluated by using PVC pipes
under low-moisture stress condition
Figures in parenthesis, indicate the ranks based on cluster mean, highest (1) to lowest (13) except for days to 50 per cent flowering and days to
maturity. Overall score is the summation of rank number for 10 characters.