1
Field Measurement of Agricultural Tractor Exhaust Gas Emissions Agriculture and Agri-Food Canada Agriculture et Agroalimentaire Canada Environment Canada Environnement Canada Neil McLaughlin, Michael Layer, Project Engineer, Pollution Data Branch, Environment Canada, 351 St. Joseph Blvd., Gatineau, QC K1A 0H3 Research Scientist, Research Branch, Agriculture and Agri-Food Canada, 960 Carling Ave., Ottawa, ON K1A 0C6 Abstract Two Canadian federal government departments, Agriculture and Agri-Food Canada (AAFC) and Environment Canada, are collaborating in a pilot project aimed at obtaining agricultural tractor exhaust gas emissions data under actual field conditions. AAFC’s unique instrumented research tractor will provide the platform for collecting these data. This tractor was developed as a general purpose research tool, and was fitted with a series of sensors and an on-board data logger for measuring and recording tractor operational parameters such as engine speed, drawbar load, and fuel consumption as the tractor is doing normal field work. An instrumented exhaust pipe is being developed to measure exhaust gas temperature, flow, and NOx concentration with provision for future sensors for CO, CO and VOC. Signals from the exhaust pipe instrumentation will be logged on the tractor data logger along with the other tractor operational parameters. Field data can be used directly, or to program a laboratory dynamometer to reproduce the same engine load cycles for comparative emissions measurements on other tractor makes and models. The research will form a basis for development of emissions factors for agricultural field operations. 2 Introduction Total emissions for agriculture have been estimated from standard emissions factors and farm diesel fuel sales data. Emissions factors, often derived from steady state laboratory dynamometer tests do not account for the duty cycle of agricultural tractors. This research project is designed to measure tractor exhaust gas emissions for typical agricultural field operations. Emissions factors can be developed from these measurements, and extrapolated to a regional or national scale using data on cropping systems from agricultural census, and soil types from national soil data bases. Objective 1. To develop instrumentation for measurement of exhaust gas emissions of agricultural tractors under actual field conditions. 2. To document exhaust gas emissions for typical agricultural field operations to provide a basis for development of emissions factors for agriculture. Description The Agriculture and Agri-Food Canada instrumented research tractor (McLaughlin et al. 1993) is being used as a platform for exhaust gas emissions measurement for agricultural field operations (Fig. 1). This unique tractor was fitted with a set of instruments and an on-board data logger to measure and record tractor operational parameters while the tractor is doing normal field work (Fig. 2). An instrumented exhaust pipe is under development (Fig. 3). Emissions sensors include a Horiba Zirconia Oxide NOx sensor, and a Horiba Mexa-700 excess oxygen sensor installed in the exhaust pipe, with provision for future installation of CO, CO , and VOC sensors as the sensors and funds become available. Exhaust gas flow will be measured directly with an Annubar averaging Pitot tube installed in the exhaust pipe. Intake manifold pressure and temperature measurements will provide base data for determination of exhaust gas flow indirectly to provide a check on the direct measurement. The exhaust pipe will be installed on the tractor, and the signals from the various emissions sensors logged on the tractor data logger along with the other tractor operational parameters. The combined data sets will allow development of emissions factors for engine duty cycles typical of different agricultural field operations. 2 Field Experiments Engine power on the instrumented tractor is measured indirectly by engine speed and axle torque. Field data show that fuel consumption closely tracks engine power (Fig. 4). Using a mathematical model of the engine map, engine power can be estimated from fuel consumption and engine speed. The tractor was fitted with a GPS (Global Position System) and the fuel consumption and position data were logged for tillage with a disc ripper in a 28 hectares (400 x 700 metres) field (Fig. 5). The fuel consumption data were subsequently mapped (Fig. 6). The map shows distinct patterns of varying fuel consumption, and engine power, which were due to both field topography (i.e. slope in direction of travel), and variability in the soil conditions. Similar patterns of exhaust gas emissions are expected due to the variability in engine power for tillage of the field. The exhaust gas instrumentation system will allow us to quantify both the average and the variability in emissions for typical field operations for subsequent emissions factor development. Secondary tillage in an east-west direction was done with a field cultivator in the same field (Fig. 7). Fuel consumption was subsequently mapped (Fig. 8). The north-east corner of the field was sandy, and the higher fuel consumption (darker shading) was noted. The cultivator wheels which control the operating depth, sank deeper into the sand resulting in increased tillage depth and higher fuel consumption. This is an example of an activity where the operator could have reduced fuel consumption, and likely NOx emissions, by raising the cultivator slightly while in the sandy soil. Fig. 9 shows fuel consumption for a pass with the cultivator as highlighted in Fig. 8. The pass started at point A on the east side of the field, proceeded westbound to point B on the west side, turned 180º, and returned east bound to point A on the east side. The high fuel consumption for the sandy area in the north east corner of the field is clearly evident at the beginning of the west bound pass, and at the end of the east bound pass. Turning with the implement in the soil at point B produced a very high peak in fuel consumption. This could have been prevented by simply raising the implement for turning. Future Directions Data from the instrumented research tractor can be extrapolated to other makes and models of tractors via two methods. 1. Engine load cycle for agricultural field operations can be determined from field data collected with the instrumented research tractor. These data can be used to duplicate the engine load cycle with a programmable tractor PTO (Power Take Off) dynamometer and emissions measured for other tractors in a laboratory setting. 2. The instrumented exhaust pipe can be installed on other tractors and emissions measured directly for field operations. Acknowledgements References Support of the Agriculture and Agri-Food Canada technical staff is appreciated. Funding for the emissions instrumentation was provided by Environment Canada's Criteria Air Contaminant Division. McLaughlin, N.B., L.C. Heslop, D.J. Buckley, G.R. St.Amour, B.A. Compton, A.M. Jones and P. Van Bodegom. 1993. A general purpose tractor instrumentation and data logging system. Transactions of the ASAE 36:(2) 265-273. Fig. 10 Water brake PTO (Power Take Off) dynamometer connected to tractor PTO. With a programmable dynamometer, field data collected with the instrumented tractor can be used to duplicate engine load cycles for laboratory emissions measurement with other tractors. Fuel Consumption and Engine Power 40 50 60 70 80 0 50 100 150 Time (s) Engine Power (kW) 15 20 25 Fuel Consumption (Litres/h) Engine Power Fuel Consumption Sample Pass Fuel Consumption 18 23 28 33 0 100 200 300 Time (s) Fuel Rate (Litres/h) Sand Sand Turn west bound east bound Point A Point A Point Fig. 1 Instrumented research tractor. The cab extension accommodates the data logger operator, data logger and signal conditioning equipment. Fig. 2 Tractor cut away showing location of various sensors. 1. engine speed 5. 3-point hitch centre 2. radar ground speed 6. fuel consumption 3. implement draft 7. data logger 4. 3-point hitch lift 8. instrumented exhaust pipe Fig. 3 Instrumentation for tractor exhaust gas flow and emissions measurement. Fig 4 Tractor fuel consumption closely tracks engine power calculated from engine speed and axle torque. Fig. 5 Primary tillage with a disc ripper. Fig. 6 Map of fuel consumption for north-south tillage of a 400 x 700 m field with a disc ripper. Patterns of varying fuel consumption are caused by both field topography and variability in soil conditions. Fig. 7 Secondary tillage with a field cultivator. Fig. 8 Map of fuel consumption for east-west secondary tillage in the same field as in Fig. 6. Fig. 9 Fuel consumption for west bound pass from point A to point B in Fig. 8, turn 180º, and return east bound pass from point B to point A. Note higher fuel consumption in sandy areas near point B, and for the turn. © 2003 B N E S W N E S W "Important note regarding results presented in scientific posters: The research reported here is in progress, and therefore the study results have not been subjected to scientific peer review."

Field Measurement of Agricultural Tractor Exhaust Gas

  • Upload
    others

  • View
    3

  • Download
    0

Embed Size (px)

Citation preview

Field Measurement of

Agricultural Tractor Exhaust Gas Emissions

Agriculture andAgri-Food Canada

Agriculture etAgroalimentaire Canada

EnvironmentCanada

EnvironnementCanada

Neil McLaughlin,

Michael Layer, Project Engineer, Pollution Data Branch, Environment Canada, 351 St. Joseph Blvd., Gatineau, QC K1A 0H3

Research Scientist, Research Branch, Agriculture and Agri-Food Canada, 960 Carling Ave., Ottawa, ON K1A 0C6

Abstract

Two Canadian federal government departments,Agriculture and Agri-Food Canada (AAFC) and EnvironmentCanada, are collaborating in a pilot project aimed atobtaining agricultural tractor exhaust gas emissions dataunder actual field conditions. AAFC’s unique instrumentedresearch tractor will provide the platform for collecting thesedata. This tractor was developed as a general purposeresearch tool, and was fitted with a series of sensors and anon-board data logger for measuring and recording tractoroperational parameters such as engine speed, drawbar load,and fuel consumption as the tractor is doing normal fieldwork. An instrumented exhaust pipe is being developed tomeasure exhaust gas temperature, flow, and NOxconcentration with provision for future sensors for CO, COand VOC. Signals from the exhaust pipe instrumentation willbe logged on the tractor data logger along with the othertractor operational parameters. Field data can be useddirectly, or to program a laboratory dynamometer toreproduce the same engine load cycles for comparativeemissions measurements on other tractor makes and models.The research will form a basis for development of emissionsfactors for agricultural field operations.

2

Introduction

Total emissions for agriculture have been estimated fromstandard emissions factors and farm diesel fuel sales data.Emissions factors, often derived from steady state laboratorydynamometer tests do not account for the duty cycle ofagricultural tractors.

This research project is designed to measure tractorexhaust gas emissions for typical agricultural field operations.Emissions factors can be developed from thesemeasurements, and extrapolated to a regional or nationalscale using data on cropping systems from agriculturalcensus, and soil types from national soil data bases.

Objective

1. To develop instrumentation for measurement of exhaustgas emissions of agricultural tractors under actual fieldconditions.

2. To document exhaust gas emissions for typical agriculturalfield operations to provide a basis for development ofemissions factors for agriculture.

Description

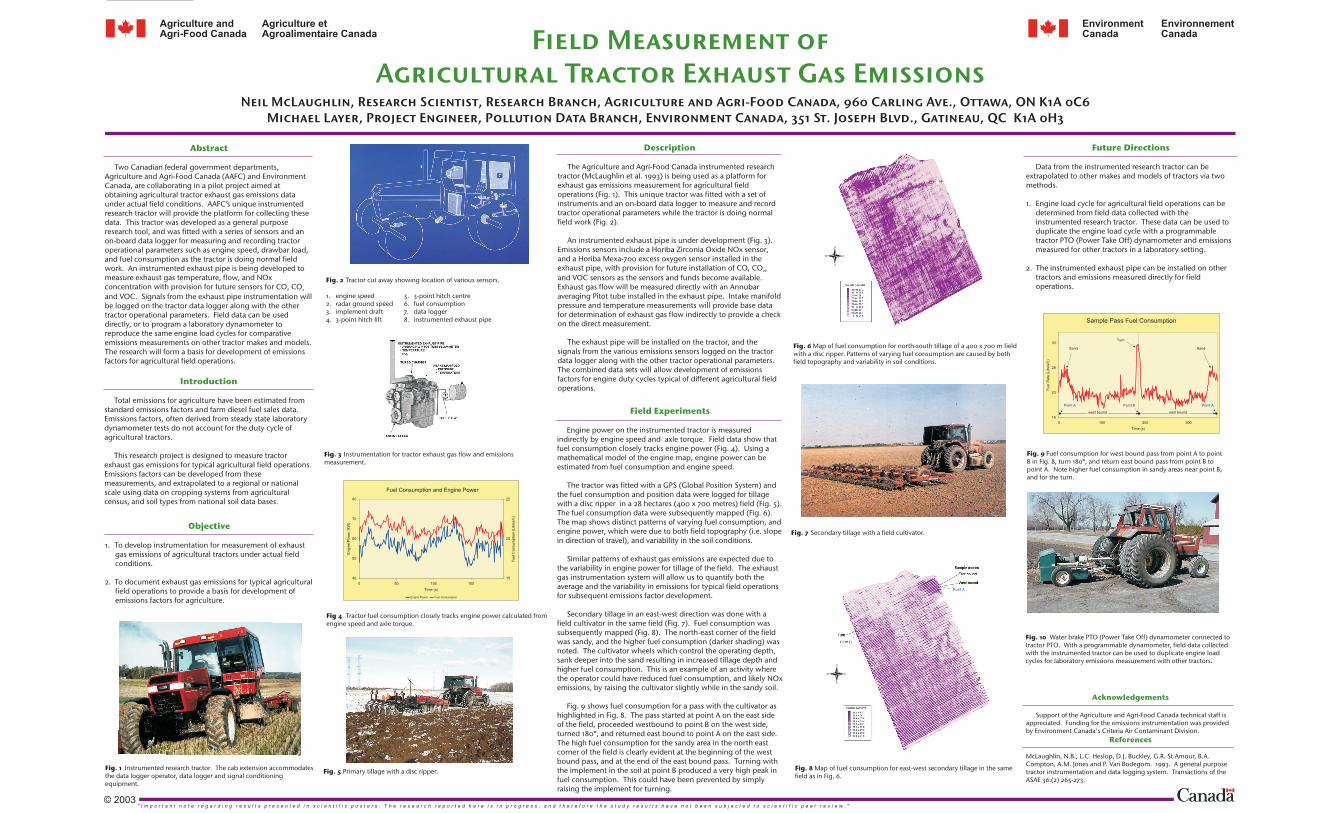
The Agriculture and Agri-Food Canada instrumented researchtractor (McLaughlin et al. 1993) is being used as a platform forexhaust gas emissions measurement for agricultural fieldoperations (Fig. 1). This unique tractor was fitted with a set ofinstruments and an on-board data logger to measure and recordtractor operational parameters while the tractor is doing normalfield work (Fig. 2).

An instrumented exhaust pipe is under development (Fig. 3).Emissions sensors include a Horiba Zirconia Oxide NOx sensor,and a Horiba Mexa-700 excess oxygen sensor installed in theexhaust pipe, with provision for future installation of CO, CO ,and VOC sensors as the sensors and funds become available.Exhaust gas flow will be measured directly with an Annubaraveraging Pitot tube installed in the exhaust pipe. Intake manifoldpressure and temperature measurements will provide base datafor determination of exhaust gas flow indirectly to provide a checkon the direct measurement.

The exhaust pipe will be installed on the tractor, and thesignals from the various emissions sensors logged on the tractordata logger along with the other tractor operational parameters.The combined data sets will allow development of emissionsfactors for engine duty cycles typical of different agricultural fieldoperations.

2

Field Experiments

Engine power on the instrumented tractor is measuredindirectly by engine speed and axle torque. Field data show thatfuel consumption closely tracks engine power (Fig. 4). Using amathematical model of the engine map, engine power can beestimated from fuel consumption and engine speed.

The tractor was fitted with a GPS (Global Position System) andthe fuel consumption and position data were logged for tillagewith a disc ripper in a 28 hectares (400 x 700 metres) field (Fig. 5).The fuel consumption data were subsequently mapped (Fig. 6).The map shows distinct patterns of varying fuel consumption, andengine power, which were due to both field topography (i.e. slopein direction of travel), and variability in the soil conditions.

Similar patterns of exhaust gas emissions are expected due tothe variability in engine power for tillage of the field. The exhaustgas instrumentation system will allow us to quantify both theaverage and the variability in emissions for typical field operationsfor subsequent emissions factor development.

Secondary tillage in an east-west direction was done with afield cultivator in the same field (Fig. 7). Fuel consumption wassubsequently mapped (Fig. 8). The north-east corner of the fieldwas sandy, and the higher fuel consumption (darker shading) wasnoted. The cultivator wheels which control the operating depth,sank deeper into the sand resulting in increased tillage depth andhigher fuel consumption. This is an example of an activity wherethe operator could have reduced fuel consumption, and likely NOxemissions, by raising the cultivator slightly while in the sandy soil.

Fig. 9 shows fuel consumption for a pass with the cultivator ashighlighted in Fig. 8. The pass started at point A on the east sideof the field, proceeded westbound to point B on the west side,turned 180º, and returned east bound to point A on the east side.The high fuel consumption for the sandy area in the north eastcorner of the field is clearly evident at the beginning of the westbound pass, and at the end of the east bound pass. Turning withthe implement in the soil at point B produced a very high peak infuel consumption. This could have been prevented by simplyraising the implement for turning.

Future Directions

Data from the instrumented research tractor can beextrapolated to other makes and models of tractors via twomethods.

1. Engine load cycle for agricultural field operations can bedetermined from field data collected with theinstrumented research tractor. These data can be used toduplicate the engine load cycle with a programmabletractor PTO (Power Take Off) dynamometer and emissionsmeasured for other tractors in a laboratory setting.

2. The instrumented exhaust pipe can be installed on othertractors and emissions measured directly for fieldoperations.

Acknowledgements

References

Support of the Agriculture and Agri-Food Canada technical staff isappreciated. Funding for the emissions instrumentation was providedby Environment Canada's Criteria Air Contaminant Division.

McLaughlin, N.B., L.C. Heslop, D.J. Buckley, G.R. St.Amour, B.A.Compton, A.M. Jones and P. Van Bodegom. 1993. A general purposetractor instrumentation and data logging system. Transactions of theASAE 36:(2) 265-273.

Fig. 10 Water brake PTO (Power Take Off) dynamometer connected totractor PTO. With a programmable dynamometer, field data collectedwith the instrumented tractor can be used to duplicate engine loadcycles for laboratory emissions measurement with other tractors.

Fuel Consumption and Engine Power

40

50

60

70

80

0 50 100 150

Time (s)

En

gin

eP

ow

er

(kW

)

15

20

25

Fu

elC

on

su

mp

tio

n(L

itre

s/h

)

Engine Power Fuel Consumption

Sample Pass Fuel Consumption

18

23

28

33

0 100 200 300

Time (s)

Fu

elR

ate

(Litre

s/h

)

Sand Sand

Turn

west bound east bound

Point A Point APoint

Fig. 1 Instrumented research tractor. The cab extension accommodatesthe data logger operator, data logger and signal conditioningequipment.

Fig. 2 Tractor cut away showing location of various sensors.

1. engine speed 5. 3-point hitch centre2. radar ground speed 6. fuel consumption3. implement draft 7. data logger4. 3-point hitch lift 8. instrumented exhaust pipe

Fig. 3 Instrumentation for tractor exhaust gas flow and emissionsmeasurement.

Fig 4 Tractor fuel consumption closely tracks engine power calculated fromengine speed and axle torque.

Fig. 5 Primary tillage with a disc ripper.

Fig. 6 Map of fuel consumption for north-south tillage of a 400 x 700 m fieldwith a disc ripper. Patterns of varying fuel consumption are caused by bothfield topography and variability in soil conditions.

Fig. 7 Secondary tillage with a field cultivator.

Fig. 8 Map of fuel consumption for east-west secondary tillage in the samefield as in Fig. 6.

Fig. 9 Fuel consumption for west bound pass from point A to pointB in Fig. 8, turn 180º, and return east bound pass from point B topoint A. Note higher fuel consumption in sandy areas near point B,and for the turn.

© 2003

B

N

E

S

W

N

E

S

W

" I m p o r t a n t n o t e r e g a r d i n g r e s u l t s p r e s e n t e d i n s c i e n t i f i c p o s t e r s : T h e r e s e a r c h r e p o r t e d h e r e i s i n p r o g r e s s , a n d t h e r e f o r e t h e s t u d y r e s u l t s h a v e n o t b e e n s u b j e c t e d t o s c i e n t i f i c p e e r r e v i e w . "