Embed Size (px)
Citation preview

Measurement of Real-World Locomotive
Engine Activity and Emissions using a
Portable Emissions Measurement System
Brandon M. Graver, H. Christopher Frey, and Jiangchuan Hu
Mobile Air Pollution Engineering Laboratory
Dept. of Civil, Construction, and Environmental Engineering
North Carolina State University

RESEARCH MOTIVATION
Is there an easier, more cost effective way of
measuring locomotive engine activity and
emissions?
• North Carolina Department of Transportation
(NCDOT) is interested in assessing overall
environmental performance of their locomotive fleet.
• Locomotive engine emission measurements are
conducted on a dynamometer or in the rail yard
– Controlled test setting
– Not representative of real-world operating
conditions
2

RESEARCH QUESTIONS
• What are the real-world duty cycles for passenger
rail service in North Carolina?
• What are the real-world emission rates for the
locomotives that operate the passenger rail
service?
3
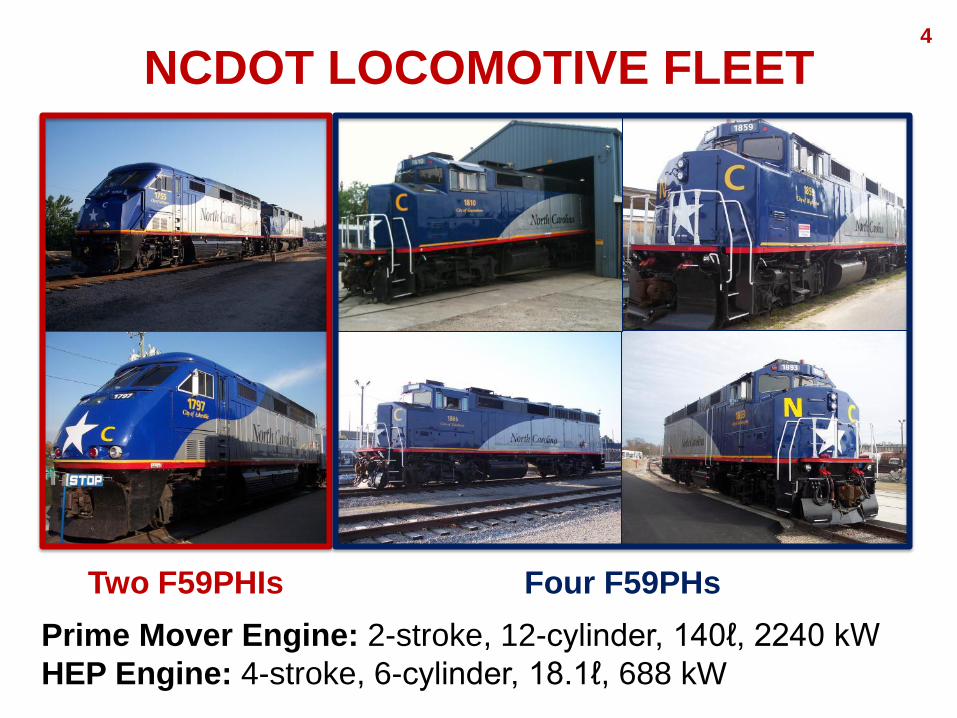
NCDOT LOCOMOTIVE FLEET 4
Two F59PHIs Four F59PHs
Prime Mover Engine: 2-stroke, 12-cylinder, 140ℓ, 2240 kW
HEP Engine: 4-stroke, 6-cylinder, 18.1ℓ, 688 kW
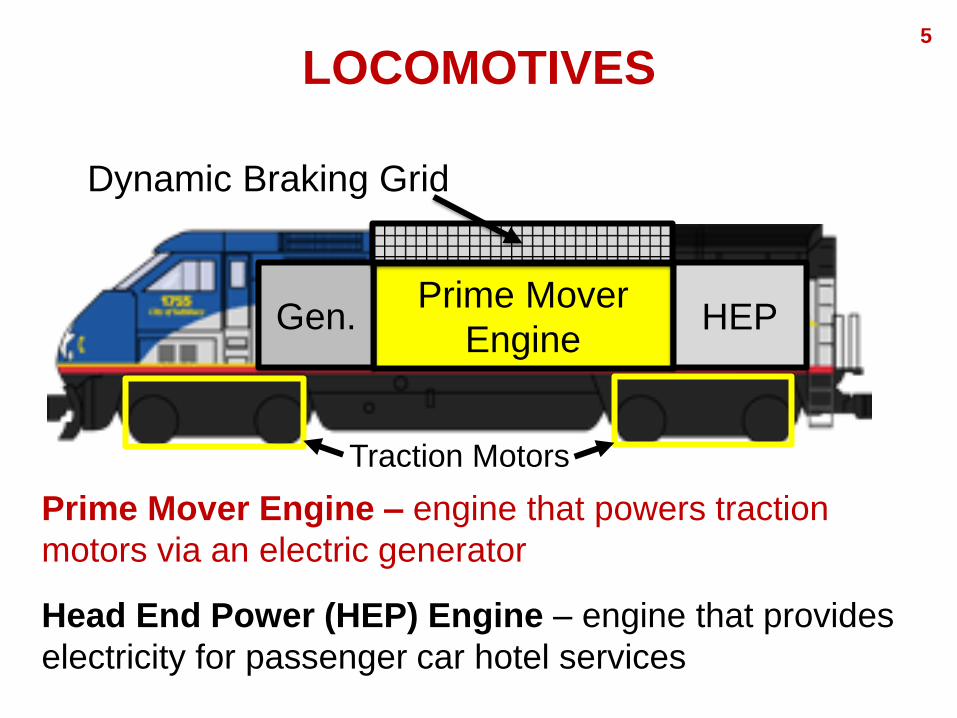
LOCOMOTIVES 5
Prime Mover
Engine HEP Gen.
Prime Mover Engine – engine that powers traction
motors via an electric generator
Head End Power (HEP) Engine – engine that provides
electricity for passenger car hotel services
Dynamic Braking Grid
Traction Motors

LOCOMOTIVES 6
Dynamic Braking Grid
Prime Mover
Engine HEP Gen.
Generator – powers the electric traction motors
Dynamic Braking (DB) Grid: “rheostatic braking”
dissipates electricity generated by traction motors to
slow the locomotive
Traction Motors

THE PIEDMONT TRAIN 7
Distance: 173 miles
Travel time (RGHCLT): 3 hours, 15 minutes
Speed: 79 mph (maximum), 55 mph (average)

PORTABLE EMISSIONS MEASUREMENT
SYSTEM
8
Montana and Axion systems
by Clean Air Technologies
International, Inc.
• Non-dispersive infrared
(NDIR) for CO2, CO, HC
• Electrochemical sensor for
NO and O2
• Light scattering particulate
matter measurement

PORTABLE EMISSIONS MEASUREMENT
SYSTEM
9
↑ Exhaust lines from
engine to PEMS
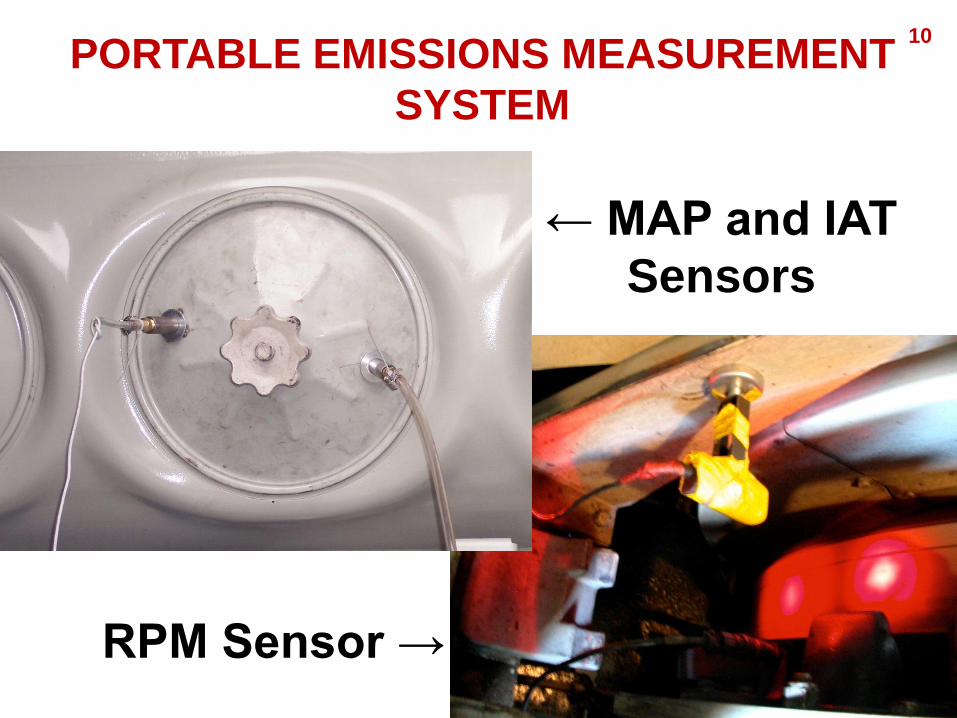
PORTABLE EMISSIONS MEASUREMENT
SYSTEM
10
RPM Sensor →
← MAP and IAT
Sensors

MEASUREMENT METHODS 11
• Relatively inexpensive
• Easily deployable for over-the-rail
measurements
• PM measurement uses a laser light scattering
detection method that is useful for relative
comparisons
• Useful for comparative evaluations

LOCOMOTIVE ACTIVITY DATA RECORDER
12
• Engine activity data shown on digital display in locomotive
cab
• Notch position, engine speed, and horsepower output
displayed, but not archived
• Engine solenoid operation data is archived, and notch
position can be inferred from this data

FUEL USE ESTIMATION
• Not feasible to accurately measure over-the-rail
fuel use
• Fuel is taken from a 900-1500 gallon
onboard tank
• Diesel engines return unspent fuel to the
tank continuously
• Exhaust flow rate is estimated based on
calculation of mass air flow through the engine
and inference of the air-to-fuel ratio from the
measured exhaust composition
13

MASS AIR FLOW ESTIMATION 14
Mass air flow from “speed density” method:
EC = engine strokes per cycle (2)
ER = engine compression ratio (typically 15 to 18)
ES = engine speed (RPM)
EV = engine displacement (L)
Ma = intake air molar flow rate (mole/s)
PB = barometric pressure (101 kPa)
PM = engine manifold absolute pressure (kPa)
Tint = intake air temperature (degrees C)
VE = engine volumetric efficiency

VOLUMETRIC EFFICIENCY 15
Values for VE are estimated based on dynamometer
measurements of the same model prime mover
engines

FIELD STUDY DESIGN 16
• Six locomotives were instrumented and measured
• Three days of over-the-rail (OTR) in-use
measurements
• Ultra-low sulfur diesel (ULSD)
This presentation – focus on NC 1797
17
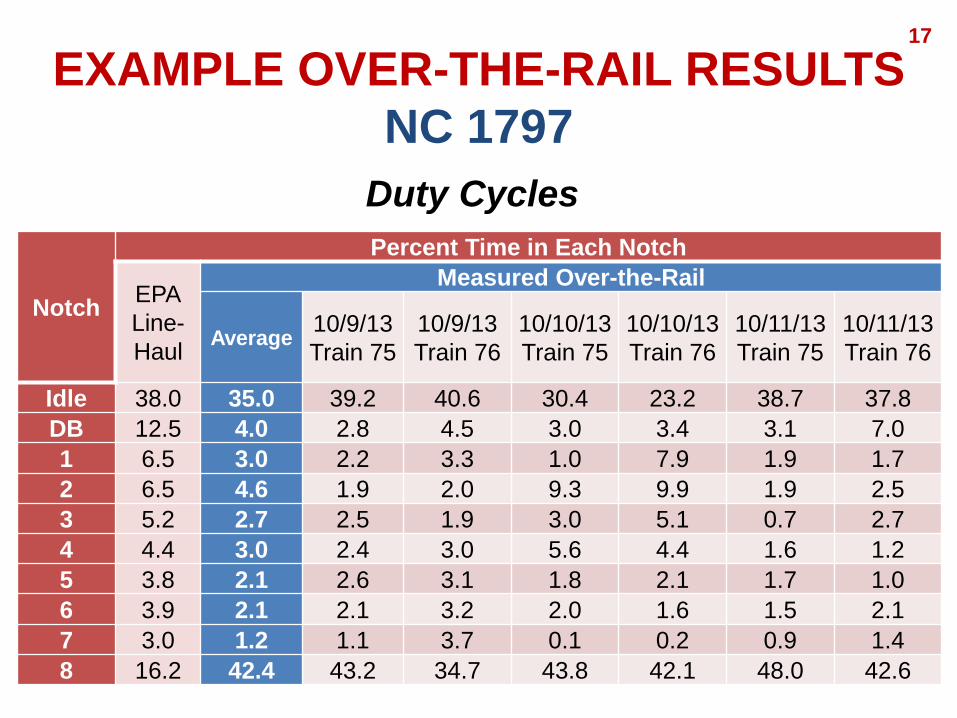
EXAMPLE OVER-THE-RAIL RESULTS
NC 1797
Duty Cycles
Notch
Percent Time in Each Notch
EPA
Line-
Haul
Measured Over-the-Rail
Average 10/9/13
Train 75
10/9/13
Train 76
10/10/13
Train 75
10/10/13
Train 76
10/11/13
Train 75
10/11/13
Train 76
Idle 38.0 35.0 39.2 40.6 30.4 23.2 38.7 37.8
DB 12.5 4.0 2.8 4.5 3.0 3.4 3.1 7.0
1 6.5 3.0 2.2 3.3 1.0 7.9 1.9 1.7
2 6.5 4.6 1.9 2.0 9.3 9.9 1.9 2.5
3 5.2 2.7 2.5 1.9 3.0 5.1 0.7 2.7
4 4.4 3.0 2.4 3.0 5.6 4.4 1.6 1.2
5 3.8 2.1 2.6 3.1 1.8 2.1 1.7 1.0
6 3.9 2.1 2.1 3.2 2.0 1.6 1.5 2.1
7 3.0 1.2 1.1 3.7 0.1 0.2 0.9 1.4
8 16.2 42.4 43.2 34.7 43.8 42.1 48.0 42.6
VARIATIONS IN DUTY CYCLE 18
• Engineer behavior
• Weather conditions
• Station delays
• Rail traffic
• Track maintenance

EXAMPLE OVER-THE-RAIL RESULTS
NC 1797
19
Engine performance is highly repeatable from replicate to replicate
Relative Standard Deviation (RSD) = (standard deviation) / mean
Engine RPM RSD < 0.07; Airbox Pressure RSD ≤ 0.06
Engine RPM Airbox Pressure
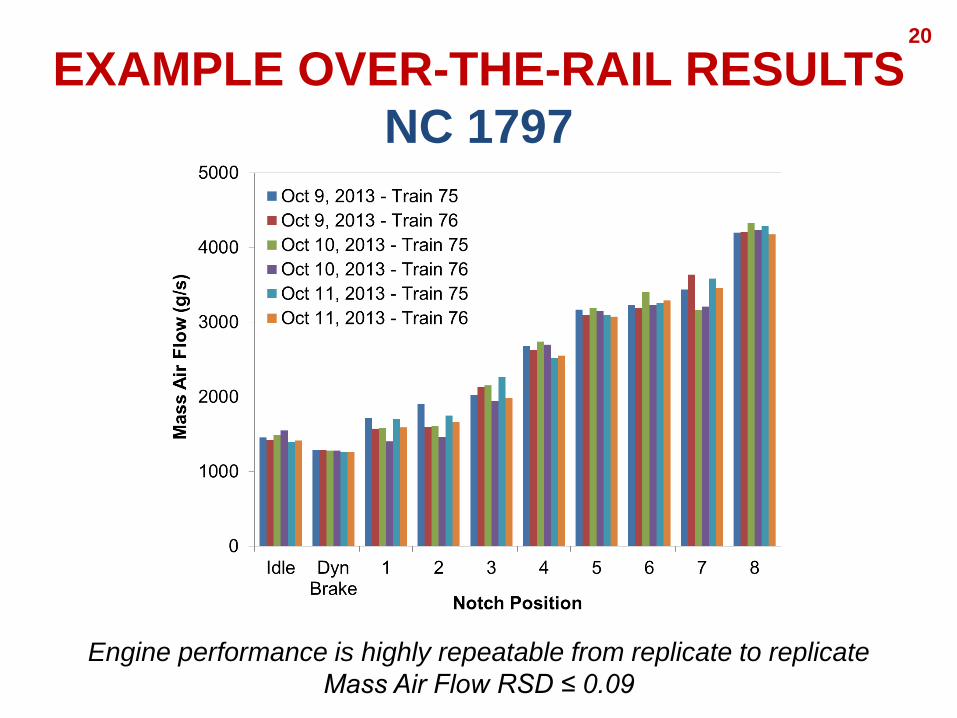
20
Engine performance is highly repeatable from replicate to replicate
Mass Air Flow RSD ≤ 0.09
EXAMPLE OVER-THE-RAIL RESULTS
NC 1797

21
Notch
Position
Average NO
Concentration (ppm)
Inter-Replicate Variability
(Relative Standard Deviation)
Idle 302 0.12
Dyn. Brake 266 0.13
1 546 0.12
2 927 0.18
3 1302 0.03
4 1384 0.04
5 1371 0.07
6 1246 0.09
7 1282 0.21
8 1160 0.02
EXAMPLE OVER-THE-RAIL RESULTS
NC 1797

CYCLE AVERAGE EMISSION RATES 22
𝐶𝐴𝐸𝑅𝑖 = 𝐸𝑅𝑖𝑗 × 𝐷𝐶𝑗 × ℎ𝑝𝑗
𝐷𝐶𝑗 × ℎ𝑝𝑗8𝐼𝑑𝑙𝑒
8
𝐼𝑑𝑙𝑒
CAERi cycle average emission rate for pollutant i
ERij emission rate for pollutant i at notch position j
DCj fractional time spent in notch j in duty cycle
hpj engine horsepower at notch position j
Two duty cycles: EPA Line-Haul
Piedmont Measured

23
EXAMPLE OVER-THE-RAIL RESULTS
NC 1797
NOx (g/bhp-hr)
HC (g/bhp-hr)
CO (g/bhp-hr)
Opacity-based PM (g/bhp-hr)
Oct. 9, 2013 – Train 75 11.4 1.66 0.51 0.17
Oct. 9, 2013 – Train 76 11.7 3.59 0.92 0.15
Oct. 10, 2013 – Train 75 11.2 1.17 0.52 0.15
Oct. 10, 2013 – Train 76 11.9 2.79 0.87 0.13
Oct. 11, 2013 – Train 75 10.9 1.22 0.65 0.15
Oct. 11, 2013 – Train 76 11.2 2.88 0.88 0.14
Average 11.4 2.22 0.72 0.15 Relative Std. Deviation 0.03 0.45 0.26 0.10
Average Emission Rates: Actual Duty Cycle

24
EXAMPLE OVER-THE-RAIL RESULTS
NC 1797
Cycle Average Emission Rates:
EPA Line Haul Duty Cycle
NOx (g/bhp-hr)
HC (g/bhp-hr)
CO (g/bhp-hr)
Opacity-based PM (g/bhp-hr)
Oct. 9, 2013 – Train 75 13.9 2.79 0.59 0.19
Oct. 9, 2013 – Train 76 13.5 5.16 1.13 0.16
Oct. 10, 2013 – Train 75 14.0 1.80 0.51 0.16
Oct. 10, 2013 – Train 76 14.9 5.10 1.16 0.14
Oct. 11, 2013 – Train 75 14.3 1.84 0.61 0.16
Oct. 11, 2013 – Train 76 14.2 4.82 0.95 0.15
Average 14.1 3.59 0.82 0.16 Relative Std. Deviation 0.03 0.45 0.35 0.09
Line-Haul vs.
Real-World + 19% + 38% + 12% + 6%

CONCLUSIONS 25
• Differences in measured duty cycle compared to
EPA line-haul duty cycle, especially at Idle and
Notch 8
• High repeatability in measured engine parameters
• Little variability in NOx and PM emission rates
• Differences in duty cycle lead to differences in
cycle average emission rates
– Higher cycle average emission rates were
estimated for the EPA line-haul duty cycle
compared to the actual duty cycle

ACKNOWLEDGEMENTS
• Allan Paul of the North Carolina Department of
Transportation Rail Division
• Herzog Transit Services and RailPlan International, Inc.
• Lynn Harris and Curtis McDowell of McDowell Engineers
• AMTRAK Southern Division Engineers and Conductors,
Raleigh Station Staff
• Federal Railroad Administration of the U.S. Department of
Transportation
26

Brandon M. Graver Department of Civil, Construction, and Environmental Engineering
North Carolina State University
Office: 919-515-4465
Email: [email protected]
Website: www4.ncsu.edu/~bmgraver


![KANSAS CITY SOUTHERN LINES, LOCOMOTIVE LISTING LOCOS [19840625].pdf · page; 5 the kan.sas city southern lines locomotive listing engine old year number type number model hf' built](https://img.pdfslide.us/doc/110x75/5b3bc2f57f8b9a213f8cba57/kansas-city-southern-lines-locomotive-locos-19840625pdf-page-5-the-kansas.jpg)