Embed Size (px)
Citation preview
Fetal and Perinatal Mortality, United States, 2003by Marian F. MacDorman, Ph.D.; Donna L. Hoyert, Ph.D.; Joyce A. Martin, M.P.H.;Martha L. Munson, M.S.; and Brady E. Hamilton, Ph.D., Division of Vital Statistics
SOURCE: CDC/NCHS, National Vital Statistics System.
6
7
8
9
10
1990 2000
Rat
e pe
r 1,
000
live
birt
hs a
nd fe
tal d
eath
sin
spe
cifie
d gr
oup
0
Infant
Fetal
20031995
Figure 1. Fetal and infant mortality rates: United States,1990–2003
Volume 55, Number 6 February 21, 2007
Abstract
Objectives—This report presents 2003 fetal and perinatal mor-tality data by a variety of characteristics, including maternal age,marital status, race, Hispanic origin, and state of residence; and byinfant birthweight, gestational age, plurality, and sex. Trends in fetaland perinatal mortality are also examined.
Methods—Descriptive tabulations of data are presented andinterpreted.
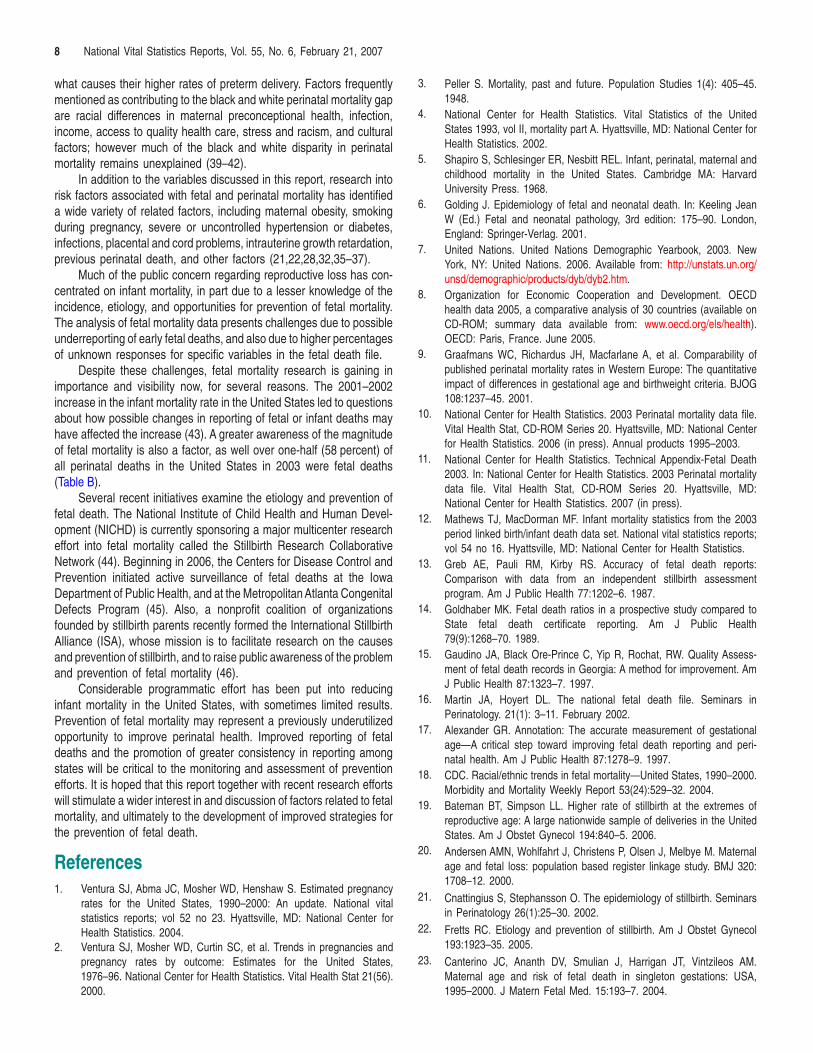
Results—The U.S. fetal mortality rate in 2003 was 6.23 fetaldeaths of 20 weeks of gestation or more per 1,000 live births and fetaldeaths. Fetal and perinatal mortality rates have declined slowly butsteadily from 1990 to 2003. Fetal mortality rates for 28 weeks ofgestation or more have declined substantially, whereas those for 20–27weeks of gestation have not declined. Fetal mortality rates are higherfor a number of groups, including non-Hispanic black women, teen-agers, women aged 35 years and over, unmarried women, and multipledeliveries. Over one-half (51 percent) of fetal deaths of 20 weeks ofgestation or more occurred between 20 and 27 weeks of gestation.
Keywords: fetal mortality c perinatal mortality c fetal death cstillbirth c pregnancy loss
Acknowledgments
This report was prepared in the Division of Vital Statistics (DVS) under thegeneral direction of Charles J. Rothwell, Director of DVS and Stephanie J.Ventura, Chief of the Reproductive Statistics Branch (RSB). Fay Menacker,Sharon Kirmeyer, and T.J. Mathews of RSB assisted with concept develop-ment. Steven J. Steimel of the Systems, Programming, and StatisticalResources Branch (SPSRB) provided computer programming support.Thomas D. Dunn of SPSRB provided assistance with content review. TheRegistration Methods staff and the Data Acquisition and Evaluation Branchprovided consultation to state vital statistics offices regarding collection of thebirth and death certificate data on which this report is based. This report wasedited by Demarius V. Miller, Office of Information Services, InformationDesign and Publishing Staff; typeset by Jacqueline M. Davis ofCoCHIS/NCHM/Division of Creative Services; and graphics were produced bySarah M. Hinkle of CoCHIS/NCHM/Division of Creative Services.
Introduction
Fetal mortality is a major, but often overlooked, public healthissue. Much of the public concern regarding reproductive loss hasconcentrated on infant mortality, in part due to a lesser knowledge ofthe incidence, etiology, and opportunities for prevention of fetalmortality. Fetal mortality refers to the intrauterine death of a fetus atany gestational age. Fetal deaths are more numerous than infantdeaths. The National Survey of Family Growth collects data onpregnancy losses throughout the gestational period but does notprovide information by characteristics. Estimates from this surveyshow a total of about 1 million fetal losses per year in the UnitedStates, however, the vast majority of these occur before 20 weeks ofgestation (1,2). The concept of a perinatal period emerged in the late1940s as clinicians and researchers became increasingly aware ofthe relatively large number of deaths occurring in the periodimmediately before and after delivery (3). Thus, perinatal mortality
2 National Vital Statistics Reports, Vol. 55, No. 6, February 21, 2007
refers to death around the time of delivery, and includes both fetaldeaths (of at least 20 weeks of gestation) and early infant (neonatal)deaths.
Vital statistics fetal mortality rates in the United States are gen-erally presented for fetal deaths of 20 weeks of gestation or more.These rates have declined about four-fold since 1942 (from 25.0 fetaldeaths of 20 weeks of gestation or more per 1,000 live births and fetaldeaths in 1942 (4) to 6.23 in 2003). The real decline in fetal mortalitywas probably larger, as reporting of fetal deaths has improved over time(5,6). Despite this success, fetal and perinatal mortality rates in theUnited States today are higher than in many other developed countries(7–9). Also of concern are large racial and ethnic disparities in U.S. fetaland perinatal mortality rates. This report presents detailed data on fetaland perinatal deaths and mortality rates for the United States for 2003.Data are presented by maternal age, marital status, race, Hispanicorigin, and state of residence; and by infant birthweight, gestational age,plurality, and sex. Trends in fetal and perinatal mortality are alsoexamined.
MethodsData sources—Data shown in this report are drawn from two
different National Center for Health Statistics (NCHS) vital statisticsdata files: the 2003 fetal death data file (for fetal deaths), and the2003 period linked birth/infant death data file (linked file) (for livebirths and infant deaths). The 2003 fetal death data file containsinformation from all Reports of Fetal Death filed in the 50 states, theDistrict of Columbia, Puerto Rico, the U.S. Virgin Islands, and Guam(10,11). In the linked file the information from the death certificate islinked to the information from the birth certificate for each infant under1 year of age who died in 2003 (10,12). The purpose of the linkageis to use the many additional variables available from the birthcertificate to conduct more detailed analysis of infant and perinatalmortality patterns. The methods for constructing the linked file aredescribed in detail elsewhere (12). Tables showing data by state alsoprovide separate information for Puerto Rico, the Virgin Islands, andGuam; however, these data are not included in U.S. totals.
Fetal mortality—Fetal death refers to the intrauterine death of afetus before delivery (see ‘‘Technical Notes’’). Fetal mortality is gen-erally divided into three periods: early (less than 20 completed weeksof gestation), intermediate (20–27 weeks of gestation), and late (28weeks of gestation or more) (11). Although the vast majority of fetaldeaths occur early in pregnancy (1,2), most states in the United Statesonly report fetal deaths of 20 weeks of gestation or more; and theseintermediate and late fetal deaths are the subject of the currentanalysis. Statistics on fetal death exclude data for induced abortions.There is substantial variation among states in reporting requirementsand completeness of reporting for fetal death data, and these variationshave important implications for data quality and completeness, see‘‘Technical Notes’’ (13–17). Thus, correct interpretation of fetal deathdata must include an evaluation of the completeness of reporting of fetaldeaths, and also an evaluation of the completeness of reporting for thespecific variables of interest. The percentage of not stated responsesfor fetal death data varies substantially among variables and states, see‘‘Technical Notes’’ (11). Fetal mortality rates in this report are computedas the number of fetal deaths of 20 weeks of gestation or more per1,000 live births and fetal deaths of 20 weeks or more, thus repre-senting the population at risk of the event (see ‘‘Technical Notes’’).
Perinatal mortality—This report includes two different definitionsof perinatal mortality. Perinatal definition I includes infant deaths of lessthan 7 days of age and fetal deaths of 28 weeks or more gestation.Perinatal definition II is the most inclusive definition, and includes infantdeaths of less than 28 days of age and fetal deaths of 20 weeks ormore gestation. The denominators for all perinatal rate computationsare per 1,000 live births plus fetal deaths; see the ‘‘Technical Notes.’’Perinatal definition I is preferred for international comparisons due todifferences among countries in completeness of reporting of fetaldeaths of 20–27 weeks of gestation. Perinatal definition II is useful formonitoring perinatal mortality throughout the gestational age spectrum,as the majority of fetal deaths occur before 28 weeks of gestation.
Race and Hispanic origin—Race and Hispanic origin of mother arereported independently on vital records. In tabulations of data by raceand Hispanic origin, data for Hispanic persons are not further classifiedby race as the vast majority of women of Hispanic origin are reportedas white. Oklahoma does not have an item on Hispanic origin of motheron its Report of Fetal Death. Data for American Indian or Alaska Native(AIAN) and Asian or Pacific Islander (API) mothers are not shownseparately by Hispanic origin because the vast majority of thesepopulations are non-Hispanic. Therefore, data for all races combinedand for AIANs and APIs in tables and figures in this report are for theUnited States, whereas data for non-Hispanic whites, non-Hispanicblacks, and Hispanics exclude Oklahoma.
Statistical significance—Text statements have been tested forstatistical significance, and a statement that a given mortality rate ishigher or lower than another rate indicates that the rates are signifi-cantly different. For information on the methods used to test forstatistical significance, as well as information on the definition, reportingrequirements, and data quality of fetal death data, the 2003 revisionof the U.S. Standard Certificates and Reports, computation of rates,multiple race data, period of gestation, and availability of fetal andperinatal data, please see ‘‘Technical Notes.’’
Results
Trends in fetal and perinatal mortality
The fetal mortality rate declined slowly but steadily, by anaverage of 1.4 percent per year from 1990–2003 (Figure 1). Incontrast, from 1990–2000, the infant mortality rate declined twice asfast as the fetal mortality rate (by an average of 2.8 percent per year),but the infant mortality rate did not decline significantly from2000–2003.
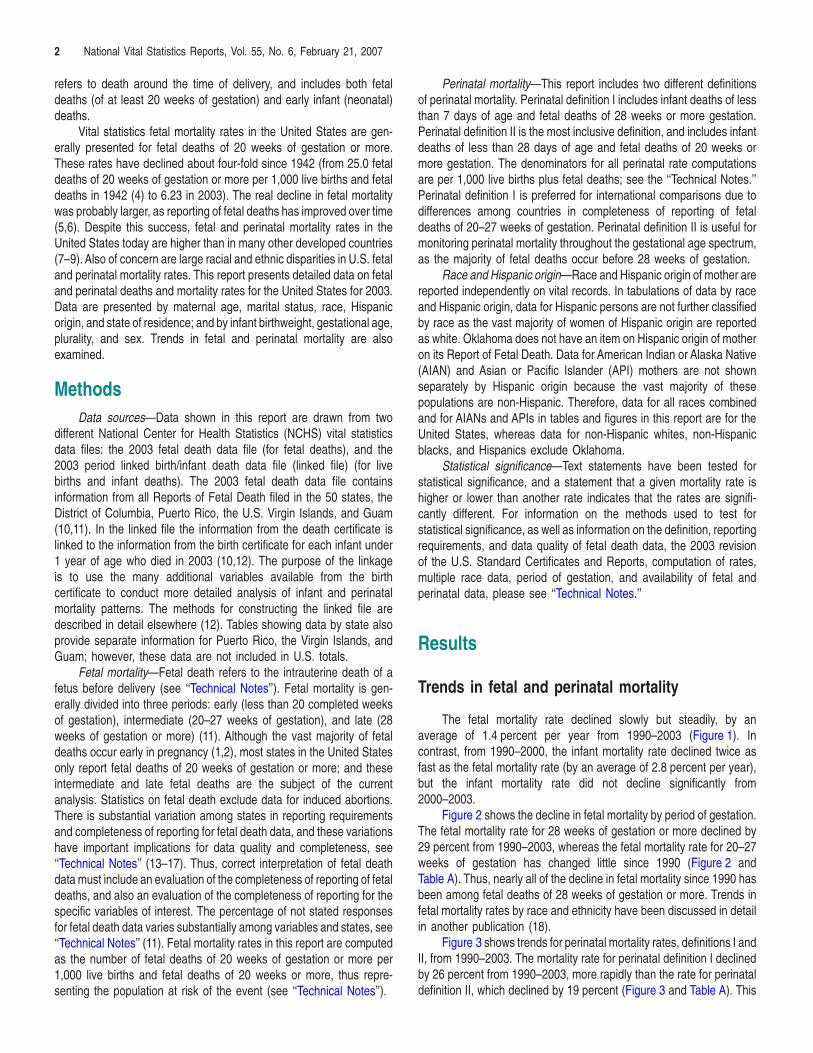
Figure 2 shows the decline in fetal mortality by period of gestation.The fetal mortality rate for 28 weeks of gestation or more declined by29 percent from 1990–2003, whereas the fetal mortality rate for 20–27weeks of gestation has changed little since 1990 (Figure 2 andTable A). Thus, nearly all of the decline in fetal mortality since 1990 hasbeen among fetal deaths of 28 weeks of gestation or more. Trends infetal mortality rates by race and ethnicity have been discussed in detailin another publication (18).
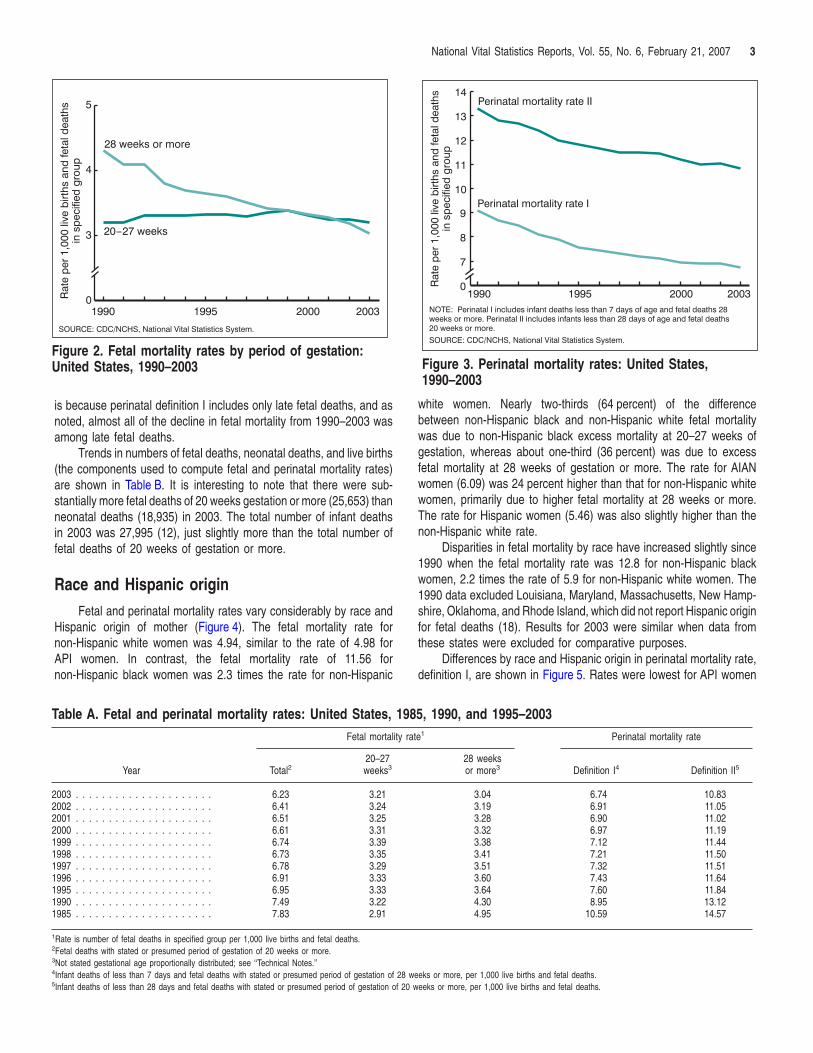
Figure 3 shows trends for perinatal mortality rates, definitions I andII, from 1990–2003. The mortality rate for perinatal definition I declinedby 26 percent from 1990–2003, more rapidly than the rate for perinataldefinition II, which declined by 19 percent (Figure 3 and Table A). This
SOURCE: CDC/NCHS, National Vital Statistics System.
Rat
e pe
r 1,
000
live
birt
hs a
nd fe
tal d
eath
sin
spe
cifie
d gr
oup
0
3
4
5
1990 1995 2000 2003
28 weeks or more
20-27 weeks
Figure 2. Fetal mortality rates by period of gestation:United States, 1990–2003
SOURCE: CDC/NCHS, National Vital Statistics System.
NOTE: Perinatal I includes infant deaths less than 7 days of age and fetal deaths 28weeks or more. Perinatal II includes infants less than 28 days of age and fetal deaths20 weeks or more.
Rat
e pe
r 1,
000
live
birt
hs a
nd fe
tal d
eath
sin
spe
cifie
d gr
oup
0
7
8
9
10
11
12
13
14
1990 1995 2000 2003
Perinatal mortality rate I
Perinatal mortality rate II
Figure 3. Perinatal mortality rates: United States,1990–2003
National Vital Statistics Reports, Vol. 55, No. 6, February 21, 2007 3
is because perinatal definition I includes only late fetal deaths, and asnoted, almost all of the decline in fetal mortality from 1990–2003 wasamong late fetal deaths.
Trends in numbers of fetal deaths, neonatal deaths, and live births(the components used to compute fetal and perinatal mortality rates)are shown in Table B. It is interesting to note that there were sub-stantially more fetal deaths of 20 weeks gestation or more (25,653) thanneonatal deaths (18,935) in 2003. The total number of infant deathsin 2003 was 27,995 (12), just slightly more than the total number offetal deaths of 20 weeks of gestation or more.
Race and Hispanic originFetal and perinatal mortality rates vary considerably by race and
Hispanic origin of mother (Figure 4). The fetal mortality rate fornon-Hispanic white women was 4.94, similar to the rate of 4.98 forAPI women. In contrast, the fetal mortality rate of 11.56 fornon-Hispanic black women was 2.3 times the rate for non-Hispanic
Table A. Fetal and perinatal mortality rates: United States, 19
Year
Fetal mortality r
Total220–27weeks3
2003 . . . . . . . . . . . . . . . . . . . . . 6.23 3.212002 . . . . . . . . . . . . . . . . . . . . . 6.41 3.242001 . . . . . . . . . . . . . . . . . . . . . 6.51 3.252000 . . . . . . . . . . . . . . . . . . . . . 6.61 3.311999 . . . . . . . . . . . . . . . . . . . . . 6.74 3.391998 . . . . . . . . . . . . . . . . . . . . . 6.73 3.351997 . . . . . . . . . . . . . . . . . . . . . 6.78 3.291996 . . . . . . . . . . . . . . . . . . . . . 6.91 3.331995 . . . . . . . . . . . . . . . . . . . . . 6.95 3.331990 . . . . . . . . . . . . . . . . . . . . . 7.49 3.221985 . . . . . . . . . . . . . . . . . . . . . 7.83 2.91
1Rate is number of fetal deaths in specified group per 1,000 live births and fetal deaths.2Fetal deaths with stated or presumed period of gestation of 20 weeks or more.3Not stated gestational age proportionally distributed; see ‘‘Technical Notes.’’4Infant deaths of less than 7 days and fetal deaths with stated or presumed period of gestation of 285Infant deaths of less than 28 days and fetal deaths with stated or presumed period of gestation of 20
white women. Nearly two-thirds (64 percent) of the differencebetween non-Hispanic black and non-Hispanic white fetal mortalitywas due to non-Hispanic black excess mortality at 20–27 weeks ofgestation, whereas about one-third (36 percent) was due to excessfetal mortality at 28 weeks of gestation or more. The rate for AIANwomen (6.09) was 24 percent higher than that for non-Hispanic whitewomen, primarily due to higher fetal mortality at 28 weeks or more.The rate for Hispanic women (5.46) was also slightly higher than thenon-Hispanic white rate.
Disparities in fetal mortality by race have increased slightly since1990 when the fetal mortality rate was 12.8 for non-Hispanic blackwomen, 2.2 times the rate of 5.9 for non-Hispanic white women. The1990 data excluded Louisiana, Maryland, Massachusetts, New Hamp-shire, Oklahoma, and Rhode Island, which did not report Hispanic originfor fetal deaths (18). Results for 2003 were similar when data fromthese states were excluded for comparative purposes.
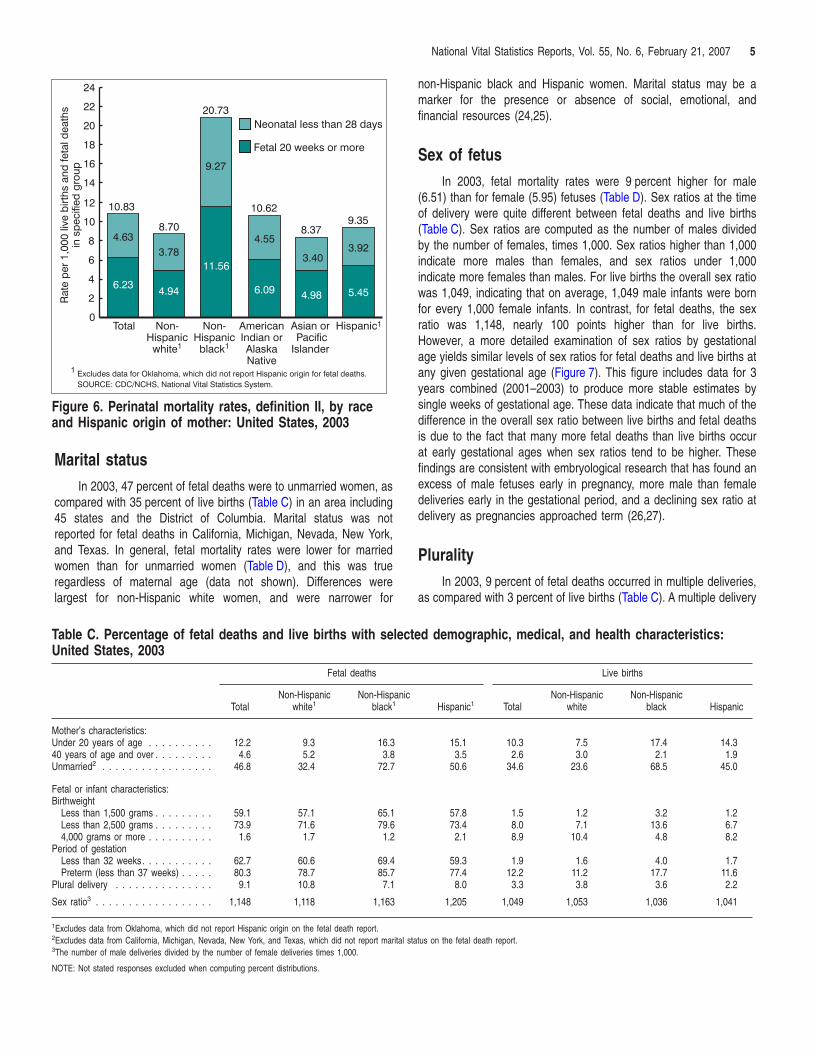
Differences by race and Hispanic origin in perinatal mortality rate,definition I, are shown in Figure 5. Rates were lowest for API women
85, 1990, and 1995–2003ate1 Perinatal mortality rate
28 weeksor more3 Definition I4 Definition II5
3.04 6.74 10.833.19 6.91 11.053.28 6.90 11.023.32 6.97 11.193.38 7.12 11.443.41 7.21 11.503.51 7.32 11.513.60 7.43 11.643.64 7.60 11.844.30 8.95 13.124.95 10.59 14.57
weeks or more, per 1,000 live births and fetal deaths.weeks or more, per 1,000 live births and fetal deaths.
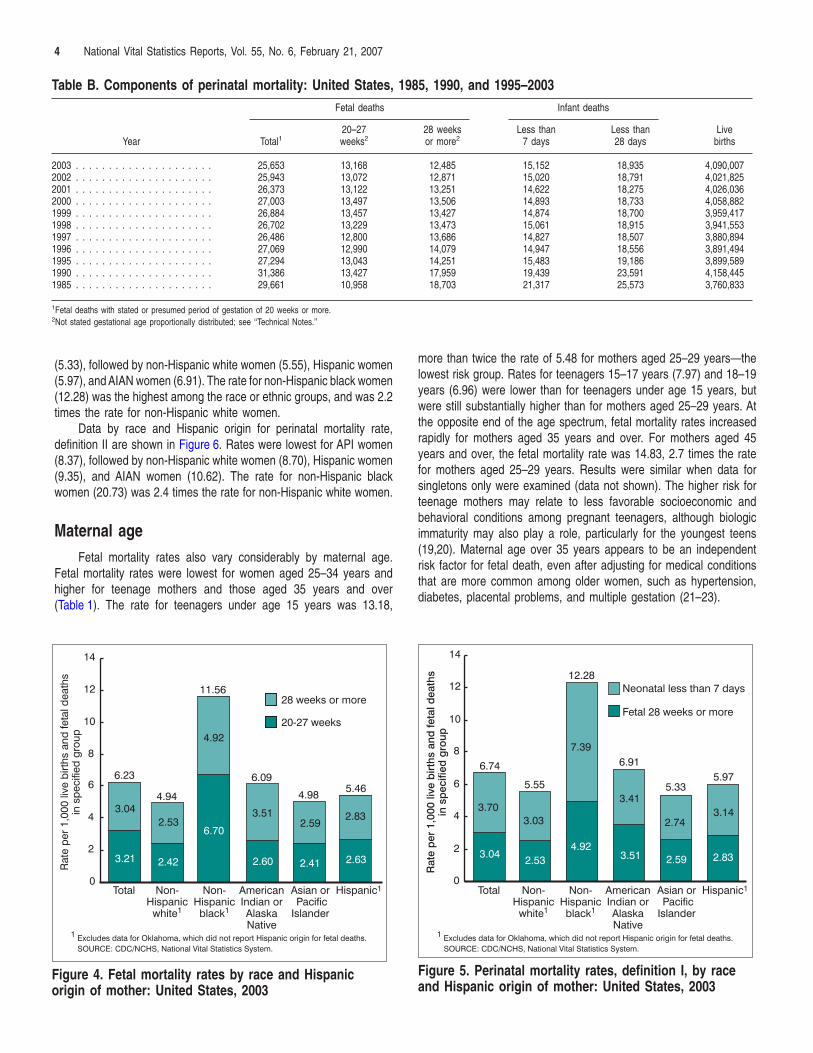
Table B. Components of perinatal mortality: United States, 1985, 1990, and 1995–2003
Year
Fetal deaths Infant deaths
LivebirthsTotal1
20–27weeks2
28 weeksor more2
Less than7 days
Less than28 days
2003 . . . . . . . . . . . . . . . . . . . . . 25,653 13,168 12,485 15,152 18,935 4,090,0072002 . . . . . . . . . . . . . . . . . . . . . 25,943 13,072 12,871 15,020 18,791 4,021,8252001 . . . . . . . . . . . . . . . . . . . . . 26,373 13,122 13,251 14,622 18,275 4,026,0362000 . . . . . . . . . . . . . . . . . . . . . 27,003 13,497 13,506 14,893 18,733 4,058,8821999 . . . . . . . . . . . . . . . . . . . . . 26,884 13,457 13,427 14,874 18,700 3,959,4171998 . . . . . . . . . . . . . . . . . . . . . 26,702 13,229 13,473 15,061 18,915 3,941,5531997 . . . . . . . . . . . . . . . . . . . . . 26,486 12,800 13,686 14,827 18,507 3,880,8941996 . . . . . . . . . . . . . . . . . . . . . 27,069 12,990 14,079 14,947 18,556 3,891,4941995 . . . . . . . . . . . . . . . . . . . . . 27,294 13,043 14,251 15,483 19,186 3,899,5891990 . . . . . . . . . . . . . . . . . . . . . 31,386 13,427 17,959 19,439 23,591 4,158,4451985 . . . . . . . . . . . . . . . . . . . . . 29,661 10,958 18,703 21,317 25,573 3,760,833
1Fetal deaths with stated or presumed period of gestation of 20 weeks or more.2Not stated gestational age proportionally distributed; see ‘‘Technical Notes.’’
4 National Vital Statistics Reports, Vol. 55, No. 6, February 21, 2007
(5.33), followed by non-Hispanic white women (5.55), Hispanic women(5.97), and AIAN women (6.91). The rate for non-Hispanic black women(12.28) was the highest among the race or ethnic groups, and was 2.2times the rate for non-Hispanic white women.
Data by race and Hispanic origin for perinatal mortality rate,definition II are shown in Figure 6. Rates were lowest for API women(8.37), followed by non-Hispanic white women (8.70), Hispanic women(9.35), and AIAN women (10.62). The rate for non-Hispanic blackwomen (20.73) was 2.4 times the rate for non-Hispanic white women.
Maternal ageFetal mortality rates also vary considerably by maternal age.
Fetal mortality rates were lowest for women aged 25–34 years andhigher for teenage mothers and those aged 35 years and over(Table 1). The rate for teenagers under age 15 years was 13.18,
1 Excludes data for Oklahoma, which did not report Hispanic origin for fetal deaths.
Rat
e pe
r 1,
000
live
birt
hs a
nd fe
tal d
eath
sin
spe
cifie
d gr
oup
20-27 weeks
28 weeks or more
3.21 2.42
6.70
2.60 2.41 2.63
3.042.53
4.92
3.512.59
2.83
0
2
4
6
8
10
12
14
Total Non-Hispanic
white1
Non-Hispanicblack1
AmericanIndian orAlaskaNative
Asian or PacificIslander
Hispanic1
6.23
4.94
11.56
5.466.09
4.98
SOURCE: CDC/NCHS, National Vital Statistics System.
Figure 4. Fetal mortality rates by race and Hispanicorigin of mother: United States, 2003
more than twice the rate of 5.48 for mothers aged 25–29 years—thelowest risk group. Rates for teenagers 15–17 years (7.97) and 18–19years (6.96) were lower than for teenagers under age 15 years, butwere still substantially higher than for mothers aged 25–29 years. Atthe opposite end of the age spectrum, fetal mortality rates increasedrapidly for mothers aged 35 years and over. For mothers aged 45years and over, the fetal mortality rate was 14.83, 2.7 times the ratefor mothers aged 25–29 years. Results were similar when data forsingletons only were examined (data not shown). The higher risk forteenage mothers may relate to less favorable socioeconomic andbehavioral conditions among pregnant teenagers, although biologicimmaturity may also play a role, particularly for the youngest teens(19,20). Maternal age over 35 years appears to be an independentrisk factor for fetal death, even after adjusting for medical conditionsthat are more common among older women, such as hypertension,diabetes, placental problems, and multiple gestation (21–23).
Rat
e p
er 1
,000
live
birt
hs a
nd fe
tal d
eath
sin
sp
ecifi
ed g
roup
6.74
5.55
12.28
5.976.91
5.33
3.042.53
4.923.51 2.59 2.83
3.703.03
7.39
3.41
2.743.14
0
2
4
6
8
10
12
14
Fetal 28 weeks or more
Neonatal less than 7 days
1 Excludes data for Oklahoma, which did not report Hispanic origin for fetal deaths.
Total Non-Hispanic
white1
Non-Hispanicblack1
AmericanIndian orAlaskaNative
Asian or PacificIslander
Hispanic1
SOURCE: CDC/NCHS, National Vital Statistics System.
Figure 5. Perinatal mortality rates, definition I, by raceand Hispanic origin of mother: United States, 2003
Rat
e pe
r 1,
000
live
birt
hs a
nd fe
tal d
eath
sin
spe
cifie
d gr
oup
6.234.94
11.56
6.09 4.98 5.45
4.633.78
9.27
4.55
3.403.92
0
2
4
6
8
10
12
14
16
18
20
22
24
10.83
8.70
20.73
9.3510.62
8.37
Fetal 20 weeks or more
Neonatal less than 28 days
1 Excludes data for Oklahoma, which did not report Hispanic origin for fetal deaths.
Total Non-Hispanic
white1
Non-Hispanicblack1
AmericanIndian orAlaskaNative
Asian or PacificIslander
Hispanic1
SOURCE: CDC/NCHS, National Vital Statistics System.
Figure 6. Perinatal mortality rates, definition II, by raceand Hispanic origin of mother: United States, 2003
National Vital Statistics Reports, Vol. 55, No. 6, February 21, 2007 5
Marital statusIn 2003, 47 percent of fetal deaths were to unmarried women, as
compared with 35 percent of live births (Table C) in an area including45 states and the District of Columbia. Marital status was notreported for fetal deaths in California, Michigan, Nevada, New York,and Texas. In general, fetal mortality rates were lower for marriedwomen than for unmarried women (Table D), and this was trueregardless of maternal age (data not shown). Differences werelargest for non-Hispanic white women, and were narrower for
Table C. Percentage of fetal deaths and live births with seleUnited States, 2003
Fetal deaths
TotalNon-Hispanic
white1Non-Hispan
black1
Mother’s characteristics:Under 20 years of age . . . . . . . . . . 12.2 9.3 16.340 years of age and over . . . . . . . . . 4.6 5.2 3.8Unmarried2 . . . . . . . . . . . . . . . . . 46.8 32.4 72.7
Fetal or infant characteristics:Birthweight
Less than 1,500 grams . . . . . . . . . 59.1 57.1 65.1Less than 2,500 grams . . . . . . . . . 73.9 71.6 79.64,000 grams or more . . . . . . . . . . 1.6 1.7 1.2
Period of gestationLess than 32 weeks. . . . . . . . . . . 62.7 60.6 69.4Preterm (less than 37 weeks) . . . . . 80.3 78.7 85.7
Plural delivery . . . . . . . . . . . . . . . 9.1 10.8 7.1
Sex ratio3 . . . . . . . . . . . . . . . . . . 1,148 1,118 1,163
1Excludes data from Oklahoma, which did not report Hispanic origin on the fetal death report.2Excludes data from California, Michigan, Nevada, New York, and Texas, which did not report marital3The number of male deliveries divided by the number of female deliveries times 1,000.
NOTE: Not stated responses excluded when computing percent distributions.
non-Hispanic black and Hispanic women. Marital status may be amarker for the presence or absence of social, emotional, andfinancial resources (24,25).
Sex of fetusIn 2003, fetal mortality rates were 9 percent higher for male
(6.51) than for female (5.95) fetuses (Table D). Sex ratios at the timeof delivery were quite different between fetal deaths and live births(Table C). Sex ratios are computed as the number of males dividedby the number of females, times 1,000. Sex ratios higher than 1,000indicate more males than females, and sex ratios under 1,000indicate more females than males. For live births the overall sex ratiowas 1,049, indicating that on average, 1,049 male infants were bornfor every 1,000 female infants. In contrast, for fetal deaths, the sexratio was 1,148, nearly 100 points higher than for live births.However, a more detailed examination of sex ratios by gestationalage yields similar levels of sex ratios for fetal deaths and live births atany given gestational age (Figure 7). This figure includes data for 3years combined (2001–2003) to produce more stable estimates bysingle weeks of gestational age. These data indicate that much of thedifference in the overall sex ratio between live births and fetal deathsis due to the fact that many more fetal deaths than live births occurat early gestational ages when sex ratios tend to be higher. Thesefindings are consistent with embryological research that has found anexcess of male fetuses early in pregnancy, more male than femaledeliveries early in the gestational period, and a declining sex ratio atdelivery as pregnancies approached term (26,27).
PluralityIn 2003, 9 percent of fetal deaths occurred in multiple deliveries,
as compared with 3 percent of live births (Table C). A multiple delivery
cted demographic, medical, and health characteristics:
Live births
icHispanic1 Total
Non-Hispanicwhite
Non-Hispanicblack Hispanic
15.1 10.3 7.5 17.4 14.33.5 2.6 3.0 2.1 1.9
50.6 34.6 23.6 68.5 45.0
57.8 1.5 1.2 3.2 1.273.4 8.0 7.1 13.6 6.7
2.1 8.9 10.4 4.8 8.2
59.3 1.9 1.6 4.0 1.777.4 12.2 11.2 17.7 11.6
8.0 3.3 3.8 3.6 2.2
1,205 1,049 1,053 1,036 1,041
status on the fetal death report.
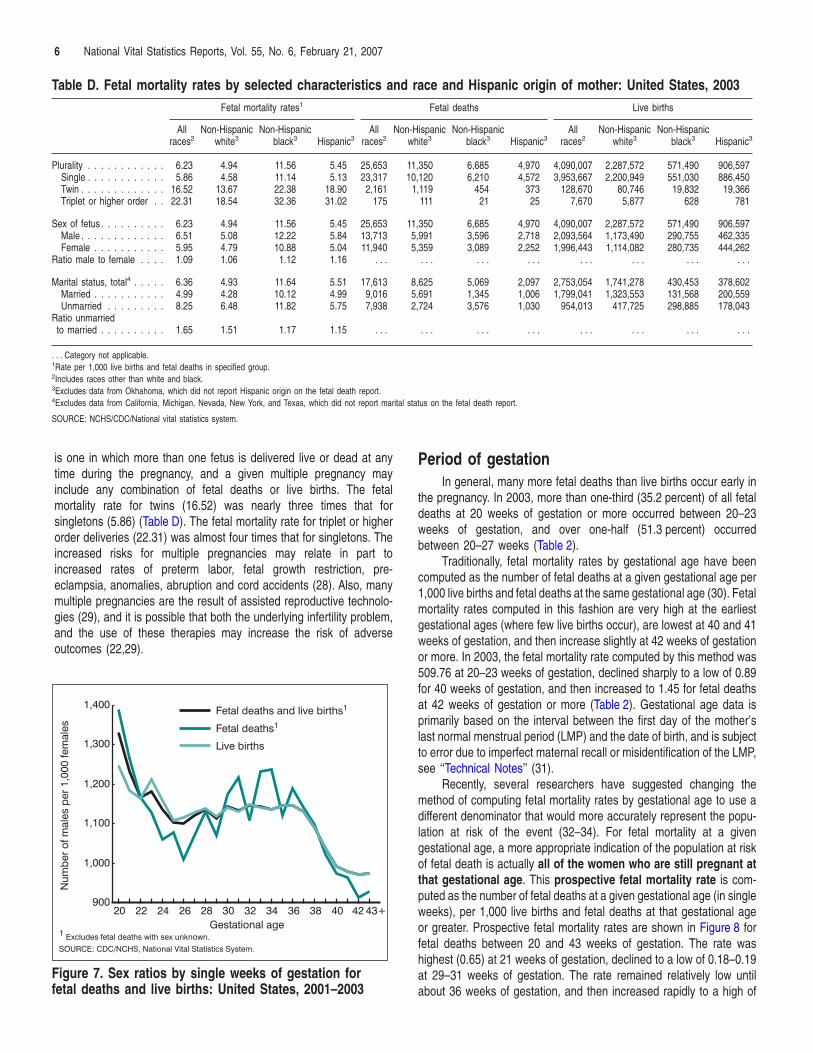
Table D. Fetal mortality rates by selected characteristics and race and Hispanic origin of mother: United States, 2003Fetal mortality rates1 Fetal deaths Live births
Allraces2
Non-Hispanicwhite3
Non-Hispanicblack3 Hispanic3
Allraces2
Non-Hispanicwhite3
Non-Hispanicblack3 Hispanic3
Allraces2
Non-Hispanicwhite3
Non-Hispanicblack3 Hispanic3
Plurality . . . . . . . . . . . . 6.23 4.94 11.56 5.45 25,653 11,350 6,685 4,970 4,090,007 2,287,572 571,490 906,597Single . . . . . . . . . . . . 5.86 4.58 11.14 5.13 23,317 10,120 6,210 4,572 3,953,667 2,200,949 551,030 886,450Twin . . . . . . . . . . . . . 16.52 13.67 22.38 18.90 2,161 1,119 454 373 128,670 80,746 19,832 19,366Triplet or higher order . . 22.31 18.54 32.36 31.02 175 111 21 25 7,670 5,877 628 781
Sex of fetus . . . . . . . . . . 6.23 4.94 11.56 5.45 25,653 11,350 6,685 4,970 4,090,007 2,287,572 571,490 906,597Male . . . . . . . . . . . . . 6.51 5.08 12.22 5.84 13,713 5,991 3,596 2,718 2,093,564 1,173,490 290,755 462,335Female . . . . . . . . . . . 5.95 4.79 10.88 5.04 11,940 5,359 3,089 2,252 1,996,443 1,114,082 280,735 444,262
Ratio male to female . . . . 1.09 1.06 1.12 1.16 . . . . . . . . . . . . . . . . . . . . . . . .
Marital status, total4 . . . . . 6.36 4.93 11.64 5.51 17,613 8,625 5,069 2,097 2,753,054 1,741,278 430,453 378,602Married . . . . . . . . . . . 4.99 4.28 10.12 4.99 9,016 5,691 1,345 1,006 1,799,041 1,323,553 131,568 200,559Unmarried . . . . . . . . . 8.25 6.48 11.82 5.75 7,938 2,724 3,576 1,030 954,013 417,725 298,885 178,043
Ratio unmarriedto married . . . . . . . . . . 1.65 1.51 1.17 1.15 . . . . . . . . . . . . . . . . . . . . . . . .
. . . Category not applicable.1Rate per 1,000 live births and fetal deaths in specified group.2Includes races other than white and black.3Excludes data from Okhahoma, which did not report Hispanic origin on the fetal death report.4Excludes data from California, Michigan, Nevada, New York, and Texas, which did not report marital status on the fetal death report.
SOURCE: NCHS/CDC/National vital statistics system.
6 National Vital Statistics Reports, Vol. 55, No. 6, February 21, 2007
is one in which more than one fetus is delivered live or dead at anytime during the pregnancy, and a given multiple pregnancy mayinclude any combination of fetal deaths or live births. The fetalmortality rate for twins (16.52) was nearly three times that forsingletons (5.86) (Table D). The fetal mortality rate for triplet or higherorder deliveries (22.31) was almost four times that for singletons. Theincreased risks for multiple pregnancies may relate in part toincreased rates of preterm labor, fetal growth restriction, pre-eclampsia, anomalies, abruption and cord accidents (28). Also, manymultiple pregnancies are the result of assisted reproductive technolo-gies (29), and it is possible that both the underlying infertility problem,and the use of these therapies may increase the risk of adverse
outcomes (22,29).SOURCE: CDC/NCHS, National Vital Statistics System.
Num
ber
of m
ales
per
1,0
00 fe
mal
es
Fetal deaths and live births1
Fetal deaths1
Live births
900
1,000
1,100
1,200
1,300
1,400
20 22 24 26 28 30 32 34 36 38 40 42 43+
1 Excludes fetal deaths with sex unknown.Gestational age
Figure 7. Sex ratios by single weeks of gestation forfetal deaths and live births: United States, 2001–2003
Period of gestationIn general, many more fetal deaths than live births occur early in
the pregnancy. In 2003, more than one-third (35.2 percent) of all fetaldeaths at 20 weeks of gestation or more occurred between 20–23weeks of gestation, and over one-half (51.3 percent) occurredbetween 20–27 weeks (Table 2).
Traditionally, fetal mortality rates by gestational age have beencomputed as the number of fetal deaths at a given gestational age per1,000 live births and fetal deaths at the same gestational age (30). Fetalmortality rates computed in this fashion are very high at the earliestgestational ages (where few live births occur), are lowest at 40 and 41weeks of gestation, and then increase slightly at 42 weeks of gestationor more. In 2003, the fetal mortality rate computed by this method was509.76 at 20–23 weeks of gestation, declined sharply to a low of 0.89for 40 weeks of gestation, and then increased to 1.45 for fetal deathsat 42 weeks of gestation or more (Table 2). Gestational age data isprimarily based on the interval between the first day of the mother’slast normal menstrual period (LMP) and the date of birth, and is subjectto error due to imperfect maternal recall or misidentification of the LMP,see ‘‘Technical Notes’’ (31).
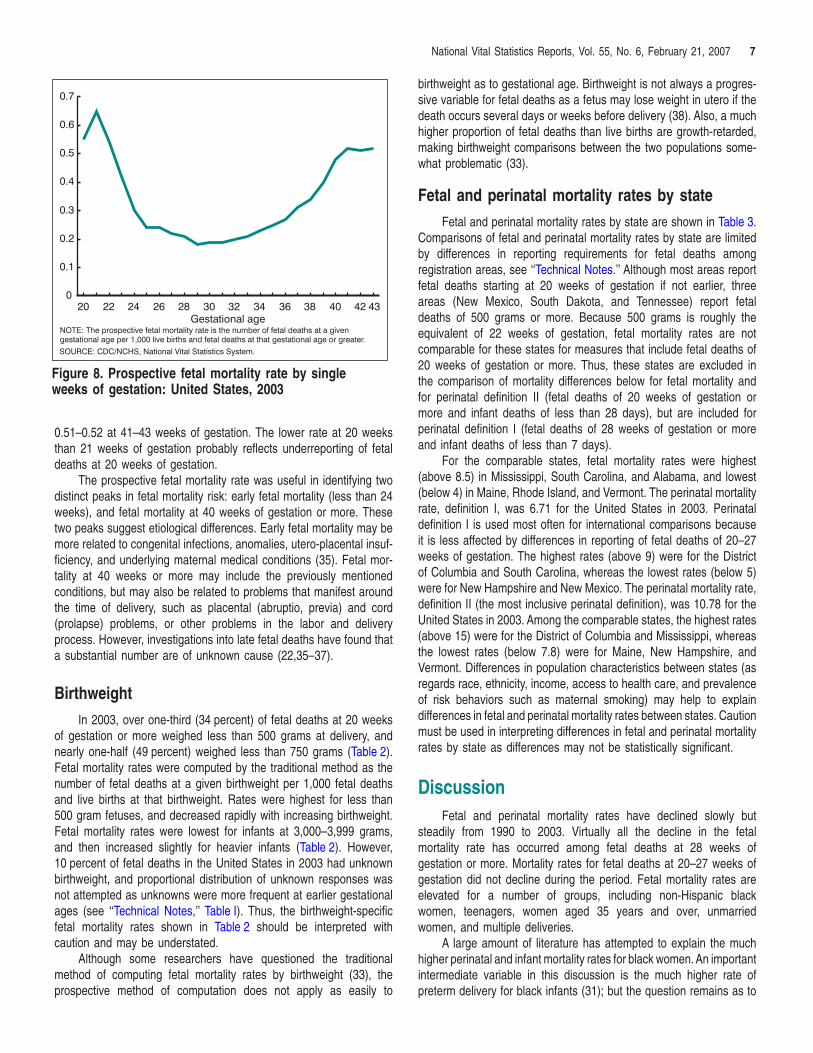
Recently, several researchers have suggested changing themethod of computing fetal mortality rates by gestational age to use adifferent denominator that would more accurately represent the popu-lation at risk of the event (32–34). For fetal mortality at a givengestational age, a more appropriate indication of the population at riskof fetal death is actually all of the women who are still pregnant atthat gestational age. This prospective fetal mortality rate is com-puted as the number of fetal deaths at a given gestational age (in singleweeks), per 1,000 live births and fetal deaths at that gestational ageor greater. Prospective fetal mortality rates are shown in Figure 8 forfetal deaths between 20 and 43 weeks of gestation. The rate washighest (0.65) at 21 weeks of gestation, declined to a low of 0.18–0.19at 29–31 weeks of gestation. The rate remained relatively low untilabout 36 weeks of gestation, and then increased rapidly to a high of
SOURCE: CDC/NCHS, National Vital Statistics System.
NOTE: The prospective fetal mortality rate is the number of fetal deaths at a givengestational age per 1,000 live births and fetal deaths at that gestational age or greater.
0
0.1
0.2
0.3
0.4
0.5
0.6
0.7
20 22 24 26 28 30 32 34 36 38 40 42 43Gestational age
Figure 8. Prospective fetal mortality rate by singleweeks of gestation: United States, 2003
National Vital Statistics Reports, Vol. 55, No. 6, February 21, 2007 7
0.51–0.52 at 41–43 weeks of gestation. The lower rate at 20 weeksthan 21 weeks of gestation probably reflects underreporting of fetaldeaths at 20 weeks of gestation.
The prospective fetal mortality rate was useful in identifying twodistinct peaks in fetal mortality risk: early fetal mortality (less than 24weeks), and fetal mortality at 40 weeks of gestation or more. Thesetwo peaks suggest etiological differences. Early fetal mortality may bemore related to congenital infections, anomalies, utero-placental insuf-ficiency, and underlying maternal medical conditions (35). Fetal mor-tality at 40 weeks or more may include the previously mentionedconditions, but may also be related to problems that manifest aroundthe time of delivery, such as placental (abruptio, previa) and cord(prolapse) problems, or other problems in the labor and deliveryprocess. However, investigations into late fetal deaths have found thata substantial number are of unknown cause (22,35–37).
BirthweightIn 2003, over one-third (34 percent) of fetal deaths at 20 weeks
of gestation or more weighed less than 500 grams at delivery, andnearly one-half (49 percent) weighed less than 750 grams (Table 2).Fetal mortality rates were computed by the traditional method as thenumber of fetal deaths at a given birthweight per 1,000 fetal deathsand live births at that birthweight. Rates were highest for less than500 gram fetuses, and decreased rapidly with increasing birthweight.Fetal mortality rates were lowest for infants at 3,000–3,999 grams,and then increased slightly for heavier infants (Table 2). However,10 percent of fetal deaths in the United States in 2003 had unknownbirthweight, and proportional distribution of unknown responses wasnot attempted as unknowns were more frequent at earlier gestationalages (see ‘‘Technical Notes,’’ Table I). Thus, the birthweight-specificfetal mortality rates shown in Table 2 should be interpreted withcaution and may be understated.
Although some researchers have questioned the traditionalmethod of computing fetal mortality rates by birthweight (33), theprospective method of computation does not apply as easily to
birthweight as to gestational age. Birthweight is not always a progres-sive variable for fetal deaths as a fetus may lose weight in utero if thedeath occurs several days or weeks before delivery (38). Also, a muchhigher proportion of fetal deaths than live births are growth-retarded,making birthweight comparisons between the two populations some-what problematic (33).
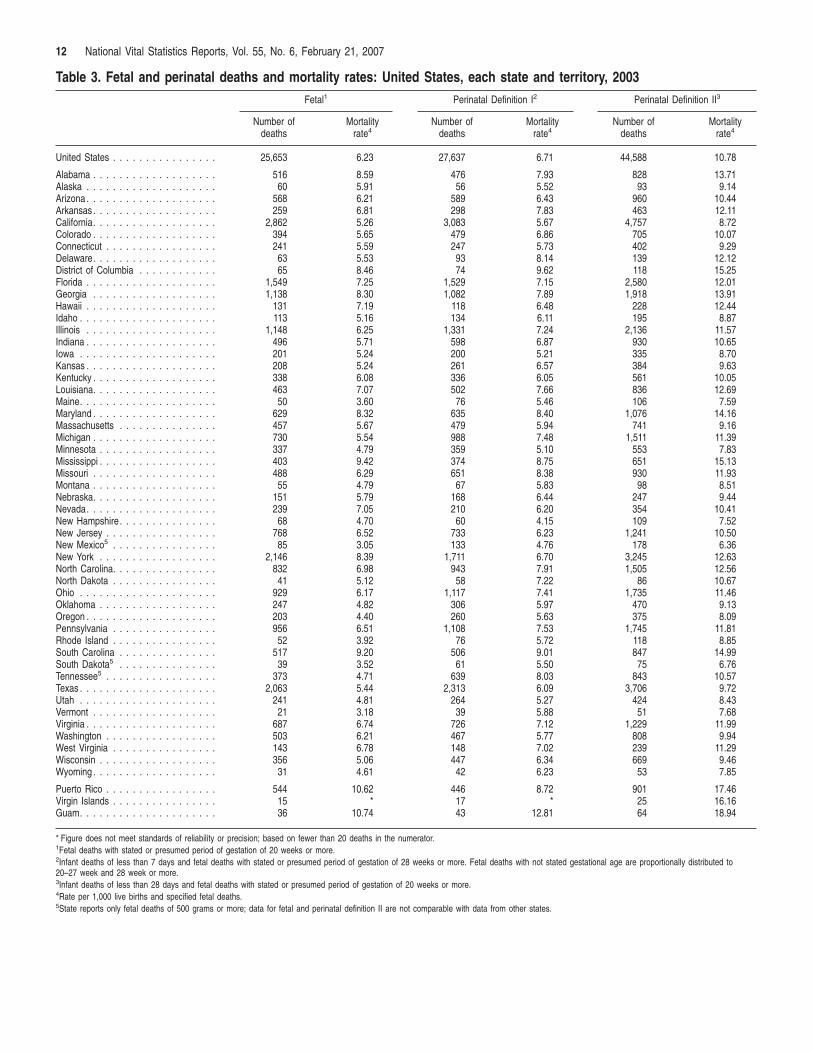
Fetal and perinatal mortality rates by stateFetal and perinatal mortality rates by state are shown in Table 3.
Comparisons of fetal and perinatal mortality rates by state are limitedby differences in reporting requirements for fetal deaths amongregistration areas, see ‘‘Technical Notes.’’ Although most areas reportfetal deaths starting at 20 weeks of gestation if not earlier, threeareas (New Mexico, South Dakota, and Tennessee) report fetaldeaths of 500 grams or more. Because 500 grams is roughly theequivalent of 22 weeks of gestation, fetal mortality rates are notcomparable for these states for measures that include fetal deaths of20 weeks of gestation or more. Thus, these states are excluded inthe comparison of mortality differences below for fetal mortality andfor perinatal definition II (fetal deaths of 20 weeks of gestation ormore and infant deaths of less than 28 days), but are included forperinatal definition I (fetal deaths of 28 weeks of gestation or moreand infant deaths of less than 7 days).
For the comparable states, fetal mortality rates were highest(above 8.5) in Mississippi, South Carolina, and Alabama, and lowest(below 4) in Maine, Rhode Island, and Vermont. The perinatal mortalityrate, definition I, was 6.71 for the United States in 2003. Perinataldefinition I is used most often for international comparisons becauseit is less affected by differences in reporting of fetal deaths of 20–27weeks of gestation. The highest rates (above 9) were for the Districtof Columbia and South Carolina, whereas the lowest rates (below 5)were for New Hampshire and New Mexico. The perinatal mortality rate,definition II (the most inclusive perinatal definition), was 10.78 for theUnited States in 2003. Among the comparable states, the highest rates(above 15) were for the District of Columbia and Mississippi, whereasthe lowest rates (below 7.8) were for Maine, New Hampshire, andVermont. Differences in population characteristics between states (asregards race, ethnicity, income, access to health care, and prevalenceof risk behaviors such as maternal smoking) may help to explaindifferences in fetal and perinatal mortality rates between states. Cautionmust be used in interpreting differences in fetal and perinatal mortalityrates by state as differences may not be statistically significant.
DiscussionFetal and perinatal mortality rates have declined slowly but
steadily from 1990 to 2003. Virtually all the decline in the fetalmortality rate has occurred among fetal deaths at 28 weeks ofgestation or more. Mortality rates for fetal deaths at 20–27 weeks ofgestation did not decline during the period. Fetal mortality rates areelevated for a number of groups, including non-Hispanic blackwomen, teenagers, women aged 35 years and over, unmarriedwomen, and multiple deliveries.
A large amount of literature has attempted to explain the muchhigher perinatal and infant mortality rates for black women. An importantintermediate variable in this discussion is the much higher rate ofpreterm delivery for black infants (31); but the question remains as to
8 National Vital Statistics Reports, Vol. 55, No. 6, February 21, 2007
what causes their higher rates of preterm delivery. Factors frequentlymentioned as contributing to the black and white perinatal mortality gapare racial differences in maternal preconceptional health, infection,income, access to quality health care, stress and racism, and culturalfactors; however much of the black and white disparity in perinatalmortality remains unexplained (39–42).
In addition to the variables discussed in this report, research intorisk factors associated with fetal and perinatal mortality has identifieda wide variety of related factors, including maternal obesity, smokingduring pregnancy, severe or uncontrolled hypertension or diabetes,infections, placental and cord problems, intrauterine growth retardation,previous perinatal death, and other factors (21,22,28,32,35–37).
Much of the public concern regarding reproductive loss has con-centrated on infant mortality, in part due to a lesser knowledge of theincidence, etiology, and opportunities for prevention of fetal mortality.The analysis of fetal mortality data presents challenges due to possibleunderreporting of early fetal deaths, and also due to higher percentagesof unknown responses for specific variables in the fetal death file.
Despite these challenges, fetal mortality research is gaining inimportance and visibility now, for several reasons. The 2001–2002increase in the infant mortality rate in the United States led to questionsabout how possible changes in reporting of fetal or infant deaths mayhave affected the increase (43). A greater awareness of the magnitudeof fetal mortality is also a factor, as well over one-half (58 percent) ofall perinatal deaths in the United States in 2003 were fetal deaths(Table B).
Several recent initiatives examine the etiology and prevention offetal death. The National Institute of Child Health and Human Devel-opment (NICHD) is currently sponsoring a major multicenter researcheffort into fetal mortality called the Stillbirth Research CollaborativeNetwork (44). Beginning in 2006, the Centers for Disease Control andPrevention initiated active surveillance of fetal deaths at the IowaDepartment of Public Health, and at the Metropolitan Atlanta CongenitalDefects Program (45). Also, a nonprofit coalition of organizationsfounded by stillbirth parents recently formed the International StillbirthAlliance (ISA), whose mission is to facilitate research on the causesand prevention of stillbirth, and to raise public awareness of the problemand prevention of fetal mortality (46).
Considerable programmatic effort has been put into reducinginfant mortality in the United States, with sometimes limited results.Prevention of fetal mortality may represent a previously underutilizedopportunity to improve perinatal health. Improved reporting of fetaldeaths and the promotion of greater consistency in reporting amongstates will be critical to the monitoring and assessment of preventionefforts. It is hoped that this report together with recent research effortswill stimulate a wider interest in and discussion of factors related to fetalmortality, and ultimately to the development of improved strategies forthe prevention of fetal death.
References1. Ventura SJ, Abma JC, Mosher WD, Henshaw S. Estimated pregnancy
rates for the United States, 1990–2000: An update. National vitalstatistics reports; vol 52 no 23. Hyattsville, MD: National Center forHealth Statistics. 2004.
2. Ventura SJ, Mosher WD, Curtin SC, et al. Trends in pregnancies andpregnancy rates by outcome: Estimates for the United States,1976–96. National Center for Health Statistics. Vital Health Stat 21(56).2000.
3. Peller S. Mortality, past and future. Population Studies 1(4): 405–45.1948.
4. National Center for Health Statistics. Vital Statistics of the UnitedStates 1993, vol II, mortality part A. Hyattsville, MD: National Center forHealth Statistics. 2002.
5. Shapiro S, Schlesinger ER, Nesbitt REL. Infant, perinatal, maternal andchildhood mortality in the United States. Cambridge MA: HarvardUniversity Press. 1968.
6. Golding J. Epidemiology of fetal and neonatal death. In: Keeling JeanW (Ed.) Fetal and neonatal pathology, 3rd edition: 175–90. London,England: Springer-Verlag. 2001.
7. United Nations. United Nations Demographic Yearbook, 2003. NewYork, NY: United Nations. 2006. Available from: http://unstats.un.org/unsd/demographic/products/dyb/dyb2.htm.
8. Organization for Economic Cooperation and Development. OECDhealth data 2005, a comparative analysis of 30 countries (available onCD-ROM; summary data available from: www.oecd.org/els/health).OECD: Paris, France. June 2005.
9. Graafmans WC, Richardus JH, Macfarlane A, et al. Comparability ofpublished perinatal mortality rates in Western Europe: The quantitativeimpact of differences in gestational age and birthweight criteria. BJOG108:1237–45. 2001.
10. National Center for Health Statistics. 2003 Perinatal mortality data file.Vital Health Stat, CD-ROM Series 20. Hyattsville, MD: National Centerfor Health Statistics. 2006 (in press). Annual products 1995–2003.
11. National Center for Health Statistics. Technical Appendix-Fetal Death2003. In: National Center for Health Statistics. 2003 Perinatal mortalitydata file. Vital Health Stat, CD-ROM Series 20. Hyattsville, MD:National Center for Health Statistics. 2007 (in press).
12. Mathews TJ, MacDorman MF. Infant mortality statistics from the 2003period linked birth/infant death data set. National vital statistics reports;vol 54 no 16. Hyattsville, MD: National Center for Health Statistics.
13. Greb AE, Pauli RM, Kirby RS. Accuracy of fetal death reports:Comparison with data from an independent stillbirth assessmentprogram. Am J Public Health 77:1202–6. 1987.
14. Goldhaber MK. Fetal death ratios in a prospective study compared toState fetal death certificate reporting. Am J Public Health79(9):1268–70. 1989.
15. Gaudino JA, Black Ore-Prince C, Yip R, Rochat, RW. Quality Assess-ment of fetal death records in Georgia: A method for improvement. AmJ Public Health 87:1323–7. 1997.
16. Martin JA, Hoyert DL. The national fetal death file. Seminars inPerinatology. 21(1): 3–11. February 2002.
17. Alexander GR. Annotation: The accurate measurement of gestationalage—A critical step toward improving fetal death reporting and peri-natal health. Am J Public Health 87:1278–9. 1997.
18. CDC. Racial/ethnic trends in fetal mortality—United States, 1990–2000.Morbidity and Mortality Weekly Report 53(24):529–32. 2004.
19. Bateman BT, Simpson LL. Higher rate of stillbirth at the extremes ofreproductive age: A large nationwide sample of deliveries in the UnitedStates. Am J Obstet Gynecol 194:840–5. 2006.
20. Andersen AMN, Wohlfahrt J, Christens P, Olsen J, Melbye M. Maternalage and fetal loss: population based register linkage study. BMJ 320:1708–12. 2000.
21. Cnattingius S, Stephansson O. The epidemiology of stillbirth. Seminarsin Perinatology 26(1):25–30. 2002.
22. Fretts RC. Etiology and prevention of stillbirth. Am J Obstet Gynecol193:1923–35. 2005.
23. Canterino JC, Ananth DV, Smulian J, Harrigan JT, Vintzileos AM.Maternal age and risk of fetal death in singleton gestations: USA,1995–2000. J Matern Fetal Med. 15:193–7. 2004.

National Vital Statistics Reports, Vol. 55, No. 6, February 21, 2007 9
24. Luo ZC, Wilkins R, Kramer MS. Disparities in pregnancy outcomesaccording to marital and cohabitation status. Obstet Gynecol103:1300–7. 2004.
25. Raatikainen K, Heiskanen N, Heinonen S. Marriage still protectspregnancy. BJOG 112:1411–6. 2005.
26. Jongbloet PH. Over-ripeness ovopathy—A challenging hypothesis forsex ratio modulation. Hum Reprod 19(4):769–74. 2004.
27. Ingemarsson I. Gender aspects of preterm birth. BJOG 110 (suppl 20):34–8. 2003.
28. Goldenberg RL, Kirby R, Culhane JF. Stillbirth: A review. J Matern FetalMed 16:79–94. 2004.
29. Wright VC, Chang J, Jeng G, Macaluso M. Assisted reproductivetechnology surveillance—United States, 2003. MMWR 55(SS-4): 1–22.2006.
30. National Office of Vital Statistics. Vital Statistics of the United States,1950, vol 1. U.S. Department of Health, Education, and Welfare,Public Health Service. 1954.
31. Martin JA, Hamilton BE, Sutton PD, Ventura SJ, Menacker F, MunsonML. Births: Final data for 2003. National vital statistics reports, vol 54no 2. Hyattsville, MD: National Center for Health Statistics. 2005.
32. Yudkin PL, Wood L, Redman CWG. Risk of unexplained stillbirth atdifferent gestational ages. Lancet 329:1192–4. 1987.
33. Kramer MS, Liu S, Luo Z, et al. Analysis of perinatal mortality and itscomponents: Time for a change? Am J Epidemiol 156:493–7. 2002.
34. Kahn B, Lumey LH, Zybert PA, et al. Prospective risk of fetal death insingleton, twin, and triplet gestations: Implications for practice. ObstetGynecol 102:685–92. 2003.
35. Rasmussen S, Albrechtsen S, Irgens LM, et al. Unexplainedantepartum fetal death in Norway, 1985–87: Diagnostic validation andsome epidemiologic aspects. Acta Obstet Gynecol Scand 82: 109–15.2003.
36. Petersson K, Bremme K, Roger B, et al. Diagnostic evaluation ofintrauterine fetal deaths in Stockholm 1998–99. Acta Obstet GynecolScand 81:284–92. 2002.
37. Huang DY, Usher RH, Kramer MS, et al. Determinants of unexplainedantepartum fetal deaths. Obstet Gynecol 95:215–21. 2000.
38. Chard T. Does the fetus lose weight in utero following fetal death: Astudy in preterm infants. BJOG 108:1113–5. 2001.
39. Fiscella K. Racial disparity in infant and maternal mortality: Confluenceof infection and microvascular dysfunction. Matern Child Health J8(2):45–54. 2004.
40. Allen CL, Hulsey TM, Hulsey TC. The influence of race on fetaloutcome. Am J Perinatol 22(5): 245–8. 2005.
41. Vintzileos AM, Ananth CV, Smulian JC, Scorza WE, Knuppel RA.Prenatal care and black-white fetal death disparity in the United States:Heterogeneity by high-risk conditions. Obstet Gynecol 99:483–9. 2002.
42. Hogan VK, Njoroge T, Durant TM, Ferre CD. Eliminating disparities inperinatal outcomes—Lessons learned. Matern Child Health J5(2):135–40. 2001.
43. MacDorman MF, Martin JA, Mathews TJ, Hoyert DL, Ventura SJ.Explaining the 2001–02 infant mortality increase: Data from the linkedbirth/infant death data set. National vital statisics reports; vol 53 no 12.Hyattsville, MD: National Center for Health Statistics. 2005.
44. National Institute of Child Health and Human Development, NationalInstitutes of Health. Stillbirth Collaborative Research Network—Research to determine the extent and causes of stillbirth. Availablefrom: http://scrn.rti.org/.
45. U.S. Senate. 109th Congress, First Session, Report 109–103. Depart-ments of Labor, Health and Human Services, and Education, andRelated Agencies Appropriation Bill, 2006. July 14, 2005.
46. International Stillbirth Alliance. Information available from:http://www.stillbirthalliance.org.
47. Model State Vital Statistics Act and Regulations, 1992 Revision. DHHSPublication no. (PHS) 94–1115.
48. Kowaleski J. State definitions and reporting requirements for live births,fetal deaths and induced terminations of pregnancy (1997 revision).National Center for Health Statistics, Hyattsville, MD. 1997.
49. National Center for Health Statistics. Report of the Panel to Evaluatethe U.S. Standard Certificates. National Center for Health Statistics,Hyattsville, MD. 2000. Available from: http://www.cdc.gov/nchs/vital_certs_rev.htm.
50. Hoyert DL. Perinatal mortality in the United States, 1985–91. NationalCenter for Health Statistics. Vital Health Stat 20(26). 1995.
51. Office of Management and Budget. Revisions to the standards for theclassification of federal data on race and ethnicity. Federal register62FR58782–58790. October 30, 1997. Available from:http://www.whitehouse.gov/omb/fedreg/ombdir15.html.
52. Johnson D. Coding and editing multiple race. Presented at the 2004Joint Meeting of NAPHSIS and VSCP, Portland, OR, June 6–10, 2004.Available from: http://www.naphsis.org/events/index.asp?bid=699.
53. Weed JA. Coding and editing multiple race. Presented at the 2004Joint Meeting of NAPHSIS and VSCP, Portland, OR, June 6–10, 2004.Available from: http://www.cdc.gov/nchs/data/dvs/Multiple_race_docu_5-10-04.pdf .
54. Schenker N, Parker JD. From single-race reporting to multiple-racereporting: Using imputation methods to bridge the transition. Stat Med22:1571–87. 2003.
55. Ingram DD, Parker JD, Schenker N, et al. United States Census 2000with bridged race categories. National Center for Health Statistics. VitalHealth Stat 2(135). 2003. Available from: http://www.cdc.gov/nchs/data/series/sr_02/sr02_135.pdf.
56. National Center for Health Statistics. Editing specifications for fetaldeath records. Unpublished manuscript. Public Health Service.Hyattsville, MD. 2005.
57. Brillinger DR. The natural variability of vital rates and associatedstatistics. Biometrics 42:693–734. 1986.
List of Detailed Tables1. Fetal deaths and mortality rates by period of gestation, age, and
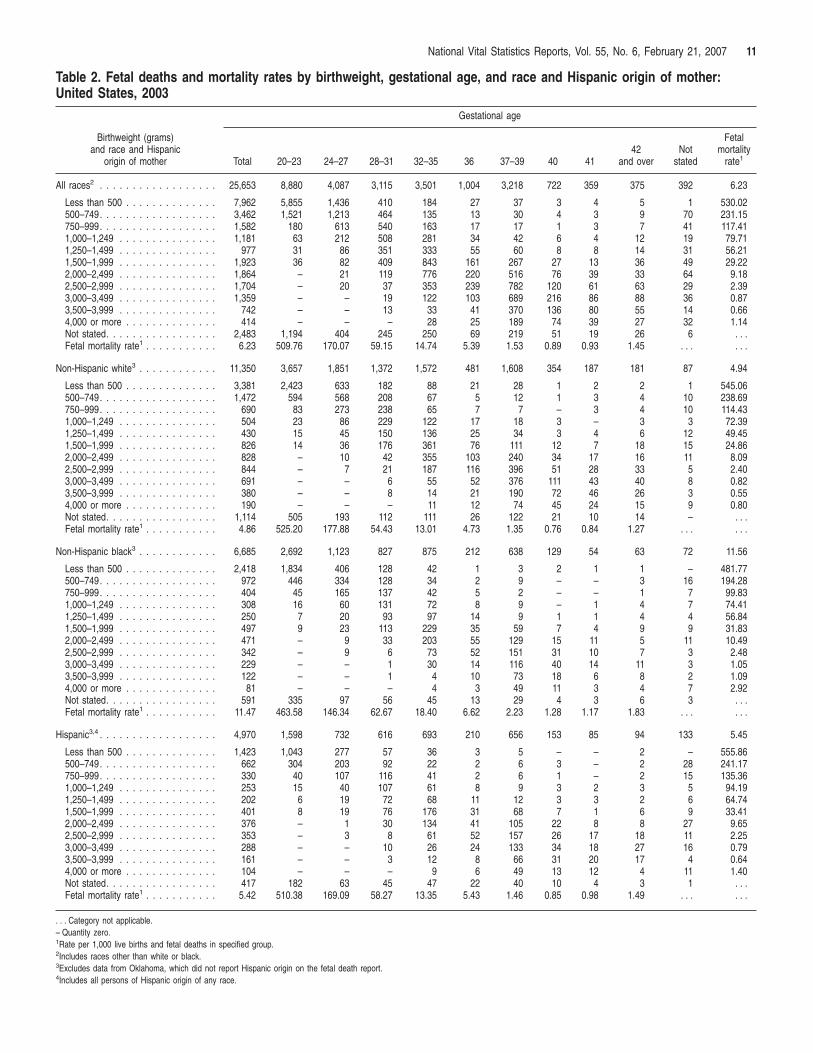
race and Hispanic origin of mother: United States, 2003 . . . . . . 102. Fetal deaths and mortality rates by birthweight, gestational age,
and race and Hispanic origin of mother: United States, 2003. . . 113. Fetal and perinatal deaths and mortality rates: United States,
each state and territory, 2003. . . . . . . . . . . . . . . . . . . . . . . . 12
10 National Vital Statistics Reports, Vol. 55, No. 6, February 21, 2007
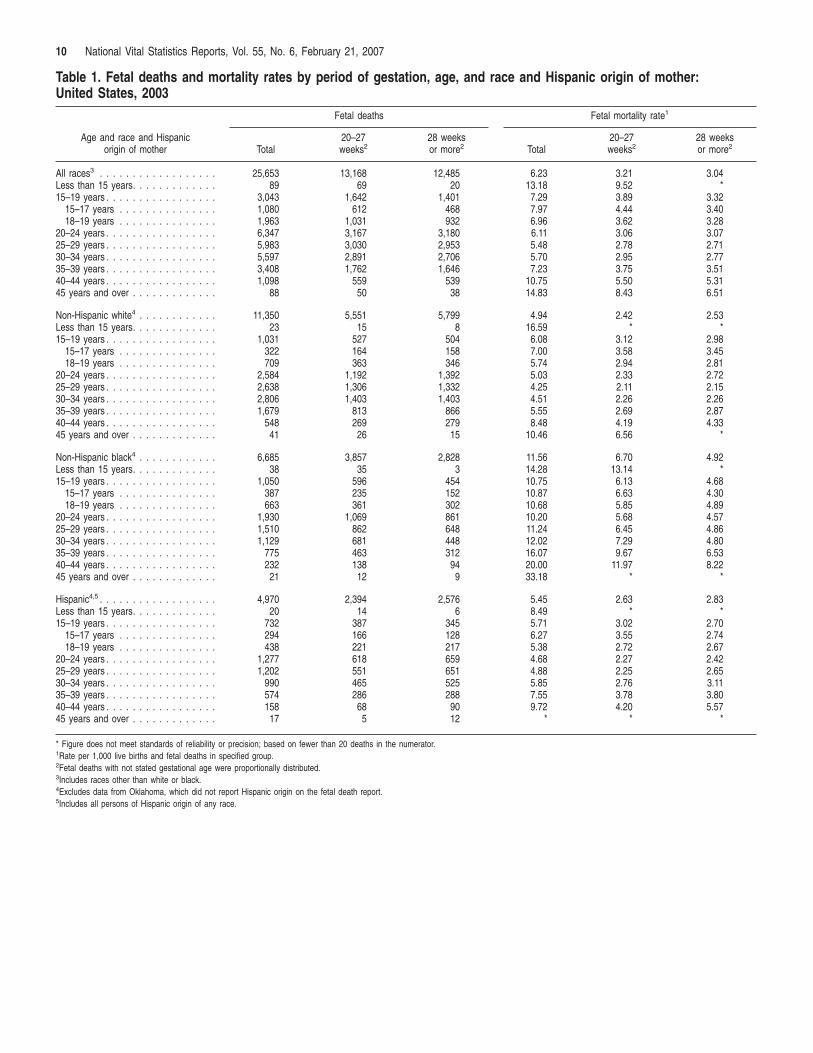
Table 1. Fetal deaths and mortality rates by period of gestation, age, and race and Hispanic origin of mother: United States, 2003
Fetal deaths Fetal mortality rate1
Age and race and Hispanic origin of mother Total
20–27 weeks2
28 weeks or more2 Total
20–27 weeks2
28 weeks or more2
All races3 . . . . . . . . . . . . . . . . . . 25,653 13,168 12,485 6.23 3.21 3.04 Less than 15 years. . . . . . . . . . . . . 89 69 20 13.18 9.52 * 15–19 years . . . . . . . . . . . . . . . . . 3,043 1,642 1,401 7.29 3.89 3.32
15–17 years . . . . . . . . . . . . . . . 1,080 612 468 7.97 4.44 3.40 18–19 years . . . . . . . . . . . . . . . 1,963 1,031 932 6.96 3.62 3.28
20–24 years . . . . . . . . . . . . . . . . . 6,347 3,167 3,180 6.11 3.06 3.07 25–29 years . . . . . . . . . . . . . . . . . 5,983 3,030 2,953 5.48 2.78 2.71 30–34 years . . . . . . . . . . . . . . . . . 5,597 2,891 2,706 5.70 2.95 2.77 35–39 years . . . . . . . . . . . . . . . . . 3,408 1,762 1,646 7.23 3.75 3.51 40–44 years . . . . . . . . . . . . . . . . . 1,098 559 539 10.75 5.50 5.31 45 years and over . . . . . . . . . . . . . 88 50 38 14.83 8.43 6.51
Non-Hispanic white4 . . . . . . . . . . . . 11,350 5,551 5,799 4.94 2.42 2.53 Less than 15 years. . . . . . . . . . . . . 23 15 8 16.59 * * 15–19 years . . . . . . . . . . . . . . . . . 1,031 527 504 6.08 3.12 2.98
15–17 years . . . . . . . . . . . . . . . 322 164 158 7.00 3.58 3.45 18–19 years . . . . . . . . . . . . . . . 709 363 346 5.74 2.94 2.81
20–24 years . . . . . . . . . . . . . . . . . 2,584 1,192 1,392 5.03 2.33 2.72 25–29 years . . . . . . . . . . . . . . . . . 2,638 1,306 1,332 4.25 2.11 2.15 30–34 years . . . . . . . . . . . . . . . . . 2,806 1,403 1,403 4.51 2.26 2.26 35–39 years . . . . . . . . . . . . . . . . . 1,679 813 866 5.55 2.69 2.87 40–44 years . . . . . . . . . . . . . . . . . 548 269 279 8.48 4.19 4.33 45 years and over . . . . . . . . . . . . . 41 26 15 10.46 6.56 *
Non-Hispanic black4 . . . . . . . . . . . . 6,685 3,857 2,828 11.56 6.70 4.92 Less than 15 years. . . . . . . . . . . . . 38 35 3 14.28 13.14 * 15–19 years . . . . . . . . . . . . . . . . . 1,050 596 454 10.75 6.13 4.68
15–17 years . . . . . . . . . . . . . . . 387 235 152 10.87 6.63 4.30 18–19 years . . . . . . . . . . . . . . . 663 361 302 10.68 5.85 4.89
20–24 years . . . . . . . . . . . . . . . . . 1,930 1,069 861 10.20 5.68 4.57 25–29 years . . . . . . . . . . . . . . . . . 1,510 862 648 11.24 6.45 4.86 30–34 years . . . . . . . . . . . . . . . . . 1,129 681 448 12.02 7.29 4.80 35–39 years . . . . . . . . . . . . . . . . . 775 463 312 16.07 9.67 6.53 40–44 years . . . . . . . . . . . . . . . . . 232 138 94 20.00 11.97 8.22 45 years and over . . . . . . . . . . . . . 21 12 9 33.18 * *
Hispanic4,5 . . . . . . . . . . . . . . . . . . 4,970 2,394 2,576 5.45 2.63 2.83 Less than 15 years. . . . . . . . . . . . . 20 14 6 8.49 * * 15–19 years . . . . . . . . . . . . . . . . . 732 387 345 5.71 3.02 2.70
15–17 years . . . . . . . . . . . . . . . 294 166 128 6.27 3.55 2.74 18–19 years . . . . . . . . . . . . . . . 438 221 217 5.38 2.72 2.67
20–24 years . . . . . . . . . . . . . . . . . 1,277 618 659 4.68 2.27 2.42 25–29 years . . . . . . . . . . . . . . . . . 1,202 551 651 4.88 2.25 2.65 30–34 years . . . . . . . . . . . . . . . . . 990 465 525 5.85 2.76 3.11 35–39 years . . . . . . . . . . . . . . . . . 574 286 288 7.55 3.78 3.80 40–44 years . . . . . . . . . . . . . . . . . 158 68 90 9.72 4.20 5.57 45 years and over . . . . . . . . . . . . . 17 5 12 * * *
* Figure does not meet standards of reliability or precision; based on fewer than 20 deaths in the numerator.1Rate per 1,000 live births and fetal deaths in specified group.2Fetal deaths with not stated gestational age were proportionally distributed.3Includes races other than white or black.4Excludes data from Oklahoma, which did not report Hispanic origin on the fetal death report.5Includes all persons of Hispanic origin of any race.
National Vital Statistics Reports, Vol. 55, No. 6, February 21, 2007 11
Table 2. Fetal deaths and mortality rates by birthweight, gestational age, and race and Hispanic origin of mother:United States, 2003
Gestational age
Birthweight (grams) Fetaland race and Hispanic 42 Not mortality
origin of mother Total 20–23 24–27 28–31 32–35 36 37–39 40 41 and over stated rate1
All races2 . . . . . . . . . . . . . . . . . . 25,653 8,880 4,087 3,115 3,501 1,004 3,218 722 359 375 392 6.23
Less than 500 . . . . . . . . . . . . . . 7,962 5,855 1,436 410 184 27 37 3 4 5 1 530.02500–749. . . . . . . . . . . . . . . . . . 3,462 1,521 1,213 464 135 13 30 4 3 9 70 231.15750–999. . . . . . . . . . . . . . . . . . 1,582 180 613 540 163 17 17 1 3 7 41 117.411,000–1,249 . . . . . . . . . . . . . . . 1,181 63 212 508 281 34 42 6 4 12 19 79.711,250–1,499 . . . . . . . . . . . . . . . 977 31 86 351 333 55 60 8 8 14 31 56.211,500–1,999 . . . . . . . . . . . . . . . 1,923 36 82 409 843 161 267 27 13 36 49 29.222,000–2,499 . . . . . . . . . . . . . . . 1,864 – 21 119 776 220 516 76 39 33 64 9.182,500–2,999 . . . . . . . . . . . . . . . 1,704 – 20 37 353 239 782 120 61 63 29 2.393,000–3,499 . . . . . . . . . . . . . . . 1,359 – – 19 122 103 689 216 86 88 36 0.873,500–3,999 . . . . . . . . . . . . . . . 742 – – 13 33 41 370 136 80 55 14 0.664,000 or more . . . . . . . . . . . . . . 414 – – – 28 25 189 74 39 27 32 1.14Not stated. . . . . . . . . . . . . . . . . 2,483 1,194 404 245 250 69 219 51 19 26 6 . . .Fetal mortality rate1 . . . . . . . . . . . 6.23 509.76 170.07 59.15 14.74 5.39 1.53 0.89 0.93 1.45 . . . . . .
Non-Hispanic white3 . . . . . . . . . . . . 11,350 3,657 1,851 1,372 1,572 481 1,608 354 187 181 87 4.94
Less than 500 . . . . . . . . . . . . . . 3,381 2,423 633 182 88 21 28 1 2 2 1 545.06500–749. . . . . . . . . . . . . . . . . . 1,472 594 568 208 67 5 12 1 3 4 10 238.69750–999. . . . . . . . . . . . . . . . . . 690 83 273 238 65 7 7 – 3 4 10 114.431,000–1,249 . . . . . . . . . . . . . . . 504 23 86 229 122 17 18 3 – 3 3 72.391,250–1,499 . . . . . . . . . . . . . . . 430 15 45 150 136 25 34 3 4 6 12 49.451,500–1,999 . . . . . . . . . . . . . . . 826 14 36 176 361 76 111 12 7 18 15 24.862,000–2,499 . . . . . . . . . . . . . . . 828 – 10 42 355 103 240 34 17 16 11 8.092,500–2,999 . . . . . . . . . . . . . . . 844 – 7 21 187 116 396 51 28 33 5 2.403,000–3,499 . . . . . . . . . . . . . . . 691 – – 6 55 52 376 111 43 40 8 0.823,500–3,999 . . . . . . . . . . . . . . . 380 – – 8 14 21 190 72 46 26 3 0.554,000 or more . . . . . . . . . . . . . . 190 – – – 11 12 74 45 24 15 9 0.80Not stated. . . . . . . . . . . . . . . . . 1,114 505 193 112 111 26 122 21 10 14 – . . . Fetal mortality rate1 . . . . . . . . . . . 4.86 525.20 177.88 54.43 13.01 4.73 1.35 0.76 0.84 1.27 . . . . . .
Non-Hispanic black3 . . . . . . . . . . . . 6,685 2,692 1,123 827 875 212 638 129 54 63 72 11.56
Less than 500 . . . . . . . . . . . . . . 2,418 1,834 406 128 42 1 3 2 1 1 – 481.77500–749. . . . . . . . . . . . . . . . . . 972 446 334 128 34 2 9 – – 3 16 194.28750–999. . . . . . . . . . . . . . . . . . 404 45 165 137 42 5 2 – – 1 7 99.831,000–1,249 . . . . . . . . . . . . . . . 308 16 60 131 72 8 9 – 1 4 7 74.411,250–1,499 . . . . . . . . . . . . . . . 250 7 20 93 97 14 9 1 1 4 4 56.841,500–1,999 . . . . . . . . . . . . . . . 497 9 23 113 229 35 59 7 4 9 9 31.832,000–2,499 . . . . . . . . . . . . . . . 471 – 9 33 203 55 129 15 11 5 11 10.492,500–2,999 . . . . . . . . . . . . . . . 342 – 9 6 73 52 151 31 10 7 3 2.483,000–3,499 . . . . . . . . . . . . . . . 229 – – 1 30 14 116 40 14 11 3 1.053,500–3,999 . . . . . . . . . . . . . . . 122 – – 1 4 10 73 18 6 8 2 1.094,000 or more . . . . . . . . . . . . . . 81 – – – 4 3 49 11 3 4 7 2.92Not stated. . . . . . . . . . . . . . . . . 591 335 97 56 45 13 29 4 3 6 3 . . . Fetal mortality rate1 . . . . . . . . . . . 11.47 463.58 146.34 62.67 18.40 6.62 2.23 1.28 1.17 1.83 . . . . . .
Hispanic3,4 . . . . . . . . . . . . . . . . . . 4,970 1,598 732 616 693 210 656 153 85 94 133 5.45
Less than 500 . . . . . . . . . . . . . . 1,423 1,043 277 57 36 3 5 – – 2 – 555.86500–749. . . . . . . . . . . . . . . . . . 662 304 203 92 22 2 6 3 – 2 28 241.17750–999. . . . . . . . . . . . . . . . . . 330 40 107 116 41 2 6 1 – 2 15 135.361,000–1,249 . . . . . . . . . . . . . . . 253 15 40 107 61 8 9 3 2 3 5 94.191,250–1,499 . . . . . . . . . . . . . . . 202 6 19 72 68 11 12 3 3 2 6 64.741,500–1,999 . . . . . . . . . . . . . . . 401 8 19 76 176 31 68 7 1 6 9 33.412,000–2,499 . . . . . . . . . . . . . . . 376 – 1 30 134 41 105 22 8 8 27 9.652,500–2,999 . . . . . . . . . . . . . . . 353 – 3 8 61 52 157 26 17 18 11 2.253,000–3,499 . . . . . . . . . . . . . . . 288 – – 10 26 24 133 34 18 27 16 0.793,500–3,999 . . . . . . . . . . . . . . . 161 – – 3 12 8 66 31 20 17 4 0.644,000 or more . . . . . . . . . . . . . . 104 – – – 9 6 49 13 12 4 11 1.40Not stated. . . . . . . . . . . . . . . . . 417 182 63 45 47 22 40 10 4 3 1 . . . Fetal mortality rate1 . . . . . . . . . . . 5.42 510.38 169.09 58.27 13.35 5.43 1.46 0.85 0.98 1.49 . . . . . .
. . . Category not applicable. – Quantity zero.1Rate per 1,000 live births and fetal deaths in specified group.2Includes races other than white or black.3Excludes data from Oklahoma, which did not report Hispanic origin on the fetal death report.4Includes all persons of Hispanic origin of any race.
12 National Vital Statistics Reports, Vol. 55, No. 6, February 21, 2007
Table 3. Fetal and perinatal deaths and mortality rates: United States, each state and territory, 2003
Fetal1 Perinatal Definition I2 Perinatal Definition II3
Number of deaths
Mortality rate4
Number of deaths
Mortality rate4
Number of deaths
Mortality rate4
United States . . . . . . . . . . . . . . . .
Alabama . . . . . . . . . . . . . . . . . . . Alaska . . . . . . . . . . . . . . . . . . . . Arizona . . . . . . . . . . . . . . . . . . . . Arkansas . . . . . . . . . . . . . . . . . . . California. . . . . . . . . . . . . . . . . . . Colorado . . . . . . . . . . . . . . . . . . . Connecticut . . . . . . . . . . . . . . . . . Delaware. . . . . . . . . . . . . . . . . . . District of Columbia . . . . . . . . . . . . Florida . . . . . . . . . . . . . . . . . . . . Georgia . . . . . . . . . . . . . . . . . . . Hawaii . . . . . . . . . . . . . . . . . . . . Idaho . . . . . . . . . . . . . . . . . . . . . Illinois . . . . . . . . . . . . . . . . . . . . Indiana . . . . . . . . . . . . . . . . . . . . Iowa . . . . . . . . . . . . . . . . . . . . . Kansas . . . . . . . . . . . . . . . . . . . . Kentucky . . . . . . . . . . . . . . . . . . . Louisiana. . . . . . . . . . . . . . . . . . . Maine. . . . . . . . . . . . . . . . . . . . . Maryland . . . . . . . . . . . . . . . . . . . Massachusetts . . . . . . . . . . . . . . . Michigan . . . . . . . . . . . . . . . . . . . Minnesota . . . . . . . . . . . . . . . . . . Mississippi . . . . . . . . . . . . . . . . . . Missouri . . . . . . . . . . . . . . . . . . . Montana . . . . . . . . . . . . . . . . . . . Nebraska. . . . . . . . . . . . . . . . . . . Nevada. . . . . . . . . . . . . . . . . . . . New Hampshire. . . . . . . . . . . . . . . New Jersey . . . . . . . . . . . . . . . . . New Mexico5 . . . . . . . . . . . . . . . . New York . . . . . . . . . . . . . . . . . . North Carolina. . . . . . . . . . . . . . . . North Dakota . . . . . . . . . . . . . . . . Ohio . . . . . . . . . . . . . . . . . . . . . Oklahoma . . . . . . . . . . . . . . . . . . Oregon . . . . . . . . . . . . . . . . . . . . Pennsylvania . . . . . . . . . . . . . . . . Rhode Island . . . . . . . . . . . . . . . . South Carolina . . . . . . . . . . . . . . . South Dakota5 . . . . . . . . . . . . . . . Tennessee5 . . . . . . . . . . . . . . . . . Texas . . . . . . . . . . . . . . . . . . . . . Utah . . . . . . . . . . . . . . . . . . . . . Vermont . . . . . . . . . . . . . . . . . . . Virginia . . . . . . . . . . . . . . . . . . . . Washington . . . . . . . . . . . . . . . . . West Virginia . . . . . . . . . . . . . . . . Wisconsin . . . . . . . . . . . . . . . . . . Wyoming . . . . . . . . . . . . . . . . . . .
Puerto Rico . . . . . . . . . . . . . . . . . Virgin Islands . . . . . . . . . . . . . . . . Guam. . . . . . . . . . . . . . . . . . . . .
25,653
516 60
568 259
2,862 394 241
63 65
1,549 1,138
131 113
1,148 496 201 208 338 463
50 629 457 730 337 403 488
55 151 239 68
768 85
2,146 832
41 929 247 203 956
52 517 39
373 2,063
241 21
687 503 143 356
31
544 15 36
6.23
8.59 5.91 6.21 6.81 5.26 5.65 5.59 5.53 8.46 7.25 8.30 7.19 5.16 6.25 5.71 5.24 5.24 6.08 7.07 3.60 8.32 5.67 5.54 4.79 9.42 6.29 4.79 5.79 7.05 4.70 6.52 3.05 8.39 6.98 5.12 6.17 4.82 4.40 6.51 3.92 9.20 3.52 4.71 5.44 4.81 3.18 6.74 6.21 6.78 5.06 4.61
10.62 *
10.74
27,637
476 56
589 298
3,083 479 247
93 74
1,529 1,082
118 134
1,331 598 200 261 336 502
76 635 479 988 359 374 651
67 168 210
60 733 133
1,711 943
58 1,117
306 260
1,108 76
506 61
639 2,313
264 39
726 467 148 447
42
446 17 43
6.71
7.93 5.52 6.43 7.83 5.67 6.86 5.73 8.14 9.62 7.15 7.89 6.48 6.11 7.24 6.87 5.21 6.57 6.05 7.66 5.46 8.40 5.94 7.48 5.10 8.75 8.38 5.83 6.44 6.20 4.15 6.23 4.76 6.70 7.91 7.22 7.41 5.97 5.63 7.53 5.72 9.01 5.50 8.03 6.09 5.27 5.88 7.12 5.77 7.02 6.34 6.23
8.72 *
12.81
44,588
828 93
960 463
4,757 705 402 139 118
2,580 1,918
228 195
2,136 930 335 384 561 836 106
1,076 741
1,511 553 651 930
98 247 354 109
1,241 178
3,245 1,505
86 1,735
470 375
1,745 118 847
75 843
3,706 424
51 1,229
808 239 669
53
901 25 64
10.78
13.71 9.14
10.44 12.11 8.72
10.07 9.29
12.12 15.25 12.01 13.91 12.44
8.87 11.57 10.65
8.70 9.63
10.05 12.69
7.59 14.16
9.16 11.39 7.83
15.13 11.93 8.51 9.44
10.41 7.52
10.50 6.36
12.63 12.56 10.67 11.46 9.13 8.09
11.81 8.85
14.99 6.76
10.57 9.72 8.43 7.68
11.99 9.94
11.29 9.46 7.85
17.46 16.16 18.94
* Figure does not meet standards of reliability or precision; based on fewer than 20 deaths in the numerator.1Fetal deaths with stated or presumed period of gestation of 20 weeks or more.2Infant deaths of less than 7 days and fetal deaths with stated or presumed period of gestation of 28 weeks or more. Fetal deaths with not stated gestational age are proportionally distributed to20–27 week and 28 week or more.3Infant deaths of less than 28 days and fetal deaths with stated or presumed period of gestation of 20 weeks or more.4Rate per 1,000 live births and specified fetal deaths.5State reports only fetal deaths of 500 grams or more; data for fetal and perinatal definition II are not comparable with data from other states.
Per
cent
SOURCE: CDC/NCHS, National Vital Statistics System.
27.1
50.354.2
58.9
0
20
40
60
80
100
All periodsof gestation
16 weeks 20 weeks or350 grams
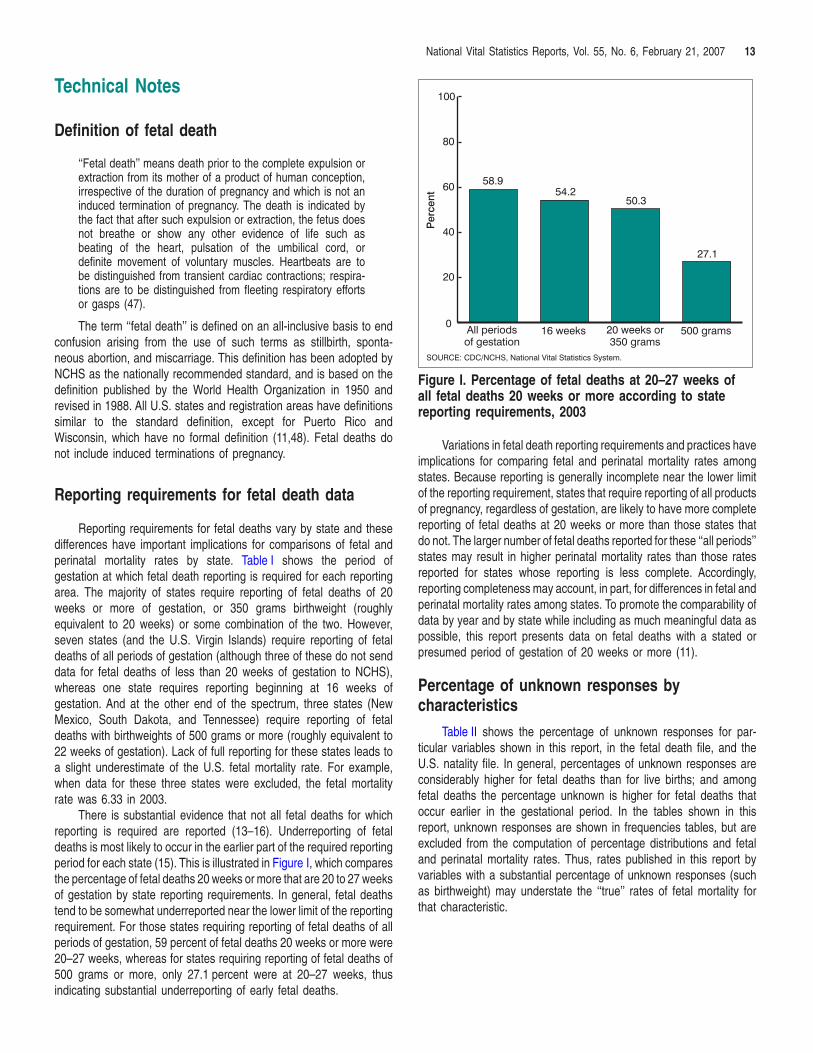
500 grams
Figure I. Percentage of fetal deaths at 20–27 weeks ofall fetal deaths 20 weeks or more according to statereporting requirements, 2003
National Vital Statistics Reports, Vol. 55, No. 6, February 21, 2007 13
Technical Notes
Definition of fetal death
‘‘Fetal death’’ means death prior to the complete expulsion orextraction from its mother of a product of human conception,irrespective of the duration of pregnancy and which is not aninduced termination of pregnancy. The death is indicated bythe fact that after such expulsion or extraction, the fetus doesnot breathe or show any other evidence of life such asbeating of the heart, pulsation of the umbilical cord, ordefinite movement of voluntary muscles. Heartbeats are tobe distinguished from transient cardiac contractions; respira-tions are to be distinguished from fleeting respiratory effortsor gasps (47).
The term ‘‘fetal death’’ is defined on an all-inclusive basis to endconfusion arising from the use of such terms as stillbirth, sponta-neous abortion, and miscarriage. This definition has been adopted byNCHS as the nationally recommended standard, and is based on thedefinition published by the World Health Organization in 1950 andrevised in 1988. All U.S. states and registration areas have definitionssimilar to the standard definition, except for Puerto Rico andWisconsin, which have no formal definition (11,48). Fetal deaths donot include induced terminations of pregnancy.
Reporting requirements for fetal death data
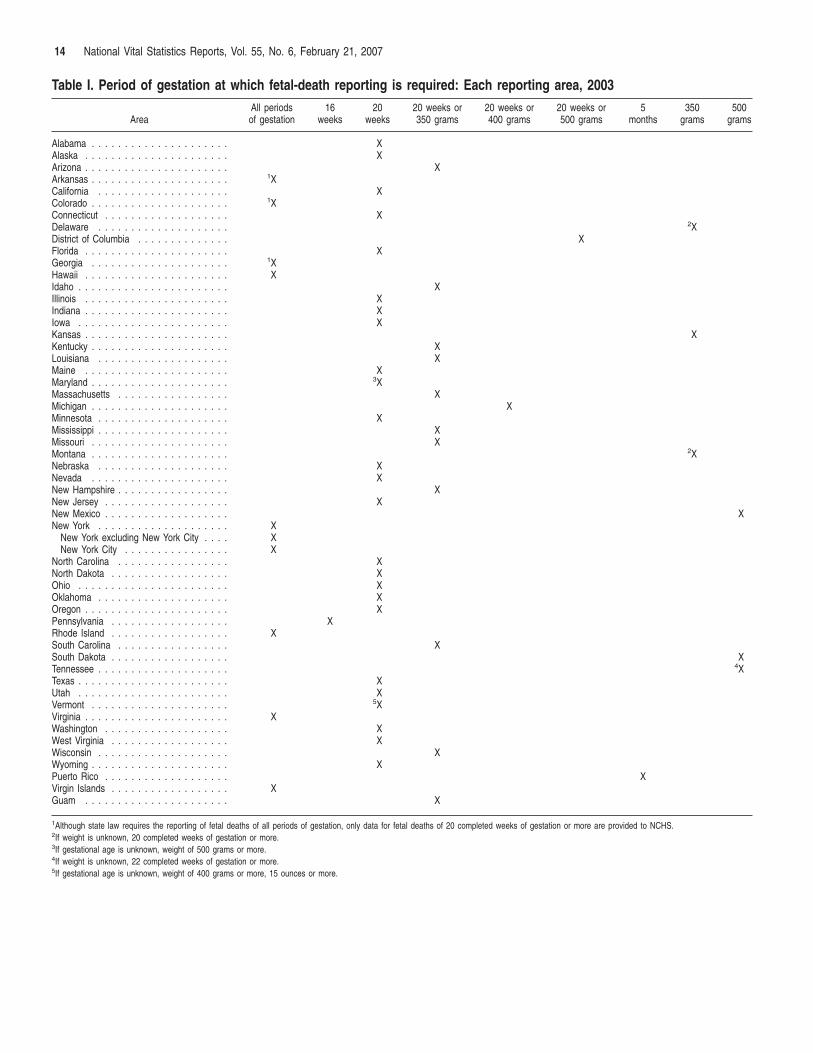
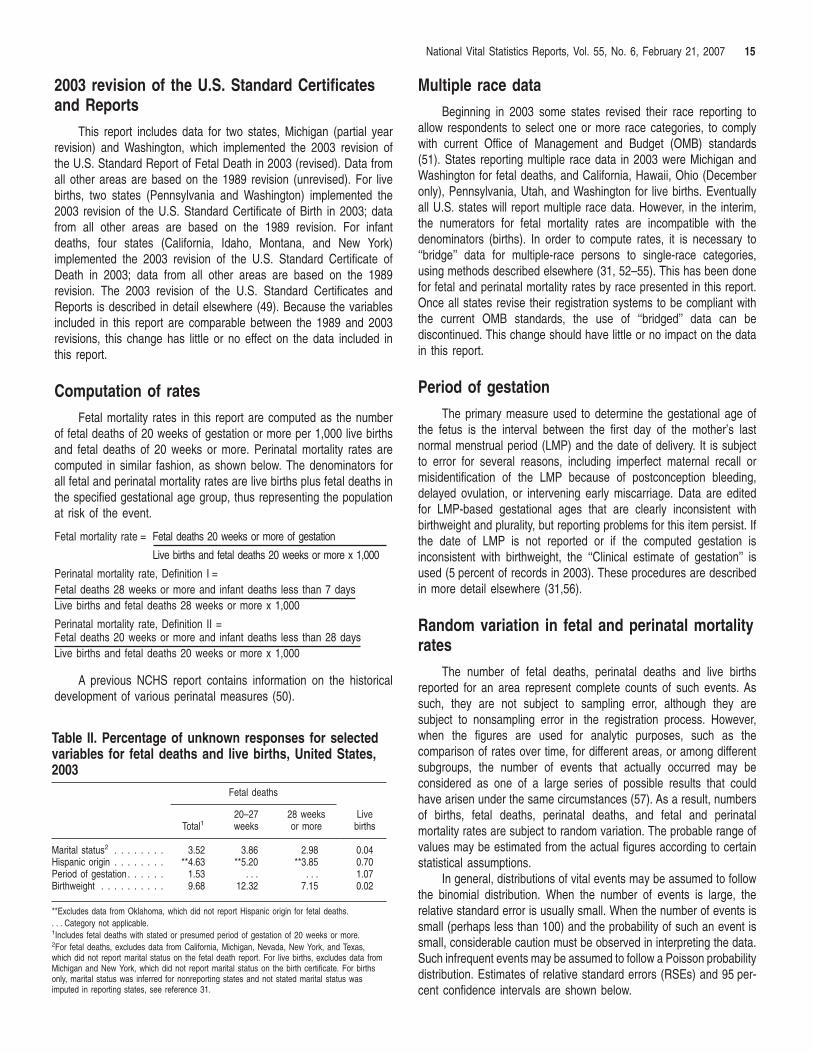
Reporting requirements for fetal deaths vary by state and thesedifferences have important implications for comparisons of fetal andperinatal mortality rates by state. Table I shows the period ofgestation at which fetal death reporting is required for each reportingarea. The majority of states require reporting of fetal deaths of 20weeks or more of gestation, or 350 grams birthweight (roughlyequivalent to 20 weeks) or some combination of the two. However,seven states (and the U.S. Virgin Islands) require reporting of fetaldeaths of all periods of gestation (although three of these do not senddata for fetal deaths of less than 20 weeks of gestation to NCHS),whereas one state requires reporting beginning at 16 weeks ofgestation. And at the other end of the spectrum, three states (NewMexico, South Dakota, and Tennessee) require reporting of fetaldeaths with birthweights of 500 grams or more (roughly equivalent to22 weeks of gestation). Lack of full reporting for these states leads toa slight underestimate of the U.S. fetal mortality rate. For example,when data for these three states were excluded, the fetal mortalityrate was 6.33 in 2003.
There is substantial evidence that not all fetal deaths for whichreporting is required are reported (13–16). Underreporting of fetaldeaths is most likely to occur in the earlier part of the required reportingperiod for each state (15). This is illustrated in Figure I, which comparesthe percentage of fetal deaths 20 weeks or more that are 20 to 27 weeksof gestation by state reporting requirements. In general, fetal deathstend to be somewhat underreported near the lower limit of the reportingrequirement. For those states requiring reporting of fetal deaths of allperiods of gestation, 59 percent of fetal deaths 20 weeks or more were20–27 weeks, whereas for states requiring reporting of fetal deaths of500 grams or more, only 27.1 percent were at 20–27 weeks, thusindicating substantial underreporting of early fetal deaths.
Variations in fetal death reporting requirements and practices haveimplications for comparing fetal and perinatal mortality rates amongstates. Because reporting is generally incomplete near the lower limitof the reporting requirement, states that require reporting of all productsof pregnancy, regardless of gestation, are likely to have more completereporting of fetal deaths at 20 weeks or more than those states thatdo not. The larger number of fetal deaths reported for these ‘‘all periods’’states may result in higher perinatal mortality rates than those ratesreported for states whose reporting is less complete. Accordingly,reporting completeness may account, in part, for differences in fetal andperinatal mortality rates among states. To promote the comparability ofdata by year and by state while including as much meaningful data aspossible, this report presents data on fetal deaths with a stated orpresumed period of gestation of 20 weeks or more (11).
Percentage of unknown responses bycharacteristics
Table II shows the percentage of unknown responses for par-ticular variables shown in this report, in the fetal death file, and theU.S. natality file. In general, percentages of unknown responses areconsiderably higher for fetal deaths than for live births; and amongfetal deaths the percentage unknown is higher for fetal deaths thatoccur earlier in the gestational period. In the tables shown in thisreport, unknown responses are shown in frequencies tables, but areexcluded from the computation of percentage distributions and fetaland perinatal mortality rates. Thus, rates published in this report byvariables with a substantial percentage of unknown responses (suchas birthweight) may understate the ‘‘true’’ rates of fetal mortality forthat characteristic.
500
14 National Vital Statistics Reports, Vol. 55, No. 6, February 21, 2007
Table I. Period of gestation at which fetal-death reporting is required: Each reporting area, 2003
All periods 16 20 20 weeks or 20 weeks or 20 weeks or 5 350Area of gestation weeks weeks 350 grams 400 grams 500 grams months grams grams
Alabama . . . . . . . . . . . . . . . . . . . . . X Alaska . . . . . . . . . . . . . . . . . . . . . . X Arizona . . . . . . . . . . . . . . . . . . . . . . X Arkansas . . . . . . . . . . . . . . . . . . . . . 1XCalifornia . . . . . . . . . . . . . . . . . . . . X Colorado . . . . . . . . . . . . . . . . . . . . . 1XConnecticut . . . . . . . . . . . . . . . . . . . X Delaware . . . . . . . . . . . . . . . . . . . . 2XDistrict of Columbia . . . . . . . . . . . . . . XFlorida . . . . . . . . . . . . . . . . . . . . . . X Georgia . . . . . . . . . . . . . . . . . . . . . 1XHawaii . . . . . . . . . . . . . . . . . . . . . . X Idaho . . . . . . . . . . . . . . . . . . . . . . . X Illinois . . . . . . . . . . . . . . . . . . . . . . X Indiana . . . . . . . . . . . . . . . . . . . . . . X Iowa . . . . . . . . . . . . . . . . . . . . . . . X Kansas . . . . . . . . . . . . . . . . . . . . . . XKentucky . . . . . . . . . . . . . . . . . . . . . X Louisiana . . . . . . . . . . . . . . . . . . . . X Maine . . . . . . . . . . . . . . . . . . . . . . X Maryland . . . . . . . . . . . . . . . . . . . . . 3XMassachusetts . . . . . . . . . . . . . . . . . X Michigan . . . . . . . . . . . . . . . . . . . . . X Minnesota . . . . . . . . . . . . . . . . . . . . X Mississippi . . . . . . . . . . . . . . . . . . . . X Missouri . . . . . . . . . . . . . . . . . . . . . X Montana . . . . . . . . . . . . . . . . . . . . . 2XNebraska . . . . . . . . . . . . . . . . . . . . X Nevada . . . . . . . . . . . . . . . . . . . . . X New Hampshire . . . . . . . . . . . . . . . . . X New Jersey . . . . . . . . . . . . . . . . . . . X New Mexico . . . . . . . . . . . . . . . . . . . XNew York . . . . . . . . . . . . . . . . . . . . X
New York excluding New York City . . . . X New York City . . . . . . . . . . . . . . . . X
North Carolina . . . . . . . . . . . . . . . . . X North Dakota . . . . . . . . . . . . . . . . . . X Ohio . . . . . . . . . . . . . . . . . . . . . . . X Oklahoma . . . . . . . . . . . . . . . . . . . . X Oregon . . . . . . . . . . . . . . . . . . . . . . X Pennsylvania . . . . . . . . . . . . . . . . . . X Rhode Island . . . . . . . . . . . . . . . . . . X South Carolina . . . . . . . . . . . . . . . . . X South Dakota . . . . . . . . . . . . . . . . . . XTennessee . . . . . . . . . . . . . . . . . . . . 4XTexas . . . . . . . . . . . . . . . . . . . . . . . X Utah . . . . . . . . . . . . . . . . . . . . . . . X Vermont . . . . . . . . . . . . . . . . . . . . . 5XVirginia . . . . . . . . . . . . . . . . . . . . . . X Washington . . . . . . . . . . . . . . . . . . . X West Virginia . . . . . . . . . . . . . . . . . . X Wisconsin . . . . . . . . . . . . . . . . . . . . X Wyoming . . . . . . . . . . . . . . . . . . . . . X Puerto Rico . . . . . . . . . . . . . . . . . . . XVirgin Islands . . . . . . . . . . . . . . . . . . X Guam . . . . . . . . . . . . . . . . . . . . . . X
1Although state law requires the reporting of fetal deaths of all periods of gestation, only data for fetal deaths of 20 completed weeks of gestation or more are provided to NCHS. 2If weight is unknown, 20 completed weeks of gestation or more. 3If gestational age is unknown, weight of 500 grams or more. 4If weight is unknown, 22 completed weeks of gestation or more. 5If gestational age is unknown, weight of 400 grams or more, 15 ounces or more.
National Vital Statistics Reports, Vol. 55, No. 6, February 21, 2007 15
2003 revision of the U.S. Standard Certificates and Reports
This report includes data for two states, Michigan (partial year revision) and Washington, which implemented the 2003 revision of the U.S. Standard Report of Fetal Death in 2003 (revised). Data from all other areas are based on the 1989 revision (unrevised). For live births, two states (Pennsylvania and Washington) implemented the 2003 revision of the U.S. Standard Certificate of Birth in 2003; data from all other areas are based on the 1989 revision. For infant deaths, four states (California, Idaho, Montana, and New York) implemented the 2003 revision of the U.S. Standard Certificate of Death in 2003; data from all other areas are based on the 1989 revision. The 2003 revision of the U.S. Standard Certificates and Reports is described in detail elsewhere (49). Because the variables included in this report are comparable between the 1989 and 2003 revisions, this change has little or no effect on the data included in this report.
Computation of rates
Fetal mortality rates in this report are computed as the number of fetal deaths of 20 weeks of gestation or more per 1,000 live births and fetal deaths of 20 weeks or more. Perinatal mortality rates are computed in similar fashion, as shown below. The denominators for all fetal and perinatal mortality rates are live births plus fetal deaths in the specified gestational age group, thus representing the population at risk of the event.
Fetal mortality rate = Fetal deaths 20 weeks or more of gestation
Live births and fetal deaths 20 weeks or more x 1,000
Perinatal mortality rate, Definition I = Fetal deaths 28 weeks or more and infant deaths less than 7 days Live births and fetal deaths 28 weeks or more x 1,000
Perinatal mortality rate, Definition II =Fetal deaths 20 weeks or more and infant deaths less than 28 daysLive births and fetal deaths 20 weeks or more x 1,000
A previous NCHS report contains information on the historical development of various perinatal measures (50).
Table II. Percentage of unknown responses for selected variables for fetal deaths and live births, United States, 2003
Fetal deaths
Total1 20–27 weeks
28 weeks or more
Live births
Marital status2 . . . . . . . . Hispanic origin . . . . . . . . Period of gestation . . . . . . Birthweight . . . . . . . . . .
3.52 **4.63
1.53 9.68
3.86 **5.20
. . . 12.32
2.98 **3.85
. . . 7.15
0.04 0.70 1.07 0.02
**Excludes data from Oklahoma, which did not report Hispanic origin for fetal deaths.. . . Category not applicable.1Includes fetal deaths with stated or presumed period of gestation of 20 weeks or more.2For fetal deaths, excludes data from California, Michigan, Nevada, New York, and Texas,which did not report marital status on the fetal death report. For live births, excludes data fromMichigan and New York, which did not report marital status on the birth certificate. For birthsonly, marital status was inferred for nonreporting states and not stated marital status wasimputed in reporting states, see reference 31.
Multiple race data
Beginning in 2003 some states revised their race reporting to allow respondents to select one or more race categories, to comply with current Office of Management and Budget (OMB) standards (51). States reporting multiple race data in 2003 were Michigan and Washington for fetal deaths, and California, Hawaii, Ohio (December only), Pennsylvania, Utah, and Washington for live births. Eventually all U.S. states will report multiple race data. However, in the interim, the numerators for fetal mortality rates are incompatible with the denominators (births). In order to compute rates, it is necessary to ‘‘bridge’’ data for multiple-race persons to single-race categories, using methods described elsewhere (31, 52–55). This has been done for fetal and perinatal mortality rates by race presented in this report. Once all states revise their registration systems to be compliant with the current OMB standards, the use of ‘‘bridged’’ data can be discontinued. This change should have little or no impact on the data in this report.
Period of gestation
The primary measure used to determine the gestational age of the fetus is the interval between the first day of the mother’s last normal menstrual period (LMP) and the date of delivery. It is subject to error for several reasons, including imperfect maternal recall or misidentification of the LMP because of postconception bleeding, delayed ovulation, or intervening early miscarriage. Data are edited for LMP-based gestational ages that are clearly inconsistent with birthweight and plurality, but reporting problems for this item persist. If the date of LMP is not reported or if the computed gestation is inconsistent with birthweight, the ‘‘Clinical estimate of gestation’’ is used (5 percent of records in 2003). These procedures are described in more detail elsewhere (31,56).
Random variation in fetal and perinatal mortality rates
The number of fetal deaths, perinatal deaths and live births reported for an area represent complete counts of such events. As such, they are not subject to sampling error, although they are subject to nonsampling error in the registration process. However, when the figures are used for analytic purposes, such as the comparison of rates over time, for different areas, or among different subgroups, the number of events that actually occurred may be considered as one of a large series of possible results that could have arisen under the same circumstances (57). As a result, numbers of births, fetal deaths, perinatal deaths, and fetal and perinatal mortality rates are subject to random variation. The probable range of values may be estimated from the actual figures according to certain statistical assumptions.
In general, distributions of vital events may be assumed to follow the binomial distribution. When the number of events is large, the relative standard error is usually small. When the number of events is small (perhaps less than 100) and the probability of such an event is small, considerable caution must be observed in interpreting the data. Such infrequent events may be assumed to follow a Poisson probability distribution. Estimates of relative standard errors (RSEs) and 95 percent confidence intervals are shown below.

16 National Vital Statistics Reports, Vol. 55, No. 6, February 21, 2007
Availability of fetal and perinatal data
Fetal and perinatal data are available on the Perinatal CD-ROM, which contains all of the variables included in this report, plus many additional variables (10). This CD-ROM has been published annually since 1995, and is available from NCHS by calling 1–866-441–6247. Additional information on fetal and perinatal mortality is available from: http://www.cdc.gov/nchs.
The formula for the RSE of fetal or perinatal deaths and live births is:
RSE(D) = 100 c ŒD 1
where D is the number of deaths and
RSE (B) = 100 c ŒB 1
where B is the number of births.
For example, let us say that for group A the number of fetal deaths was 238 and the number of live births was 32,650 yielding a fetal mortality rate of 7.29 fetal deaths per 1,000 live births.
Π1The RSE of the deaths =100 c 238 = 6.48, and
Π1the RSE of the births = 100 c = 0.55. 32,650
The formula for the RSE of the fetal mortality rate (FMR) is:
1 RSE(FMR) = 100 c ŒD
1+ B
The RSE of the FMR for the example above
1Π1 = 100 c 238 + 32,650 = 6.51.
Binomial distribution—When the number of events is greater than 100, the binomial distribution is used to estimate the 95 percent confidence intervals as follows:
RSE(R1)Lower: R1 – 1.96 c R1 c 100
RSE(R1)Upper: R1 + 1.96 c R1 c 100
Thus, for group A:
Lower: 7.29 – (1.96 c 7.29 c 6.51) = 6.36 100
Upper: 7.29 + (1.96 c 7.29 c 6.51) = 8.22 100
Thus the chances are 95 out of 100 that the true fetal or perinatal mortality rate for Group A lies somewhere in the 6.36–8.22 interval.
Poisson distribution—When the number of events in the numerator is less than 100, the confidence interval for the rate can be estimated based on the Poisson distribution using the values in Table III.
Lower: FMR c L (.95, Dadj)
Upper: FMR c U (.95, Dadj)
where Dadj is the adjusted number of fetal or perinatal deaths (rounded to the nearest integer) used to take into account the RSE of the number of deaths and live births, and is computed as follows:
D c BDadj = D + B
L (.95, Dadj) and U (.95, Dadj) refer to the values in Table III corresponding to the value of Dadj.
For example, let us say that for group B the number of deaths was 73, the number of live births was 11,422, and the mortality rate was 6.39.
(73 c 11,422)Dadj = (73 + 11,422) = 73
Therefore the 95 percent confidence interval (using the formula in Table III for 1–99 infant deaths) =
Lower: 6.39 c 0.78384 = 5.01
Upper: 6.39 c 1.25735 = 8.03
Comparison of two fetal or perinatal mortality rates—If either of the two rates to be compared is based on fewer than 100 deaths, compute the confidence intervals for both rates and check to see if they overlap. If so, the difference is not statistically significant at the 95 percent level. If they do not overlap, the difference is statistically significant. If both of the two rates (R1 and R2) to be compared are based on 100 or more deaths, the following z-test may be used to define a significance test statistic:
R1 – R2 z =
RSE(R1) 2 RSE(R2) 2ŒR12 ( 100 ) + R2
2 ( 100 )If ?z? ≥ 1.96, then the difference is statistically significant at the 0.05 level and if ?z? < 1.96, the difference is not significant.
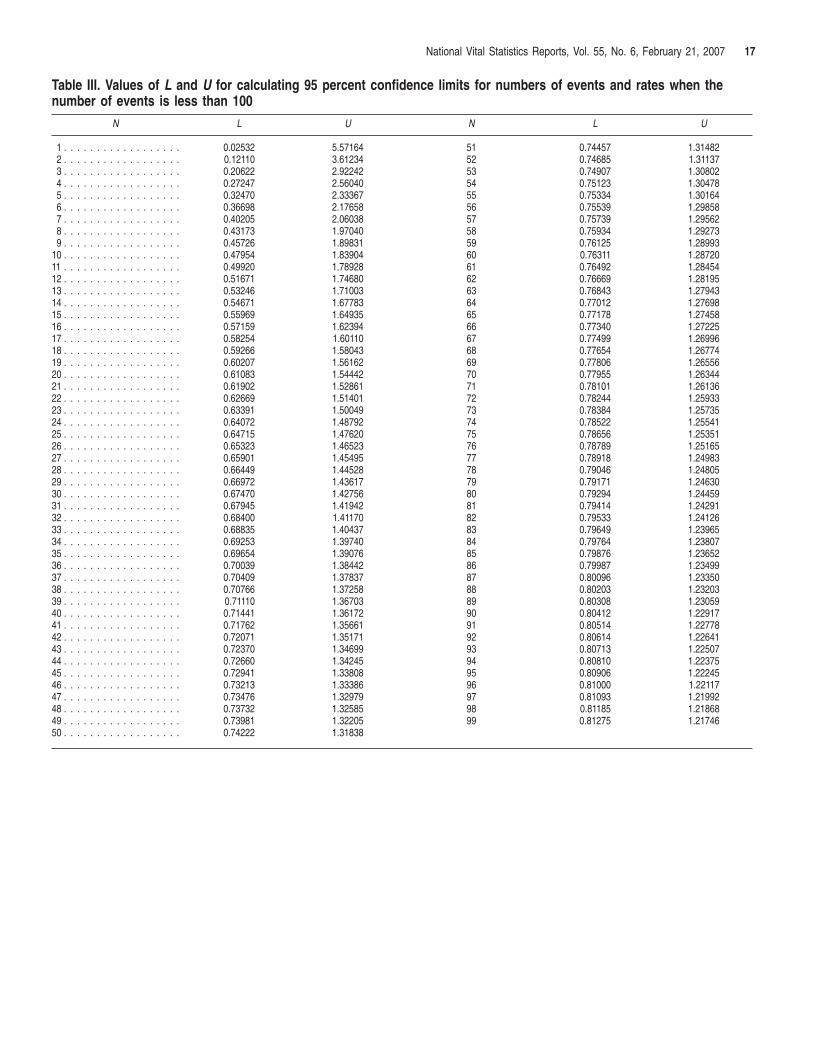
National Vital Statistics Reports, Vol. 55, No. 6, February 21, 2007 17
Table III. Values of L and U for calculating 95 percent confidence limits for numbers of events and rates when the number of events is less than 100
N L U N L U
1 . . . . . . . . . . . . . . . . . . 0.02532 5.57164 51 0.74457 1.314822 . . . . . . . . . . . . . . . . . . 0.12110 3.61234 52 0.74685 1.311373 . . . . . . . . . . . . . . . . . . 0.20622 2.92242 53 0.74907 1.308024 . . . . . . . . . . . . . . . . . . 0.27247 2.56040 54 0.75123 1.304785 . . . . . . . . . . . . . . . . . . 0.32470 2.33367 55 0.75334 1.301646 . . . . . . . . . . . . . . . . . . 0.36698 2.17658 56 0.75539 1.298587 . . . . . . . . . . . . . . . . . . 0.40205 2.06038 57 0.75739 1.295628 . . . . . . . . . . . . . . . . . . 0.43173 1.97040 58 0.75934 1.292739 . . . . . . . . . . . . . . . . . . 0.45726 1.89831 59 0.76125 1.28993
10 . . . . . . . . . . . . . . . . . . 0.47954 1.83904 60 0.76311 1.2872011 . . . . . . . . . . . . . . . . . . 0.49920 1.78928 61 0.76492 1.2845412 . . . . . . . . . . . . . . . . . . 0.51671 1.74680 62 0.76669 1.2819513 . . . . . . . . . . . . . . . . . . 0.53246 1.71003 63 0.76843 1.2794314 . . . . . . . . . . . . . . . . . . 0.54671 1.67783 64 0.77012 1.2769815 . . . . . . . . . . . . . . . . . . 0.55969 1.64935 65 0.77178 1.2745816 . . . . . . . . . . . . . . . . . . 0.57159 1.62394 66 0.77340 1.2722517 . . . . . . . . . . . . . . . . . . 0.58254 1.60110 67 0.77499 1.2699618 . . . . . . . . . . . . . . . . . . 0.59266 1.58043 68 0.77654 1.2677419 . . . . . . . . . . . . . . . . . . 0.60207 1.56162 69 0.77806 1.2655620 . . . . . . . . . . . . . . . . . . 0.61083 1.54442 70 0.77955 1.2634421 . . . . . . . . . . . . . . . . . . 0.61902 1.52861 71 0.78101 1.2613622 . . . . . . . . . . . . . . . . . . 0.62669 1.51401 72 0.78244 1.2593323 . . . . . . . . . . . . . . . . . . 0.63391 1.50049 73 0.78384 1.2573524 . . . . . . . . . . . . . . . . . . 0.64072 1.48792 74 0.78522 1.2554125 . . . . . . . . . . . . . . . . . . 0.64715 1.47620 75 0.78656 1.2535126 . . . . . . . . . . . . . . . . . . 0.65323 1.46523 76 0.78789 1.2516527 . . . . . . . . . . . . . . . . . . 0.65901 1.45495 77 0.78918 1.2498328 . . . . . . . . . . . . . . . . . . 0.66449 1.44528 78 0.79046 1.2480529 . . . . . . . . . . . . . . . . . . 0.66972 1.43617 79 0.79171 1.2463030 . . . . . . . . . . . . . . . . . . 0.67470 1.42756 80 0.79294 1.2445931 . . . . . . . . . . . . . . . . . . 0.67945 1.41942 81 0.79414 1.2429132 . . . . . . . . . . . . . . . . . . 0.68400 1.41170 82 0.79533 1.2412633 . . . . . . . . . . . . . . . . . . 0.68835 1.40437 83 0.79649 1.2396534 . . . . . . . . . . . . . . . . . . 0.69253 1.39740 84 0.79764 1.2380735 . . . . . . . . . . . . . . . . . . 0.69654 1.39076 85 0.79876 1.2365236 . . . . . . . . . . . . . . . . . . 0.70039 1.38442 86 0.79987 1.2349937 . . . . . . . . . . . . . . . . . . 0.70409 1.37837 87 0.80096 1.2335038 . . . . . . . . . . . . . . . . . . 0.70766 1.37258 88 0.80203 1.2320339 . . . . . . . . . . . . . . . . . . 0.71110 1.36703 89 0.80308 1.2305940 . . . . . . . . . . . . . . . . . . 0.71441 1.36172 90 0.80412 1.2291741 . . . . . . . . . . . . . . . . . . 0.71762 1.35661 91 0.80514 1.2277842 . . . . . . . . . . . . . . . . . . 0.72071 1.35171 92 0.80614 1.2264143 . . . . . . . . . . . . . . . . . . 0.72370 1.34699 93 0.80713 1.2250744 . . . . . . . . . . . . . . . . . . 0.72660 1.34245 94 0.80810 1.2237545 . . . . . . . . . . . . . . . . . . 0.72941 1.33808 95 0.80906 1.2224546 . . . . . . . . . . . . . . . . . . 0.73213 1.33386 96 0.81000 1.2211747 . . . . . . . . . . . . . . . . . . 0.73476 1.32979 97 0.81093 1.2199248 . . . . . . . . . . . . . . . . . . 0.73732 1.32585 98 0.81185 1.2186849 . . . . . . . . . . . . . . . . . . 0.73981 1.32205 99 0.81275 1.2174650 . . . . . . . . . . . . . . . . . . 0.74222 1.31838
20 National Vital Statistics Reports, Vol. 55, No. 6, February 21, 2007
Contents
Abstract. . . . . . . . . . . . . . . . . . . . . . . . . . . . . . . . . . . . . . . 1Introduction . . . . . . . . . . . . . . . . . . . . . . . . . . . . . . . . . . . . 1Methods . . . . . . . . . . . . . . . . . . . . . . . . . . . . . . . . . . . . . . 2Results . . . . . . . . . . . . . . . . . . . . . . . . . . . . . . . . . . . . . . . 2
Trends in fetal and perinatal mortality . . . . . . . . . . . . . . . . . 2Race and Hispanic origin. . . . . . . . . . . . . . . . . . . . . . . . . . 3Maternal age . . . . . . . . . . . . . . . . . . . . . . . . . . . . . . . . . . 4Marital status. . . . . . . . . . . . . . . . . . . . . . . . . . . . . . . . . . 5Sex of fetus . . . . . . . . . . . . . . . . . . . . . . . . . . . . . . . . . . 5Plurality . . . . . . . . . . . . . . . . . . . . . . . . . . . . . . . . . . . . . 5Period of gestation . . . . . . . . . . . . . . . . . . . . . . . . . . . . . . 6Birthweight . . . . . . . . . . . . . . . . . . . . . . . . . . . . . . . . . . . 7Fetal and perinatal mortality rates by state . . . . . . . . . . . . . . 7
Discussion . . . . . . . . . . . . . . . . . . . . . . . . . . . . . . . . . . . . . 7References. . . . . . . . . . . . . . . . . . . . . . . . . . . . . . . . . . . . . 8List of Detailed Tables . . . . . . . . . . . . . . . . . . . . . . . . . . . . . 9Technical Notes. . . . . . . . . . . . . . . . . . . . . . . . . . . . . . . . . 13
Copyright information
All material appearing in this report is in the public domain and may be reproduced or copied without permission; citation as to source, however, is appreciated.
Suggested citation
MacDorman MF, Hoyert DL, Martin JA, Munson ML, Hamilton BE. Fetal and Perinatal Mortality, United States, 2003. National vital statistics reports; vol 55 no 6. Hyattsville, MD: National Center for Health Statistics. 2007.
National Center for Health Statistics
DirectorEdward J. Sondik, Ph.D.
Acting Co-Deputy DirectorsJennifer H. Madans, Ph.D.
Michael H. Sadagursky
Division of Vital Statistics
Director, Charles J. Rothwell
U.S. DEPARTMENT OF HEALTH & HUMAN SERVICES
Centers for Disease Control and Prevention National Center for Health Statistics 3311 Toledo Road Hyattsville, MD 20782
FIRST CLASS MAILPOSTAGE & FEES PAID
CDC/NCHSPERMIT NO. G-284
OFFICIAL BUSINESS PENALTY FOR PRIVATE USE, $300
To receive this publication regularly, contact the National Center for Health Statistics by calling 1-866-441-NCHS (6247) E-mail: [email protected] Internet: www.cdc.gov/nchs
07-0024 (2/2007) CS108564 T27403 DHHS Publication No. (PHS) 2007–1120