Embed Size (px)
Citation preview
Fermentation study of metabolically
engineered Escherichia coli strains for high-level
1-propanol production
by
Xuejia Liu
A thesis
presented to the University of Waterloo
in fulfillment of the
thesis requirement for the degree of
Master of Applied Science
in
Chemical Engineering
Waterloo, Ontario, Canada, 2015
© Xuejia Liu 2015

ii
Author’s declaration
I hereby declare that I am the sole author of this thesis. This is a true copy of the thesis, including
any required final revisions, as accepted by my examiners.
I understand that my thesis may be made electronically available to the public.
iii
Abstract
As the current global energy requirements are mainly met through the combustion of
petroleum, coal, and natural gas, concerns over the global warming and the sustainability of the
future exploitation of fossil fuels are growing. 1-propanol of which carbon chain is longer than the
ethanol could be a better biofuel for blending with gasoline. Previously in our lab, a novel
alternative 1-propanol biosynthesis pathway was constructed by introducing the sleeping beauty
mutase (Sbm) operon into the native E.coli. During the anaerobic cultivation of a metabolically
engineered E.coli strain in a shake flask, approximately 150 mg/L of 1-propanol was produced
using glucose as the main carbon source. In this study, we demonstrated high-level production of
both 1-propanol and ethanol by fermenting our novel metabolically engineered E. coli strains
anaerobically with glycerol/glucose as the main carbon source. In a batch fermentation of a wild
type E. coli stain harboring a low copy number plasmid with an active Sbm operon, low
concentration of 1-propanol was detected in the culture media. By knocking out the gene involved
in the major carbon flux competing pathway (ldhA), the titer of 1-propanol was increased by four-
fold. Due to glucose’s limited NADH-generating capacity, glycerol, which is a more reduced
compound, was used as the main carbon source, and the 1-propanol titer reached 2.15 g/L and 4.12
g/L from 30 g/L and 87 g/L of glycerol, respectively. Further enhancement in the 1-propanol
production was achieved by constructing a plasmid-free propanogenic E. coli strain that had a
faster glycerol dissimilation rate and higher 1-propanol yield. In summary, 7.52 g/L and 35.66 g/L
of 1-propanol and ethanol, respectively, was produced from 116 g/L of glycerol in a fed-batch
cultivation of the plasmid-free propanogenic E. coli strain.
iv
Acknowledgements
I want to thank Dr. Chou, my handsome supervisor, for giving me the opportunity to work
in his lab at the first place, otherwise I might be sitting in my parents’ apartment in Beijing and
enjoying my life there without too much pressure. I also want to thank Dr. Murray Moo-Young
for his continuous spiritual encouragement.
I want to thank my committee members Dr. Anderson and Dr. Gu for spending your valuable
time reading my thesis and participating my thesis defense. I also appreciate all the help I received
from the staff of the Chemical Engineering Department.
To all my lab mates, I just want to thank you guys, all of you, for your company in the lab
for the past two years and nine months (That is really long!), it won’t be easier without you guys
generous help.
Finally, I really really really want to and need to thank my parents. Without your support
and understanding, I won’t be able to get this far and achieve that much. Although you two always
complain that I don’t care about you, but I really love you, forever.
The last of last, I want to thank my girlfriend for your patience and love, for your
understanding and tolerance, for not leaving and forsaking.
v
Table of Contents
Author’s declaration........................................................................................................................ ii
Abstract .......................................................................................................................................... iii
Acknowledgements ........................................................................................................................ iv
Table of Contents ............................................................................................................................ v
List of Figures ............................................................................................................................... vii
List of Tables ............................................................................................................................... viii
Chapter 1 Overview ........................................................................................................................ 1
1.1 Research backgrounds ...................................................................................................... 1
1.2 Research objectives .......................................................................................................... 6
1.3 Outline of thesis ................................................................................................................ 7
Chapter 2 Literature Review ........................................................................................................... 8
2.1 Biomanufacturing of biofuels ........................................................................................... 8
2.2 Microorganisms for bioethanol production .................................................................... 13
2.3 Metabolic engineering toward 1-propanol production ................................................... 17
2.4 The sleeping beauty mutase pathway ............................................................................. 22
Chapter 3 Materials and Methods ................................................................................................. 24
3.1 Bacterial strains, plasmids, and primers ......................................................................... 24
3.2 Media and cultivation conditions ................................................................................... 28
3.3 HPLC analysis ................................................................................................................ 29
3.4 Calculations .................................................................................................................... 30
Chapter 4 Results .......................................................................................................................... 32
vi
4.1 Characterization of 1-propanol production under anaerobic conditions using glucose as
the main carbon source ......................................................................................................... 32
4.2 Characterization of 1-propanol production under anaerobic conditions using glycerol as
the main carbon source ......................................................................................................... 38
4.3 Fed-batch cultivation for 1-propanol production using glycerol as the main carbon
source .................................................................................................................................... 42
4.4 Fed-batch cultivation of plasmid-free propanogenic Escherichia coli strain for 1-
propanol production ............................................................................................................. 46
Chapter 5 Discussion .................................................................................................................... 52
Chapter 6 Conclusions and Recommendations ............................................................................. 58
References ..................................................................................................................................... 61
Appendix A ................................................................................................................................... 75
vii
List of Figures
Figure 1: The U.S. annual energy flow chart, 2014 ........................................................................ 2
Figure 2: Chemical structure of 1-propanol .................................................................................... 3
Figure 3: Transesterification of triglyceride with alcohol ............................................................ 12
Figure 4: Ethanol production pathways in microorganisms ......................................................... 16
Figure 5: Cyclical E. coli sleeping beauty mutase pathway ......................................................... 23
Figure 6: Time profiles of glucose, biomass, and major metabolites during batch cultivation of A.
CPC-CNTRL1 and B. CPC-PrOH1 with glucose as the major carbon source ............. 36
Figure 7: Time profiles of glucose, biomass, and major metabolites during batch cultivation of A.
CPC-CNTRL2 and B. CPC-PrOH2 with glucose as the major carbon source ............. 37
Figure 8: Time profiles of glycerol, biomass, and major metabolites during batch cultivation of
A. CPC-CNTRL2 and B. CPC-PrOH2 with glycerol as the main carbon source ........ 41
Figure 9: Time profile of glycerol, biomass, and major metabolites during fed-batch cultivation
of CPC-PrOH2 with glycerol as the major carbon source ............................................ 45
Figure 10: Time profile of glycerol, biomass, and major metabolites during fed-batch cultivation
of CPC-PrOH3 with glycerol as the major carbon source ............................................ 51
viii
List of Tables
Table 1: U.S. Renewable Energy Consumption in 2014 ................................................................ 3
Table 2: 2014 global ethanol production by country ...................................................................... 9
Table 3: Assessment of selected pretreatment processes .............................................................. 11
Table 4: Fermentation performance of industrial xylose-fermenting S. cerevisiae strains in
lignocellulose hydrolysates .......................................................................................... 14
Table 5: Fuels energy density and average octane number .......................................................... 18
Table 6: Fermentation performance of metabolically engineered microorganisms ..................... 21
Table 7: E. coli strains, plasmids, and primers used in this study ................................................ 26
Table 8: Pathway equations and the theoretical yield of intermediates and final metabolites ..... 30
Table 9: Theoretical yield of final metabolites from glucose and glycerol .................................. 31
Table 10: Fermentation profiles of the strain CPC-PrOH1, CPC-CNTRL1, CPC-PrOH2, and
CPC- CNTRL2 cultured on glucose as the main carbon source .................................. 35
Table 11: Fermentation profiles of the strain CPC-PrOH2 and CPC-CNTRL2 cultured on
glycerol as the main carbon source .............................................................................. 40
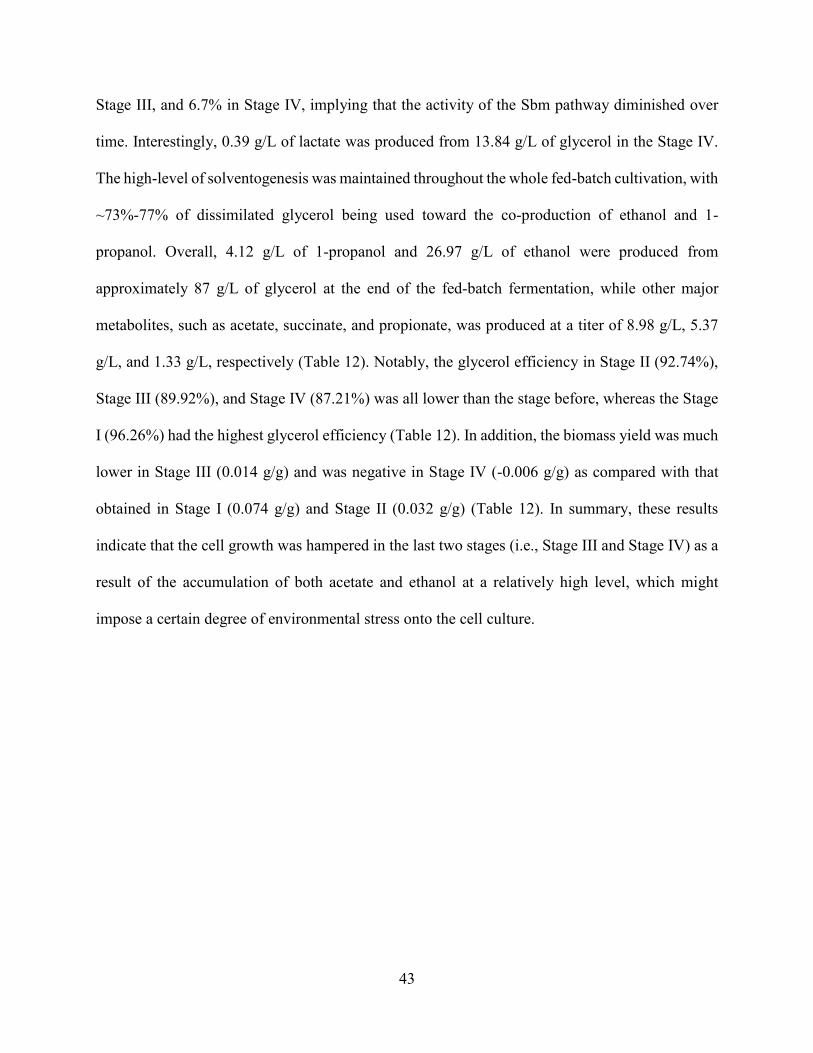
Table 12: Fed-batch fermentation profiles of the strain CPC-PrOH2 cultured on glycerol as the
main carbon source ....................................................................................................... 44
Table 13: Fed-batch fermentation profiles of the strain CPC-PrOH3 cultured on glycerol as the
main carbon source ....................................................................................................... 49
1
Chapter 1 Overview
1.1 Research backgrounds
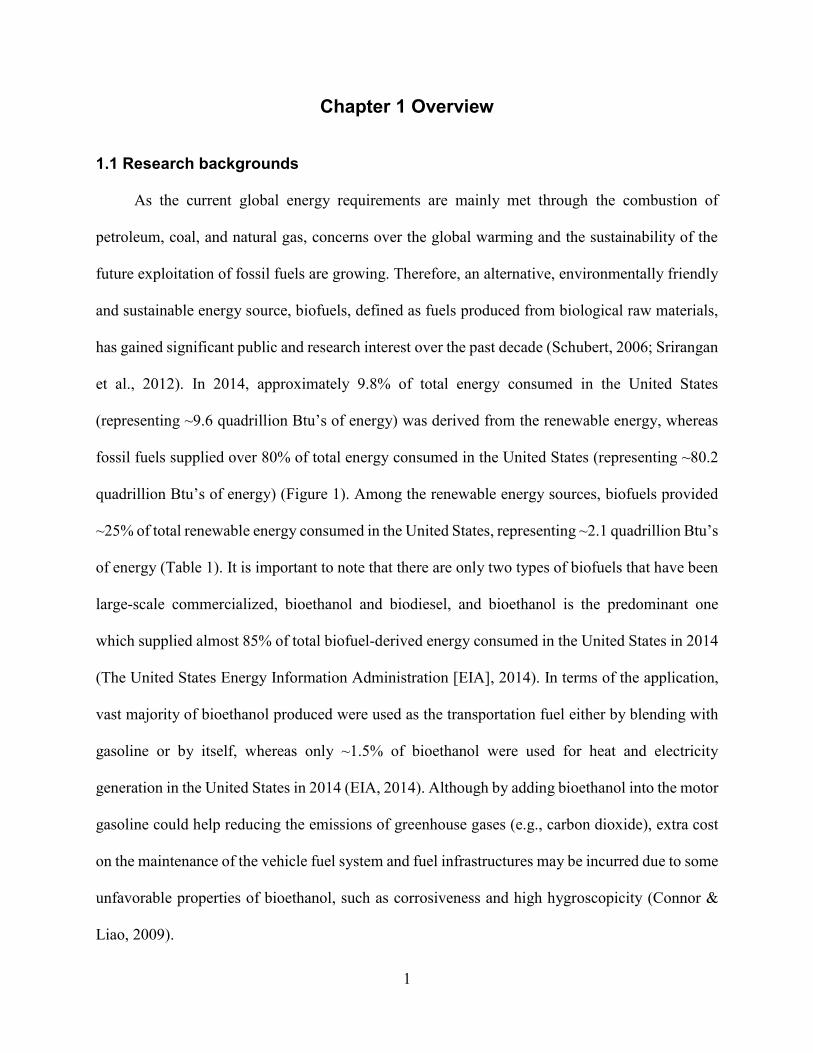
As the current global energy requirements are mainly met through the combustion of
petroleum, coal, and natural gas, concerns over the global warming and the sustainability of the
future exploitation of fossil fuels are growing. Therefore, an alternative, environmentally friendly
and sustainable energy source, biofuels, defined as fuels produced from biological raw materials,
has gained significant public and research interest over the past decade (Schubert, 2006; Srirangan
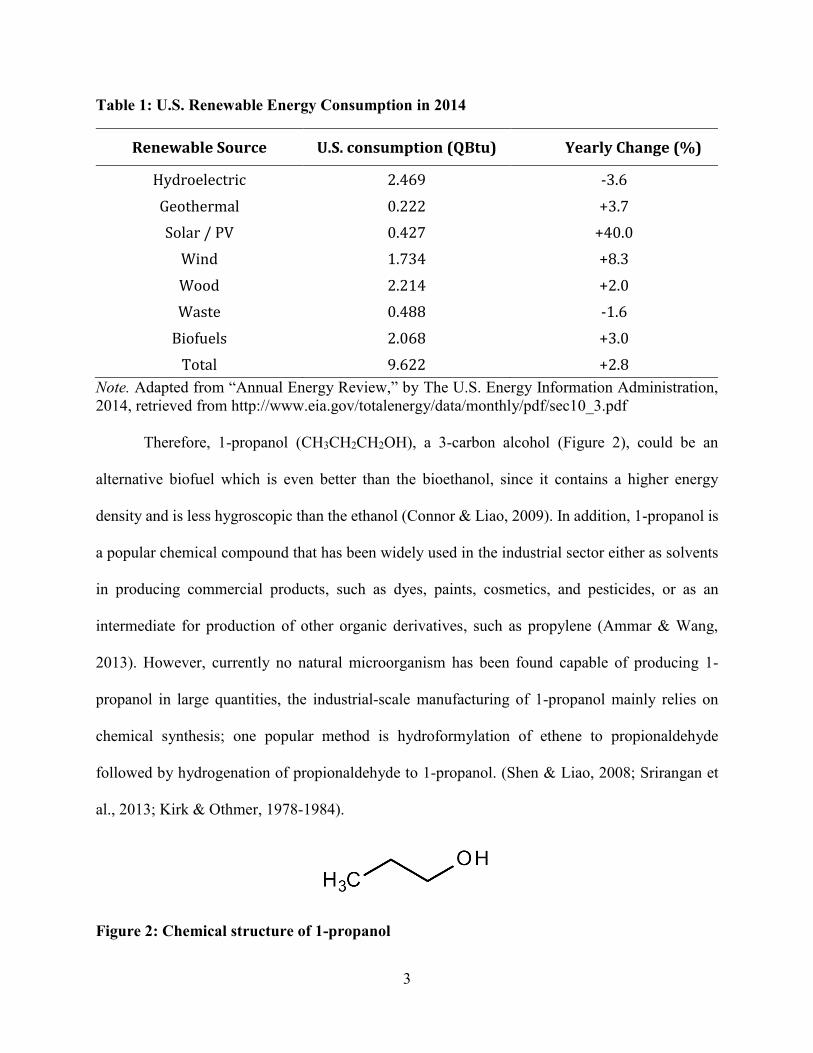
et al., 2012). In 2014, approximately 9.8% of total energy consumed in the United States
(representing ~9.6 quadrillion Btu’s of energy) was derived from the renewable energy, whereas
fossil fuels supplied over 80% of total energy consumed in the United States (representing ~80.2
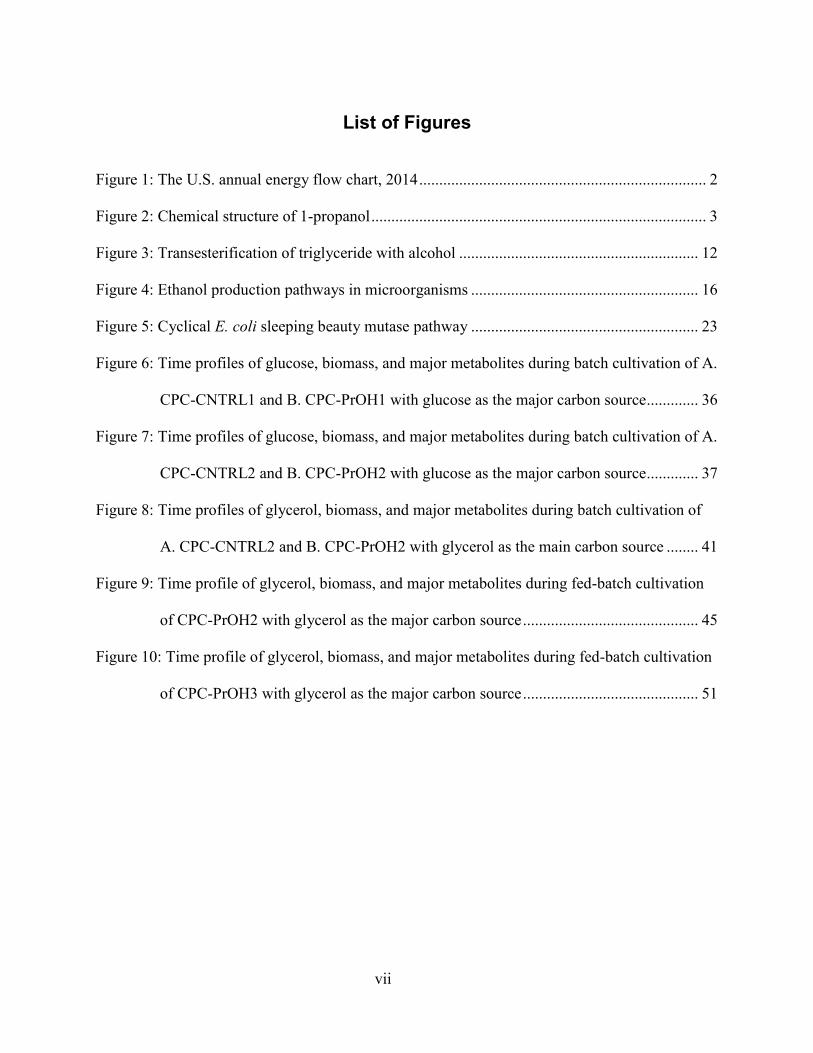
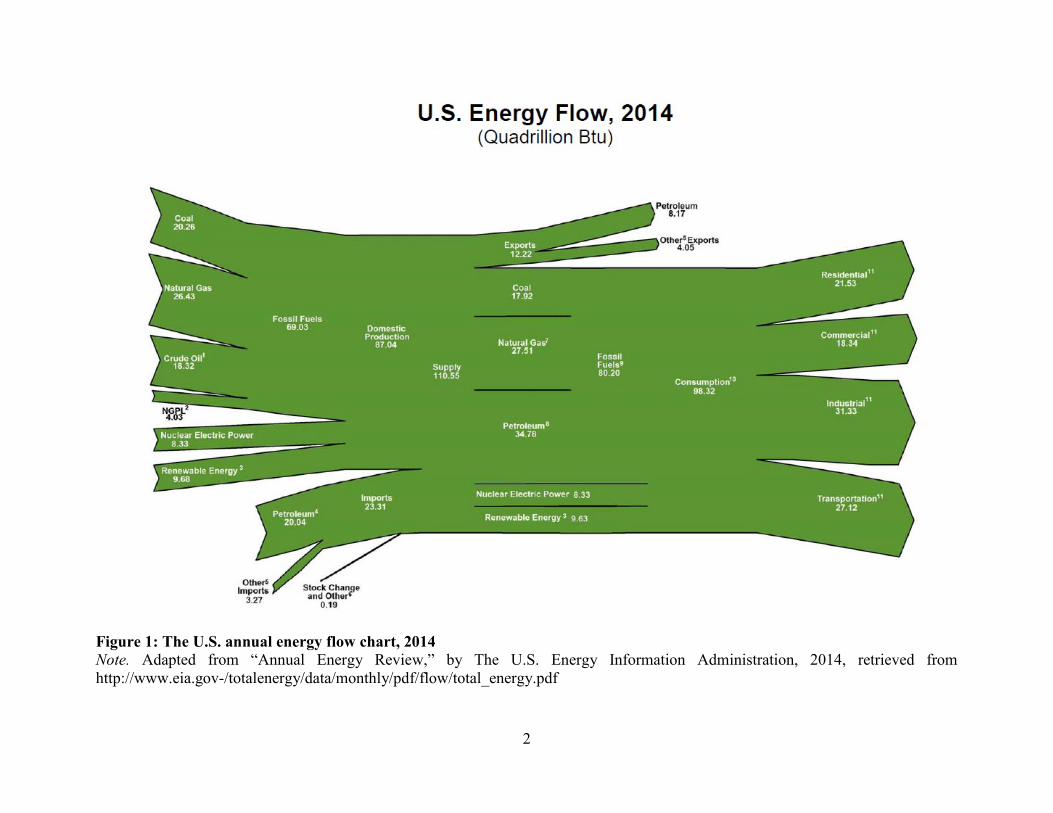
quadrillion Btu’s of energy) (Figure 1). Among the renewable energy sources, biofuels provided
~25% of total renewable energy consumed in the United States, representing ~2.1 quadrillion Btu’s
of energy (Table 1). It is important to note that there are only two types of biofuels that have been
large-scale commercialized, bioethanol and biodiesel, and bioethanol is the predominant one
which supplied almost 85% of total biofuel-derived energy consumed in the United States in 2014
(The United States Energy Information Administration [EIA], 2014). In terms of the application,
vast majority of bioethanol produced were used as the transportation fuel either by blending with
gasoline or by itself, whereas only ~1.5% of bioethanol were used for heat and electricity
generation in the United States in 2014 (EIA, 2014). Although by adding bioethanol into the motor
gasoline could help reducing the emissions of greenhouse gases (e.g., carbon dioxide), extra cost
on the maintenance of the vehicle fuel system and fuel infrastructures may be incurred due to some
unfavorable properties of bioethanol, such as corrosiveness and high hygroscopicity (Connor &
Liao, 2009).
2
Figure 1: The U.S. annual energy flow chart, 2014
Note. Adapted from “Annual Energy Review,” by The U.S. Energy Information Administration, 2014, retrieved from
http://www.eia.gov-/totalenergy/data/monthly/pdf/flow/total_energy.pdf
3
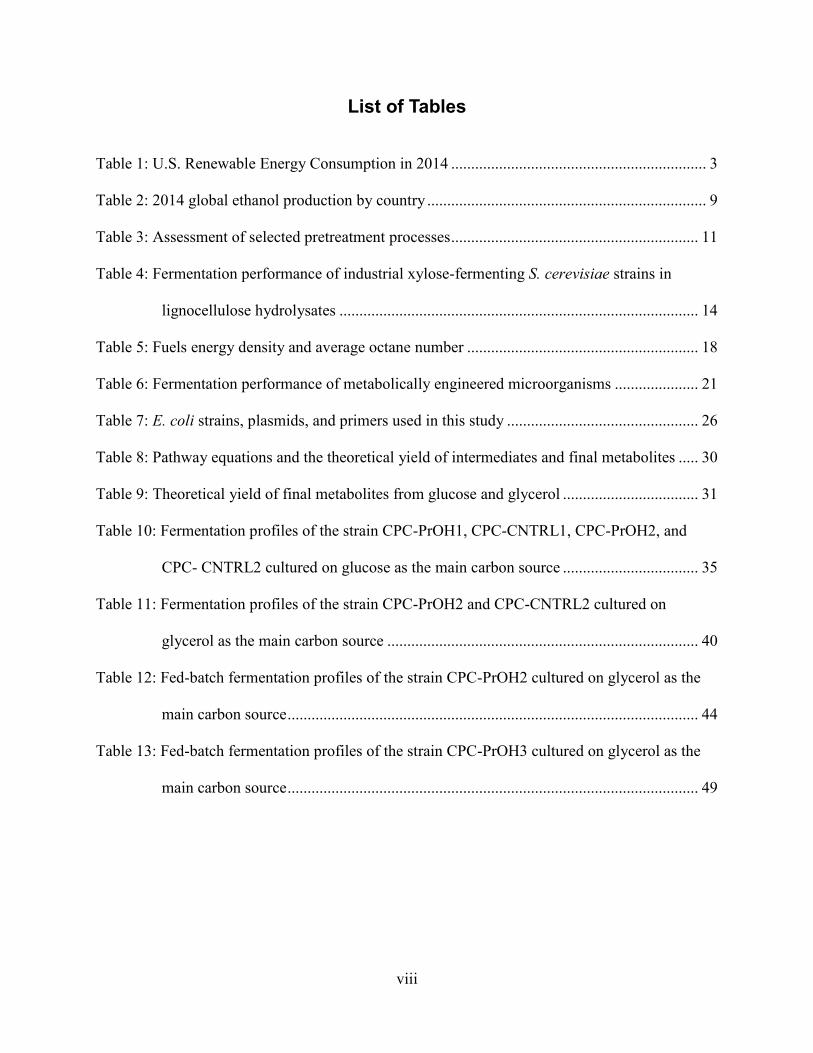
Table 1: U.S. Renewable Energy Consumption in 2014
Note. Adapted from “Annual Energy Review,” by The U.S. Energy Information Administration,
2014, retrieved from http://www.eia.gov/totalenergy/data/monthly/pdf/sec10_3.pdf
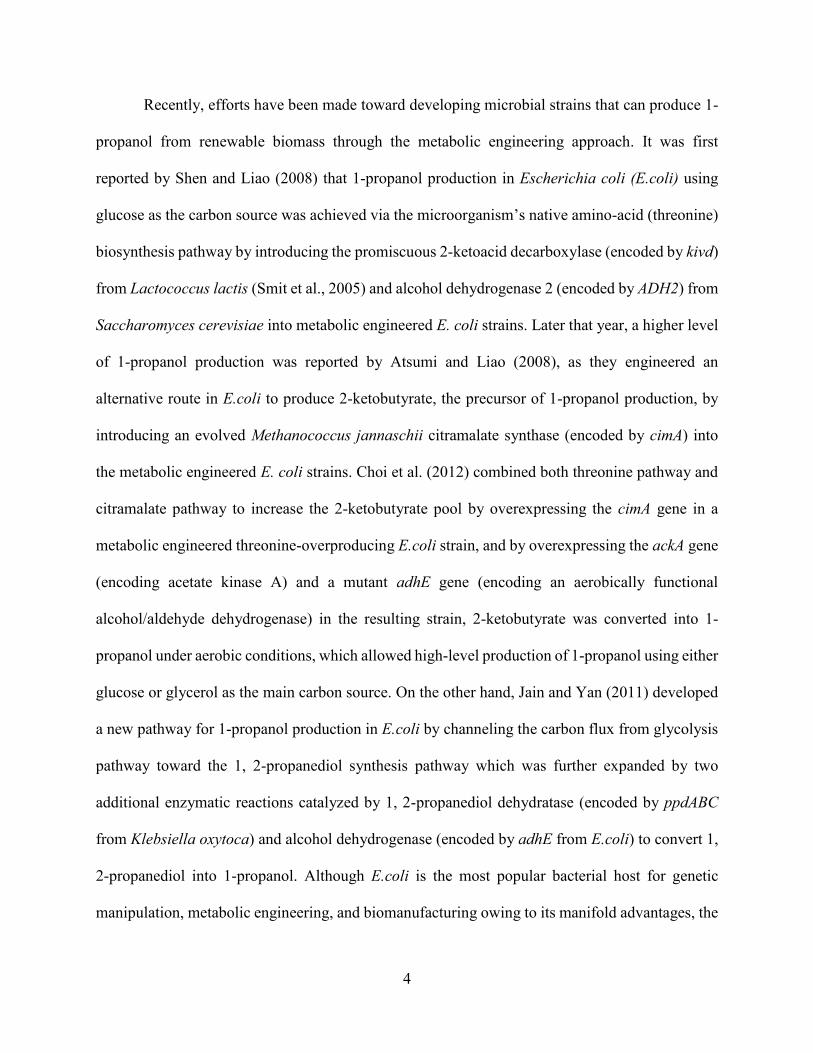
Therefore, 1-propanol (CH3CH2CH2OH), a 3-carbon alcohol (Figure 2), could be an
alternative biofuel which is even better than the bioethanol, since it contains a higher energy
density and is less hygroscopic than the ethanol (Connor & Liao, 2009). In addition, 1-propanol is
a popular chemical compound that has been widely used in the industrial sector either as solvents
in producing commercial products, such as dyes, paints, cosmetics, and pesticides, or as an
intermediate for production of other organic derivatives, such as propylene (Ammar & Wang,
2013). However, currently no natural microorganism has been found capable of producing 1-
propanol in large quantities, the industrial-scale manufacturing of 1-propanol mainly relies on
chemical synthesis; one popular method is hydroformylation of ethene to propionaldehyde
followed by hydrogenation of propionaldehyde to 1-propanol. (Shen & Liao, 2008; Srirangan et
al., 2013; Kirk & Othmer, 1978-1984).
Figure 2: Chemical structure of 1-propanol
Renewable Source U.S. consumption (QBtu) Yearly Change (%)
Hydroelectric 2.469 -3.6
Geothermal 0.222 +3.7
Solar / PV 0.427 +40.0
Wind 1.734 +8.3
Wood 2.214 +2.0
Waste 0.488 -1.6
Biofuels 2.068 +3.0
Total 9.622 +2.8
4
Recently, efforts have been made toward developing microbial strains that can produce 1-
propanol from renewable biomass through the metabolic engineering approach. It was first
reported by Shen and Liao (2008) that 1-propanol production in Escherichia coli (E.coli) using
glucose as the carbon source was achieved via the microorganism’s native amino-acid (threonine)
biosynthesis pathway by introducing the promiscuous 2-ketoacid decarboxylase (encoded by kivd)
from Lactococcus lactis (Smit et al., 2005) and alcohol dehydrogenase 2 (encoded by ADH2) from
Saccharomyces cerevisiae into metabolic engineered E. coli strains. Later that year, a higher level
of 1-propanol production was reported by Atsumi and Liao (2008), as they engineered an
alternative route in E.coli to produce 2-ketobutyrate, the precursor of 1-propanol production, by
introducing an evolved Methanococcus jannaschii citramalate synthase (encoded by cimA) into
the metabolic engineered E. coli strains. Choi et al. (2012) combined both threonine pathway and
citramalate pathway to increase the 2-ketobutyrate pool by overexpressing the cimA gene in a
metabolic engineered threonine-overproducing E.coli strain, and by overexpressing the ackA gene
(encoding acetate kinase A) and a mutant adhE gene (encoding an aerobically functional
alcohol/aldehyde dehydrogenase) in the resulting strain, 2-ketobutyrate was converted into 1-
propanol under aerobic conditions, which allowed high-level production of 1-propanol using either
glucose or glycerol as the main carbon source. On the other hand, Jain and Yan (2011) developed
a new pathway for 1-propanol production in E.coli by channeling the carbon flux from glycolysis
pathway toward the 1, 2-propanediol synthesis pathway which was further expanded by two
additional enzymatic reactions catalyzed by 1, 2-propanediol dehydratase (encoded by ppdABC
from Klebsiella oxytoca) and alcohol dehydrogenase (encoded by adhE from E.coli) to convert 1,
2-propanediol into 1-propanol. Although E.coli is the most popular bacterial host for genetic
manipulation, metabolic engineering, and biomanufacturing owing to its manifold advantages, the
5
production of 1-propanol in other microorganisms, such as Propionibacterium ferudenreichii,
Thermobifida fusca, Shimwellia blattae, and Corynebacterium glutamicum, has also been
demonstrated (Ammar et al., 2013; Deng & Fong, 2011; Urano et al., 2015; Siebert & Wendisch,
2015).
Previously in our lab, a novel alternative 1-propanol biosynthesis pathway was constructed
by introducing the sleeping beauty mutase (Sbm) operon (sbm-ygfD-ygfG-ygfH, encoding Sbm:
methylmalonyl-CoA mutase, YgfD: Sbm-interacting protein kinase, YgfG: methylmalonyl-CoA
decarboxylase, and YgfH: propionyl-CoA/succinyl-CoA transferase, respectively) into E.coli
(Srirangan et al., 2013). During the anaerobic cultivation of a metabolically engineered E.coli
strain in a shake flask, approximately 150 mg/L of 1-propanol was produced using glucose as the
main carbon source, which demonstrated that the Sbm operon was functionally expressed in the
engineered E.coli strain (Srirangan et al., 2013). Although the Sbm operon has been identified in
the native E.coli genome and the function of the enzymes encoded by the Sbm operon have been
revealed (Sbm catalyzes the isomerization of succinyl-CoA to L-methylmalonyl-CoA; YgfG
catalyzes the decarboxylation of methylmalonyl-CoA to propionyl-CoA; YgfH transfers the
coenzyme A from propionyl-CoA to succinate; YgfD has GTPase activity), the metabolic context
of this pathway remains unclear, as the operon is thought to be silent or minimal expressed in vivo
due to an inactive or weak promoter (Haller et al., 2000; Froese et al., 2009; Srirangan et al., 2013).
6
1.2 Research objectives
The overall objectives of this thesis include:
1. Utilizing a bench-scale bioreactor to characterize the 1-propanol production in metabolic
engineered E.coli strains using glucose as the main carbon source under anaerobic
conditions, and identifying the constraints which limit the 1-propanol production during
the fermentations.
2. Using glycerol as the main carbon source for fermentation of metabolic engineered E.coli
strains under anaerobic conditions in order to enhance the level of solventogenesis and
boost the production of 1-propanol.
3. Performing the fed-batch cultivation of metabolic engineered E.coli strains using glycerol
as the main carbon source under anaerobic conditions to further characterize the strains’ 1-
propanol production capacity by utilizing the Sbm pathway.
7
1.3 Outline of thesis
Chapter 2 reviews (1) the overall biofuel market, especially the bioethanol and biodiesel
market, (2) microorganism that have been widely studied and used for laboratory or industrial
bioethanol production from a variety of carbon sources, (3) current metabolic and genetic
engineering strategies that have been applied to produce 1-propanol in a variety of
microorganisms, (4) the identification and characterization of the sleeping beauty mutase (Sbm)
pathway and also the E. coli genes that are involved in the Sbm pathway. Chapter 3 contains all
the materials (e.g., bacterial strains, plasmids, primers, chemical reagents, medium, and
instruments) and methods (e.g., bacterial strains construction, plasmids construction, cultivation,
fermentation, HPLC analysis, and calculations) that have been used in this study. Chapter 4
presents all the results obtained in this study, including: (1) characterization of 1-propanol
production under anaerobic conditions using glucose as the main carbon source, (2)
characterization of 1-propanol production under anaerobic conditions using glycerol as the main
carbon source, and (3) fed-batch cultivation for 1-propanol production using glycerol as the main
carbon source. In Chapter 5, the results presented in Chapter 4 are discussed in detail. Finally, the
conclusions of the study and the recommendations for future works are summarized in Chapter 6.
8
Chapter 2 Literature Review
2.1 Biomanufacturing of biofuels
Bioethanol, which is the ethanol (CH3CH2OH) produced from biological materials, received
broad interest from the public in the late 20th century when the over-use of fossil fuels caused
pollutions, along with a surge in crude oil price, though it has been produced by human since early
humanity history as a pivotal ingredient in alcoholic beverages. In the middle 20th century, ethanol
was manufactured in large-scale by hydration of ethylene, a petrochemical derived from petroleum
by steam cracking (Okafor, 2007). However, after the crude petroleum price shot up, fermentation
of biomass (e.g., sugar cane in Brazil or corn in the U.S.) became the dominant way to produce
ethanol, which was named as a clean and renewable energy source (Okafor, 2007). Interestingly,
ethanol was used as motor fuel in early 20th century but was soon replaced by the cheap petroleum-
derived gasoline when there was a boom in the petroleum industry (Mills & Ecklund, 1987). Thus,
the upsurge of ethanol production in the late 20th century was most likely due to the fluctuation of
the petroleum price, which was not completely controlled by the governments, especially those oil
importation countries, and therefore, world governments such as Brazil, the United States, and
some Europe countries initiated incentives for the bioethanol production and sales in order to make
the price of biofuel more competitive and at the mean time to conserve petroleum resources (Mills
& Ecklund, 1987; Okafor, 2007). Thereafter, the bioethanol industry grows in a fast pace and has
become a stable, sustainable, and momentous driving force behind the world economic prosperity.
In 2014, the global fuel ethanol production reached approximately 24,570 million gallons, the
highest level for the past decade, and the United States remained to be the largest ethanol fuel
production country with 14,300 million gallons, which accounted for approximately 58% of total
global output (Table 2). In the United States, the feedstock for bioethanol production is primarily
9
derived from corn, which is the most common grain crop grown in the Americas, and certain
species of the yeast (e.g., Saccharomyces cerevisiae) is used as the workhorse of the biomass
fermentation for bioethanol production, owing to its high ethanol productivity and high ethanol
tolerance. Since only sugars (e.g., glucose) could be directly consumed by the yeast, feedstock pre-
treatments (e.g., milling, liquefaction, and saccharification) are required to extract the starch from
corn and then break down the starch into fermentable sugars (Onuki et al., 2008). The second large
ethanol production country in the world is Brazil, whose production reached 6,190 million gallons
in 2014, accounting for a 25% of global ethanol production (Table 2). Since the country is the
worlds’ biggest sugarcane producer, the feedstock used for ethanol production in Brazil is mainly
derived from this domestically grown sucrose-rich crop. The ethanol production by the other
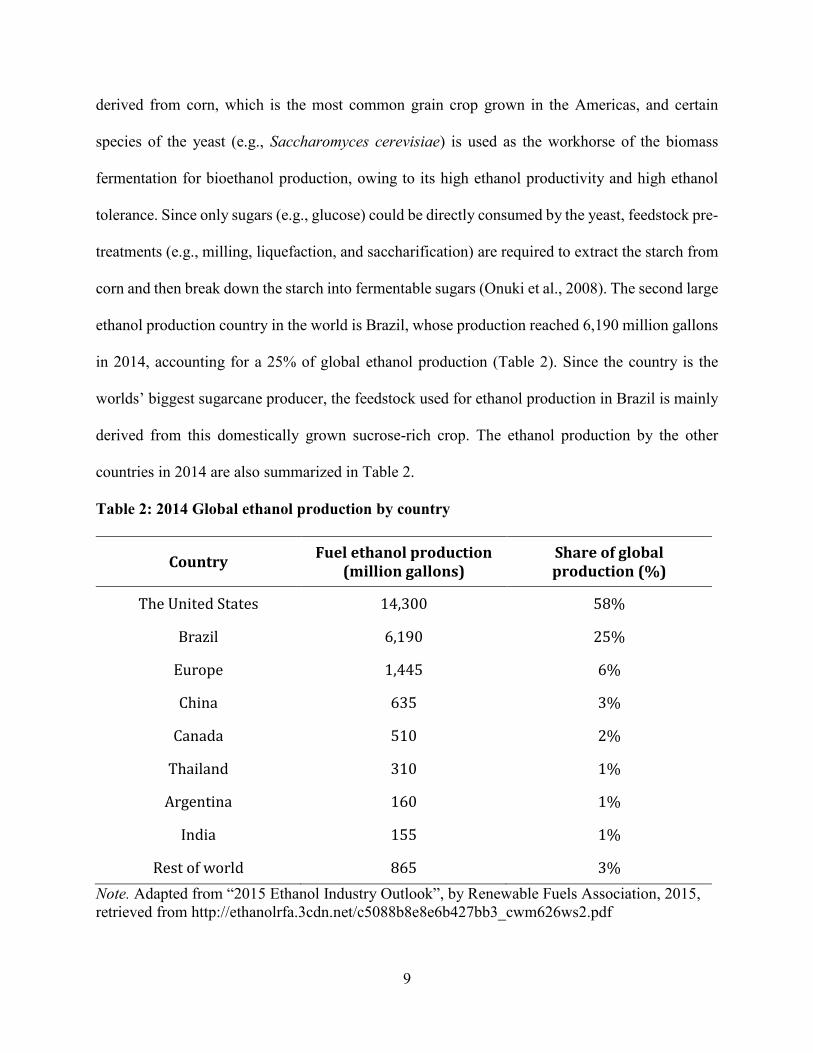
countries in 2014 are also summarized in Table 2.
Table 2: 2014 Global ethanol production by country
Country Fuel ethanol production
(million gallons) Share of global production (%)
The United States 14,300 58%
Brazil 6,190 25%
Europe 1,445 6%
China 635 3%
Canada 510 2%
Thailand 310 1%
Argentina 160 1%
India 155 1%
Rest of world 865 3%
Note. Adapted from “2015 Ethanol Industry Outlook”, by Renewable Fuels Association, 2015,
retrieved from http://ethanolrfa.3cdn.net/c5088b8e8e6b427bb3_cwm626ws2.pdf
10
Other than the corn and sugarcane, bioethanol could be produced from various crops,
including sugar beet, sugar sorghum, potato, sweet potato, cassava, and wheat (Power et al., 2008;
Billa et al., 1997; Quintero et al., 2008; Sree et al., 1999; Akihiko et al., 2009; Murphy & Power,
2008). These crops could be easily fermented by the yeast without too complicated pretreatments,
as they are rich in either starch or sucrose. Currently, most of bioethanol plants are using these
food-related sugar-based crops as the fermentation feedstock, which is often refereed as the first
generation of bioethanol production, and the selection of feedstock is primarily based on the
regional availability and economical efficiency (Baeyens et al., 2015; Onuki et al., 2008).
However, there is always controversy over using food-related crops to produce fuel ethanol, as
people are concerned that this will rise the food prices as a result of the direct competition between
fuel ethanol production and food production. Not only does farming food-related crops for
bioethanol production occupy the agricultural lands which are originally used for food production,
but also it requires large amount of water resources and fertilizer. Therefore, the second generation
of bioethanol production, which uses lignocellulosic raw materials (e.g., corn straw, sugarcane
bagasse, and switchgrass) as the feedstock, has received tremendous attention from the public, bio-
fuel company, and even government (Slade et al., 2009). Some advantages of the second
generation of bioethanol production are listed below: (1) lignocellulosic raw materials are not
food-related, (2) lignocellulosic raw materials are cheap and abundant, as they could be obtained
from unwanted agricultural waste, and (3) using lignocellulosic raw materials as the feedstock
could lead to more CO2 emission reduction than using food-related crops as the feedstock (Balat,
2011; Li et al., 2010). Nevertheless, there has been a difficulty in commercialization of the second
generation of bioethanol production in the past few decades. Although the main process of the
second generation of bioethanol production (converting sugars into bioethanol through microbial
11
fermentation) is similar to that of the first generation of bioethanol production, the pretreatment of
lignocellulosic materials is much more complicated and expensive (Balat, 2011). Lignocellulosic
materials are mainly composed of three basic biopolymers: cellulose, hemicellulose, and lignin,
whereas only cellulose and hemicellulose could be hydrolyzed into fermentable sugars, such as
glucose, xylose, and arabinose (Buruiana et al., 2013). Due to the rigid structure of lignocellulose,
cellulose and hemicellulose could not be directly hydrolyzed by the enzymes, and therefore,
lignocellulosic materials must undergo a thorough delignification process in the first place to
release the cellulose and hemicellulose from the lignin-carbohydrate complexes (LCC) for
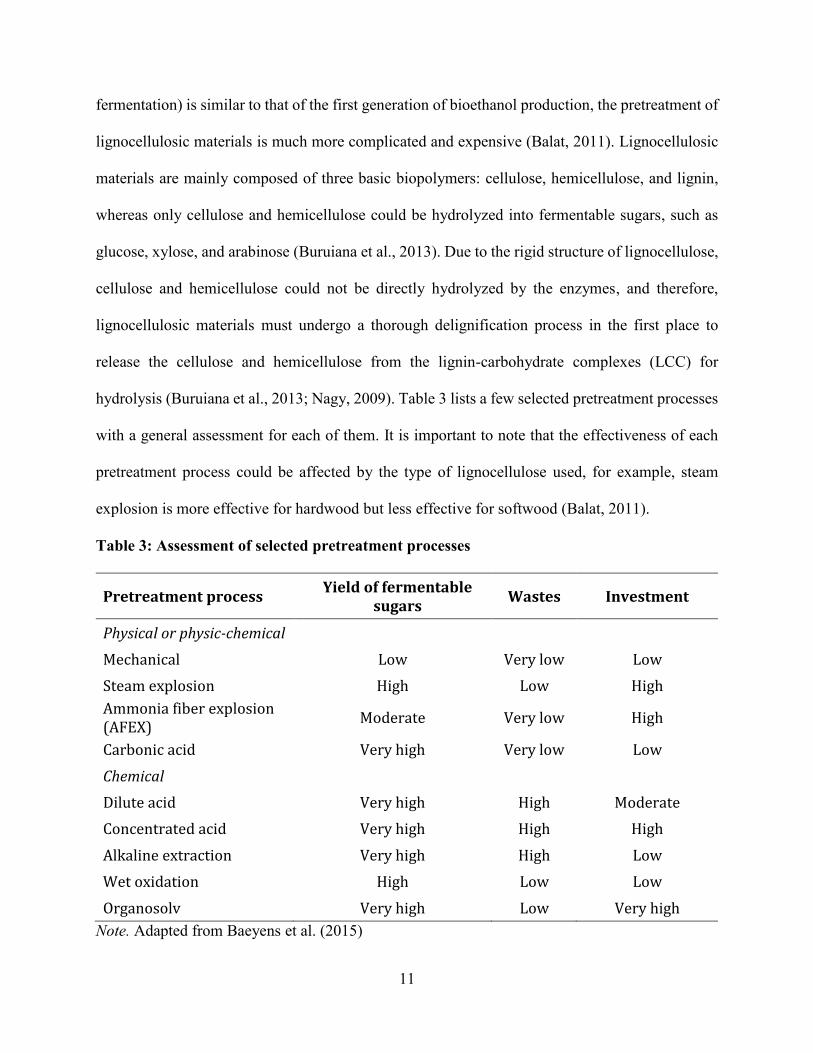
hydrolysis (Buruiana et al., 2013; Nagy, 2009). Table 3 lists a few selected pretreatment processes
with a general assessment for each of them. It is important to note that the effectiveness of each
pretreatment process could be affected by the type of lignocellulose used, for example, steam
explosion is more effective for hardwood but less effective for softwood (Balat, 2011).
Table 3: Assessment of selected pretreatment processes
Pretreatment process Yield of fermentable
sugars Wastes Investment
Physical or physic-chemical
Mechanical Low Very low Low
Steam explosion High Low High
Ammonia fiber explosion (AFEX)
Moderate Very low High
Carbonic acid Very high Very low Low
Chemical
Dilute acid Very high High Moderate
Concentrated acid Very high High High
Alkaline extraction Very high High Low
Wet oxidation High Low Low
Organosolv Very high Low Very high
Note. Adapted from Baeyens et al. (2015)
12
While bioethanol is dominating the biofuel market, biodiesel, which is also known as the
fatty acid methyl esters (FAME), has its own niche in the market. In the United States, 1.63 billion
gallons of biodiesel was produced in 2014, and an annual increase of 0.07 billion gallons, 0.1
billion gallons, and 0.1 billion gallons in biodiesel production is expected for years 2015, 2016,
and 2017, respectively (The United States Environmental Protection Agency [EPA], 2015). Unlike
the bioethanol production which relies on microbial fermentation, biodiesel is mainly produced by
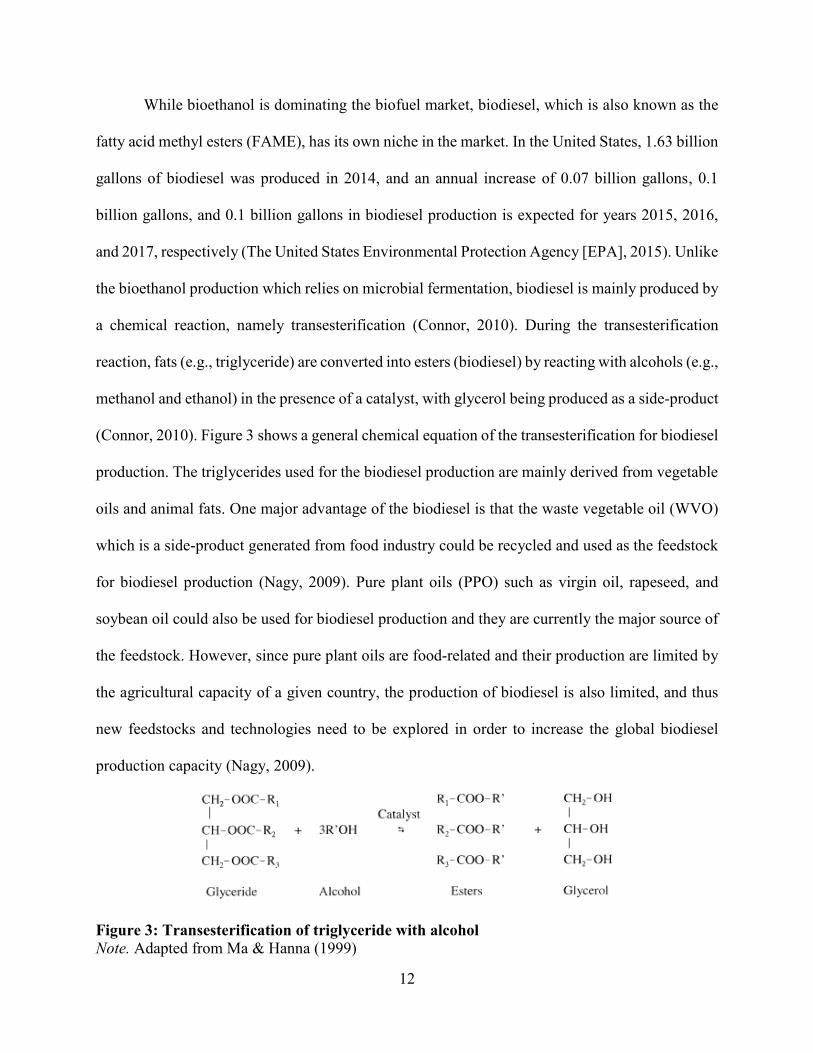
a chemical reaction, namely transesterification (Connor, 2010). During the transesterification
reaction, fats (e.g., triglyceride) are converted into esters (biodiesel) by reacting with alcohols (e.g.,
methanol and ethanol) in the presence of a catalyst, with glycerol being produced as a side-product
(Connor, 2010). Figure 3 shows a general chemical equation of the transesterification for biodiesel
production. The triglycerides used for the biodiesel production are mainly derived from vegetable
oils and animal fats. One major advantage of the biodiesel is that the waste vegetable oil (WVO)
which is a side-product generated from food industry could be recycled and used as the feedstock
for biodiesel production (Nagy, 2009). Pure plant oils (PPO) such as virgin oil, rapeseed, and
soybean oil could also be used for biodiesel production and they are currently the major source of
the feedstock. However, since pure plant oils are food-related and their production are limited by
the agricultural capacity of a given country, the production of biodiesel is also limited, and thus
new feedstocks and technologies need to be explored in order to increase the global biodiesel
production capacity (Nagy, 2009).
Figure 3: Transesterification of triglyceride with alcohol
Note. Adapted from Ma & Hanna (1999)
13
2.2 Microorganisms for bioethanol production
There is a long history of the ethanol production through fermentation process in human
history, and the brewer’s yeast, Saccharomyces cerevisiae, is the most popular workhorse for the
industrial ethanol production (Okafor, 2007). In order to reduce the overall cost of ethanol
production, the microorganism selected for ethanol production should possess the following
characteristics: (1) high ethanol yield (greater than 90% of theoretical yield), (2) high ethanol
tolerance (more than 40 g/L of ethanol), (3) high ethanol productivity (greater than 1 g L-1 h-1), (4)
robust growth rate and low growth requirements, (5) resistance to hydrolysate inhibitors, and (6)
broad pH and temperature range for cultivation (Dien et al., 2003). Although the current ethanol
industry relies heavily on the first generation of ethanol production, a large portion of research
efforts in the past few decades have been put on fermenting lignocellulosic materials, the feedstock
for second generation of ethanol production. Since the native S. cerevisiae is not capable of
utilizing pentose sugars (mostly xylose), which is the second most abundant sugars contained in
the hydrolysate of lignocellulosic materials, metabolic and genetic engineering strategies are
employed to enable the assimilation of pentose sugars in native S. cerevisiae (Tantirungkij et al.,
1994; Jin, 2002; Wahlbom et al., 2003; Kim, 2007; Cann, 2010; Du, 2011; Hector et al., 2011;
Kuhad et al., 2011). However, most of the pentose fermentation study are based on laboratory S.
cerevisiae strains, which are not suitable for the industrial-scale ethanol production due to a lack
of robustness and hydrolysates tolerance compared to the industrial S. cerevisiae strains
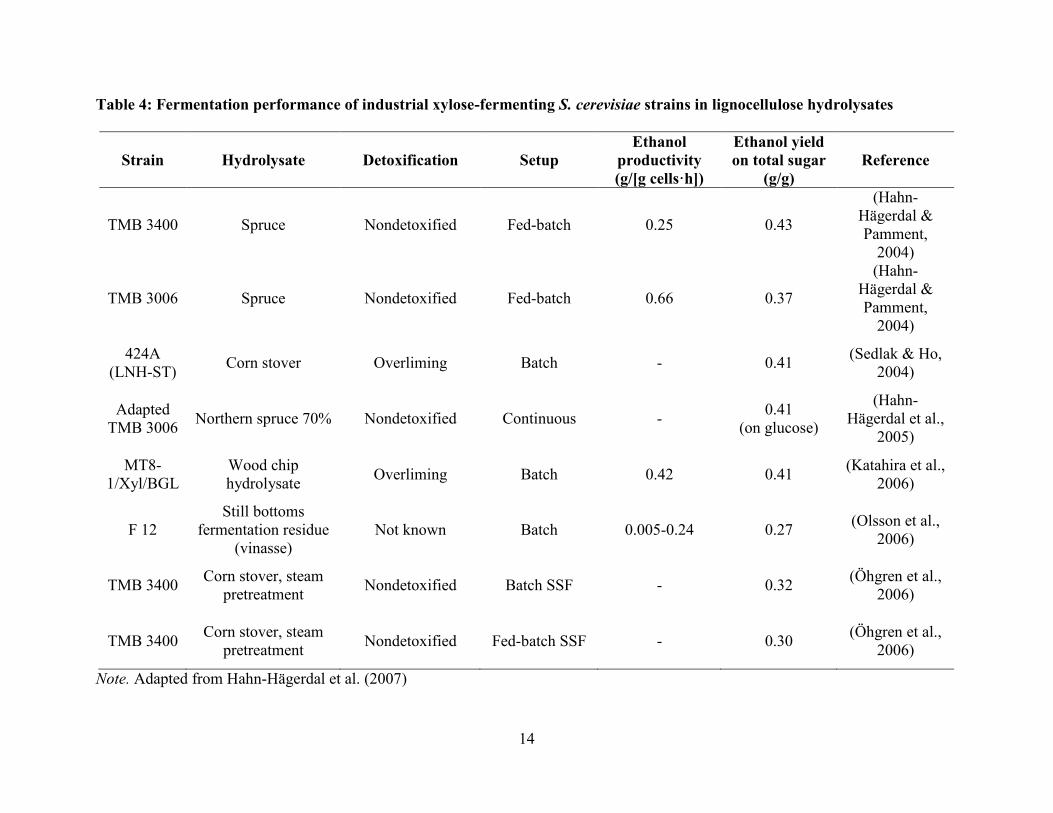
(Sonderegger et al., 2004; Hahn-Hägerdal et al., 2007). Table 4 summarizes the fermentation
performance of selected industrial xylose-fermenting S. cerevisiae strains in lignocellulose
hydrolysates.
14
Table 4: Fermentation performance of industrial xylose-fermenting S. cerevisiae strains in lignocellulose hydrolysates
Strain Hydrolysate Detoxification Setup
Ethanol
productivity
(g/[g cells·h])
Ethanol yield
on total sugar
(g/g)
Reference
TMB 3400 Spruce Nondetoxified Fed-batch 0.25 0.43
(Hahn-
Hägerdal &
Pamment,
2004)
TMB 3006 Spruce Nondetoxified Fed-batch 0.66 0.37
(Hahn-
Hägerdal &
Pamment,
2004)
424A
(LNH-ST) Corn stover Overliming Batch - 0.41
(Sedlak & Ho,
2004)
Adapted
TMB 3006 Northern spruce 70% Nondetoxified Continuous -
0.41
(on glucose)
(Hahn-
Hägerdal et al.,
2005)
MT8-
1/Xyl/BGL
Wood chip
hydrolysate Overliming Batch 0.42 0.41
(Katahira et al.,
2006)
F 12
Still bottoms
fermentation residue
(vinasse)
Not known Batch 0.005-0.24 0.27 (Olsson et al.,
2006)
TMB 3400 Corn stover, steam
pretreatment Nondetoxified Batch SSF - 0.32
(Öhgren et al.,
2006)
TMB 3400 Corn stover, steam
pretreatment Nondetoxified Fed-batch SSF - 0.30
(Öhgren et al.,
2006)
Note. Adapted from Hahn-Hägerdal et al. (2007)
15
On the other hand, efforts have been put on identifying native xylose-fermenting yeasts that
are capable of producing ethanol as the major end-product, such as Pachysolen tannophilus,
Candida shehatae, Pichia stipites, and Spathaspora passalidarum (Jeffries & Kurtzman, 2004;
Kuhad et al., 2011; Harner et al., 2015). However, these yeasts normally have a poor fermentation
performance (i.e., low ethanol yield) when growing on industrial substrates (e.g., pretreated
biomass hydrolysate of lignocellulosic materials) as a result of the competition between xylose
and hexoses sugars (e.g., glucose and mannose) utilization and low tolerance to pH, ethanol, and
hydrolysate inhibitors (Hahn-Hägerdal et al., 2007).
Except for yeasts, microorganisms such as Escherichia coli, Zymomonas mobilis, and
Filamentous fungi have also been extensively studied for their xylose-fermenting capacity,
whereas E. coli is the most promising one (Kuhad et al., 2011; Kim, 2007). Although the native Z.
mobilis is superior in several aspects, including homo-ethanol production, high ethanol yield and
specific productivity, and high ethanol tolerance, it can only ferment a limited types of sugars
(glucose, fructose, and fructose) which makes it undesirable for usage in industrial applications
(Rogers et al., 2007). On the other hand, E. coli has a wide substrate-utilization range, as it is able
to ferment both pentose sugars (xylose and arabinose) and hexose sugars (glucose, mannose,
galactose, and fructose) (Zaldivar et al., 2001). In addition, owing to its numerous advantageous
characteristics such as rapid growth under both aerobic and anaerobic conditions, simple and
inexpensive cultivation requirements, well-established genetic manipulation tools and
technologies, and clear genetic, proteomic, and metabolic information, E. coli has become one of
the most popular microorganism in the biomanufacturing industry (Chang et al., 1999; Cirino et
al., 2006; Yu et al., 2011). However, one shortage for E. coli is that ethanol is not the main
fermentation product in the native E. coli, so that it is not as effective as other native ethanol
16
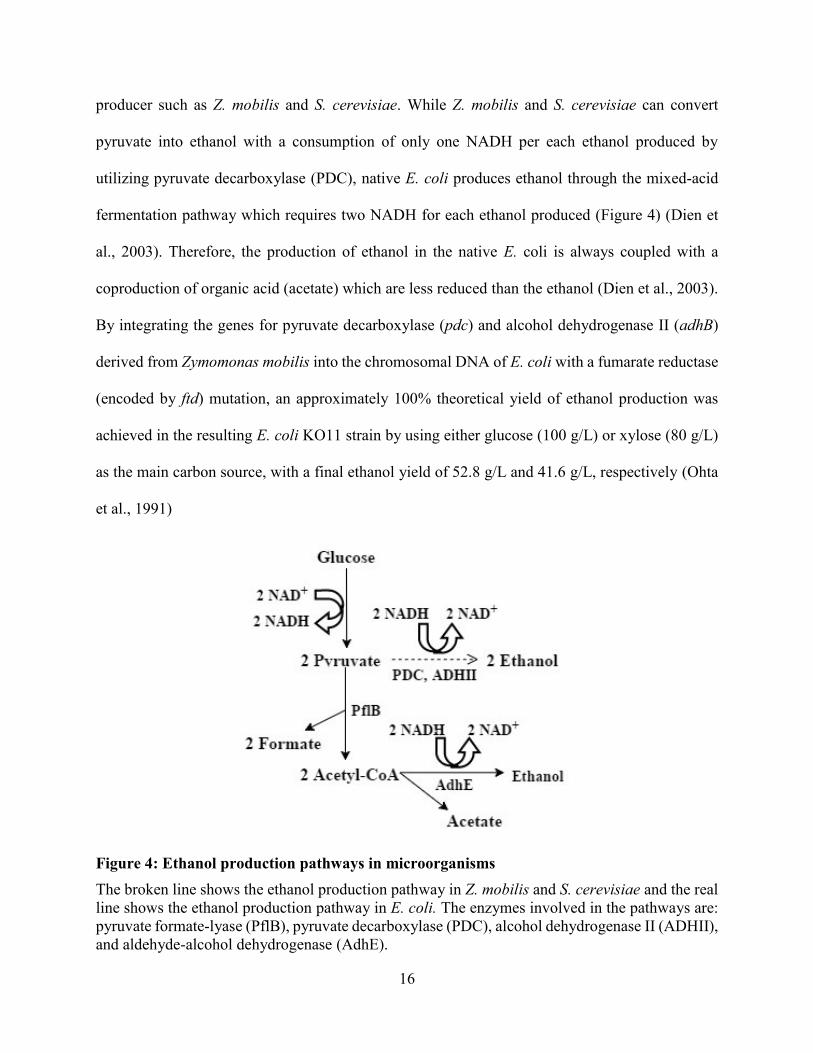
producer such as Z. mobilis and S. cerevisiae. While Z. mobilis and S. cerevisiae can convert
pyruvate into ethanol with a consumption of only one NADH per each ethanol produced by
utilizing pyruvate decarboxylase (PDC), native E. coli produces ethanol through the mixed-acid
fermentation pathway which requires two NADH for each ethanol produced (Figure 4) (Dien et
al., 2003). Therefore, the production of ethanol in the native E. coli is always coupled with a
coproduction of organic acid (acetate) which are less reduced than the ethanol (Dien et al., 2003).
By integrating the genes for pyruvate decarboxylase (pdc) and alcohol dehydrogenase II (adhB)
derived from Zymomonas mobilis into the chromosomal DNA of E. coli with a fumarate reductase
(encoded by ftd) mutation, an approximately 100% theoretical yield of ethanol production was
achieved in the resulting E. coli KO11 strain by using either glucose (100 g/L) or xylose (80 g/L)
as the main carbon source, with a final ethanol yield of 52.8 g/L and 41.6 g/L, respectively (Ohta
et al., 1991)
Figure 4: Ethanol production pathways in microorganisms
The broken line shows the ethanol production pathway in Z. mobilis and S. cerevisiae and the real
line shows the ethanol production pathway in E. coli. The enzymes involved in the pathways are:
pyruvate formate-lyase (PflB), pyruvate decarboxylase (PDC), alcohol dehydrogenase II (ADHII),
and aldehyde-alcohol dehydrogenase (AdhE).
17
2.3 Metabolic engineering toward 1-propanol production
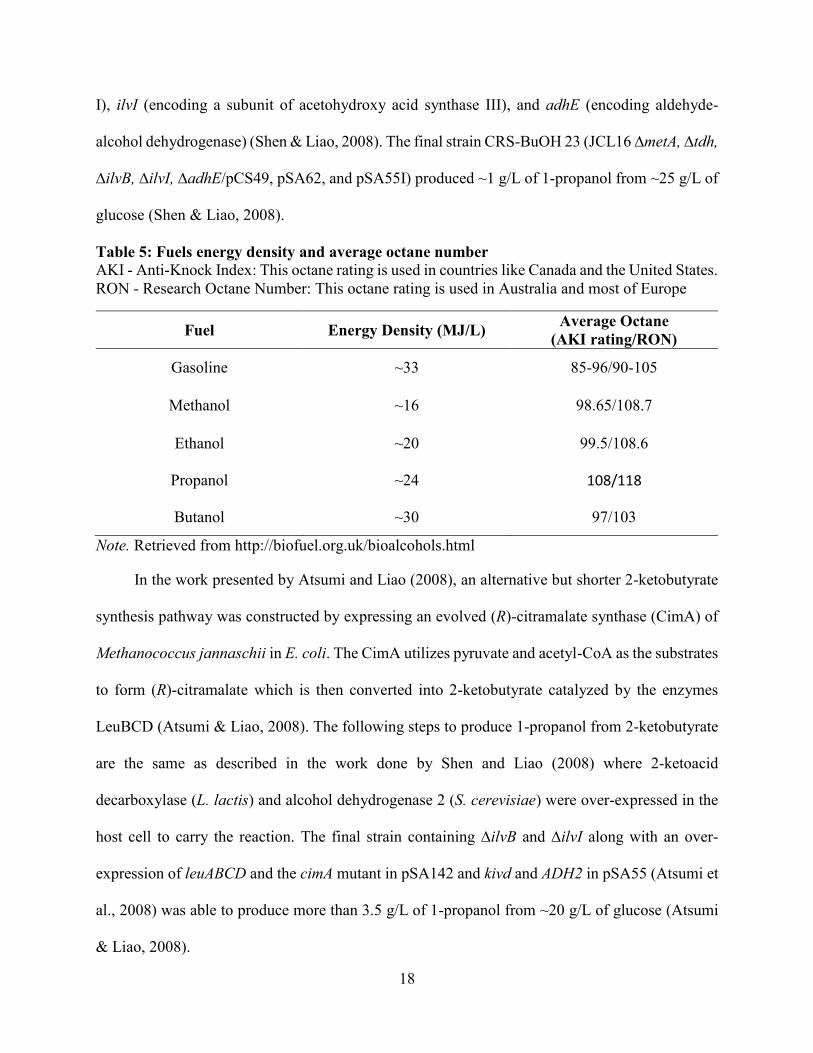
In spite of the advancements and achievements in high-level ethanol production, higher
chain alcohol (e.g., 1-propanol, butanol, and isobutanol) remains to be a superior gasoline additive
or substitute in terms of the energy density and octane number in contrast to ethanol (Table 5).
Among the higher chain alcohols, 1-propanol received limited amount of attention from
researchers as no known microorganisms were found capable of producing large quantities of 1-
propanol in nature (Shen & Liao, 2008). Eden et al. (2001) detected ~60 mg/L of 1-propanol during
the fermentation of yeast and Janssen (2004) reported a production of ~0.46 mg/L of 1-propanol
in threonine fermentation of Clostridium sp.. Although low level of 1-propanol production has
been found in yeast and Clostridium sp., the 1-propanol biosynthesis pathway in both
microorganisms have not been very well characterized and no further effort has been made to
improve the 1-propanol yield. On the other hand, Shen and Liao (2008) constructed a non-native
1-propanol-producing E. coli strain by introducing the promiscuous 2-ketoacid decarboxylase
(encoded by kivd) from Lactococcus lactis (Smit et al., 2005) and alcohol dehydrogenase 2
(encoded by ADH2) from Saccharomyces cerevisiae into a threonine hyper-producing E. coli
strain. Firstly, the gene ilvA (encoding threonine deaminase), thrAfbr (encoding a feedback-
resistant mutant of aspartate kinase/homoserine dehydrogenase), and thrBC (encoding homoserine
kinase and threonine synthase) were over-expressed from pSA62 (Atsumi et al., 2008) and pCS49
to direct the metabolic flux towards 2-ketobutyrate, the precursor for 1-propanol production, then
by over-expression of kivd and ADH2 from pSA55I, 2-ketobutyrate was converted into 1-propanol
(Shen & Liao, 2008). To enhance the production level of 1-propanol, several competing pathways
were removed by deleting the gene metA (encoding homoserine O-succinyltransferase), tdh
(encoding threonine dehydrogenase), ilvB (encoding a large subunit of acetohydroxy acid synthase
18
I), ilvI (encoding a subunit of acetohydroxy acid synthase III), and adhE (encoding aldehyde-
alcohol dehydrogenase) (Shen & Liao, 2008). The final strain CRS-BuOH 23 (JCL16 ∆metA, ∆tdh,
∆ilvB, ∆ilvI, ∆adhE/pCS49, pSA62, and pSA55I) produced ~1 g/L of 1-propanol from ~25 g/L of
glucose (Shen & Liao, 2008).
Table 5: Fuels energy density and average octane number
AKI - Anti-Knock Index: This octane rating is used in countries like Canada and the United States.
RON - Research Octane Number: This octane rating is used in Australia and most of Europe
Fuel Energy Density (MJ/L) Average Octane
(AKI rating/RON)
Gasoline ~33 85-96/90-105
Methanol ~16 98.65/108.7
Ethanol ~20 99.5/108.6
Propanol ~24 108/118
Butanol ~30 97/103
Note. Retrieved from http://biofuel.org.uk/bioalcohols.html
In the work presented by Atsumi and Liao (2008), an alternative but shorter 2-ketobutyrate
synthesis pathway was constructed by expressing an evolved (R)-citramalate synthase (CimA) of
Methanococcus jannaschii in E. coli. The CimA utilizes pyruvate and acetyl-CoA as the substrates
to form (R)-citramalate which is then converted into 2-ketobutyrate catalyzed by the enzymes
LeuBCD (Atsumi & Liao, 2008). The following steps to produce 1-propanol from 2-ketobutyrate
are the same as described in the work done by Shen and Liao (2008) where 2-ketoacid
decarboxylase (L. lactis) and alcohol dehydrogenase 2 (S. cerevisiae) were over-expressed in the
host cell to carry the reaction. The final strain containing ∆ilvB and ∆ilvI along with an over-
expression of leuABCD and the cimA mutant in pSA142 and kivd and ADH2 in pSA55 (Atsumi et
al., 2008) was able to produce more than 3.5 g/L of 1-propanol from ~20 g/L of glucose (Atsumi
& Liao, 2008).
19
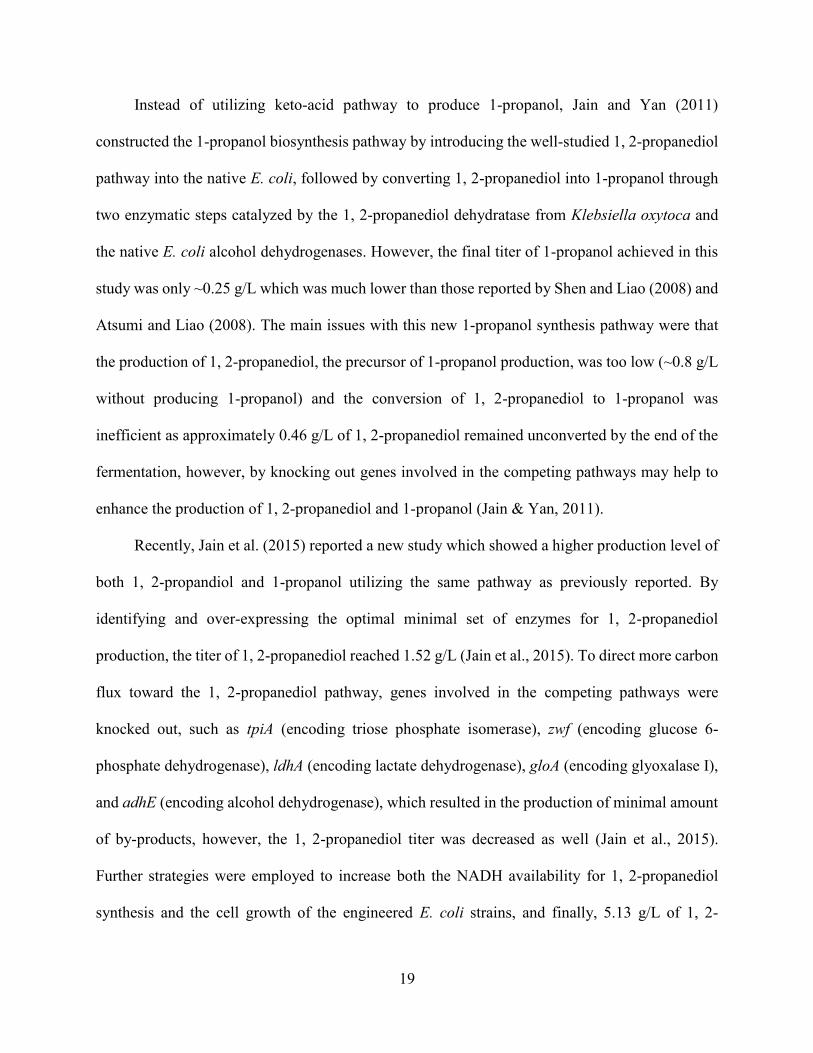
Instead of utilizing keto-acid pathway to produce 1-propanol, Jain and Yan (2011)
constructed the 1-propanol biosynthesis pathway by introducing the well-studied 1, 2-propanediol
pathway into the native E. coli, followed by converting 1, 2-propanediol into 1-propanol through
two enzymatic steps catalyzed by the 1, 2-propanediol dehydratase from Klebsiella oxytoca and
the native E. coli alcohol dehydrogenases. However, the final titer of 1-propanol achieved in this
study was only ~0.25 g/L which was much lower than those reported by Shen and Liao (2008) and
Atsumi and Liao (2008). The main issues with this new 1-propanol synthesis pathway were that
the production of 1, 2-propanediol, the precursor of 1-propanol production, was too low (~0.8 g/L
without producing 1-propanol) and the conversion of 1, 2-propanediol to 1-propanol was
inefficient as approximately 0.46 g/L of 1, 2-propanediol remained unconverted by the end of the
fermentation, however, by knocking out genes involved in the competing pathways may help to
enhance the production of 1, 2-propanediol and 1-propanol (Jain & Yan, 2011).
Recently, Jain et al. (2015) reported a new study which showed a higher production level of
both 1, 2-propandiol and 1-propanol utilizing the same pathway as previously reported. By
identifying and over-expressing the optimal minimal set of enzymes for 1, 2-propanediol
production, the titer of 1, 2-propanediol reached 1.52 g/L (Jain et al., 2015). To direct more carbon
flux toward the 1, 2-propanediol pathway, genes involved in the competing pathways were
knocked out, such as tpiA (encoding triose phosphate isomerase), zwf (encoding glucose 6-
phosphate dehydrogenase), ldhA (encoding lactate dehydrogenase), gloA (encoding glyoxalase I),
and adhE (encoding alcohol dehydrogenase), which resulted in the production of minimal amount
of by-products, however, the 1, 2-propanediol titer was decreased as well (Jain et al., 2015).
Further strategies were employed to increase both the NADH availability for 1, 2-propanediol
synthesis and the cell growth of the engineered E. coli strains, and finally, 5.13 g/L of 1, 2-
20
propanediol was produced with a yield of 0.48 g/g glucose (Jain et al., 2015). On the basis of this
1, 2-propanediol hyper-producing E. coli strain, a production of 2.91 g/L of 1-propanol was
achieved by expressing a superior fusion diol dehydratase in the resulting strain and employing a
dual strain strategy during the fermentation process (Jain et al., 2015).
Except for E. coli, microorganisms like Propionibacterium ferudenreichii, Thermobifida
fusca, Shimwellia blattae, and Corynebacterium glutamicum have also been metabolically or
genetically engineered for 1-propanol production (Ammar et al., 2013; Deng & Fong, 2011; Urano
et al., 2015; Siebert & Wendisch, 2015). Table 6 summarizes the fermentation performance of
several successful metabolically engineered propanogenic microorganisms.
21
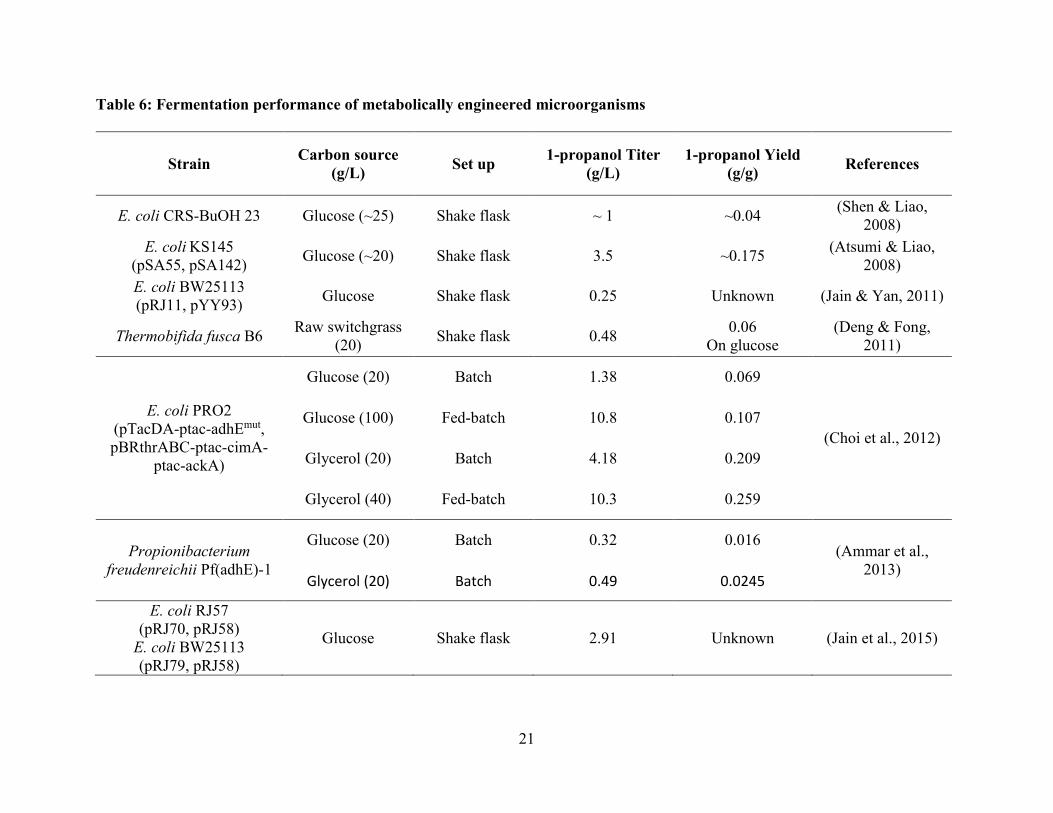
Table 6: Fermentation performance of metabolically engineered microorganisms
Strain Carbon source
(g/L) Set up
1-propanol Titer
(g/L)
1-propanol Yield
(g/g) References
E. coli CRS-BuOH 23 Glucose (~25) Shake flask ~ 1 ~0.04 (Shen & Liao,
2008)
E. coli KS145
(pSA55, pSA142) Glucose (~20) Shake flask 3.5 ~0.175
(Atsumi & Liao,
2008)
E. coli BW25113
(pRJ11, pYY93) Glucose Shake flask 0.25 Unknown (Jain & Yan, 2011)
Thermobifida fusca B6 Raw switchgrass
(20) Shake flask 0.48
0.06
On glucose
(Deng & Fong,
2011)
E. coli PRO2
(pTacDA-ptac-adhEmut,
pBRthrABC-ptac-cimA-
ptac-ackA)
Glucose (20) Batch 1.38 0.069
(Choi et al., 2012)
Glucose (100) Fed-batch 10.8 0.107
Glycerol (20) Batch 4.18 0.209
Glycerol (40) Fed-batch 10.3 0.259
Propionibacterium
freudenreichii Pf(adhE)-1
Glucose (20) Batch 0.32 0.016 (Ammar et al.,
2013) Glycerol (20) Batch 0.49 0.0245
E. coli RJ57
(pRJ70, pRJ58)
E. coli BW25113
(pRJ79, pRJ58)
Glucose Shake flask 2.91 Unknown (Jain et al., 2015)
22
2.4 The sleeping beauty mutase pathway
The sleeping beauty mutase pathway (Sbm), which is known as the methylmalonyl-CoA
mutase (MCM) pathway, plays an important role in the fermentation of native propionate-
producing microoraganisms, such as Propionibacteriaceae shermanii and Streptomyces
cinnamonensis, as the redox balance in those microorganisms are maintained by producing
propionic acid through the MCM pathway (McKie et al., 1990; Banerjee, 1997). Although the
native E. coli strain is not capable of producing either propionate or 1-propanol, the E. coli genes
encoding enzymes that have similar functions as those involved in the MCM pathway have been
identified and the enzyme encoded by those genes have been characterized (Haller et al., 2000). In
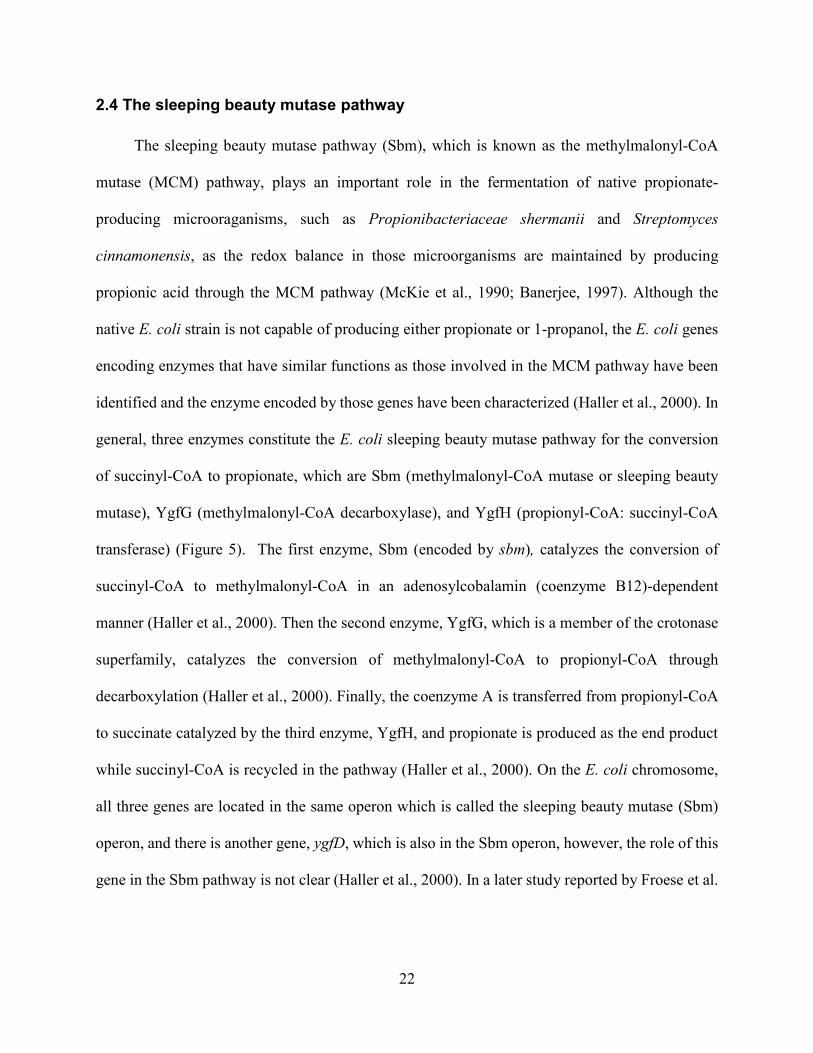
general, three enzymes constitute the E. coli sleeping beauty mutase pathway for the conversion
of succinyl-CoA to propionate, which are Sbm (methylmalonyl-CoA mutase or sleeping beauty
mutase), YgfG (methylmalonyl-CoA decarboxylase), and YgfH (propionyl-CoA: succinyl-CoA
transferase) (Figure 5). The first enzyme, Sbm (encoded by sbm), catalyzes the conversion of
succinyl-CoA to methylmalonyl-CoA in an adenosylcobalamin (coenzyme B12)-dependent
manner (Haller et al., 2000). Then the second enzyme, YgfG, which is a member of the crotonase
superfamily, catalyzes the conversion of methylmalonyl-CoA to propionyl-CoA through
decarboxylation (Haller et al., 2000). Finally, the coenzyme A is transferred from propionyl-CoA
to succinate catalyzed by the third enzyme, YgfH, and propionate is produced as the end product
while succinyl-CoA is recycled in the pathway (Haller et al., 2000). On the E. coli chromosome,
all three genes are located in the same operon which is called the sleeping beauty mutase (Sbm)
operon, and there is another gene, ygfD, which is also in the Sbm operon, however, the role of this
gene in the Sbm pathway is not clear (Haller et al., 2000). In a later study reported by Froese et al.
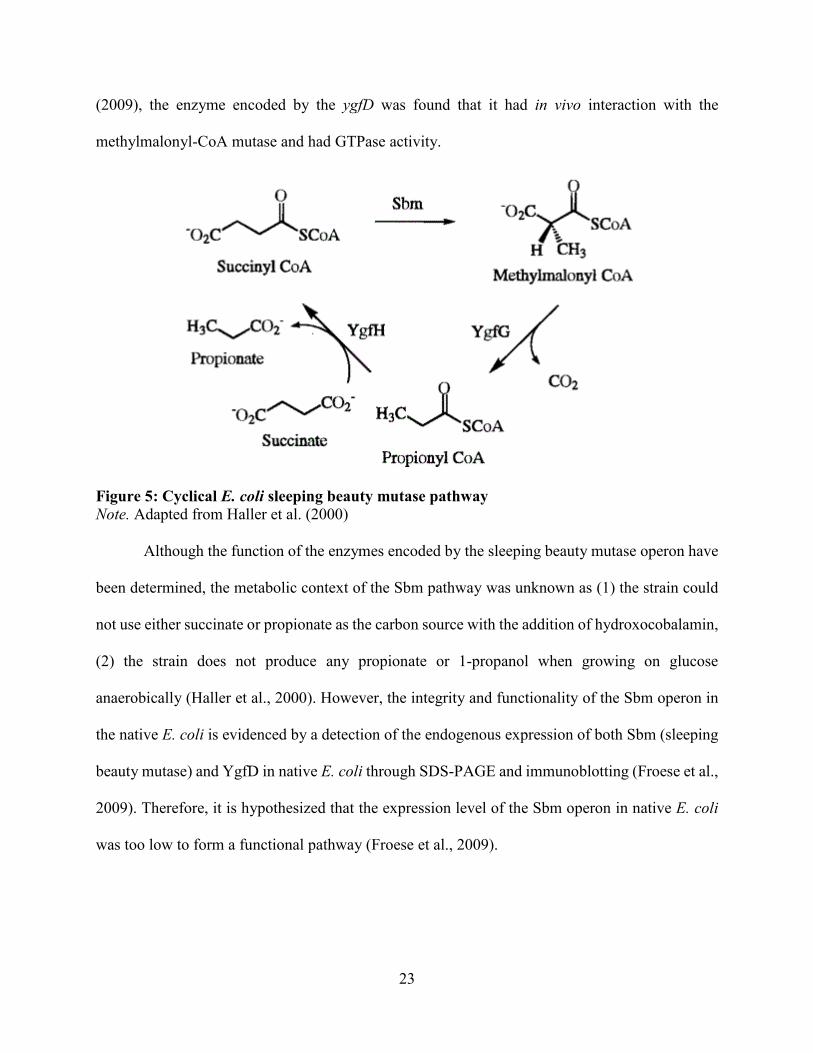
23
(2009), the enzyme encoded by the ygfD was found that it had in vivo interaction with the
methylmalonyl-CoA mutase and had GTPase activity.
Figure 5: Cyclical E. coli sleeping beauty mutase pathway
Note. Adapted from Haller et al. (2000)
Although the function of the enzymes encoded by the sleeping beauty mutase operon have
been determined, the metabolic context of the Sbm pathway was unknown as (1) the strain could
not use either succinate or propionate as the carbon source with the addition of hydroxocobalamin,
(2) the strain does not produce any propionate or 1-propanol when growing on glucose
anaerobically (Haller et al., 2000). However, the integrity and functionality of the Sbm operon in
the native E. coli is evidenced by a detection of the endogenous expression of both Sbm (sleeping
beauty mutase) and YgfD in native E. coli through SDS-PAGE and immunoblotting (Froese et al.,
2009). Therefore, it is hypothesized that the expression level of the Sbm operon in native E. coli
was too low to form a functional pathway (Froese et al., 2009).
24
Chapter 3 Materials and Methods
3.1 Bacterial strains, plasmids, and primers
E. coli strains, plasmids and primers used in this study are listed in Table 7. Standard
recombinant DNA technologies for molecular cloning were applied (Miller, 1992). Pfu and Taq
DNA polymerases, T4 DNA ligase, and large (Klenow) fragment of DNA Polymerase I were all
purchased from New England Biolabs (Ipswich, MA), and all synthesized oligonucleotides were
obtained from Integrated DNA Technologies (Coralville, IA). The Centre for Applied Genomics
at the Hospital for Sick Children (Toronto, Canada) performed all the DNA sequencing of the
resulting plasmids.
E. coli BW25141 was used to provide the parental genetic background for 1-propanol
production. E. coli HST08 was used for molecular cloning purpose. Gene deletions were
introduced to BW25141 strains by P1-phage transduction (Miller, 1992) using proper Keio
Collection strains (The Coli Genetic Stock Center, Yale University) as donors (Baba et al., 2006).
The pCP20 was used to remove the co-transduced KmR-FRT gene cassette (Datsenko and Wanner,
2000). The genotypes of the resulting knockout strains were confirmed by colony PCR using
appropriate primer sets.
A modified λ Red-mediated recombination protocol was used to fuse the strong promoter
(Ptrc) with the Sbm operon in the E. coli genome as described by Sukhija et al. (2012). The FRT-
CmR-FRT cassette was PCR-amplified from pKD3 using the c-frt primer set, whereas the Ptrc
promoter-operator fragment was PCR-amplified from pTrc99a using the c-ptrc primer set. The
two DNA fragments were fused by splice overlap extension (SOE) PCR as described by Jones and
Barnard (2005) using the forward primer of the c-frt primer set and the reverse primer of the c-
ptrc primer set to generate the FRT-CmR-FRT-Ptrc cassette. To generate the DNA cartridge for
25
genomic integration, the FRT-CmR-FRT-Ptrc cassette was PCR-amplified using the r-frt:ptrc
primer set containing the 36-bp homology arms of H1 and H2, respectively. To derive the plasmid-
free strain of CPC-PrOH3, 0.5 µg of the amplified/purified DNA cassette was electro-transformed,
using a Gene Pulser (BioRad Laboratories, Hercules, CA) set at 2.5 kV, 25 µF, and 200 Ω, to WT-
∆ldhA-∆pykF harboring the λ-Red recombinase expression plasmid pKD46 for DNA
recombination to replace the 204-bp upstream region of the Sbm operon. Expression of the λ-Red
recombination enzymes and preparation of competent cells were carried out as described by
Datsenko and Wanner (2000). After electroporation, cells were resuspended in 500 µL of SOC
(super optimal broth with catabolite repression) medium (3.6 g/L glucose, 20 g/L tryptone, 5 g/L
yeast extract, 0.6 g/L NaCl, 0.19 g/L KCI, 4.8 g/L MgSO4) (Hanahan, 1983) and recovered at 37
°C for 1 h in a rotatory shaker at 250 rpm (New Brunswick Scientific, NJ). Cells were then plated
on lysogeny broth (LB) agar plate containing 12 µg/mL chloramphenicol for incubation at 37 °C
for 16 h to select chloramphenicol-resistant recombinants. The fusion of the FRT-CmR-FRT-Ptrc
cassette with the Sbm operon was verified by colony PCR using the v-frt:ptrc primer set as well
as DNA sequencing.
26
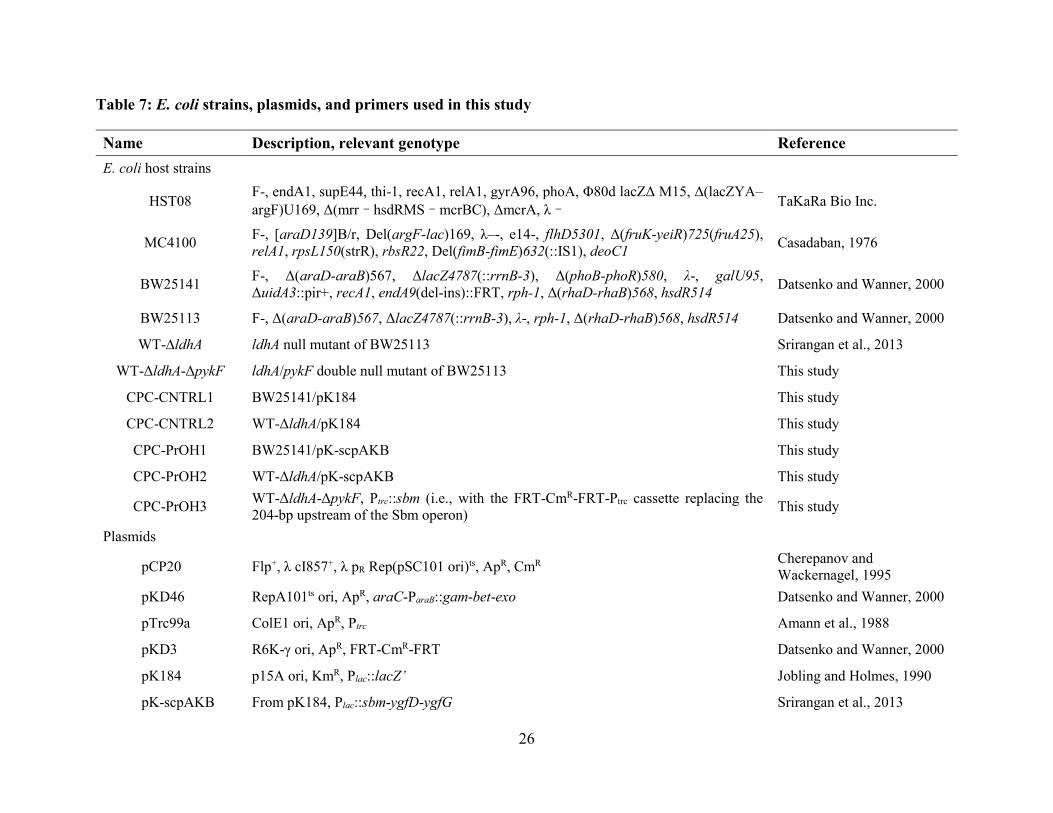
Table 7: E. coli strains, plasmids, and primers used in this study
Name Description, relevant genotype Reference
E. coli host strains
HST08 F-, endA1, supE44, thi-1, recA1, relA1, gyrA96, phoA, Φ80d lacZΔ M15, Δ(lacZYA–
argF)U169, Δ(mrr–hsdRMS–mcrBC), ΔmcrA, λ– TaKaRa Bio Inc.
MC4100 F-, [araD139]B/r, Del(argF-lac)169, λ–-, e14-, flhD5301, Δ(fruK-yeiR)725(fruA25),
relA1, rpsL150(strR), rbsR22, Del(fimB-fimE)632(::IS1), deoC1 Casadaban, 1976
BW25141 F-, Δ(araD-araB)567, ΔlacZ4787(::rrnB-3), Δ(phoB-phoR)580, λ-, galU95,
ΔuidA3::pir+, recA1, endA9(del-ins)::FRT, rph-1, Δ(rhaD-rhaB)568, hsdR514 Datsenko and Wanner, 2000
BW25113 F-, Δ(araD-araB)567, ΔlacZ4787(::rrnB-3), λ-, rph-1, Δ(rhaD-rhaB)568, hsdR514 Datsenko and Wanner, 2000
WT-∆ldhA ldhA null mutant of BW25113 Srirangan et al., 2013
WT-ΔldhA-ΔpykF ldhA/pykF double null mutant of BW25113 This study
CPC-CNTRL1 BW25141/pK184 This study
CPC-CNTRL2 WT-ΔldhA/pK184 This study
CPC-PrOH1 BW25141/pK-scpAKB This study
CPC-PrOH2 WT-ΔldhA/pK-scpAKB This study
CPC-PrOH3 WT-ΔldhA-ΔpykF, Ptrc::sbm (i.e., with the FRT-CmR-FRT-Ptrc cassette replacing the
204-bp upstream of the Sbm operon) This study
Plasmids
pCP20 Flp+, λ cI857+, λ pR Rep(pSC101 ori)ts, ApR, CmR Cherepanov and
Wackernagel, 1995
pKD46 RepA101ts ori, ApR, araC-ParaB::gam-bet-exo Datsenko and Wanner, 2000
pTrc99a ColE1 ori, ApR, Ptrc Amann et al., 1988
pKD3 R6K-γ ori, ApR, FRT-CmR-FRT Datsenko and Wanner, 2000
pK184 p15A ori, KmR, Plac::lacZ’ Jobling and Holmes, 1990
pK-scpAKB From pK184, Plac::sbm-ygfD-ygfG Srirangan et al., 2013
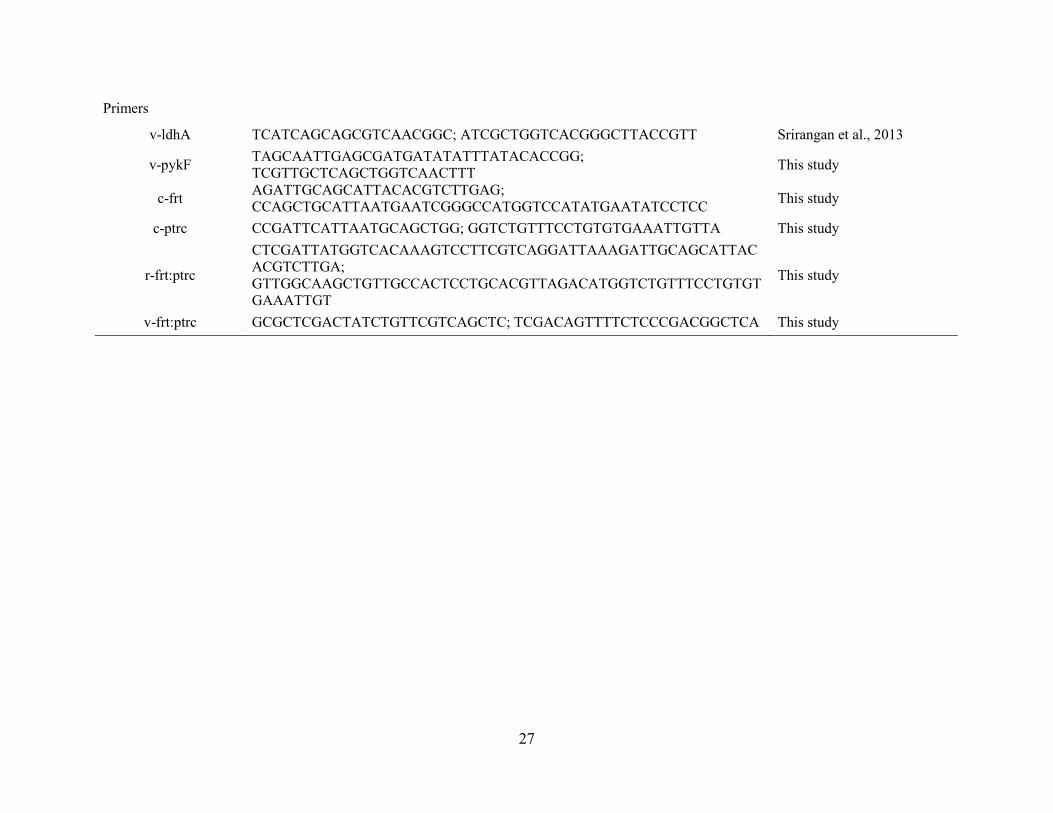
27
Primers
v-ldhA TCATCAGCAGCGTCAACGGC; ATCGCTGGTCACGGGCTTACCGTT Srirangan et al., 2013
v-pykF TAGCAATTGAGCGATGATATATTTATACACCGG;
TCGTTGCTCAGCTGGTCAACTTT This study
c-frt AGATTGCAGCATTACACGTCTTGAG;
CCAGCTGCATTAATGAATCGGGCCATGGTCCATATGAATATCCTCC This study
c-ptrc CCGATTCATTAATGCAGCTGG; GGTCTGTTTCCTGTGTGAAATTGTTA This study
r-frt:ptrc
CTCGATTATGGTCACAAAGTCCTTCGTCAGGATTAAAGATTGCAGCATTAC
ACGTCTTGA;
GTTGGCAAGCTGTTGCCACTCCTGCACGTTAGACATGGTCTGTTTCCTGTGT
GAAATTGT
This study
v-frt:ptrc GCGCTCGACTATCTGTTCGTCAGCTC; TCGACAGTTTTCTCCCGACGGCTCA This study
28
3.2 Media and cultivation conditions
Glucose, yeast extract, and tryptone used in this study were obtained from BD Diagnostic
Systems (Franklin Lakes, NJ), while other media components were obtained from Sigma-Aldrich
Co. (St Louis, MO). Certain concentration of the antibiotic (30 µg/mL kanamycin or 12 µg/mL
chloramphenicol) was supplemented into the media as required. To start a fermentation
experiment, the glycerol stock of a propanogenic or control E. coli strain (stored at -80 °C) was
streaked onto a LB agar plate with appropriate antibiotic and then incubated at 37 °C for 16 h. A
single colony was picked from the LB plate to inoculate an overnight culture that contained 30 mL
SB (super broth) medium (32 g/L tryptone, 20 g/L yeast extract, and 5 g/L NaCl) with appropriate
antibiotic in a 125 mL conical flask. The overnight culture was incubated at 37 °C in a rotary
shaker (New Brunswick Scientific, NJ) at 270 rpm. After approximately 12 hours, 2 mL of the
overnight culture was used to inoculate the seed culture that contained 200 mL SB medium with
appropriate antibiotic in a 1 L conical flask. The seed culture was incubated at 37 °C in a rotary
shaker at 270 rpm for approximately 18 h. To collect the cells for inoculation, seed culture was
spun down by centrifugation at 6,000 × g and 20 °C for 15 min. After that, the cell pellets were
resuspended in 100-mL fresh LB media and the new culture was used to inoculate a 1-L stirred-
tank bioreactor (Omni-Culture, VirTis, NY). The bioreactor was operated anaerobically by
constantly sparging nitrogen into the bioreactor at a flow rate of 0.1 vvm, and the temperature and
the agitation speed was maintained at 30 °C and 430 rpm, respectively. The production medium
in the bioreactor contained 30 g/L of certain carbon sources (i.e., glucose or glycerol), appropriate
antibiotics, 0.23 g/L K2HPO4, 0.51 g/L NH4Cl, 100 mg/L MgCl2, 48.1 mg/L K2SO4, 1.52 mg/L
FeSO4, 0.055 mg/L CaCl2, 2.93 g/L NaCl, 0.72 g/L tricine, 10 g/L yeast extract, 10 mM NaHCO3,
0.2 µM cyaocobalamin (vitamin B12), trace elements (2.86 mg/L H3BO3, 1.81 mg/L MnCl2•4H2O,
29
0.222 mg/L ZnSO4•7H2O, 0.39 mg/L Na2MoO4•2H2O, 79 µg/L CuSO4•5H2O, 49.4 µg/L
Co(NO3)2•6H2O) (Neidhardt et al. 1974). The pH of the fermentation broth was maintained at 7.0
± 0.1 by adding 30% (v/v) NH4OH and 30% (v/v) H3PO4. The feeding solution for fed-batch
cultivation contained 50% (w/v) glycerol only and 50 mL (25 g) of it was added manually into the
bioreactor when the glycerol concentration in the fermentation culture fell below 5 g/L. Note that
no isopropyl β-D-1-thiogalactopyranoside (IPTG) was supplemented in the cultivation medium
for induction purpose since it was observed that IPTG supplementation had negligible effects on
the 1-propanol production for all propanogenic strains in this study, and the cyaocobalamin was
only supplemented at the beginning of the fed-batch cultivation.
3.3 HPLC analysis
The optical density (OD600) was measured by appropriately diluting the culture samples with
0.15 M sodium chloride solution using a spectrophotometer (DU520, Beckman Coulter, Fullerton,
CA). After that, the samples were spun down by centrifugation at 10,000 RPM and 4 °C for 8 min.
The pellets were discarded and the cell-free supernatants were collected and filtrated for titer
analysis of glucose, glycerol, and all the other carbohydrate compounds using an HPLC system
(LC-10AT, Shimadzu, Kyoto, Japan) equipped with a refractive index detector (RID-10A,
Shimadzu, Kyoto, Japan) and a chromatographic column (Aminex HPX-87H, Bio-Rad
Laboratories, CA, USA). The column was kept in a column oven (CTO-20A, Shimadzu, Kyoto,
Japan) at 65 °C and the 5 mM H2SO4 (pH 2.0) was used as the mobile phase. The pump was set at
a flow rate of 0.6 mL/min under the working conditions. The RID signal was transferred to a
desktop computer and the data collected was processed by the Clarity Lite Chromatographic
Station (Clarity Lite, DataApex, Prague, The Czech Republic).
30
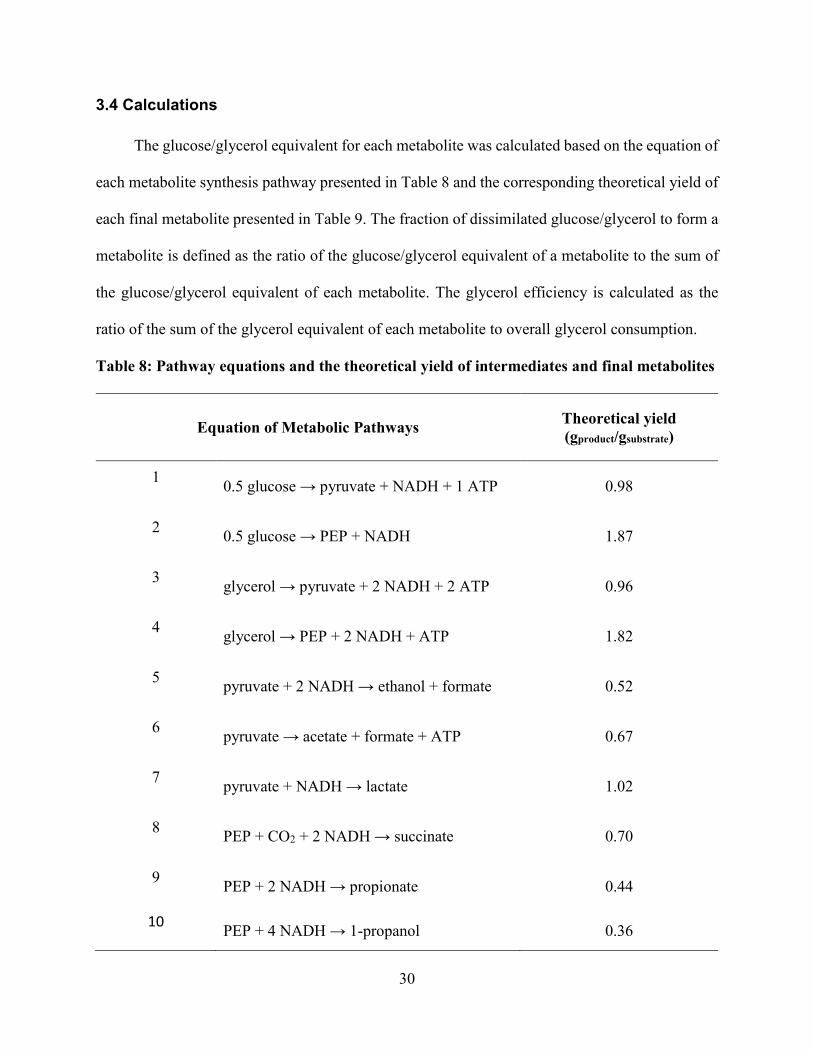
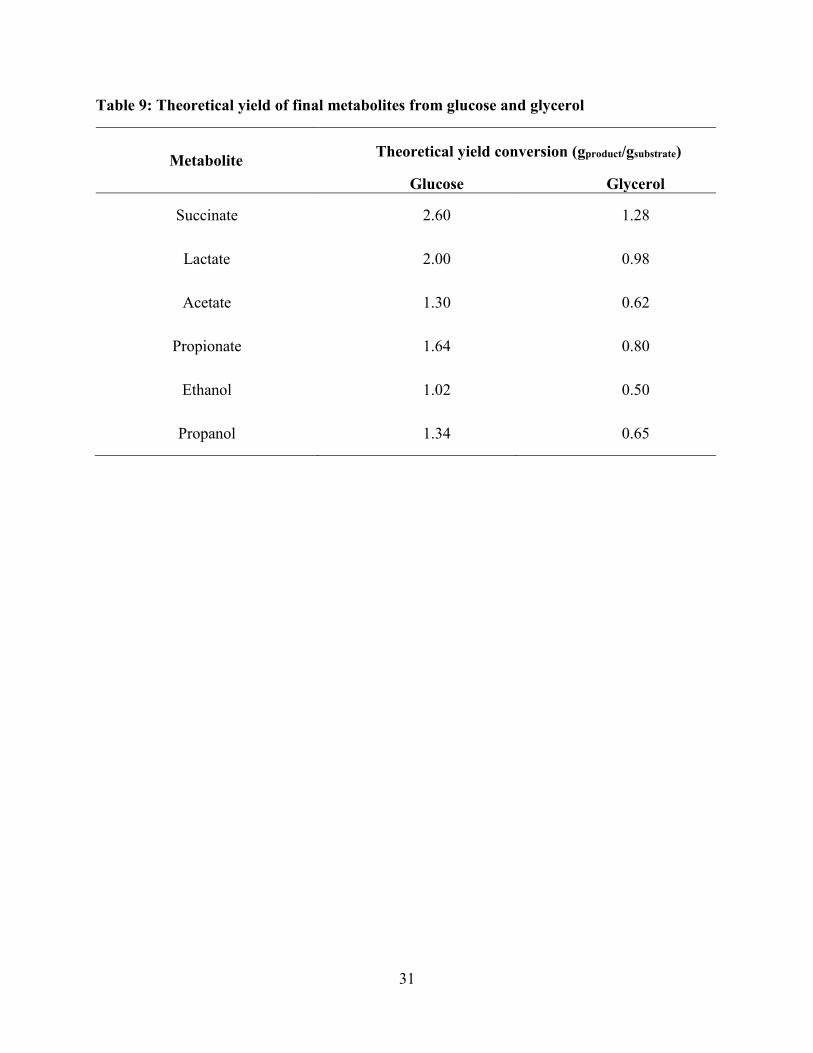
3.4 Calculations
The glucose/glycerol equivalent for each metabolite was calculated based on the equation of
each metabolite synthesis pathway presented in Table 8 and the corresponding theoretical yield of
each final metabolite presented in Table 9. The fraction of dissimilated glucose/glycerol to form a
metabolite is defined as the ratio of the glucose/glycerol equivalent of a metabolite to the sum of
the glucose/glycerol equivalent of each metabolite. The glycerol efficiency is calculated as the
ratio of the sum of the glycerol equivalent of each metabolite to overall glycerol consumption.
Table 8: Pathway equations and the theoretical yield of intermediates and final metabolites
Equation of Metabolic Pathways Theoretical yield
(gproduct/gsubstrate)
1 0.5 glucose → pyruvate + NADH + 1 ATP 0.98
2 0.5 glucose → PEP + NADH 1.87
3 glycerol → pyruvate + 2 NADH + 2 ATP 0.96
4 glycerol → PEP + 2 NADH + ATP 1.82
5 pyruvate + 2 NADH → ethanol + formate 0.52
6 pyruvate → acetate + formate + ATP 0.67
7 pyruvate + NADH → lactate 1.02
8 PEP + CO2 + 2 NADH → succinate 0.70
9 PEP + 2 NADH → propionate 0.44
10 PEP + 4 NADH → 1-propanol 0.36
31
Table 9: Theoretical yield of final metabolites from glucose and glycerol
Metabolite Theoretical yield conversion (gproduct/gsubstrate)
Glucose Glycerol
Succinate 2.60 1.28
Lactate 2.00 0.98
Acetate 1.30 0.62
Propionate 1.64 0.80
Ethanol 1.02 0.50
Propanol 1.34 0.65
32
Chapter 4 Results
4.1 Characterization of 1-propanol production under anaerobic conditions using
glucose as the main carbon source
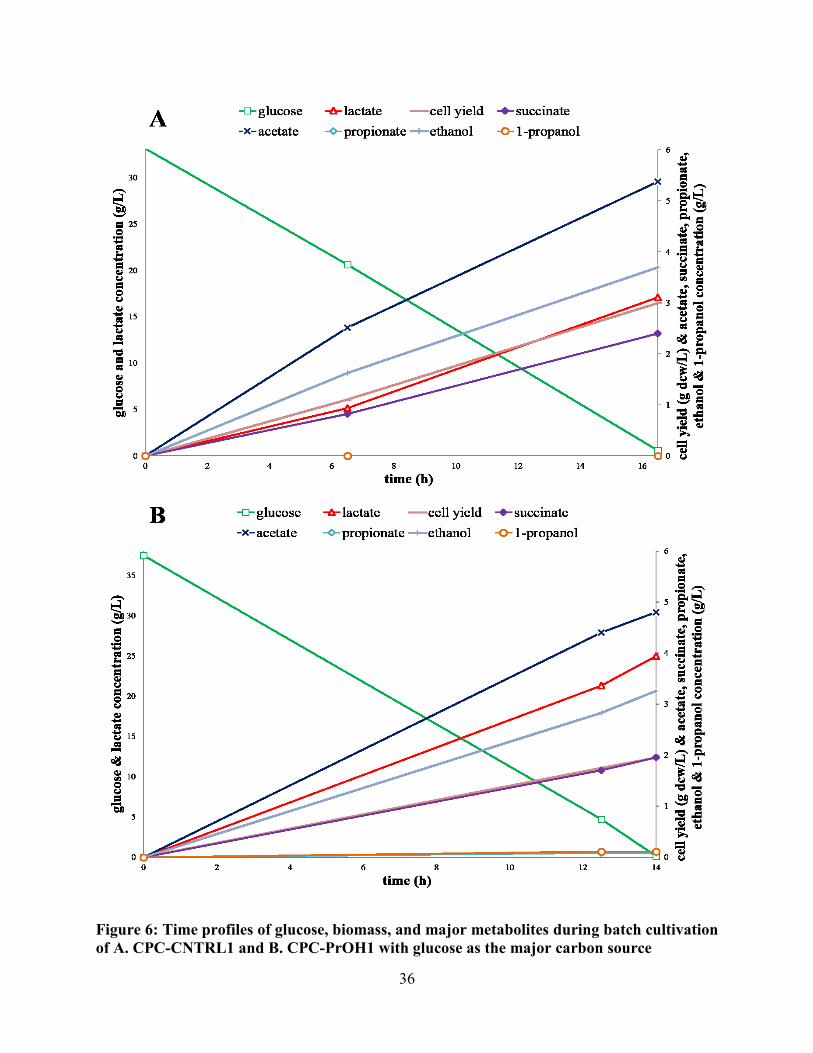
The strain CPC-PrOH1, which contains an active Sbm operon (i.e., sbm-ygfD-ygfG) on a
low-copy number plasmid (pK184), was fermented anaerobically using glucose as the main carbon
source. As can be seen from the Figure 6, the glucose dissimilation rate of the strain CPC-PrOH1
was similar to that of the control strain CPC-CNTRL1 harboring a dummy pK184 plasmid with a
total cultivation time of 14 hours and 16 hours, respectively. Both batch fermentations were
finished with the glucose being completely dissimilated at the end of the cultivation. 1-propanol
and propionate were produced solely by the strain CPC-PrOH1 with a titer of 0.11 g/L and 0.09
g/L, respectively (Figure 6 and Table 10). As shown in the Figure 6 and Table 10, other
fermentation metabolites produced by the strain CPC-PrOH1 and its control strain CPC-CNTRL1
includes: lactate (24.97 g/L and 17.08 g/L, respectively), succinate (1.96 g/L and 2.40 g/L,
respectively), acetate (4.80 g/L and 5.38 g/L, respectively), and ethanol (3.26 g/L and 3.73 g/L,
respectively), while lactate was the dominant metabolite for both stains and the titer was 32%
higher in the strain CPC-PrOH1 as compared to the control strain CPC-CNTRL1. Notably, the
combined titers of all organic acids being produced at the end of fermentation were 31.82 g/L for
the strain CPC-PrOH1 and 24.86 g/L for the control strain CPC-CNTRL1, accounting for
approximately 84% and 79% of dissimilated glucose, respectively. However, the biomass titer for
the strain CPC-PrOH1 (1.96 g/L) was approximately 35% lower than that of the control strain (3
g/L) (Table 10), implying that overproduction of organic acids (i.e., lactate, acetate, and succinate)
can potentially harm the cell growth and viability due to their toxicity at high concentration
(Warnecke and Gill, 2005). As a result, in order to reduce the lactate production and redirect the
33
carbon flux toward the sleeping beauty mutase (Sbm) pathway, the ldhA gene (encoding lactate
dehydrogenase) knocked-out strain CPC-PrOH2 was selected for fermenting.
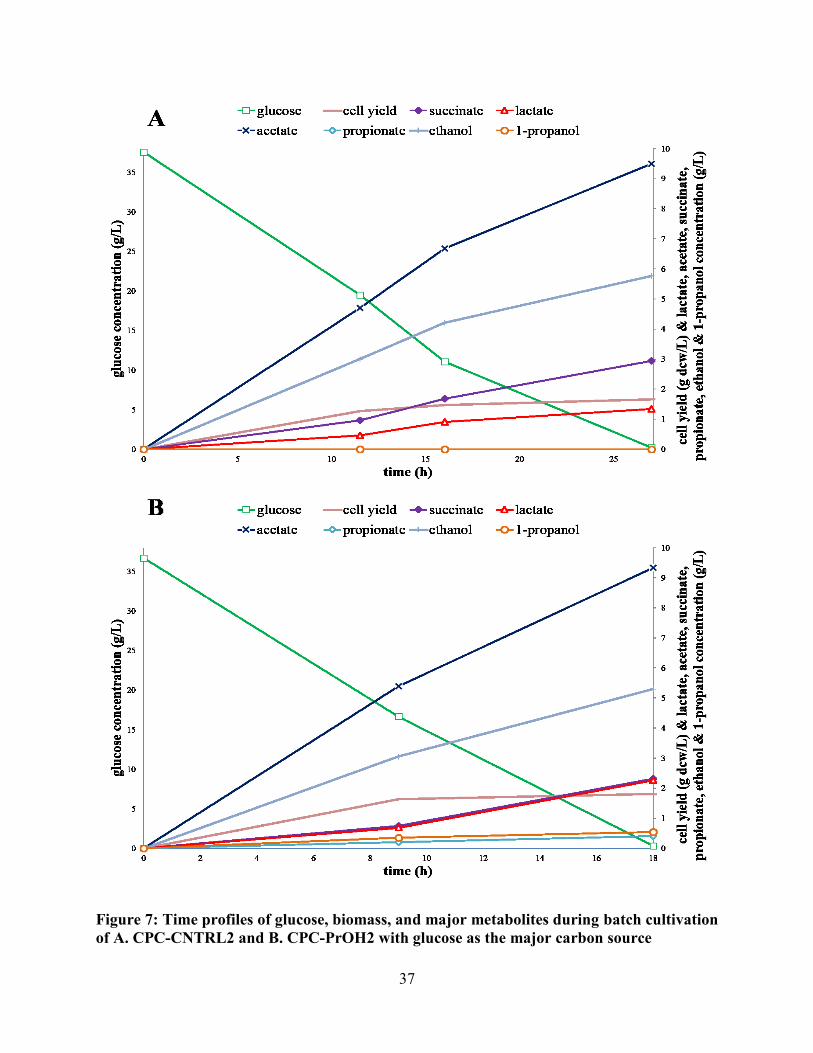
The ldhA mutant strain CPC-PrOH2 contains the same plasmid as its parental strain CPC-
PrOH1, which has been shown capable of producing 1-propanol through the extensive Sbm
pathway. Fermentation of the strain CPC-PrOH2 and its control ldhA mutant strain CPC-CNTRL2
harboring a dummy pK184 plasmid were performed under the same conditions using glucose as
the carbon source, and the results are shown in Figure 7 and Table 10. As expected, the lactate titer
for the strain CPC-PrOH2 (2.27 g/L) and CPC-CNTRL2 (1.35 g/L) was decreased by
approximately 90% and 92% as compared to that of the strain CPC-PrOH1 (24.97 g/L) and CPC-
CNTRL1 (17.08 g/L), respectively (Table 10). The remaining level of lactate could be produced
through an alternative pathway (i.e., methylglyoxal degradation) (Kalapos, 1999). The strain CPC-
PrOH2 produced 0.55 g/L of 1-propanol and 0.41 g/L of propionate, representing a 400% and
456% increase in production compared to the strain CPC-PrOH1, respectively (Table 10). Except
for 1-propanol and propionate (neither were detected in the culture of the strain CPC-CNTRL2),
the distribution of fermentation metabolites (i.e., acetate, succinate, lactate, and ethanol) for the
control strain CPC-CNTRL2 were similar to those obtained with the strain CPC-PrOH2 (Table
10). Although lactate level was significantly reduced and 1-propanol production was increased by
four-fold, the amount of glucose being used toward 1-propanol production remained low (2.73%
of dissimilated glucose) (Table 10). On the other hand, acetate production for the strain CPC-
PrOH2 was increased from 4.80 g/L to 9.33 g/L, which accounted for approximately 48% of
dissimilated glucose (Table 10). Even though the fraction of dissimilated glucose being used for
the organic acids production (i.e., acetate, lactate, succinate, and propionate) was reduced from
84% to 63%, the biomass titer (1.81 g/L) for the strain CPC-PrOH2 was less than that obtained
34
with the strain CPC-PrOH1 (Table 10), implying that acetate is more potent than the lactate.
Nevertheless, it should be noted that the combined solvent production (i.e., ethanol at 5.77 g/L and
1-propanol at 0.55 g/L) was increased from 3.77 g/L to 6.32 g/L (representing approximately 37%
of dissimilated glucose), suggesting that the carbon flux was partially redirected from acidogenesis
to solventogenesis (Table 10).
35
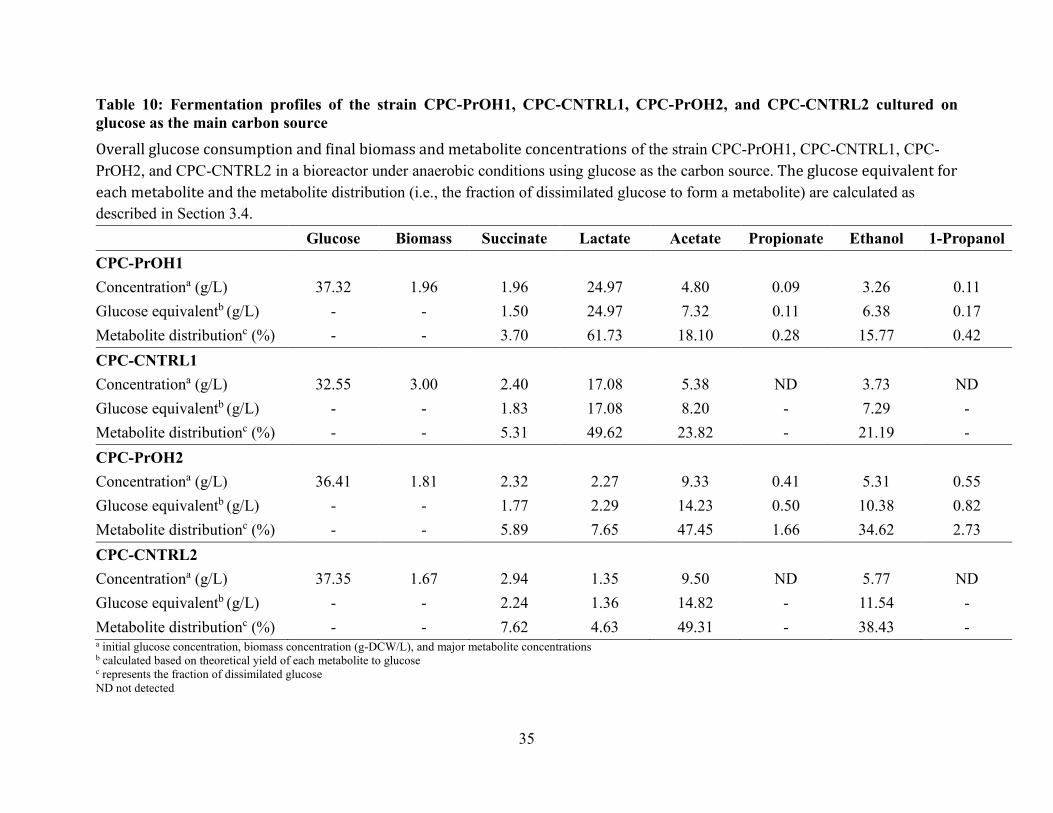
Table 10: Fermentation profiles of the strain CPC-PrOH1, CPC-CNTRL1, CPC-PrOH2, and CPC-CNTRL2 cultured on
glucose as the main carbon source
Overall glucose consumption and final biomass and metabolite concentrations of the strain CPC-PrOH1, CPC-CNTRL1, CPC-
PrOH2, and CPC-CNTRL2 in a bioreactor under anaerobic conditions using glucose as the carbon source. The glucose equivalent for
each metabolite and the metabolite distribution (i.e., the fraction of dissimilated glucose to form a metabolite) are calculated as
described in Section 3.4.
Glucose Biomass Succinate Lactate Acetate Propionate Ethanol 1-Propanol
CPC-PrOH1
Concentrationa (g/L) 37.32 1.96 1.96 24.97 4.80 0.09 3.26 0.11
Glucose equivalentb (g/L) - - 1.50 24.97 7.32 0.11 6.38 0.17
Metabolite distributionc (%) - - 3.70 61.73 18.10 0.28 15.77 0.42
CPC-CNTRL1
Concentrationa (g/L) 32.55 3.00 2.40 17.08 5.38 ND 3.73 ND
Glucose equivalentb (g/L) - - 1.83 17.08 8.20 - 7.29 -
Metabolite distributionc (%) - - 5.31 49.62 23.82 - 21.19 -
CPC-PrOH2
Concentrationa (g/L) 36.41 1.81 2.32 2.27 9.33 0.41 5.31 0.55
Glucose equivalentb (g/L) - - 1.77 2.29 14.23 0.50 10.38 0.82
Metabolite distributionc (%) - - 5.89 7.65 47.45 1.66 34.62 2.73
CPC-CNTRL2
Concentrationa (g/L) 37.35 1.67 2.94 1.35 9.50 ND 5.77 ND
Glucose equivalentb (g/L) - - 2.24 1.36 14.82 - 11.54 -
Metabolite distributionc (%) - - 7.62 4.63 49.31 - 38.43 - a initial glucose concentration, biomass concentration (g-DCW/L), and major metabolite concentrations b calculated based on theoretical yield of each metabolite to glucose c represents the fraction of dissimilated glucose
ND not detected
36
Figure 6: Time profiles of glucose, biomass, and major metabolites during batch cultivation
of A. CPC-CNTRL1 and B. CPC-PrOH1 with glucose as the major carbon source
37
Figure 7: Time profiles of glucose, biomass, and major metabolites during batch cultivation
of A. CPC-CNTRL2 and B. CPC-PrOH2 with glucose as the major carbon source
38
4.2 Characterization of 1-propanol production under anaerobic conditions using
glycerol as the main carbon source
Due to the high-level of acidogenesis for fermentations under anaerobic conditions using
glucose as the carbon source, the effect of using glycerol, which is a more reduced compound
compared to glucose (Clomburg and Gonzalez, 2013), as an alternative carbon source was
investigated. The glycerol fermentation of the strain CPC-PrOH2 and CPC-CNTRL2 were
performed under the same condition as those glucose fermentations. As shown in the Figure 8B
and Table 11, 2.15 g/L of 1-propanol were produced by the strain CPC-PrOH2, representing an
almost three-fold increase compared with that obtained by using glucose as the carbon source (0.55
g/L). However, ethanol became the dominant by-product as its titer was increased from 5.31 g/L
to 9.31 g/L, while acetate titer was decreased from 9.33 g/L to 3.92 g/L and succinate titer was
decreased from 2.32 g/L to 0.62 g/L (Figure 8B and Table 11). Propionate titer was also increased
from 0.41 g/L to 0.89 g/L, representing a more than two-fold increase compared to that obtained
with glucose (Table 11). Interestingly, lactate was totally eliminated in the culture of both the strain
CPC-PrOH2 and CPC-CNTRL2 by using glycerol as the carbon source (Figure 8 and Table 11).
More importantly, the combined titer of all organic acids produced by the strain CPC-PrOH2 (i.e.,
acetate, succinate, and propionate) accounted for approximately 26% of the dissimilated glycerol,
whereas the combined titer of all solvents (i.e., ethanol and 1-propanol) accounted for 74% of the
dissimilated glycerol (Table 11). This result shows the effectiveness of using glycerol as the main
carbon source in driving the carbon flux toward solventogenesis instead of acidogenesis. However,
the dissimilation rate of glycerol in the strain CPC-PrOH2 was much slower than that of the
glucose, with a total cultivation time of 85.5 hours and 18 hours, respectively (Figure 8B & 7B).
The prolonged cultivation time might be related to glycerol’s highly reduced state (κ ≈ 4.67, where
39
κ is the degree of reduction per carbon atom in the compound) (Villadsen et al., 2011) and less
ATP generated by the acetate synthesis pathway (Table 8). As shown in the Fig 8A and Table 11,
the control strain CPC-CNTRL2 without an active Sbm operon took 134 hours to completely
consume all the glycerol, and the biomass titer (1.64 g/L) was 28% lower than that of the strain
CPC-PrOH2 (2.27 g/L). This result suggests that the extensive Sbm pathway can not only facilitate
the dissimilation of glycerol but also help the cell growth under fermentative conditions. As
expected, both 1-propanol and propionate were not detected in the culture of the strain CPC-
CNTRL2 by using glycerol as the main carbon source (Figure 8A and Table 11). Ethanol was the
dominate metabolite with a titer of 10.89 g/L, representing approximately 79% of dissimilated
glycerol (Table 11). Compared to the strain CPC-PrOH2, the control strain CPC-CNTRL2
produced 456% more succinate at 3.45 g/L and 47% less acetate at 2.08 g/L by using glycerol as
the main carbon source (Table 11). Clearly, the succinate accumulation in the strain CPC-CNTRL2
was due to the lack of the Sbm pathway, which can facilitate the conversion of succinate into 1-
propanol. In addition, the acetate accumulation in the culture of the strain CPC-PrOH2 by using
glycerol as the carbon source might be due to the fact that for each mole of succinate converted to
1 mol of 1-propanol, 1 net mol of ATP is consumed (Table 8), so that more acetate needs to be
produced in order to compensate this net ATP consumption. Surprisingly, the glycerol efficiency
(i.e., ratio of the sum of the glycerol equivalents associated with all metabolites to overall glycerol
consumption) for the strain CPC-PrOH2 (96.29%) was higher than that of the control strain CPC-
CNTRL2 (87.19%) (Table 11).
40
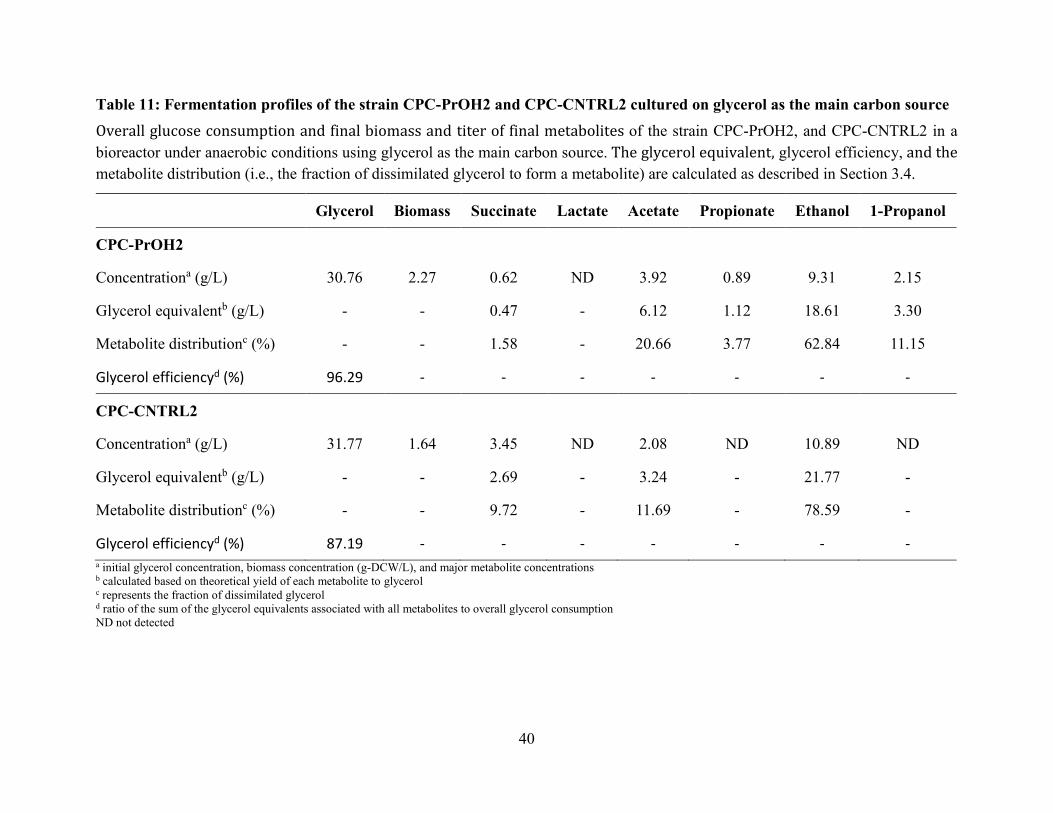
Table 11: Fermentation profiles of the strain CPC-PrOH2 and CPC-CNTRL2 cultured on glycerol as the main carbon source
Overall glucose consumption and final biomass and titer of final metabolites of the strain CPC-PrOH2, and CPC-CNTRL2 in a
bioreactor under anaerobic conditions using glycerol as the main carbon source. The glycerol equivalent, glycerol efficiency, and the
metabolite distribution (i.e., the fraction of dissimilated glycerol to form a metabolite) are calculated as described in Section 3.4.
Glycerol Biomass Succinate Lactate Acetate Propionate Ethanol 1-Propanol
CPC-PrOH2
Concentrationa (g/L) 30.76 2.27 0.62 ND 3.92 0.89 9.31 2.15
Glycerol equivalentb (g/L) - - 0.47 - 6.12 1.12 18.61 3.30
Metabolite distributionc (%) - - 1.58 - 20.66 3.77 62.84 11.15
Glycerol efficiencyd (%) 96.29 - - - - - - -
CPC-CNTRL2
Concentrationa (g/L) 31.77 1.64 3.45 ND 2.08 ND 10.89 ND
Glycerol equivalentb (g/L) - - 2.69 - 3.24 - 21.77 -
Metabolite distributionc (%) - - 9.72 - 11.69 - 78.59 -
Glycerol efficiencyd (%) 87.19 - - - - - - - a initial glycerol concentration, biomass concentration (g-DCW/L), and major metabolite concentrations b calculated based on theoretical yield of each metabolite to glycerol c represents the fraction of dissimilated glycerol d ratio of the sum of the glycerol equivalents associated with all metabolites to overall glycerol consumption
ND not detected
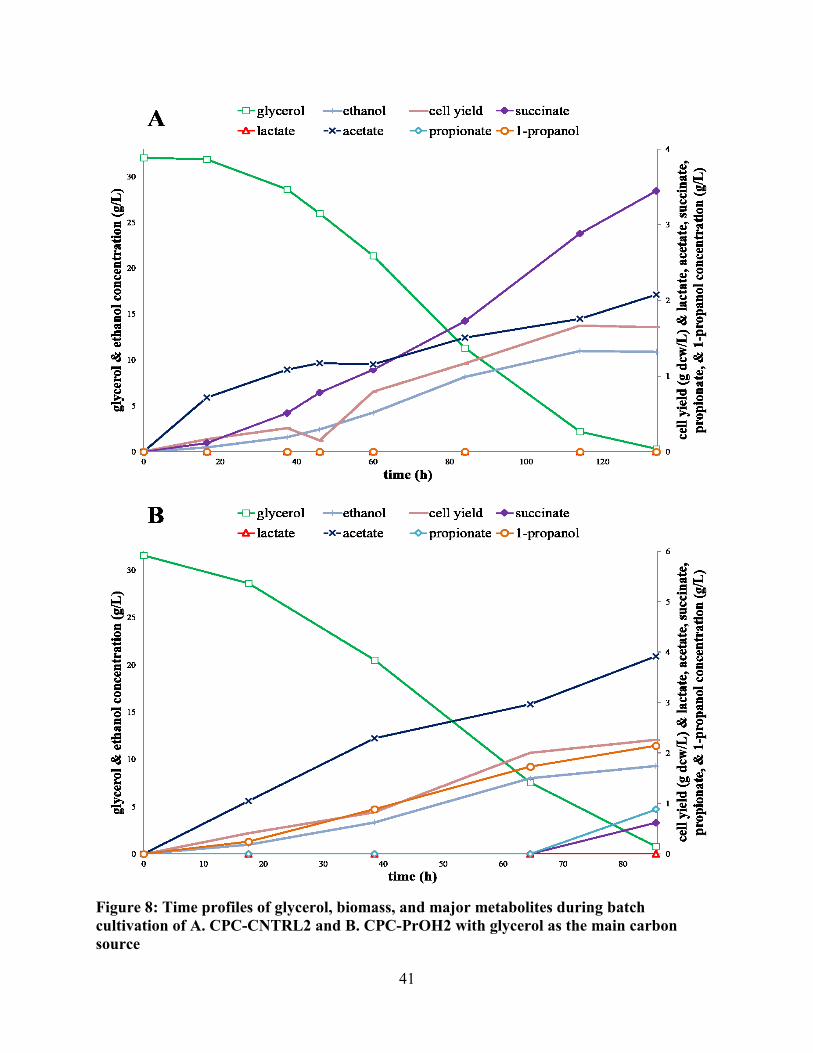
41
Figure 8: Time profiles of glycerol, biomass, and major metabolites during batch
cultivation of A. CPC-CNTRL2 and B. CPC-PrOH2 with glycerol as the main carbon
source
42
4.3 Fed-batch cultivation for 1-propanol production using glycerol as the main
carbon source
In order to characterize the 1-propanol production capacity of our propanogenic strain, the
fed-batch cultivation of the strain CPC-PrOH2 was performed following the first batch cultivation
of the strain CPC-PrOH2 using glycerol as the carbon source (Figure 8B) by periodically adding
approximately 50 mL of the 50% (w/v) glycerol stock solution into the bioreactor when the
glycerol concentration in the bioreactor fell near to 1 g/L. The fed-batch fermentation profile of
the strain CPC-PrOH2 are shown in the Figure 9 and Table 12. Due to the dilution effect resulted
from addition of either glycerol stock solution or acidic and alkaline solution and sampling of
fermentation cultures for the HPLC analysis, the working volume of the bioreactor varied between
stages, which made the metabolite concentrations underestimated from Stage II to Stage IV. As
shown in the Figure 9, there was always a sudden drop in the metabolite concentration after the
addition of the glycerol stock solution, which implied the existence of such dilution effect.
Therefore, the metabolite distribution (i.e., the fraction of dissimilated glycerol to form a
metabolite) and glycerol efficiency (i.e., ratio of the sum of the glycerol equivalents associated
with all metabolites to overall glycerol consumption) were analyzed based on each individual
stage’s cultivation performance to avoid this dilution effect (Table 12). Ethanol was the dominant
metabolite in all four stages, and the fraction of dissimilated glycerol used for ethanol production
was increased from 62.84% in Stage I to 74.4% in Stage IV. However, 1-propanol production was
hampered in all the stages after, with 9.51% and 5.62% of dissimilated glycerol being used for 1-
propanol production in Stage II and Stage III, respectively, and almost no 1-propanol was
accumulated in the last stage (Table 12). On the other hand, the fraction of dissimilated glycerol
used for succinate production was increased from 1.58% in Stage I to 7.59% in Stage II, 8.32% in
43
Stage III, and 6.7% in Stage IV, implying that the activity of the Sbm pathway diminished over
time. Interestingly, 0.39 g/L of lactate was produced from 13.84 g/L of glycerol in the Stage IV.
The high-level of solventogenesis was maintained throughout the whole fed-batch cultivation, with
~73%-77% of dissimilated glycerol being used toward the co-production of ethanol and 1-
propanol. Overall, 4.12 g/L of 1-propanol and 26.97 g/L of ethanol were produced from
approximately 87 g/L of glycerol at the end of the fed-batch fermentation, while other major
metabolites, such as acetate, succinate, and propionate, was produced at a titer of 8.98 g/L, 5.37
g/L, and 1.33 g/L, respectively (Table 12). Notably, the glycerol efficiency in Stage II (92.74%),
Stage III (89.92%), and Stage IV (87.21%) was all lower than the stage before, whereas the Stage
I (96.26%) had the highest glycerol efficiency (Table 12). In addition, the biomass yield was much
lower in Stage III (0.014 g/g) and was negative in Stage IV (-0.006 g/g) as compared with that
obtained in Stage I (0.074 g/g) and Stage II (0.032 g/g) (Table 12). In summary, these results
indicate that the cell growth was hampered in the last two stages (i.e., Stage III and Stage IV) as a
result of the accumulation of both acetate and ethanol at a relatively high level, which might
impose a certain degree of environmental stress onto the cell culture.
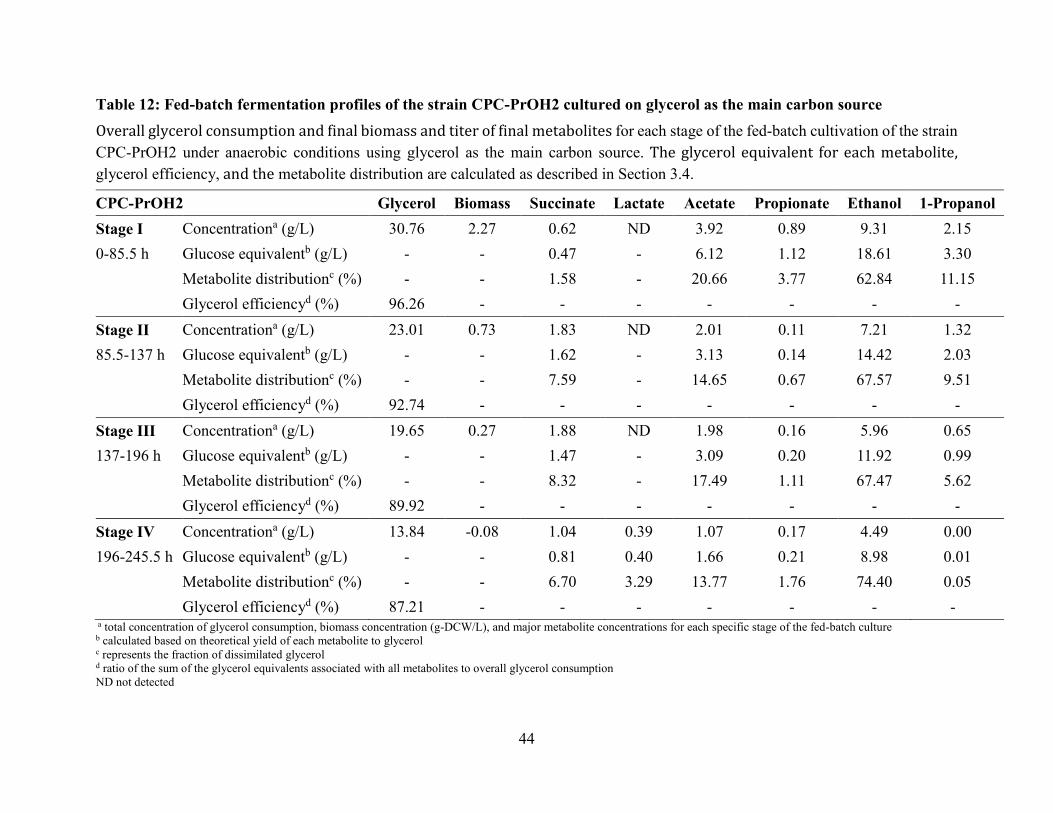
44
Table 12: Fed-batch fermentation profiles of the strain CPC-PrOH2 cultured on glycerol as the main carbon source
Overall glycerol consumption and final biomass and titer of final metabolites for each stage of the fed-batch cultivation of the strain
CPC-PrOH2 under anaerobic conditions using glycerol as the main carbon source. The glycerol equivalent for each metabolite,
glycerol efficiency, and the metabolite distribution are calculated as described in Section 3.4.
a total concentration of glycerol consumption, biomass concentration (g-DCW/L), and major metabolite concentrations for each specific stage of the fed-batch culture b calculated based on theoretical yield of each metabolite to glycerol c represents the fraction of dissimilated glycerol d ratio of the sum of the glycerol equivalents associated with all metabolites to overall glycerol consumption
ND not detected
CPC-PrOH2 Glycerol Biomass Succinate Lactate Acetate Propionate Ethanol 1-Propanol
Stage I Concentrationa (g/L) 30.76 2.27 0.62 ND 3.92 0.89 9.31 2.15
0-85.5 h Glucose equivalentb (g/L) - - 0.47 - 6.12 1.12 18.61 3.30
Metabolite distributionc (%) - - 1.58 - 20.66 3.77 62.84 11.15
Glycerol efficiencyd (%) 96.26 - - - - - - -
Stage II Concentrationa (g/L) 23.01 0.73 1.83 ND 2.01 0.11 7.21 1.32
85.5-137 h Glucose equivalentb (g/L) - - 1.62 - 3.13 0.14 14.42 2.03
Metabolite distributionc (%) - - 7.59 - 14.65 0.67 67.57 9.51
Glycerol efficiencyd (%) 92.74 - - - - - - -
Stage III Concentrationa (g/L) 19.65 0.27 1.88 ND 1.98 0.16 5.96 0.65
137-196 h Glucose equivalentb (g/L) - - 1.47 - 3.09 0.20 11.92 0.99
Metabolite distributionc (%) - - 8.32 - 17.49 1.11 67.47 5.62
Glycerol efficiencyd (%) 89.92 - - - - - - -
Stage IV Concentrationa (g/L) 13.84 -0.08 1.04 0.39 1.07 0.17 4.49 0.00
196-245.5 h Glucose equivalentb (g/L) - - 0.81 0.40 1.66 0.21 8.98 0.01
Metabolite distributionc (%) - - 6.70 3.29 13.77 1.76 74.40 0.05
Glycerol efficiencyd (%) 87.21 - - - - - - -
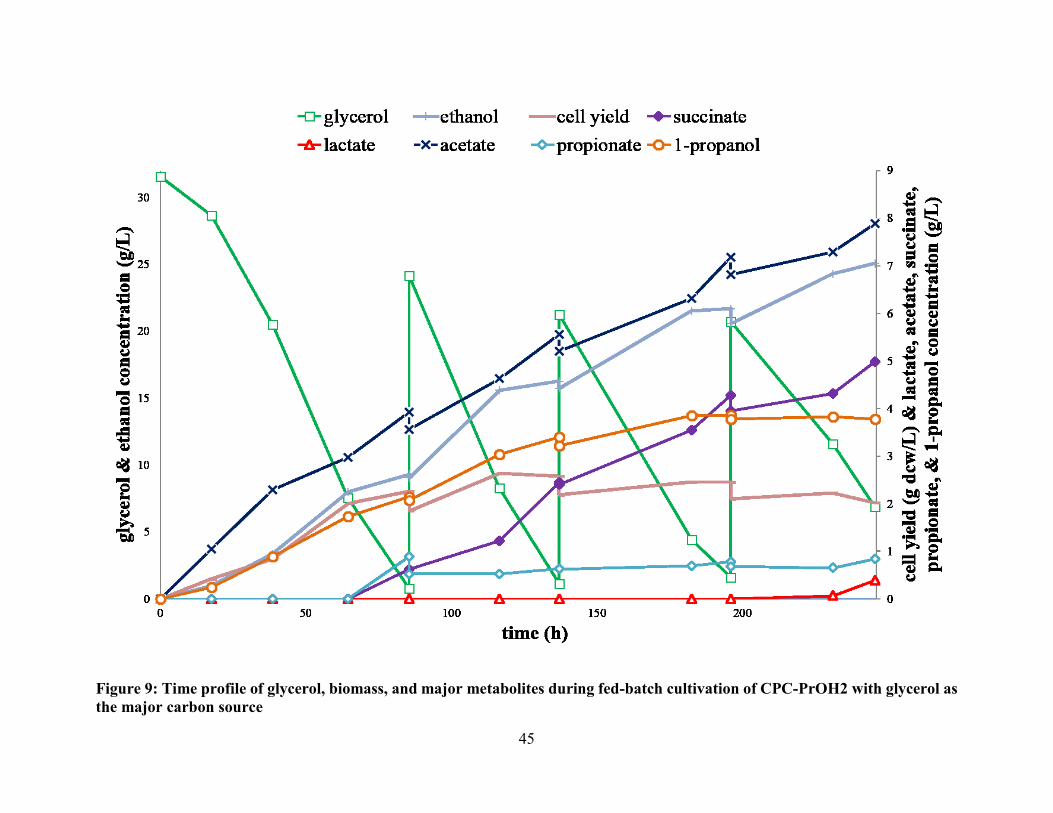
45
Figure 9: Time profile of glycerol, biomass, and major metabolites during fed-batch cultivation of CPC-PrOH2 with glycerol as
the major carbon source
46
4.4 Fed-batch cultivation of plasmid-free propanogenic Escherichia coli strain for
1-propanol production
Although the carbon flux has been successfully channelled toward solventogenesis by using
glycerol as the carbon source, the dissimilation rate of glycerol is rather slow as compared to that
of the glucose. It has been previously studied by Togna, Shuler, and Wilson (1993), Makrides
(1996) and Martinez et al. (1999) that using plasmid system could potentially harm the cell growth
rate due to the metabolic burden imposed on the host cell. To surmount this limitation, a plasmid-
free propanogenic strain, CPC-PrOH3, was derived, which had a strong trc-promoter (Ptrc) being
integrated upstream of the chromosomal Sbm operon (Srirangan et al., 2014). Fed-batch
cultivation of the strain CPC-PrOH3 was then performed to test its 1-propanol production capacity
under anaerobic conditions using glycerol as the carbon source. These results were summarized in
Table 13 and Figure 10. As expected, the cultivation time of the strain CPC-PrOH3 in Stage I was
reduced significantly from 85.5 hours to 42.5 hours (Figure 10 & 9). In addition, the biomass titer
was increased from 2.27 g/L to 2.79 g/L with the dissimilation of a similar amount of glycerol
(30.76 g vs 30.73 g, respectively) in Stage I (Table 12 & 13), implying that the plasmid-free strain
CPC-PrOH3 had a much better cell growth and faster glycerol dissimilation rate than the strain
CPC-PrOH2. Also, a similar effect was observed in other stages (i.e., Stage II, III, and IV) as well.
1-propanol was produced at 2.44 g/L in Stage I as compared to 2.15 g/L in the strain CPC-PrOH2
(Table 13 & 12). More interestingly, the fraction of dissimilated glycerol used for 1-propanol
production was steadily increased in Stage II (12.95 %) and Stage III (13.84%) as compared to
Stage I (12.29 %) (Table 13), suggesting that the plasmid-free strain CPC-PrOH3 was superior to
the strain CPC-PrOH2 in maintaining the functional expression of the gene of interest (i.e., Sbm
operon) overtime. However, the 1-propanol production was hampered in late stages (Stage IV and
47
Stage V), as only 7.90% and 6.31% of dissimilated glycerol was used toward the 1-propanol
production, respectively (Table 13). Again, ethanol was the dominant metabolite in all five stages.
The fraction of dissimilated glycerol used to produce ethanol was around 70% in the middle three
stages (i.e., Stage II, III, and IV), which were higher than the 62.34% in Stage I and 67.81% in
Stage V (Table 13). Over 80% of the carbon flux was directed toward solventogenesis in Stage II
(84.89%) and Stage III (84.27%), but showed a downward trend in Stage IV (77.98%) and Stage
V (74.12%). On the other hand, the fraction of dissimilated glycerol used for acetate production
was lower in Stage II (12.06%) and Stage III (13.31%) compared with Stage I (20.64%), primarily
due to an enhancement in solventogenesis level. However, when the co-production of ethanol and
1-propanol was hampered in Stage IV and Stage V, acetate started to accumulate again and
approximately 18% and 23 % of the dissimilated glycerol, respectively, was used toward the
acetate production. Notably, succinate was produced minimally in the strain CPC-PrOH3 as
compared to the strain CPC-PrOH2, as only ~1-3% of dissimilated glycerol was used toward the
succinate production throughout the whole fed-batch fermentation, implying that succinate was
continuously converted to 1-propanol catalyzed by the extensive Sbm pathway (Figure 9 & 10).
Similar to the fed-batch cultivation of the strain CPC-PrOH2, the biomass yield was decreased
dramatically after Stage I and was negligible in the last two stages (i.e., Stage IV and V) (Table
13). The glycerol efficiency was maintained at a high level in Stage I (99.34%) and Stage II
(105.06%), but was drastically lower in Stage III (87.16%), Stage IV (81.41%), and Stage V
(73.92%), which might be due to the utilization of carbon source for cell maintenance under
environmental stress as a result of the accumulation of high concentration of acetate and ethanol
in the cell culture. In summary, 7.52 g/L of 1-proapnol and 35.66 g/L of ethanol were produced
48
from 115.82 g/L of glycerol at the end of the fed-batch fermentation, along with 1.65 g/L of
propionate, 2.25 g/L of succinate, and 11.63 g/L of acetate being produced.
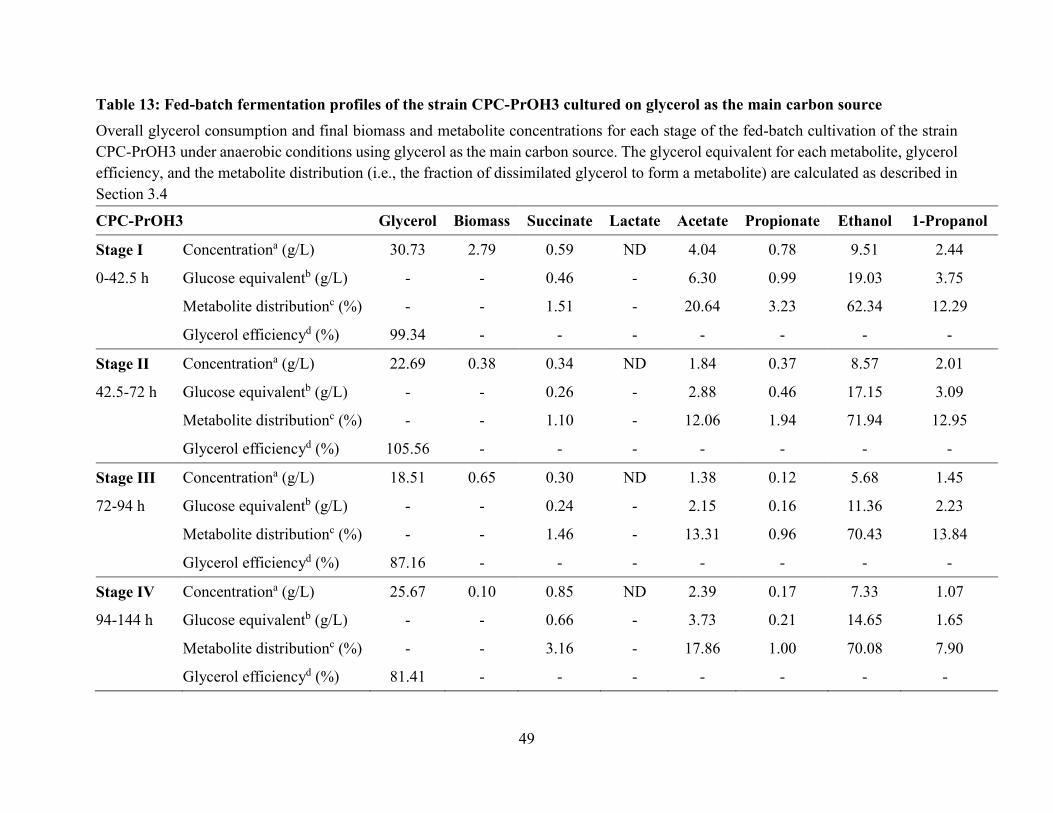
49
Table 13: Fed-batch fermentation profiles of the strain CPC-PrOH3 cultured on glycerol as the main carbon source
Overall glycerol consumption and final biomass and metabolite concentrations for each stage of the fed-batch cultivation of the strain
CPC-PrOH3 under anaerobic conditions using glycerol as the main carbon source. The glycerol equivalent for each metabolite, glycerol
efficiency, and the metabolite distribution (i.e., the fraction of dissimilated glycerol to form a metabolite) are calculated as described in
Section 3.4
CPC-PrOH3 Glycerol Biomass Succinate Lactate Acetate Propionate Ethanol 1-Propanol
Stage I Concentrationa (g/L) 30.73 2.79 0.59 ND 4.04 0.78 9.51 2.44
0-42.5 h Glucose equivalentb (g/L) - - 0.46 - 6.30 0.99 19.03 3.75
Metabolite distributionc (%) - - 1.51 - 20.64 3.23 62.34 12.29
Glycerol efficiencyd (%) 99.34 - - - - - - -
Stage II Concentrationa (g/L) 22.69 0.38 0.34 ND 1.84 0.37 8.57 2.01
42.5-72 h Glucose equivalentb (g/L) - - 0.26 - 2.88 0.46 17.15 3.09
Metabolite distributionc (%) - - 1.10 - 12.06 1.94 71.94 12.95
Glycerol efficiencyd (%) 105.56 - - - - - - -
Stage III Concentrationa (g/L) 18.51 0.65 0.30 ND 1.38 0.12 5.68 1.45
72-94 h Glucose equivalentb (g/L) - - 0.24 - 2.15 0.16 11.36 2.23
Metabolite distributionc (%) - - 1.46 - 13.31 0.96 70.43 13.84
Glycerol efficiencyd (%) 87.16 - - - - - - -
Stage IV Concentrationa (g/L) 25.67 0.10 0.85 ND 2.39 0.17 7.33 1.07
94-144 h Glucose equivalentb (g/L) - - 0.66 - 3.73 0.21 14.65 1.65
Metabolite distributionc (%) - - 3.16 - 17.86 1.00 70.08 7.90
Glycerol efficiencyd (%) 81.41 - - - - - - -
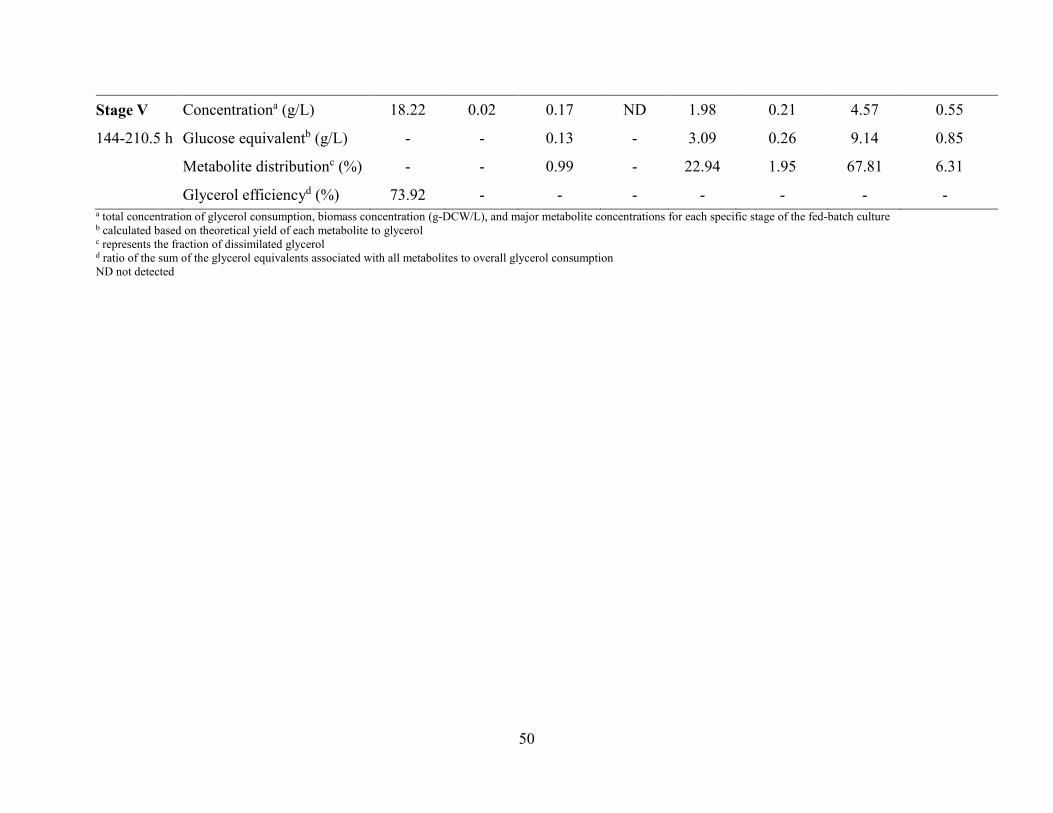
50
Stage V Concentrationa (g/L) 18.22 0.02 0.17 ND 1.98 0.21 4.57 0.55
144-210.5 h Glucose equivalentb (g/L) - - 0.13 - 3.09 0.26 9.14 0.85
Metabolite distributionc (%) - - 0.99 - 22.94 1.95 67.81 6.31
Glycerol efficiencyd (%) 73.92 - - - - - - - a total concentration of glycerol consumption, biomass concentration (g-DCW/L), and major metabolite concentrations for each specific stage of the fed-batch culture b calculated based on theoretical yield of each metabolite to glycerol c represents the fraction of dissimilated glycerol d ratio of the sum of the glycerol equivalents associated with all metabolites to overall glycerol consumption
ND not detected
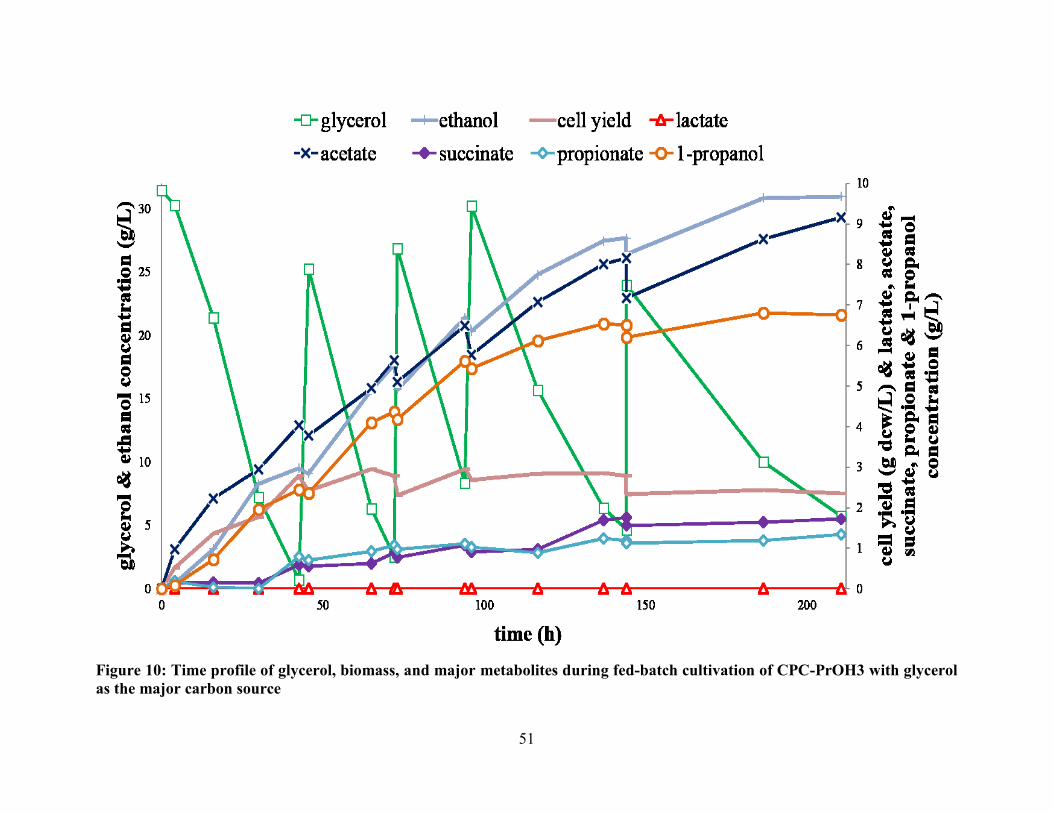
51
Figure 10: Time profile of glycerol, biomass, and major metabolites during fed-batch cultivation of CPC-PrOH3 with glycerol
as the major carbon source
52
Chapter 5 Discussion
It has been long argued that the combustion of fossil fuels is not only environmental
unfriendly, which produces air pollutants that contribute to climate change, smog, and acid-rain,
but also unsustainable due to its limited global reserves. By blending renewable fuels (e.g.,
ethanol) into the traditional petroleum fuels, emissions of greenhouse gases and air pollutants can
be significantly reduced. In Canada, up to 10% of ethanol can be blended into gasoline for usage
in internal combustion engines. However, as a potential renewable fuel, 1-propanol is superior to
ethanol in terms of energy density and RON (research octane number). Several studies have
reported the heterologous production of 1-propanol in metabolically engineered Escherichia coli
strains (Atsumi and Liao, 2008; Shen and Liao, 2008; Jain and Yan, 2011; Lee et al., 2012; Jain et
al., 2015). Recently, our group constructed a new 1-propanol biosynthesis pathway in E.coli by
expanding the native succinate pathway via overexpression of the native E.coli Sbm operon
(Srirangan et al., 2013). In that work, 150 mg/L of 1-propanol was produced by a metabolically
engineered E.coli stain in shake flasks under anaerobic conditions using glucose as the main carbon
source. Due to low 1-propanol yield and poorly defined cultivation conditions in shake flasks, the
performance of our metabolically engineered propanogenic strains could be further improved by
scaling up from the shake flask to the bioreactor.
Anaerobic fermentation of wild type E. coli strains using glucose as the carbon source mainly
produce lactate, acetate, ethanol, formate, and succinate as the end products, which is known as
the mixed-acid fermentation (Clark, 1989). By introducing a low copy plasmid pK184 containing
an active Sbm operon, the wild type E.coli strain was capable of converting succinate into 1-
propanol via propionyl-CoA intermediate (Figure 6 and Table 10). Even though the sleeping
53
beauty mutase pathway worked as expected, only a small portion of succinate was dissimilated.
This might be due to the fact that 1-propanol possesses a higher degree of reduction per carbon
atom (κ = 6) compared with the glucose (κ = 4) (Villadsen et al., 2011), so that the 1-propanol
production from glucose will result in net NADH consumption which can cause the redox
imbalance in the host cell. Based on the concept described by Roels (1983), the redox level of
glucose and 1-propanol is 24 and 18, respectively, and for each mole of 1-propanol produced from
0.5 mol of glucose (Table 8), there is a net consumption of 3 mol of reducing equivalents (i.e.,
NADH = 2 H), which is calculated based on the calculation: - (0.5 × 24) + 18 = 6. In addition, for
each mole of 1-propanol converted from 1 mol succinate via the Sbm pathway, one mole of ATP
is consumed (Table 8), which makes the synthesis of 1-propanol also energetically unfavorable
when compared to the synthesis of succinate. On the other hand, lactate synthesis from glucose
represents a perfect redox-balanced reaction. Since the redox level of lactate is 12 and each mole
of lactate is converted from 0.5 mol of glucose (Table 8), based on the calculation: - (0.5 × 24) +
12 = 0, there are neither net consumption nor net production of the reducing equivalents in the
reaction. Furthermore, 2 mol of ATP are generated for each mole of glucose converted to 2 mol of
lactate, whereas for each mole of 1-propanol produced, there is a net consumption of 1 mol ATP.
Consequently, lactate was produced as the dominant product in the batch culture of both the control
strain CPC-CNTRL1 and the propanogenic strain CPC-PrOH1 (Figure 6 and Table 10). This result
is consistent with the findings reported by Stokes (1949), Alam and Clark (1989), and Mat-Jan,
Alam, and Clark (1989) that the fermentative production of lactate in wild type E.coli is induced
by anaerobic conditions with glucose as the main carbon source. In order to channel carbon flux
toward the Sbm pathway and conserve NADH for 1-propanol production, the ldhA gene was
deleted. In the resulting mutant strain, CPC-PrOH2, 1-propanol production was increased by four-
54
fold along with minimal amount of lactate being produced compared to that obtained with the
strain CPC-PrOH1 (Figure 6B & 7B and Table 10). However, 2.32 g/L of succinate remained
unconverted and both acetate and ethanol were overproduced by the end of the fermentation
(Figure 7B). This metabolites shift caused by the disruption of the lactate synthesis pathway
suggests that the carbon flux is mainly driven toward the pyruvate catabolism rather than the
reductive arm of the TCA cycle (oxaloacetate → malate → fumarate → succinate) via the
phosphoenolpyruvate (PEP) node when using glucose as the carbon source, as lactate, acetate, and
ethanol are all produced via the pyruvate node. Again, the NADH availability might be the limiting
factor that prevents the carbon flux being driven toward the 1-propanol production via the PEP
node. While only 2 mol of NADH could be generated from each mole of glucose dissimilated via
the glycolysis pathway, the production of each mole of 1-propanol requires a net consumption of
3 mol NADH, and thus 1.5 mol of glucose are minimally required for production of each mole of
1-propanol in order to maintain the overall redox balance. Therefore, glucose is an unfavorable
substrate for 1-propanol production in our metabolically engineered propanogenic strains due to
its limited NADH-generating capacity.
Glycerol, which has a higher degree of reduction per carbon atom (κ ≈ 4.67) as compared to
the glucose (κ ≈ 4), has been extensively studied in microbial fermentations as an inexpensive
feedstock for biofuels and chemicals production during the past decade (Dharmadi et al., 2006;
Murarka et al., 2008; Ganesh et al., 2012; Bauer and Hulteberg, 2013; Mattam et al., 2013). As
illustrated in the Table 8, for each mole of glycerol converted to one mol of pyruvate or PEP, 2
mol of NADH are produced, which are twice as much of that generated from 0.5 mol of glucose.
Thus, using glycerol as the main carbon source should be able to direct more carbon flux toward
the reductive arm of the TCA cycle via the PEP node and subsequently toward the sleeping beauty
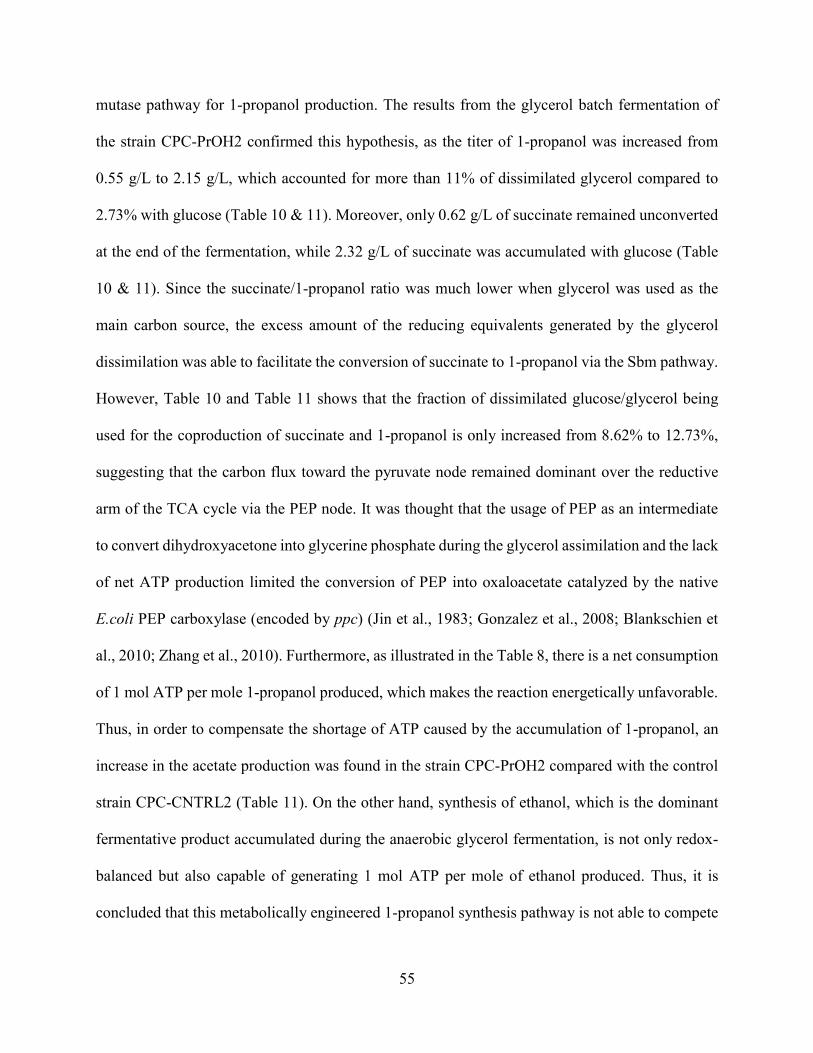
55
mutase pathway for 1-propanol production. The results from the glycerol batch fermentation of
the strain CPC-PrOH2 confirmed this hypothesis, as the titer of 1-propanol was increased from
0.55 g/L to 2.15 g/L, which accounted for more than 11% of dissimilated glycerol compared to
2.73% with glucose (Table 10 & 11). Moreover, only 0.62 g/L of succinate remained unconverted
at the end of the fermentation, while 2.32 g/L of succinate was accumulated with glucose (Table
10 & 11). Since the succinate/1-propanol ratio was much lower when glycerol was used as the
main carbon source, the excess amount of the reducing equivalents generated by the glycerol
dissimilation was able to facilitate the conversion of succinate to 1-propanol via the Sbm pathway.
However, Table 10 and Table 11 shows that the fraction of dissimilated glucose/glycerol being
used for the coproduction of succinate and 1-propanol is only increased from 8.62% to 12.73%,
suggesting that the carbon flux toward the pyruvate node remained dominant over the reductive
arm of the TCA cycle via the PEP node. It was thought that the usage of PEP as an intermediate
to convert dihydroxyacetone into glycerine phosphate during the glycerol assimilation and the lack
of net ATP production limited the conversion of PEP into oxaloacetate catalyzed by the native
E.coli PEP carboxylase (encoded by ppc) (Jin et al., 1983; Gonzalez et al., 2008; Blankschien et
al., 2010; Zhang et al., 2010). Furthermore, as illustrated in the Table 8, there is a net consumption
of 1 mol ATP per mole 1-propanol produced, which makes the reaction energetically unfavorable.
Thus, in order to compensate the shortage of ATP caused by the accumulation of 1-propanol, an
increase in the acetate production was found in the strain CPC-PrOH2 compared with the control
strain CPC-CNTRL2 (Table 11). On the other hand, synthesis of ethanol, which is the dominant
fermentative product accumulated during the anaerobic glycerol fermentation, is not only redox-
balanced but also capable of generating 1 mol ATP per mole of ethanol produced. Thus, it is
concluded that this metabolically engineered 1-propanol synthesis pathway is not able to compete
56
with the native fermentative pathway by simply switching the carbon source from glucose to
glycerol.
Fed-batch fermentation of the propanogenic strain CPC-PrOH2 using glycerol as the main
carbon source was then performed to further characterize the strain’s 1-propanol production
capacity. As shown in the Table 13, approximately 4 g/L of 1-propanol was produced from 87 g/L
of glycerol by the end of the fed-batch fermentation. However, after the Stage I, succinate started
to accumulate at a faster pace while 1-propanol production rate was decreased over time,
suggesting that the conversion of succinate into 1-propanol via the Sbm pathway was hindered. It
is reasoned that this might be due to a gradually decrease in the catalytic activity of the enzymes
encoded by the Sbm operon, as the metabolites distribution in the last stage was similar to that of
the batch fermentation of the control strain CPC-CNTRL2 (Table 8B). Although the strain CPC-
PrOH2 was constructed by introducing a low copy number plasmid (pK184) that contained an
activate Sbm operon, which should impose a minimal level of metabolic load onto the host cell as
compared to the high or middle copy number plasmids, certain amounts of cellular energy were
still required to maintain the presence and expression of the foreign plasmid in the host cell (Glick,
1995). Moreover, it was reported that the plasmid stability was sensitive to the dissolved oxygen
level, as the fluctuation in dissolved oxygen level (i.e., dissolved oxygen shock) might cause the
cell to lose the plasmid (Hopkins et al., 1987; Ryan et al., 1989; Khosravi et al., 1990). Since the
glycerol was manually added into the bioreactor by using serological pipette during the fed-batch
fermentation, the bioreactor was kept open for a few seconds during the addition of glycerol
solution, and therefore, the fresh air might be accidentally introduced into the bioreactor by either
pipetting or self-diffusion, which could potentially cause the cell culture being exposed to the
dissolved oxygen shock.
57
Thus, in order to improve the unstable performance of the propanogenic strain which is
constructed with the plasmid system, a metabolically engineered plasmid-free propanogenic strain,
CPC-PrOH3 (Srirangan et al., 2014), was then derived for glycerol fermentation. Throughout the
whole fed-batch cultivation, the glycerol dissimilation rate was greatly improved in the resulting
strain, and about 7.5 g/L of 1-propanol was produced from ~115.8 g/L of glycerol with a shorter
period of total cultivation time (210.5 h) compared with that obtained with the strain CPC-PrOH2
(245.5 h) (Table 12 & 13). These results suggest that the metabolic burden placed upon the host
cell is alleviated by applying the chromosomal engineering strategy. Further analysis of the
metabolites distribution in each specific stage shows that the catalytic activity of the enzymes
encoded by the Sbm operon are maintained throughout the whole fed-batch fermentation,
especially in the first three stages in which the fraction of dissimilated glycerol toward 1-propanol
production is even gradually increased over time. In addition, only a small amount of the succinate
remained unconverted in each specific stage, which also suggests that the native Sbm operon is
functionally expressed as expected. However, a drastic drop in the glycerol efficiency was
observed during the late stages of the cultivation, which might be related to the high-level
accumulation of both acetate and ethanol in the culture medium. It has been reported that the
accumulation of acetate to a certain level in the fermentation broth could inhibit the cell growth by
reducing the intracellular pH and forming toxic intermediate homocysteine (Luli and Strohl, 1990;
Irvine, 2005). On the other hand, the accumulation of ethanol in the medium could harm the cell
by inducing nucleotides and ion leakage which could eventually result in the cell lysis (Ingram and
Vreeland, 1980; Eaton, Tedder and Ingram, 1982; Dombek and Ingram, 1984). Thus, it is reasoned
that the cell needs to consume more carbon source and energy to maintain the cell viability under
these physiological stresses.
58
Chapter 6 Conclusions and Recommendations
Although today’s economy relies heavily on the traditional petroleum industry for our daily
energy supply, more and more novel technology have been developed and implemented to
generate energy from renewable sources, such as solar power, wind power, and nuclear power.
However, in light of the high cost, low efficiency, or high risk of utilizing these new energy
sources, it would be meaningful to produce renewable energy from agricultural and biochemical
waste though the microbial fermentation. Here, we reported a bench-scale bioreactor study for 1-
propanol production by metabolically engineered Escherichia coli strains. Two carbon sources,
glucose and glycerol, were investigated in this study. When glucose was used as the main carbon
source, by knocking out one of the genes that were involved in lactate production (ldhA), minimal
amount of lactate was produced and the level of solventogenesis was slightly enhanced, though
acetate became the dominant metabolite and large amount of succinate remained unconverted in
the culture medium. The results reveal that our metabolically engineered strain’s 1-propanol
production capacity is limited when using glucose as the main carbon source due to limited NADH
availability. Therefore, in order to facilitate the conversion of succinate into 1-propanol via the
extensive Sbm pathway, excess amount of NADH are required. When glycerol, which has a higher
degree of reduction per carbon atom compared with the glucose, was used as the main carbon
source, the 1-propanol production in our metabolically engineered strain was greatly improved and
the overall metabolite distribution shifted from acidogenesis to solventogenesis. Hence, glycerol
is a more suitable carbon source for 1-propanol production in our propanogenic E. coli strain.
During the fed-batch cultivation of our propanogenic strain with glycerol, there was an
inconsistency in 1-propanol production in later stages. The results imply that the functional
expression of the Sbm operon on a plasmid might not be stable. By inserting a strong promoter
59
upstream of the native E. coli Sbm operon, a plasmid-free propanogenic strain was derived. The
fed-batch fermentation of the resulting strain with glycerol allowed faster glycerol dissimilation
rate and higher level of 1-propanol production with a final titer of 7.52 g/L from 115.82 g/L of
glycerol.
However, the production of pyruvate derived fermentative metabolites (i.e., lactate, acetate,
and ethanol) is overwhelming during the anaerobic fermentation of both glucose and glycerol,
even with the Sbm operon being functionally expressed. Further metabolic engineering strategies
that could be employed to prevent these by-products formation include knocking out genes that
are involved in each metabolite synthesis pathway (e.g., pta, encoding phosphate acetyltransferase,
ackA, encoding acetate kinase, poxB, encoding pyruvate oxidase, and gloAB, encoding glyoxalase
I&II) and deleting genes that facilitate the conversion of PEP into acetyl-CoA via the pyruvate
intermediate (e.g., pfkFA, encoding pyruvate kinase I&II, pflB, encoding pyruvate formate-lyase,
and ptsI, encoding PTS enzyme I). On the other hand, by overexpressing ppc (encoding
phosphoenolpyruvate carboxylase) or pyc (encoding pyruvate carboxylase), which drives the
conversion of PEP or pyruvate, respectively, into the oxaloacetate, more carbon flux could be
channeled toward the reductive arm of the TCA cycle instead of the pyruvate node, so that the
production of pyruvate derived fermentative metabolites should be minimized.
Since glycerol is a superior carbon source for 1-propanol production in terms of the NADH-
generating capacity and the cost compared to the glucose, it is worthwhile to put effort into
optimizing the glycerol utilization pathways. By replacing the native E.coli dhaK gene (encoding
the PEP-dependent dihydroxyacetone kinase) with the heterologous C. freundii dhaK gene
(encoding the ATP-dependent dihydroxyacetone kinase), the PEP pool could be reserved
60
(Clomburg and Gonzalez, 2011). A similar effect could also be obtained by deleting the gldA
(encoding glycerol dehydrogenase) and dhaK (encoding dihydroxyacetone kinase).
Except for the genetic and metabolic engineering strategies, cultivation strategies, such as
medium optimization and cultivation conditions optimization, could also be explored to achieve a
higher the 1-propanol productivity and yield. It is also recommended to test the 1-propanol-
producing capacity of our metabolically engineered propanogenic strains by using other carbon
sources (e.g., crude glycerol, lignocellulose biomass, and corn), which are more economically
efficient, which has already been used or can be potentially used for the industrial-scale biological
manufacturing of biofuels, compared with the high cost cell culture grade glucose and glycerol
that are currently used in this study.
61
References
Akihiko, K., Akihiko, K., Mitsuyoshi, U., Yoshinori, M., Pilanee, V., & Warunee, T. (2009).
Production of ethanol from cassava pulp via fermentation with a surface engineered yeast
strain displaying glucoamylase. Renew Energy, 34, 1354-8.
Alam, K. Y., & Clark, D. P. (1989). Anaerobic fermentation balance of Escherichia coli as
observed by in vivo nuclear magnetic resonance spectroscopy. Journal of
Bacteriology, 171(11), 6213–6217.
Amann, E., Ochs, B., & Abel, K. J. (1988). Tightly regulated tac promoter vectors useful for the
expression of unfused and fused proteins in Escherichia coli. Gene, 69(2), 301-315.
Ammar, E. M., Wang, Z., & Yang, S. (2013). Metabolic engineering of Propionibacterium
freudenreichii for n-propanol production. Applied Microbiology and
Biotechnology, 97(10), 4677-4690.
Atsumi, S., Hanai, T., & Liao, J. C. (2008). Non-fermentative pathways for synthesis of branched-
chain higher alcohols as biofuels. Nature, 451(7174), 86-89.
Atsumi, S., & Liao, J. C. (2008). Directed evolution of methanococcus jannaschii citramalate
synthase for biosynthesis of 1-propanol and 1-butanol by Escherichia coli. Applied and
Environmental Microbiology, 74(24), 7802-7808.
Baba, T., Ara, T., Hasegawa, M., Takai, Y., Okumura, Y., Baba, M., . . . Mori, H. (2006).
Construction of Escherichia coli K-12 in-frame, single-gene knockout mutants: The keio
collection. Molecular Systems Biology, 2, 2006.0008.
Baeyens, J., Kang, Q., Appels, L., Dewil, R., Lv, Y., & Tan, T. (2015). Challenges and
opportunities in improving the production of bio-ethanol. Progress in Energy and
Combustion Science, 47, 60-88.
62
Balat, M. (2011). Production of bioethanol from lignocellulosic materials via the biochemical
pathway: A review. Energy Conversion & Management, 52(2), 858-875.
Banerjee, R. (1997). The yin-yang of cobalamin biochemistry. Chem Biol, 4, 175-186.
Bauer, F., & Hulteberg, C. (2013). Is there a future in glycerol as a feedstock in the production of
biofuels and biochemicals? Biofuels, Bioproducts and Biorefining, 7(1), 43-51.
Billa, E., Koullas, D. P., Monties, B., & Koukios, E. G. (1997). Structure and composition of sweet
sorghum stalk components. Industrial Crops and Products, 6 (3-4), 297-302.
Blankschien, M. D., Clomburg, J. M., & Gonzalez, R. (2010). Metabolic engineering of
Escherichia coli for the production of succinate from glycerol. Metabolic
Engineering, 12(5), 409-419.
Buruiana, C., Garrote, G., & Vizireanu, C. (2013). Bioethanol production from residual
lignocellulosic materials: a review - part 1. The Annals of the University of Dunarea De
Jos of Galati. Fascicle VI. Food Technology, 37(1), 9-24.
Cann, A. F. (2010). Metabolic engineering and modeling for the production of higher alcohols in
Escherichia coli (Doctoral dissertation). Available from ProQuest Dissertations & Theses
Global. (UMI No. 3405550).
Casadaban, M. J. (1976). Transposition and fusion of the lac genes to selected promoters in
Escherichia coli using bacteriophage lambda and Mu. J. Mol. Biol, 104, 541-555.
Cherepanov, P. P., & Wackernagel, W. (1995). Gene disruption in Escherichia coli: TcR and KmR
cassettes with the option of flp-catalyzed excision of the antibiotic-resistance
determinant. Gene, 158(1), 9-14.
63
Cirino, P. C., Chin, J. W., & Ingram, L. O. (2006). Engineering Escherichia coli for xylitol
production from glucose-xylose mixtures. Biotechnology and Bioengineering, 95(6),
1167-1176.
Clark, D. P. (1989). The fermentation pathways of Escherichia coli. FEMS Microbiol Rev, 63,
223–234.
Clomburg, J. M., & Gonzalez, R. (2011). Metabolic engineering of Escherichia coli for the
production of 1,2-propanediol from glycerol. Biotechnology and Bioengineering, 108, 867-
879.
Clomburg, J. M., & Gonzalez, R. (2013). Anaerobic fermentation of glycerol: a platform for
renewable fuels and chemicals. Trends Biotechnol, 31(1), 20-28.
Chang, D., Jung, H., Rhee, J. S., & Pan, J. (1999). Homofermentative production of D- or L-lactate
in metabolically engineered Escherichia coli RR1. Applied and Environmental
Microbiology, 65(4), 1384-1389.
Choi, Y. J., Park, J. H., Kim, T. Y., & Lee, S. Y. (2012). Metabolic engineering of Escherichia
coli for the production of 1-propanol. Metabolic Engineering, 14(5), 477-486.
Connor, M. R., & Liao, J. C. (2009). Microbial production of advanced transportation fuels in non-
natural hosts. Current Opinion in Biotechnology, 20(3), 307-315.
Connor, M. R. (2010). Metabolic engineering of microbial systems for the production of advanced
transportation fuels (Doctoral dissertation). Available from ProQuest Dissertations &
Theses Global. (UMI No. 3405552).
Datsenko, K. A., & Wanner, B. L. (2000). One-step inactivation of chromosomal genes in
Escherichia coli K-12 using PCR products. Proceedings of the National Academy of
Sciences of the United States of America, 97(12), 6640-6645.
64
Deng, Y., & Fong, S. S. (2011). Metabolic engineering of Thermobifida fusca for direct aerobic
bioconversion of untreated lignocellulosic biomass to 1-propanol. Metabolic
Engineering, 13(5), 570-577.
Dharmadi, Y., Murarka, A., & Gonzalez, R. (2006). Anaerobic fermentation of glycerol by
Escherichia coli: A new platform for metabolic engineering. Biotechnology and
Bioengineering, 94(5), 821-829.
Dien, B. S., Cotta, M. A., & Jeffries, T. W. (2003). Bacteria engineered for fuel ethanol production:
Current status. Applied Microbiology and Biotechnology, 63(3), 258-266.
Dombek, K. M., & Ingram, L. O. (1984). Effects of ethanol on the Escherichia coli plasma
membrane. Journal of Bacteriology, 157(1), 233-239.
Du, J. (2011). Metabolic engineering of Saccharomyces cerevisiae for efficient ethanol production
from pentose sugars (Doctoral dissertation). Available from ProQuest Dissertations &
Theses Global. (UMI No. 3601057).
Eaton, L. C., Tedder, T. F., & Ingram, L. O. (1982). Effects of fatty acid composition on the
sensitivity of membrane functions to ethanol in Escherichia coli. Substance and Alcohol
actions/misuse, 3(1-2), 77-87.
Eden, A., Van Nedervelde, L., Drukker, M., Benvenisty, N., & Debourg, A. (2001). Involvement
of branched-chain amino acid aminotransferases in the production of fusel alcohols during
fermentation in yeast. Applied Microbiology and Biotechnology, 55(3), 296-300.
Energy Information Administration. (2014). Annual energy review. Retrieved from
http://www.eia.doe.gov/totalenergy/data/annual/index.cfm
65
Environmental Protection Agency. (2015). EPA proposes renewable fuel standards for 2014, 2015,
and 2016, and the biomass-based diesel volume for 2017. Retrieved from
http://www.epa.gov/otaq/fuels/renewablefuels/documents/420f15028.pdf
Froese, D. S., Dobson, C. M., White, A. P., Wu, X., Padovani, D., Banerjee, R., . . . Gravel, R. A.
(2009). Sleeping beauty mutase (sbm) is expressed and interacts with ygfd in Escherichia
coli. Microbiological Research, 164(1), 1-8.
Ganesh, I., Ravikumar, S., & Hong, S. H. (2012). Metabolically engineered Escherichia coli as a
tool for the production of bioenergy and biochemicals from glycerol. Biotechnology and
Bioprocess Engineering: BBE, 17(4), 671-678.
Glick, B. R. (1995). Metabolic load and heterologous gene expression. Biotechnology
Advances, 13(2), 247-262.
Gonzalez, R., Murarka, A., Dharmadi, Y., & Yazdani, S. S. (2008). A new model for the anaerobic
fermentation of glycerol in enteric bacteria: Trunk and auxiliary pathways in Escherichia
coli. Metabolic Engineering, 10(5), 234-245.
Hahn-Hägerdal, B., & Pamment, N. (2004). Microbial pentose metabolism. Appl Biochem
Biotechnol, 116(1-3), 1207–1209.
Hahn-Hägerdal, B., Karhumaa. K., Larsson, C. U., Gorwa-Grauslund, M., Görgens, J., & van Zyl,
W. H. (2005). Role of cultivation media in the development of yeast strains for large scale
industrial use. Microb Cell Fact, 4, 31.
Hahn-hägerdal, B., Karhumaa, K., Fonseca, C., Spencer-martins, I., & Gorwa-grauslund, M.
(2007). Towards industrial pentose-fermenting yeast strains. Applied Microbiology and
Biotechnology, 74(5), 937-953.
66
Haller, T., Buckel, T., Rétey, J., & Gerlt, J. A. (2000). Discovering new enzymes and metabolic
pathways: Conversion of succinate to propionate by Escherichia coli.
Biochemistry, 39(16), 4622-4629.
Hanahan, D. (1983). Studies on transformation of Escherichia coli with plasmids. Journal of
Molecular Biology, 166(4), 557-580.
Harner, N. K., Wen, X., Bajwa, P. K., Austin, G. D., Ho, C., Habash, M. B., . . . Lee, H. (2015).
Genetic improvement of native xylose-fermenting yeasts for ethanol production. Journal
of Industrial Microbiology & Biotechnology, 42(1), 1-20.
Hector, R. E., Dien, B. S., Cotta, M. A., & Qureshi, N. (2011). Engineering industrial
Saccharomyces cerevisiae strains for xylose fermentation and comparison for switchgrass
conversion. Journal of Industrial Microbiology & Biotechnology, 38(9), 1193-1202.
Hopkins, D. J., Betenbaugh, M. J., & Dhurjati, P. (1987). Effects of dissolved oxygen shock on
the stability of recombinant Escherichia coli containing plasmid pKN401. Biotechnology
and Bioengineering, 29(1), 85-91.
Ingram, L. O., & Vreeland, N. S. (1980). Differential effects of ethanol and hexanol on the
Escherichia coli cell envelope. Journal of Bacteriology, 144(2), 481-488.
Irvine, H. P. (2005). A metabolic engineering approach to study overflow metabolism in E. coli
(Doctoral dissertation). Available from ProQuest Dissertations & Theses Global. (UMI No.
U592060).
Jain, R., & Yan, Y. (2011). Dehydratase mediated 1-propanol production in metabolically
engineered Escherichia coli. Microbial Cell Factories, 10, 97.
67
Jain, R., Sun, X., Yuan, Q., & Yan, Y. (2015). Systematically engineering Escherichia coli for
enhanced production of 1, 2-propanediol and 1-propanol. ACS Synthetic Biology, 4(6),
746-756.
Janssen, P. H. (2004). Propanol as an end product of threonine fermentation. Archives of
Microbiology, 182(6), 482-486.
Jeffries, T. W., & Kurtzman, C. P. (2004). Strain selection, taxonomy, and genetics of xylose-
fermenting yeasts. Enzym Microb Tech, 16, 922–932.
Jin, R. J., Tang, J., & Lin, E. (1983). Experimental evolution of a novel pathway for glycerol
dissimilation in Escherichia coli. Journal of Molecular Evolution, 19(6), 429-436.
Jin, Y. (2002). Metabolic engineering of xylose fermentation in Saccharomyces
cerevisiae (Doctoral dissertation). Available from ProQuest Dissertations & Theses
Global. (UMI No. 3072835).
Jobling, M. G., & Holmes, R. K. (1990). Construction of vectors with the pl5a replicon, kanamycin
resistance, inducible laczα and puc18 or puc19 multiple cloning sites. Nucleic Acids Res,
18, 5315-5316.
Jones, M. L., & Barnard, R. T. (2005). Chimerization of multiple antibody classes using splice
overlap extension PCR. BioTechniques, 38(2), 181-182.
Kalapos, M. P. (1999). Methylglyoxal in living organisms: chemistry, biochemistry, toxicology
and biological implications. Toxicol. Lett, 110, 145–175.
Katahira, S., Mizuike, A., Fukuda, H., & Kondo, A. (2006). Ethanol fermentation from
lignocellulosic hydrolysate by a recombinant xylose- and cellooligosaccharide-
assimilating yeast strain. Appl Microbiol Biotechnol, 72, 1136–1143.
68
Khosravi, M., Ryan, W., Webster, D. A., & Stark, B. C. (1990). Variation of oxygen requirement
with plasmid size in recombinant Escherichia coli. Plasmid, 23(2), 138-143.
Kim, Y. (2007). Metabolic engineering of Escherichia coli for ethanol production without foreign
genes (Doctoral dissertation). Available from ProQuest Dissertations & Theses Global.
(UMI No. 3299343).
Kirk, R. E & Othmer, D. F. (Eds.). (1978-1984). Encyclopedia of chemical technology (3rd ed.).
New York, NY: Wiley Interscience.
Kuhad, R. C., Gupta, R., Khasa, Y. P., Singh, A., & Zhang, Y. (2011). Bioethanol production from
pentose sugars: Current status and future prospects. Renewable & Sustainable Energy
Reviews, 15(9), 4950-4962.
Li, H., Wang, L., & Shen, L. (2010). Potential CO2 emission reduction by development of non-
grain-based bioethanol in China. Environmental Management, 46(4), 555-564.
Luli, G. W., & Strohl, W. R. (1990). Comparison of growth, acetate production, and acetate
inhibition of Escherichia coli strains in batch and fed-batch fermentations. Applied and
Environmental Microbiology, 56(4), 1004-1011.
Ma, F., & Hanna, M. A. (1999). Biodiesel production: A review. Bioresource Technology, 70(1),
1-15.
Mattam, A. J., Clomburg, J. M., Gonzalez, R., & Yazdani, S. S. (2013). Fermentation of glycerol
and production of valuable chemical and biofuel molecules. Biotechnology Letters, 35(6),
831-842.
Makrides, S. C. (1996). Strategies for achieving high-level expression of genes in Escherichia coli.
Microbiol. Rev, 60, 512-538.
69
Martinez, A., York, S. W., Yomano, L. P., Pineda, V. L., Davis, F. C., Shelton, J. C., et al. (1999).
Biosynthetic burden and plasmid burden limit expression of chromosomally integrated
heterologous genes (pdc, adhB) in Escherichia coli. Biotechnol Prog, 15, 891–897.
Mat-Jan, F., Alam, K. Y., & Clark, D. P. (1989). Mutants of Escherichia coli deficient in the
fermentative lactate dehydrogenase. Journal of Bacteriology, 171(1), 342–348.
McKie, N., Keep, N. H., Patchett, M. L., & Leadlay, P. F. (1990). Adenosylcobalamin-dependent
methylmalonyl-CoA mutase from Propionibacterium shermanii. Active holoenzyme
produced from Escherichia coli. The Biochemical Journal, 269(2), 293-298.
Miller, J. H., (1992). A short course in bacterial genetics: A laboratory manual and handbook for
Escherichia coli and related bacteria. Cold Spring Harbor Laboratory Press.
Mills, G. A., & Ecklund, E. E. (1987). Alcohols as components of transportation fuels. Annual
review of energy, 12(1), 47-80.
Murarka, A., Dharmadi, Y., Yazdani, S. S., & Gonzalez, R. (2008). Fermentative utilization of
glycerol by Escherichia coli and its implications for the production of fuels and
chemicals. Applied and Environmental Microbiology, 74(4), 1124.
Murphy, J. D., & Power, N. M. (2008). How can we improve the energy balance of ethanol
production from wheat? Fuel. 87: 1799-1806.
Nagy, M. (2009). Biofuels from lignin and novel biodiesel analysis (Doctoral dissertation).
Available from ProQuest Dissertations & Theses Global. (UMI No.
3394437).
Neidhardt, F. C., Bloch, P. L., & Smith, D. F. (1974). Culture medium for enterobacteria. J
Bacteriol, 119, 736-747.
70
Öhgren, K., Bengtsson, O., Gorwa-Grauslund, M. F., Galbe, M., HahnHägerdal, B., & Zacchi, G.
(2006). Simultaneous saccharification and co-fermentation of glucose and xylose in steam-
pretreated corn stover at high fiber content with Saccharomyces cerevisiae TMB3400. J
Biotechnol, 126(4), 488–498.
Ohta, K., Beall, D. S., Mejia, J. P., Shanmugam, K. T., & Ingram, L. O. (1991). Genetic
improvement of Escherichia coli for ethanol production: Chromosomal integration of
Zymomonas mobilis genes encoding pyruvate decarboxylase and alcohol dehydrogenase
II. Applied and Environmental Microbiology, 57(4), 893-900.
Okafor, N. (2007). Modern Industrial Microbiology and Biotechnology. Enfield, NH: Science
Publishers.
Olsson, L., Soerensen, H. R., Dam, B. P., Christensen, H., Krogh, K. M., & Meyer, A. S. (2006).
Separate and simultaneous enzymatic hydrolysis and fermentation of wheat hemicellulose
with recombinant xylose utilizing Saccharomyces cerevisiae. Appl Biochem Biotechnol,
129–132, 117–129.
Onuki, S., Koziel, J. A., van Leeuwen, J., Jenks, W. S., Grewell, D. A., & Cai, L. (2008). Ethanol
production, purification, and analysis techniques: a review. Agricultural and Biosystems
Engineering Conference Proceedings and Presentations. Paper number: 085136.
Power, N., Murphy, J. D., & McKeogh, E. (2008). What crop rotation will provide optimal first-
generation ethanol production in Ireland, from technical and economical perspective?
Renewable Energy, 33, 385-399.
Quintero, J. A., Montoya, M. I., Sanchez, O. J., Giraldo, O. H., & Cardona, C. A. (2008). Fuel
ethanol production from sugarcane and corn: Comparative analysis for a Colombian case.
Energy, 33(3), 385-399.
71
Renewable Fuels Association. (2015). 2015 Ethanol industry outlook. Retrieved from
http://ethanolrfa.3cdn.net/c5088b8e8e6b427bb3_cwm626ws2.pdf
Roels, J. A. (1983). Energetics and Kinetics in Biotechnology. Amsterdam, NY: Elsevier
Biomedical Press.
Rogers, P. L., Jeon, Y. J., Lee, K. J., & Lawford, H. G. (2007). Zymomonas mobilis for fuel ethanol
and higher value products. Advances in Biochemical Engineering/Biotechnology, 108,
263-288.
Ryan, W., Parulekar, S. J., & Stark, B. C. (1989). Expression of beta-lactamase by recombinant
Escherichia coli strains containing plasmids of different sizes--effects of pH, phosphate,
and dissolved oxygen. Biotechnology and Bioengineering, 34(3), 309-319.
Schubert, C. (2006) Can biofuels finally take center stage? Nat Biotechnol, 24, 777–784.
Sedlak, M., & Ho, N. W. (2004). Production of ethanol from cellulosic biomass hydrolysates using
genetically engineered Saccharomyces yeast capable of cofermenting glucose and xylose.
Appl Biochem Biotechnol, 113-116, 403–416.
Shen, C. R., & Liao, J. C. (2008). Metabolic engineering of Escherichia coli for 1-butanol and 1-
propanol production via the keto-acid pathways. Metabolic Engineering, 10(6), 312-320.
Shen, C. R., & Liao, J. C. (2013). Synergy as design principle for metabolic engineering of 1-
propanol production in Escherichia coli. Metabolic Engineering, 17, 12-22.
Siebert, D., & Wendisch, V. F. (2015). Metabolic pathway engineering for production of 1, 2-
propanediol and 1-propanol by Corynebacterium glutamicum. Biotechnology for
Biofuels, 8, 91.
Smit, B. A., Van Hylckama Vlieg, J. E. T., Engels, W. J. M., Meijer, L., Wouters, J. T. M., & Smit,
G. (2005). Identification, cloning, and characterization of a Lactococcus lactis branched-
72
chain alpha -keto acid decarboxylase involved in flavor formation. Applied and
Environmental Microbiology, 71(1), 303-311.
Sonderegger, M., Jeppsson, M., Larsson, C., Gorwa-Grauslund, M., Boles, E., Olsson, L., . . .
Sauer, U. (2004). Fermentation performance of engineered and evolved xylose-fermenting
Saccharomyces cerevisiae strains. Biotechnology and Bioengineering, 87(1), 90-98.
Sree, N. K., Sridhar, M., Rao, L. V., & Pandey, A. (1999). Ethanol production in solid substrate
fermentation using thermotolerant yeast. Process Biochemistry, 34(2), 115-119.
Srirangan, K., Akawi, L., Moo-Young, M., & Chou, C. P. (2012). Towards sustainable production
of clean energy carriers from biomass resources. Applied Energy, 100, 172-186.
Srirangan, K., Akawi, L., Liu, X., Westbrook, A., Blondeel, E. J., Aucoin, M. G., . . . Chou, C. P.
(2013). Manipulating the sleeping beauty mutase operon for the production of 1-propanol
in engineered Escherichia coli. Biotechnology for Biofuels, 6(1), 139.
Srirangan, K., Liu, X., Westbrook, A., Akawi, L., Pyne, M., Moo-Young, M., & Chou, C. P.
(2014). Biochemical, genetic, and metabolic engineering strategies to enhance
coproduction of 1-propanol and ethanol in engineered Escherichia coli. Appl Microbiol
Biotechnol, 1, 17.
Sukhija, K., Pyne, M., Ali, S., Orr, V., Abedi, D., Moo-Young, M., & Chou, C. P. (2012).
Developing an extended genomic engineering approach based on recombineering to
knock-in heterologous genes to Escherichia coli genome. Molecular Biotechnology, 51(2),
109-118.
Stokes, J. L. (1949). Fermentation of glucose by suspensions of Escherichia coli. Journal of
Bacteriology, 57(2), 147–158.
73
Tantirungkij, M., Izuishi, T., Seki, T., & Yoshida, T. (1994). Fed-batch fermentation of xylose by
a fast-growing mutant of xylose-assimilating recombinant Saccharomyces
cerevisiae. Applied Microbiology and Biotechnology, 41(1), 8-12.
Togna, A. P., Shuler, M. L., & Wilson, D. B. (1993). Effects of plasmid copy number and runaway
plasmid replication on overproduction and excretion of beta-lactamase from Escherichia
coli. Biotechnol. Prog, 9, 31-39.
Urano, N., Fujii, M., Kaino, H., Matsubara, M., & Kataoka, M. (2015). Fermentative production
of 1-propanol from sugars using wild-type and recombinant Shimwellia blattae. Applied
Microbiology and Biotechnology, 99(4), 2001-2008.
Villadsen, J., Nielsen, J., & Lidén, G. (2011). Bioreaction Engineering Principles (3rd ed.). New
York, NY: Springer-Verlag.
Wahlbom, C. F., Cordero Otero, R. R., van Zyl, W. H., Hahn-Hägerdal, B., & Jönsson, L. J. (2003).
Molecular analysis of a Saccharomyces cerevisiae mutant with improved ability to utilize
xylose shows enhanced expression of proteins involved in transport, initial xylose
metabolism, and the pentose phosphate pathway. Applied and Environmental
Microbiology, 69(2), 740-746.
Warnecke, T., & Gill, R. T. (2005). Organic acid toxicity, tolerance, and production in Escherichia
coli biorefining applications. Microbial Cell Factories, 4, 25.
Yu, C., Cao, Y., Zou, H., & Xian, M. (2011). Metabolic engineering of Escherichia coli for
biotechnological production of high-value organic acids and alcohols. Applied
Microbiology and Biotechnology, 89(3), 573-583.
74
Zaldivar, J., Nielsen, J., & Olsson, L. (2001). Fuel ethanol production from lignocellulose: A
challenge for metabolic engineering and process integration. Applied Microbiology and
Biotechnology, 56(1-2), 17-34.
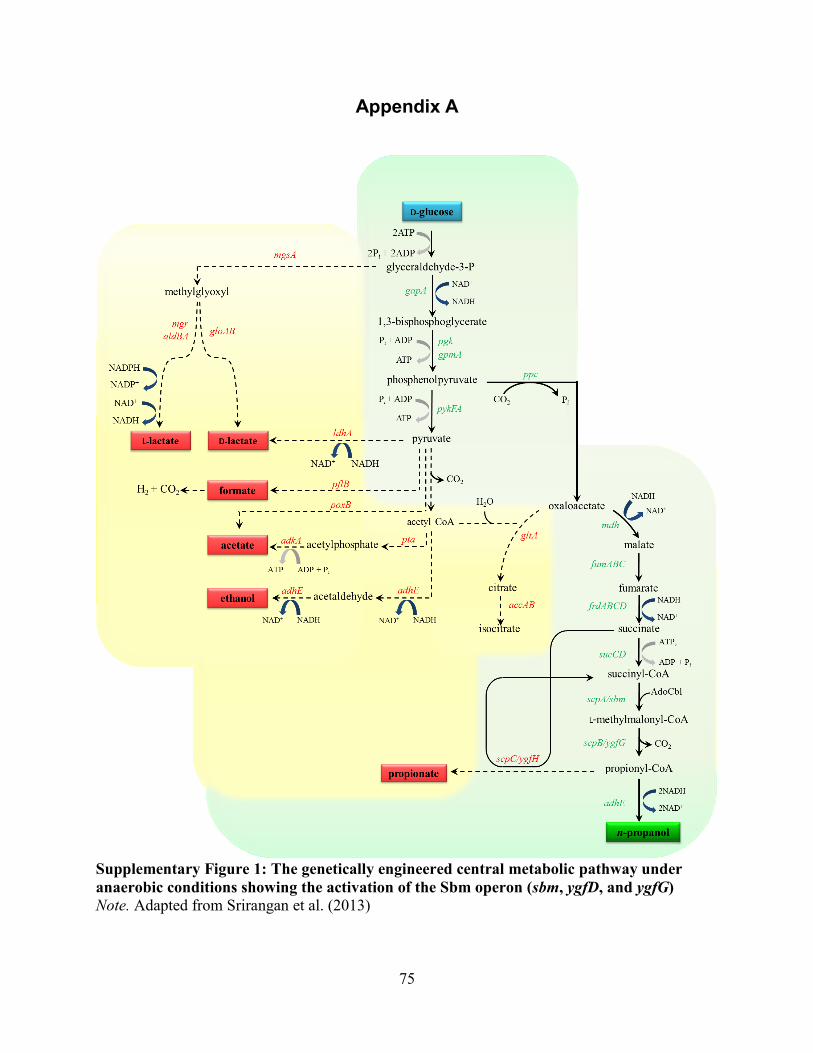
75
Appendix A
Supplementary Figure 1: The genetically engineered central metabolic pathway under
anaerobic conditions showing the activation of the Sbm operon (sbm, ygfD, and ygfG)
Note. Adapted from Srirangan et al. (2013)