Embed Size (px)
Citation preview
RESEARCH Open Access
A comprehensive metabolic profiling of themetabolically healthy obesity phenotypeVibeke H. Telle-Hansen1* , Jacob J. Christensen2,3, Gulla Aase Formo3, Kirsten B. Holven2,3 and Stine M. Ulven3
Abstract
Background: The ever-increasing prevalence of obesity constitutes a major health problem worldwide. A subgroupof obese individuals has been described as “metabolically healthy obese” (MHO). In contrast to metabolicallyunhealthy obese (MUO), the MHO phenotype has a favorable risk profile. Despite this, the MHO phenotype is stillsub-optimally characterized with respect to a comprehensive risk assessment. Our aim was to increase theunderstanding of metabolic alterations associated with healthy and unhealthy obesity.
Methods: In this cross-sectional study, men and women (18–70 years) with obesity (body mass index (BMI) ≥ 30 kg/m2) or normal weight (NW) (BMI ≤ 25 kg/m2) were classified with MHO (n = 9), MUO (n = 10) or NW (n = 11)according to weight, lipid profile and glycemic regulation. We characterized individuals by comprehensivemetabolic profiling using a commercial available high-throughput proton NMR metabolomics platform. Plasma fattyacid profile, including short chain fatty acids, was measured using gas chromatography.
Results: The concentrations of very low density lipoprotein (VLDL), intermediate density lipoprotein (IDL) and lowdensity lipoprotein (LDL) subclasses were overall significantly higher, and high density lipoprotein (HDL) subclasseslower in MUO compared with MHO. VLDL and IDL subclasses were significantly lower and HDL subclasses werehigher in NW compared with MHO. The concentration of isoleucine, leucine and valine was significantly higher inMUO compared with MHO, and the concentration phenylalanine was lower in NW subjects compared with MHO.The fatty acid profile in MHO was overall more favorable compared with MUO.
Conclusions: Comprehensive metabolic profiling supports that MHO subjects have intermediate-stagecardiovascular disease risk marker profile compared with NW and MUO subjects.
Clinical trial registration number: NCT01034436, Fatty acid quality and overweight (FO-study).
Keywords: Metabolically healthy obesity, Metabolically unhealthy obesity, Fatty acids, SCFA, Obese, Diet, Glycemicregulation, Lipoprotein, Metabolic profiling
BackgroundObesity alters the state of metabolism and physiologyleading to dyslipidemia, insulin resistance, and inflam-mation, and is therefore an important risk factor for car-diovascular diseases (CVD) and type 2 diabetes (T2D)[1]. Furthermore, estimates show that every 5 units
higher body mass index (BMI) above 25 kg/m2 is associ-ated with about 31% higher risk of premature death [2].Prevention and treatment of obesity and obesity-relateddiseases are therefore major public health challengeswhich needs to be solved. However, obesity is a hetero-geneous and complex condition and a subgroup of indi-viduals with obesity has been described to have“metabolically healthy obesity” (MHO) [3]. In contrast tometabolically unhealthy obesity (MUO), the MHOphenotype has a favorable lipid profile and a normal or
© The Author(s). 2020 Open Access This article is licensed under a Creative Commons Attribution 4.0 International License,which permits use, sharing, adaptation, distribution and reproduction in any medium or format, as long as you giveappropriate credit to the original author(s) and the source, provide a link to the Creative Commons licence, and indicate ifchanges were made. The images or other third party material in this article are included in the article's Creative Commonslicence, unless indicated otherwise in a credit line to the material. If material is not included in the article's Creative Commonslicence and your intended use is not permitted by statutory regulation or exceeds the permitted use, you will need to obtainpermission directly from the copyright holder. To view a copy of this licence, visit http://creativecommons.org/licenses/by/4.0/.The Creative Commons Public Domain Dedication waiver (http://creativecommons.org/publicdomain/zero/1.0/) applies to thedata made available in this article, unless otherwise stated in a credit line to the data.
* Correspondence: [email protected] of Health Sciences, Oslo Metropolitan University, P.O. Box 4, St.Olavsplass, 0130 Oslo, NorwayFull list of author information is available at the end of the article
Telle-Hansen et al. Lipids in Health and Disease (2020) 19:90 https://doi.org/10.1186/s12944-020-01273-z

only slightly affected insulin sensitivity, despite the simi-lar amount of body fat [3]. Weight reduction per se willimprove metabolic risk factors, but is difficult both toachieve and to maintain for a longer period. Some stud-ies have reported individuals with MHO to have anintermediate-stage risk of metabolic disorders comparedwith individuals with healthy, normal weight (NW) andMUO [4, 5], and that the MHO phenotype is associatedwith a higher risk of coronary heart disease and heartfailure than a healthy, NW phenotype [5]. Even thoughindividuals with MHO will shift towards an MUO profilewith time, a more profound understanding of the under-lying metabolic regulation in MHO and MUO is neces-sary to enhance our understanding of the developmentof metabolic dysfunction associated with obesity, andhow to prevent it with lifestyle changes.Several studies have investigated metabolites as bio-
markers of metabolic dysregulation in obesity [6–8].However, differences between subgroups of individualswith obesity, like MHO and MUO, are less investigated.A detailed study of lipoprotein metabolism and the de-tection of subtle differences in the distribution of lipo-proteins between MHO and MUO may increase ourunderstanding of the lipid metabolism in obesity, to tar-get prevention and treatment more precisely amongMUO and MHO.
MethodsOur aim was to increase the understanding of metabolicalterations associated with healthy and unhealthy obes-ity. We hypothesized that for all features associated withthe discrimination of obesity subtypes, 1) individualswith MUO would present with a more detrimentalphenotype than MHO, and 2) MHO would present witha more detrimental phenotype than NW.In this exploratory, cross-sectional study, we charac-
terized individuals with MUO, MHO and NW by com-prehensive metabolic profiling of the following systemicbiomarkers in plasma: lipoprotein subclasses, glycolysisrelated metabolites, amino acids, ketone bodies, fluidbalance, inflammatory markers, as well as fatty acid pro-file data and dietary intake data. The participants in thiscross-sectional study was initially recruited to a dietaryintervention study designed to investigate the effect ofdiglyceride oil on metabolic regulation [9], hence thedata presented in the present article are considered ex-plorative with a hypothesis generating purpose.
Study populationThe inclusion criteria for study participation were menand women with obesity (18–70 years, BMI ≥ 30 kg/m2)and has previously been described [10]. The participantswere characterized with MHO (n = 9) when at least threeout of the following five criteria were fulfilled:
Homeostasis model assessment of insulin resistance(HOMAir) index ≤ 1.95, triglyceride (TG) ≤ 1.7 mmol/L,total cholesterol ≤ 5.2 mmol/L, low-density lipoprotein(LDL)-cholesterol ≤ 2.6 mmol/L, and high density lipo-protein (HDL)-cholesterol ≥ 1.3 mmol/L. Individualswith a MUO profile (n = 10) were characterized by ful-filling at least four out of the following five criteria:HOMAir index > 1.95; TG > 1.7 mmol/L; total choles-terol > 5.2 mmol/L; LDL-cholesterol > 2.6 mmol/L andHDL-cholesterol < 1.3 mmol/L. The criteria used in thepresent study are based on the National CholesterolEducation Program’s Adult Treatment Panel III report(ATP III) for lipid profiles as previously described byKarelis et al. [3]. Furthermore, eleven individuals with ahealthy, NW phenotype (BMI ≤ 25 kg/m2) were included,characterized as healthy when at least four out of five ofthe MHO criteria were present.The study was approved by the Regional Committee of
Medical Ethics (approval no. 6.2008.1368) and by theNorwegian Social Science Data Services (approval no.19667). Written informed consent for participation wasobtained from each participant, and the study compliedwith the Declaration of Helsinki. The study was regis-tered at Clinical trials (NCT01034436).
Measurements of body compositionBMI and body composition were estimated by TanitaBC-418 bioelectric impedance analysis (BIA, 50 kHz), ahand-to-foot system, according to the manufacturer’smanual (Tanita Corporation, Tokyo, Japan), and has pre-vious been described in Telle-Hansen et al. [10]. All par-ticipants were measured while standing in a relaxedposition and with normal respiration. All participantswere routinely classified as “standard” body type.
Blood samplingParticipants were told to refrain from alcohol consump-tion and vigorous physical activity the day prior to bloodsampling. Venous blood samples were drawn after anovernight fast (12 h). Serum was obtained from silica geltubes [Becton–Dickinson (BD) vacutainer] and kept atroom temperature for at least 30 min, until centrifuga-tion (1500 g, 12 min). Serum was kept at roomtemperature and immediately prepared for subsequentanalysis of routine laboratory analyses or aliquoted andstored at − 80 °C until further analyses. Plasma was ob-tained from EDTA tubes (BD vacutainer), immediatelyplaced on ice and centrifuged within 10 min (1500 g,4 °C, 10 min). Plasma samples were aliquoted and storedat − 80 °C until further analyses.
Routine laboratory analysisFasting serum total cholesterol, LDL-cholesterol, HDL-cholesterol, TG, glucose, insulin, and HbA1c were
Telle-Hansen et al. Lipids in Health and Disease (2020) 19:90 Page 2 of 12
measured by standard methods at Oslo University Hos-pital, Norway.
Plasma fatty acid profile and short chain fatty acidsFasting EDTA plasma fatty acid profile was measuredwith gas chromatography (GC-MS (short-chain fattyacids (SCFA)) and GC-FID (fatty acids)) using a com-mercial laboratory (Vitas Analytical Service, Oslo,Norway). The concentration of the individual fatty acidswas measured as μg fatty acid/ml plasma and presentedas percentage of total fatty acids.
NMR spectroscopyMetabolic biomarkers were quantified from fastingEDTA plasma using a commercially available high-throughput proton NMR metabolomics platform (Night-ingale Health Ltd., Helsinki, Fin), giving a snapshot ofsystemic metabolism. This method quantifies lipoproteinsubclass profile with lipid concentrations within fourteensubclasses, abundant proteins and various low-molecular-weight metabolites. Details of the experimen-tation and applications of the NMR metabolomicsplatform have been described previously [11]. The four-teen lipoprotein subclass sizes were defined by theiraverage diameter, as follows: extremely large (XXL) verylow density lipoprotein (VLDL)/chylomicrons (> 75 nm),extra-large (XL), large (L), medium (M), small (S), andextra-small (XS) VLDL (64.0, 53.6, 44.5, 36.8 and 31.3nm), intermediate lipoprotein IDL (28.6 nm), L, M, andS LDL subclasses (25.5, 23.0 and 18.7 nm), and XL, L,M, and S HDL subclasses (14.3, 12.1, 10.9 and 8.7 nm).The following components of the lipoprotein subclasseswere quantified: phospholipids (PL), cholesterol, choles-teryl esters (CE), free cholesterol (FC) and TG. Themean size for VLDL, LDL and HDL particles was calcu-lated by weighting the corresponding subclass diameterswith their particle concentrations.
Dietary registrationAll participants with obesity were invited to complete afour-day, pre-coded food diary, in which fifteen partici-pants (6 MHO and 9 MUO) completed the registration.The diary included > 270 food items grouped togetheraccording to the typical Norwegian meal pattern [12].Each food group was supplemented with open-ended al-ternatives. Along with the food diary, each participantreceived a validated photography booklet that containedthirteen series of colored photographs, each with fourdifferent portion sizes ranging from small to large. Foodamounts were estimated in predefined household units(e.g. glasses, pieces or tablespoons) or from photographs.The diaries were scanned using the Teleform program,version 6.0 (InfoShare Solutions AS). Daily intake of en-ergy and macronutrients was computed using the
Norwegian food database and software system KBS(KBS, version 7), developed at the Department of Nutri-tion, University of Oslo, Norway.
Statistics and bioinformatics analysesToolsAll data analyses were performed in R version 3.6.0using R Studio version 1.2.1335. In this section, we referto packages and specific functions where relevant in thefollowing format: package::function (settings). Note thatsettings that deviate from the default are noted inparentheses.
Exploratory data analysesTo get an impression of the data types and their un-supervised separation of group affiliation, we performedprincipal component analyses (PCA) for each data type(stats::prcomp (scale = TRUE)). Note that we normalizedall variables prior to running the analysis. We visualizedPC1 and PC2 in scatter plots, highlighting group and ex-plained variance for each component.
Pre-processingTo optimize downstream modeling, we pre-processedthe data. All skewed variables (e1071::skewness (na.rm. =TRUE) lower than − 1 or higher than 1 were trans-formed using Box-Cox transformation (caret::BoxCox-Trans (na.rm. = TRUE)). Next, we normalized allvariables (stats::scale), both un-transformed and trans-formed variables, to mean = 0 and SD = 1, making themdirectly comparable in the same downstream forest plotvisualization. These pre-processing steps were performedfor MHO and MUO combined, and for MHO and NWcombined.
Linear regression modelsWe performed linear models using stats::lm, and re-trieved all relevant coefficients using broom::tidy (con-f.int = TRUE). We compared MUO vs MHO and NW vsMHO in separate models, and we performed the analysisusing various adjustment levels, including 1) no covari-ates, 2) age, 3) gender, 4) age and gender, and 5) age*-gender (interaction). Since there was little or nodiscrepancy between the different adjustment levels, wereport group estimates and associated uncertainty mea-sures and P values adjusted for age and gender.
ResultsCharacteristics of the participantsData from thirty participants (n = 18 males/12 females)was available for this study and the sample populationhas been described before [10]. The mean age was 49years (range 42–63 years; MHO, n = 9), 52 years (43–59years; MUO, n = 10) and 47 years (42–54 years; NW, n =
Telle-Hansen et al. Lipids in Health and Disease (2020) 19:90 Page 3 of 12

11) with a BMI of 33 (30–37 kg/m2), 32 (30–34 kg/m2)and 23 (21–24 kg/m2), respectively [10].
Principal component analysisFirst, we analyzed the variability among the groups usingPCA by either clinical data, different metabolites (par-ticle concentrations of lipoprotein subclasses, glycolysisrelated metabolites, amino acids, ketone bodies, fluidbalance markers, and inflammatory markers), as well asplasma fatty acid composition and dietary intake (Add-itional file 1). The three groups were fairly well separatedfor the two former data types; MUO and MHO groupswere also well separated by fatty acids but not by dietaryintake. This indicates that all except the diet show anunsupervised ability to discriminate between the studygroups.
Particle concentration of lipoprotein subclassesAlthough individuals with MHO have a favorable clinicallipid phenotype based on the definition of MHO, theiratherogenic lipoprotein profile is poorly characterized.Here we found that MUO and NW present with a morerisk-prone and healthy atherogenic lipoprotein profile,respectively, compared with MHO (Fig. 1).Due to the definition used to characterize the obesity
phenotypes, the MUO and MHO groups would differ incholesterol and TG levels; the lipoprotein profilingshowed that this difference is mediated by significanthigher or lower concentration of the whole spectrum ofVLDL particles, IDL and L-LDL, ApoB, TG and PL, inthe MUO and NW groups, compared with the MHOgroup, respectively. Interestingly, the largest HDL
Fig. 1 Atherogenic lipoprotein particles were increased in MUO, andreduced in NW, compared with MHO. The forest plot displays the βregression coefficients (mean difference) and 95% confidenceinterval for MUO vs MHO subjects (circles) and NW vs MHO subjects(squares). Estimates on the right and left side of the zero-linetranslates to higher and lower than MHO subjects, respectively. Colordenotes nominal significance level. Abbreviations: ApoA-I,Apolipoprotein A-I; ApoB-ApoA-I ratio, Ratio of apolipoprotein B toapolipoprotein A-I; ApoB, Apolipoprotein B; Est-C, Esterifiedcholesterol; Free-C, Free cholesterol; HDL-C, Total cholesterol in HDL;HDL-TG, Triglycerides in HDL; HDL, High-density lipoprotein; HDL2-C,Total cholesterol in HDL2; HDL3-C, Total cholesterol in HDL3; IDL,Intermediate-density lipoprotein; L, Large; LDL-C, Total cholesterol inLDL; LDL-TG, Triglycerides in LDL; LDL, Low-density lipoprotein; M,Medium; MHO, Metabolically healthy obese subjects; MUO,Metabolically unhealthy obese subjects; NW, Normal weight subjects;PC-cholines, Phosphatidylcholine and other cholines; Remnant-C,Remnant cholesterol (non-HDL, non-LDL -cholesterol); S, Small;SphingoM, Sphingomyelins; T-cholines, Total cholines; T-PG, Totalphosphoglycerides; TC, Serum total cholesterol; TG-PG ratio, Ratio oftriglycerides to phosphoglycerides; TG, Serum total triglycerides;VLDL-C, Total cholesterol in VLDL; VLDL-TG, Triglycerides in VLDL;VLDL, Very low-density lipoprotein; XL, Extra-large; XS, Extra-small;XXL, Extremely large
Telle-Hansen et al. Lipids in Health and Disease (2020) 19:90 Page 4 of 12
particles and ApoA-I followed the same pattern: theywere significantly higher and lower in NW and MUO,respectively, compared with MHO.Furthermore, the absolute level (but not relative level)
of various lipid types (PL, total cholesterol, CE, FC andTG) in the different lipoprotein subclasses (VLDL, IDL,LDL and HDL) were overall higher in MUO and lowerin NW, compared with MHO (Regression estimates inAdditional file 2; raw data in Additional file 3).
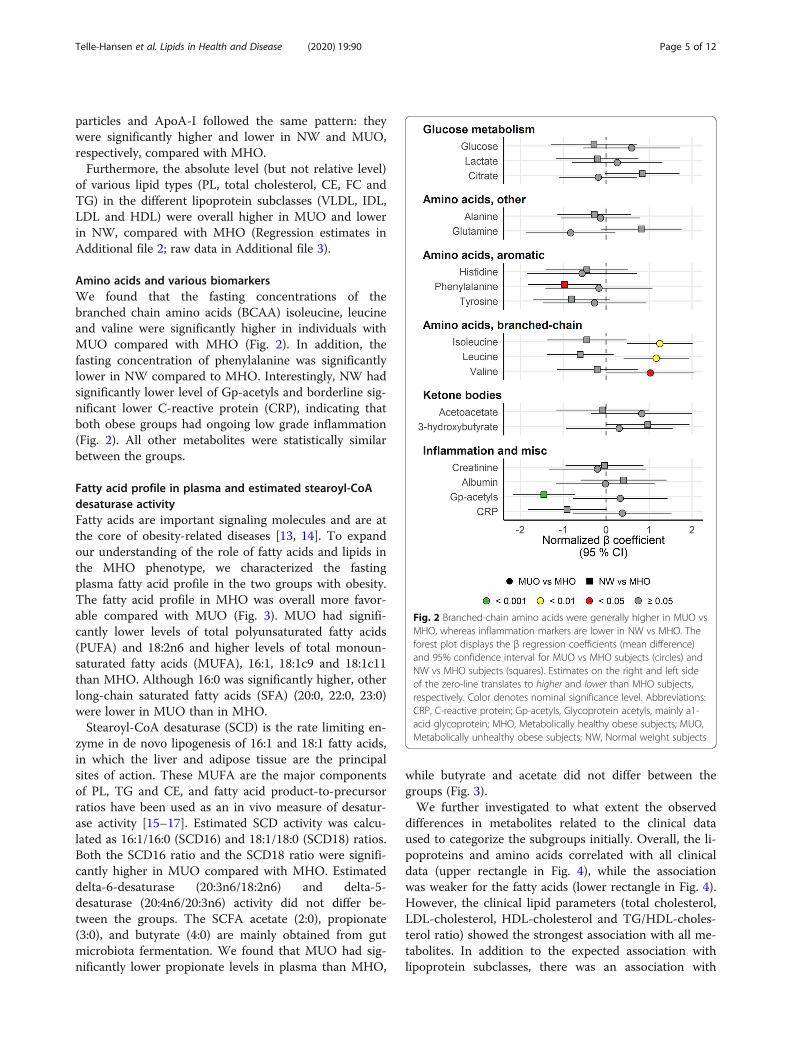
Amino acids and various biomarkersWe found that the fasting concentrations of thebranched chain amino acids (BCAA) isoleucine, leucineand valine were significantly higher in individuals withMUO compared with MHO (Fig. 2). In addition, thefasting concentration of phenylalanine was significantlylower in NW compared to MHO. Interestingly, NW hadsignificantly lower level of Gp-acetyls and borderline sig-nificant lower C-reactive protein (CRP), indicating thatboth obese groups had ongoing low grade inflammation(Fig. 2). All other metabolites were statistically similarbetween the groups.
Fatty acid profile in plasma and estimated stearoyl-CoAdesaturase activityFatty acids are important signaling molecules and are atthe core of obesity-related diseases [13, 14]. To expandour understanding of the role of fatty acids and lipids inthe MHO phenotype, we characterized the fastingplasma fatty acid profile in the two groups with obesity.The fatty acid profile in MHO was overall more favor-able compared with MUO (Fig. 3). MUO had signifi-cantly lower levels of total polyunsaturated fatty acids(PUFA) and 18:2n6 and higher levels of total monoun-saturated fatty acids (MUFA), 16:1, 18:1c9 and 18:1c11than MHO. Although 16:0 was significantly higher, otherlong-chain saturated fatty acids (SFA) (20:0, 22:0, 23:0)were lower in MUO than in MHO.Stearoyl-CoA desaturase (SCD) is the rate limiting en-
zyme in de novo lipogenesis of 16:1 and 18:1 fatty acids,in which the liver and adipose tissue are the principalsites of action. These MUFA are the major componentsof PL, TG and CE, and fatty acid product-to-precursorratios have been used as an in vivo measure of desatur-ase activity [15–17]. Estimated SCD activity was calcu-lated as 16:1/16:0 (SCD16) and 18:1/18:0 (SCD18) ratios.Both the SCD16 ratio and the SCD18 ratio were signifi-cantly higher in MUO compared with MHO. Estimateddelta-6-desaturase (20:3n6/18:2n6) and delta-5-desaturase (20:4n6/20:3n6) activity did not differ be-tween the groups. The SCFA acetate (2:0), propionate(3:0), and butyrate (4:0) are mainly obtained from gutmicrobiota fermentation. We found that MUO had sig-nificantly lower propionate levels in plasma than MHO,
while butyrate and acetate did not differ between thegroups (Fig. 3).We further investigated to what extent the observed
differences in metabolites related to the clinical dataused to categorize the subgroups initially. Overall, the li-poproteins and amino acids correlated with all clinicaldata (upper rectangle in Fig. 4), while the associationwas weaker for the fatty acids (lower rectangle in Fig. 4).However, the clinical lipid parameters (total cholesterol,LDL-cholesterol, HDL-cholesterol and TG/HDL-choles-terol ratio) showed the strongest association with all me-tabolites. In addition to the expected association withlipoprotein subclasses, there was an association with
Fig. 2 Branched-chain amino acids were generally higher in MUO vsMHO, whereas inflammation markers are lower in NW vs MHO. Theforest plot displays the β regression coefficients (mean difference)and 95% confidence interval for MUO vs MHO subjects (circles) andNW vs MHO subjects (squares). Estimates on the right and left sideof the zero-line translates to higher and lower than MHO subjects,respectively. Color denotes nominal significance level. Abbreviations:CRP, C-reactive protein; Gp-acetyls, Glycoprotein acetyls, mainly a1-acid glycoprotein; MHO, Metabolically healthy obese subjects; MUO,Metabolically unhealthy obese subjects; NW, Normal weight subjects
Telle-Hansen et al. Lipids in Health and Disease (2020) 19:90 Page 5 of 12
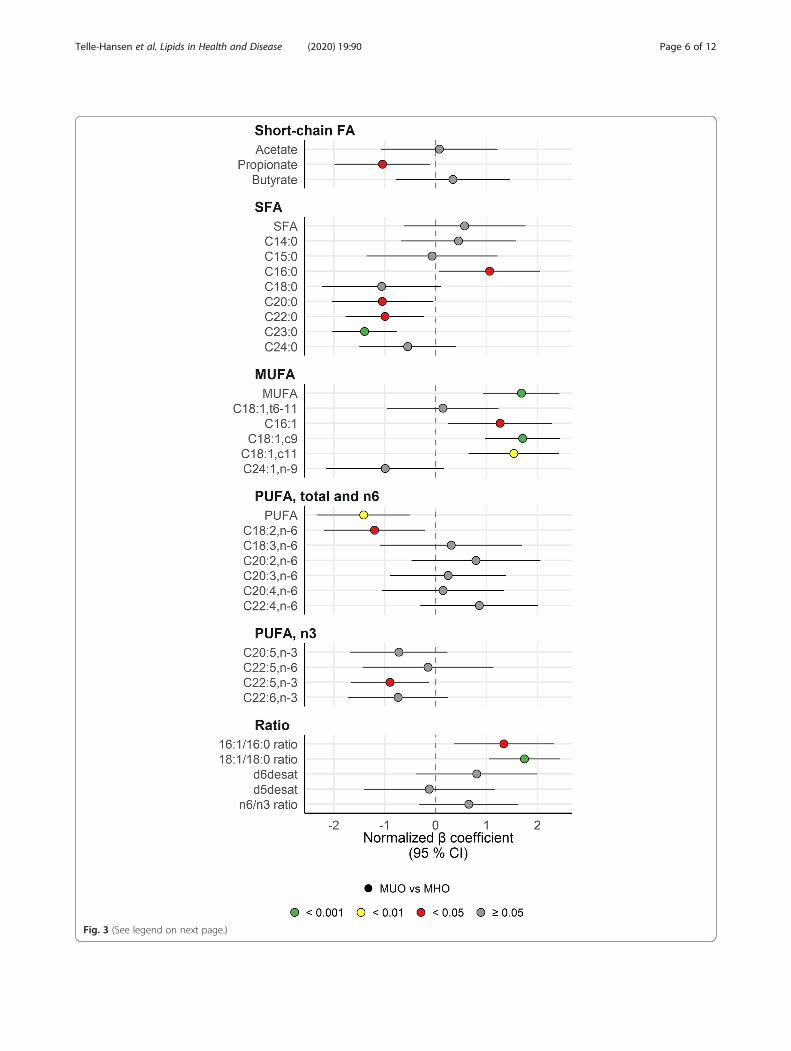
Fig. 3 (See legend on next page.)
Telle-Hansen et al. Lipids in Health and Disease (2020) 19:90 Page 6 of 12

TG/PG ratio, amino acids, GP-acetyls, and fatty acids.We have previously shown that the systemic concentra-tion of the liver enzyme gamma-glutamyltransferase(gGT) is different in MHO and MUO [10]. In thepresent study, we found that gGT was associated withthe lipoprotein subclasses and amino acids. Althoughweak, there was also an association between gGT andSFA. However, while there was a positive associationwith 16:0, the long-chain SFA (20:0, 22:0, 23:0) were allnegatively associated with gGT. This pattern was alsoreflected for the other liver markers and the SFA.HbA1c, on the other hand, showed a positive correlationwith the long chain PUFA 22:5n3, but none of the otherfatty acids. Adiponectin, but not resistin and leptin,negatively correlated to the BCAA, Gp-acetyls and lipo-protein subclasses except for HDL. While fat free mass,waist and waist-to-hip ratio were positively associatedwith VLDL, IDL and LDL subclasses, and negatively as-sociated with HDL subclasses, there was no associationwith waist (Fig. 4).
DietThe MHO phenotype could possibly be explained bylifestyle, for example that some individuals with obes-ity eat a healthier diet than others. However, wefound no differences in energy percent (E %), gramsor kilojoule of total energy intake, fat, protein, carbo-hydrates or alcohol between the MHO and MUO;also, there were no differences in specific aggregatedfood groups (Additional figure 4).
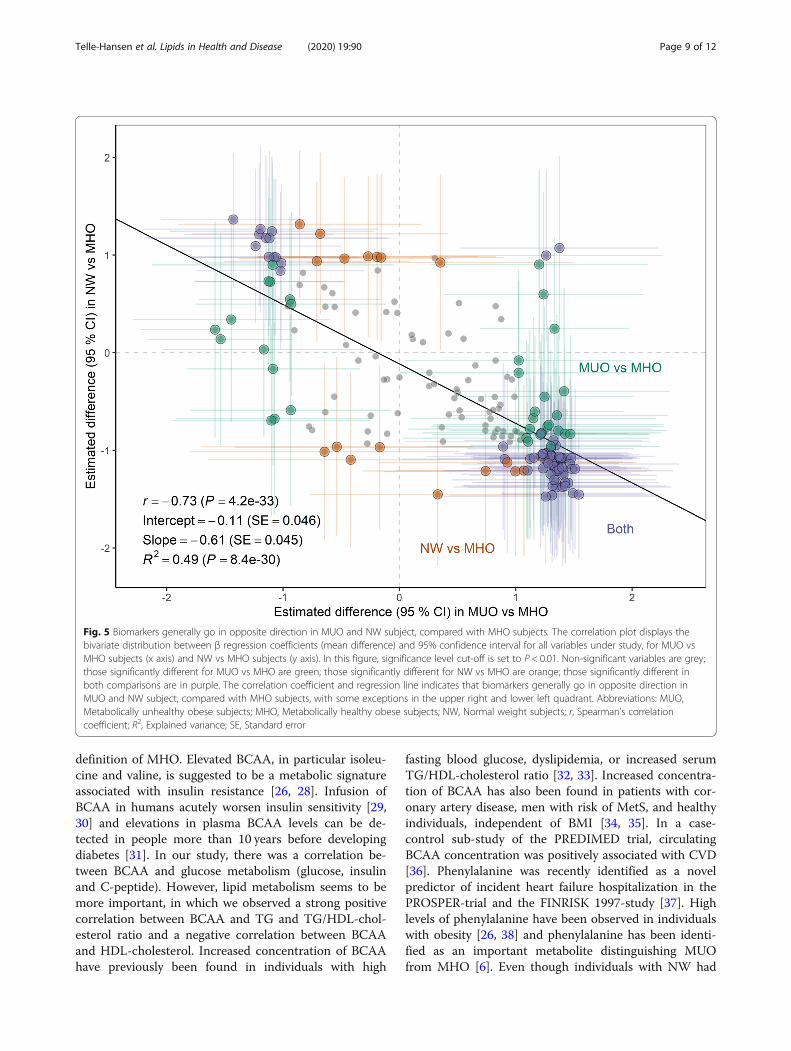
MHO as an intermediate-stage risk group between MUOand NWTo examine whether the MHO phenotype robustly cor-responds to a midpoint between the MUO and NW phe-notypes, we associated the respective group effectestimates for all variables where we had data for all threegroups (Fig. 5). Indeed, biomarkers generally went in theopposite direction in MUO and NW, compared withMHO. Markers that were higher in MUO were generallylower in NW, and opposite, with some exceptions.
DiscussionIn the present study, using a comprehensive metabolicprofiling approach, we report a panel of plasma bio-markers that associated with the degree of obesity-relatedclinical sequelae that make up the MUO and MHO sub-types. Our findings support that individuals with MHOphenotype have an intermediate-stage of CVD risk profilethat is between MUO and NW phenotypes.In the FINRISK cohort study, all VLDL, IDL, and LDL
subclasses were associated with higher risk of future car-diovascular events, whereas the L- and M-HDL sub-classes were associated with lower risk [18]. This is inline with our study, where NW had lower concentrationand MUO higher concentration of all VLDL, IDL andLDL subclasses compared with MHO. Traditionally,obesity has been considered to induce insulin resistancefollowed by hyperlipidemia. However, another hypoth-esis suggested that hyperlipidemia (elevated fasting andpost-prandial plasma VLDL remnants) is present priorto obesity and insulin resistance [19, 20]. In our study,individuals with MUO phenotype have higher concen-tration of VLDL and VLDL remnant particles comparedwith MHO phenotype. Furthermore, remnant particlesincluding VLDL are synthesized with ApoB. In our studyApoB is higher in individuals with MUO and lower inNW compared with MHO. Increased levels of ApoB ispositively associated with dyslipidemia and metabolicsyndrome (MetS) [21] and is an important risk factor foratherosclerosis and CVD [22]. Taken together, the ob-served differences in VLDL, IDL and LDL subclassesand ApoB may suggest that individuals with MHO havean intermediate-stage risk of CVD compared with NWand MUO.We found no differences in plasma levels of sphingo-
myelins and phosphatidylcholine among the three differ-ent subgroups. Others have measured this in visceraladipose tissue and found higher levels of sphingomyelinsand sphingolipids ceramides in MUO compared withMHO and NW [23]. Serum levels of sphingomyelin andceramide species with distinct saturated acyl chains wereassociated with obesity and correlated with insulin sensi-tivity, liver function and atherogenic dyslipidemia [24].
(See figure on previous page.)Fig. 3 MUFAs were higher, whereas other fatty acids were lower in MUO subjects. The forest plot displays the β regression coefficients (meandifference) and 95% confidence interval for MUO vs MHO subjects (circles). Estimates on the right and left side of the zero-line translates tohigher and lower than MHO subjects, respectively. Color denotes nominal significance level. Abbreviations: 16:1/16:0 ratio, Ratio of palmitoleic acidto palmitic acid; 18:1/18:0 ratio, Ratio of oleic acid to stearic acid; Acetate, Acetate; Butyrate, Butyrate; C14:0, Myristic acid; C15:0, Pentadecylic acid;C16:0, Palmitic acid; C16:1, Palmitoleic acid; C18:0, Stearic acid; C18:1,c11, NA; C18:1,c9, Oleic acid; C18:1,t6–11, Vaccenic acid; C18:2,n-6, Linoleicacid (LA); C18:3,n-6, Gamma-Linolenic acid (GLA); C20:0, Arachidic acid; C20:2,n-6, Dihomolinoleic acid; C20:3,n-6, Dihomo-γ-linolenic acid; C20:4,n-6, Arachidonic acid (AA); C20:5,n-3, Eicosapentaenoic acid (EPA); C22:0, Behenic acid; C22:4,n-6, Adrenic acid (AdA); C22:5,n-3, Docosapentaenoicacid (DPA); C22:5,n-6, Docosapentaenoic acid (Osbond acid); C22:6,n-3, Docosahexaenoic acid (DHA); C23:0, Tricosylic acid; C24:0, Lignoceric acid;C24:1,n-9, Nervonic acid; d5desat, Delta 5-desaturase; d6desat, Delta 6-desaturase; MHO, Metabolically healthy obese subjects; MUFA,Monounsaturated fatty acids; MUO, Metabolically unhealthy obese subjects; n6/n3 ratio, NA; Propionate, Propionate; PUFA, Polyunsaturated fattyacids; SFA, Saturated fatty acids
Telle-Hansen et al. Lipids in Health and Disease (2020) 19:90 Page 7 of 12

Since we have measured total plasma levels of sphingo-myelins and phosphatidylcholine, we cannot distinguishbetween the compositions of fatty acids on these lipids,but this is something to explore further in future studies.Amino acids, and in particular BCAA, are associated
with obesity and risk of T2D [25, 26]. We found that theBCAA isoleucine, leucine and valine were higher in
MUO, while the aromatic amino acid phenylalanine waslower in NW, compared with MHO. In line with our re-sults, Chen et al. demonstrated increased levels of theBCAA valine and isoleucine in MUO compared withMHO [6]. However, Kim et al. did not find any differ-ences in amino acids between MHO and MUO [27].This discrepancy might be due to the lack of a unison
Fig. 4 Biological markers differentially regulated in MUO, MHO and NW subjects associate with a number of clinical variables, especially bodycomposition- and lipid-related. The heatmap displays Spearman’s rho (ρ) correlation coefficient for clinical variables (x axis) vs significant variables(y axis), as seen in Figs. 1, 2 and 3. Correlations were calculated using all three groups combined. Abbreviations: 16:1/16:0 ratio, Ratio ofpalmitoleic acid to palmitic acid; 18:1/18:0 ratio, Ratio of oleic acid to stearic acid; ALAT, Alanine aminotransferase; ALP, Alkaline phosphatase;ApoA-I, Apolipoprotein A-I; ApoB-ApoA-I ratio, Ratio of apolipoprotein B to apolipoprotein A-I; ApoB, Apolipoprotein B; ASAT, Aspartateaminotransferase; BMI, Body mass index; C16:0, Palmitic acid; C16:1, Palmitoleic acid; C18:1,c11, NA; C18:1,c9, Oleic acid; C18:2,n-6, Linoleic acid(LA); C20:0, Arachidic acid; C22:0, Behenic acid; C22:5,n-3, Docosapentaenoic acid (DPA); C23:0, Tricosylic acid; CRP, C-reactive protein; gGT,gamma-Glutamyltransferase; Gp-acetyls, Glycoprotein acetyls, mainly a1-acid glycoprotein; HbA1c, Glycated hemoglobin A1c; HDL-C, HDLcholesterol; HDL-C, Total cholesterol in HDL; HDL-TG, Triglycerides in HDL; HDL, high-density lipoprotein; HDL2-C, Total cholesterol in HDL2; Hip-c,Hip circumference; IDL, Intermediate-density lipoprotein; Isoleucine, Isoleucine; L, Large; LDL-C, LDL cholesterol; LDL-TG, Triglycerides in LDL; LDL,low-density lipoprotein; Leucine, Leucine; M, Medium; MHO, Metabolically healthy obese subjects; MUFA, Monounsaturated fatty acids; MUO,Metabolically unhealthy obese subjects; Phenylalanine, Phenylalanine; Propionate, Propionate; PUFA, Polyunsaturated fatty acids; NW, normalweight subjects; Remnant-C, Remnant cholesterol (non-HDL, non-LDL -cholesterol); S, Small; TC, Total cholesterol; TG-PG ratio, Ratio oftriglycerides to phosphoglycerides; TG, Serum total triglycerides; TG, Triglycerides; Valine, Valine; VLDL-C, Total cholesterol in VLDL; VLDL-TG,Triglycerides in VLDL; VLDL, Very low-density lipoprotein; Waist-c, Waist circumference; WH ratio, Waist-hip ratio; XL, Extra-large; XS, Extra-small;XXL, Extremely large
Telle-Hansen et al. Lipids in Health and Disease (2020) 19:90 Page 8 of 12
definition of MHO. Elevated BCAA, in particular isoleu-cine and valine, is suggested to be a metabolic signatureassociated with insulin resistance [26, 28]. Infusion ofBCAA in humans acutely worsen insulin sensitivity [29,30] and elevations in plasma BCAA levels can be de-tected in people more than 10 years before developingdiabetes [31]. In our study, there was a correlation be-tween BCAA and glucose metabolism (glucose, insulinand C-peptide). However, lipid metabolism seems to bemore important, in which we observed a strong positivecorrelation between BCAA and TG and TG/HDL-chol-esterol ratio and a negative correlation between BCAAand HDL-cholesterol. Increased concentration of BCAAhave previously been found in individuals with high
fasting blood glucose, dyslipidemia, or increased serumTG/HDL-cholesterol ratio [32, 33]. Increased concentra-tion of BCAA has also been found in patients with cor-onary artery disease, men with risk of MetS, and healthyindividuals, independent of BMI [34, 35]. In a case-control sub-study of the PREDIMED trial, circulatingBCAA concentration was positively associated with CVD[36]. Phenylalanine was recently identified as a novelpredictor of incident heart failure hospitalization in thePROSPER-trial and the FINRISK 1997-study [37]. Highlevels of phenylalanine have been observed in individualswith obesity [26, 38] and phenylalanine has been identi-fied as an important metabolite distinguishing MUOfrom MHO [6]. Even though individuals with NW had
Fig. 5 Biomarkers generally go in opposite direction in MUO and NW subject, compared with MHO subjects. The correlation plot displays thebivariate distribution between β regression coefficients (mean difference) and 95% confidence interval for all variables under study, for MUO vsMHO subjects (x axis) and NW vs MHO subjects (y axis). In this figure, significance level cut-off is set to P < 0.01. Non-significant variables are grey;those significantly different for MUO vs MHO are green; those significantly different for NW vs MHO are orange; those significantly different inboth comparisons are in purple. The correlation coefficient and regression line indicates that biomarkers generally go in opposite direction inMUO and NW subject, compared with MHO subjects, with some exceptions in the upper right and lower left quadrant. Abbreviations: MUO,Metabolically unhealthy obese subjects; MHO, Metabolically healthy obese subjects; NW, Normal weight subjects; r, Spearman’s correlationcoefficient; R2, Explained variance; SE, Standard error
Telle-Hansen et al. Lipids in Health and Disease (2020) 19:90 Page 9 of 12

lower levels than MHO did, we did not find differencesin phenylalanine between MUO and MHO. In line withprevious studies, our results indicate that amino acidmetabolism is differently regulated in people with nor-mal weight and obesity however, there are also differ-ences according to obesity phenotype.Obesity and cardio-metabolic disorders associate with
chronic low-grade inflammation [39]. We found no dif-ference in CRP levels between the groups with obesity(adjusted for age and sex), although NW had lowerlevels of CRP compared with MHO. However, the in-flammatory marker glycoprotein acetyls was decreasedin NW compared with MHO, while there were no differ-ences between MHO and MUO. The concentration ofglycoprotein acetyls reflects the amount of N-acetylgroups in circulating glycoproteins involved in acute-phase inflammatory responses. Glycoprotein acetyls isassociated with different inflammatory markers (such asIL-6, TNFa, fibrinogen and CRP) and are considered abiomarker of systemic inflammation and subclinical vas-cular inflammation [40]. Lawler et al. quantified glyco-protein acetyls in the Women’s Health Study and founda positive association with longitudinal risk of all-cause,cardiovascular and cancer mortality risk in initiallyhealthy women [41]. These results suggest that obesity-related inflammation is present in both MHO and MUOphenotypes.Serum fatty acid composition is shown to be associ-
ated with obesity [42]. Total plasma MUFA was higherand total PUFA and linoleic acid (18:2n6) were lower inthe MUO compared with MHO. These results are inline with the FINRISK study [18] where they found thathigher plasma levels of MUFA were associated with in-creased cardiovascular risk, while higher omega-6 fattyacids and docosahexaenoic acid (DHA) levels were asso-ciated with lower risk. They concluded that low PUFAand high MUFA levels are biomarkers for future cardio-vascular risk [18]. In the NHANES-study, they foundthat high plasma concentrations of SFA and MUFA wereassociated with elevated HbA1c and fasting plasma glu-cose levels [43]. In our study there was a positive correl-ation between HbA1c and 22:5n3. Furthermore, in thePREDIMED study, they investigated the cross-sectionalfatty acid profile in individuals with MetS versus non-MetS [44]. Their results showed the same pattern; sub-jects with MetS had higher levels of SFA (14:0 and 16:0)in plasma and lower levels of PUFA, in particular LA(18:2n6) [44].The SCD enzyme catalyzes the synthesis of MUFA
(16:1 and 18:1) from SFA (16:0 and 18:0), and the activ-ity may be estimated by product-to-precursor ratios(SCD16 and SCD18, respectively) [15–17]. Increased es-timated SCD activity has been associated with metabolicdysfunction, like insulin resistance and body fat mass in
both animal and human studies [45]. We found thatboth SCD16 and SCD18 were increased in MUO com-pared with MHO. However, 18:1 is known to be moreabundant in the diet and the high SCD18 in MUO maysimply be a reflection of dietary differences. EstimatedSCD activity was also measured in the PREDIMED study[44]; however, they found no difference in the SCD18 ra-tio and a higher SCD16 ratio in individuals with MetScompared to non-MetS [44]. In a study by Zhao et al.,they investigated if free fatty acid ratios could predictthe transition from MHO to MUO phenotype. Theyfound that a high SCD18 ratio in MHO at baseline waspredictive of a conversion to MUO after a 10 yearsfollow-up [46]. The activity of the SCD enzyme is af-fected by different factors, including the diet, and PUFAhave been shown to be inhibitors of the enzyme [47].We have previously shown a negative correlation be-tween estimated SCD18 activity and the concentrationof PUFA in plasma (eicosapentaenoic acid (EPA) andDHA), and a corresponding reduction in plasma TG inNW, healthy individuals [17]. This is in line with thepresent results where MUO have lower levels of PUFAand higher estimated SCD activity compared with MHO.Limitations of the present study include the low num-
ber of participants and that it was initially designed forother purposes than metabolic profiling. Also, cross-sectional studies are observational by nature and cannever draw conclusions about causal relationships.Strengths of the study include detailed profiling acrossmultiple metabolic pathways in subgroups with obesityand NW.
ConclusionsIn summary, comprehensive metabolic profiling sup-ports that individuals with MHO phenotype haveintermediate-stage cardiovascular disease risk profilecompared with NW and MUO. Such a detailed profilingof obesity phenotypes may lead to earlier and more ac-curate identification of individuals at high cardio-metabolic disease risk, facilitating better preventivestrategies.
Supplementary informationSupplementary information accompanies this paper at https://doi.org/10.1186/s12944-020-01273-z.
Additional file 1: Figure S1. Principal component analysis separatedthe study groups for some, but not all, data types. Panels A-D displaystandard clinical data, Nightingale data, Vitas plasma fatty acids data, anddietary intake data, respectively, for MUO, MHO and NW subjects as la-belled directly by colors. Abbreviations: MHO, Metabolically healthy obesesubjects; MUO, Metabolically unhealthy obese subjects; NW, Normalweight subjects; PC, Principal component.
Additional file 2: Figure S2. Absolute level, but not relative level, ofvarious lipid types are generally lower in NW and higher in MUO,compared with MHO subjects. The forest plot displays the β regression
Telle-Hansen et al. Lipids in Health and Disease (2020) 19:90 Page 10 of 12
coefficients (mean difference) and 95% confidence interval for MUO vsMHO subjects (circles) and NW vs MHO subjects (squares). Estimates onthe right and left side of the zero-line translates to higher and lower thanMHO subjects, respectively. Color denotes nominal significance level. Ab-breviations: HDL, High-density lipoprotein; IDL, Intermediate-density lipo-protein; L, Large; LDL, Low-density lipoprotein; M, Medium; MHO,Metabolically healthy obese subjects; MUO, Metabolically unhealthyobese subjects; NW, Normal weight subjects; S, Small; VLDL, Very low-density lipoprotein; XL, Extra-large; XS, Extra-small; XXL, Extremely large.
Additional file 3: Figure S3. There is systematic variation in lipidspecies content for 14 lipid subclasses across all study groups. The figureshows the distribution of lipid species across all 14 subclasses for MUO,MHO and NW groups. The left-hand side “% of total lipids” column andcolor-coding correspond to the absolute concentration of lipid speciesreported in the boxplot-dotplot columns on the right-hand side. Abbrevi-ations: HDL, High-density lipoprotein; IDL, Intermediate-density lipopro-tein; L, Large; LDL, Low-density lipoprotein; M, Medium; MHO,Metabolically healthy obese subjects; MUO, Metabolically unhealthyobese subjects; NW, Normal weight subjects; S, Small; VLDL, Very low-density lipoprotein; XL, Extra-large; XS, Extra-small; XXL, Extremely large.
Additional file 4: Figure S4. Dietary intake was similar for MUO andMHO subjects. The forest plot displays the β regression coefficients(mean difference) and 95% confidence interval for MUO vs MHO subjects(circles) and NW vs MHO subjects (squares). Estimates on the right andleft side of the zero-line translates to higher and lower than MHO subjects,respectively. Color denotes nominal significance level. Abbreviations:CHO, Carbohydrate; E%, Percent of total energy intake; g, Grams; kJ, Kilo-joule; MHO, Metabolically healthy obese subjects; MUO, Metabolically un-healthy obese subjects.
AbbreviationsBCAA: Branched chain amino acid; BMI: Body mass index; CE: Cholesterylester; CRP: C-reactive protein; CVD: Cardiovascular disease;DHA: Docosahexaenoic acid; EPA: Eicosapentaenoic acid; FC: Free cholesterol;gGT: gamma-glutamyltransferase; HDL: High density lipoprotein;HOMAir: Homeostasis model assessment of insulin resistance;IDL: Intermediate density lipoprotein; L: Large; LDL: Low density lipoprotein;M: Medium; MetS: Metabolic syndrome; MHO: Metabolically healthy obesity;MOU: Metabolically unhealthy obesity; MUFA: Monounsaturated fatty acid;NW: Normal weight; PCA: Principal component analyses; PL: Phospholipid;PUFA: Polyunsaturated fatty acid; S: Small; SCD: Stearoyl CoA desaturase;SCFA: Short chain fatty acid; SFA: Saturated fatty acid; TG: Triglyceride;T2D: Type 2 diabetes; VLDL: Very low density lipoprotein; XL: Extra-large;XXL: Extremely large; XS: Extra-small
AcknowledgmentsWe are grateful to all participants in the study, to researchers NimaWesseltoft-Rao and Ingunn Narverud, and to bio-engineer Ellen Raael fortheir contributions to the present study. The study protocol and statisticalanalysis plan is available by request to the corresponding author.
Consent of publicationNot applicable.
Authors’ contributionsVHTH, KBH and SMU contributed with the planning and design of the study.VHTH collected the data. VHTH, JJC and GAAF analyzed the data. JJCgenerated figures. VHTH performed literature search. All authors contributedto the interpretation of the results, and were involved in writing themanuscript. All authors have read and approved the final manuscript.
FundingThrone Holst Foundation for Nutrition Research, Oslo, Norway, University ofOslo, Oslo, Norway, OsloMet, Oslo, Norway, and Mills DA, Oslo, Norway.
Availability of data and materialsThe datasets used and/or analysed during the current study are availablefrom the corresponding author on reasonable request.
Ethics approval and consent to participateThe study was approved by the Regional Committee of Medical Ethics(approval no. 6.2008.1368) and by the Norwegian Social Science DataServices (approval no. 19667). Written informed consent for participation wasobtained from each participant, and the study complied with theDeclaration of Helsinki.
Competing interestsMills DA partially funded the study and VHTH has been employed at MillsDA. She does not owns any stocks in the company, and the work performedin this paper was done after she left the company. KBH has receivedresearch grant from TINE BA, Olympic Seafood, Amgen, Sanofi, Kaneka andPronova. SMU has received research grant from TINE BA and OlympicSeafood. None of these grants or honoraria are related to the content of thismanuscript.
Author details1Faculty of Health Sciences, Oslo Metropolitan University, P.O. Box 4, St.Olavsplass, 0130 Oslo, Norway. 2Norwegian National Advisory Unit onFamilial Hypercholesterolemia, Oslo University Hospital Rikshospitalet, P.O.Box 4950, Nydalen, 0424 Oslo, Norway. 3Departmentof Nutrition, Institute ofBasic Medical Sciences, Faculty of Medicine, University of Oslo, P.O. Box 1046,Blindern, 0317 Oslo, Norway.
Received: 19 February 2020 Accepted: 29 April 2020
References1. Bluher M. Obesity: global epidemiology and pathogenesis. Nat Rev
Endocrinol. 2019;15(5):288–98.2. Collaboration NCDRF. Trends in adult body-mass index in 200 countries
from 1975 to 2014: a pooled analysis of 1698 population-basedmeasurement studies with 19.2 million participants. Lancet. 2016;387(10026):1377–96.
3. Karelis AD, Brochu M, Rabasa-Lhoret R. Can we identify metabolicallyhealthy but obese individuals (MHO)? Diabetes Metab. 2004;30(6):569–72.
4. Kramer CK, Zinman B, Retnakaran R. Are metabolically healthy overweightand obesity benign conditions?: a systematic review and meta-analysis. AnnIntern Med. 2013;159(11):758–69.
5. Caleyachetty R, Thomas GN, Toulis KA, Mohammed N, Gokhale KM,Balachandran K, et al. Metabolically healthy obese and incidentcardiovascular disease events among 3.5 million men and women. J AmColl Cardiol. 2017;70(12):1429–37.
6. Chen HH, Tseng YJ, Wang SY, Tsai YS, Chang CS, Kuo TC, et al. Themetabolome profiling and pathway analysis in metabolic healthy andabnormal obesity. Int J Obes. 2015;39(8):1241–8.
7. Ho JE, Larson MG, Ghorbani A, Cheng S, Chen MH, Keyes M, et al.Metabolomic profiles of body mass index in the Framingham heart studyreveal distinct Cardiometabolic phenotypes. PLoS One. 2016;11(2):e0148361.
8. Park S, Sadanala KC, Kim EK. A Metabolomic approach to understanding themetabolic link between obesity and diabetes. Mol Cells. 2015;38(7):587–96.
9. Telle-Hansen VH, Narverud I, Retterstol K, Wesseltoft-Rao N, Mosdol A,Granlund L, et al. Substitution of TAG oil with diacylglycerol oil in fooditems improves the predicted 10 years cardiovascular risk score in healthy,overweight subjects. J Nutr Sci. 2012;1:e17.
10. Telle-Hansen VH, Halvorsen B, Dalen KT, Narverud I, Wesseltoft-Rao N,Granlund L, et al. Altered expression of genes involved in lipid metabolismin obese subjects with unfavourable phenotype. Genes Nutr. 2013;8(4):425–34.
11. Soininen P, Kangas AJ, Wurtz P, Suna T, Ala-Korpela M. Quantitative serumnuclear magnetic resonance metabolomics in cardiovascular epidemiologyand genetics. Circ Cardiovasc Genet. 2015;8(1):192–206.
12. Lillegaard IT, Andersen LF. Validation of a pre-coded food diary with energyexpenditure, comparison of under-reporters v. acceptable reporters. Br JNutr. 2005;94(6):998–1003.
13. Jump DB. Fatty acid regulation of gene transcription. Crit Rev Clin Lab Sci.2004;41(1):41–78.
14. Gonzalez-Becerra K, Ramos-Lopez O, Barron-Cabrera E, Riezu-Boj JI, MilagroFI, Martinez-Lopez E, et al. Fatty acids, epigenetic mechanisms and chronicdiseases: a systematic review. Lipids Health Dis. 2019;18(1):178.
Telle-Hansen et al. Lipids in Health and Disease (2020) 19:90 Page 11 of 12
15. Warensjo E, Riserus U, Vessby B. Fatty acid composition of serum lipidspredicts the development of the metabolic syndrome in men. Diabetologia.2005;48(10):1999–2005.
16. Warensjo E, Riserus U, Gustafsson IB, Mohsen R, Cederholm T, Vessby B.Effects of saturated and unsaturated fatty acids on estimated desaturaseactivities during a controlled dietary intervention. Nutr Metab CardiovascDis. 2008;18(10):683–90.
17. Telle-Hansen VH, Larsen LN, Hostmark AT, Molin M, Dahl L, Almendingen K,et al. Daily intake of cod or salmon for 2 weeks decreases the 18:1n-9/18:0ratio and serum triacylglycerols in healthy subjects. Lipids. 2012;47(2):151–60.
18. Wurtz P, Havulinna AS, Soininen P, Tynkkynen T, Prieto-Merino D, Tillin T,et al. Metabolite profiling and cardiovascular event risk: a prospective studyof 3 population-based cohorts. Circulation. 2015;131(9):774–85.
19. Cohn JS, Johnson EJ, Millar JS, Cohn SD, Milne RW, Marcel YL, et al.Contribution of apoB-48 and apoB-100 triglyceride-rich lipoproteins (TRL) topostprandial increases in the plasma concentration of TRL triglycerides andretinyl esters. J Lipid Res. 1993;34(12):2033–40.
20. Nakajima K, Tokita Y, Tanaka A. Hypothesis: postprandial remnantlipoproteins are the causal factors that induce the insulin resistanceassociated with obesity. Clin Chim Acta. 2018;485:126–32.
21. Masuda D, Yamashita S. Postprandial hyperlipidemia and remnantlipoproteins. J Atheroscler Thromb. 2017;24(2):95–109.
22. Robinson JG, Williams KJ, Gidding S, Boren J, Tabas I, Fisher EA, et al.Eradicating the burden of atherosclerotic cardiovascular disease by loweringApolipoprotein B lipoproteins earlier in life. J Am Heart Assoc. 2018;7(20):e009778.
23. Candi E, Tesauro M, Cardillo C, Lena AM, Schinzari F, Rodia G, et al.Metabolic profiling of visceral adipose tissue from obese subjects with orwithout metabolic syndrome. Biochem J. 2018;475(5):1019–35.
24. Hanamatsu H, Ohnishi S, Sakai S, Yuyama K, Mitsutake S, Takeda H, et al.Altered levels of serum sphingomyelin and ceramide containing distinctacyl chains in young obese adults. Nutr Diabetes. 2014;4:e141.
25. Arany Z, Neinast M. Branched chain amino acids in metabolic disease. CurrDiab Rep. 2018;18(10):76.
26. Newgard CB, An J, Bain JR, Muehlbauer MJ, Stevens RD, Lien LF, et al. Abranched-chain amino acid-related metabolic signature that differentiatesobese and lean humans and contributes to insulin resistance. Cell Metab.2009;9(4):311–26.
27. Kim M, Yoo HJ, KO J, Lee HJ. Metabolically unhealthy overweight individualshave high lysophosphatide levels, phospholipase activity, and oxidativestress. Clin Nutr. 2020;39(4):1137–45.
28. Palmer ND, Stevens RD, Antinozzi PA, Anderson A, Bergman RN,Wagenknecht LE, et al. Metabolomic profile associated with insulinresistance and conversion to diabetes in the insulin resistanceatherosclerosis study. J Clin Endocrinol Metab. 2015;100(3):E463–8.
29. Krebs M, Krssak M, Bernroider E, Anderwald C, Brehm A, Meyerspeer M, et al.Mechanism of amino acid-induced skeletal muscle insulin resistance inhumans. Diabetes. 2002;51(3):599–605.
30. Everman S, Mandarino LJ, Carroll CC, Katsanos CS. Effects of acute exposure toincreased plasma branched-chain amino acid concentrations on insulin-mediatedplasma glucose turnover in healthy young subjects. PLoS One. 2015;10(3):e0120049.
31. Liu J, Semiz S, van der Lee SJ, van der Spek A, Verhoeven A, van Klinken JB,et al. Metabolomics based markers predict type 2 diabetes in a 14-yearfollow-up study. Metabolomics. 2017;13(9):104.
32. Shah SH, Kraus WE, Newgard CB. Metabolomic profiling for theidentification of novel biomarkers and mechanisms related to commoncardiovascular diseases: form and function. Circulation. 2012;126(9):1110–20.
33. Yang RY, Wang SM, Sun L, Liu JM, Li HX, Sui XF, et al. Association ofbranched-chain amino acids with coronary artery disease: a matched-paircase-control study. Nutr Metab Cardiovasc Dis. 2015;25(10):937–42.
34. Ntzouvani A, Nomikos T, Panagiotakos D, Fragopoulou E, Pitsavos C,McCann A, et al. Amino acid profile and metabolic syndrome in a maleMediterranean population: a cross-sectional study. Nutr Metab CardiovascDis. 2017;27(11):1021–30.
35. Mangge H, Zelzer S, Pruller F, Schnedl WJ, Weghuber D, Enko D, et al.Branched-chain amino acids are associated with cardiometabolic riskprofiles found already in lean, overweight and obese young. J NutrBiochem. 2016;32:123–7.
36. Ruiz-Canela M, Toledo E, Clish CB, Hruby A, Liang L, Salas-Salvado J, et al.Plasma branched-chain amino acids and incident cardiovascular disease inthe PREDIMED trial. Clin Chem. 2016;62(4):582–92.
37. Delles C, Rankin NJ, Boachie C, McConnachie A, Ford I, Kangas A, et al.Nuclear magnetic resonance-based metabolomics identifies phenylalanineas a novel predictor of incident heart failure hospitalisation: results fromPROSPER and FINRISK 1997. Eur J Heart Fail. 2018;20(4):663–73.
38. Swierczynski J, Sledzinski T, Slominska E, Smolenski R, Sledzinski Z. Serumphenylalanine concentration as a marker of liver function in obese patientsbefore and after bariatric surgery. Obes Surg. 2009;19(7):883–9.
39. Saltiel AR, Olefsky JM. Inflammatory mechanisms linking obesity andmetabolic disease. J Clin Invest. 2017;127(1):1–4.
40. Connelly MA, Otvos JD, Shalaurova I, Playford MP, Mehta NN. GlycA, a novelbiomarker of systemic inflammation and cardiovascular disease risk. J TranslMed. 2017;15(1):219.
41. Lawler PR, Akinkuolie AO, Chandler PD, Moorthy MV, Vandenburgh MJ,Schaumberg DA, et al. Circulating N-linked glycoprotein acetyls andlongitudinal mortality risk. Circ Res. 2016;118(7):1106–15.
42. Warensjo E, Ohrvall M, Vessby B. Fatty acid composition and estimateddesaturase activities are associated with obesity and lifestyle variables inmen and women. Nutr Metab Cardiovasc Dis. 2006;16(2):128–36.
43. Yu EA, Hu PJ, Mehta S. Plasma fatty acids in de novo lipogenesis pathwayare associated with diabetogenic indicators among adults: NHANES 2003-2004. Am J Clin Nutr. 2018;108(3):622–32.
44. Mayneris-Perxachs J, Guerendiain M, Castellote AI, Estruch R, Covas MI, FitoM, et al. Plasma fatty acid composition, estimated desaturase activities, andtheir relation with the metabolic syndrome in a population at high risk ofcardiovascular disease. Clin Nutr. 2014;33(1):90–7.
45. AL AM, Syed DN, Ntambi JM. Insights into Stearoyl-CoA Desaturase-1regulation of systemic metabolism. Trends Endocrinol Metab. 2017;28(12):831–42.
46. Zhao L, Ni Y, Ma X, Zhao A, Bao Y, Liu J, et al. A panel of free fatty acidratios to predict the development of metabolic abnormalities in healthyobese individuals. Sci Rep. 2016;6:28418.
47. Kamal S, Saleem A, Rehman S, Bibi I, Iqbal HMN. Protein engineering:regulatory perspectives of stearoyl CoA desaturase. Int J Biol Macromol.2018;114:692–9.
Publisher’s NoteSpringer Nature remains neutral with regard to jurisdictional claims inpublished maps and institutional affiliations.
Telle-Hansen et al. Lipids in Health and Disease (2020) 19:90 Page 12 of 12