Embed Size (px)
Citation preview

Feedstocks & Products:Properties & Specifications
Updated: January 4, 2019Copyright © 2017 John Jechura ([email protected])
Topics
Natural gas characterization▪Composition▪Characterization qualifiers▪Review of phase behavior
Gas & liquid products▪Composition▪Other properties
2
Updated: January 4, 2019Copyright © 2017 John Jechura ([email protected])
Natural gas characterization
Updated: January 4, 2019Copyright © 2017 John Jechura ([email protected])
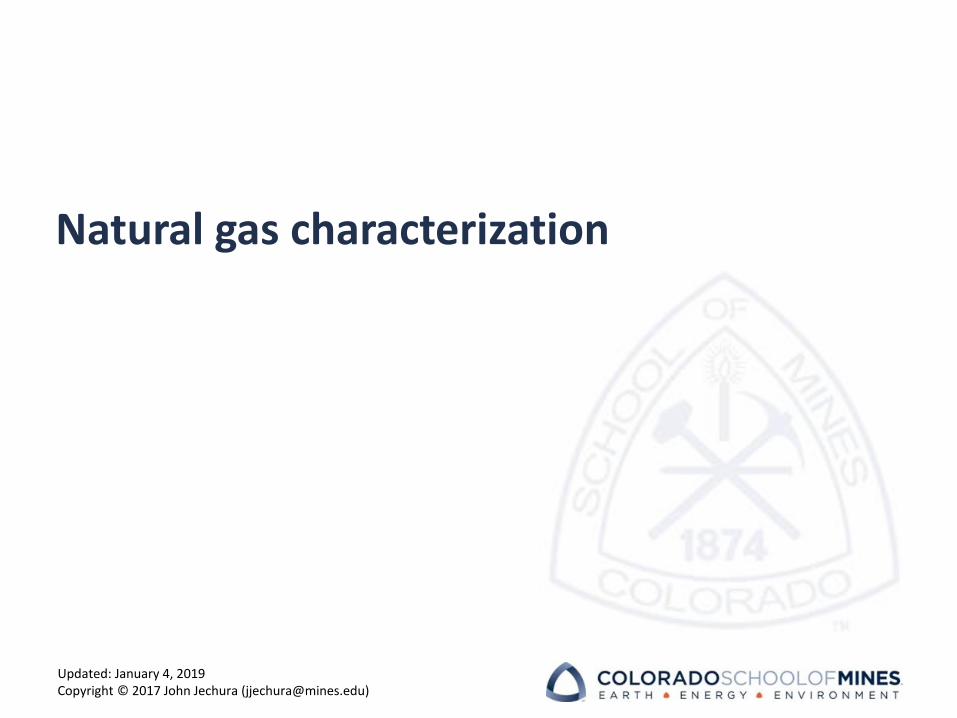
Natural GasNatural gas is the gaseous portion of petroleum production at surface conditions
▪ Dry gas – no surface hydrocarbon liquids
• Some cases of methane concentration upwards of 99%
▪ Associated gas – coexisting production of gases & hydrocarbon liquids
• Potentially significant amounts of C6+
4
Drawing based on:Fundamentals of Natural Gas Processing, 2nd ed.Kidnay, Parrish, & McCartney
Updated: January 4, 2019Copyright © 2017 John Jechura ([email protected])
Natural Gas Characterization
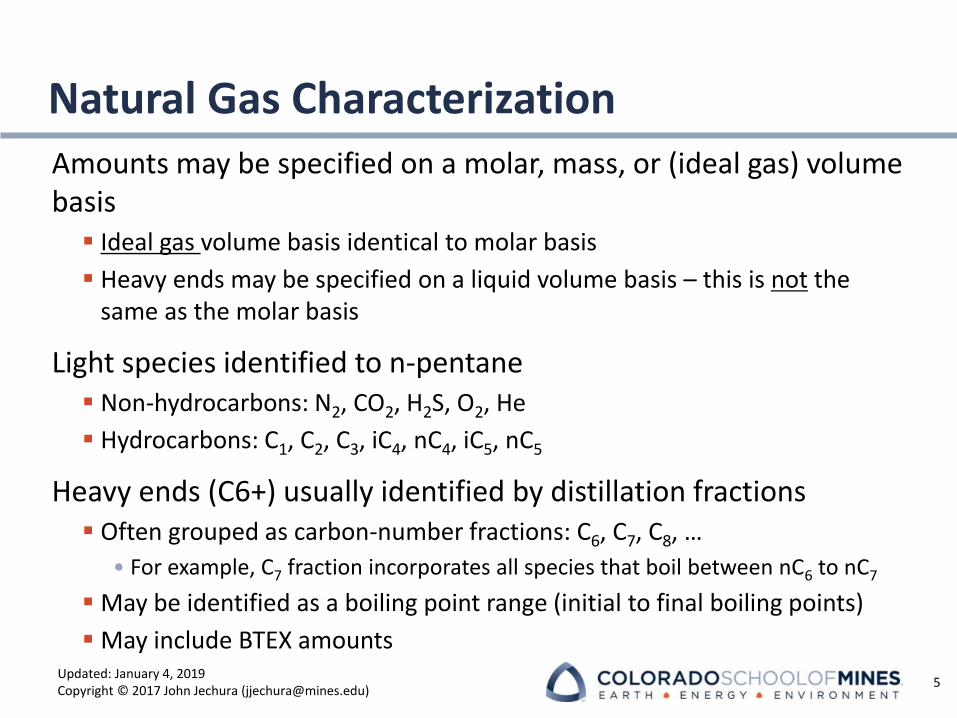
Amounts may be specified on a molar, mass, or (ideal gas) volume basis
▪ Ideal gas volume basis identical to molar basis
▪ Heavy ends may be specified on a liquid volume basis – this is not the same as the molar basis
Light species identified to n-pentane▪ Non-hydrocarbons: N2, CO2, H2S, O2, He
▪ Hydrocarbons: C1, C2, C3, iC4, nC4, iC5, nC5
Heavy ends (C6+) usually identified by distillation fractions▪ Often grouped as carbon-number fractions: C6, C7, C8, …
• For example, C7 fraction incorporates all species that boil between nC6 to nC7
▪ May be identified as a boiling point range (initial to final boiling points)
▪ May include BTEX amounts
5
Updated: January 4, 2019Copyright © 2017 John Jechura ([email protected])
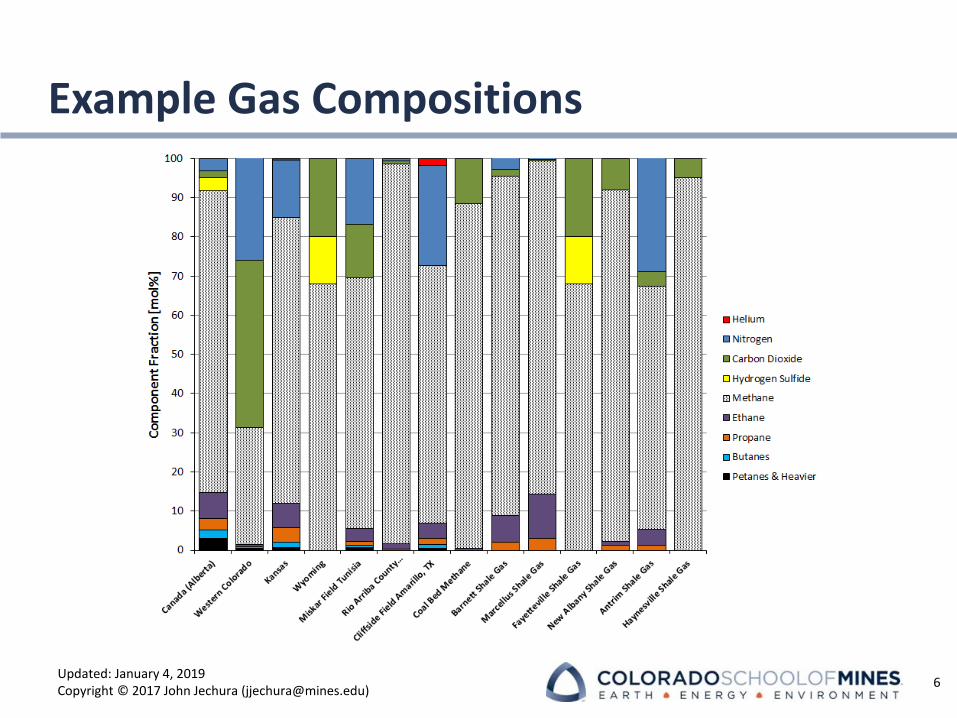
Example Gas Compositions
6
Updated: January 4, 2019Copyright © 2017 John Jechura ([email protected])
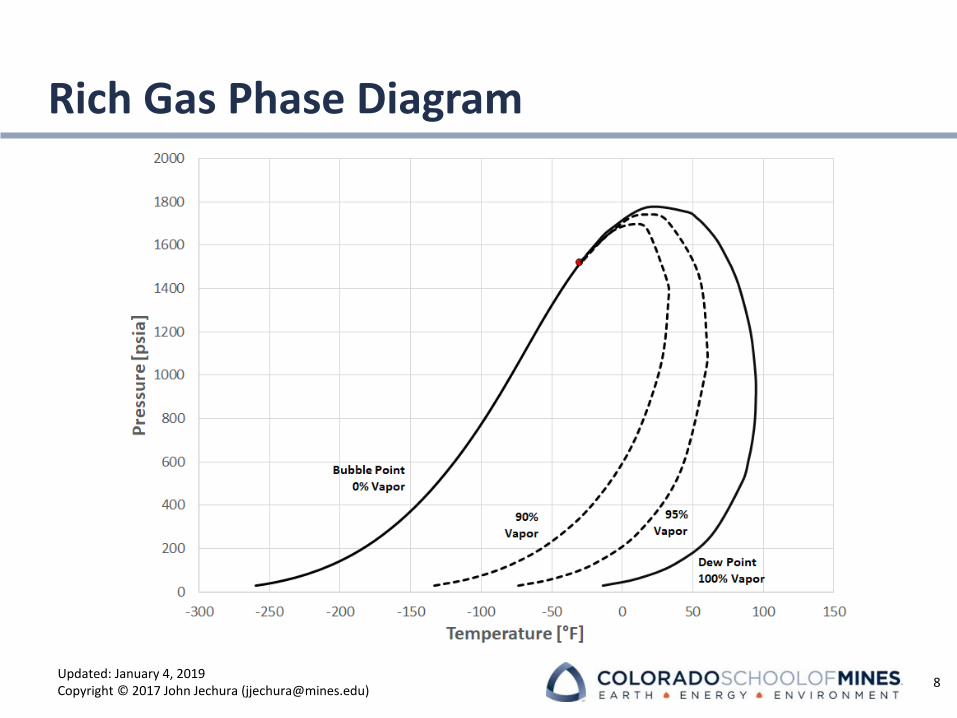
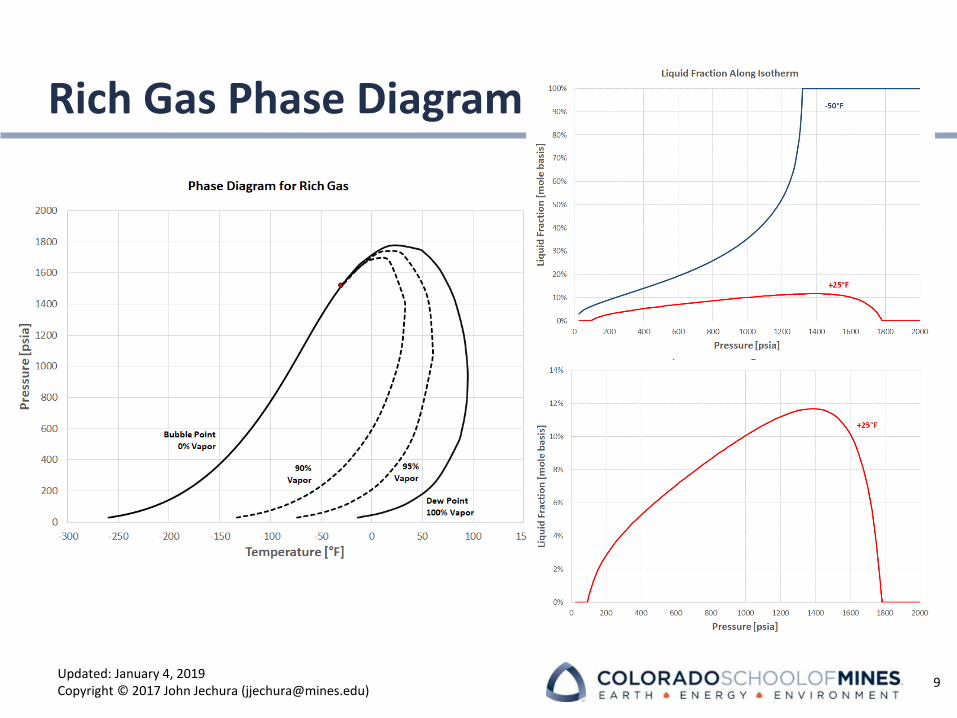
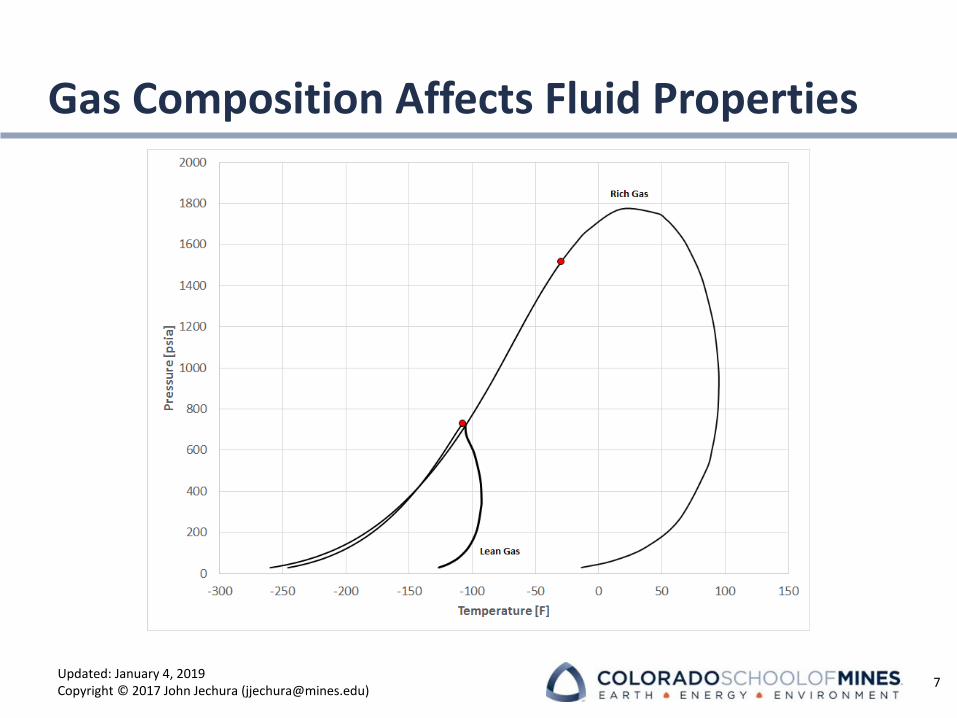
Gas Composition Affects Fluid Properties
7
Updated: January 4, 2019Copyright © 2017 John Jechura ([email protected])
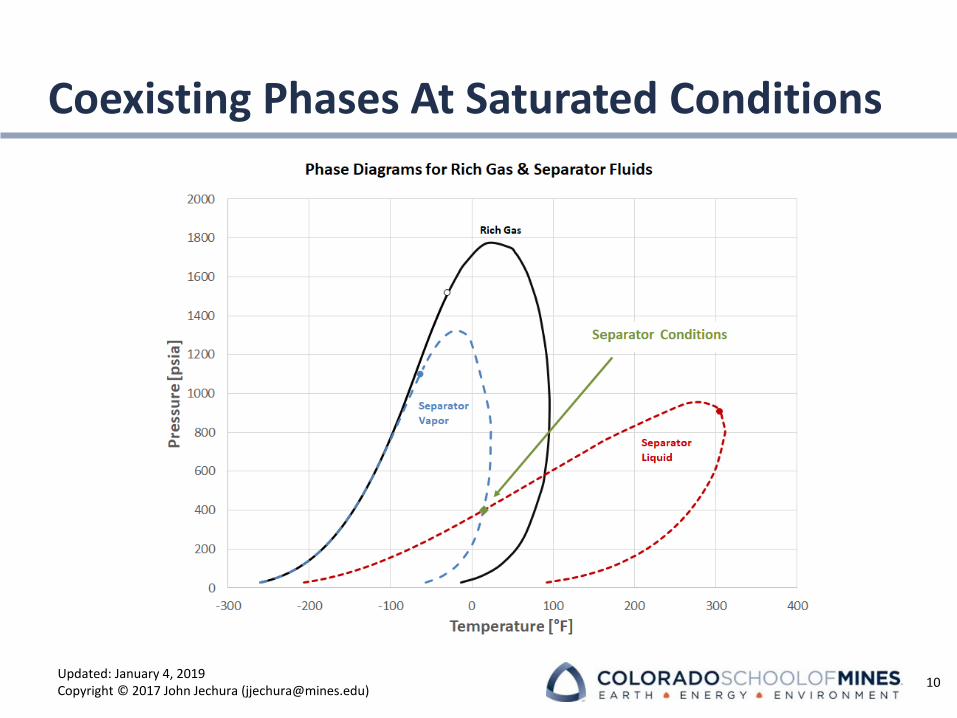
Coexisting Phases At Saturated Conditions
10
Updated: January 4, 2019Copyright © 2017 John Jechura ([email protected])
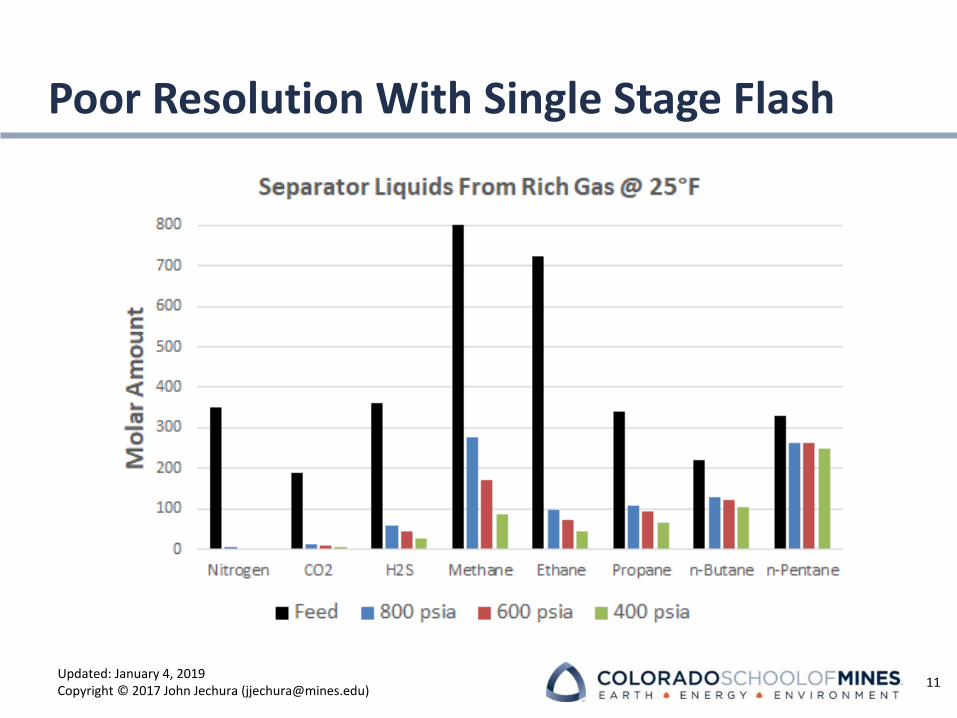
Poor Resolution With Single Stage Flash
11
Updated: January 4, 2019Copyright © 2017 John Jechura ([email protected])
Qualifiers for Gas Composition
Liquids Content – Rich vs. Lean▪The amount of ethane & heavier (C2
+) or propane & heavier (C3
+) in the gas stream
▪ Quantified as standard liquid gallons of liquid per thousandstandard cubic feet of total ideal gas – denoted as “GPM”
• Lean gas usually 1 GPM or less
• Rich gas usually 3 GPM or greater
H2S Content – Sweet vs. Sour▪Sweet less than 4 ppmv (essentially pipeline spec)
12
Updated: January 4, 2019Copyright © 2017 John Jechura ([email protected])
Standard Conditions
“Standard conditions” may vary between countries, states within the U.S., & between different organizations▪Standard temperature – 60oF
• Most other countries use 15oC (59oF)
• Russia uses 20oC (68oF)
▪Standard pressure – 1 atm (14.696 psia)• Other typical values are 14.73 psia (ANSI Z132.1) & 14.503 psia
“Normal conditions”▪Almost exclusively used with metric units (e.g., Nm³)
▪ IUPAC: 0oC & 100 kPa (32oF & 14.50 psia)
▪NIST: 0oC & 1 atm (32oF & 14.696 psia)
13
Updated: January 4, 2019Copyright © 2017 John Jechura ([email protected])
Calculation of Liquids Content
For standard conditions of 60oF & 1 atm the ideal gas molar volume is 379.5 scf/lb.mol
▪ Calculated from ideal gas law
▪ Value will be different for different standard conditions
Convert components’ molar values to standard liquid volumes▪ Moles → mass using molecular weights
▪ Mass → liquid volumes using standard liquid densities (i.e., specific gravities)
Sources for conversion factors▪ Table B.1 in text book
▪ Figure 23.2 in GPSA Engineering Data Book
▪ Spreadsheet on the class web page
14
Updated: January 4, 2019Copyright © 2017 John Jechura ([email protected])
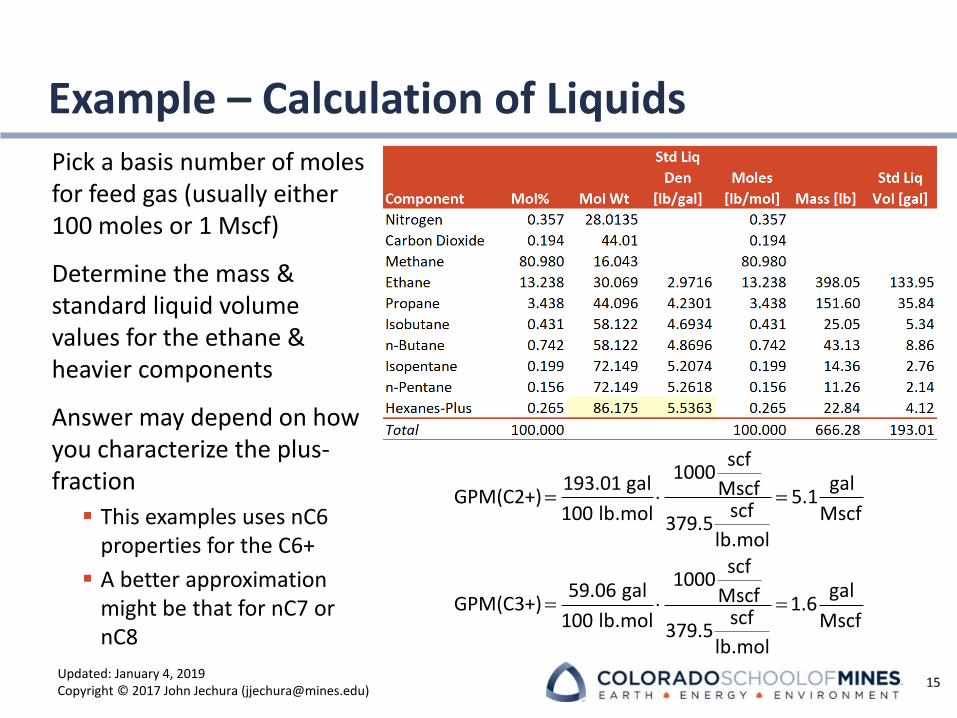
Example – Calculation of LiquidsPick a basis number of moles for feed gas (usually either 100 moles or 1 Mscf)
Determine the mass & standard liquid volume values for the ethane & heavier components
Answer may depend on how you characterize the plus-fraction
▪ This examples uses nC6 properties for the C6+
▪ A better approximation might be that for nC7 or nC8
15
= =
= =
scf1000
193.01 gal galMscfGPM(C2+) 5.1scf100 lb.mol Mscf379.5
lb.mol
scf1000
59.06 gal galMscfGPM(C3+) 1.6scf100 lb.mol Mscf379.5
lb.mol
Updated: January 4, 2019Copyright © 2017 John Jechura ([email protected])
Products & SpecificationsThere are “official” industry standards, representing a broad industry consensus for minimum quality products.
▪ Producers, purchasers, or pipeline companies may adopt variations per individual contract
Primary products▪ Gas
• Combustion characteristics
• Avoid liquid formation during transmission
▪ Natural gas liquids (NGLs)
• May include raw mix streams, ethane, propane, ethane-propane mixes, normal butane, iso-butane, and plant condensate.
• Allow for safe transport
▪ Other
• Sulfur
17
Updated: January 4, 2019Copyright © 2017 John Jechura ([email protected])
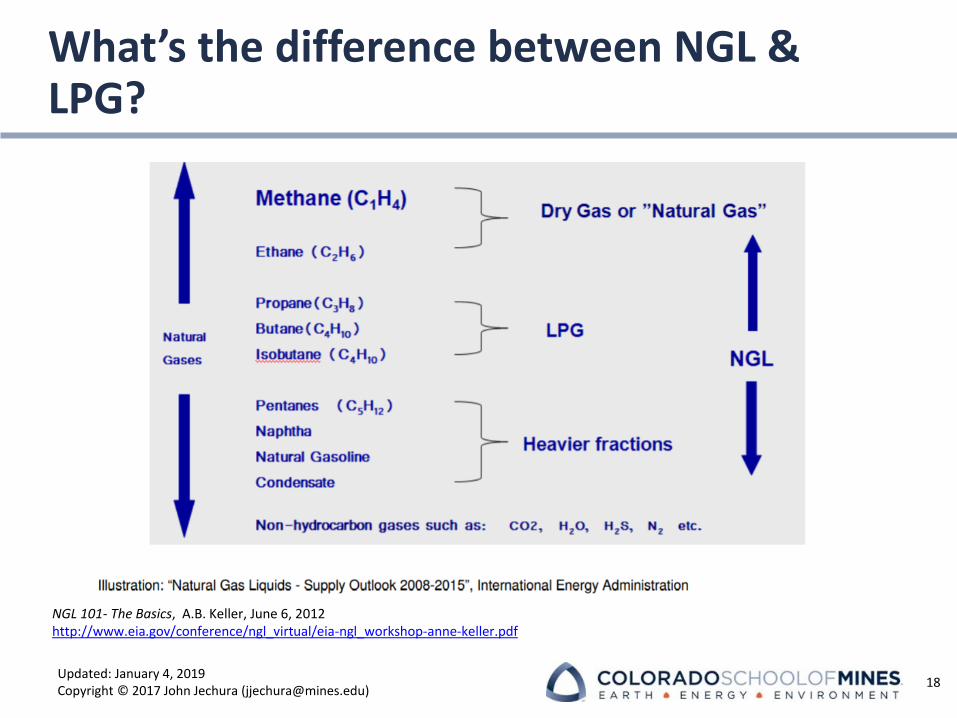
What’s the difference between NGL & LPG?
18
NGL 101- The Basics, A.B. Keller, June 6, 2012http://www.eia.gov/conference/ngl_virtual/eia-ngl_workshop-anne-keller.pdf
Updated: January 4, 2019Copyright © 2017 John Jechura ([email protected])
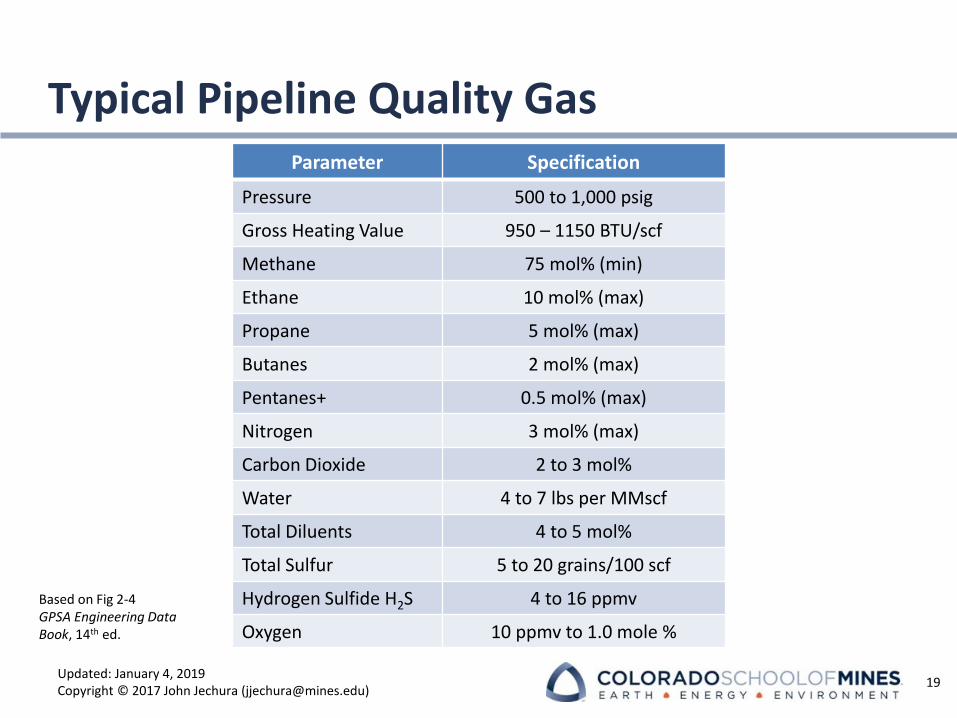
Typical Pipeline Quality Gas
19
Parameter Specification
Pressure 500 to 1,000 psig
Gross Heating Value 950 – 1150 BTU/scf
Methane 75 mol% (min)
Ethane 10 mol% (max)
Propane 5 mol% (max)
Butanes 2 mol% (max)
Pentanes+ 0.5 mol% (max)
Nitrogen 3 mol% (max)
Carbon Dioxide 2 to 3 mol%
Water 4 to 7 lbs per MMscf
Total Diluents 4 to 5 mol%
Total Sulfur 5 to 20 grains/100 scf
Hydrogen Sulfide H2S 4 to 16 ppmv
Oxygen 10 ppmv to 1.0 mole %
Based on Fig 2-4 GPSA Engineering Data Book, 14th ed.
Updated: January 4, 2019Copyright © 2017 John Jechura ([email protected])
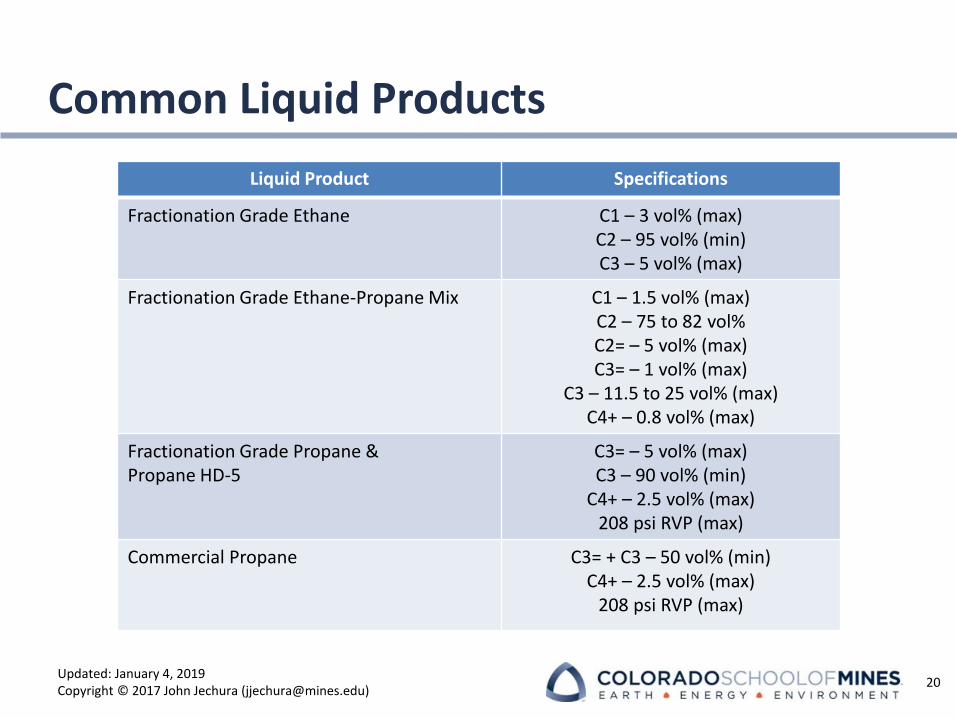
Common Liquid Products
Liquid Product Specifications
Fractionation Grade Ethane C1 – 3 vol% (max)C2 – 95 vol% (min)C3 – 5 vol% (max)
Fractionation Grade Ethane-Propane Mix C1 – 1.5 vol% (max)C2 – 75 to 82 vol%C2= – 5 vol% (max)C3= – 1 vol% (max)
C3 – 11.5 to 25 vol% (max)C4+ – 0.8 vol% (max)
Fractionation Grade Propane & Propane HD-5
C3= – 5 vol% (max)C3 – 90 vol% (min)
C4+ – 2.5 vol% (max)208 psi RVP (max)
Commercial Propane C3= + C3 – 50 vol% (min)C4+ – 2.5 vol% (max)
208 psi RVP (max)
20
Updated: January 4, 2019Copyright © 2017 John Jechura ([email protected])
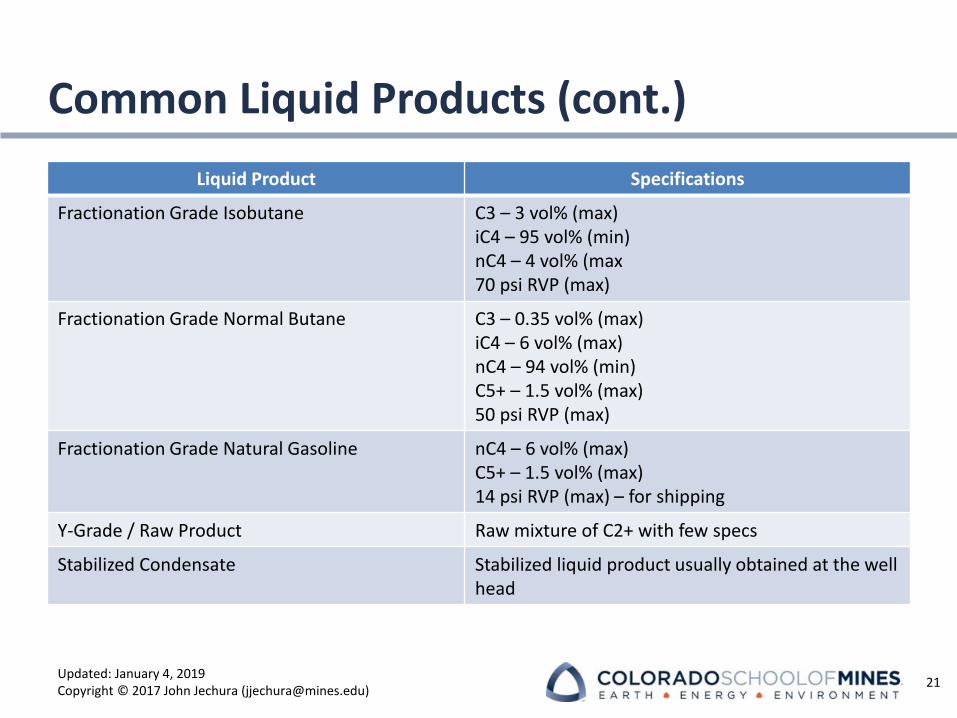
Common Liquid Products (cont.)
Liquid Product Specifications
Fractionation Grade Isobutane C3 – 3 vol% (max)iC4 – 95 vol% (min)nC4 – 4 vol% (max70 psi RVP (max)
Fractionation Grade Normal Butane C3 – 0.35 vol% (max)iC4 – 6 vol% (max)nC4 – 94 vol% (min)C5+ – 1.5 vol% (max)50 psi RVP (max)
Fractionation Grade Natural Gasoline nC4 – 6 vol% (max)C5+ – 1.5 vol% (max)14 psi RVP (max) – for shipping
Y-Grade / Raw Product Raw mixture of C2+ with few specs
Stabilized Condensate Stabilized liquid product usually obtained at the well head
21
Updated: January 4, 2019Copyright © 2017 John Jechura ([email protected])
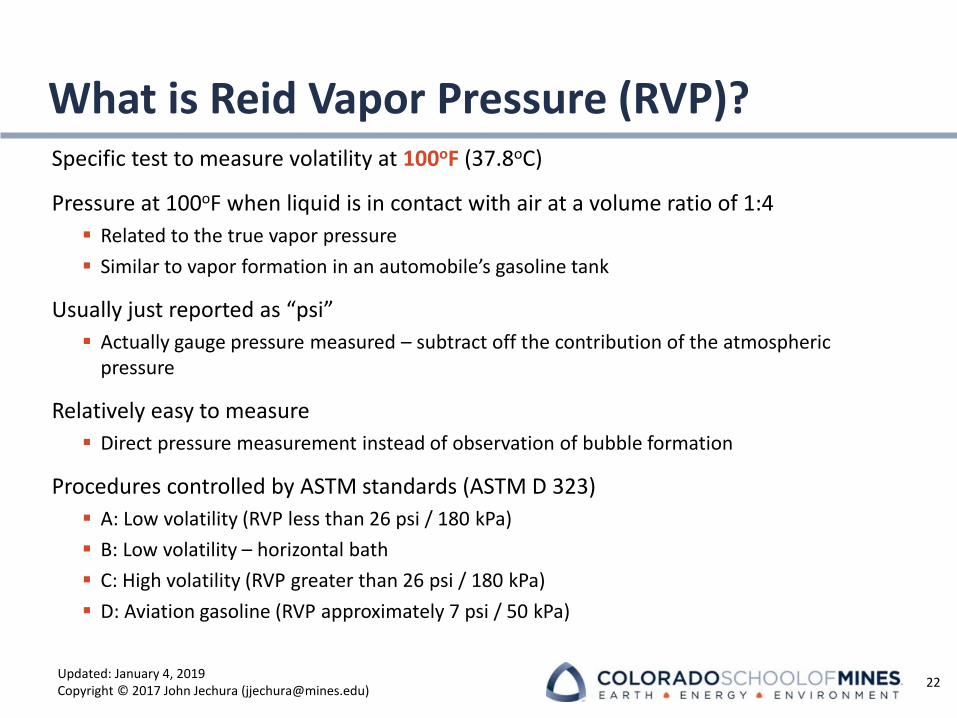
What is Reid Vapor Pressure (RVP)?Specific test to measure volatility at 100oF (37.8oC)
Pressure at 100oF when liquid is in contact with air at a volume ratio of 1:4
▪ Related to the true vapor pressure
▪ Similar to vapor formation in an automobile’s gasoline tank
Usually just reported as “psi”
▪ Actually gauge pressure measured – subtract off the contribution of the atmospheric pressure
Relatively easy to measure
▪ Direct pressure measurement instead of observation of bubble formation
Procedures controlled by ASTM standards (ASTM D 323)
▪ A: Low volatility (RVP less than 26 psi / 180 kPa)
▪ B: Low volatility – horizontal bath
▪ C: High volatility (RVP greater than 26 psi / 180 kPa)
▪ D: Aviation gasoline (RVP approximately 7 psi / 50 kPa)
22
Updated: January 4, 2019Copyright © 2017 John Jechura ([email protected])
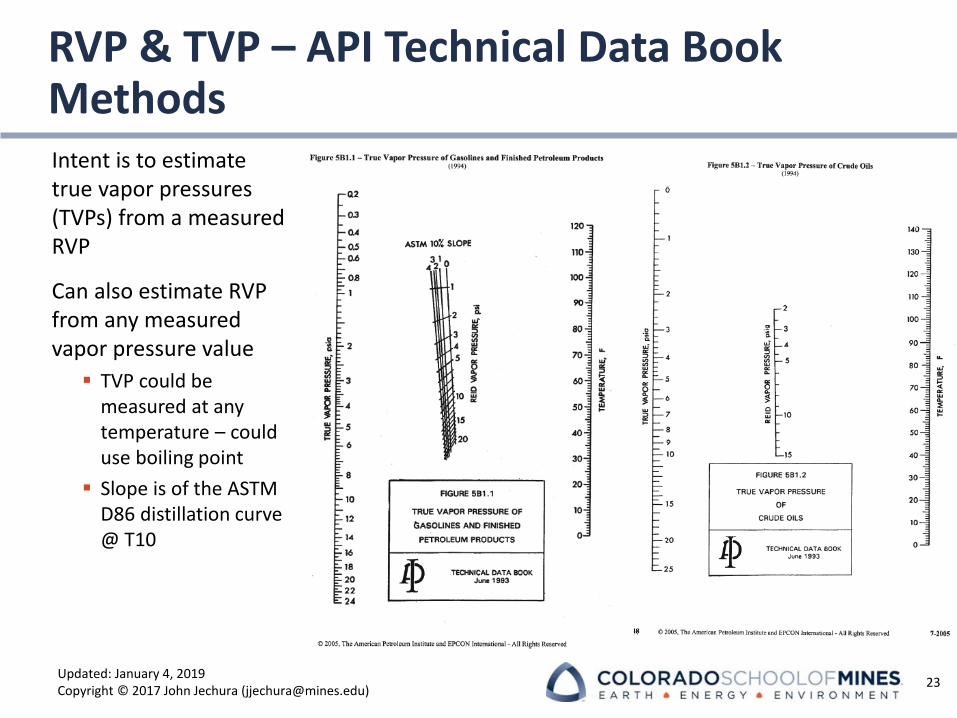
RVP & TVP – API Technical Data Book MethodsIntent is to estimate true vapor pressures (TVPs) from a measured RVP
Can also estimate RVP from any measured vapor pressure value
▪ TVP could be measured at any temperature – could use boiling point
▪ Slope is of the ASTM D86 distillation curve @ T10
23
Updated: January 4, 2019Copyright © 2017 John Jechura ([email protected])
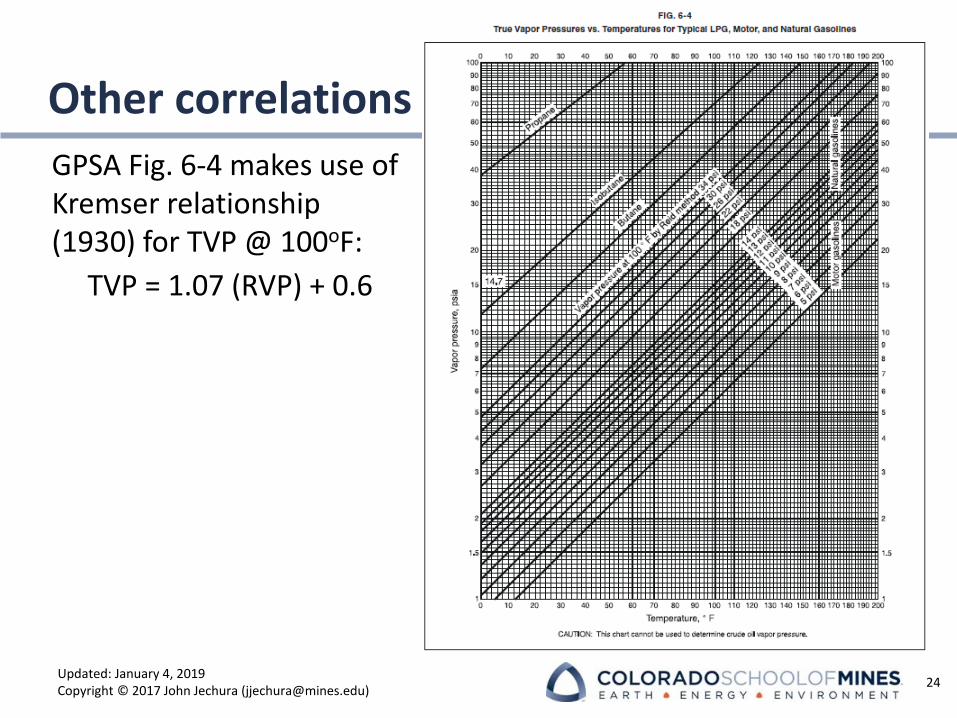
Other correlations
GPSA Fig. 6-4 makes use of Kremser relationship (1930) for TVP @ 100oF:
TVP = 1.07 (RVP) + 0.6
24
Updated: January 4, 2019Copyright © 2017 John Jechura ([email protected])
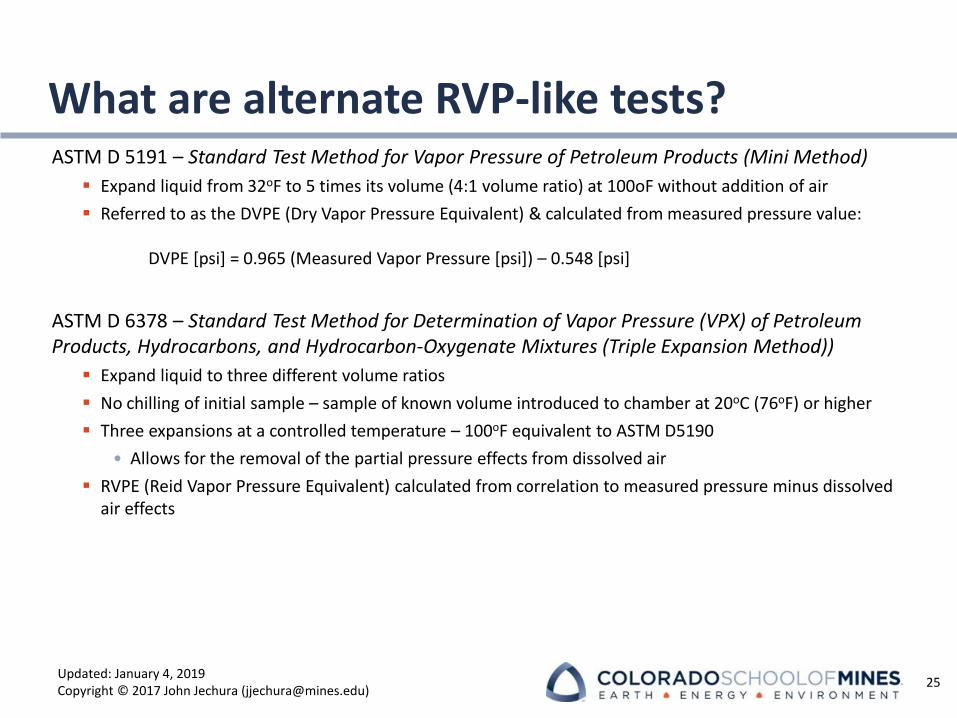
What are alternate RVP-like tests?ASTM D 5191 – Standard Test Method for Vapor Pressure of Petroleum Products (Mini Method)
▪ Expand liquid from 32oF to 5 times its volume (4:1 volume ratio) at 100oF without addition of air
▪ Referred to as the DVPE (Dry Vapor Pressure Equivalent) & calculated from measured pressure value:
DVPE [psi] = 0.965 (Measured Vapor Pressure [psi]) – 0.548 [psi]
ASTM D 6378 – Standard Test Method for Determination of Vapor Pressure (VPX) of Petroleum Products, Hydrocarbons, and Hydrocarbon-Oxygenate Mixtures (Triple Expansion Method))
▪ Expand liquid to three different volume ratios
▪ No chilling of initial sample – sample of known volume introduced to chamber at 20oC (76oF) or higher
▪ Three expansions at a controlled temperature – 100oF equivalent to ASTM D5190
• Allows for the removal of the partial pressure effects from dissolved air
▪ RVPE (Reid Vapor Pressure Equivalent) calculated from correlation to measured pressure minus dissolved air effects
25
Updated: January 4, 2019Copyright © 2017 John Jechura ([email protected])
Industry Specific Properties
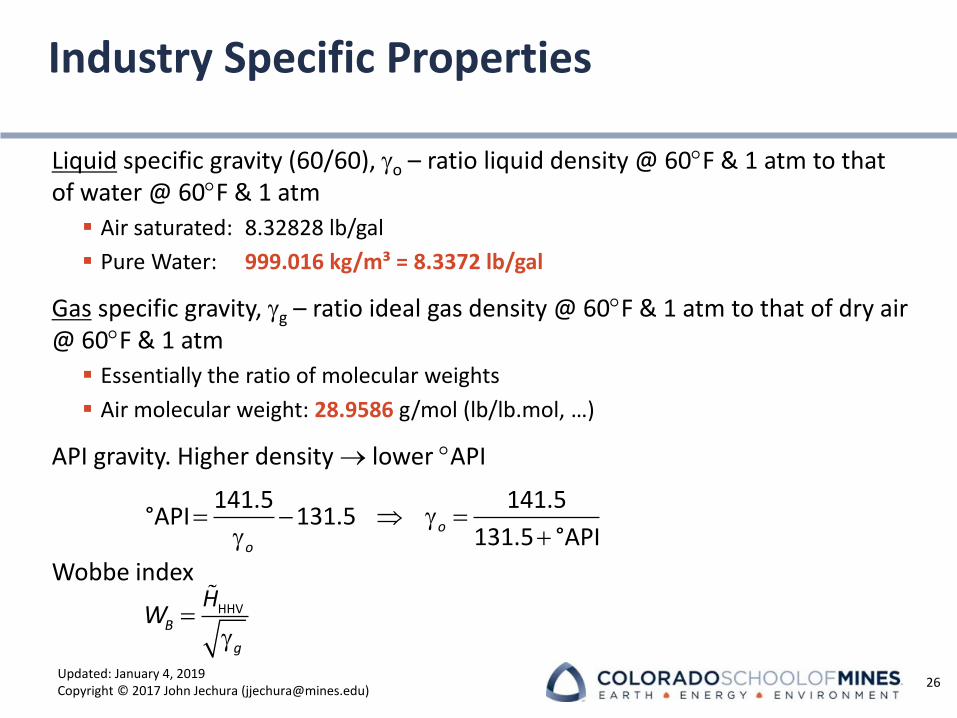
Liquid specific gravity (60/60), go – ratio liquid density @ 60F & 1 atm to that of water @ 60F & 1 atm
▪ Air saturated: 8.32828 lb/gal
▪ Pure Water: 999.016 kg/m³ = 8.3372 lb/gal
Gas specific gravity, gg – ratio ideal gas density @ 60F & 1 atm to that of dry air @ 60F & 1 atm
▪ Essentially the ratio of molecular weights
▪ Air molecular weight: 28.9586 g/mol (lb/lb.mol, …)
API gravity. Higher density → lower API
Wobbe index
26
=g
HHVB
g
HW
= − g =g +
141.5 141.5°API 131.5
131.5 °APIo
o
Updated: January 4, 2019Copyright © 2017 John Jechura ([email protected])
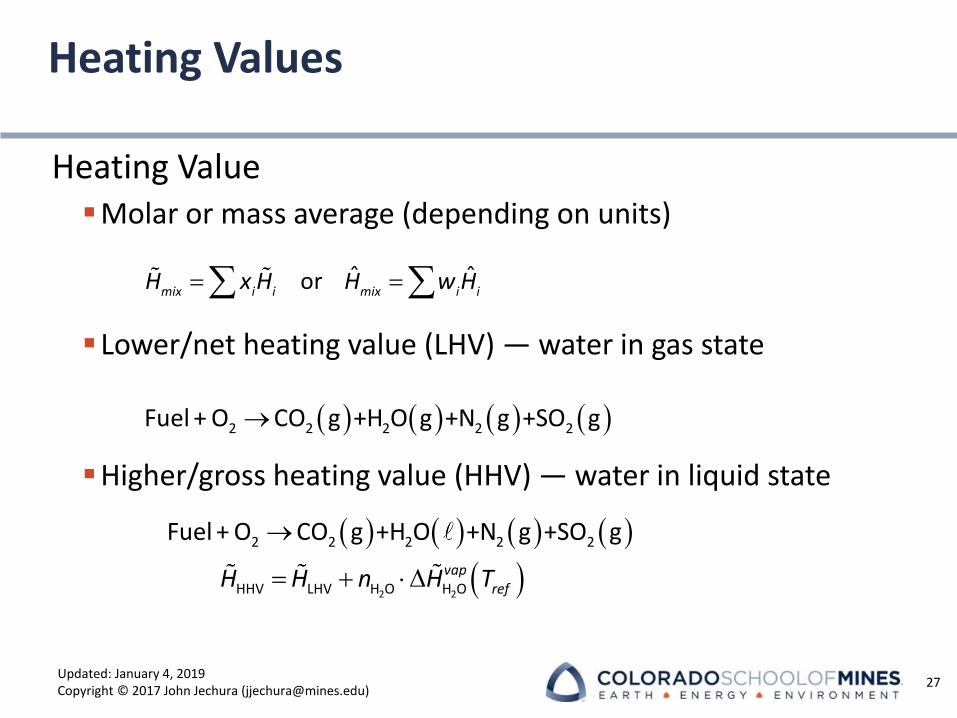
Heating Values
Heating Value▪Molar or mass average (depending on units)
▪Lower/net heating value (LHV) — water in gas state
▪Higher/gross heating value (HHV) — water in liquid state
27
= = ˆ ˆormix i i mix i iH x H H w H
( ) ( ) ( ) ( )→2 2 2 2 2Fuel + O CO g +H O g +N g +SO g
( ) ( ) ( ) ( )
( )
→
= + 2 2
2 2 2 2 2
HHV LHV H O H O
Fuel + O CO g +H O +N g +SO g
vaprefH H n H T
Updated: January 4, 2019Copyright © 2017 John Jechura ([email protected])
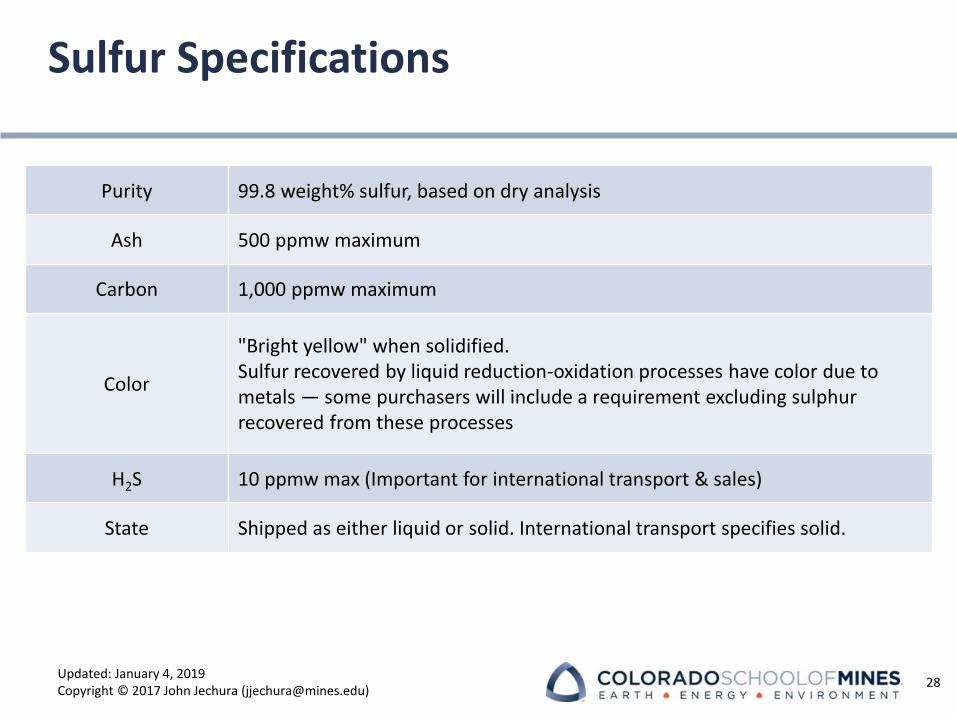
Sulfur Specifications
28
Purity 99.8 weight% sulfur, based on dry analysis
Ash 500 ppmw maximum
Carbon 1,000 ppmw maximum
Color
"Bright yellow" when solidified. Sulfur recovered by liquid reduction-oxidation processes have color due to metals — some purchasers will include a requirement excluding sulphurrecovered from these processes
H2S 10 ppmw max (Important for international transport & sales)
State Shipped as either liquid or solid. International transport specifies solid.
Updated: January 4, 2019Copyright © 2017 John Jechura ([email protected])
Summary
Natural gas may have associated liquids (hydrocarbon & water) at the well head
Gas specifications for transportation & usage▪Hydrocarbon & water dew points▪Heating value & Wobbe index▪Sulfur content
Liquid products have may have minimal specifications ▪Y-grade mix to be fractionated downstream of the gas plant▪Liquid products tend to be low purity/industrial
30
Updated: January 4, 2019Copyright © 2017 John Jechura ([email protected])
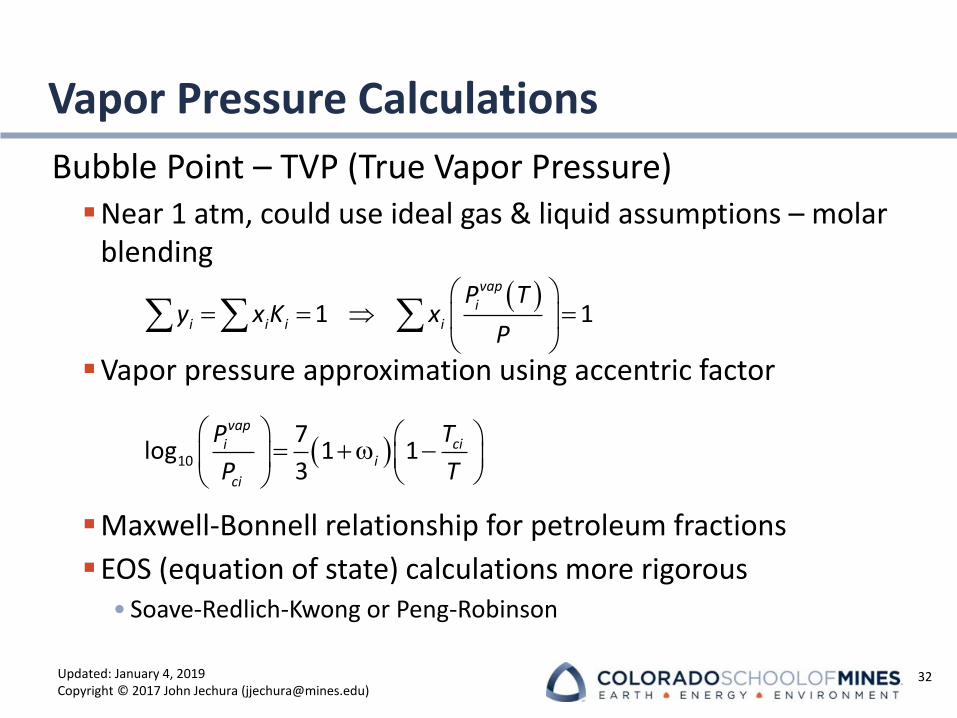
Vapor Pressure Calculations
Bubble Point – TVP (True Vapor Pressure)▪Near 1 atm, could use ideal gas & liquid assumptions – molar
blending
▪Vapor pressure approximation using accentric factor
▪Maxwell-Bonnell relationship for petroleum fractions
▪EOS (equation of state) calculations more rigorous• Soave-Redlich-Kwong or Peng-Robinson
32
( ) = = =
1 1
vapi
i i i i
P Ty x K x
P
( )
= + −
10
7log 1 1
3
vapcii
i
ci
TP
P T
Updated: January 4, 2019Copyright © 2017 John Jechura ([email protected])
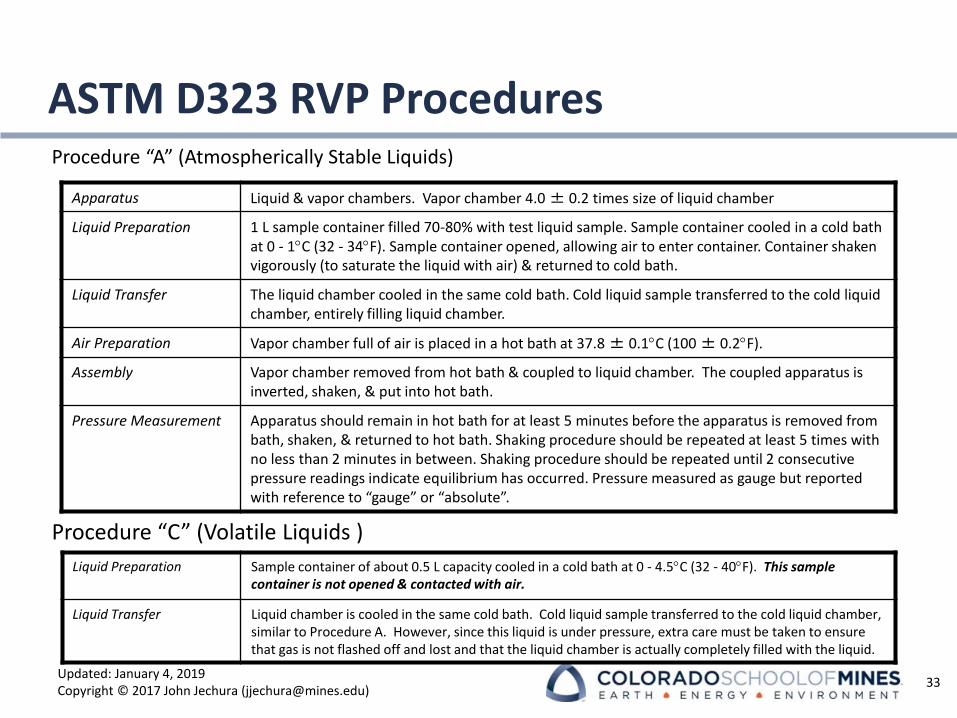
ASTM D323 RVP ProceduresProcedure “A” (Atmospherically Stable Liquids)
Procedure “C” (Volatile Liquids )
33
Apparatus Liquid & vapor chambers. Vapor chamber 4.0 ± 0.2 times size of liquid chamber
Liquid Preparation 1 L sample container filled 70-80% with test liquid sample. Sample container cooled in a cold bath at 0 - 1C (32 - 34F). Sample container opened, allowing air to enter container. Container shaken vigorously (to saturate the liquid with air) & returned to cold bath.
Liquid Transfer The liquid chamber cooled in the same cold bath. Cold liquid sample transferred to the cold liquid chamber, entirely filling liquid chamber.
Air Preparation Vapor chamber full of air is placed in a hot bath at 37.8 ± 0.1C (100 ± 0.2F).
Assembly Vapor chamber removed from hot bath & coupled to liquid chamber. The coupled apparatus is inverted, shaken, & put into hot bath.
Pressure Measurement Apparatus should remain in hot bath for at least 5 minutes before the apparatus is removed from bath, shaken, & returned to hot bath. Shaking procedure should be repeated at least 5 times with no less than 2 minutes in between. Shaking procedure should be repeated until 2 consecutive pressure readings indicate equilibrium has occurred. Pressure measured as gauge but reported with reference to “gauge” or “absolute”.
Liquid Preparation Sample container of about 0.5 L capacity cooled in a cold bath at 0 - 4.5C (32 - 40F). This sample container is not opened & contacted with air.
Liquid Transfer Liquid chamber is cooled in the same cold bath. Cold liquid sample transferred to the cold liquid chamber, similar to Procedure A. However, since this liquid is under pressure, extra care must be taken to ensure that gas is not flashed off and lost and that the liquid chamber is actually completely filled with the liquid.
Updated: January 4, 2019Copyright © 2017 John Jechura ([email protected])
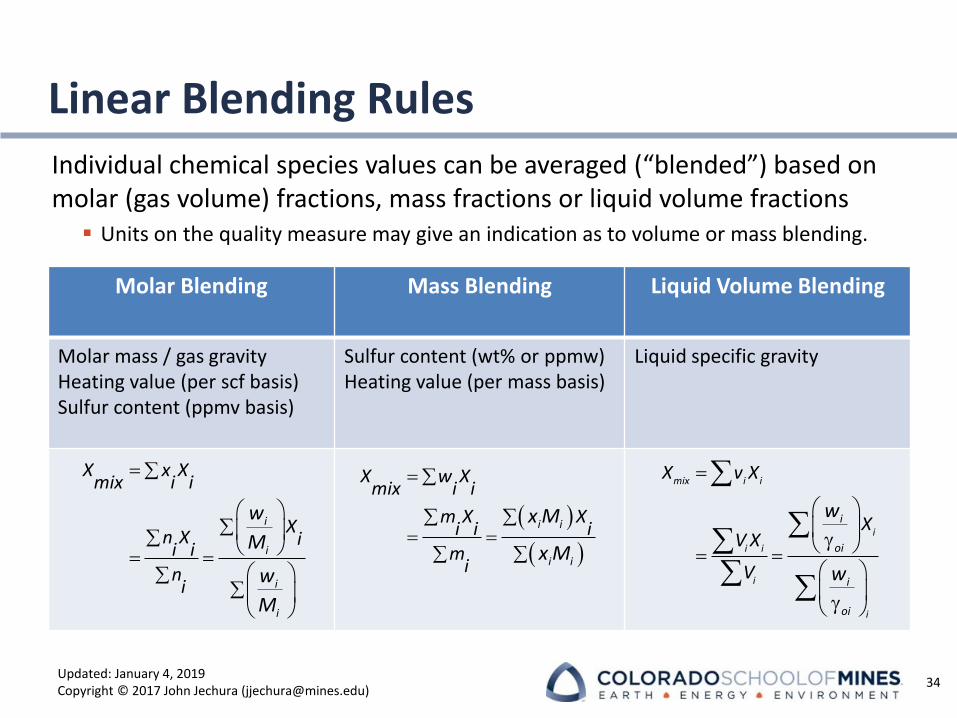
Molar Blending Mass Blending Liquid Volume Blending
Molar mass / gas gravityHeating value (per scf basis)Sulfur content (ppmv basis)
Sulfur content (wt% or ppmw)Heating value (per mass basis)
Liquid specific gravity
Linear Blending Rules
Individual chemical species values can be averaged (“blended”) based on molar (gas volume) fractions, mass fractions or liquid volume fractions
▪ Units on the quality measure may give an indication as to volume or mass blending.
34
=
= =
g
g
mix i i
i
i i
i
i
i
oi
i
oi
X v X
XV X
V
w
w
( )
( )
=
= =
i i
i i
X w Xmix i i
m X Xi i i
mi
x M
x M
=
= =
i
i
i
i
X x Xmix i i
Xn X i
i in
i
w
M
w
M
Updated: January 4, 2019Copyright © 2017 John Jechura ([email protected])
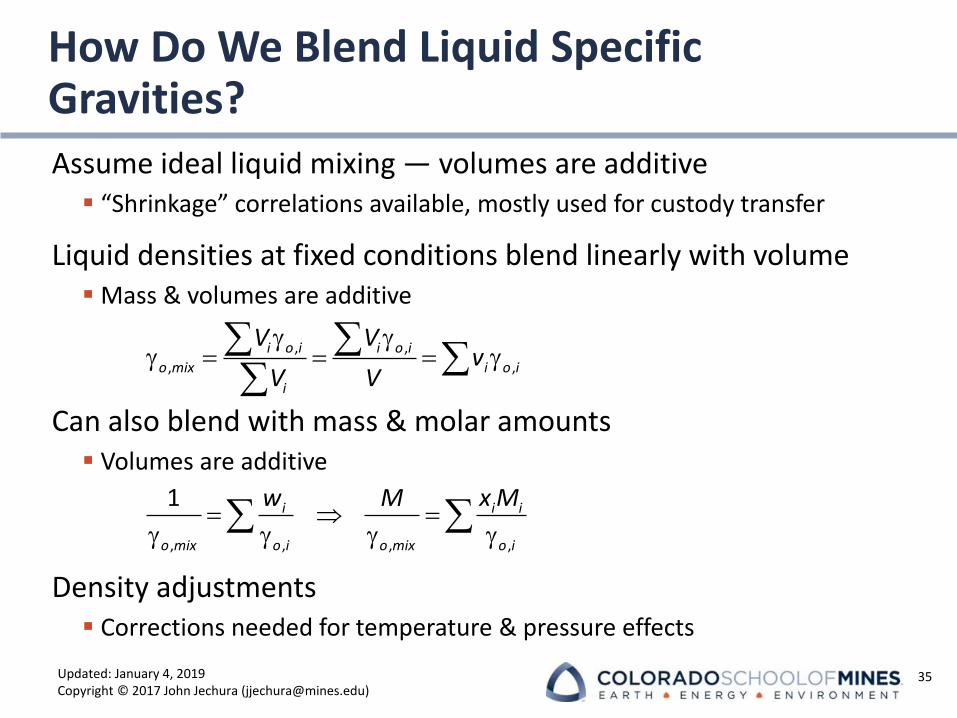
How Do We Blend Liquid Specific Gravities?
Assume ideal liquid mixing — volumes are additive▪ “Shrinkage” correlations available, mostly used for custody transfer
Liquid densities at fixed conditions blend linearly with volume▪ Mass & volumes are additive
Can also blend with mass & molar amounts▪ Volumes are additive
Density adjustments▪ Corrections needed for temperature & pressure effects
35
g gg = = = g
, ,
, ,
i o i i o i
o mix i o i
i
V Vv
V V
= =g g g g
, , , ,
1 i i i
o mix o i o mix o i
w x MM
Updated: January 4, 2019Copyright © 2017 John Jechura ([email protected])
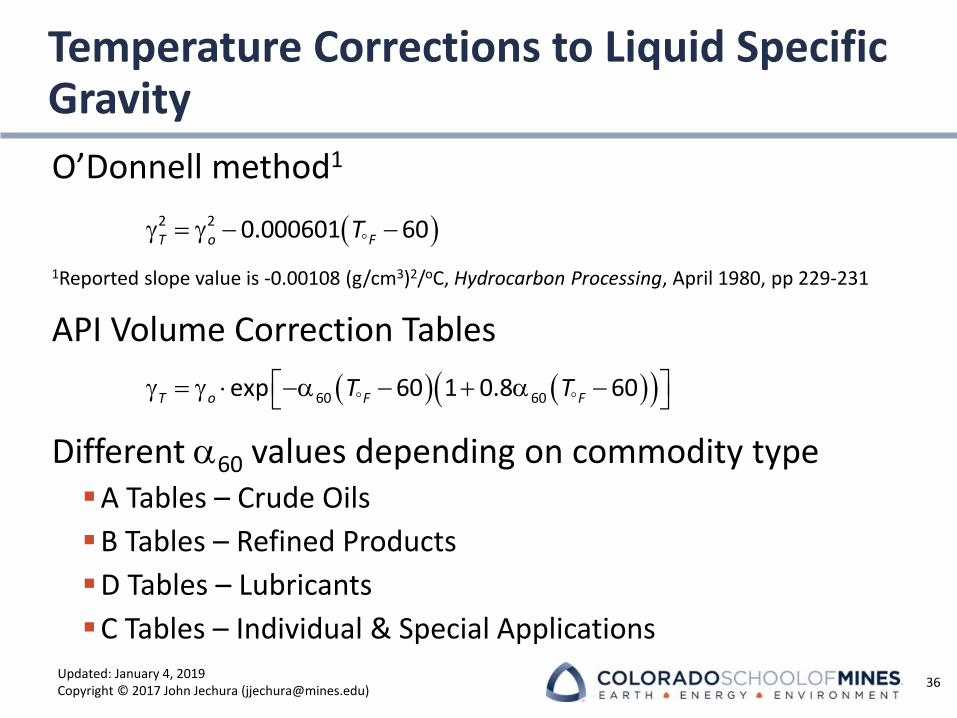
Temperature Corrections to Liquid Specific Gravity
O’Donnell method1
1Reported slope value is -0.00108 (g/cm3)2/oC, Hydrocarbon Processing, April 1980, pp 229-231
API Volume Correction Tables
Different a60 values depending on commodity type▪A Tables – Crude Oils
▪B Tables – Refined Products
▪D Tables – Lubricants
▪C Tables – Individual & Special Applications
36
( )g = g − −2 2 0.000601 60T o FT
( ) ( )( ) g = g −a − + a − 60 60exp 60 1 0.8 60T o F FT T
Updated: January 4, 2019Copyright © 2017 John Jechura ([email protected])
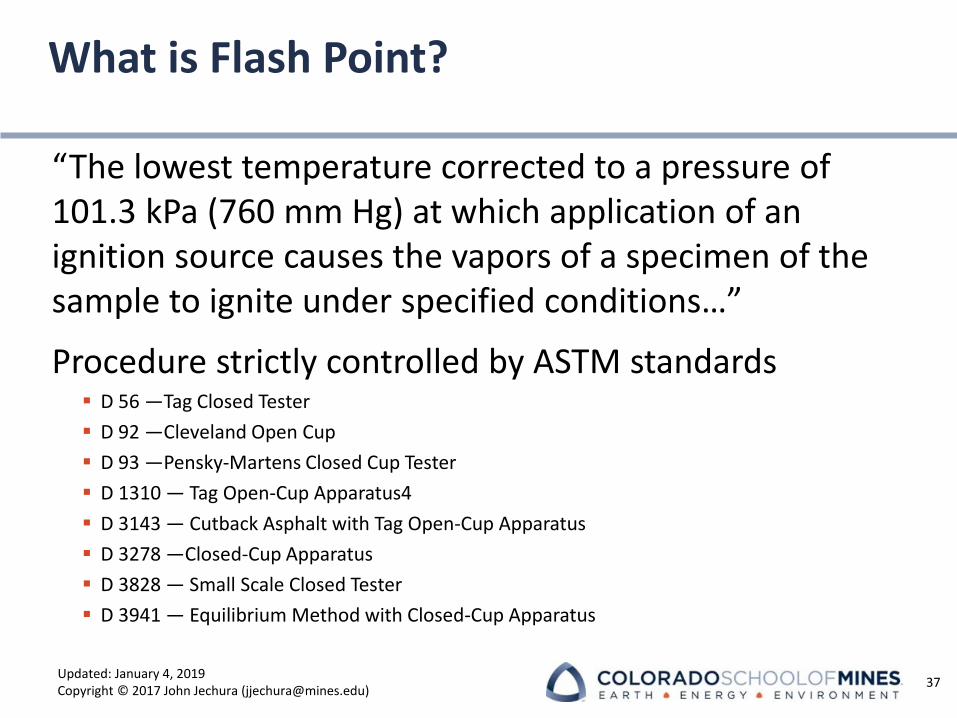
What is Flash Point?
“The lowest temperature corrected to a pressure of 101.3 kPa (760 mm Hg) at which application of an ignition source causes the vapors of a specimen of the sample to ignite under specified conditions…”
Procedure strictly controlled by ASTM standards ▪ D 56 —Tag Closed Tester
▪ D 92 —Cleveland Open Cup
▪ D 93 —Pensky-Martens Closed Cup Tester
▪ D 1310 — Tag Open-Cup Apparatus4
▪ D 3143 — Cutback Asphalt with Tag Open-Cup Apparatus
▪ D 3278 —Closed-Cup Apparatus
▪ D 3828 — Small Scale Closed Tester
▪ D 3941 — Equilibrium Method with Closed-Cup Apparatus
37
Updated: January 4, 2019Copyright © 2017 John Jechura ([email protected])
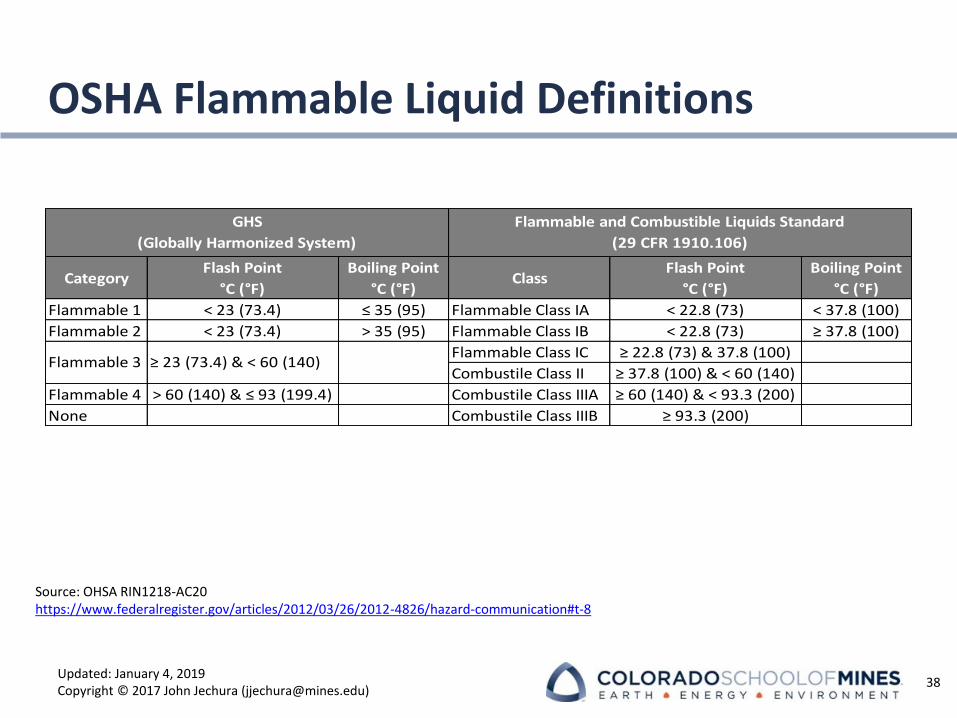
OSHA Flammable Liquid Definitions
38
CategoryFlash Point
°C (°F)
Boiling Point
°C (°F)Class
Flash Point
°C (°F)
Boiling Point
°C (°F)
Flammable 1 < 23 (73.4) ≤ 35 (95) Flammable Class IA < 22.8 (73) < 37.8 (100)
Flammable 2 < 23 (73.4) > 35 (95) Flammable Class IB < 22.8 (73) ≥ 37.8 (100)
Flammable Class IC ≥ 22.8 (73) & 37.8 (100)
Combustile Class II ≥ 37.8 (100) & < 60 (140)
Flammable 4 > 60 (140) & ≤ 93 (199.4) Combustile Class IIIA ≥ 60 (140) & < 93.3 (200)
None Combustile Class IIIB ≥ 93.3 (200)
GHS
(Globally Harmonized System)
Flammable and Combustible Liquids Standard
(29 CFR 1910.106)
Flammable 3 ≥ 23 (73.4) & < 60 (140)
Source: OHSA RIN1218-AC20https://www.federalregister.gov/articles/2012/03/26/2012-4826/hazard-communication#t-8
Updated: January 4, 2019Copyright © 2017 John Jechura ([email protected])
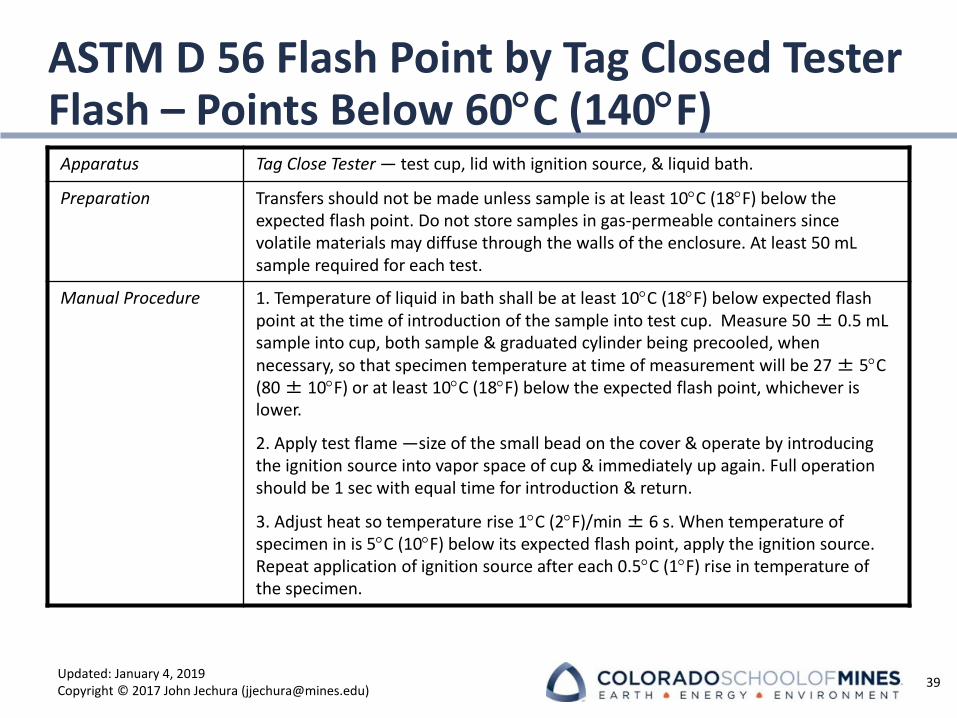
ASTM D 56 Flash Point by Tag Closed Tester Flash – Points Below 60C (140F)
Apparatus Tag Close Tester — test cup, lid with ignition source, & liquid bath.
Preparation Transfers should not be made unless sample is at least 10C (18F) below the expected flash point. Do not store samples in gas-permeable containers since volatile materials may diffuse through the walls of the enclosure. At least 50 mL sample required for each test.
Manual Procedure 1. Temperature of liquid in bath shall be at least 10C (18F) below expected flash point at the time of introduction of the sample into test cup. Measure 50 ± 0.5 mLsample into cup, both sample & graduated cylinder being precooled, when necessary, so that specimen temperature at time of measurement will be 27 ± 5C (80 ± 10F) or at least 10C (18F) below the expected flash point, whichever is lower.
2. Apply test flame —size of the small bead on the cover & operate by introducing the ignition source into vapor space of cup & immediately up again. Full operation should be 1 sec with equal time for introduction & return.
3. Adjust heat so temperature rise 1C (2F)/min ± 6 s. When temperature of specimen in is 5C (10F) below its expected flash point, apply the ignition source. Repeat application of ignition source after each 0.5C (1F) rise in temperature of the specimen.
39
Updated: January 4, 2019Copyright © 2017 John Jechura ([email protected])
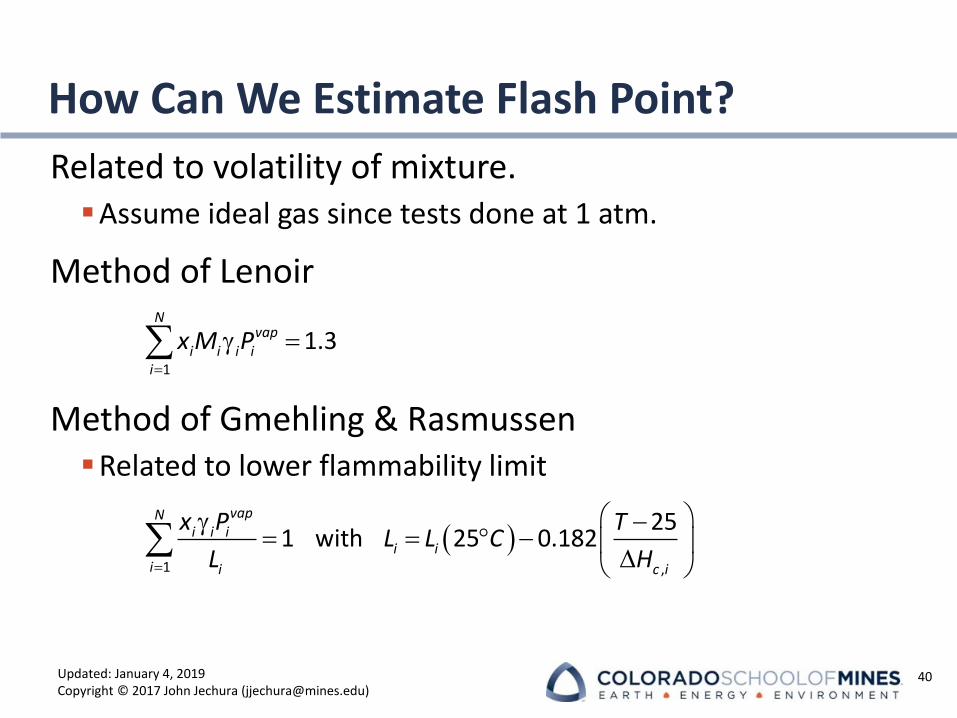
How Can We Estimate Flash Point?
Related to volatility of mixture.▪Assume ideal gas since tests done at 1 atm.
Method of Lenoir
Method of Gmehling & Rasmussen▪Related to lower flammability limit
40
=
g =1
1.3N
vapi i i i
i
x M P
( )=
g −= = −
1 ,
251 with 25 0.182
vapNi i i
i ii i c i
x P TL L C
L H
Updated: January 4, 2019Copyright © 2017 John Jechura ([email protected])
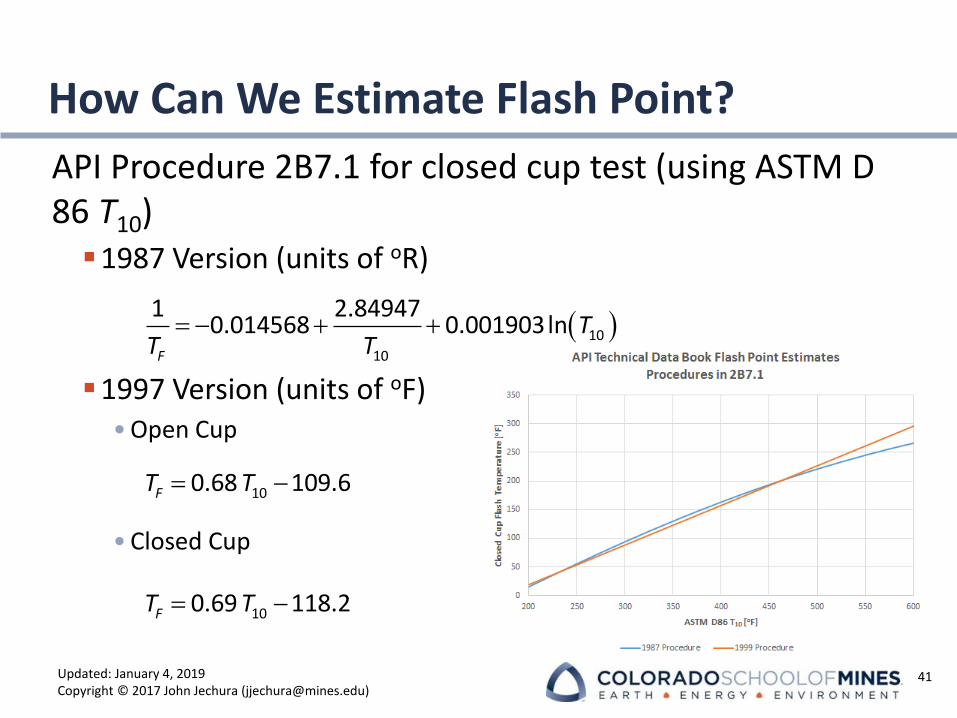
How Can We Estimate Flash Point?
API Procedure 2B7.1 for closed cup test (using ASTM D 86 T10)▪1987 Version (units of oR)
▪1997 Version (units of oF)• Open Cup
• Closed Cup
41
( )= − + + 10
10
1 2.849470.014568 0.001903ln
F
TT T
= −100.68 109.6FT T
= −100.69 118.2FT T
Updated: January 4, 2019Copyright © 2017 John Jechura ([email protected])
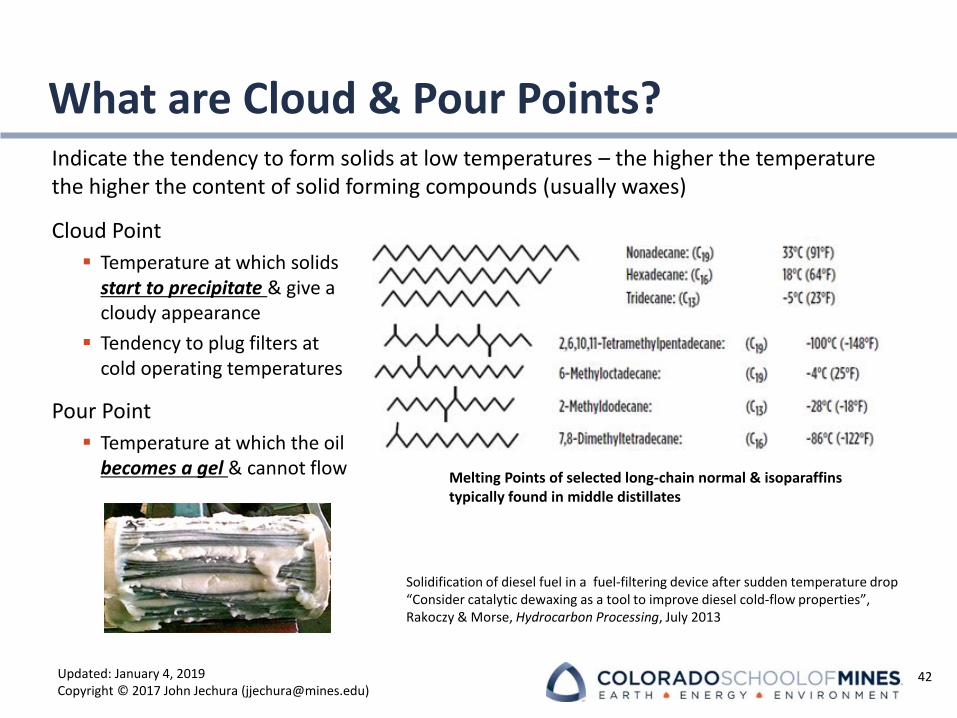
What are Cloud & Pour Points?Indicate the tendency to form solids at low temperatures – the higher the temperature the higher the content of solid forming compounds (usually waxes)
Cloud Point
▪ Temperature at which solids start to precipitate & give a cloudy appearance
▪ Tendency to plug filters at cold operating temperatures
Pour Point
▪ Temperature at which the oil becomes a gel & cannot flow
42
Solidification of diesel fuel in a fuel-filtering device after sudden temperature drop“Consider catalytic dewaxing as a tool to improve diesel cold-flow properties”, Rakoczy & Morse, Hydrocarbon Processing, July 2013
Melting Points of selected long-chain normal & isoparaffinstypically found in middle distillates