Embed Size (px)
Citation preview
Annual Shareholder Report
October 31, 2018
Share Class | Ticker Institutional | FIHBX R6 | FIHLX
Federated Institutional High YieldBond FundFund Established 2002
A Portfolio of Federated Institutional Trust
Dear Valued Shareholder,
I am pleased to present the Annual Shareholder Report for your fund covering the periodfrom November 1, 2017 through October 31, 2018. This report includes Management’sDiscussion of Fund Performance, a complete listing of your fund’s holdings, performanceinformation and financial statements along with other important fund information.
In addition, our website, FederatedInvestors.com, offers easy access to Federatedresources that include timely fund updates, economic and market insights from ourinvestment strategists, and financial planning tools.
Thank you for investing with Federated. I hope you find this information useful and lookforward to keeping you informed.
Sincerely,
J. Christopher Donahue, President
Not FDIC Insured ▪ May Lose Value ▪ No Bank Guarantee
CONTENTS
Management’s Discussion of Fund Performance . . . . . . . . . . . . . . . . . . . . . . . . . . . . . . . . . . . . . . . . . . . . 1
Portfolio of Investments Summary Table . . . . . . . . . . . . . . . . . . . . . . . . . . . . . . . . . . . . . . . . . . . . . . . . . . . . . . 6
Portfolio of Investments. . . . . . . . . . . . . . . . . . . . . . . . . . . . . . . . . . . . . . . . . . . . . . . . . . . . . . . . . . . . . . . . . . . . . . . . . . 7
Financial Highlights . . . . . . . . . . . . . . . . . . . . . . . . . . . . . . . . . . . . . . . . . . . . . . . . . . . . . . . . . . . . . . . . . . . . . . . . . . . . . . 29
Statement of Assets and Liabilities. . . . . . . . . . . . . . . . . . . . . . . . . . . . . . . . . . . . . . . . . . . . . . . . . . . . . . . . . . . . . 31
Statement of Operations. . . . . . . . . . . . . . . . . . . . . . . . . . . . . . . . . . . . . . . . . . . . . . . . . . . . . . . . . . . . . . . . . . . . . . . . . 32
Statement of Changes in Net Assets. . . . . . . . . . . . . . . . . . . . . . . . . . . . . . . . . . . . . . . . . . . . . . . . . . . . . . . . . . . 33
Notes to Financial Statements . . . . . . . . . . . . . . . . . . . . . . . . . . . . . . . . . . . . . . . . . . . . . . . . . . . . . . . . . . . . . . . . . . 34
Report of Independent Registered Public Accounting Firm . . . . . . . . . . . . . . . . . . . . . . . . . . . . . . . . . 42
Shareholder Expense Example . . . . . . . . . . . . . . . . . . . . . . . . . . . . . . . . . . . . . . . . . . . . . . . . . . . . . . . . . . . . . . . . . 44
In Memoriam. . . . . . . . . . . . . . . . . . . . . . . . . . . . . . . . . . . . . . . . . . . . . . . . . . . . . . . . . . . . . . . . . . . . . . . . . . . . . . . . . . . . . . 46
Board of Trustees and Trust Officers . . . . . . . . . . . . . . . . . . . . . . . . . . . . . . . . . . . . . . . . . . . . . . . . . . . . . . . . . . . 46
Evaluation and Approval of Advisory Contract . . . . . . . . . . . . . . . . . . . . . . . . . . . . . . . . . . . . . . . . . . . . . . . . 53
Voting Proxies on Fund Portfolio Securities . . . . . . . . . . . . . . . . . . . . . . . . . . . . . . . . . . . . . . . . . . . . . . . . . . . 60
Quarterly Portfolio Schedule . . . . . . . . . . . . . . . . . . . . . . . . . . . . . . . . . . . . . . . . . . . . . . . . . . . . . . . . . . . . . . . . . . . . 60
Management’s Discussion of FundPerformance (unaudited)The total return of Federated Institutional High Yield Bond Fund (the“Fund”), based on net asset value for the 12-month reporting period endedOctober 31, 2018, was 0.39% for the Institutional Shares and 0.30% forClass R6 Shares. The 0.39% total return for the Fund’s Institutional Shares forthe reporting period consisted of 5.64% of taxable dividends and -5.25% ofdepreciation in the net asset value of shares. The total return of theBloomberg Barclays U.S. Corporate High Yield 2% Issuer Capped Index(BBHY2%ICI),1 a broad-based securities market index, was 0.98% during thesame period. The total return of the Lipper High Yield Funds Average(LHYFA),2 a peer group for the Fund, was 0.32% during the same period. TheFund’s and LHYFA’s total returns for the most recently completed fiscal yearreflected actual cash flows, transaction costs and other expenses which were notreflected in the total return of the BBHY2%ICI.
During the reporting period, the most significant factors affecting the Fund’sperformance relative to the BBHY2%ICI were: (1) the allocation amongindustry sectors; (2) the selection of individual securities; and (3) the Fund’sduration3 positioning.
The following discussion will focus on the performance of the Fund’sInstitutional Shares.
MARKET OVERVIEW
The high-yield4 market generated attractive returns relative to most other fixed-income asset classes during the reporting period. However, rising interest ratesacross the U.S. Treasury yield curve had a negative impact on absolute returnsfor most fixed-income asset classes including high-yield bonds. For example, theinterest rate on 5- and 10-year U.S. Treasury notes increased 96 and 76 basispoints, respectively, during the reporting period. This impact can be seen in the-2.05% return for the Bloomberg Barclays U.S. Aggregate Bond Index,5 ameasure of high quality bond6 performance, for the reporting period. TheBBHY2%ICI’s outperformance for the period under review resulted from itshigher levels of income earned and minimal losses from defaults in a low defaultloss environment. High-yield bonds benefited from a strong economic climateduring the period spurred on by a reduction in regulations, tax cuts and highlevels of both consumer and business confidence. For most of the period, creditspreads were narrower than the 393 basis points level at the end of the Fund’sprior fiscal year. However, weaker equity prices at the end of the reportingperiod, driven by the fear of rising interest rates, concerns over a potential tradewar with China and the rapidly approaching midterm elections, caused creditspreads to widen in the final month of the period by 62 basis points. For the
Annual Shareholder Report1
period as a whole, the yield spread between the Credit Suisse High Yield BondIndex7 and U.S. Treasury securities of comparable maturities increased from393 basis points on October 31, 2017 to 422 basis points on October 31, 2018.
Within the high-yield market, major industry sectors that substantiallyoutperformed the overall BBHY2%ICI included: Pharmaceuticals, Healthcare,Transportation Services, Oil Field Services and Independent Energy. Majorindustry sectors that substantially underperformed the overall BBHY2%ICIincluded: Automotive, Home Construction, Banking, Food & Beverage andBuilding Materials. From a credit quality perspective, the lower qualityeconomically sensitive “CCC”-rated sector led the way during the reportingperiod with a 4.07% return followed by the “B”-rated sector with a 1.54%return. The more interest rate sensitive “BB”-rated sector returned -0.85%during the reporting period reflecting the rising rate environment.
SECTOR ALLOCATION
During the reporting period, the Fund was positively affected by its sectorallocation. The Fund benefited from its overweight position to the strong-performing Pharmaceutical and Healthcare sectors. The Fund also was positivelyimpacted by its underweight position to the poor-performing HomeConstruction and Banking sectors. The Fund was negatively affected by itsoverweight position to the underperforming Packaging sector and itsunderweight position to the strong-performing Oil Field Service sector.
SECURITY SELECTION
During the reporting period, the Fund was negatively affected by securityselection. This was especially true in the Cable & Satellite, WirelessTelecommunication, Midstream, Food & Beverage and Independent Energyindustry sectors. Specific Fund holdings that negatively impacted performancerelative to the BBHY2%ICI included: Anna Merger Sub, Ultra Resource, AlticeSA, FGI Operating and PetSmart.
The Fund was positively impacted by security selection in the Technologysector. Specific Fund holdings that positively impacted performance relative tothe BBHY2%ICI included: Bausch Health Cos., Hub International, EndoFinance, Riverbed Technology and Envision Healthcare.
DURATION
The Fund had a modestly shorter duration than the BBHY2%ICI whichpositively impacted Fund performance given the increase in the general interestrate level and the widening of credit spreads.
Annual Shareholder Report2

1 Please see the footnotes to the line graphs below for definitions of, and further information about,the BBHY2%ICI.
2 Please see the footnotes to the line graphs below for definitions of, and further information about,the LHYFA.
3 Duration is a measure of a security’s price sensitivity to changes in interest rates. Securities with longerdurations are more sensitive to changes in interest rates than securities of shorter duration.
4 High-yield, lower-rated securities generally entail greater market, credit and liquidity risks thaninvestment-grade securities and may include higher volatility and a higher risk of default.
5 The Bloomberg Barclays U.S. Aggregate Bond Index is a broad-based index that measures theinvestment grade, U.S. dollar-denominated, fixed-rate taxable bond market.*
6 Bond prices are sensitive to changes in interest rates, and a rise in interest rates can cause a decline intheir prices.
7 Credit Suisse High Yield Bond Index serves as a benchmark to evaluate the performance of low-qualitybonds. Low-quality is defined as those bonds in the range from “BB” to “CCC” and defaults.*
* The index is unmanaged, and it is not possible to invest directly in an index.
Annual Shareholder Report3
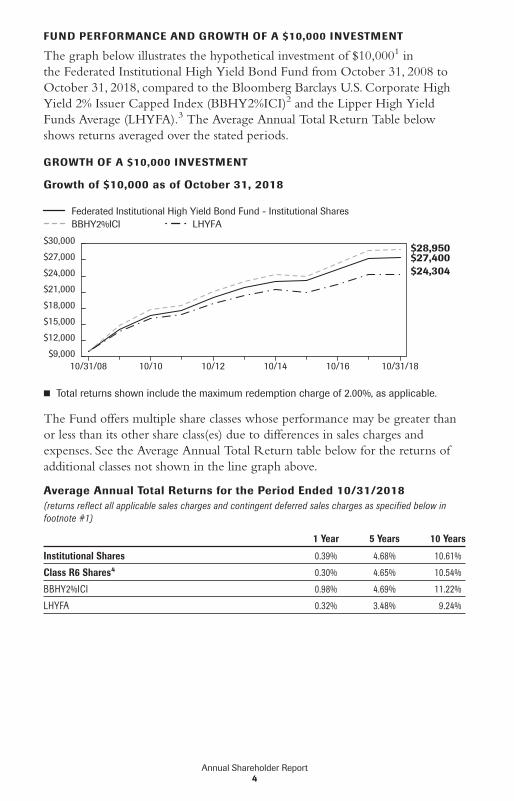
FUND PERFORMANCE AND GROWTH OF A $10,000 INVESTMENT
The graph below illustrates the hypothetical investment of $10,0001 inthe Federated Institutional High Yield Bond Fund from October 31, 2008 toOctober 31, 2018, compared to the Bloomberg Barclays U.S. Corporate HighYield 2% Issuer Capped Index (BBHY2%ICI)2 and the Lipper High YieldFunds Average (LHYFA).3 The Average Annual Total Return Table belowshows returns averaged over the stated periods.
GROWTH OF A $10,000 INVESTMENT
Growth of $10,000 as of October 31, 2018
Federated Institutional High Yield Bond Fund - Institutional SharesBBHY2%ICI LHYFA
$9,000
$12,000
$15,000
$18,000
$21,000
$24,000
$27,000
$30,000
10/31/08 10/31/1810/10 10/12 10/14 10/16
$27,400$28,950
$24,304
� Total returns shown include the maximum redemption charge of 2.00%, as applicable.
The Fund offers multiple share classes whose performance may be greater thanor less than its other share class(es) due to differences in sales charges andexpenses. See the Average Annual Total Return table below for the returns ofadditional classes not shown in the line graph above.
Average Annual Total Returns for the Period Ended 10/31/2018(returns reflect all applicable sales charges and contingent deferred sales charges as specified below infootnote #1)
1 Year 5 Years 10 Years
Institutional Shares 0.39% 4.68% 10.61%
Class R6 Shares4 0.30% 4.65% 10.54%
BBHY2%ICI 0.98% 4.69% 11.22%
LHYFA 0.32% 3.48% 9.24%
Annual Shareholder Report4
Performance data quoted represents past performance which is noguarantee of future results. Investment return and principal value willfluctuate so that an investor’s shares, when redeemed, may be worthmore or less than their original cost. Mutual fund performancechanges over time and current performance may be lower or higherthan what is stated. For current to the most recent month-endperformance and after-tax returns, visit FederatedInvestors.com or call1-800-341-7400. Returns shown do not reflect the deduction of taxesthat a shareholder would pay on Fund distributions or the redemptionof Fund shares. Mutual funds are not obligations of or guaranteed byany bank and are not federally insured.
1 Represents a hypothetical investment of $10,000 in the Fund. A 2.00% redemption fee will be applied toany redemption less than 90 days from the purchase date. The Fund’s performance assumes thereinvestment of all dividends and distributions. The BBHY2%ICI and the LHYFA have been adjusted toreflect reinvestment of dividends on securities in the indices.
2 The BBHY2%ICI is an issuer-constrained version of the Bloomberg Barclays U.S. Corporate High-YieldIndex that measures the market of USD-denominated, noninvestment-grade, fixed-rate, taxablecorporate bonds. The index follows the same rules as the uncapped index but limits the exposure ofeach issuer to 2% of the total market value and redistributes any excess market value index-wide on apro-rata basis. The BBHY2%ICI is not adjusted to reflect sales charges, expenses or other fees that theSecurities and Exchange Commission (SEC) requires to be reflected in the Fund’s performance. Theindex is unmanaged and unlike the Fund, is not affected by cash flows. It is not possible to investdirectly in an index.
3 Lipper figures represent the average of the total returns reported by all funds designated by Lipper, Inc.,as falling into the respective category and is not adjusted to reflect any sales charges. The Lipper figuresin the Growth of $10,000 line graph are based on historical return information published by Lipper andreflect the return of the funds comprising the category in the year of publication. Because the fundsdesignated by Lipper as falling into the category can change over time, the Lipper figures in the linegraph may not match the Lipper figures in the Average Annual Total Returns table, which reflect thereturn of the funds that currently comprise the category.
4 The Fund’s R6 Shares commenced operations on June 29, 2016. For the period prior to thecommencement of operations of the R6 Shares, the performance information shown is for InstitutionalShares adjusted to reflect the expenses of R6 Shares for each year for which the Fund’s R6 expenseswould have exceeded the actual expenses paid by the Fund’s Institutional Shares.
Annual Shareholder Report5
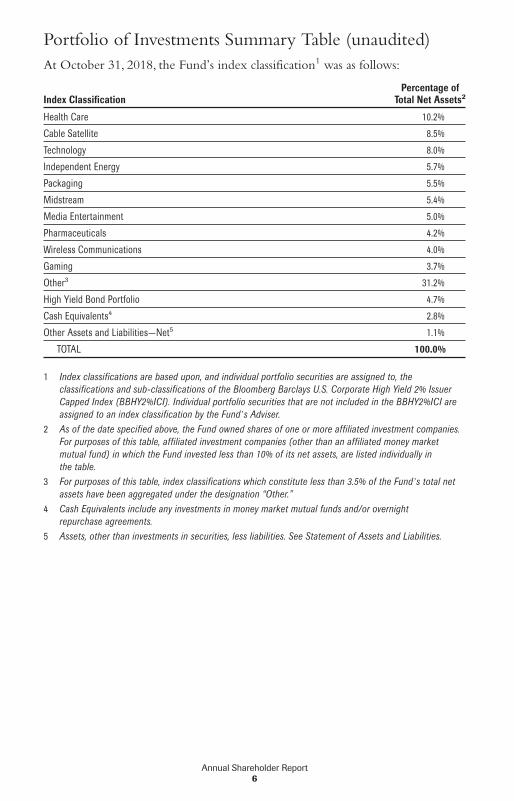
Portfolio of Investments Summary Table (unaudited)At October 31, 2018, the Fund’s index classification1 was as follows:
Index ClassificationPercentage of
Total Net Assets2
Health Care 10.2%
Cable Satellite 8.5%
Technology 8.0%
Independent Energy 5.7%
Packaging 5.5%
Midstream 5.4%
Media Entertainment 5.0%
Pharmaceuticals 4.2%
Wireless Communications 4.0%
Gaming 3.7%
Other3 31.2%
High Yield Bond Portfolio 4.7%
Cash Equivalents4 2.8%
Other Assets and Liabilities—Net5 1.1%
TOTAL 100.0%
1 Index classifications are based upon, and individual portfolio securities are assigned to, theclassifications and sub-classifications of the Bloomberg Barclays U.S. Corporate High Yield 2% IssuerCapped Index (BBHY2%ICI). Individual portfolio securities that are not included in the BBHY2%ICI areassigned to an index classification by the Fund’s Adviser.
2 As of the date specified above, the Fund owned shares of one or more affiliated investment companies.For purposes of this table, affiliated investment companies (other than an affiliated money marketmutual fund) in which the Fund invested less than 10% of its net assets, are listed individually inthe table.
3 For purposes of this table, index classifications which constitute less than 3.5% of the Fund’s total netassets have been aggregated under the designation “Other.”
4 Cash Equivalents include any investments in money market mutual funds and/or overnightrepurchase agreements.
5 Assets, other than investments in securities, less liabilities. See Statement of Assets and Liabilities.
Annual Shareholder Report6
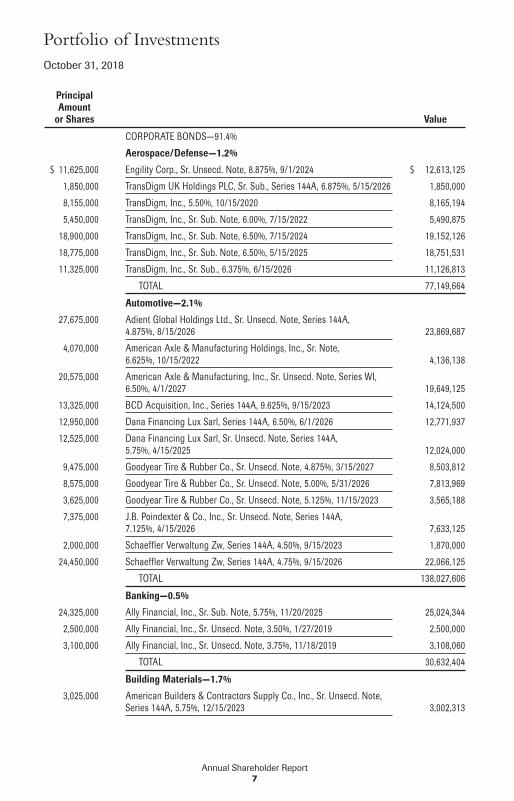
Portfolio of InvestmentsOctober 31, 2018
PrincipalAmount
or Shares Value
CORPORATE BONDS—91.4%
Aerospace/Defense—1.2%
$ 11,625,000 Engility Corp., Sr. Unsecd. Note, 8.875%, 9/1/2024 $ 12,613,125
1,850,000 TransDigm UK Holdings PLC, Sr. Sub., Series 144A, 6.875%, 5/15/2026 1,850,000
8,155,000 TransDigm, Inc., 5.50%, 10/15/2020 8,165,194
5,450,000 TransDigm, Inc., Sr. Sub. Note, 6.00%, 7/15/2022 5,490,875
18,900,000 TransDigm, Inc., Sr. Sub. Note, 6.50%, 7/15/2024 19,152,126
18,775,000 TransDigm, Inc., Sr. Sub. Note, 6.50%, 5/15/2025 18,751,531
11,325,000 TransDigm, Inc., Sr. Sub., 6.375%, 6/15/2026 11,126,813
TOTAL 77,149,664
Automotive—2.1%
27,675,000 Adient Global Holdings Ltd., Sr. Unsecd. Note, Series 144A,4.875%, 8/15/2026 23,869,687
4,070,000 American Axle & Manufacturing Holdings, Inc., Sr. Note,6.625%, 10/15/2022 4,136,138
20,575,000 American Axle & Manufacturing, Inc., Sr. Unsecd. Note, Series WI,6.50%, 4/1/2027 19,649,125
13,325,000 BCD Acquisition, Inc., Series 144A, 9.625%, 9/15/2023 14,124,500
12,950,000 Dana Financing Lux Sarl, Series 144A, 6.50%, 6/1/2026 12,771,937
12,525,000 Dana Financing Lux Sarl, Sr. Unsecd. Note, Series 144A,5.75%, 4/15/2025 12,024,000
9,475,000 Goodyear Tire & Rubber Co., Sr. Unsecd. Note, 4.875%, 3/15/2027 8,503,812
8,575,000 Goodyear Tire & Rubber Co., Sr. Unsecd. Note, 5.00%, 5/31/2026 7,813,969
3,625,000 Goodyear Tire & Rubber Co., Sr. Unsecd. Note, 5.125%, 11/15/2023 3,565,188
7,375,000 J.B. Poindexter & Co., Inc., Sr. Unsecd. Note, Series 144A,7.125%, 4/15/2026 7,633,125
2,000,000 Schaeffler Verwaltung Zw, Series 144A, 4.50%, 9/15/2023 1,870,000
24,450,000 Schaeffler Verwaltung Zw, Series 144A, 4.75%, 9/15/2026 22,066,125
TOTAL 138,027,606
Banking—0.5%
24,325,000 Ally Financial, Inc., Sr. Sub. Note, 5.75%, 11/20/2025 25,024,344
2,500,000 Ally Financial, Inc., Sr. Unsecd. Note, 3.50%, 1/27/2019 2,500,000
3,100,000 Ally Financial, Inc., Sr. Unsecd. Note, 3.75%, 11/18/2019 3,108,060
TOTAL 30,632,404
Building Materials—1.7%
3,025,000 American Builders & Contractors Supply Co., Inc., Sr. Unsecd. Note,Series 144A, 5.75%, 12/15/2023 3,002,313
Annual Shareholder Report7
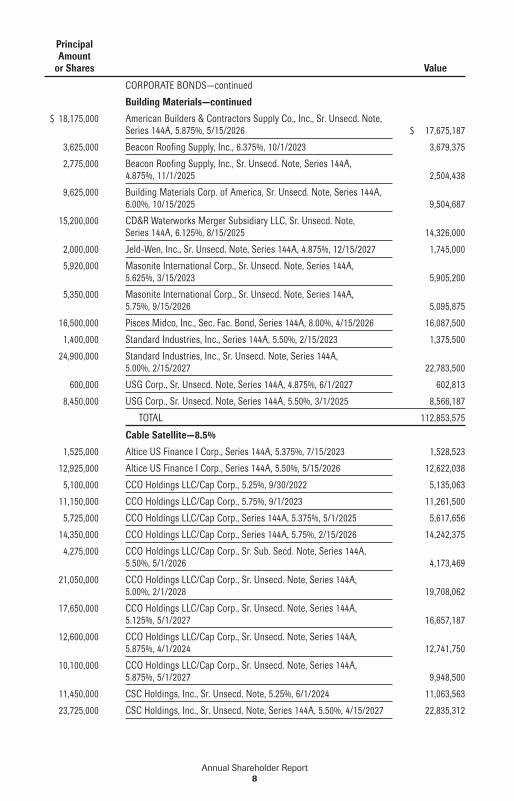
PrincipalAmount
or Shares Value
CORPORATE BONDS—continued
Building Materials—continued
$ 18,175,000 American Builders & Contractors Supply Co., Inc., Sr. Unsecd. Note,Series 144A, 5.875%, 5/15/2026 $ 17,675,187
3,625,000 Beacon Roofing Supply, Inc., 6.375%, 10/1/2023 3,679,375
2,775,000 Beacon Roofing Supply, Inc., Sr. Unsecd. Note, Series 144A,4.875%, 11/1/2025 2,504,438
9,625,000 Building Materials Corp. of America, Sr. Unsecd. Note, Series 144A,6.00%, 10/15/2025 9,504,687
15,200,000 CD&R Waterworks Merger Subsidiary LLC, Sr. Unsecd. Note,Series 144A, 6.125%, 8/15/2025 14,326,000
2,000,000 Jeld-Wen, Inc., Sr. Unsecd. Note, Series 144A, 4.875%, 12/15/2027 1,745,000
5,920,000 Masonite International Corp., Sr. Unsecd. Note, Series 144A,5.625%, 3/15/2023 5,905,200
5,350,000 Masonite International Corp., Sr. Unsecd. Note, Series 144A,5.75%, 9/15/2026 5,095,875
16,500,000 Pisces Midco, Inc., Sec. Fac. Bond, Series 144A, 8.00%, 4/15/2026 16,087,500
1,400,000 Standard Industries, Inc., Series 144A, 5.50%, 2/15/2023 1,375,500
24,900,000 Standard Industries, Inc., Sr. Unsecd. Note, Series 144A,5.00%, 2/15/2027 22,783,500
600,000 USG Corp., Sr. Unsecd. Note, Series 144A, 4.875%, 6/1/2027 602,813
8,450,000 USG Corp., Sr. Unsecd. Note, Series 144A, 5.50%, 3/1/2025 8,566,187
TOTAL 112,853,575
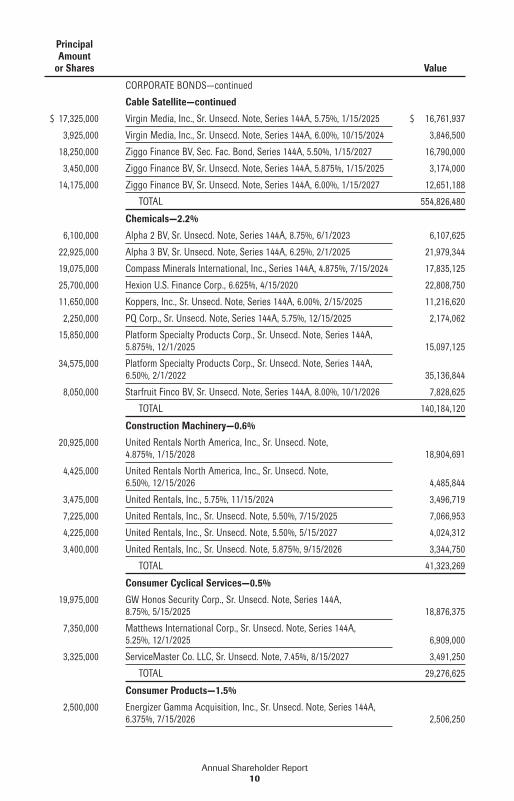
Cable Satellite—8.5%
1,525,000 Altice US Finance I Corp., Series 144A, 5.375%, 7/15/2023 1,528,523
12,925,000 Altice US Finance I Corp., Series 144A, 5.50%, 5/15/2026 12,622,038
5,100,000 CCO Holdings LLC/Cap Corp., 5.25%, 9/30/2022 5,135,063
11,150,000 CCO Holdings LLC/Cap Corp., 5.75%, 9/1/2023 11,261,500
5,725,000 CCO Holdings LLC/Cap Corp., Series 144A, 5.375%, 5/1/2025 5,617,656
14,350,000 CCO Holdings LLC/Cap Corp., Series 144A, 5.75%, 2/15/2026 14,242,375
4,275,000 CCO Holdings LLC/Cap Corp., Sr. Sub. Secd. Note, Series 144A,5.50%, 5/1/2026 4,173,469
21,050,000 CCO Holdings LLC/Cap Corp., Sr. Unsecd. Note, Series 144A,5.00%, 2/1/2028 19,708,062
17,650,000 CCO Holdings LLC/Cap Corp., Sr. Unsecd. Note, Series 144A,5.125%, 5/1/2027 16,657,187
12,600,000 CCO Holdings LLC/Cap Corp., Sr. Unsecd. Note, Series 144A,5.875%, 4/1/2024 12,741,750
10,100,000 CCO Holdings LLC/Cap Corp., Sr. Unsecd. Note, Series 144A,5.875%, 5/1/2027 9,948,500
11,450,000 CSC Holdings, Inc., Sr. Unsecd. Note, 5.25%, 6/1/2024 11,063,563
23,725,000 CSC Holdings, Inc., Sr. Unsecd. Note, Series 144A, 5.50%, 4/15/2027 22,835,312
Annual Shareholder Report8
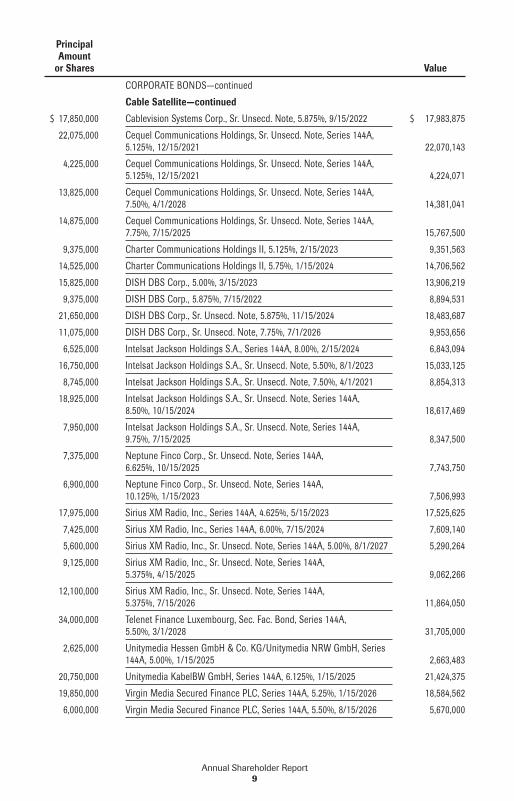
PrincipalAmount
or Shares Value
CORPORATE BONDS—continued
Cable Satellite—continued
$ 17,850,000 Cablevision Systems Corp., Sr. Unsecd. Note, 5.875%, 9/15/2022 $ 17,983,875
22,075,000 Cequel Communications Holdings, Sr. Unsecd. Note, Series 144A,5.125%, 12/15/2021 22,070,143
4,225,000 Cequel Communications Holdings, Sr. Unsecd. Note, Series 144A,5.125%, 12/15/2021 4,224,071
13,825,000 Cequel Communications Holdings, Sr. Unsecd. Note, Series 144A,7.50%, 4/1/2028 14,381,041
14,875,000 Cequel Communications Holdings, Sr. Unsecd. Note, Series 144A,7.75%, 7/15/2025 15,767,500
9,375,000 Charter Communications Holdings II, 5.125%, 2/15/2023 9,351,563
14,525,000 Charter Communications Holdings II, 5.75%, 1/15/2024 14,706,562
15,825,000 DISH DBS Corp., 5.00%, 3/15/2023 13,906,219
9,375,000 DISH DBS Corp., 5.875%, 7/15/2022 8,894,531
21,650,000 DISH DBS Corp., Sr. Unsecd. Note, 5.875%, 11/15/2024 18,483,687
11,075,000 DISH DBS Corp., Sr. Unsecd. Note, 7.75%, 7/1/2026 9,953,656
6,525,000 Intelsat Jackson Holdings S.A., Series 144A, 8.00%, 2/15/2024 6,843,094
16,750,000 Intelsat Jackson Holdings S.A., Sr. Unsecd. Note, 5.50%, 8/1/2023 15,033,125
8,745,000 Intelsat Jackson Holdings S.A., Sr. Unsecd. Note, 7.50%, 4/1/2021 8,854,313
18,925,000 Intelsat Jackson Holdings S.A., Sr. Unsecd. Note, Series 144A,8.50%, 10/15/2024 18,617,469
7,950,000 Intelsat Jackson Holdings S.A., Sr. Unsecd. Note, Series 144A,9.75%, 7/15/2025 8,347,500
7,375,000 Neptune Finco Corp., Sr. Unsecd. Note, Series 144A,6.625%, 10/15/2025 7,743,750
6,900,000 Neptune Finco Corp., Sr. Unsecd. Note, Series 144A,10.125%, 1/15/2023 7,506,993
17,975,000 Sirius XM Radio, Inc., Series 144A, 4.625%, 5/15/2023 17,525,625
7,425,000 Sirius XM Radio, Inc., Series 144A, 6.00%, 7/15/2024 7,609,140
5,600,000 Sirius XM Radio, Inc., Sr. Unsecd. Note, Series 144A, 5.00%, 8/1/2027 5,290,264
9,125,000 Sirius XM Radio, Inc., Sr. Unsecd. Note, Series 144A,5.375%, 4/15/2025 9,062,266
12,100,000 Sirius XM Radio, Inc., Sr. Unsecd. Note, Series 144A,5.375%, 7/15/2026 11,864,050
34,000,000 Telenet Finance Luxembourg, Sec. Fac. Bond, Series 144A,5.50%, 3/1/2028 31,705,000
2,625,000 Unitymedia Hessen GmbH & Co. KG/Unitymedia NRW GmbH, Series144A, 5.00%, 1/15/2025 2,663,483
20,750,000 Unitymedia KabelBW GmbH, Series 144A, 6.125%, 1/15/2025 21,424,375
19,850,000 Virgin Media Secured Finance PLC, Series 144A, 5.25%, 1/15/2026 18,584,562
6,000,000 Virgin Media Secured Finance PLC, Series 144A, 5.50%, 8/15/2026 5,670,000
Annual Shareholder Report9
PrincipalAmount
or Shares Value
CORPORATE BONDS—continued
Cable Satellite—continued
$ 17,325,000 Virgin Media, Inc., Sr. Unsecd. Note, Series 144A, 5.75%, 1/15/2025 $ 16,761,937
3,925,000 Virgin Media, Inc., Sr. Unsecd. Note, Series 144A, 6.00%, 10/15/2024 3,846,500
18,250,000 Ziggo Finance BV, Sec. Fac. Bond, Series 144A, 5.50%, 1/15/2027 16,790,000
3,450,000 Ziggo Finance BV, Sr. Unsecd. Note, Series 144A, 5.875%, 1/15/2025 3,174,000
14,175,000 Ziggo Finance BV, Sr. Unsecd. Note, Series 144A, 6.00%, 1/15/2027 12,651,188
TOTAL 554,826,480
Chemicals—2.2%
6,100,000 Alpha 2 BV, Sr. Unsecd. Note, Series 144A, 8.75%, 6/1/2023 6,107,625
22,925,000 Alpha 3 BV, Sr. Unsecd. Note, Series 144A, 6.25%, 2/1/2025 21,979,344
19,075,000 Compass Minerals International, Inc., Series 144A, 4.875%, 7/15/2024 17,835,125
25,700,000 Hexion U.S. Finance Corp., 6.625%, 4/15/2020 22,808,750
11,650,000 Koppers, Inc., Sr. Unsecd. Note, Series 144A, 6.00%, 2/15/2025 11,216,620
2,250,000 PQ Corp., Sr. Unsecd. Note, Series 144A, 5.75%, 12/15/2025 2,174,062
15,850,000 Platform Specialty Products Corp., Sr. Unsecd. Note, Series 144A,5.875%, 12/1/2025 15,097,125
34,575,000 Platform Specialty Products Corp., Sr. Unsecd. Note, Series 144A,6.50%, 2/1/2022 35,136,844
8,050,000 Starfruit Finco BV, Sr. Unsecd. Note, Series 144A, 8.00%, 10/1/2026 7,828,625
TOTAL 140,184,120
Construction Machinery—0.6%
20,925,000 United Rentals North America, Inc., Sr. Unsecd. Note,4.875%, 1/15/2028 18,904,691
4,425,000 United Rentals North America, Inc., Sr. Unsecd. Note,6.50%, 12/15/2026 4,485,844
3,475,000 United Rentals, Inc., 5.75%, 11/15/2024 3,496,719
7,225,000 United Rentals, Inc., Sr. Unsecd. Note, 5.50%, 7/15/2025 7,066,953
4,225,000 United Rentals, Inc., Sr. Unsecd. Note, 5.50%, 5/15/2027 4,024,312
3,400,000 United Rentals, Inc., Sr. Unsecd. Note, 5.875%, 9/15/2026 3,344,750
TOTAL 41,323,269
Consumer Cyclical Services—0.5%
19,975,000 GW Honos Security Corp., Sr. Unsecd. Note, Series 144A,8.75%, 5/15/2025 18,876,375
7,350,000 Matthews International Corp., Sr. Unsecd. Note, Series 144A,5.25%, 12/1/2025 6,909,000
3,325,000 ServiceMaster Co. LLC, Sr. Unsecd. Note, 7.45%, 8/15/2027 3,491,250
TOTAL 29,276,625
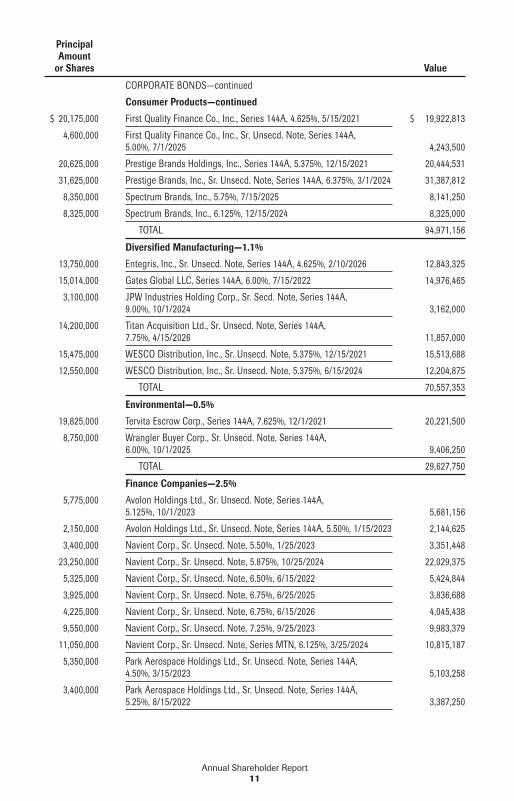
Consumer Products—1.5%
2,500,000 Energizer Gamma Acquisition, Inc., Sr. Unsecd. Note, Series 144A,6.375%, 7/15/2026 2,506,250
Annual Shareholder Report10
PrincipalAmount
or Shares Value
CORPORATE BONDS—continued
Consumer Products—continued
$ 20,175,000 First Quality Finance Co., Inc., Series 144A, 4.625%, 5/15/2021 $ 19,922,813
4,600,000 First Quality Finance Co., Inc., Sr. Unsecd. Note, Series 144A,5.00%, 7/1/2025 4,243,500
20,625,000 Prestige Brands Holdings, Inc., Series 144A, 5.375%, 12/15/2021 20,444,531
31,625,000 Prestige Brands, Inc., Sr. Unsecd. Note, Series 144A, 6.375%, 3/1/2024 31,387,812
8,350,000 Spectrum Brands, Inc., 5.75%, 7/15/2025 8,141,250
8,325,000 Spectrum Brands, Inc., 6.125%, 12/15/2024 8,325,000
TOTAL 94,971,156
Diversified Manufacturing—1.1%
13,750,000 Entegris, Inc., Sr. Unsecd. Note, Series 144A, 4.625%, 2/10/2026 12,843,325
15,014,000 Gates Global LLC, Series 144A, 6.00%, 7/15/2022 14,976,465
3,100,000 JPW Industries Holding Corp., Sr. Secd. Note, Series 144A,9.00%, 10/1/2024 3,162,000
14,200,000 Titan Acquisition Ltd., Sr. Unsecd. Note, Series 144A,7.75%, 4/15/2026 11,857,000
15,475,000 WESCO Distribution, Inc., Sr. Unsecd. Note, 5.375%, 12/15/2021 15,513,688
12,550,000 WESCO Distribution, Inc., Sr. Unsecd. Note, 5.375%, 6/15/2024 12,204,875
TOTAL 70,557,353
Environmental—0.5%
19,825,000 Tervita Escrow Corp., Series 144A, 7.625%, 12/1/2021 20,221,500
8,750,000 Wrangler Buyer Corp., Sr. Unsecd. Note, Series 144A,6.00%, 10/1/2025 9,406,250
TOTAL 29,627,750
Finance Companies—2.5%
5,775,000 Avolon Holdings Ltd., Sr. Unsecd. Note, Series 144A,5.125%, 10/1/2023 5,681,156
2,150,000 Avolon Holdings Ltd., Sr. Unsecd. Note, Series 144A, 5.50%, 1/15/2023 2,144,625
3,400,000 Navient Corp., Sr. Unsecd. Note, 5.50%, 1/25/2023 3,351,448
23,250,000 Navient Corp., Sr. Unsecd. Note, 5.875%, 10/25/2024 22,029,375
5,325,000 Navient Corp., Sr. Unsecd. Note, 6.50%, 6/15/2022 5,424,844
3,925,000 Navient Corp., Sr. Unsecd. Note, 6.75%, 6/25/2025 3,836,688
4,225,000 Navient Corp., Sr. Unsecd. Note, 6.75%, 6/15/2026 4,045,438
9,550,000 Navient Corp., Sr. Unsecd. Note, 7.25%, 9/25/2023 9,983,379
11,050,000 Navient Corp., Sr. Unsecd. Note, Series MTN, 6.125%, 3/25/2024 10,815,187
5,350,000 Park Aerospace Holdings Ltd., Sr. Unsecd. Note, Series 144A,4.50%, 3/15/2023 5,103,258
3,400,000 Park Aerospace Holdings Ltd., Sr. Unsecd. Note, Series 144A,5.25%, 8/15/2022 3,387,250
Annual Shareholder Report11
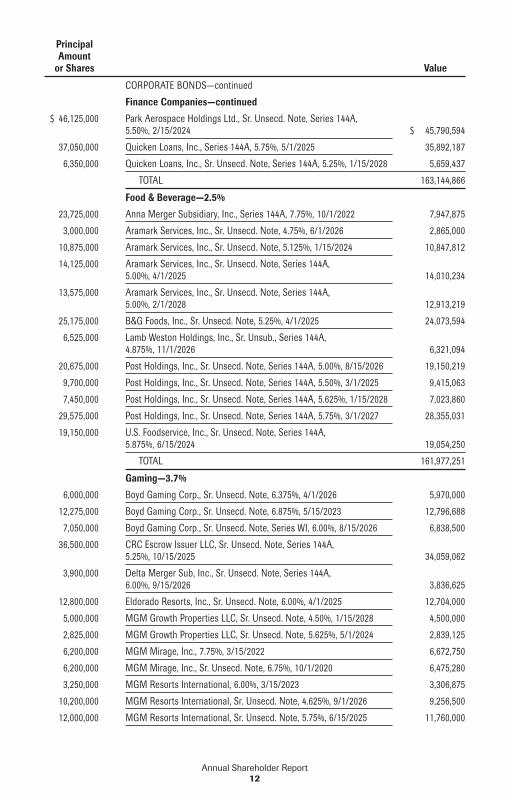
PrincipalAmount
or Shares Value
CORPORATE BONDS—continued
Finance Companies—continued
$ 46,125,000 Park Aerospace Holdings Ltd., Sr. Unsecd. Note, Series 144A,5.50%, 2/15/2024 $ 45,790,594
37,050,000 Quicken Loans, Inc., Series 144A, 5.75%, 5/1/2025 35,892,187
6,350,000 Quicken Loans, Inc., Sr. Unsecd. Note, Series 144A, 5.25%, 1/15/2028 5,659,437
TOTAL 163,144,866
Food & Beverage—2.5%
23,725,000 Anna Merger Subsidiary, Inc., Series 144A, 7.75%, 10/1/2022 7,947,875
3,000,000 Aramark Services, Inc., Sr. Unsecd. Note, 4.75%, 6/1/2026 2,865,000
10,875,000 Aramark Services, Inc., Sr. Unsecd. Note, 5.125%, 1/15/2024 10,847,812
14,125,000 Aramark Services, Inc., Sr. Unsecd. Note, Series 144A,5.00%, 4/1/2025 14,010,234
13,575,000 Aramark Services, Inc., Sr. Unsecd. Note, Series 144A,5.00%, 2/1/2028 12,913,219
25,175,000 B&G Foods, Inc., Sr. Unsecd. Note, 5.25%, 4/1/2025 24,073,594
6,525,000 Lamb Weston Holdings, Inc., Sr. Unsub., Series 144A,4.875%, 11/1/2026 6,321,094
20,675,000 Post Holdings, Inc., Sr. Unsecd. Note, Series 144A, 5.00%, 8/15/2026 19,150,219
9,700,000 Post Holdings, Inc., Sr. Unsecd. Note, Series 144A, 5.50%, 3/1/2025 9,415,063
7,450,000 Post Holdings, Inc., Sr. Unsecd. Note, Series 144A, 5.625%, 1/15/2028 7,023,860
29,575,000 Post Holdings, Inc., Sr. Unsecd. Note, Series 144A, 5.75%, 3/1/2027 28,355,031
19,150,000 U.S. Foodservice, Inc., Sr. Unsecd. Note, Series 144A,5.875%, 6/15/2024 19,054,250
TOTAL 161,977,251
Gaming—3.7%
6,000,000 Boyd Gaming Corp., Sr. Unsecd. Note, 6.375%, 4/1/2026 5,970,000
12,275,000 Boyd Gaming Corp., Sr. Unsecd. Note, 6.875%, 5/15/2023 12,796,688
7,050,000 Boyd Gaming Corp., Sr. Unsecd. Note, Series WI, 6.00%, 8/15/2026 6,838,500
36,500,000 CRC Escrow Issuer LLC, Sr. Unsecd. Note, Series 144A,5.25%, 10/15/2025 34,059,062
3,900,000 Delta Merger Sub, Inc., Sr. Unsecd. Note, Series 144A,6.00%, 9/15/2026 3,836,625
12,800,000 Eldorado Resorts, Inc., Sr. Unsecd. Note, 6.00%, 4/1/2025 12,704,000
5,000,000 MGM Growth Properties LLC, Sr. Unsecd. Note, 4.50%, 1/15/2028 4,500,000
2,825,000 MGM Growth Properties LLC, Sr. Unsecd. Note, 5.625%, 5/1/2024 2,839,125
6,200,000 MGM Mirage, Inc., 7.75%, 3/15/2022 6,672,750
6,200,000 MGM Mirage, Inc., Sr. Unsecd. Note, 6.75%, 10/1/2020 6,475,280
3,250,000 MGM Resorts International, 6.00%, 3/15/2023 3,306,875
10,200,000 MGM Resorts International, Sr. Unsecd. Note, 4.625%, 9/1/2026 9,256,500
12,000,000 MGM Resorts International, Sr. Unsecd. Note, 5.75%, 6/15/2025 11,760,000
Annual Shareholder Report12
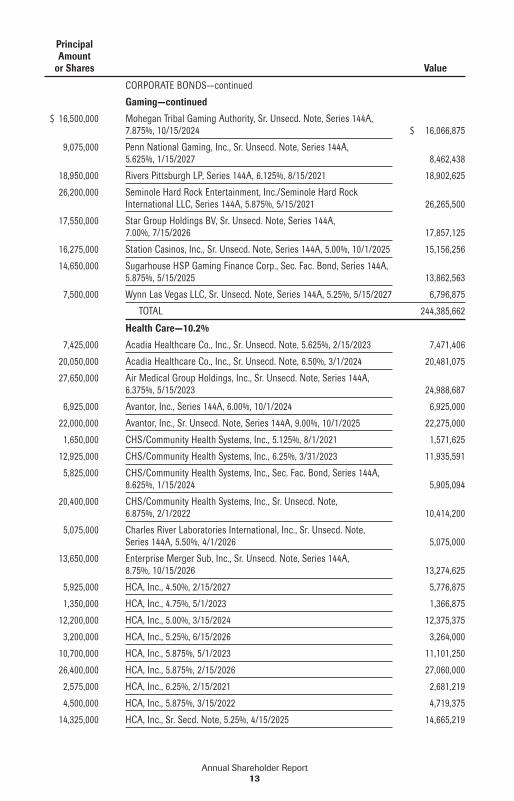
PrincipalAmount
or Shares Value
CORPORATE BONDS—continued
Gaming—continued
$ 16,500,000 Mohegan Tribal Gaming Authority, Sr. Unsecd. Note, Series 144A,7.875%, 10/15/2024 $ 16,066,875
9,075,000 Penn National Gaming, Inc., Sr. Unsecd. Note, Series 144A,5.625%, 1/15/2027 8,462,438
18,950,000 Rivers Pittsburgh LP, Series 144A, 6.125%, 8/15/2021 18,902,625
26,200,000 Seminole Hard Rock Entertainment, Inc./Seminole Hard RockInternational LLC, Series 144A, 5.875%, 5/15/2021 26,265,500
17,550,000 Star Group Holdings BV, Sr. Unsecd. Note, Series 144A,7.00%, 7/15/2026 17,857,125
16,275,000 Station Casinos, Inc., Sr. Unsecd. Note, Series 144A, 5.00%, 10/1/2025 15,156,256
14,650,000 Sugarhouse HSP Gaming Finance Corp., Sec. Fac. Bond, Series 144A,5.875%, 5/15/2025 13,862,563
7,500,000 Wynn Las Vegas LLC, Sr. Unsecd. Note, Series 144A, 5.25%, 5/15/2027 6,796,875
TOTAL 244,385,662
Health Care—10.2%
7,425,000 Acadia Healthcare Co., Inc., Sr. Unsecd. Note, 5.625%, 2/15/2023 7,471,406
20,050,000 Acadia Healthcare Co., Inc., Sr. Unsecd. Note, 6.50%, 3/1/2024 20,481,075
27,650,000 Air Medical Group Holdings, Inc., Sr. Unsecd. Note, Series 144A,6.375%, 5/15/2023 24,988,687
6,925,000 Avantor, Inc., Series 144A, 6.00%, 10/1/2024 6,925,000
22,000,000 Avantor, Inc., Sr. Unsecd. Note, Series 144A, 9.00%, 10/1/2025 22,275,000
1,650,000 CHS/Community Health Systems, Inc., 5.125%, 8/1/2021 1,571,625
12,925,000 CHS/Community Health Systems, Inc., 6.25%, 3/31/2023 11,935,591
5,825,000 CHS/Community Health Systems, Inc., Sec. Fac. Bond, Series 144A,8.625%, 1/15/2024 5,905,094
20,400,000 CHS/Community Health Systems, Inc., Sr. Unsecd. Note,6.875%, 2/1/2022 10,414,200
5,075,000 Charles River Laboratories International, Inc., Sr. Unsecd. Note,Series 144A, 5.50%, 4/1/2026 5,075,000
13,650,000 Enterprise Merger Sub, Inc., Sr. Unsecd. Note, Series 144A,8.75%, 10/15/2026 13,274,625
5,925,000 HCA, Inc., 4.50%, 2/15/2027 5,776,875
1,350,000 HCA, Inc., 4.75%, 5/1/2023 1,366,875
12,200,000 HCA, Inc., 5.00%, 3/15/2024 12,375,375
3,200,000 HCA, Inc., 5.25%, 6/15/2026 3,264,000
10,700,000 HCA, Inc., 5.875%, 5/1/2023 11,101,250
26,400,000 HCA, Inc., 5.875%, 2/15/2026 27,060,000
2,575,000 HCA, Inc., 6.25%, 2/15/2021 2,681,219
4,500,000 HCA, Inc., 5.875%, 3/15/2022 4,719,375
14,325,000 HCA, Inc., Sr. Secd. Note, 5.25%, 4/15/2025 14,665,219
Annual Shareholder Report13
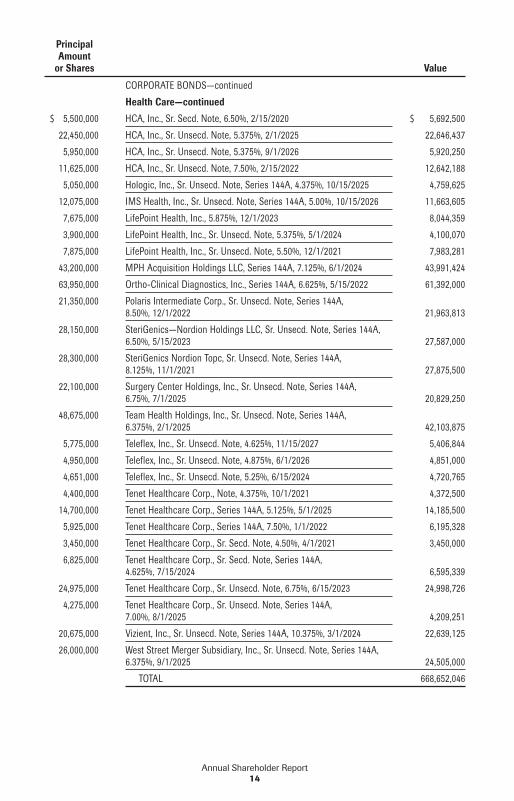
PrincipalAmount
or Shares Value
CORPORATE BONDS—continued
Health Care—continued
$ 5,500,000 HCA, Inc., Sr. Secd. Note, 6.50%, 2/15/2020 $ 5,692,500
22,450,000 HCA, Inc., Sr. Unsecd. Note, 5.375%, 2/1/2025 22,646,437
5,950,000 HCA, Inc., Sr. Unsecd. Note, 5.375%, 9/1/2026 5,920,250
11,625,000 HCA, Inc., Sr. Unsecd. Note, 7.50%, 2/15/2022 12,642,188
5,050,000 Hologic, Inc., Sr. Unsecd. Note, Series 144A, 4.375%, 10/15/2025 4,759,625
12,075,000 IMS Health, Inc., Sr. Unsecd. Note, Series 144A, 5.00%, 10/15/2026 11,663,605
7,675,000 LifePoint Health, Inc., 5.875%, 12/1/2023 8,044,359
3,900,000 LifePoint Health, Inc., Sr. Unsecd. Note, 5.375%, 5/1/2024 4,100,070
7,875,000 LifePoint Health, Inc., Sr. Unsecd. Note, 5.50%, 12/1/2021 7,983,281
43,200,000 MPH Acquisition Holdings LLC, Series 144A, 7.125%, 6/1/2024 43,991,424
63,950,000 Ortho-Clinical Diagnostics, Inc., Series 144A, 6.625%, 5/15/2022 61,392,000
21,350,000 Polaris Intermediate Corp., Sr. Unsecd. Note, Series 144A,8.50%, 12/1/2022 21,963,813
28,150,000 SteriGenics—Nordion Holdings LLC, Sr. Unsecd. Note, Series 144A,6.50%, 5/15/2023 27,587,000
28,300,000 SteriGenics Nordion Topc, Sr. Unsecd. Note, Series 144A,8.125%, 11/1/2021 27,875,500
22,100,000 Surgery Center Holdings, Inc., Sr. Unsecd. Note, Series 144A,6.75%, 7/1/2025 20,829,250
48,675,000 Team Health Holdings, Inc., Sr. Unsecd. Note, Series 144A,6.375%, 2/1/2025 42,103,875
5,775,000 Teleflex, Inc., Sr. Unsecd. Note, 4.625%, 11/15/2027 5,406,844
4,950,000 Teleflex, Inc., Sr. Unsecd. Note, 4.875%, 6/1/2026 4,851,000
4,651,000 Teleflex, Inc., Sr. Unsecd. Note, 5.25%, 6/15/2024 4,720,765
4,400,000 Tenet Healthcare Corp., Note, 4.375%, 10/1/2021 4,372,500
14,700,000 Tenet Healthcare Corp., Series 144A, 5.125%, 5/1/2025 14,185,500
5,925,000 Tenet Healthcare Corp., Series 144A, 7.50%, 1/1/2022 6,195,328
3,450,000 Tenet Healthcare Corp., Sr. Secd. Note, 4.50%, 4/1/2021 3,450,000
6,825,000 Tenet Healthcare Corp., Sr. Secd. Note, Series 144A,4.625%, 7/15/2024 6,595,339
24,975,000 Tenet Healthcare Corp., Sr. Unsecd. Note, 6.75%, 6/15/2023 24,998,726
4,275,000 Tenet Healthcare Corp., Sr. Unsecd. Note, Series 144A,7.00%, 8/1/2025 4,209,251
20,675,000 Vizient, Inc., Sr. Unsecd. Note, Series 144A, 10.375%, 3/1/2024 22,639,125
26,000,000 West Street Merger Subsidiary, Inc., Sr. Unsecd. Note, Series 144A,6.375%, 9/1/2025 24,505,000
TOTAL 668,652,046
Annual Shareholder Report14
PrincipalAmount
or Shares Value
CORPORATE BONDS—continued
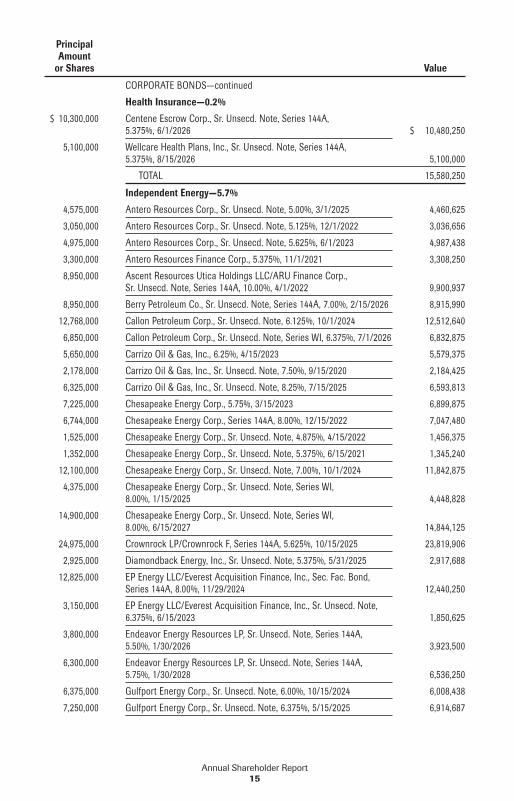
Health Insurance—0.2%
$ 10,300,000 Centene Escrow Corp., Sr. Unsecd. Note, Series 144A,5.375%, 6/1/2026 $ 10,480,250
5,100,000 Wellcare Health Plans, Inc., Sr. Unsecd. Note, Series 144A,5.375%, 8/15/2026 5,100,000
TOTAL 15,580,250
Independent Energy—5.7%
4,575,000 Antero Resources Corp., Sr. Unsecd. Note, 5.00%, 3/1/2025 4,460,625
3,050,000 Antero Resources Corp., Sr. Unsecd. Note, 5.125%, 12/1/2022 3,036,656
4,975,000 Antero Resources Corp., Sr. Unsecd. Note, 5.625%, 6/1/2023 4,987,438
3,300,000 Antero Resources Finance Corp., 5.375%, 11/1/2021 3,308,250
8,950,000 Ascent Resources Utica Holdings LLC/ARU Finance Corp.,Sr. Unsecd. Note, Series 144A, 10.00%, 4/1/2022 9,900,937
8,950,000 Berry Petroleum Co., Sr. Unsecd. Note, Series 144A, 7.00%, 2/15/2026 8,915,990
12,768,000 Callon Petroleum Corp., Sr. Unsecd. Note, 6.125%, 10/1/2024 12,512,640
6,850,000 Callon Petroleum Corp., Sr. Unsecd. Note, Series WI, 6.375%, 7/1/2026 6,832,875
5,650,000 Carrizo Oil & Gas, Inc., 6.25%, 4/15/2023 5,579,375
2,178,000 Carrizo Oil & Gas, Inc., Sr. Unsecd. Note, 7.50%, 9/15/2020 2,184,425
6,325,000 Carrizo Oil & Gas, Inc., Sr. Unsecd. Note, 8.25%, 7/15/2025 6,593,813
7,225,000 Chesapeake Energy Corp., 5.75%, 3/15/2023 6,899,875
6,744,000 Chesapeake Energy Corp., Series 144A, 8.00%, 12/15/2022 7,047,480
1,525,000 Chesapeake Energy Corp., Sr. Unsecd. Note, 4.875%, 4/15/2022 1,456,375
1,352,000 Chesapeake Energy Corp., Sr. Unsecd. Note, 5.375%, 6/15/2021 1,345,240
12,100,000 Chesapeake Energy Corp., Sr. Unsecd. Note, 7.00%, 10/1/2024 11,842,875
4,375,000 Chesapeake Energy Corp., Sr. Unsecd. Note, Series WI,8.00%, 1/15/2025 4,448,828
14,900,000 Chesapeake Energy Corp., Sr. Unsecd. Note, Series WI,8.00%, 6/15/2027 14,844,125
24,975,000 Crownrock LP/Crownrock F, Series 144A, 5.625%, 10/15/2025 23,819,906
2,925,000 Diamondback Energy, Inc., Sr. Unsecd. Note, 5.375%, 5/31/2025 2,917,688
12,825,000 EP Energy LLC/Everest Acquisition Finance, Inc., Sec. Fac. Bond,Series 144A, 8.00%, 11/29/2024 12,440,250
3,150,000 EP Energy LLC/Everest Acquisition Finance, Inc., Sr. Unsecd. Note,6.375%, 6/15/2023 1,850,625
3,800,000 Endeavor Energy Resources LP, Sr. Unsecd. Note, Series 144A,5.50%, 1/30/2026 3,923,500
6,300,000 Endeavor Energy Resources LP, Sr. Unsecd. Note, Series 144A,5.75%, 1/30/2028 6,536,250
6,375,000 Gulfport Energy Corp., Sr. Unsecd. Note, 6.00%, 10/15/2024 6,008,438
7,250,000 Gulfport Energy Corp., Sr. Unsecd. Note, 6.375%, 5/15/2025 6,914,687
Annual Shareholder Report15
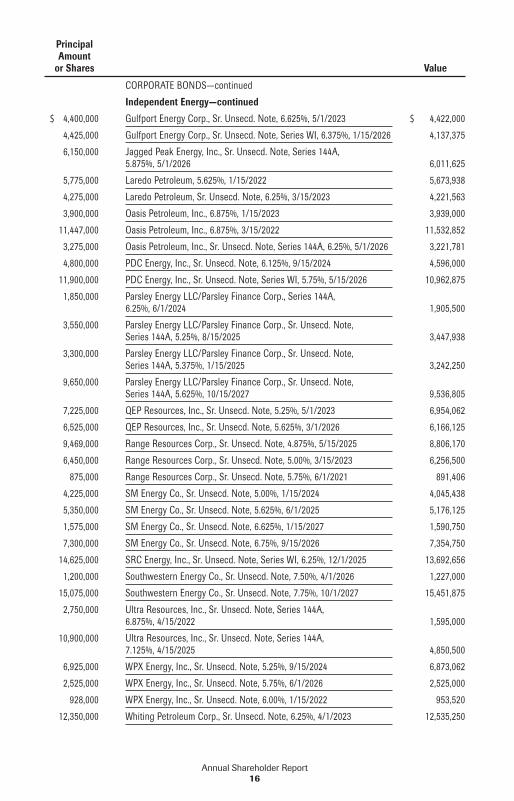
PrincipalAmount
or Shares Value
CORPORATE BONDS—continued
Independent Energy—continued
$ 4,400,000 Gulfport Energy Corp., Sr. Unsecd. Note, 6.625%, 5/1/2023 $ 4,422,000
4,425,000 Gulfport Energy Corp., Sr. Unsecd. Note, Series WI, 6.375%, 1/15/2026 4,137,375
6,150,000 Jagged Peak Energy, Inc., Sr. Unsecd. Note, Series 144A,5.875%, 5/1/2026 6,011,625
5,775,000 Laredo Petroleum, 5.625%, 1/15/2022 5,673,938
4,275,000 Laredo Petroleum, Sr. Unsecd. Note, 6.25%, 3/15/2023 4,221,563
3,900,000 Oasis Petroleum, Inc., 6.875%, 1/15/2023 3,939,000
11,447,000 Oasis Petroleum, Inc., 6.875%, 3/15/2022 11,532,852
3,275,000 Oasis Petroleum, Inc., Sr. Unsecd. Note, Series 144A, 6.25%, 5/1/2026 3,221,781
4,800,000 PDC Energy, Inc., Sr. Unsecd. Note, 6.125%, 9/15/2024 4,596,000
11,900,000 PDC Energy, Inc., Sr. Unsecd. Note, Series WI, 5.75%, 5/15/2026 10,962,875
1,850,000 Parsley Energy LLC/Parsley Finance Corp., Series 144A,6.25%, 6/1/2024 1,905,500
3,550,000 Parsley Energy LLC/Parsley Finance Corp., Sr. Unsecd. Note,Series 144A, 5.25%, 8/15/2025 3,447,938
3,300,000 Parsley Energy LLC/Parsley Finance Corp., Sr. Unsecd. Note,Series 144A, 5.375%, 1/15/2025 3,242,250
9,650,000 Parsley Energy LLC/Parsley Finance Corp., Sr. Unsecd. Note,Series 144A, 5.625%, 10/15/2027 9,536,805
7,225,000 QEP Resources, Inc., Sr. Unsecd. Note, 5.25%, 5/1/2023 6,954,062
6,525,000 QEP Resources, Inc., Sr. Unsecd. Note, 5.625%, 3/1/2026 6,166,125
9,469,000 Range Resources Corp., Sr. Unsecd. Note, 4.875%, 5/15/2025 8,806,170
6,450,000 Range Resources Corp., Sr. Unsecd. Note, 5.00%, 3/15/2023 6,256,500
875,000 Range Resources Corp., Sr. Unsecd. Note, 5.75%, 6/1/2021 891,406
4,225,000 SM Energy Co., Sr. Unsecd. Note, 5.00%, 1/15/2024 4,045,438
5,350,000 SM Energy Co., Sr. Unsecd. Note, 5.625%, 6/1/2025 5,176,125
1,575,000 SM Energy Co., Sr. Unsecd. Note, 6.625%, 1/15/2027 1,590,750
7,300,000 SM Energy Co., Sr. Unsecd. Note, 6.75%, 9/15/2026 7,354,750
14,625,000 SRC Energy, Inc., Sr. Unsecd. Note, Series WI, 6.25%, 12/1/2025 13,692,656
1,200,000 Southwestern Energy Co., Sr. Unsecd. Note, 7.50%, 4/1/2026 1,227,000
15,075,000 Southwestern Energy Co., Sr. Unsecd. Note, 7.75%, 10/1/2027 15,451,875
2,750,000 Ultra Resources, Inc., Sr. Unsecd. Note, Series 144A,6.875%, 4/15/2022 1,595,000
10,900,000 Ultra Resources, Inc., Sr. Unsecd. Note, Series 144A,7.125%, 4/15/2025 4,850,500
6,925,000 WPX Energy, Inc., Sr. Unsecd. Note, 5.25%, 9/15/2024 6,873,062
2,525,000 WPX Energy, Inc., Sr. Unsecd. Note, 5.75%, 6/1/2026 2,525,000
928,000 WPX Energy, Inc., Sr. Unsecd. Note, 6.00%, 1/15/2022 953,520
12,350,000 Whiting Petroleum Corp., Sr. Unsecd. Note, 6.25%, 4/1/2023 12,535,250
Annual Shareholder Report16
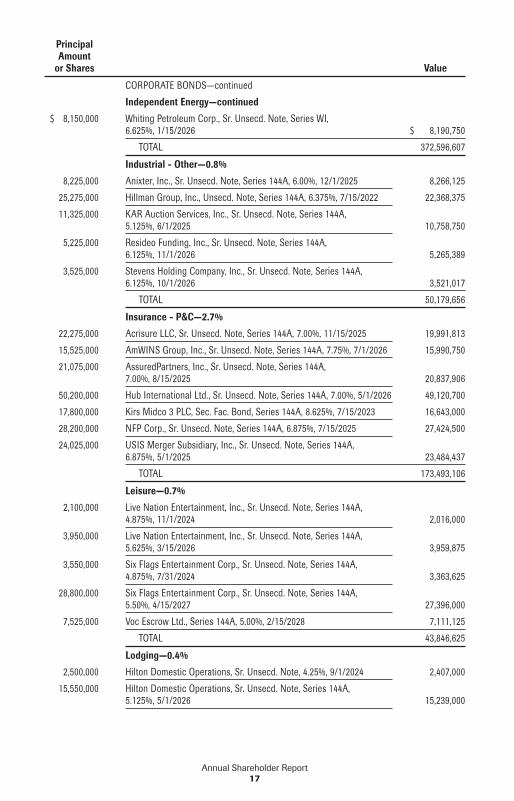
PrincipalAmount
or Shares Value
CORPORATE BONDS—continued
Independent Energy—continued
$ 8,150,000 Whiting Petroleum Corp., Sr. Unsecd. Note, Series WI,6.625%, 1/15/2026 $ 8,190,750
TOTAL 372,596,607
Industrial - Other—0.8%
8,225,000 Anixter, Inc., Sr. Unsecd. Note, Series 144A, 6.00%, 12/1/2025 8,266,125
25,275,000 Hillman Group, Inc., Unsecd. Note, Series 144A, 6.375%, 7/15/2022 22,368,375
11,325,000 KAR Auction Services, Inc., Sr. Unsecd. Note, Series 144A,5.125%, 6/1/2025 10,758,750
5,225,000 Resideo Funding, Inc., Sr. Unsecd. Note, Series 144A,6.125%, 11/1/2026 5,265,389
3,525,000 Stevens Holding Company, Inc., Sr. Unsecd. Note, Series 144A,6.125%, 10/1/2026 3,521,017
TOTAL 50,179,656
Insurance - P&C—2.7%
22,275,000 Acrisure LLC, Sr. Unsecd. Note, Series 144A, 7.00%, 11/15/2025 19,991,813
15,525,000 AmWINS Group, Inc., Sr. Unsecd. Note, Series 144A, 7.75%, 7/1/2026 15,990,750
21,075,000 AssuredPartners, Inc., Sr. Unsecd. Note, Series 144A,7.00%, 8/15/2025 20,837,906
50,200,000 Hub International Ltd., Sr. Unsecd. Note, Series 144A, 7.00%, 5/1/2026 49,120,700
17,800,000 Kirs Midco 3 PLC, Sec. Fac. Bond, Series 144A, 8.625%, 7/15/2023 16,643,000
28,200,000 NFP Corp., Sr. Unsecd. Note, Series 144A, 6.875%, 7/15/2025 27,424,500
24,025,000 USIS Merger Subsidiary, Inc., Sr. Unsecd. Note, Series 144A,6.875%, 5/1/2025 23,484,437
TOTAL 173,493,106
Leisure—0.7%
2,100,000 Live Nation Entertainment, Inc., Sr. Unsecd. Note, Series 144A,4.875%, 11/1/2024 2,016,000
3,950,000 Live Nation Entertainment, Inc., Sr. Unsecd. Note, Series 144A,5.625%, 3/15/2026 3,959,875
3,550,000 Six Flags Entertainment Corp., Sr. Unsecd. Note, Series 144A,4.875%, 7/31/2024 3,363,625
28,800,000 Six Flags Entertainment Corp., Sr. Unsecd. Note, Series 144A,5.50%, 4/15/2027 27,396,000
7,525,000 Voc Escrow Ltd., Series 144A, 5.00%, 2/15/2028 7,111,125
TOTAL 43,846,625
Lodging—0.4%
2,500,000 Hilton Domestic Operations, Sr. Unsecd. Note, 4.25%, 9/1/2024 2,407,000
15,550,000 Hilton Domestic Operations, Sr. Unsecd. Note, Series 144A,5.125%, 5/1/2026 15,239,000
Annual Shareholder Report17
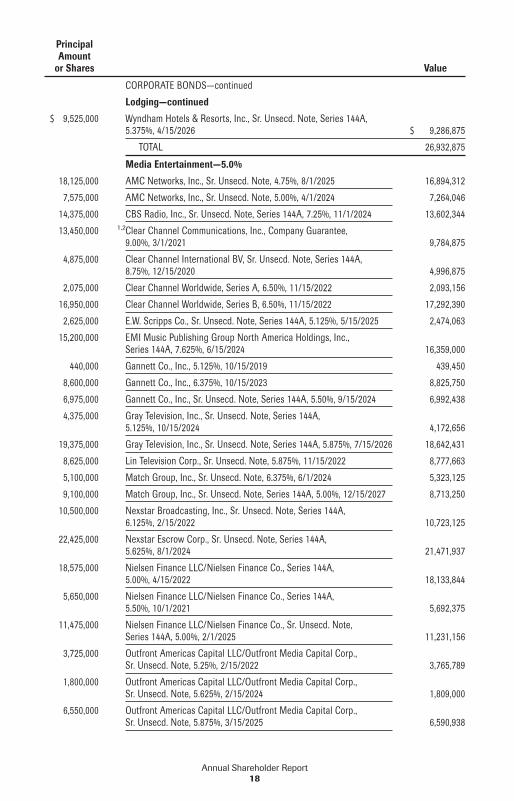
PrincipalAmount
or Shares Value
CORPORATE BONDS—continued
Lodging—continued
$ 9,525,000 Wyndham Hotels & Resorts, Inc., Sr. Unsecd. Note, Series 144A,5.375%, 4/15/2026 $ 9,286,875
TOTAL 26,932,875
Media Entertainment—5.0%
18,125,000 AMC Networks, Inc., Sr. Unsecd. Note, 4.75%, 8/1/2025 16,894,312
7,575,000 AMC Networks, Inc., Sr. Unsecd. Note, 5.00%, 4/1/2024 7,264,046
14,375,000 CBS Radio, Inc., Sr. Unsecd. Note, Series 144A, 7.25%, 11/1/2024 13,602,344
13,450,000 1,2Clear Channel Communications, Inc., Company Guarantee,9.00%, 3/1/2021 9,784,875
4,875,000 Clear Channel International BV, Sr. Unsecd. Note, Series 144A,8.75%, 12/15/2020 4,996,875
2,075,000 Clear Channel Worldwide, Series A, 6.50%, 11/15/2022 2,093,156
16,950,000 Clear Channel Worldwide, Series B, 6.50%, 11/15/2022 17,292,390
2,625,000 E.W. Scripps Co., Sr. Unsecd. Note, Series 144A, 5.125%, 5/15/2025 2,474,063
15,200,000 EMI Music Publishing Group North America Holdings, Inc.,Series 144A, 7.625%, 6/15/2024 16,359,000
440,000 Gannett Co., Inc., 5.125%, 10/15/2019 439,450
8,600,000 Gannett Co., Inc., 6.375%, 10/15/2023 8,825,750
6,975,000 Gannett Co., Inc., Sr. Unsecd. Note, Series 144A, 5.50%, 9/15/2024 6,992,438
4,375,000 Gray Television, Inc., Sr. Unsecd. Note, Series 144A,5.125%, 10/15/2024 4,172,656
19,375,000 Gray Television, Inc., Sr. Unsecd. Note, Series 144A, 5.875%, 7/15/2026 18,642,431
8,625,000 Lin Television Corp., Sr. Unsecd. Note, 5.875%, 11/15/2022 8,777,663
5,100,000 Match Group, Inc., Sr. Unsecd. Note, 6.375%, 6/1/2024 5,323,125
9,100,000 Match Group, Inc., Sr. Unsecd. Note, Series 144A, 5.00%, 12/15/2027 8,713,250
10,500,000 Nexstar Broadcasting, Inc., Sr. Unsecd. Note, Series 144A,6.125%, 2/15/2022 10,723,125
22,425,000 Nexstar Escrow Corp., Sr. Unsecd. Note, Series 144A,5.625%, 8/1/2024 21,471,937
18,575,000 Nielsen Finance LLC/Nielsen Finance Co., Series 144A,5.00%, 4/15/2022 18,133,844
5,650,000 Nielsen Finance LLC/Nielsen Finance Co., Series 144A,5.50%, 10/1/2021 5,692,375
11,475,000 Nielsen Finance LLC/Nielsen Finance Co., Sr. Unsecd. Note,Series 144A, 5.00%, 2/1/2025 11,231,156
3,725,000 Outfront Americas Capital LLC/Outfront Media Capital Corp.,Sr. Unsecd. Note, 5.25%, 2/15/2022 3,765,789
1,800,000 Outfront Americas Capital LLC/Outfront Media Capital Corp.,Sr. Unsecd. Note, 5.625%, 2/15/2024 1,809,000
6,550,000 Outfront Americas Capital LLC/Outfront Media Capital Corp.,Sr. Unsecd. Note, 5.875%, 3/15/2025 6,590,938
Annual Shareholder Report18
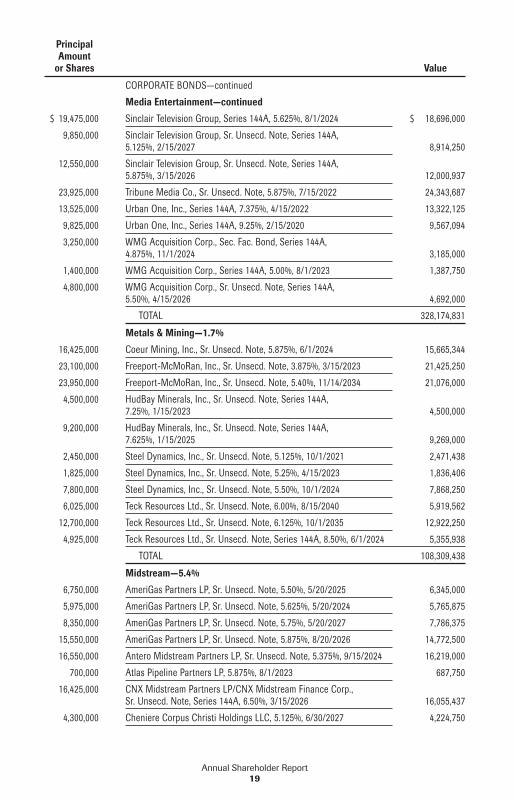
PrincipalAmount
or Shares Value
CORPORATE BONDS—continued
Media Entertainment—continued
$ 19,475,000 Sinclair Television Group, Series 144A, 5.625%, 8/1/2024 $ 18,696,000
9,850,000 Sinclair Television Group, Sr. Unsecd. Note, Series 144A,5.125%, 2/15/2027 8,914,250
12,550,000 Sinclair Television Group, Sr. Unsecd. Note, Series 144A,5.875%, 3/15/2026 12,000,937
23,925,000 Tribune Media Co., Sr. Unsecd. Note, 5.875%, 7/15/2022 24,343,687
13,525,000 Urban One, Inc., Series 144A, 7.375%, 4/15/2022 13,322,125
9,825,000 Urban One, Inc., Series 144A, 9.25%, 2/15/2020 9,567,094
3,250,000 WMG Acquisition Corp., Sec. Fac. Bond, Series 144A,4.875%, 11/1/2024 3,185,000
1,400,000 WMG Acquisition Corp., Series 144A, 5.00%, 8/1/2023 1,387,750
4,800,000 WMG Acquisition Corp., Sr. Unsecd. Note, Series 144A,5.50%, 4/15/2026 4,692,000
TOTAL 328,174,831
Metals & Mining—1.7%
16,425,000 Coeur Mining, Inc., Sr. Unsecd. Note, 5.875%, 6/1/2024 15,665,344
23,100,000 Freeport-McMoRan, Inc., Sr. Unsecd. Note, 3.875%, 3/15/2023 21,425,250
23,950,000 Freeport-McMoRan, Inc., Sr. Unsecd. Note, 5.40%, 11/14/2034 21,076,000
4,500,000 HudBay Minerals, Inc., Sr. Unsecd. Note, Series 144A,7.25%, 1/15/2023 4,500,000
9,200,000 HudBay Minerals, Inc., Sr. Unsecd. Note, Series 144A,7.625%, 1/15/2025 9,269,000
2,450,000 Steel Dynamics, Inc., Sr. Unsecd. Note, 5.125%, 10/1/2021 2,471,438
1,825,000 Steel Dynamics, Inc., Sr. Unsecd. Note, 5.25%, 4/15/2023 1,836,406
7,800,000 Steel Dynamics, Inc., Sr. Unsecd. Note, 5.50%, 10/1/2024 7,868,250
6,025,000 Teck Resources Ltd., Sr. Unsecd. Note, 6.00%, 8/15/2040 5,919,562
12,700,000 Teck Resources Ltd., Sr. Unsecd. Note, 6.125%, 10/1/2035 12,922,250
4,925,000 Teck Resources Ltd., Sr. Unsecd. Note, Series 144A, 8.50%, 6/1/2024 5,355,938
TOTAL 108,309,438
Midstream—5.4%
6,750,000 AmeriGas Partners LP, Sr. Unsecd. Note, 5.50%, 5/20/2025 6,345,000
5,975,000 AmeriGas Partners LP, Sr. Unsecd. Note, 5.625%, 5/20/2024 5,765,875
8,350,000 AmeriGas Partners LP, Sr. Unsecd. Note, 5.75%, 5/20/2027 7,786,375
15,550,000 AmeriGas Partners LP, Sr. Unsecd. Note, 5.875%, 8/20/2026 14,772,500
16,550,000 Antero Midstream Partners LP, Sr. Unsecd. Note, 5.375%, 9/15/2024 16,219,000
700,000 Atlas Pipeline Partners LP, 5.875%, 8/1/2023 687,750
16,425,000 CNX Midstream Partners LP/CNX Midstream Finance Corp.,Sr. Unsecd. Note, Series 144A, 6.50%, 3/15/2026 16,055,437
4,300,000 Cheniere Corpus Christi Holdings LLC, 5.125%, 6/30/2027 4,224,750
Annual Shareholder Report19
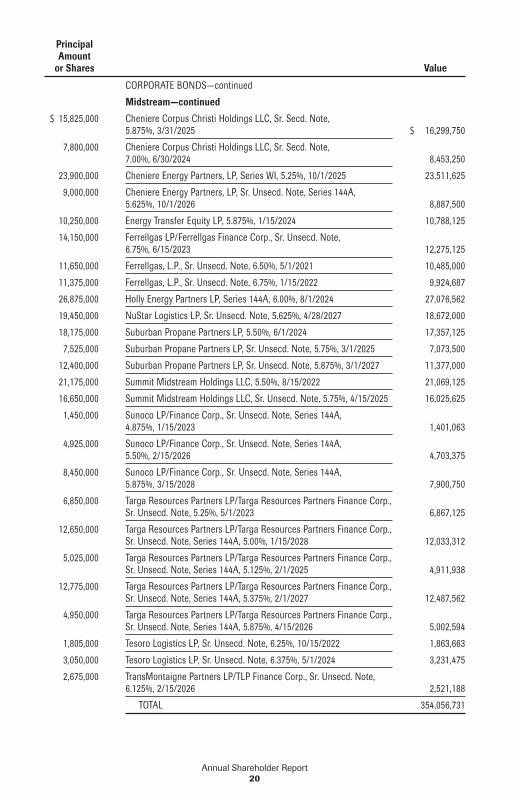
PrincipalAmount
or Shares Value
CORPORATE BONDS—continued
Midstream—continued
$ 15,825,000 Cheniere Corpus Christi Holdings LLC, Sr. Secd. Note,5.875%, 3/31/2025 $ 16,299,750
7,800,000 Cheniere Corpus Christi Holdings LLC, Sr. Secd. Note,7.00%, 6/30/2024 8,453,250
23,900,000 Cheniere Energy Partners, LP, Series WI, 5.25%, 10/1/2025 23,511,625
9,000,000 Cheniere Energy Partners, LP, Sr. Unsecd. Note, Series 144A,5.625%, 10/1/2026 8,887,500
10,250,000 Energy Transfer Equity LP, 5.875%, 1/15/2024 10,788,125
14,150,000 Ferrellgas LP/Ferrellgas Finance Corp., Sr. Unsecd. Note,6.75%, 6/15/2023 12,275,125
11,650,000 Ferrellgas, L.P., Sr. Unsecd. Note, 6.50%, 5/1/2021 10,485,000
11,375,000 Ferrellgas, L.P., Sr. Unsecd. Note, 6.75%, 1/15/2022 9,924,687
26,875,000 Holly Energy Partners LP, Series 144A, 6.00%, 8/1/2024 27,076,562
19,450,000 NuStar Logistics LP, Sr. Unsecd. Note, 5.625%, 4/28/2027 18,672,000
18,175,000 Suburban Propane Partners LP, 5.50%, 6/1/2024 17,357,125
7,525,000 Suburban Propane Partners LP, Sr. Unsecd. Note, 5.75%, 3/1/2025 7,073,500
12,400,000 Suburban Propane Partners LP, Sr. Unsecd. Note, 5.875%, 3/1/2027 11,377,000
21,175,000 Summit Midstream Holdings LLC, 5.50%, 8/15/2022 21,069,125
16,650,000 Summit Midstream Holdings LLC, Sr. Unsecd. Note, 5.75%, 4/15/2025 16,025,625
1,450,000 Sunoco LP/Finance Corp., Sr. Unsecd. Note, Series 144A,4.875%, 1/15/2023 1,401,063
4,925,000 Sunoco LP/Finance Corp., Sr. Unsecd. Note, Series 144A,5.50%, 2/15/2026 4,703,375
8,450,000 Sunoco LP/Finance Corp., Sr. Unsecd. Note, Series 144A,5.875%, 3/15/2028 7,900,750
6,850,000 Targa Resources Partners LP/Targa Resources Partners Finance Corp.,Sr. Unsecd. Note, 5.25%, 5/1/2023 6,867,125
12,650,000 Targa Resources Partners LP/Targa Resources Partners Finance Corp.,Sr. Unsecd. Note, Series 144A, 5.00%, 1/15/2028 12,033,312
5,025,000 Targa Resources Partners LP/Targa Resources Partners Finance Corp.,Sr. Unsecd. Note, Series 144A, 5.125%, 2/1/2025 4,911,938
12,775,000 Targa Resources Partners LP/Targa Resources Partners Finance Corp.,Sr. Unsecd. Note, Series 144A, 5.375%, 2/1/2027 12,487,562
4,950,000 Targa Resources Partners LP/Targa Resources Partners Finance Corp.,Sr. Unsecd. Note, Series 144A, 5.875%, 4/15/2026 5,002,594
1,805,000 Tesoro Logistics LP, Sr. Unsecd. Note, 6.25%, 10/15/2022 1,863,663
3,050,000 Tesoro Logistics LP, Sr. Unsecd. Note, 6.375%, 5/1/2024 3,231,475
2,675,000 TransMontaigne Partners LP/TLP Finance Corp., Sr. Unsecd. Note,6.125%, 2/15/2026 2,521,188
TOTAL 354,056,731
Annual Shareholder Report20
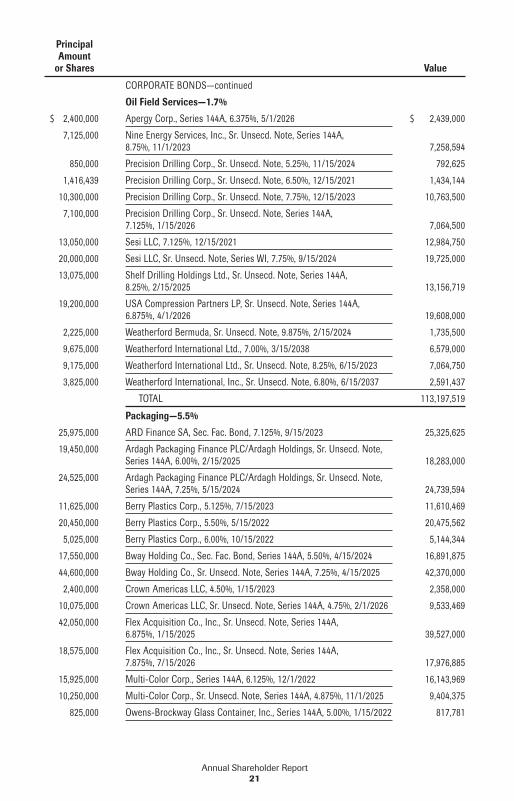
PrincipalAmount
or Shares Value
CORPORATE BONDS—continued
Oil Field Services—1.7%
$ 2,400,000 Apergy Corp., Series 144A, 6.375%, 5/1/2026 $ 2,439,000
7,125,000 Nine Energy Services, Inc., Sr. Unsecd. Note, Series 144A,8.75%, 11/1/2023 7,258,594
850,000 Precision Drilling Corp., Sr. Unsecd. Note, 5.25%, 11/15/2024 792,625
1,416,439 Precision Drilling Corp., Sr. Unsecd. Note, 6.50%, 12/15/2021 1,434,144
10,300,000 Precision Drilling Corp., Sr. Unsecd. Note, 7.75%, 12/15/2023 10,763,500
7,100,000 Precision Drilling Corp., Sr. Unsecd. Note, Series 144A,7.125%, 1/15/2026 7,064,500
13,050,000 Sesi LLC, 7.125%, 12/15/2021 12,984,750
20,000,000 Sesi LLC, Sr. Unsecd. Note, Series WI, 7.75%, 9/15/2024 19,725,000
13,075,000 Shelf Drilling Holdings Ltd., Sr. Unsecd. Note, Series 144A,8.25%, 2/15/2025 13,156,719
19,200,000 USA Compression Partners LP, Sr. Unsecd. Note, Series 144A,6.875%, 4/1/2026 19,608,000
2,225,000 Weatherford Bermuda, Sr. Unsecd. Note, 9.875%, 2/15/2024 1,735,500
9,675,000 Weatherford International Ltd., 7.00%, 3/15/2038 6,579,000
9,175,000 Weatherford International Ltd., Sr. Unsecd. Note, 8.25%, 6/15/2023 7,064,750
3,825,000 Weatherford International, Inc., Sr. Unsecd. Note, 6.80%, 6/15/2037 2,591,437
TOTAL 113,197,519
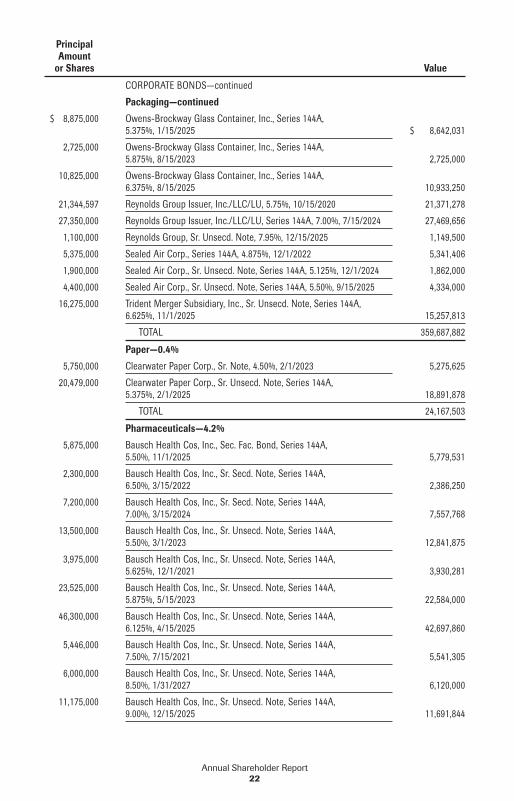
Packaging—5.5%
25,975,000 ARD Finance SA, Sec. Fac. Bond, 7.125%, 9/15/2023 25,325,625
19,450,000 Ardagh Packaging Finance PLC/Ardagh Holdings, Sr. Unsecd. Note,Series 144A, 6.00%, 2/15/2025 18,283,000
24,525,000 Ardagh Packaging Finance PLC/Ardagh Holdings, Sr. Unsecd. Note,Series 144A, 7.25%, 5/15/2024 24,739,594
11,625,000 Berry Plastics Corp., 5.125%, 7/15/2023 11,610,469
20,450,000 Berry Plastics Corp., 5.50%, 5/15/2022 20,475,562
5,025,000 Berry Plastics Corp., 6.00%, 10/15/2022 5,144,344
17,550,000 Bway Holding Co., Sec. Fac. Bond, Series 144A, 5.50%, 4/15/2024 16,891,875
44,600,000 Bway Holding Co., Sr. Unsecd. Note, Series 144A, 7.25%, 4/15/2025 42,370,000
2,400,000 Crown Americas LLC, 4.50%, 1/15/2023 2,358,000
10,075,000 Crown Americas LLC, Sr. Unsecd. Note, Series 144A, 4.75%, 2/1/2026 9,533,469
42,050,000 Flex Acquisition Co., Inc., Sr. Unsecd. Note, Series 144A,6.875%, 1/15/2025 39,527,000
18,575,000 Flex Acquisition Co., Inc., Sr. Unsecd. Note, Series 144A,7.875%, 7/15/2026 17,976,885
15,925,000 Multi-Color Corp., Series 144A, 6.125%, 12/1/2022 16,143,969
10,250,000 Multi-Color Corp., Sr. Unsecd. Note, Series 144A, 4.875%, 11/1/2025 9,404,375
825,000 Owens-Brockway Glass Container, Inc., Series 144A, 5.00%, 1/15/2022 817,781
Annual Shareholder Report21
PrincipalAmount
or Shares Value
CORPORATE BONDS—continued
Packaging—continued
$ 8,875,000 Owens-Brockway Glass Container, Inc., Series 144A,5.375%, 1/15/2025 $ 8,642,031
2,725,000 Owens-Brockway Glass Container, Inc., Series 144A,5.875%, 8/15/2023 2,725,000
10,825,000 Owens-Brockway Glass Container, Inc., Series 144A,6.375%, 8/15/2025 10,933,250
21,344,597 Reynolds Group Issuer, Inc./LLC/LU, 5.75%, 10/15/2020 21,371,278
27,350,000 Reynolds Group Issuer, Inc./LLC/LU, Series 144A, 7.00%, 7/15/2024 27,469,656
1,100,000 Reynolds Group, Sr. Unsecd. Note, 7.95%, 12/15/2025 1,149,500
5,375,000 Sealed Air Corp., Series 144A, 4.875%, 12/1/2022 5,341,406
1,900,000 Sealed Air Corp., Sr. Unsecd. Note, Series 144A, 5.125%, 12/1/2024 1,862,000
4,400,000 Sealed Air Corp., Sr. Unsecd. Note, Series 144A, 5.50%, 9/15/2025 4,334,000
16,275,000 Trident Merger Subsidiary, Inc., Sr. Unsecd. Note, Series 144A,6.625%, 11/1/2025 15,257,813
TOTAL 359,687,882
Paper—0.4%
5,750,000 Clearwater Paper Corp., Sr. Note, 4.50%, 2/1/2023 5,275,625
20,479,000 Clearwater Paper Corp., Sr. Unsecd. Note, Series 144A,5.375%, 2/1/2025 18,891,878
TOTAL 24,167,503
Pharmaceuticals—4.2%
5,875,000 Bausch Health Cos, Inc., Sec. Fac. Bond, Series 144A,5.50%, 11/1/2025 5,779,531
2,300,000 Bausch Health Cos, Inc., Sr. Secd. Note, Series 144A,6.50%, 3/15/2022 2,386,250
7,200,000 Bausch Health Cos, Inc., Sr. Secd. Note, Series 144A,7.00%, 3/15/2024 7,557,768
13,500,000 Bausch Health Cos, Inc., Sr. Unsecd. Note, Series 144A,5.50%, 3/1/2023 12,841,875
3,975,000 Bausch Health Cos, Inc., Sr. Unsecd. Note, Series 144A,5.625%, 12/1/2021 3,930,281
23,525,000 Bausch Health Cos, Inc., Sr. Unsecd. Note, Series 144A,5.875%, 5/15/2023 22,584,000
46,300,000 Bausch Health Cos, Inc., Sr. Unsecd. Note, Series 144A,6.125%, 4/15/2025 42,697,860
5,446,000 Bausch Health Cos, Inc., Sr. Unsecd. Note, Series 144A,7.50%, 7/15/2021 5,541,305
6,000,000 Bausch Health Cos, Inc., Sr. Unsecd. Note, Series 144A,8.50%, 1/31/2027 6,120,000
11,175,000 Bausch Health Cos, Inc., Sr. Unsecd. Note, Series 144A,9.00%, 12/15/2025 11,691,844
Annual Shareholder Report22
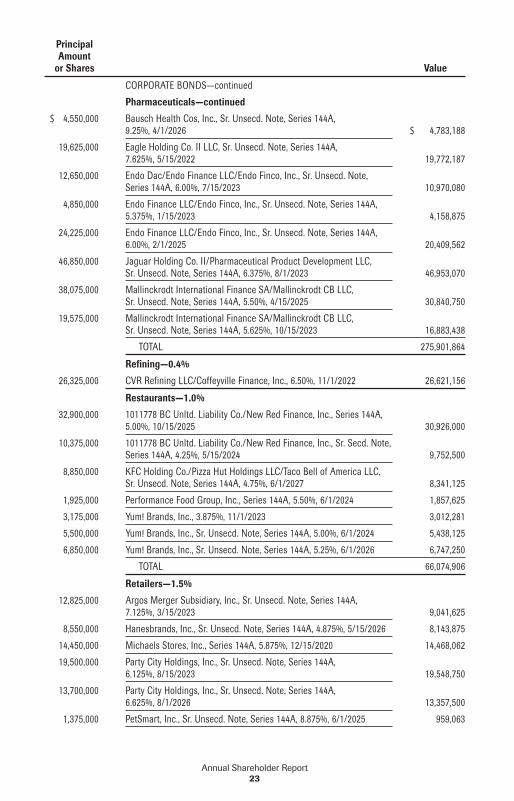
PrincipalAmount
or Shares Value
CORPORATE BONDS—continued
Pharmaceuticals—continued
$ 4,550,000 Bausch Health Cos, Inc., Sr. Unsecd. Note, Series 144A,9.25%, 4/1/2026 $ 4,783,188
19,625,000 Eagle Holding Co. II LLC, Sr. Unsecd. Note, Series 144A,7.625%, 5/15/2022 19,772,187
12,650,000 Endo Dac/Endo Finance LLC/Endo Finco, Inc., Sr. Unsecd. Note,Series 144A, 6.00%, 7/15/2023 10,970,080
4,850,000 Endo Finance LLC/Endo Finco, Inc., Sr. Unsecd. Note, Series 144A,5.375%, 1/15/2023 4,158,875
24,225,000 Endo Finance LLC/Endo Finco, Inc., Sr. Unsecd. Note, Series 144A,6.00%, 2/1/2025 20,409,562
46,850,000 Jaguar Holding Co. II/Pharmaceutical Product Development LLC,Sr. Unsecd. Note, Series 144A, 6.375%, 8/1/2023 46,953,070
38,075,000 Mallinckrodt International Finance SA/Mallinckrodt CB LLC,Sr. Unsecd. Note, Series 144A, 5.50%, 4/15/2025 30,840,750
19,575,000 Mallinckrodt International Finance SA/Mallinckrodt CB LLC,Sr. Unsecd. Note, Series 144A, 5.625%, 10/15/2023 16,883,438
TOTAL 275,901,864
Refining—0.4%
26,325,000 CVR Refining LLC/Coffeyville Finance, Inc., 6.50%, 11/1/2022 26,621,156
Restaurants—1.0%
32,900,000 1011778 BC Unltd. Liability Co./New Red Finance, Inc., Series 144A,5.00%, 10/15/2025 30,926,000
10,375,000 1011778 BC Unltd. Liability Co./New Red Finance, Inc., Sr. Secd. Note,Series 144A, 4.25%, 5/15/2024 9,752,500
8,850,000 KFC Holding Co./Pizza Hut Holdings LLC/Taco Bell of America LLC,Sr. Unsecd. Note, Series 144A, 4.75%, 6/1/2027 8,341,125
1,925,000 Performance Food Group, Inc., Series 144A, 5.50%, 6/1/2024 1,857,625
3,175,000 Yum! Brands, Inc., 3.875%, 11/1/2023 3,012,281
5,500,000 Yum! Brands, Inc., Sr. Unsecd. Note, Series 144A, 5.00%, 6/1/2024 5,438,125
6,850,000 Yum! Brands, Inc., Sr. Unsecd. Note, Series 144A, 5.25%, 6/1/2026 6,747,250
TOTAL 66,074,906
Retailers—1.5%
12,825,000 Argos Merger Subsidiary, Inc., Sr. Unsecd. Note, Series 144A,7.125%, 3/15/2023 9,041,625
8,550,000 Hanesbrands, Inc., Sr. Unsecd. Note, Series 144A, 4.875%, 5/15/2026 8,143,875
14,450,000 Michaels Stores, Inc., Series 144A, 5.875%, 12/15/2020 14,468,062
19,500,000 Party City Holdings, Inc., Sr. Unsecd. Note, Series 144A,6.125%, 8/15/2023 19,548,750
13,700,000 Party City Holdings, Inc., Sr. Unsecd. Note, Series 144A,6.625%, 8/1/2026 13,357,500
1,375,000 PetSmart, Inc., Sr. Unsecd. Note, Series 144A, 8.875%, 6/1/2025 959,063
Annual Shareholder Report23
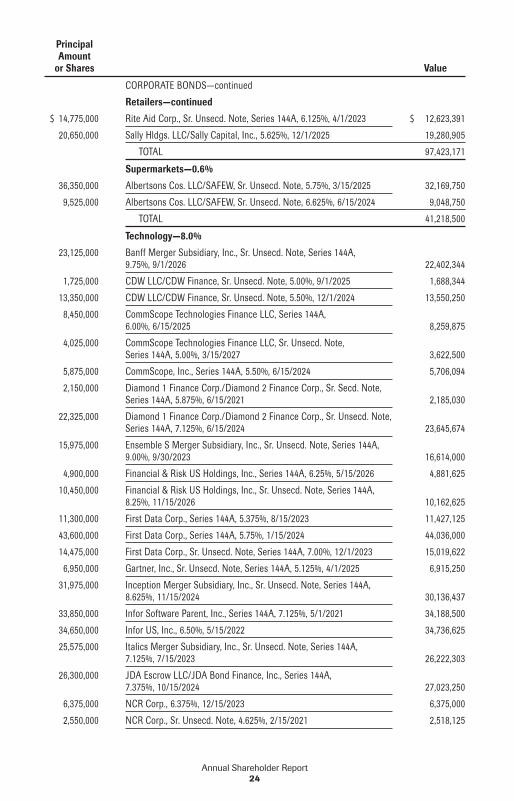
PrincipalAmount
or Shares Value
CORPORATE BONDS—continued
Retailers—continued
$ 14,775,000 Rite Aid Corp., Sr. Unsecd. Note, Series 144A, 6.125%, 4/1/2023 $ 12,623,391
20,650,000 Sally Hldgs. LLC/Sally Capital, Inc., 5.625%, 12/1/2025 19,280,905
TOTAL 97,423,171
Supermarkets—0.6%
36,350,000 Albertsons Cos. LLC/SAFEW, Sr. Unsecd. Note, 5.75%, 3/15/2025 32,169,750
9,525,000 Albertsons Cos. LLC/SAFEW, Sr. Unsecd. Note, 6.625%, 6/15/2024 9,048,750
TOTAL 41,218,500
Technology—8.0%
23,125,000 Banff Merger Subsidiary, Inc., Sr. Unsecd. Note, Series 144A,9.75%, 9/1/2026 22,402,344
1,725,000 CDW LLC/CDW Finance, Sr. Unsecd. Note, 5.00%, 9/1/2025 1,688,344
13,350,000 CDW LLC/CDW Finance, Sr. Unsecd. Note, 5.50%, 12/1/2024 13,550,250
8,450,000 CommScope Technologies Finance LLC, Series 144A,6.00%, 6/15/2025 8,259,875
4,025,000 CommScope Technologies Finance LLC, Sr. Unsecd. Note,Series 144A, 5.00%, 3/15/2027 3,622,500
5,875,000 CommScope, Inc., Series 144A, 5.50%, 6/15/2024 5,706,094
2,150,000 Diamond 1 Finance Corp./Diamond 2 Finance Corp., Sr. Secd. Note,Series 144A, 5.875%, 6/15/2021 2,185,030
22,325,000 Diamond 1 Finance Corp./Diamond 2 Finance Corp., Sr. Unsecd. Note,Series 144A, 7.125%, 6/15/2024 23,645,674
15,975,000 Ensemble S Merger Subsidiary, Inc., Sr. Unsecd. Note, Series 144A,9.00%, 9/30/2023 16,614,000
4,900,000 Financial & Risk US Holdings, Inc., Series 144A, 6.25%, 5/15/2026 4,881,625
10,450,000 Financial & Risk US Holdings, Inc., Sr. Unsecd. Note, Series 144A,8.25%, 11/15/2026 10,162,625
11,300,000 First Data Corp., Series 144A, 5.375%, 8/15/2023 11,427,125
43,600,000 First Data Corp., Series 144A, 5.75%, 1/15/2024 44,036,000
14,475,000 First Data Corp., Sr. Unsecd. Note, Series 144A, 7.00%, 12/1/2023 15,019,622
6,950,000 Gartner, Inc., Sr. Unsecd. Note, Series 144A, 5.125%, 4/1/2025 6,915,250
31,975,000 Inception Merger Subsidiary, Inc., Sr. Unsecd. Note, Series 144A,8.625%, 11/15/2024 30,136,437
33,850,000 Infor Software Parent, Inc., Series 144A, 7.125%, 5/1/2021 34,188,500
34,650,000 Infor US, Inc., 6.50%, 5/15/2022 34,736,625
25,575,000 Italics Merger Subsidiary, Inc., Sr. Unsecd. Note, Series 144A,7.125%, 7/15/2023 26,222,303
26,300,000 JDA Escrow LLC/JDA Bond Finance, Inc., Series 144A,7.375%, 10/15/2024 27,023,250
6,375,000 NCR Corp., 6.375%, 12/15/2023 6,375,000
2,550,000 NCR Corp., Sr. Unsecd. Note, 4.625%, 2/15/2021 2,518,125
Annual Shareholder Report24
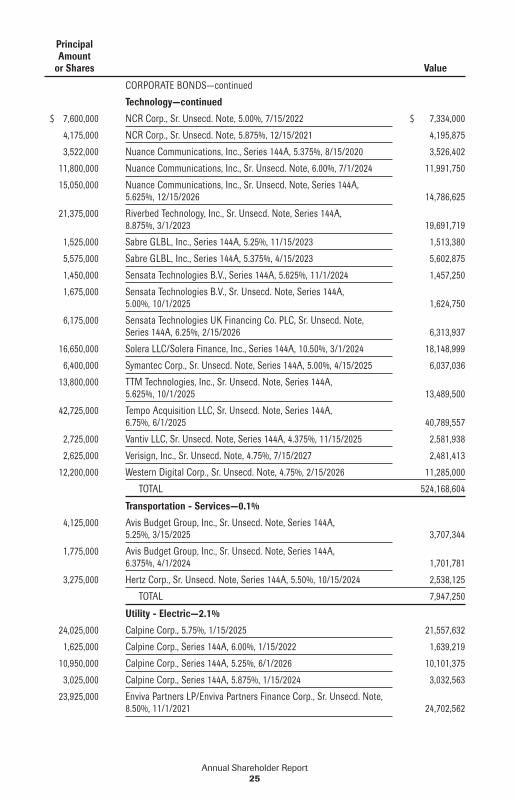
PrincipalAmount
or Shares Value
CORPORATE BONDS—continued
Technology—continued
$ 7,600,000 NCR Corp., Sr. Unsecd. Note, 5.00%, 7/15/2022 $ 7,334,000
4,175,000 NCR Corp., Sr. Unsecd. Note, 5.875%, 12/15/2021 4,195,875
3,522,000 Nuance Communications, Inc., Series 144A, 5.375%, 8/15/2020 3,526,402
11,800,000 Nuance Communications, Inc., Sr. Unsecd. Note, 6.00%, 7/1/2024 11,991,750
15,050,000 Nuance Communications, Inc., Sr. Unsecd. Note, Series 144A,5.625%, 12/15/2026 14,786,625
21,375,000 Riverbed Technology, Inc., Sr. Unsecd. Note, Series 144A,8.875%, 3/1/2023 19,691,719
1,525,000 Sabre GLBL, Inc., Series 144A, 5.25%, 11/15/2023 1,513,380
5,575,000 Sabre GLBL, Inc., Series 144A, 5.375%, 4/15/2023 5,602,875
1,450,000 Sensata Technologies B.V., Series 144A, 5.625%, 11/1/2024 1,457,250
1,675,000 Sensata Technologies B.V., Sr. Unsecd. Note, Series 144A,5.00%, 10/1/2025 1,624,750
6,175,000 Sensata Technologies UK Financing Co. PLC, Sr. Unsecd. Note,Series 144A, 6.25%, 2/15/2026 6,313,937
16,650,000 Solera LLC/Solera Finance, Inc., Series 144A, 10.50%, 3/1/2024 18,148,999
6,400,000 Symantec Corp., Sr. Unsecd. Note, Series 144A, 5.00%, 4/15/2025 6,037,036
13,800,000 TTM Technologies, Inc., Sr. Unsecd. Note, Series 144A,5.625%, 10/1/2025 13,489,500
42,725,000 Tempo Acquisition LLC, Sr. Unsecd. Note, Series 144A,6.75%, 6/1/2025 40,789,557
2,725,000 Vantiv LLC, Sr. Unsecd. Note, Series 144A, 4.375%, 11/15/2025 2,581,938
2,625,000 Verisign, Inc., Sr. Unsecd. Note, 4.75%, 7/15/2027 2,481,413
12,200,000 Western Digital Corp., Sr. Unsecd. Note, 4.75%, 2/15/2026 11,285,000
TOTAL 524,168,604
Transportation - Services—0.1%
4,125,000 Avis Budget Group, Inc., Sr. Unsecd. Note, Series 144A,5.25%, 3/15/2025 3,707,344
1,775,000 Avis Budget Group, Inc., Sr. Unsecd. Note, Series 144A,6.375%, 4/1/2024 1,701,781
3,275,000 Hertz Corp., Sr. Unsecd. Note, Series 144A, 5.50%, 10/15/2024 2,538,125
TOTAL 7,947,250
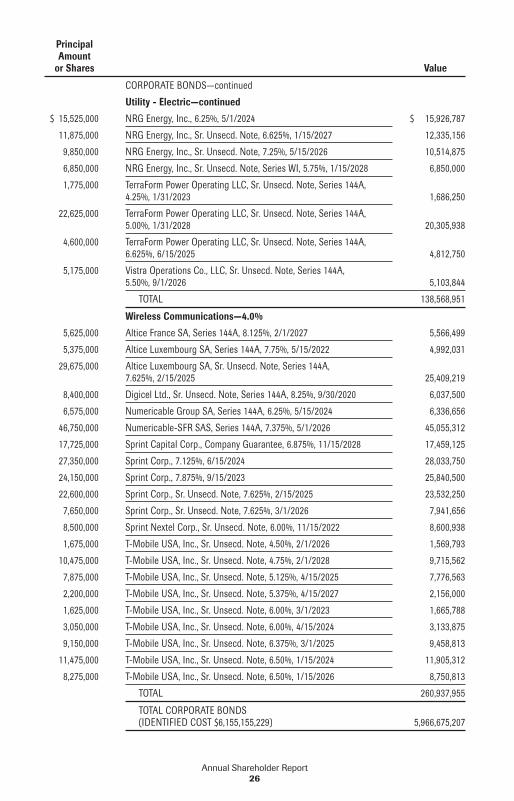
Utility - Electric—2.1%
24,025,000 Calpine Corp., 5.75%, 1/15/2025 21,557,632
1,625,000 Calpine Corp., Series 144A, 6.00%, 1/15/2022 1,639,219
10,950,000 Calpine Corp., Series 144A, 5.25%, 6/1/2026 10,101,375
3,025,000 Calpine Corp., Series 144A, 5.875%, 1/15/2024 3,032,563
23,925,000 Enviva Partners LP/Enviva Partners Finance Corp., Sr. Unsecd. Note,8.50%, 11/1/2021 24,702,562
Annual Shareholder Report25
PrincipalAmount
or Shares Value
CORPORATE BONDS—continued
Utility - Electric—continued
$ 15,525,000 NRG Energy, Inc., 6.25%, 5/1/2024 $ 15,926,787
11,875,000 NRG Energy, Inc., Sr. Unsecd. Note, 6.625%, 1/15/2027 12,335,156
9,850,000 NRG Energy, Inc., Sr. Unsecd. Note, 7.25%, 5/15/2026 10,514,875
6,850,000 NRG Energy, Inc., Sr. Unsecd. Note, Series WI, 5.75%, 1/15/2028 6,850,000
1,775,000 TerraForm Power Operating LLC, Sr. Unsecd. Note, Series 144A,4.25%, 1/31/2023 1,686,250
22,625,000 TerraForm Power Operating LLC, Sr. Unsecd. Note, Series 144A,5.00%, 1/31/2028 20,305,938
4,600,000 TerraForm Power Operating LLC, Sr. Unsecd. Note, Series 144A,6.625%, 6/15/2025 4,812,750
5,175,000 Vistra Operations Co., LLC, Sr. Unsecd. Note, Series 144A,5.50%, 9/1/2026 5,103,844
TOTAL 138,568,951
Wireless Communications—4.0%
5,625,000 Altice France SA, Series 144A, 8.125%, 2/1/2027 5,566,499
5,375,000 Altice Luxembourg SA, Series 144A, 7.75%, 5/15/2022 4,992,031
29,675,000 Altice Luxembourg SA, Sr. Unsecd. Note, Series 144A,7.625%, 2/15/2025 25,409,219
8,400,000 Digicel Ltd., Sr. Unsecd. Note, Series 144A, 8.25%, 9/30/2020 6,037,500
6,575,000 Numericable Group SA, Series 144A, 6.25%, 5/15/2024 6,336,656
46,750,000 Numericable-SFR SAS, Series 144A, 7.375%, 5/1/2026 45,055,312
17,725,000 Sprint Capital Corp., Company Guarantee, 6.875%, 11/15/2028 17,459,125
27,350,000 Sprint Corp., 7.125%, 6/15/2024 28,033,750
24,150,000 Sprint Corp., 7.875%, 9/15/2023 25,840,500
22,600,000 Sprint Corp., Sr. Unsecd. Note, 7.625%, 2/15/2025 23,532,250
7,650,000 Sprint Corp., Sr. Unsecd. Note, 7.625%, 3/1/2026 7,941,656
8,500,000 Sprint Nextel Corp., Sr. Unsecd. Note, 6.00%, 11/15/2022 8,600,938
1,675,000 T-Mobile USA, Inc., Sr. Unsecd. Note, 4.50%, 2/1/2026 1,569,793
10,475,000 T-Mobile USA, Inc., Sr. Unsecd. Note, 4.75%, 2/1/2028 9,715,562
7,875,000 T-Mobile USA, Inc., Sr. Unsecd. Note, 5.125%, 4/15/2025 7,776,563
2,200,000 T-Mobile USA, Inc., Sr. Unsecd. Note, 5.375%, 4/15/2027 2,156,000
1,625,000 T-Mobile USA, Inc., Sr. Unsecd. Note, 6.00%, 3/1/2023 1,665,788
3,050,000 T-Mobile USA, Inc., Sr. Unsecd. Note, 6.00%, 4/15/2024 3,133,875
9,150,000 T-Mobile USA, Inc., Sr. Unsecd. Note, 6.375%, 3/1/2025 9,458,813
11,475,000 T-Mobile USA, Inc., Sr. Unsecd. Note, 6.50%, 1/15/2024 11,905,312
8,275,000 T-Mobile USA, Inc., Sr. Unsecd. Note, 6.50%, 1/15/2026 8,750,813
TOTAL 260,937,955
TOTAL CORPORATE BONDS(IDENTIFIED COST $6,155,155,229) 5,966,675,207
Annual Shareholder Report26
PrincipalAmount
or Shares Value
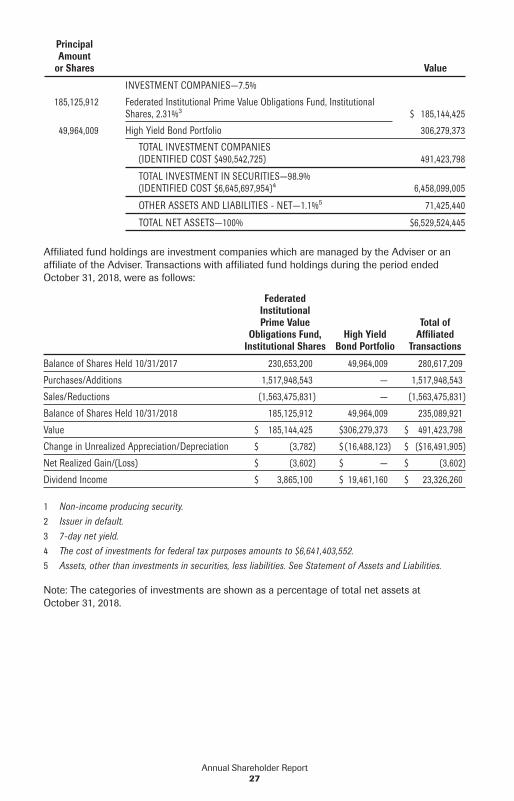
INVESTMENT COMPANIES—7.5%
185,125,912 Federated Institutional Prime Value Obligations Fund, InstitutionalShares, 2.31%3 $ 185,144,425
49,964,009 High Yield Bond Portfolio 306,279,373
TOTAL INVESTMENT COMPANIES(IDENTIFIED COST $490,542,725) 491,423,798
TOTAL INVESTMENT IN SECURITIES—98.9%(IDENTIFIED COST $6,645,697,954)4 6,458,099,005
OTHER ASSETS AND LIABILITIES - NET—1.1%5 71,425,440
TOTAL NET ASSETS—100% $6,529,524,445
Affiliated fund holdings are investment companies which are managed by the Adviser or anaffiliate of the Adviser. Transactions with affiliated fund holdings during the period endedOctober 31, 2018, were as follows:
FederatedInstitutionalPrime Value
Obligations Fund,Institutional Shares
High YieldBond Portfolio
Total ofAffiliated
Transactions
Balance of Shares Held 10/31/2017 230,653,200 49,964,009 280,617,209
Purchases/Additions 1,517,948,543 — 1,517,948,543
Sales/Reductions (1,563,475,831) — (1,563,475,831)
Balance of Shares Held 10/31/2018 185,125,912 49,964,009 235,089,921
Value $ 185,144,425 $306,279,373 $ 491,423,798
Change in Unrealized Appreciation/Depreciation $ (3,782) $ (16,488,123) $ ($16,491,905)
Net Realized Gain/(Loss) $ (3,602) $ — $ (3,602)
Dividend Income $ 3,865,100 $ 19,461,160 $ 23,326,260
1 Non-income producing security.2 Issuer in default.3 7-day net yield.4 The cost of investments for federal tax purposes amounts to $6,641,403,552.5 Assets, other than investments in securities, less liabilities. See Statement of Assets and Liabilities.
Note: The categories of investments are shown as a percentage of total net assets atOctober 31, 2018.
Annual Shareholder Report27
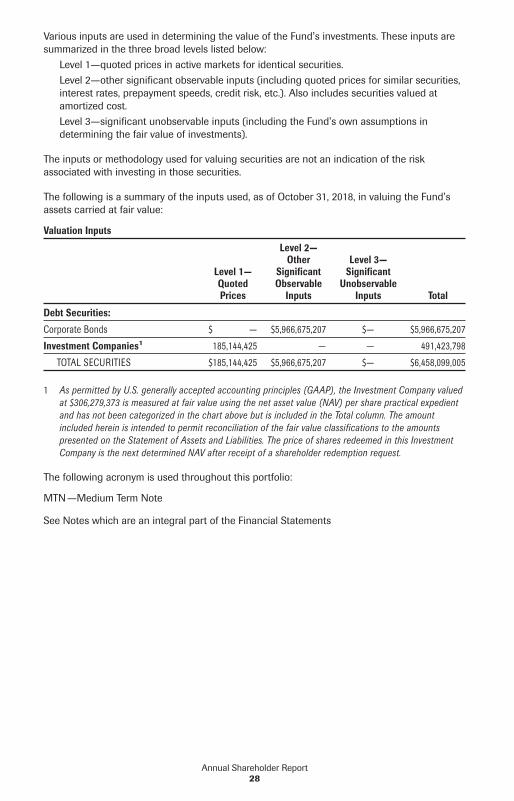
Various inputs are used in determining the value of the Fund’s investments. These inputs aresummarized in the three broad levels listed below:
Level 1—quoted prices in active markets for identical securities.Level 2—other significant observable inputs (including quoted prices for similar securities,interest rates, prepayment speeds, credit risk, etc.). Also includes securities valued atamortized cost.Level 3—significant unobservable inputs (including the Fund’s own assumptions indetermining the fair value of investments).
The inputs or methodology used for valuing securities are not an indication of the riskassociated with investing in those securities.
The following is a summary of the inputs used, as of October 31, 2018, in valuing the Fund’sassets carried at fair value:
Valuation Inputs
Level 1—QuotedPrices
Level 2—Other
SignificantObservable
Inputs
Level 3—Significant
UnobservableInputs Total
Debt Securities:
Corporate Bonds $ — $5,966,675,207 $— $5,966,675,207
Investment Companies1 185,144,425 — — 491,423,798
TOTAL SECURITIES $185,144,425 $5,966,675,207 $— $6,458,099,005
1 As permitted by U.S. generally accepted accounting principles (GAAP), the Investment Company valuedat $306,279,373 is measured at fair value using the net asset value (NAV) per share practical expedientand has not been categorized in the chart above but is included in the Total column. The amountincluded herein is intended to permit reconciliation of the fair value classifications to the amountspresented on the Statement of Assets and Liabilities. The price of shares redeemed in this InvestmentCompany is the next determined NAV after receipt of a shareholder redemption request.
The following acronym is used throughout this portfolio:
MTN—Medium Term Note
See Notes which are an integral part of the Financial Statements
Annual Shareholder Report28
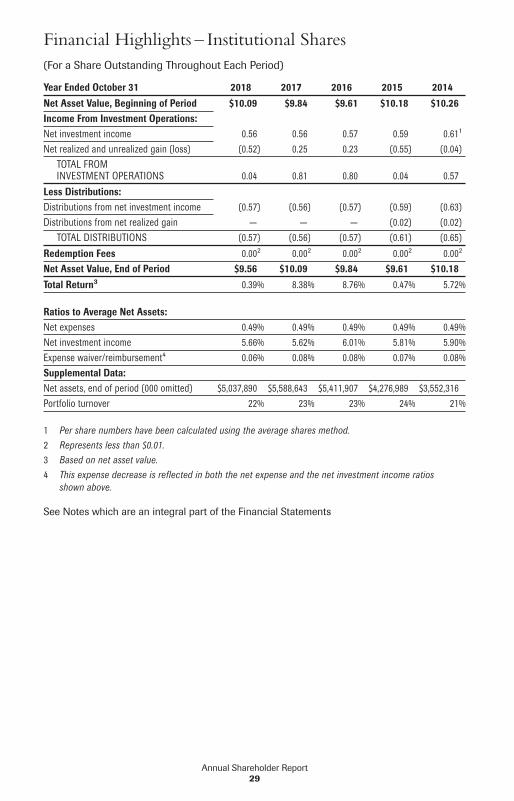
Financial Highlights – Institutional Shares(For a Share Outstanding Throughout Each Period)
Year Ended October 31 2018 2017 2016 2015 2014Net Asset Value, Beginning of Period $10.09 $9.84 $9.61 $10.18 $10.26Income From Investment Operations:Net investment income 0.56 0.56 0.57 0.59 0.611
Net realized and unrealized gain (loss) (0.52) 0.25 0.23 (0.55) (0.04)TOTAL FROMINVESTMENT OPERATIONS 0.04 0.81 0.80 0.04 0.57
Less Distributions:Distributions from net investment income (0.57) (0.56) (0.57) (0.59) (0.63)Distributions from net realized gain — — — (0.02) (0.02)
TOTAL DISTRIBUTIONS (0.57) (0.56) (0.57) (0.61) (0.65)
Redemption Fees 0.002 0.002 0.002 0.002 0.002
Net Asset Value, End of Period $9.56 $10.09 $9.84 $9.61 $10.18Total Return3 0.39% 8.38% 8.76% 0.47% 5.72%
Ratios to Average Net Assets:Net expenses 0.49% 0.49% 0.49% 0.49% 0.49%Net investment income 5.66% 5.62% 6.01% 5.81% 5.90%Expense waiver/reimbursement4 0.06% 0.08% 0.08% 0.07% 0.08%Supplemental Data:Net assets, end of period (000 omitted) $5,037,890 $5,588,643 $5,411,907 $4,276,989 $3,552,316Portfolio turnover 22% 23% 23% 24% 21%
1 Per share numbers have been calculated using the average shares method.2 Represents less than $0.01.3 Based on net asset value.4 This expense decrease is reflected in both the net expense and the net investment income ratios
shown above.
See Notes which are an integral part of the Financial Statements
Annual Shareholder Report29
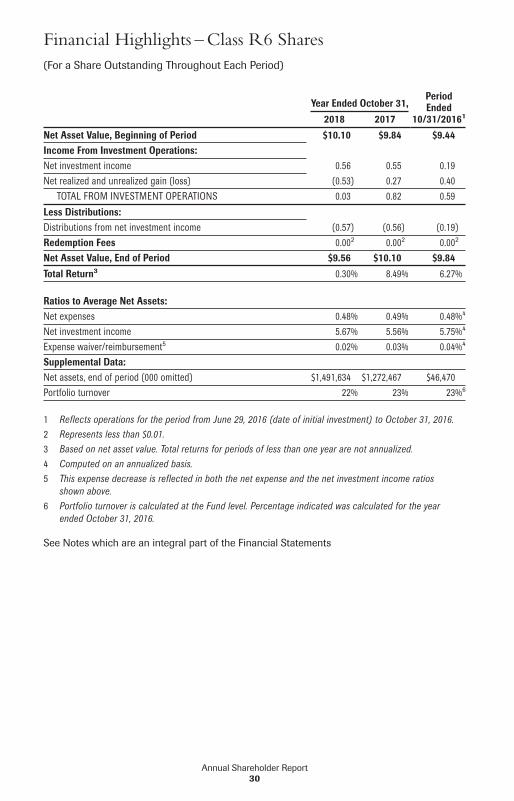
Financial Highlights – Class R6 Shares(For a Share Outstanding Throughout Each Period)
Year Ended October 31,PeriodEnded
10/31/201612018 2017Net Asset Value, Beginning of Period $10.10 $9.84 $9.44Income From Investment Operations:Net investment income 0.56 0.55 0.19Net realized and unrealized gain (loss) (0.53) 0.27 0.40
TOTAL FROM INVESTMENT OPERATIONS 0.03 0.82 0.59
Less Distributions:Distributions from net investment income (0.57) (0.56) (0.19)Redemption Fees 0.002 0.002 0.002
Net Asset Value, End of Period $9.56 $10.10 $9.84Total Return3 0.30% 8.49% 6.27%
Ratios to Average Net Assets:Net expenses 0.48% 0.49% 0.48%4
Net investment income 5.67% 5.56% 5.75%4
Expense waiver/reimbursement5 0.02% 0.03% 0.04%4
Supplemental Data:Net assets, end of period (000 omitted) $1,491,634 $1,272,467 $46,470Portfolio turnover 22% 23% 23%6
1 Reflects operations for the period from June 29, 2016 (date of initial investment) to October 31, 2016.2 Represents less than $0.01.3 Based on net asset value. Total returns for periods of less than one year are not annualized.4 Computed on an annualized basis.5 This expense decrease is reflected in both the net expense and the net investment income ratios
shown above.6 Portfolio turnover is calculated at the Fund level. Percentage indicated was calculated for the year
ended October 31, 2016.
See Notes which are an integral part of the Financial Statements
Annual Shareholder Report30
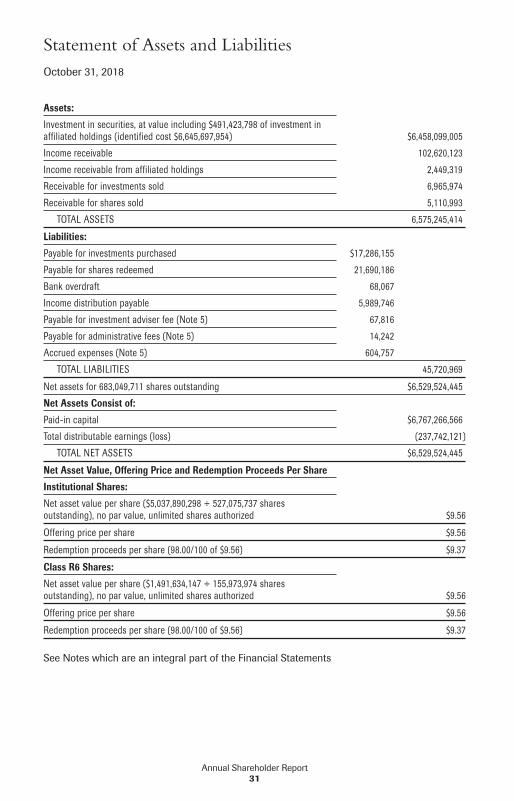
Assets:
Investment in securities, at value including $491,423,798 of investment inaffiliated holdings (identified cost $6,645,697,954) $6,458,099,005
Income receivable 102,620,123
Income receivable from affiliated holdings 2,449,319
Receivable for investments sold 6,965,974
Receivable for shares sold 5,110,993
TOTAL ASSETS 6,575,245,414
Liabilities:
Payable for investments purchased $17,286,155
Payable for shares redeemed 21,690,186
Bank overdraft 68,067
Income distribution payable 5,989,746
Payable for investment adviser fee (Note 5) 67,816
Payable for administrative fees (Note 5) 14,242
Accrued expenses (Note 5) 604,757
TOTAL LIABILITIES 45,720,969
Net assets for 683,049,711 shares outstanding $6,529,524,445
Net Assets Consist of:
Paid-in capital $6,767,266,566
Total distributable earnings (loss) (237,742,121)
TOTAL NET ASSETS $6,529,524,445
Net Asset Value, Offering Price and Redemption Proceeds Per Share
Institutional Shares:
Net asset value per share ($5,037,890,298 ÷ 527,075,737 sharesoutstanding), no par value, unlimited shares authorized $9.56
Offering price per share $9.56
Redemption proceeds per share (98.00/100 of $9.56) $9.37
Class R6 Shares:
Net asset value per share ($1,491,634,147 ÷ 155,973,974 sharesoutstanding), no par value, unlimited shares authorized $9.56
Offering price per share $9.56
Redemption proceeds per share (98.00/100 of $9.56) $9.37
See Notes which are an integral part of the Financial Statements
Statement of Assets and LiabilitiesOctober 31, 2018
Annual Shareholder Report31
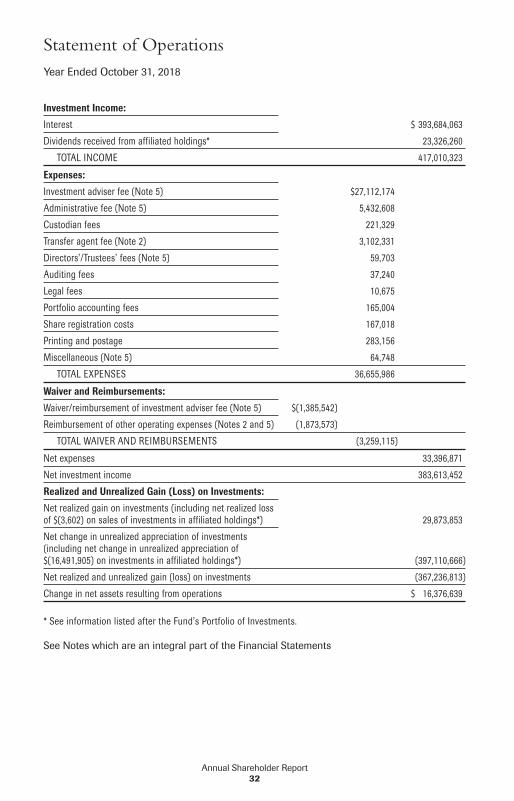
Investment Income:
Interest $ 393,684,063
Dividends received from affiliated holdings* 23,326,260
TOTAL INCOME 417,010,323
Expenses:
Investment adviser fee (Note 5) $27,112,174
Administrative fee (Note 5) 5,432,608
Custodian fees 221,329
Transfer agent fee (Note 2) 3,102,331
Directors’/Trustees’ fees (Note 5) 59,703
Auditing fees 37,240
Legal fees 10,675
Portfolio accounting fees 165,004
Share registration costs 167,018
Printing and postage 283,156
Miscellaneous (Note 5) 64,748
TOTAL EXPENSES 36,655,986
Waiver and Reimbursements:
Waiver/reimbursement of investment adviser fee (Note 5) $(1,385,542)
Reimbursement of other operating expenses (Notes 2 and 5) (1,873,573)
TOTAL WAIVER AND REIMBURSEMENTS (3,259,115)
Net expenses 33,396,871
Net investment income 383,613,452
Realized and Unrealized Gain (Loss) on Investments:
Net realized gain on investments (including net realized lossof $(3,602) on sales of investments in affiliated holdings*) 29,873,853
Net change in unrealized appreciation of investments(including net change in unrealized appreciation of$(16,491,905) on investments in affiliated holdings*) (397,110,666)
Net realized and unrealized gain (loss) on investments (367,236,813)
Change in net assets resulting from operations $ 16,376,639
* See information listed after the Fund’s Portfolio of Investments.
See Notes which are an integral part of the Financial Statements
Statement of OperationsYear Ended October 31, 2018
Annual Shareholder Report32
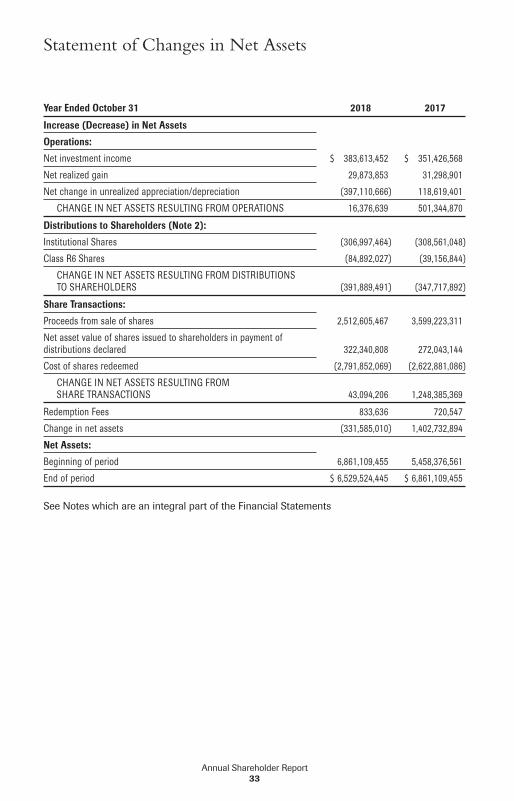
Year Ended October 31 2018 2017
Increase (Decrease) in Net Assets
Operations:
Net investment income $ 383,613,452 $ 351,426,568
Net realized gain 29,873,853 31,298,901
Net change in unrealized appreciation/depreciation (397,110,666) 118,619,401
CHANGE IN NET ASSETS RESULTING FROM OPERATIONS 16,376,639 501,344,870
Distributions to Shareholders (Note 2):
Institutional Shares (306,997,464) (308,561,048)
Class R6 Shares (84,892,027) (39,156,844)
CHANGE IN NET ASSETS RESULTING FROM DISTRIBUTIONSTO SHAREHOLDERS (391,889,491) (347,717,892)
Share Transactions:
Proceeds from sale of shares 2,512,605,467 3,599,223,311
Net asset value of shares issued to shareholders in payment ofdistributions declared 322,340,808 272,043,144
Cost of shares redeemed (2,791,852,069) (2,622,881,086)
CHANGE IN NET ASSETS RESULTING FROMSHARE TRANSACTIONS 43,094,206 1,248,385,369
Redemption Fees 833,636 720,547
Change in net assets (331,585,010) 1,402,732,894
Net Assets:
Beginning of period 6,861,109,455 5,458,376,561
End of period $ 6,529,524,445 $ 6,861,109,455
See Notes which are an integral part of the Financial Statements
Statement of Changes in Net Assets
Annual Shareholder Report33
Notes to Financial StatementsOctober 31, 2018
1. ORGANIZATIONFederated Institutional Trust (the “Trust”) is registered under the Investment Company Act of1940, as amended (the “Act”), as an open-end management investment company. The Trustconsists of three portfolios. The financial statements included herein are only those ofFederated Institutional High Yield Bond Fund (the “Fund”), a diversified portfolio. The financialstatements of the other portfolios are presented separately. The assets of each portfolio aresegregated and a shareholder’s interest is limited to the portfolio in which shares are held.Each portfolio pays its own expenses. The Fund offers two classes of shares: InstitutionalShares and Class R6 Shares. The investment objective of the Fund is to seek highcurrent income.
2. SIGNIFICANT ACCOUNTING POLICIESThe following is a summary of significant accounting policies consistently followed by theFund in the preparation of its financial statements. These policies are in conformity with GAAP.
Investment ValuationIn calculating its NAV, the Fund generally values investments as follows:� Fixed-income securities are fair valued using price evaluations provided by a pricing service
approved by the Fund’s Board of Trustees (the “Trustees”).� Shares of other mutual funds or non-exchange-traded investment companies are valued
based upon their reported NAVs.� Equity securities listed on an exchange or traded through a regulated market system are
valued at their last reported sale price or official closing price in their principal exchangeor market.
� Derivative contracts listed on exchanges are valued at their reported settlement or closingprice, except that options are valued at the mean of closing bid and asked quotations.
� Over-the-counter (OTC) derivative contracts are fair valued using price evaluations providedby a pricing service approved by the Trustees.
� For securities that are fair valued in accordance with procedures established by and underthe general supervision of the Trustees, certain factors may be considered, such as: the lasttraded or purchase price of the security, information obtained by contacting the issuer ordealers, analysis of the issuer’s financial statements or other available documents,fundamental analytical data, the nature and duration of restrictions on disposition, themovement of the market in which the security is normally traded, public trading in similarsecurities or derivative contracts of the issuer or comparable issuers, movement of arelevant index, or other factors including but not limited to industry changes and relevantgovernment actions.
If any price, quotation, price evaluation or other pricing source is not readily available whenthe NAV is calculated, if the Fund cannot obtain price evaluations from a pricing service orfrom more than one dealer for an investment within a reasonable period of time as set forth inthe Fund’s valuation policies and procedures, or if information furnished by a pricing service,in the opinion of the valuation committee (“Valuation Committee”), is deemed notrepresentative of the fair value of such security, the Fund uses the fair value of the investmentdetermined in accordance with the procedures described below. There can be no assurancethat the Fund could obtain the fair value assigned to an investment if it sold the investment atapproximately the time at which the Fund determines its NAV per share.
Annual Shareholder Report34
Fair Valuation and Significant Events ProceduresThe Trustees have ultimate responsibility for determining the fair value of investments forwhich market quotations are not readily available. The Trustees have appointed a valuationcommittee (“Valuation Committee”) comprised of officers of the Fund, Federated InvestmentManagement Company (the “Adviser”) and certain of the Adviser’s affiliated companies toassist in determining fair value and in overseeing the calculation of the NAV. The Trustees havealso authorized the use of pricing services recommended by the Valuation Committee toprovide fair value evaluations of the current value of certain investments for purposes ofcalculating the NAV. The Valuation Committee employs various methods for reviewing third-party pricing-service evaluations including periodic reviews of third-party pricing services’policies, procedures and valuation methods (including key inputs, methods, models andassumptions), transactional back-testing, comparisons of evaluations of different pricingservices, and review of price challenges by the Adviser based on recent market activity. In theevent that market quotations and price evaluations are not available for an investment, theValuation Committee determines the fair value of the investment in accordance withprocedures adopted by the Trustees. The Trustees periodically review and approve the fairvaluations made by the Valuation Committee and any changes made to the procedures.
Factors considered by pricing services in evaluating an investment include the yields orprices of investments of comparable quality, coupon, maturity, call rights and other potentialprepayments, terms and type, reported transactions, indications as to values from dealers andgeneral market conditions. Some pricing services provide a single price evaluation reflectingthe bid-side of the market for an investment (a “bid” evaluation). Other pricing services offerboth bid evaluations and price evaluations indicative of a price between the prices bid andasked for the investment (a “mid” evaluation). The Fund normally uses bid evaluations for anyU.S. Treasury and Agency securities, mortgage-backed securities and municipal securities. TheFund normally uses mid evaluations for any other types of fixed-income securities and anyOTC derivative contracts. In the event that market quotations and price evaluations are notavailable for an investment, the fair value of the investment is determined in accordance withprocedures adopted by the Trustees.
The Trustees also have adopted procedures requiring an investment to be priced at its fairvalue whenever the Adviser determines that a significant event affecting the value of theinvestment has occurred between the time as of which the price of the investment wouldotherwise be determined and the time as of which the NAV is computed. An event isconsidered significant if there is both an affirmative expectation that the investment’s valuewill change in response to the event and a reasonable basis for quantifying the resultingchange in value. Examples of significant events that may occur after the close of the principalmarket on which a security is traded, or after the time of a price evaluation provided by apricing service or a dealer, include:� With respect to securities traded principally in foreign markets, significant trends in
U.S. equity markets or in the trading of foreign securities index futures contracts;� Political or other developments affecting the economy or markets in which an issuer
conducts its operations or its securities are traded;� Announcements concerning matters such as acquisitions, recapitalizations, litigation
developments, or a natural disaster affecting the issuer’s operations or regulatory changesor market developments affecting the issuer’s industry.
Annual Shareholder Report35
The Trustees have adopted procedures whereby the Valuation Committee uses a pricingservice to determine the fair value of equity securities traded principally in foreign marketswhen the Adviser determines that there has been a significant trend in the U.S. equity marketsor in index futures trading. For other significant events, the Fund may seek to obtain morecurrent quotations or price evaluations from alternative pricing sources. If a reliable alternativepricing source is not available, the Fund will determine the fair value of the investment inaccordance with the fair valuation procedures approved by the Trustees. The Trustees haveultimate responsibility for any fair valuations made in response to a significant event.
Repurchase AgreementsThe Fund may invest in repurchase agreements for short-term liquidity purposes. It is thepolicy of the Fund to require the other party to a repurchase agreement to transfer to theFund’s custodian or sub-custodian eligible securities or cash with a market value (aftertransaction costs) at least equal to the repurchase price to be paid under the repurchaseagreement. The eligible securities are transferred to accounts with the custodian or sub-custodian in which the Fund holds a “securities entitlement” and exercises “control” as thoseterms are defined in the Uniform Commercial Code. The Fund has established procedures formonitoring the market value of the transferred securities and requiring the transfer ofadditional eligible securities if necessary to equal at least the repurchase price. Theseprocedures also allow the other party to require securities to be transferred from the accountto the extent that their market value exceeds the repurchase price or in exchange for othereligible securities of equivalent market value.
The insolvency of the other party or other failure to repurchase the securities may delay thedisposition of the underlying securities or cause the Fund to receive less than the fullrepurchase price. Under the terms of the repurchase agreement, any amounts received by theFund in excess of the repurchase price and related transaction costs must be remitted to theother party.
The Fund may enter into repurchase agreements in which eligible securities are transferredinto joint trading accounts maintained by the custodian or sub-custodian for investmentcompanies and other clients advised by the Adviser and its affiliates. The Fund will participateon a pro rata basis with the other investment companies and clients in its share of thesecurities transferred under such repurchase agreements and in its share of proceeds fromany repurchase or other disposition of such securities.
Investment Income, Gains and Losses, Expenses and DistributionsInvestment transactions are accounted for on a trade-date basis. Realized gains and lossesfrom investment transactions are recorded on an identified-cost basis. Interest income andexpenses are accrued daily. Dividend income and distributions to shareholders are recordedon the ex-dividend date. Foreign dividends are recorded on the ex-dividend date or when theFund is informed of the ex-dividend date. Distributions of net investment income, if any, aredeclared daily and paid monthly. Non-cash dividends included in dividend income, if any, arerecorded at fair value. Amortization/accretion of premium and discount is included ininvestment income. Investment income, realized and unrealized gains and losses, and certainfund-level expenses are allocated to each class based on relative average daily net assets,except that select classes will bear certain expenses unique to those classes. The detail of thetotal fund expense waiver and reimbursements of $3,259,115 is disclosed in various locationsin this Note 2 and Note 5.
Annual Shareholder Report36
For the year ended October 31, 2018, transfer agent fees for the Fund were as follows:
Transfer AgentFees Incurred
Transfer AgentFees Reimbursed
Institutional Shares $2,952,588 $(1,873,573)
Class R6 Shares 149,743 —
TOTAL $3,102,331 $(1,873,573)
Dividends are declared separately for each class. No class has preferential dividend rights;differences in per share dividend rates are generally due to differences in separate classexpenses. All distributions as indicated on the Statement of Changes in Net Assets for theyear ended October 31, 2017, were from net investment income. Undistributed net investmentincome at October 31, 2017 was $1,225,090.
Federal TaxesIt is the Fund’s policy to comply with the Subchapter M provision of the Internal Revenue Code(the “Code”) and to distribute to shareholders each year substantially all of its income.Accordingly, no provision for federal income tax is necessary. As of and during the year endedOctober 31, 2018, the Fund did not have a liability for any uncertain tax positions. The Fundrecognizes interest and penalties, if any, related to tax liabilities as income tax expense in theStatement of Operations. As of October 31, 2018, tax years 2015 through 2018 remain subjectto examination by the Fund’s major tax jurisdictions, which include the United States ofAmerica and the Commonwealth of Massachusetts.
When-Issued and Delayed-Delivery TransactionsThe Fund may engage in when-issued or delayed-delivery transactions. The Fund recordswhen-issued securities on the trade date and maintains security positions such that sufficientliquid assets will be available to make payment for the securities purchased. Securitiespurchased on a when-issued or delayed-delivery basis are marked to market daily and beginearning interest on the settlement date. Losses may occur on these transactions due tochanges in market conditions or the failure of counterparties to perform under the contract.
Restricted SecuritiesThe Fund may purchase securities which are considered restricted. Restricted securities aresecurities that either: (a) cannot be offered for public sale without first being registered, orbeing able to take advantage of an exemption from registration, under the Securities Act of1933; or (b) are subject to contractual restrictions on public sales. In some cases, when asecurity cannot be offered for public sale without first being registered, the issuer of therestricted security has agreed to register such securities for resale, at the issuer’s expense,either upon demand by the Fund or in connection with another registered offering of thesecurities. Many such restricted securities may be resold in the secondary market intransactions exempt from registration. Restricted securities may be determined to be liquidunder criteria established by the Trustees. The Fund will not incur any registration costs uponsuch resales. The Fund’s restricted securities, like other securities, are priced in accordancewith procedures established by and under the general supervision of the Trustees.
Annual Shareholder Report37
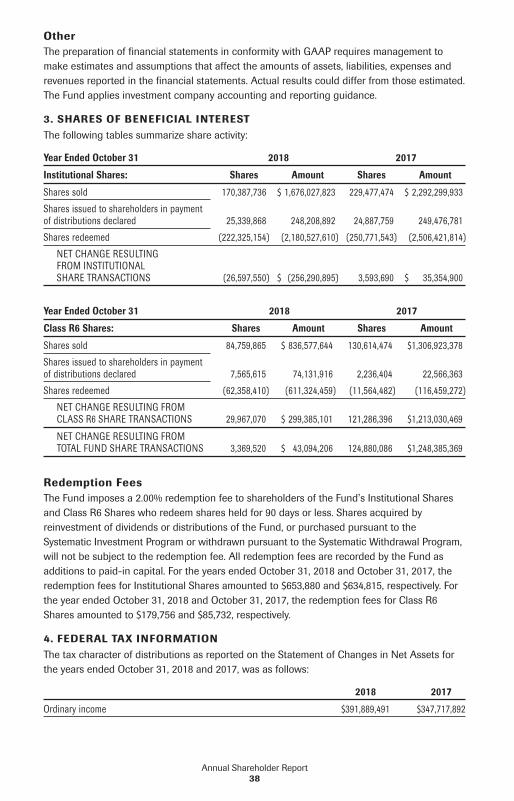
OtherThe preparation of financial statements in conformity with GAAP requires management tomake estimates and assumptions that affect the amounts of assets, liabilities, expenses andrevenues reported in the financial statements. Actual results could differ from those estimated.The Fund applies investment company accounting and reporting guidance.
3. SHARES OF BENEFICIAL INTERESTThe following tables summarize share activity:
Year Ended October 31 2018 2017
Institutional Shares: Shares Amount Shares Amount
Shares sold 170,387,736 $ 1,676,027,823 229,477,474 $ 2,292,299,933
Shares issued to shareholders in paymentof distributions declared 25,339,868 248,208,892 24,887,759 249,476,781
Shares redeemed (222,325,154) (2,180,527,610) (250,771,543) (2,506,421,814)
NET CHANGE RESULTINGFROM INSTITUTIONALSHARE TRANSACTIONS (26,597,550) $ (256,290,895) 3,593,690 $ 35,354,900
Year Ended October 31 2018 2017
Class R6 Shares: Shares Amount Shares Amount
Shares sold 84,759,865 $ 836,577,644 130,614,474 $1,306,923,378
Shares issued to shareholders in paymentof distributions declared 7,565,615 74,131,916 2,236,404 22,566,363
Shares redeemed (62,358,410) (611,324,459) (11,564,482) (116,459,272)
NET CHANGE RESULTING FROMCLASS R6 SHARE TRANSACTIONS 29,967,070 $ 299,385,101 121,286,396 $1,213,030,469
NET CHANGE RESULTING FROMTOTAL FUND SHARE TRANSACTIONS 3,369,520 $ 43,094,206 124,880,086 $1,248,385,369
Redemption FeesThe Fund imposes a 2.00% redemption fee to shareholders of the Fund’s Institutional Sharesand Class R6 Shares who redeem shares held for 90 days or less. Shares acquired byreinvestment of dividends or distributions of the Fund, or purchased pursuant to theSystematic Investment Program or withdrawn pursuant to the Systematic Withdrawal Program,will not be subject to the redemption fee. All redemption fees are recorded by the Fund asadditions to paid-in capital. For the years ended October 31, 2018 and October 31, 2017, theredemption fees for Institutional Shares amounted to $653,880 and $634,815, respectively. Forthe year ended October 31, 2018 and October 31, 2017, the redemption fees for Class R6Shares amounted to $179,756 and $85,732, respectively.
4. FEDERAL TAX INFORMATIONThe tax character of distributions as reported on the Statement of Changes in Net Assets forthe years ended October 31, 2018 and 2017, was as follows:
2018 2017
Ordinary income $391,889,491 $347,717,892
Annual Shareholder Report38
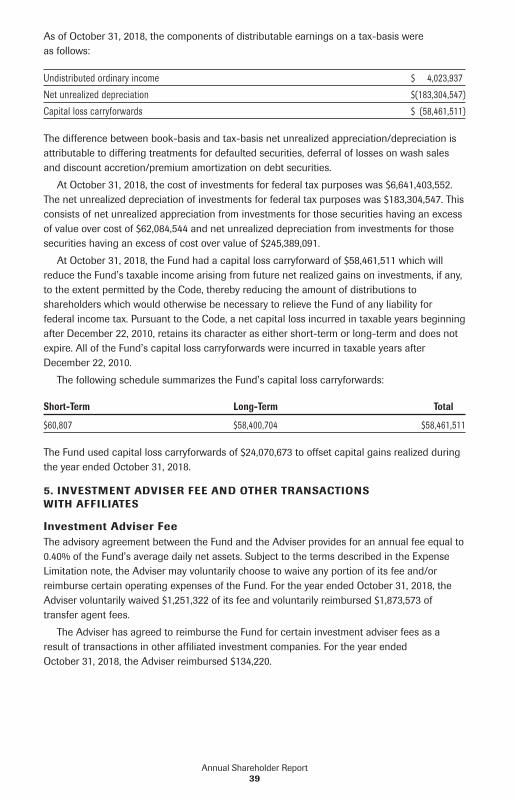
As of October 31, 2018, the components of distributable earnings on a tax-basis wereas follows:
Undistributed ordinary income $ 4,023,937
Net unrealized depreciation $(183,304,547)
Capital loss carryforwards $ (58,461,511)
The difference between book-basis and tax-basis net unrealized appreciation/depreciation isattributable to differing treatments for defaulted securities, deferral of losses on wash salesand discount accretion/premium amortization on debt securities.
At October 31, 2018, the cost of investments for federal tax purposes was $6,641,403,552.The net unrealized depreciation of investments for federal tax purposes was $183,304,547. Thisconsists of net unrealized appreciation from investments for those securities having an excessof value over cost of $62,084,544 and net unrealized depreciation from investments for thosesecurities having an excess of cost over value of $245,389,091.
At October 31, 2018, the Fund had a capital loss carryforward of $58,461,511 which willreduce the Fund’s taxable income arising from future net realized gains on investments, if any,to the extent permitted by the Code, thereby reducing the amount of distributions toshareholders which would otherwise be necessary to relieve the Fund of any liability forfederal income tax. Pursuant to the Code, a net capital loss incurred in taxable years beginningafter December 22, 2010, retains its character as either short-term or long-term and does notexpire. All of the Fund’s capital loss carryforwards were incurred in taxable years afterDecember 22, 2010.
The following schedule summarizes the Fund’s capital loss carryforwards:
Short-Term Long-Term Total
$60,807 $58,400,704 $58,461,511
The Fund used capital loss carryforwards of $24,070,673 to offset capital gains realized duringthe year ended October 31, 2018.
5. INVESTMENT ADVISER FEE AND OTHER TRANSACTIONSWITH AFFILIATES
Investment Adviser FeeThe advisory agreement between the Fund and the Adviser provides for an annual fee equal to0.40% of the Fund’s average daily net assets. Subject to the terms described in the ExpenseLimitation note, the Adviser may voluntarily choose to waive any portion of its fee and/orreimburse certain operating expenses of the Fund. For the year ended October 31, 2018, theAdviser voluntarily waived $1,251,322 of its fee and voluntarily reimbursed $1,873,573 oftransfer agent fees.
The Adviser has agreed to reimburse the Fund for certain investment adviser fees as aresult of transactions in other affiliated investment companies. For the year endedOctober 31, 2018, the Adviser reimbursed $134,220.
Annual Shareholder Report39
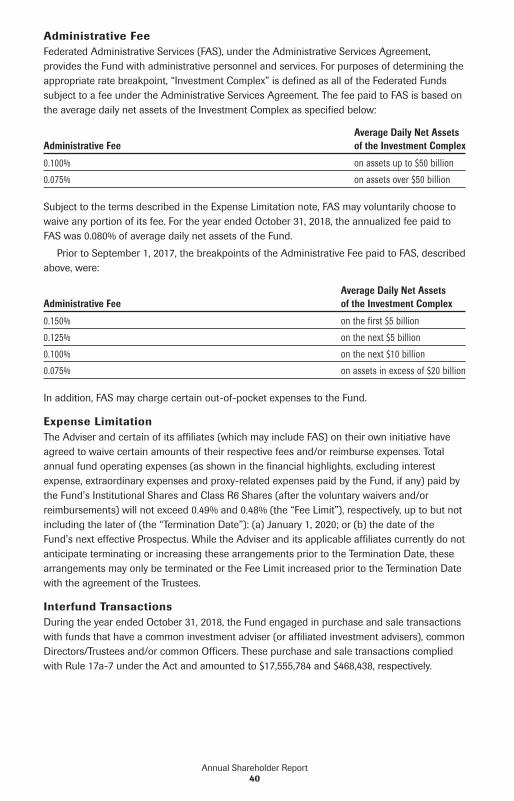
Administrative FeeFederated Administrative Services (FAS), under the Administrative Services Agreement,provides the Fund with administrative personnel and services. For purposes of determining theappropriate rate breakpoint, “Investment Complex” is defined as all of the Federated Fundssubject to a fee under the Administrative Services Agreement. The fee paid to FAS is based onthe average daily net assets of the Investment Complex as specified below:
Administrative FeeAverage Daily Net Assetsof the Investment Complex
0.100% on assets up to $50 billion
0.075% on assets over $50 billion
Subject to the terms described in the Expense Limitation note, FAS may voluntarily choose towaive any portion of its fee. For the year ended October 31, 2018, the annualized fee paid toFAS was 0.080% of average daily net assets of the Fund.
Prior to September 1, 2017, the breakpoints of the Administrative Fee paid to FAS, describedabove, were:
Administrative FeeAverage Daily Net Assetsof the Investment Complex
0.150% on the first $5 billion
0.125% on the next $5 billion
0.100% on the next $10 billion
0.075% on assets in excess of $20 billion
In addition, FAS may charge certain out-of-pocket expenses to the Fund.
Expense LimitationThe Adviser and certain of its affiliates (which may include FAS) on their own initiative haveagreed to waive certain amounts of their respective fees and/or reimburse expenses. Totalannual fund operating expenses (as shown in the financial highlights, excluding interestexpense, extraordinary expenses and proxy-related expenses paid by the Fund, if any) paid bythe Fund’s Institutional Shares and Class R6 Shares (after the voluntary waivers and/orreimbursements) will not exceed 0.49% and 0.48% (the “Fee Limit”), respectively, up to but notincluding the later of (the “Termination Date”): (a) January 1, 2020; or (b) the date of theFund’s next effective Prospectus. While the Adviser and its applicable affiliates currently do notanticipate terminating or increasing these arrangements prior to the Termination Date, thesearrangements may only be terminated or the Fee Limit increased prior to the Termination Datewith the agreement of the Trustees.
Interfund TransactionsDuring the year ended October 31, 2018, the Fund engaged in purchase and sale transactionswith funds that have a common investment adviser (or affiliated investment advisers), commonDirectors/Trustees and/or common Officers. These purchase and sale transactions compliedwith Rule 17a-7 under the Act and amounted to $17,555,784 and $468,438, respectively.
Annual Shareholder Report40
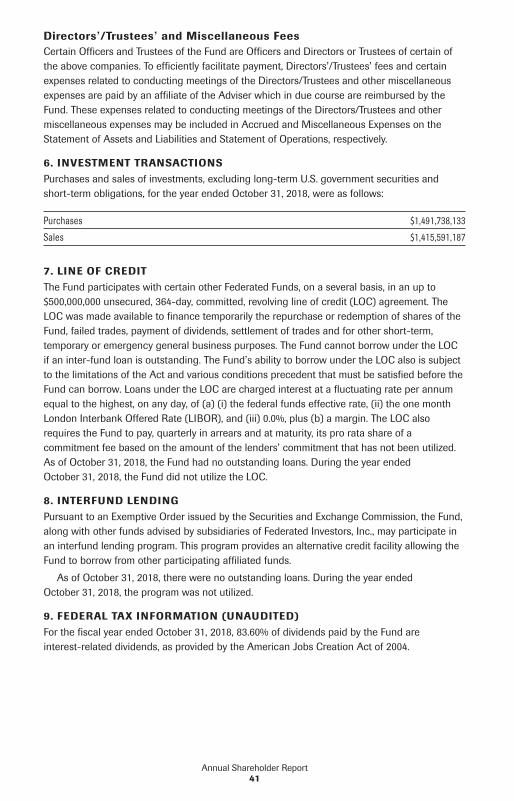
Directors’/Trustees’ and Miscellaneous FeesCertain Officers and Trustees of the Fund are Officers and Directors or Trustees of certain ofthe above companies. To efficiently facilitate payment, Directors’/Trustees’ fees and certainexpenses related to conducting meetings of the Directors/Trustees and other miscellaneousexpenses are paid by an affiliate of the Adviser which in due course are reimbursed by theFund. These expenses related to conducting meetings of the Directors/Trustees and othermiscellaneous expenses may be included in Accrued and Miscellaneous Expenses on theStatement of Assets and Liabilities and Statement of Operations, respectively.
6. INVESTMENT TRANSACTIONSPurchases and sales of investments, excluding long-term U.S. government securities andshort-term obligations, for the year ended October 31, 2018, were as follows:
Purchases $1,491,738,133
Sales $1,415,591,187
7. LINE OF CREDITThe Fund participates with certain other Federated Funds, on a several basis, in an up to$500,000,000 unsecured, 364-day, committed, revolving line of credit (LOC) agreement. TheLOC was made available to finance temporarily the repurchase or redemption of shares of theFund, failed trades, payment of dividends, settlement of trades and for other short-term,temporary or emergency general business purposes. The Fund cannot borrow under the LOCif an inter-fund loan is outstanding. The Fund’s ability to borrow under the LOC also is subjectto the limitations of the Act and various conditions precedent that must be satisfied before theFund can borrow. Loans under the LOC are charged interest at a fluctuating rate per annumequal to the highest, on any day, of (a) (i) the federal funds effective rate, (ii) the one monthLondon Interbank Offered Rate (LIBOR), and (iii) 0.0%, plus (b) a margin. The LOC alsorequires the Fund to pay, quarterly in arrears and at maturity, its pro rata share of acommitment fee based on the amount of the lenders’ commitment that has not been utilized.As of October 31, 2018, the Fund had no outstanding loans. During the year endedOctober 31, 2018, the Fund did not utilize the LOC.
8. INTERFUND LENDINGPursuant to an Exemptive Order issued by the Securities and Exchange Commission, the Fund,along with other funds advised by subsidiaries of Federated Investors, Inc., may participate inan interfund lending program. This program provides an alternative credit facility allowing theFund to borrow from other participating affiliated funds.
As of October 31, 2018, there were no outstanding loans. During the year endedOctober 31, 2018, the program was not utilized.
9. FEDERAL TAX INFORMATION (UNAUDITED)For the fiscal year ended October 31, 2018, 83.60% of dividends paid by the Fund areinterest-related dividends, as provided by the American Jobs Creation Act of 2004.
Annual Shareholder Report41
Report of Independent Registered PublicAccounting FirmTO THE BOARD OF TRUSTEES OF FEDERATED INSTITUTIONAL TRUST ANDSHAREHOLDERS OF FEDERATED INSTITUTIONAL HIGH YIELD BOND FUND:
Opinion on the Financial Statements
We have audited the accompanying statement of assets and liabilities ofFederated Institutional High Yield Bond Fund (the “Fund”) (one of theportfolios constituting Federated Institutional Trust), including the portfolio ofinvestments, as of October 31, 2018, and the related statement of operations forthe year then ended, the statement of changes in net assets for each of the twoyears in the period then ended, the financial highlights for each of the five yearsin the period then ended and the related notes (collectively referred to as the“financial statements”). In our opinion, the financial statements present fairly, inall material respects, the financial position of the Fund at October 31, 2018, theresults of its operations for the year then ended, the changes in its net assets foreach of the two years in the period then ended and its financial highlights foreach of the five years in the period then ended, in conformity withU.S. generally accepted accounting principles.
Basis for Opinion
These financial statements are the responsibility of the Fund’s management. Ourresponsibility is to express an opinion on the Fund’s financial statements basedon our audits. We are a public accounting firm registered with the PublicCompany Accounting Oversight Board (United States) (“PCAOB”) and arerequired to be independent with respect to the Fund in accordance with theU.S. federal securities laws and the applicable rules and regulations of theSecurities and Exchange Commission and the PCAOB.
We conducted our audits in accordance with standards of the PCAOB. Thosestandards require that we plan and perform the audit to obtain reasonableassurance about whether the financial statements are free of materialmisstatement, whether due to error or fraud. The Fund is not required to have,nor were we engaged to perform, an audit of the Fund’s internal control overfinancial reporting. As part of our audits, we are required to obtain anunderstanding of internal control over financial reporting, but not for thepurpose of expressing an opinion on the effectiveness of the Fund’s internalcontrol over financial reporting. Accordingly, we express no such opinion.
Annual Shareholder Report42

Our audits included performing procedures to assess the risks of materialmisstatement of the financial statements, whether due to error or fraud, andperforming procedures that respond to those risks. Such procedures includedexamining, on a test basis, evidence regarding the amounts and disclosures in thefinancial statements. Our procedures included confirmation of securities ownedas of October 31, 2018, by correspondence with the custodian and others or byother appropriate auditing procedures where replies from others were notreceived. Our audits also included evaluating the accounting principles used andsignificant estimates made by management, as well as evaluating the overallpresentation of the financial statements. We believe that our audits provide areasonable basis for our opinion.
We have served as the auditor of one or more Federated investment companiessince 1979.
Boston, MassachusettsDecember 21, 2018
Annual Shareholder Report43
Shareholder Expense Example (unaudited)As a shareholder of the Fund, you incur ongoing costs, including managementfees and to the extent applicable, distribution (12b-1) fees and/or other servicefees and other Fund expenses. This Example is intended to help you tounderstand your ongoing costs (in dollars) of investing in the Fund and tocompare these costs with the ongoing costs of investing in other mutual funds. Itis based on an investment of $1,000 invested at the beginning of the period andheld for the entire period from May 1, 2018 to October 31, 2018.
ACTUAL EXPENSES
The first section of the table below provides information about actual accountvalues and actual expenses. You may use the information in this section, togetherwith the amount you invested, to estimate the expenses that you incurred overthe period. Simply divide your account value by $1,000 (for example, an $8,600account value divided by $1,000 = 8.6), then multiply the result by the numberin the first section under the heading entitled “Expenses Paid During Period”to estimate the expenses attributable to your investment during this period.
HYPOTHETICAL EXAMPLE FOR COMPARISON PURPOSES
The second section of the table below provides information about hypotheticalaccount values and hypothetical expenses based on the Fund’s actual expenseratio and an assumed rate of return of 5% per year before expenses, which is notthe Fund’s actual return. Thus, you should not use the hypothetical accountvalues and expenses to estimate the actual ending account balance or yourexpenses for the period. Rather, these figures are required to be provided toenable you to compare the ongoing costs of investing in the Fund with otherfunds. To do so, compare this 5% hypothetical example with the 5%hypothetical examples that appear in the shareholder reports of the other funds.
Annual Shareholder Report44
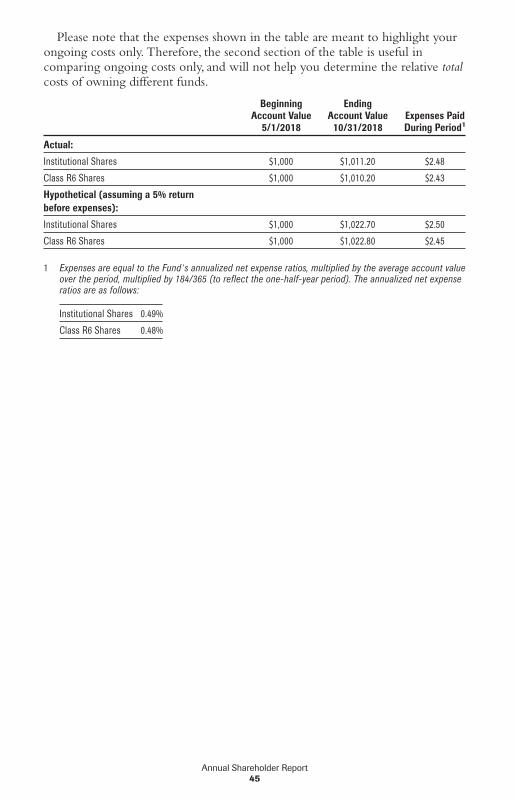
Please note that the expenses shown in the table are meant to highlight yourongoing costs only. Therefore, the second section of the table is useful incomparing ongoing costs only, and will not help you determine the relative totalcosts of owning different funds.
BeginningAccount Value
5/1/2018
EndingAccount Value
10/31/2018Expenses PaidDuring Period1
Actual:
Institutional Shares $1,000 $1,011.20 $2.48
Class R6 Shares $1,000 $1,010.20 $2.43
Hypothetical (assuming a 5% returnbefore expenses):
Institutional Shares $1,000 $1,022.70 $2.50
Class R6 Shares $1,000 $1,022.80 $2.45
1 Expenses are equal to the Fund’s annualized net expense ratios, multiplied by the average account valueover the period, multiplied by 184/365 (to reflect the one-half-year period). The annualized net expenseratios are as follows:
Institutional Shares 0.49%
Class R6 Shares 0.48%
Annual Shareholder Report45
In MemoriamWith profound sadness, Federated announces the passing of Richard B. (“Dick”)Fisher. He will be greatly missed.
RICHARD B. FISHER
(Former Officer of the Federated Funds, Chairman of Federated Securities Corp., and ViceChairman of Federated Investors, Inc.)
Dick Fisher, along with John F. (“Jack”) Donahue and Thomas J. Donnelly, Esq.,co-founded Federated in 1955 and served as a leader, particularly for Federated’ssales division, and an officer of the Federated Funds. Mr. Fisher was a familyman of deep faith, with exemplary character, prodigious generosity,immeasurable devotion, undeniable charm and a good sense of humor. Heserved his religion, family, community, and the Federated Funds and Federated,as well as their shareholders, officers and employees, with distinction. Hisintegrity, intelligence, and keen sense of duty to shareholders, coupled with hisfaith and devotion to family, allowed him to become the consummategentleman and salesman par excellence who will be greatly missed. Among hismany achievements, Mr. Fisher led the sales strategy and execution forFederated’s Fund for U.S. Government Securities, the first fund to investexclusively in government bonds, and spearheaded the campaign for sales ofFederated’s Government Income Securities Fund, the first of what wouldbecome Federated’s Fortress family of funds. Federated expresses deep gratitudeto Mr. Fisher for his inspiring leadership, distinguished service and contributionsas a husband, father, co-founder, officer, colleague and friend.
Board of Trustees and Trust OfficersThe Board of Trustees is responsible for managing the Trust’s business affairsand for exercising all the Trust’s powers except those reserved for theshareholders. The following tables give information about each Trustee and thesenior officers of the Fund. Where required, the tables separately list Trusteeswho are “interested persons” of the Fund (i.e., “Interested” Trustees) and thosewho are not (i.e., “Independent” Trustees). Unless otherwise noted, the addressof each person listed is Federated Investors Tower, 1001 Liberty Avenue,Pittsburgh, PA 15222. The address of all Independent Trustees listed is4000 Ericsson Drive, Warrendale, PA 15086-7561; Attention: Mutual FundBoard. As of December 31, 2017, the Trust comprised three portfolio(s), and theFederated Fund Family consisted of 40 investment companies (comprising108 portfolios). Unless otherwise noted, each Officer is elected annually. Unlessotherwise noted, each Trustee oversees all portfolios in the Federated FundFamily and serves for an indefinite term. The Fund’s Statement of AdditionalInformation includes additional information about Trust Trustees and isavailable, without charge and upon request, by calling 1-800-341-7400.
Annual Shareholder Report46
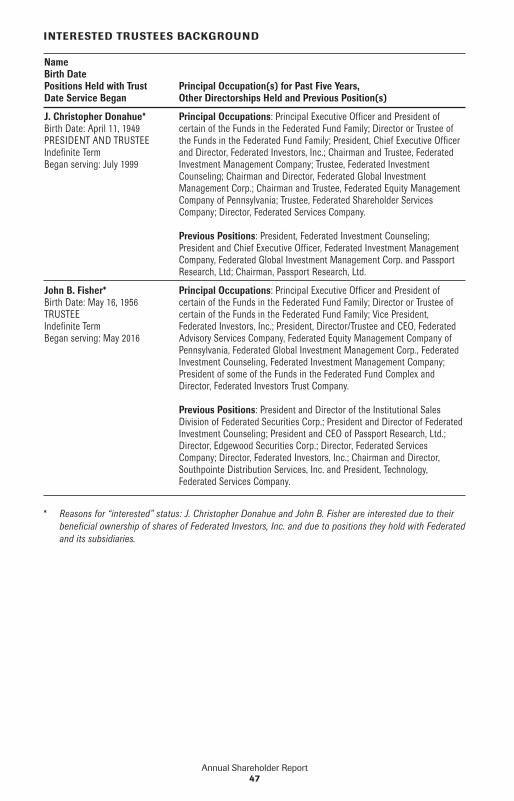
INTERESTED TRUSTEES BACKGROUND
NameBirth DatePositions Held with TrustDate Service Began
Principal Occupation(s) for Past Five Years,Other Directorships Held and Previous Position(s)
J. Christopher Donahue*Birth Date: April 11, 1949PRESIDENT AND TRUSTEEIndefinite TermBegan serving: July 1999
Principal Occupations: Principal Executive Officer and President ofcertain of the Funds in the Federated Fund Family; Director or Trustee ofthe Funds in the Federated Fund Family; President, Chief Executive Officerand Director, Federated Investors, Inc.; Chairman and Trustee, FederatedInvestment Management Company; Trustee, Federated InvestmentCounseling; Chairman and Director, Federated Global InvestmentManagement Corp.; Chairman and Trustee, Federated Equity ManagementCompany of Pennsylvania; Trustee, Federated Shareholder ServicesCompany; Director, Federated Services Company.
Previous Positions: President, Federated Investment Counseling;President and Chief Executive Officer, Federated Investment ManagementCompany, Federated Global Investment Management Corp. and PassportResearch, Ltd; Chairman, Passport Research, Ltd.
John B. Fisher*Birth Date: May 16, 1956TRUSTEEIndefinite TermBegan serving: May 2016
Principal Occupations: Principal Executive Officer and President ofcertain of the Funds in the Federated Fund Family; Director or Trustee ofcertain of the Funds in the Federated Fund Family; Vice President,Federated Investors, Inc.; President, Director/Trustee and CEO, FederatedAdvisory Services Company, Federated Equity Management Company ofPennsylvania, Federated Global Investment Management Corp., FederatedInvestment Counseling, Federated Investment Management Company;President of some of the Funds in the Federated Fund Complex andDirector, Federated Investors Trust Company.
Previous Positions: President and Director of the Institutional SalesDivision of Federated Securities Corp.; President and Director of FederatedInvestment Counseling; President and CEO of Passport Research, Ltd.;Director, Edgewood Securities Corp.; Director, Federated ServicesCompany; Director, Federated Investors, Inc.; Chairman and Director,Southpointe Distribution Services, Inc. and President, Technology,Federated Services Company.
* Reasons for “interested” status: J. Christopher Donahue and John B. Fisher are interested due to theirbeneficial ownership of shares of Federated Investors, Inc. and due to positions they hold with Federatedand its subsidiaries.
Annual Shareholder Report47
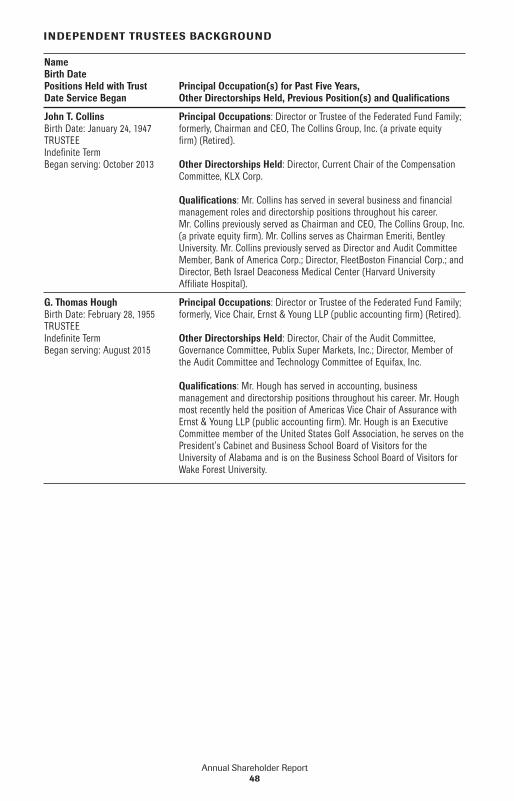
INDEPENDENT TRUSTEES BACKGROUND
NameBirth DatePositions Held with TrustDate Service Began
Principal Occupation(s) for Past Five Years,Other Directorships Held, Previous Position(s) and Qualifications
John T. CollinsBirth Date: January 24, 1947TRUSTEEIndefinite TermBegan serving: October 2013
Principal Occupations: Director or Trustee of the Federated Fund Family;formerly, Chairman and CEO, The Collins Group, Inc. (a private equityfirm) (Retired).
Other Directorships Held: Director, Current Chair of the CompensationCommittee, KLX Corp.
Qualifications: Mr. Collins has served in several business and financialmanagement roles and directorship positions throughout his career.Mr. Collins previously served as Chairman and CEO, The Collins Group, Inc.(a private equity firm). Mr. Collins serves as Chairman Emeriti, BentleyUniversity. Mr. Collins previously served as Director and Audit CommitteeMember, Bank of America Corp.; Director, FleetBoston Financial Corp.; andDirector, Beth Israel Deaconess Medical Center (Harvard UniversityAffiliate Hospital).
G. Thomas HoughBirth Date: February 28, 1955TRUSTEEIndefinite TermBegan serving: August 2015
Principal Occupations: Director or Trustee of the Federated Fund Family;formerly, Vice Chair, Ernst & Young LLP (public accounting firm) (Retired).
Other Directorships Held: Director, Chair of the Audit Committee,Governance Committee, Publix Super Markets, Inc.; Director, Member ofthe Audit Committee and Technology Committee of Equifax, Inc.
Qualifications: Mr. Hough has served in accounting, businessmanagement and directorship positions throughout his career. Mr. Houghmost recently held the position of Americas Vice Chair of Assurance withErnst & Young LLP (public accounting firm). Mr. Hough is an ExecutiveCommittee member of the United States Golf Association, he serves on thePresident’s Cabinet and Business School Board of Visitors for theUniversity of Alabama and is on the Business School Board of Visitors forWake Forest University.
Annual Shareholder Report48
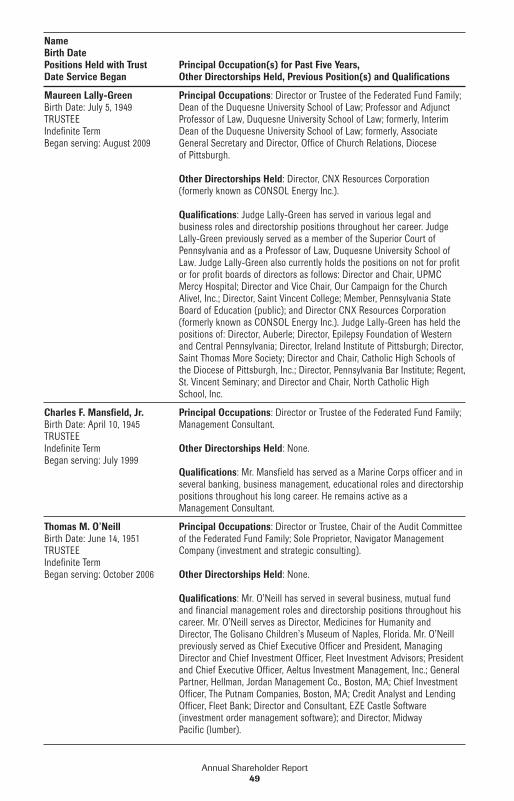
NameBirth DatePositions Held with TrustDate Service Began
Principal Occupation(s) for Past Five Years,Other Directorships Held, Previous Position(s) and Qualifications
Maureen Lally-GreenBirth Date: July 5, 1949TRUSTEEIndefinite TermBegan serving: August 2009
Principal Occupations: Director or Trustee of the Federated Fund Family;Dean of the Duquesne University School of Law; Professor and AdjunctProfessor of Law, Duquesne University School of Law; formerly, InterimDean of the Duquesne University School of Law; formerly, AssociateGeneral Secretary and Director, Office of Church Relations, Dioceseof Pittsburgh.
Other Directorships Held: Director, CNX Resources Corporation(formerly known as CONSOL Energy Inc.).
Qualifications: Judge Lally-Green has served in various legal andbusiness roles and directorship positions throughout her career. JudgeLally-Green previously served as a member of the Superior Court ofPennsylvania and as a Professor of Law, Duquesne University School ofLaw. Judge Lally-Green also currently holds the positions on not for profitor for profit boards of directors as follows: Director and Chair, UPMCMercy Hospital; Director and Vice Chair, Our Campaign for the ChurchAlive!, Inc.; Director, Saint Vincent College; Member, Pennsylvania StateBoard of Education (public); and Director CNX Resources Corporation(formerly known as CONSOL Energy Inc.). Judge Lally-Green has held thepositions of: Director, Auberle; Director, Epilepsy Foundation of Westernand Central Pennsylvania; Director, Ireland Institute of Pittsburgh; Director,Saint Thomas More Society; Director and Chair, Catholic High Schools ofthe Diocese of Pittsburgh, Inc.; Director, Pennsylvania Bar Institute; Regent,St. Vincent Seminary; and Director and Chair, North Catholic HighSchool, Inc.
Charles F. Mansfield, Jr.Birth Date: April 10, 1945TRUSTEEIndefinite TermBegan serving: July 1999
Principal Occupations: Director or Trustee of the Federated Fund Family;Management Consultant.
Other Directorships Held: None.
Qualifications: Mr. Mansfield has served as a Marine Corps officer and inseveral banking, business management, educational roles and directorshippositions throughout his long career. He remains active as aManagement Consultant.
Thomas M. O’NeillBirth Date: June 14, 1951TRUSTEEIndefinite TermBegan serving: October 2006
Principal Occupations: Director or Trustee, Chair of the Audit Committeeof the Federated Fund Family; Sole Proprietor, Navigator ManagementCompany (investment and strategic consulting).
Other Directorships Held: None.
Qualifications: Mr. O’Neill has served in several business, mutual fundand financial management roles and directorship positions throughout hiscareer. Mr. O’Neill serves as Director, Medicines for Humanity andDirector, The Golisano Children’s Museum of Naples, Florida. Mr. O’Neillpreviously served as Chief Executive Officer and President, ManagingDirector and Chief Investment Officer, Fleet Investment Advisors; Presidentand Chief Executive Officer, Aeltus Investment Management, Inc.; GeneralPartner, Hellman, Jordan Management Co., Boston, MA; Chief InvestmentOfficer, The Putnam Companies, Boston, MA; Credit Analyst and LendingOfficer, Fleet Bank; Director and Consultant, EZE Castle Software(investment order management software); and Director, MidwayPacific (lumber).
Annual Shareholder Report49
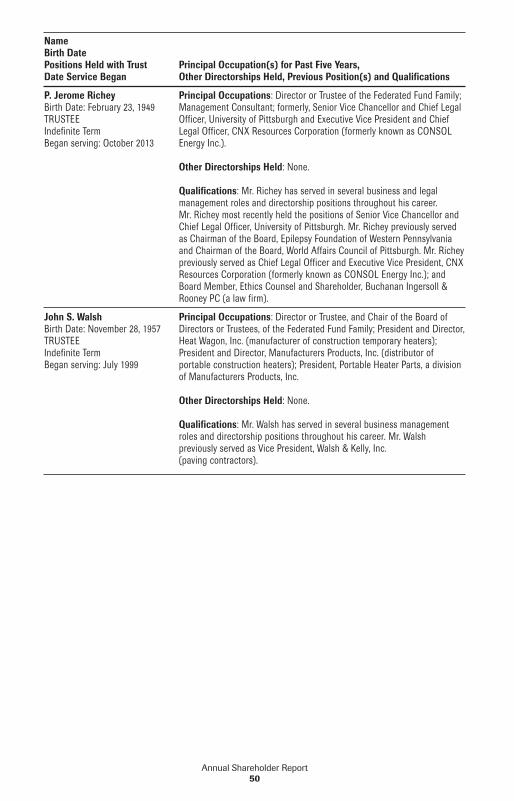
NameBirth DatePositions Held with TrustDate Service Began
Principal Occupation(s) for Past Five Years,Other Directorships Held, Previous Position(s) and Qualifications
P. Jerome RicheyBirth Date: February 23, 1949TRUSTEEIndefinite TermBegan serving: October 2013
Principal Occupations: Director or Trustee of the Federated Fund Family;Management Consultant; formerly, Senior Vice Chancellor and Chief LegalOfficer, University of Pittsburgh and Executive Vice President and ChiefLegal Officer, CNX Resources Corporation (formerly known as CONSOLEnergy Inc.).
Other Directorships Held: None.
Qualifications: Mr. Richey has served in several business and legalmanagement roles and directorship positions throughout his career.Mr. Richey most recently held the positions of Senior Vice Chancellor andChief Legal Officer, University of Pittsburgh. Mr. Richey previously servedas Chairman of the Board, Epilepsy Foundation of Western Pennsylvaniaand Chairman of the Board, World Affairs Council of Pittsburgh. Mr. Richeypreviously served as Chief Legal Officer and Executive Vice President, CNXResources Corporation (formerly known as CONSOL Energy Inc.); andBoard Member, Ethics Counsel and Shareholder, Buchanan Ingersoll &Rooney PC (a law firm).
John S. WalshBirth Date: November 28, 1957TRUSTEEIndefinite TermBegan serving: July 1999
Principal Occupations: Director or Trustee, and Chair of the Board ofDirectors or Trustees, of the Federated Fund Family; President and Director,Heat Wagon, Inc. (manufacturer of construction temporary heaters);President and Director, Manufacturers Products, Inc. (distributor ofportable construction heaters); President, Portable Heater Parts, a divisionof Manufacturers Products, Inc.
Other Directorships Held: None.
Qualifications: Mr. Walsh has served in several business managementroles and directorship positions throughout his career. Mr. Walshpreviously served as Vice President, Walsh & Kelly, Inc.(paving contractors).
Annual Shareholder Report50
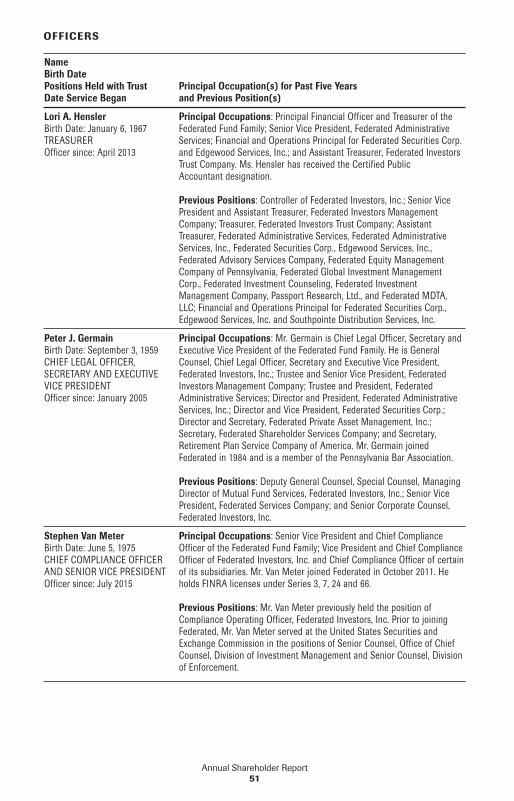
OFFICERS
NameBirth DatePositions Held with TrustDate Service Began
Principal Occupation(s) for Past Five Yearsand Previous Position(s)
Lori A. HenslerBirth Date: January 6, 1967TREASUREROfficer since: April 2013
Principal Occupations: Principal Financial Officer and Treasurer of theFederated Fund Family; Senior Vice President, Federated AdministrativeServices; Financial and Operations Principal for Federated Securities Corp.and Edgewood Services, Inc.; and Assistant Treasurer, Federated InvestorsTrust Company. Ms. Hensler has received the Certified PublicAccountant designation.
Previous Positions: Controller of Federated Investors, Inc.; Senior VicePresident and Assistant Treasurer, Federated Investors ManagementCompany; Treasurer, Federated Investors Trust Company; AssistantTreasurer, Federated Administrative Services, Federated AdministrativeServices, Inc., Federated Securities Corp., Edgewood Services, Inc.,Federated Advisory Services Company, Federated Equity ManagementCompany of Pennsylvania, Federated Global Investment ManagementCorp., Federated Investment Counseling, Federated InvestmentManagement Company, Passport Research, Ltd., and Federated MDTA,LLC; Financial and Operations Principal for Federated Securities Corp.,Edgewood Services, Inc. and Southpointe Distribution Services, Inc.
Peter J. GermainBirth Date: September 3, 1959CHIEF LEGAL OFFICER,SECRETARY AND EXECUTIVEVICE PRESIDENTOfficer since: January 2005
Principal Occupations: Mr. Germain is Chief Legal Officer, Secretary andExecutive Vice President of the Federated Fund Family. He is GeneralCounsel, Chief Legal Officer, Secretary and Executive Vice President,Federated Investors, Inc.; Trustee and Senior Vice President, FederatedInvestors Management Company; Trustee and President, FederatedAdministrative Services; Director and President, Federated AdministrativeServices, Inc.; Director and Vice President, Federated Securities Corp.;Director and Secretary, Federated Private Asset Management, Inc.;Secretary, Federated Shareholder Services Company; and Secretary,Retirement Plan Service Company of America. Mr. Germain joinedFederated in 1984 and is a member of the Pennsylvania Bar Association.
Previous Positions: Deputy General Counsel, Special Counsel, ManagingDirector of Mutual Fund Services, Federated Investors, Inc.; Senior VicePresident, Federated Services Company; and Senior Corporate Counsel,Federated Investors, Inc.
Stephen Van MeterBirth Date: June 5, 1975CHIEF COMPLIANCE OFFICERAND SENIOR VICE PRESIDENTOfficer since: July 2015
Principal Occupations: Senior Vice President and Chief ComplianceOfficer of the Federated Fund Family; Vice President and Chief ComplianceOfficer of Federated Investors, Inc. and Chief Compliance Officer of certainof its subsidiaries. Mr. Van Meter joined Federated in October 2011. Heholds FINRA licenses under Series 3, 7, 24 and 66.
Previous Positions: Mr. Van Meter previously held the position ofCompliance Operating Officer, Federated Investors, Inc. Prior to joiningFederated, Mr. Van Meter served at the United States Securities andExchange Commission in the positions of Senior Counsel, Office of ChiefCounsel, Division of Investment Management and Senior Counsel, Divisionof Enforcement.
Annual Shareholder Report51
NameBirth DatePositions Held with TrustDate Service Began
Principal Occupation(s) for Past Five Yearsand Previous Position(s)
Robert J. OstrowskiBirth Date: April 26, 1963CHIEF INVESTMENT OFFICEROfficer since: May 2004
Principal Occupations: Robert J. Ostrowski joined Federated in 1987 asan Investment Analyst and became a Portfolio Manager in 1990. He wasnamed Chief Investment Officer of Federated’s taxable fixed-incomeproducts in 2004 and also serves as a Senior Portfolio Manager.Mr. Ostrowski became an Executive Vice President of the Fund’s Adviser in2009 and served as a Senior Vice President of the Fund’s Adviser from1997 to 2009. Mr. Ostrowski has received the Chartered Financial Analystdesignation. He received his M.S. in Industrial Administration fromCarnegie Mellon University.
Annual Shareholder Report52
Evaluation and Approval of AdvisoryContract – May 2018FEDERATED INSTITUTIONAL HIGH YIELD BOND FUND (THE “FUND”)
At its meetings in May 2018, the Fund’s Board of Trustees (the “Board”),including a majority of those Trustees who are not “interested persons” of theFund, as defined in the Investment Company Act of 1940 (the “IndependentTrustees”), reviewed and unanimously approved the continuation of the Fund’sinvestment advisory contract for an additional one-year term. The Board’sdecision regarding the contract reflects the exercise of its business judgment afterconsidering all of the information received on whether to continue theexisting arrangements.
The Board had previously appointed a Senior Officer, whose duties includedspecified responsibilities relating to the process by which advisory fees are to becharged to a fund advised by Federated Investment Management Company (the“Adviser”) or its affiliates (collectively, “Federated”) (each, a “Federated fund”).The Senior Officer’s responsibilities included preparing and furnishing to theBoard an annual independent written evaluation that covered topics discussedbelow. In December 2017, the Senior Officer position was eliminated.Notwithstanding the elimination of the Senior Officer position, at the request ofthe Independent Trustees, the Fund’s Chief Compliance Officer (the CCO)furnished to the Board in advance of its May 2018 meetings an independentwritten evaluation covering substantially the same topics that had been coveredin the Senior Officer’s written evaluation in prior years. The Board consideredthe CCO’s independent written evaluation (the “CCO Fee EvaluationReport”), along with other information, in evaluating the reasonableness of theFund’s management fee and in deciding to approve the continuation of theinvestment advisory contract. Consistent with the former Senior Officerposition, the CCO, in preparing the CCO Fee Evaluation Report, has theauthority to retain consultants, experts or staff as reasonably necessary to assist inthe performance of his duties, reports directly to the Board, and can beterminated only with the approval of a majority of the Independent Trustees.
The Board also considered judicial decisions concerning allegedly excessiveinvestment advisory fees in making its decision. Using these judicial decisions asa guide, the Board observed that the following factors may be relevant to anadviser’s fiduciary duty with respect to its receipt of compensation from a fund:(1) the nature and quality of the services provided by an adviser to a fund and itsshareholders (including the performance of the fund, its benchmark, andcomparable funds); (2) an adviser’s cost of providing the services (including theprofitability to an adviser of providing advisory services to a fund); (3) the extentto which an adviser may realize “economies of scale” as a fund grows largerand, if such economies of scale exist, whether they have been shared with a fundand its shareholders or the family of funds; (4) any “fall-out” financial benefitsthat accrue to an adviser because of its relationship with a fund (including
Annual Shareholder Report53
research services received from brokers that execute fund trades and any feespaid to affiliates of an adviser for services rendered to a fund); (5) comparativefee and expense structures (including a comparison of fees paid to an adviserwith those paid by similar funds both internally and externally as well asmanagement fees charged to institutional and other advisory clients of theAdviser or its affiliates for what might be viewed as like services); and (6) theextent of care, conscientiousness and independence with which the fund’s boardmembers perform their duties and their expertise (including whether they arefully informed about all facts the board deems relevant to its consideration of anadviser’s services and fees). The Board noted that the Securities and ExchangeCommission (SEC) disclosure requirements regarding the basis for the Board’sapproval of the Fund’s investment advisory contract generally align with thefactors listed above. The Board was aware of these factors and was guided bythem in its review of the Fund’s investment advisory contract to the extent itconsidered them to be appropriate and relevant, as discussed further below.
The Board considered and weighed these factors in light of its substantialaccumulated experience in governing the Fund and working with Federated onmatters relating to the Federated funds. The Independent Trustees were assistedin their deliberations by independent legal counsel.
In addition to the extensive materials that comprise and accompany theCCO Fee Evaluation Report, the Board received detailed information aboutthe Fund and the Federated organization throughout the year, and inconnection with its May meetings at which the Board’s formal approval of theadvisory and subadvisory contracts occurred. In this regard, Federated providedmuch of this information at each regular meeting of the Board, and furnishedadditional information specifically in connection with the May meetings. In themonths preceding the May meetings, the Board requested and reviewed writtenmaterials prepared by Federated in response to requests on behalf of theIndependent Trustees encompassing a wide variety of topics. At the Maymeetings, in addition to meeting in separate sessions of the IndependentTrustees without management present, senior management of the Adviser alsomet with the Independent Trustees and their counsel to discuss the materialspresented and such additional matters as the Independent Trustees deemedreasonably necessary to evaluate the advisory and subadvisory contracts.Between regularly scheduled meetings, the Board also received information onparticular matters as the need arose.
The Board’s consideration of the investment advisory contract includedreview of the CCO Fee Evaluation Report, accompanying data and additionalinformation covering the following matters, among others: the Adviser’sinvestment philosophy, revenue, profitability, personnel and processes; investmentand operating strategies; the Fund’s short-term and long-term performance (inabsolute terms, both on a gross basis and net of expenses, as well as in termsrelative to its particular investment program and certain competitor or “peergroup” funds and/or other benchmarks, as appropriate) and comments on the
Annual Shareholder Report54
reasons for performance; the Fund’s investment objectives; the Fund’s expenses,including the advisory fee and the overall expense structure of the Fund (bothin absolute terms and relative to similar and/or competing funds), with dueregard for contractual or voluntary expense limitations; the use and allocation ofbrokerage commissions derived from trading the Fund’s portfolio securities (ifany); and the nature, quality and extent of the advisory and other servicesprovided to the Fund by the Adviser and its affiliates. The Board also consideredthe preferences and expectations of Fund shareholders; the entrepreneurial andother risks assumed by the Adviser in sponsoring the Fund; the continuing stateof competition in the mutual fund industry and market practices; the range ofcomparable fees for similar funds in the mutual fund industry; the Fund’srelationship to the Federated funds which include a comprehensive array offunds with different investment objectives, policies and strategies which aregenerally available for exchange without the incurrence of additional salescharges; compliance and audit reports concerning the Federated funds and theFederated companies that service them (including communications fromregulatory agencies), as well as Federated’s responses to any issues raised therein;and relevant developments in the mutual fund industry and how the Federatedfunds and/or Federated are responding to them. The Board’s evaluation processis evolutionary. The criteria considered and the emphasis placed on relevantcriteria change in recognition of changing circumstances in the mutualfund marketplace.
While mindful that courts have cautioned against giving too much weight tocomparative information concerning fees charged by other advisers formanaging funds with comparable investment programs, the Board has found theuse of such comparisons to be relevant to its deliberations. In this regard, theBoard was presented with, and considered, information regarding thecontractual advisory fee rates, net advisory fee rates, total expense ratios andeach element of the Fund’s total expense ratio (i.e., gross and net advisory fees,custody fees, portfolio accounting fees and transfer agency fees) relative to anappropriate group of peer funds compiled by Federated using data supplied byindependent fund ranking organizations (the “Peer Group”). The Boardreceived a description of the composition and methodology used to select thePeer Group. The Board focused on comparisons with other similar mutual fundsmore heavily than non-mutual fund products or services because it is believedthat they are more relevant. For example, other mutual funds are the productsmost like the Fund, in that they are readily available to Fund shareholders asalternative investment vehicles. Also, they are the type of investment vehicle, infact, chosen and maintained by the Fund’s investors. The range of their fees andexpenses, therefore, appears to be a relevant indicator of what consumers havefound to be reasonable in the marketplace in which the Fund competes.
Annual Shareholder Report55
The Board reviewed the contractual advisory fee rate, net advisory fee rateand other expenses of the Fund and noted the position of the Fund’s fee ratesrelative to its Peer Group. In this regard, the Board noted that the contractualadvisory fee rate was below the median of the relevant Peer Group and theBoard was satisfied that the overall expense structure of the Fundremained competitive.
For comparison, the CCO reviewed the fees charged by Federated forproviding advisory services to products other than the Federated funds(e.g., institutional and separate accounts and third-party unaffiliated mutualfunds for which Federated serves as sub-adviser) (referenced to as “ComparableFunds/Accounts”). With respect to Comparable Funds/Accounts other thanthird-party mutual funds, the CCO concluded that they are inherently differentproducts. Those differences include, but are not limited to, different types oftargeted investors; different applicable laws and regulations; different legalstructures; different average account sizes and portfolio management techniquesmade necessary by different cash flows and different associated costs; and thetime spent by portfolio managers and their teams, as well as personnel in theFunds Financial Services, Legal, Compliance and Risk Managementdepartments, in reviewing securities pricing, addressing different administrativeresponsibilities, addressing different degrees of risk associated with managementand a variety of different costs. The CCO also reviewed the differences in thenature of the services required for Federated to manage its proprietary mutualfund business versus managing a discrete pool of assets as a sub-adviser toanother institution’s mutual fund, and that Federated generally performssignificant additional services and assumes substantially greater risk in managingthe Fund and other Federated funds than in its role as sub-adviser to anunaffiliated third-party mutual fund. The CCO did not consider the fees forproviding advisory services to Comparable Funds/Accounts to be determinativein judging the appropriateness of the Federated funds’ advisory fees.
The CCO noted that the services, administrative responsibilities and risksassociated with such relationships are quite different than serving as a primaryadviser to a fund.
Following such evaluation, and full deliberations, the Board concluded thatthe fees and expenses of the Fund are reasonable and supported renewal of theFund’s investment advisory contract.
The Board considered the nature, extent and quality of the services providedto the Fund by the Adviser and the resources of the Adviser and its affiliatesdedicated to the Fund. In this regard, the Board evaluated, among other things,the Adviser’s personnel, experience, track record, overall reputation andwillingness to invest in personnel and infrastructure that benefit the Fund. Inaddition, the Board reviewed the qualifications, backgrounds and responsibilitiesof the portfolio management team primarily responsible for the day-to-daymanagement of the Fund and the Adviser’s ability and experience in attractingand retaining qualified personnel to service the Fund. The Board noted the
Annual Shareholder Report56
compliance program of the Adviser and the compliance-related resourcesprovided to the Fund by the Adviser, including the Adviser’s commitment torespond to rulemaking initiatives of the SEC. The Fund’s ability to delivercompetitive performance when compared to its Peer Group was also deemed tobe relevant by the Board as a useful indicator of how the Adviser is executingthe Fund’s investment program. The Adviser’s ability to execute this programwas one of the Board’s considerations in reaching a conclusion that the nature,extent and quality of the Adviser’s investment management services warrant thecontinuation of the investment advisory contract.
In evaluating the Fund’s investment performance, the Board consideredperformance results in light of the Fund’s investment objective, strategies andrisks, as disclosed in the Fund’s prospectus. The Board considered detailedinvestment reports on the Fund’s performance that were provided to the Boardthroughout the year and in connection with the May meetings. The CCO alsoreviewed information regarding the performance of other mutual funds in thePeer Group, noting the CCO’s view that comparisons to fund peer groups maybe helpful, though not conclusive, in evaluating the performance of the Adviserin managing the Fund. The Board considered, in evaluating such comparisons,that in some cases individual funds may exhibit significant and uniquedifferences in their objectives and management techniques when compared toother funds within a Peer Group.
For the one-year, three-year and five-year periods covered by the CCO FeeEvaluation Report, the Fund’s performance was above the median of therelevant Peer Group.
Following such evaluation, and full deliberations, the Board concluded thatthe performance of the Fund supported renewal of the Fund’s investmentadvisory contract.
The Board also received financial information about Federated, includinginformation regarding the compensation and ancillary (or “fall-out”) benefitsFederated derived from its relationships with the Federated funds. Thisinformation covered not only the fees under the investment advisory contracts,but also fees received by Federated’s subsidiaries for providing other services tothe Federated funds under separate contracts (e.g., for serving as the Federatedfunds’ administrator and distributor). In this regard, the Board considered thatcertain Federated subsidiaries provide distribution and shareholder services tothe Federated funds, for which they may be compensated through distributionand servicing fees paid pursuant to Rule 12b-1 plans or otherwise. Theinformation also detailed any indirect benefit Federated may derive from itsreceipt of research services from brokers who execute Federated fund trades. Inaddition, the Board considered the fact that, in order for a Federated fund to becompetitive in the marketplace, the Adviser and its affiliates frequently waivedfees and/or reimbursed expenses and have disclosed to Federated fund investorsand/or indicated to the Board their intention to do so in the future. Moreover,
Annual Shareholder Report57
the Board receives regular reporting as to the institution, adjustment orelimination of these voluntary waivers. The Board considered Federated’sprevious reductions in contractual management fees to certain Federated fundsin response to the CCO’s recommendations.
Federated furnished information, requested by the CCO, that reportedrevenues on a fund-by-fund basis and made estimates of the allocation ofexpenses on a fund-by-fund basis, using allocation methodologies specified bythe CCO. The CCO noted that, while these cost allocation reports applyconsistent allocation processes, the inherent difficulties in allocating costscontinues to cause the CCO to question the precision of the process and toconclude that such reports may be unreliable, since a single change in anallocation estimate may dramatically alter the resulting estimate of cost and/orprofitability of a Federated fund and may produce unintended consequences.The allocation information, including the CCO’s view that fund-by-fundestimations may be unreliable, was considered in the evaluation by the Board.
The Board and the CCO also reviewed information compiled by Federatedcomparing its profitability information to other publicly held fund managementcompanies, including information regarding profitability trends over time. In thisregard, the CCO concluded that Federated’s profit margins did not appear to beexcessive. The CCO also noted that Federated appeared financially sound, withthe resources necessary to fulfill its obligations under its contracts withthe Fund.
The CCO Fee Evaluation Report also discussed the notion of possiblerealization of “economies of scale” as a fund grows larger. In this regard, theBoard considered that the Adviser has made significant and long-terminvestments in areas that support all of the Federated funds, such as personneland processes for the portfolio management, shareholder services, compliance,internal audit and risk management functions, as well as systems technology(including technology relating to cybersecurity) and that the benefits of theseefforts (as well as any economies of scale, should they exist) were likely to beshared with the Federated fund family as a whole. The Board noted that theAdviser’s investments in these areas are extensive. In addition, the Boardconsidered that the Adviser and its affiliates have frequently waived fees and/orreimbursed expenses and that this has allowed fund shareholders to sharepotential economies of scale with shareholders. The Board also considered thatsuch waivers and reimbursements can provide protection from an increase inexpenses if a Federated fund’s assets decline. Federated, as it does throughout theyear, and specifically in connection with the Board’s review of the advisory andsubadvisory contracts, furnished information relative to revenue sharing oradviser-paid fees. Federated and the CCO noted that this information should beviewed to determine if there was an incentive to either not apply breakpoints, orto apply breakpoints at higher levels, and should not be viewed to determine theappropriateness of advisory fees because it would represent marketing anddistribution expenses. The Board also noted the absence of any applicable
Annual Shareholder Report58
regulatory or industry guidelines on this subject, which (as discussed in theCCO Fee Evaluation Report) is compounded by the lack of any commonindustry practice or general pattern with respect to structuring fund advisoryfees with “breakpoints” that serve to reduce the fee as a fund attains acertain size.
The CCO stated that his observations and the information accompanying theCCO Fee Evaluation Report supported a finding by the Board that themanagement fee for the Fund was reasonable. Under these circumstances, nochanges were recommended to, and no objection was raised to the continuationof, the Fund’s investment advisory contract. The CCO also recognized that theBoard’s evaluation of the Federated funds’ advisory and subadvisoryarrangements is a continuing and on-going process that is informed by theinformation that the Board requests and receives from management throughoutthe course of the year and, in this regard, the CCO noted certain items forfuture reporting to the Board or further consideration by management as theBoard continues its on-going oversight of the Federated funds.
In its decision to continue an existing investment advisory contract, the Boardwas mindful of the potential disruptions of the Fund’s operations and variousrisks, uncertainties and other effects that could occur as a result of a decision toterminate or not renew an investment advisory contract. In particular, the Boardrecognized that many shareholders have invested in the Fund on the strength ofthe Adviser’s industry standing and reputation and with the expectation that theAdviser will have a continuing role in providing advisory services to the Fund.Thus, the Board’s approval of the investment advisory contract reflected the factthat it is the shareholders who have effectively selected the Adviser by virtue ofhaving invested in the Fund. The Board concluded that, in light of the factorssummarized above, including the nature, quality and scope of the servicesprovided to the Fund by the Adviser and its affiliates, continuation of theinvestment advisory contract was appropriate.
The Board based its decision to approve the investment advisory contract onthe totality of the circumstances and relevant factors and with a view to past andfuture long-term considerations. Not all of the factors and considerationsidentified above were necessarily relevant to the Fund, nor did the Boardconsider any one of them to be determinative. With respect to the factors thatwere relevant, the Board’s decision to approve the continuation of the contractreflects its view that Federated’s performance and actions provided a satisfactorybasis to support the decision to continue the existing arrangement.
Annual Shareholder Report59

Voting Proxies on Fund Portfolio SecuritiesA description of the policies and procedures that the Fund uses to determinehow to vote proxies, if any, relating to securities held in the Fund’s portfolio isavailable, without charge and upon request, by calling 1-800-341-7400. A reporton “Form N-PX” of how the Fund voted any such proxies during the mostrecent 12-month period ended June 30 is available via the Proxy Voting Record(Form N-PX) link associated with the Fund and share class name atwww.FederatedInvestors.com/FundInformation. Form N-PX filings are alsoavailable at the SEC’s website at www.sec.gov.
Quarterly Portfolio ScheduleThe Fund files with the SEC a complete schedule of its portfolio holdings, as ofthe close of the first and third quarters of its fiscal year, on “Form N-Q.” Thesefilings are available on the SEC’s website at www.sec.gov. You may also accessthis information via the link to the Fund and share class name atwww.FederatedInvestors.com/FundInformation.
Annual Shareholder Report60

Notes
[PAGE INTENTIONALLY LEFT BLANK]
Mutual funds are not bank deposits or obligations, are not guaranteed by any bank and arenot insured or guaranteed by the U.S. government, the Federal Deposit InsuranceCorporation, the Federal Reserve Board or any other government agency. Investment inmutual funds involves investment risk, including the possible loss of principal.
This Report is authorized for distribution to prospective investors only whenpreceded or accompanied by the Fund’s Prospectus, which contains factsconcerning its objective and policies, management fees, expenses andother information.
e e eratd dFederated Institutional High Yield Bond FundFederated Investors Funds4000 Ericsson DriveWarrendale, PA 15086-7561
Contact us at FederatedInvestors.comor call 1-800-341-7400.
Federated Securities Corp., Distributor
CUSIP 31420B300CUSIP 31420B847
29856 (12/18)
Federated is a registered trademark of Federated Investors, Inc.2018 ©Federated Investors, Inc.