Embed Size (px)
Citation preview

© The European Bank for Reconstruction and Development, 2004.Published by Blackwell Publishing, 9600 Garsington Road, Oxford OX4 2DQ, UK and 350 Main Street, Malden, MA 02148, USA.
Economics of TransitionVolume 12 (3) 2004, 373–398
Blackwell Publishing, Ltd.Oxford, UKECOTThe Economics of Transition0967-0750© Blackwell Publishing 200412Original Article
F
ederal
T
ax
A
rrears in
R
ussia
P
onomareva and
Z
huravskaya
Federal tax arrears in Russia
Liquidity problems, federal redistribution or regional resistance?*
Maria Ponomareva* and Ekaterina Zhuravskaya**
*Northwestern University, USA. **Institute for Advanced Study, Princeton, Center for Economic and Financial Research, Moscow, and CEPR. Email: [email protected]
Abstract
Three hypotheses about the nature of federal tax arrears in Russia in the secondhalf of the 1990s are tested empirically. Tax arrears can be a result of: 1) liquidityproblems in firms, 2) redistributive subsidies of the federal government, or3) regional political resistance to federal tax collectors. Liquidity problems in firmsexplain a large part of the variation in tax arrears. Regional political resistance tofederal tax collectors was also an important factor: For a given level of liquidity,federal arrears accumulated faster in regions where governors had a larger popularbase, in regions with a better bargaining position
vis-à-vis
the centre, and in regions withgovernors in political opposition to the centre. We find that patterns of federal arrearsare inconsistent with the redistributive politics premise that redistribution favoursjurisdictions with ‘closer races’ for the incumbent in the national elections. Variationin authorized tax deferrals can be explained in part by federal redistributive politics.
JEL classifications: H11, H26, R5, P26.Keywords: Tax arrears, regional protection, Russia, transition, redistributive politics.
* We are very grateful to Ahmed Ahmedov, David Brown, Sergei Guriev, Boris Kuznetzov, Evgeny Orlov,Elena Paltseva, Leonid Poleschuk, Gerard Roland, Mark Schaffer, two anonymous referees, and the par-ticipants of CEFIR-EERC Annual Conference on political economy and seminar participants at the NewEconomic School and CEFIR for helpful comments. We also thank Dmitry Novikov, Irina Slinko, and EvgenyYakovlev for excellent research assistance. We thank the New Economic School Research Center for finan-cial support at early stages of this project.
374
P
onomareva and
Z
huravskaya
1
.
Introduction
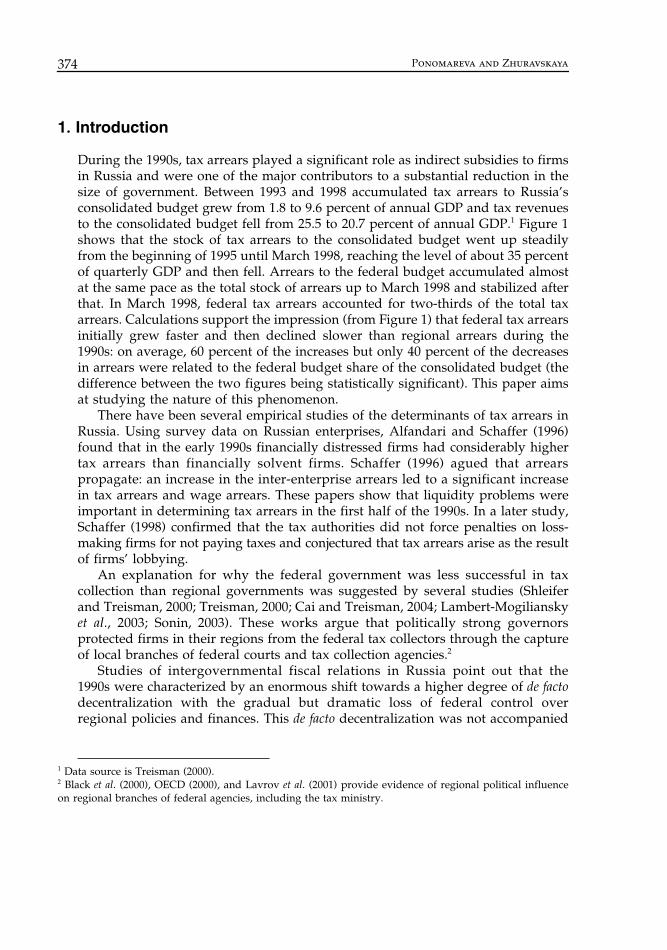
During the 1990s, tax arrears played a significant role as indirect subsidies to firmsin Russia and were one of the major contributors to a substantial reduction in thesize of government. Between 1993 and 1998 accumulated tax arrears to Russia’sconsolidated budget grew from 1.8 to 9.6 percent of annual GDP and tax revenuesto the consolidated budget fell from 25.5 to 20.7 percent of annual GDP.
1
Figure 1shows that the stock of tax arrears to the consolidated budget went up steadilyfrom the beginning of 1995 until March 1998, reaching the level of about 35 percentof quarterly GDP and then fell. Arrears to the federal budget accumulated almostat the same pace as the total stock of arrears up to March 1998 and stabilized afterthat. In March 1998, federal tax arrears accounted for two-thirds of the total taxarrears. Calculations support the impression (from Figure 1) that federal tax arrearsinitially grew faster and then declined slower than regional arrears during the1990s: on average, 60 percent of the increases but only 40 percent of the decreasesin arrears were related to the federal budget share of the consolidated budget (thedifference between the two figures being statistically significant). This paper aimsat studying the nature of this phenomenon.
There have been several empirical studies of the determinants of tax arrears inRussia. Using survey data on Russian enterprises, Alfandari and Schaffer (1996)found that in the early 1990s financially distressed firms had considerably highertax arrears than financially solvent firms. Schaffer (1996) agued that arrearspropagate: an increase in the inter-enterprise arrears led to a significant increasein tax arrears and wage arrears. These papers show that liquidity problems wereimportant in determining tax arrears in the first half of the 1990s. In a later study,Schaffer (1998) confirmed that the tax authorities did not force penalties on loss-making firms for not paying taxes and conjectured that tax arrears arise as the resultof firms’ lobbying.
An explanation for why the federal government was less successful in taxcollection than regional governments was suggested by several studies (Shleiferand Treisman, 2000; Treisman, 2000; Cai and Treisman, 2004; Lambert-Mogiliansky
et al.
, 2003; Sonin, 2003). These works argue that politically strong governorsprotected firms in their regions from the federal tax collectors through the captureof local branches of federal courts and tax collection agencies.
2
Studies of intergovernmental fiscal relations in Russia point out that the1990s were characterized by an enormous shift towards a higher degree of
de facto
decentralization with the gradual but dramatic loss of federal control overregional policies and finances. This
de facto
decentralization was not accompanied
1
Data source is Treisman (2000).
2
Black
et al
. (2000), OECD (2000), and Lavrov
et al
. (2001) provide evidence of regional political influenceon regional branches of federal agencies, including the tax ministry.

F
ederal
T
ax
A
rrears in
R
ussia
375
by appropriate changes to the
de jure
central command over subnational budgets.
3
Shleifer and Treisman (2000) were the first to associate the strengthening of regionalpolitical and fiscal powers
vis-à-vis
the federal centre with shortfalls in federal taxrevenues and the growth of fiscal imbalances in the second half of the 1990s.Motivated by the ideas of Shleifer and Treisman’s book, Cai and Treisman (2004)developed a Tiebout-like formal model of inter-regional competition to attractcapital by providing protection from federal tax collectors. The model shows thatthe accumulation of federal tax arrears can be explained by the regional protection-ist policies of politically strong governors. Sonin (2003) produced another testablehypothesis about the determinants of regional protection from paying federaltaxes. He built a model of interactions between a regional governor and a benevolentfederal tax enforcer to show that the industrial structure of regional economies andthe ability of governors to extract rents from regional enterprises are importantdeterminants of the extent of regional protection.
3
For the best available surveys of development of Russia’s federalism see OECD (2000) and Lavrov
et al
.(2001). Treisman (2000) provides aggregate data on dynamics of consolidated revenues and tax arrears.
Figure 1. Growth in federal tax arrears accounts for most of the growth in total arrears
Source: Russian Economic Trends
376
P
onomareva and
Z
huravskaya
Using regional level data on tax debt, Treisman (2000) attempted to test thehypothesis about the regional protection explanation of tax arrears. He foundsome, albeit very weak, evidence in support of the conjecture that tax arrears werethe result of political and fiscal interactions between the regional and federalauthorities. In particular, the presence of very large enterprises in the regionsignificantly increased regional tax debt and so did the existence of a newly electedcommunist governor (other political variables turned out to be insignificant). Theabsence of firm-level data precluded Treisman from drawing definite conclusionsabout the nature of arrears because it was not possible to control for the financialperformance of firms. This is particularly important because the previous literatureidentified financial distress as a primary source of federal arrears (Alfandari andSchaffer, 1996 and Schaffer, 1996).
Federal tax arrears and bailouts of non-paying firms in the form of authorizedtax deferrals may also arise because federal governments, which can enforce taxcollection, have incentives not to do so.
4
In particular, we look at whether theRussian federal government used tax arrears and deferrals to redistribute incometowards those regions where it faces tougher electoral competition in national elec-tions – (as argued by Lindbeck and Weibull (1987) and Dixit and Londregan (1995and 1998)) – and whether there is any evidence of a purer form of income redistri-bution produced by enforcing taxes more strictly in richer than in poorer regions.
Treisman’s empirical study (2000) is the one most closely related to this paper:essentially this paper revisits the same hypothesis. The advantage of our approachrests on the availability of micro-level data. Firm-level data allow us to differentiateempirically between the alternative hypotheses at the regional and firm level –regional resistance to paying federal taxes, implicit redistributive federal subsidiesto firms and the lack of liquidity (financial distress) of firms. In particular, we testthe empirical relevance of the regional protection story after controlling for liquidityat the firm level.
We find that both lack of liquidity in firms and governors’ political resistanceto federal tax collection were important in determining federal arrears. Liquidityproblems in firms explain a large part of the variation in the flow and stock of taxarrears. In addition, for a given level of liquidity, federal arrears accumulated fasterand authorized tax deferrals were more frequent in regions where governors hada larger popular base, in regions that had better bargaining position
vis-à-vis
thecentre, and in regions where the governor was in political opposition to the centre.Contrary to the premise of the redistributive politics paradigm, there is no
4
Tax deferral is an official permission given to a particular firm by tax authorities to postpone payment ofa certain amount of taxes due. A sequence of mass authorized tax deferrals took place in 1994, 1996 and1997. Ivanova and Wyplosz (1999) used time-series data to show that official deferrals in tax paymentscaused tax arrears to go up. They also provided evidence of strategic behaviour of enterprises in accumu-lation of tax arrears: enterprises correctly predicted that the policy of granting deferrals was persistent overtime and accumulated tax arrears in expectation of future deferrals.
F
ederal
T
ax
A
rrears in
R
ussia
377
evidence that regions where the incumbent had a ‘close race’ in the presidentialelections had higher levels of arrears. These results explain why federal tax arrearsaccumulated faster than regional arrears. In contrast, authorized tax deferralsgranted by the federal government exhibit a pattern that is consistent with thestory of federal government buying off ‘swing’ voters: in regions where the votefor the incumbent president and the opposition candidate were closer, deferralswere more frequent. However, some federal deferrals were granted becauseregional governors successfully bargained for them on behalf of regional companies.
The paper is organized as follows. Section 2 presents testable hypotheses relatedto alternative theories of the nature of federal tax arrears. Section 3 describes thedata and empirical methodology. Section 4 presents results. The conclusions followin Section 5.
2
.
The nature of tax arrears: Testable hypotheses
2.1 Lack of liquidity
Many Russian enterprises, profitable according to their books, did not have liquidityto finance their profit tax obligations because they were involved in barterchains (Guriev and Ickes, 2000) and experienced inter-enterprise arrears (OECD,2000). In addition, genuinely loss-making enterprises accumulated tax obligationsthat they were unable to meet: a large part of federal tax liabilities was independ-ent of enterprise performance characteristics, e.g., payroll and revenue taxes. Thus,the literature has cited liquidity problems in firms as the most natural cause of taxarrears in the 1990s (see, for instance, Schaffer, 1996). Henceforth, we denote thisexplanation the
lack of liquidity
(LL) hypothesis.Liquidity problems alone may explain the difference in dynamic patterns of
federal and regional arrears that this paper aims to explain because regional andlocal governments often accepted in-kind contributions towards subnational taxes(i.e., public work by the firm’s employees, paving roads, provision of housing,sports and cultural facilities to the local population) whereas the federal govern-ment required cash payments (Litwack, 2002).
We measure the extent of firms’ liquidity problems by the absolute, ‘quick’, andcurrent liquidity ratios as well as the relative size of overdue receivables (detailsare given below in the methodology section). If liquidity constraints are binding,we expect a negative correlation between liquidity measures and federal tax arrears.Since our liquidity measures are based on the accounting statements of firms, thefact that the measures indicate low liquidity may just reflect the endogenousoutcomes of firms’ tax evasion because managers can use improper accountingto hide revenues from tax collectors. With the available data it is impossible todifferentiate between real and fraudulent liquidity problems. Thus, we may over-state the importance of lack of liquidity as a cause of tax arrears.

378
P
onomareva and
Z
huravskaya
2.2 Regional resistance
Arrears do not only arise because firms do not have the liquidity to pay the taxesdue. It is possible that while firms are able to pay taxes and the federal governmentwants to enforce tax collection, arrears accumulate because the federal governmentlacks instruments for enforcement. Shleifer and Treisman (2000) suggested that thiswas the reason for the fall in federal revenues and the rise in federal tax arrearsbetween 1995 and 1998. Federal tax collection efforts were impaired because theagents who carry out tax collection and enforcement in the regions (formallyfederal employees) as well as the regional judiciary (formally independent) were oftenunder the control of regional governments. Lavrov
et al.
wrote ‘federal organsoperating in the regions typically have close relations with the regional adminis-tration, depending on the latter for a number of reasons, sometimes even for theprovision of office space. Federal organs in the regions are typically staffed by localofficials with a background in regional administration. Until recently, the regionalgovernor had informal veto power over the selection of some federal representatives,most notably the head of the tax ministry’ (2001, p. 14). Tax and treasury officialsfrom the regional branches of these federal agencies usually looked to a positionin the regional administration as the best possible continuation of their careers.
There are several reasons why regional governments may want to provideprotection to firms in their regions from federal taxes. They may want to attractprofitable firms to their regions in order to reduce regional employment or forpurely fiscal reasons. Moreover, regional governments may facilitate their own taxcollections by withholding federal taxes because the federal and regional tax basesoverlap. Other causes of regional resistance to paying federal taxes are corruptionand capture of the regional government by politically powerful industrial elites inthe regions. It may be cheaper and more feasible for firms to bribe the regionalauthorities than to bribe the federal government. The same can be true if specialrelationships of business to government are not based on other methods of politicalinfluence rather than bribes.
The OECD Economic Survey on Russia (2000) reported that threats by regionalgovernments to withhold the federal share of tax revenues in the region as well asissuance of official instructions to regional branches of tax collection agencies onhow to do it were quite common. For example, Tatarstan, Bashkorkostan, Sakha-Yakutia, and Chechnia regions showed that direct withholdings of federal taxeswere possible. The report states, however, that many of the threats were not imple-mented and it is not clear whether they were credible. Lambert-Mogiliansky
et al.
(2003) showed that the bankruptcy law of 1998 was frequently used by manyregional governors to justify large regional enterprises not paying federal taxes.
We refer to the explanation that the shortfall in federal tax collection wascaused by opportunistic behaviour by federal agents in the regions as the
regionalresistance
(RR) hypothesis. This hypothesis generates several predictions. First, onecan look at whether regional governors were in political opposition to the federal
F
ederal
T
ax
A
rrears in
R
ussia
379
centre. Governors that were loyal to Yeltsin and relied on the federal government’spolitical support during elections were less likely to engage in regional resistanceto paying federal taxes because this was likely to spoil their relationship with thepresident. Second, more popular governors were likely to find it easier to controlfederal tax agents based in their regions because of these agents’ career concerns.Since governors with a broader political base were more likely to win the nextelections, they could more credibly promise positions in the regional administra-tion to opportunistic federal agents who might get fired. Third, higher concentra-tion within the regional industrial sector increases the incentives of regionalauthorities to protect firms because concentration usually indicates close tiesbetween a regional governor and the largest industrial enterprises (Slinko
et al.
,2003); and higher rents can be extracted from the largest enterprises in regions withhigher concentration (Sonin, 2003). Fourth, regions that protect their firms frompaying federal taxes may not depend on federal transfers as the main source offinancing of public expenditure (instead they may have a relatively high percent-age of expenditures covered by their own sources of revenues).
5
Otherwise, thefederal government can fight regional resistance by cutting transfers to regions thatcapture federal tax collectors. And finally, regions that have a history of counter-manding federal laws by regional legislation probably have a strong bargainingposition
vis-à-vis
the centre and, therefore, are more likely to credibly threaten thecentre by withholding its revenues.
We use indirect measures of political relationships between the centre and theregional authorities because we were unable to find variables that directly measureregional characteristics needed to test some of the outlined predictions. The bestavailable proxies for loyalty of the regional governor to the federal centre andcountermanding federal legislation by regional legislation were the two independ-ently constructed composite indices that evaluate the relationships of governors andthe centre. We discuss the construction and use of all variables in the next section.
2.3 Federal financing
An alternative explanation for the accumulation of federal tax arrears is that thefederal government did not (as the RR hypothesis suggests) have problems enforc-ing tax collection but that it simply did not want to enforce tax payments by certainenterprises. Governments may have incentives not to enforce tax collection becausetolerating tax arrears can serve as an effective way of subsidizing firms. In par-ticular, permitting tax arrears may be politically more feasible than giving directsubsidies when governments are cash constrained or when the law prohibits directsubsidies. In this case, politicians may choose to tolerate, delay, or write off tax
5
Treisman (1998) studied the determinants of the distribution of federal transfers across regions.

380
P
onomareva and
Z
huravskaya
arrears instead of liquidating non-paying firms or forcing them to pay. The reasonsfor subsidizing firms have been extensively studied in the literature.
6
Politicians atall levels of government may have incentives to subsidize firms in order to secureinefficiently high employment (Shleifer and Vishny, 1994; and Kornai, 1980) andbribes (Shleifer and Vishny, 1993); or because they cannot commit not to do it ifsubsidies are
ex post
efficient even when they are associated with large
ex ante
inefficiencies (Maskin and Xu, 2001). The motive for
ex post
subsidization can beboth political (when governments fear the political costs of liquidation of largefirms) and financial (when governments can get taxes after they have re-financedfailing firms).
If, independently of each other, federal and regional governments had the sameincentive to subsidize large firms by means of tax arrears, either there would be nodifference between federal and regional tax collection or regional tax enforcementwould be smaller. This is because some large regional enterprises are very importantpolitically at the regional level but small and unimportant from the point of viewof the federal government.
We, however, aim to explain the opposite pattern of divergence between federaland regional arrears. Federal governments may have a stronger desire thanregional governments to subsidize firms because it may have strong incentives forredistribution. In the absence of a better mechanism of redistribution, tax arrearsmay be used. A pure form of income redistribution implies that the federalgovernment would enforce tax collection more strictly in richer than in poorer regions.The redistributive politics paradigm (Lindbeck and Weibull, 1987 and Dixit andLondregan, 1995 and 1998) argues that the federal government would redistributetowards regions where it faces tougher electoral competition in national electionsand many voters are undecided between incumbent or opposition candidates.Thus, if we compare similar firms in different regions, we should observe higherfederal tax arrears in firms located in regions with smaller gross regional product(GRP) per capita and/or regions that had closer races in presidential elections. Wecall this explanation the
federal financing
(FF) hypothesis.
7
Data on distribution of authorized tax deferrals across firms allow us to test thehypotheses further. If tax arrears are a result of a deliberate federal redistributionpolicy, official deferrals should be more frequent in economically weaker regionsand regions with closer races in national elections. If tax arrears are a result ofregional governors’ resistance, higher deferrals should be observed in regionswhere the governor is in open opposition to the federal centre and regions thathave stronger bargaining power
vis-à-vis
the centre.It is worth noting that the hypotheses considered here are not mutually exclus-
ive. It is possible that all three hypotheses are relevant in explaining a part of
6
See Roland (2000) for an excellent survey of this literature.
7
Note that the redistribution motive for federal arrears is consistent with on average less strict federal(compared to regional) tax enforcement.

F
ederal
T
ax
A
rrears in
R
ussia
381
federal tax arrears. We can only investigate what is the prevailing nature of federalarrears and deferrals. The question that interests us most is whether regionaleconomic and political factors matter for determining the scope of arrears for agiven level of firms’ liquidity.
3
.
Data, variables, and empirical methodology
3.1 Data sources and the sample
The Russian Tax Ministry supplied us with two lists containing firm-level data: onewith information on the stock of federal tax arrears on January 1, 1997 and the flowof authorized federal tax deferrals on April 1, 1997; and the other with the sameinformation for 1998. The lists overlap for about five hundred companies. Theselection criteria were not carefully specified by tax ministry officials but theyclaimed that ‘the sample in each year is close to a random draw’ from the lists ofthe largest debtors to the federal budget in the 1996 and 1997.
We merged these lists of companies with the Russian Enterprise RegistryLongitudinal Data Base (RERLD), which contains statistical data for large andmedium-size Russian enterprises.
8
The resulting dataset contains 863 firms in 1997and 1,374 firms in 1998.
9
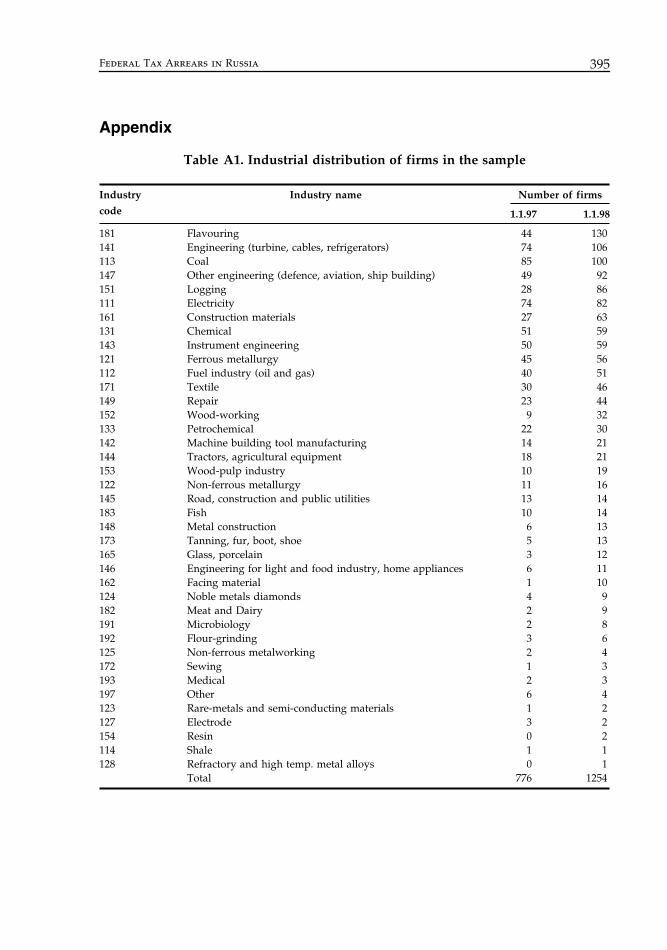
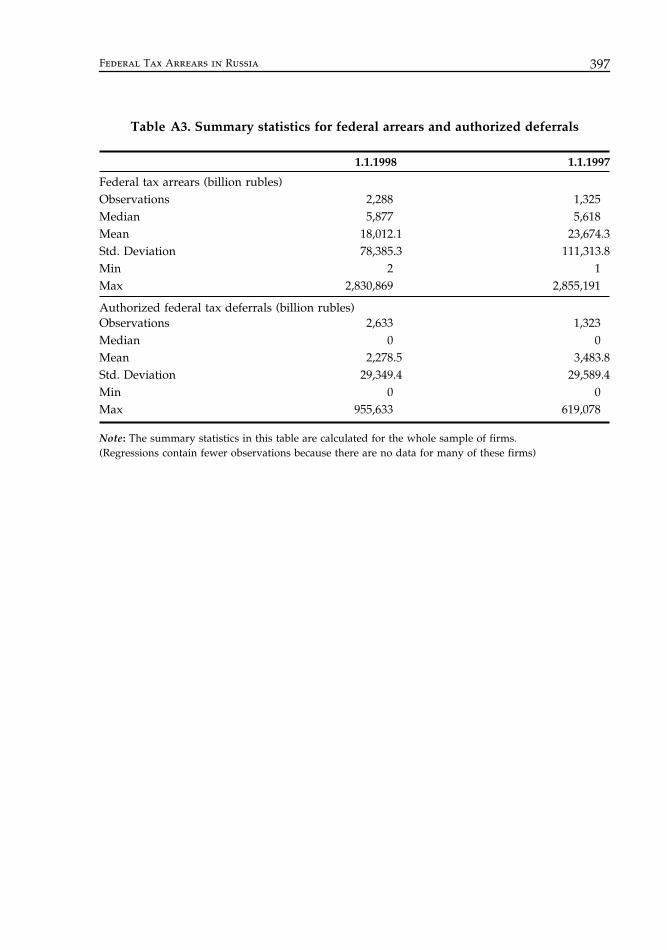
In addition, to this dataset we merged several financialindicators from the accounting statements of firms provided by Goskomstat(Russia’s Official Statistical Agency) and regional level data for 73 out of 89 regionsof the Russian Federation. This reduced our sample further to 776 firms in 1997 and1,254 firms in 1998. Regional data come from Goskomstat with the exception oftwo indices that characterize political relationships between the federal govern-ment and regional governors. These indices were independently constructed by theUrban Institute and the MFK Renaissance. In addition, for the 476 companies(present in both lists) that accumulated arrears in 1997, we constructed a variableindicating the flow of federal arrears. The resulting sample consists of big indus-trial firms. Distributions of firms in our sample across industries and regions arepresented in Tables A1 and A2 in the Appendix. Table A3 provides summarystatistics for federal tax arrears and authorized tax deferrals.
3.2 Empirical methodology and description of variables
To test the hypotheses described in the previous section, we ran three series ofcross-section firm-level regressions. First, we estimated the following set of regres-sions for the stock of arrears at the beginning of 1997 and 1998 separately:
8
Detailed information on how the RERLD was constructed is given in Brown and Brown (1999).
9
Few companies from these lists have arrears or deferrals data missing.
382
P
onomareva and
Z
huravskaya
Log
[
Arrears_stock/output
]
i
=
α
1
Liquidity_ratio
i
+
α
2
Log
[
Overdue_receivables
/
output
]
i
+
α
3
Governor_pol_power
i
+
α
4
Reg_own_revenue_share
i
+
α
5Fed_pol_compi + α 6Log[GRP_pc]i + α 7Reg_Concentration + α 8Controlsi + εi (1)
The first thing to note is that, although, the sample consists mostly of very largefirms, the variation in size is very high. Thus, it is important to normalize financialvariables (e.g., stock and flow of arrears, overdue receivables) by a proxy for enter-prise size. We normalize these variables by the value of nominal output. Second,since we aim to analyse tax arrears the most important control variable shouldbe the amount of taxes due. We do not, however, have these data for the wholesample (only a few firms reported the amount of tax obligations in their balancesheets). The closest proxy for the amount of tax obligations available for a sufficientnumber of firms turned out to be the value of enterprise output.10 Thus, ournormalization controls for the amount of tax due.
Liquidity_ratio stands for the absolute, ‘quick’, or current liquidity ratio – standardaccounting measures of liquidity. We take the absolute liquidity ratio (equal tocash over short term liabilities) as our baseline measure because it has the largestnumber of observations and unlike the other liquidity ratios does not have tradecredits in the numerator. In the special Russian case, trade credits may not be asign of expected liquidity; instead they may indicate that the enterprise has beenforced into a chain of inter-enterprise arrears. Nonetheless, we verify that the base-line results obtained using the absolute liquidity ratio are robust to using otherliquidity ratios. Overdue_receivables/output is a direct measure of whether an enter-prise is a part of an inter-enterprise arrears chain. Unfortunately, data on overduereceivables are scarce, so that the inclusion of this variable in the regressionreduced the number of observations by about forty percent. Thus, as a baseline wereport regression results without this variable. Again, the baseline results forliquidity as well as other explanatory variables are robust to the inclusion ofoverdue receivables as an additional regressor.
Fed_pol_comp is a measure of federal political competition. It is importantfor the FF hypothesis because this measure reflects political motives for federalredistribution. It is equal to the negative of the absolute value of the differencebetween the votes for the incumbent presidential candidate, Yeltsin, and hisopponent, Zuganov, in the second round of the Russian presidential electionsof 1996.
Governor_pol_power (standing for governor’s political power) is the label forthree variables that we include in the regressions in turn: the percentage of votes
10 Initially we tried to predict the federal tax obligations for the firms in our sample, by 1) estimating theequation of determinants of federal tax obligations for a smaller set of firms that reported tax obligationsdata, and 2) calculating the predicted tax obligations for the whole set of our firms with the fitted values.We, however, found that the value of output is the best predictor of taxes due and, thus, dropped thistwo-stage procedure.
Federal Tax Arrears in Russia 383
for the governor in the first tour of the last regional elections and two indices thatcharacterize the nature of relationship between the federal and regional authorities.
The first index measures tensions in relationships between the governor and thefederal centre in 1997 (higher value means higher tension in relationships). It wasconstructed by the former investment group MFK Renaissance. This index summa-rizes information on the frequency of public statements by the governor personallyagainst president Yeltsin and against Yeltsin’s policies, the level of political supportof the governor by the centre during the last regional elections (with the negativesign) and the presence (or not) of a bilateral treaty between the region and thecentre. As we discussed in the previous section, if the regional governor is inopposition to the federal centre and does not rely on federal political support duringregional elections, regional resistance to federal tax collection is more likely.
The second index proxies for the strength of the bargaining power of the regionwith the federal centre in 1996 (higher values mean a stronger bargaining positionfor the region). This index was constructed by the Urban Institute in Moscow(http://www.urbaneconomics.ru/eng/index.php). The first component of thisindex summarizes the information about contradictions of federal laws by regionallegislation and regulations. This component should have unambiguous effect onregional resistance because it reflects the lack of federal control in the region. Thesecond component is a measure of regional natural resource endowments. Theeffect of natural resource endowments is ambiguous, because, on the one hand,natural resources give governors additional bargaining power vis-à-vis the centrewhich would help regional resistance, but on the other hand, companies thatexport natural resources are very large and likely to bargain directly with thefederal government rather than use regional governments for protection. Naturalresource exporters have strong incentives to invest in their relationship with thefederal government because most of natural resource taxes are collected by federalcustoms at the border rather than by tax collectors inside the regions.11 The thirdcomponent of the index is the evaluation of whether regional population votesagainst or for federal policies during national elections. On the one hand, it wouldbe politically less costly for the regional governor to obstruct federal tax collectionif the population of the region votes against the federal policies (which is in linewith the regional resistance story). On the other hand, this component of the indexis correlated with the closeness of the race of the incumbent and oppositioncandidate in the national elections (which is relevant for federal redistributivefinancing). We control, however, for the closeness of the race at the nationalelections. Thus, this index also serves as a proxy for regional resistance.12
11 Controlling for the natural resource potential or export of natural resources directly in order to eliminatethis ambiguity does not change our baseline results. The coefficients of the resource potential variables areinsignificant in all regressions.12 The baseline results do not change if we control for Yeltsin’s political popularity in the regions.
384 Ponomareva and Zhuravskaya
Regional own tax revenues as a share of total regional expenditures,Reg_own_revenue_share, proxies for the scale of dependence of regional budgets onfederal transfers (important for the RR hypothesis). All proxies for governors’ polit-ical power and the regional own revenue share are highly correlated (which provesthat all of them essentially measure the same thing – bargaining power of the regionvis-à-vis the centre). Thus, we include these variables in regressions one by one.13
Log of GRP per capita is included in all regressions as a proxy for regionalincome (which might be relevant for income redistribution under the FF hypo-thesis). Concentration of output among the largest non-state industrial enterprisesin the region is included to test Sonin’s (2003) prediction (RR hypothesis). To makeconcentration comparable across regions, it is measured by the Herfindahl-Hirschman measure calculated among the ten largest non-state regional firms.
We use the following control variables: dummy for electricity suppliers,dummy for regional election in the preceding year, log of geographical distance toMoscow from the region where the firm is located, dummy for the military sector,and dummies for 2-digit industries. Military and electricity enterprises have specialrelationships to the federal government; thus, they may enjoy special treatmentby the federal tax authorities.14 2-digit industry dummies are included becausetaxability of firms in different industries differs for technological reasons (Gehlbach,2003). Distance from the capital of the region to Moscow is an important controlbecause whenever the federal government has limited resources for enforcementof tax collection, it chooses to collect taxes where it is cheaper to do so (i.e., closerto the centre).
Both regional and federal elections can affect the incentives of the federalgovernment for redistribution as well as the incentives of the regional governmentfor protection from federal taxes. In particular, predictions about the regionalincentives for capture of federal agents in the regions can be weakened substantiallyin times of gubernatorial elections because federal political support during electioncampaigns can be very helpful for incumbent governors. On the other hand,governors that do not count on federal support during regional elections may intensifyprotection because it brings additional revenue to the region. The federal govern-ment’s political incentives also change in the face of elections which strengthen thepolitical motive for redistribution. 1996 was the year of presidential elections andelections of regional governors in many of the regions. A few regional electionsalso took place in 1997. Thus, we separately run regressions for the arrears in thebeginning of 1997 and of 1998 to control for federal elections and include dummiesfor regional election in the previous year to control for regional elections.
13 The results do not change much if we include the share of own revenues in all regressions.14 Electricity companies were paid by the federal government (by tolerating tax arrears) for channelingsubsidies to politically important firms in the form of low energy prices. Military firms depend on thefederal government for orders.

Federal Tax Arrears in Russia 385
All independent variables in regressions for arrears at the beginning of 1997 aretaken in 1996 (with the exception of the index of tensions in relationships betweenthe governor and the federal centre which is only available in 1997); and in regres-sions for arrears at the beginning of 1998 independent variables are for 1997 or 1996depending on data availability.15 Endogeneity is a serious issue in the regressionsdescribed above, even though we lag all except one explanatory variable, becausethe dependent variables are stocks and we do not have information on when thesestocks were accumulated. Unfortunately, we do not have appropriate instruments.Therefore, we also run a series of similar cross-section regressions for the flow ofarrears accumulated in 1997 normalized by the level of firm’s output.
Log[Arrears_flow/output]i = α 1Liquidity_ratioi + α 2Log[Overdue_receivables/output]i + α 3Governor_pol_poweri + α4Reg_own_revenue_sharei + α 5Fed_pol_compi + α 6Log[GRP_pc]i + α 7Reg_Concentrationi + α 8Controlsi + εi (2)
We included 476 firms in which the stock of arrears increased during 1997 inthis estimation. There are, however, another 120 firms that have observations forthe beginning of both 1997 and 1998, but their arrears decreased during 1997. Weexclude these observations from the sample for two reasons: 1) as it turns out, therate of repayment of arrears is unrelated to our variables of interest; and 2) poolingthe two subsamples (the one in which arrears rose and the one in which they fell)and allowing only the coefficients of interest to differ is rejected by econometrictests. Evidently, the pattern of federal tax enforcement for companies that paymore to the government than just the flow of new tax obligations follows a differ-ent rule than that for companies which accumulate arrears. All explanatory vari-ables are the same as in the previous specification and taken in 1996 (with theexception of the index of tensions in relationships between the governor and thefederal centre that is measured for 1997). The regression that contains this indexmay suffer from an endogeneity problem because the fact that regional firms accu-mulate federal tax arrears creates tensions in relationships between authoritiesof two levels. We cannot eliminate this problem because there are no appropriateinstruments. Thus, the alternative explanation that results based on this index aredriven by reverse causality cannot be ruled out. One can only note that manycomponents of the index (however, not all of them) were measured before 1997and did not change in 1997. We include a dummy for regional elections in 1997 tocontrol for a possible political budget cycle.16
15 The Share of own revenues in total regional expenditures is available only for 1996. Regional outputconcentration is always taken in 1996 because it is very persistent and does not change over time.16 See Alesina, Roubini and Cohen (1997) for a survey of the theoretical and empirical literature on electoralbusiness cycles. For Russian evidence of political cycles consult Treisman and Gimpelson (2001) on federalelections and Akhmedov and Zhuravskaya (2003) on regional elections.
386 Ponomareva and Zhuravskaya
The question that we address next is which enterprises have been granted author-ized tax deferrals for a given level of tax arrears. We have data on official federal taxdeferrals at the end of the first quarters of 1997 and 1998. Most firms did not receivea deferral, thus, we simultaneously estimate the probability that a firm is granted anauthorized tax deferral and the size of the deferral relative to the stock of accumu-lated federal arrears (given that it is granted). Heckman’s estimation procedure wasused with the following specifications for selection and size equations, respectively:
P{Delays_flow > 0 or Delays_flow = 0}i = F(α 1Liquidity_ratioi + α 2Log[Overdue_receivables/output]i + α3Governor_pol_poweri + α 4Reg_own_revenue_sharei + α 5Fed_pol_compi + α 6Log[GRP_pc]i + α 7Reg_Concentrationi + α 8Log[Employment]i + α 9Controlsi + εi)
Log[Delays_flow/Arrears_stock]i = α 1Liquidity_ratioi + α 2Log[Overdue_receivables/output]i + α 3Governor_pol_poweri + α 4Reg_own_revenue_sharei + α 5Fed_pol_compi + α 6Log[GRP_pc]i + α 7Log[Employment]i + α 8Controlsi + εi (3)
The list of explanatory variables in these specifications is very similar to the one inthe regressions for tax arrears. One important difference is that the list of regressorsincludes the logarithm of employment to account for the firm size because in thiscase the natural choice for normalization is the stock of arrears, rather than enter-prise size. Employment size, however, may be important for political reasons.Selection equation includes the full set of regressors while the size equationexcludes regional output concentration, distance to Moscow, and the electricitydummy because they have no explanatory power. We run regressions separatelyfor deferrals in 1997 and 1998 and use lagged independent variables.
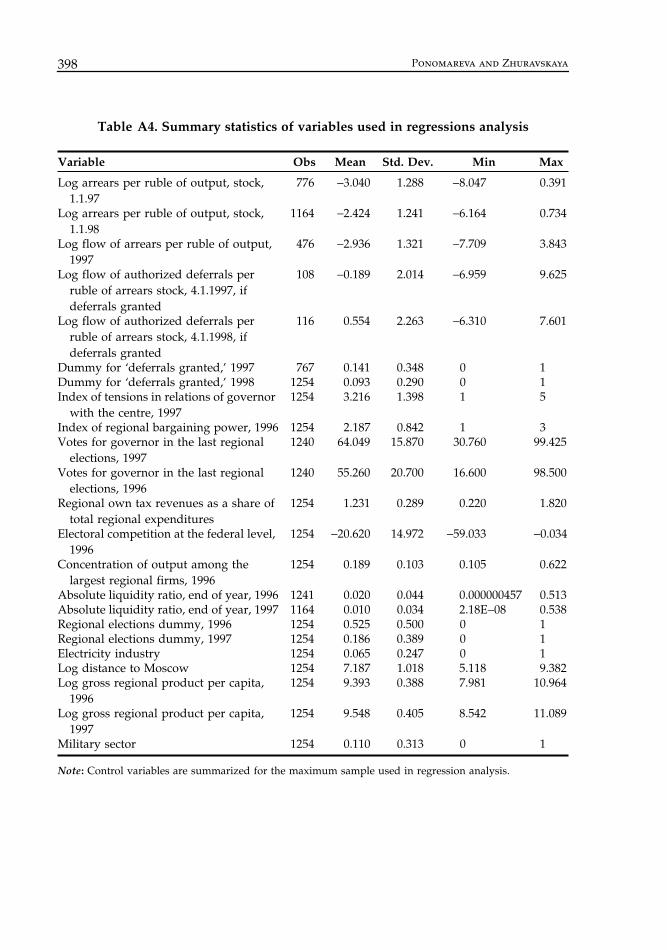
Since many of our regressors in firm-level regressions are the same within eachregion, in all specifications discussed above we allow error terms to be clustered(correlated) within regions. Summary statistics for the variables used in regressionsare in Table A4 in Appendix.
4. Results
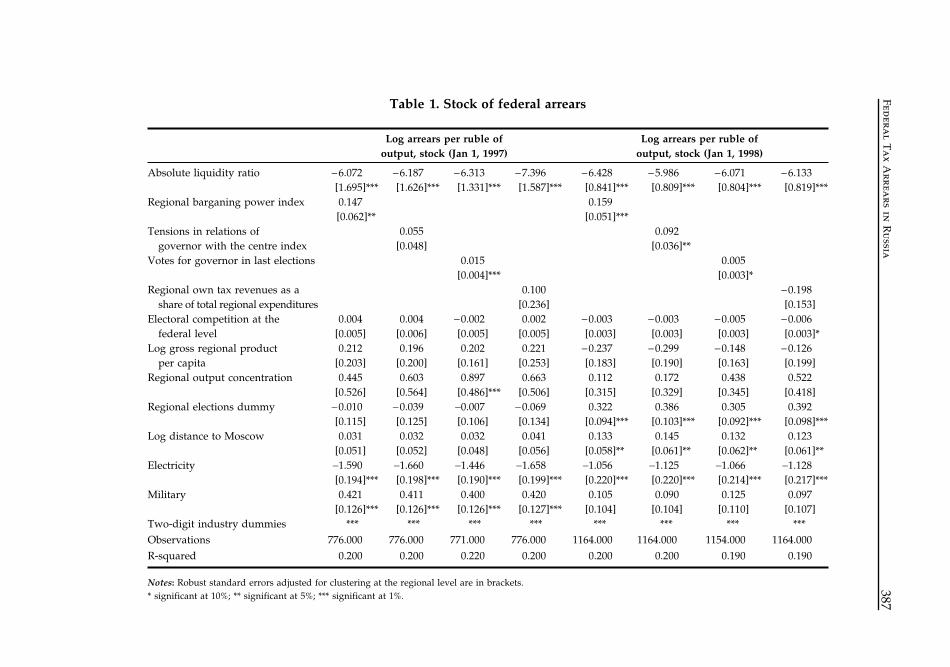
Let us start by presenting the results about the determinants of arrears (estimationof Equations (1) and (2)). Table 1 presents the results of the baseline regressions forthe stock of arrears. The first result is that independent of the liquidity measureused (absolute, ‘quick’, or current liquidity ratio, including or not including over-due receivables) we find that firms with liquidity problems have a significantlyhigher stock of federal tax arrears in both years, which is consistent with earlierfindings of Alfandari and Schaffer (1996). A one standard deviation increase in theabsolute liquidity ratio led to a decrease in the stock of arrears per ruble of outputof 24 percent on 1.1.1997 and 18 percent on 1.1.1998.
Federa
l Ta
x Arrea
rs in R
ussia
387
Table 1. Stock of federal arrears
Log arrears per ruble of output, stock (Jan 1, 1997)
Log arrears per ruble of output, stock (Jan 1, 1998)
Absolute liquidity ratio −6.072 [1.695]***
−6.187 [1.626]***
−6.313 [1.331]***
−7.396 [1.587]***
−6.428 [0.841]***
−5.986 [0.809]***
−6.071 [0.804]***
−6.133 [0.819]***
Regional barganing power index 0.147 [0.062]**
0.159 [0.051]***
Tensions in relations of governor with the centre index
0.055 [0.048]
0.092 [0.036]**
Votes for governor in last elections 0.015 [0.004]***
0.005 [0.003]*
Regional own tax revenues as a share of total regional expenditures
0.100 [0.236]
−0.198 [0.153]
Electoral competition at the federal level
0.004 [0.005]
0.004 [0.006]
−0.002 [0.005]
0.002 [0.005]
−0.003 [0.003]
−0.003 [0.003]
−0.005 [0.003]
−0.006 [0.003]*
Log gross regional product per capita
0.212 [0.203]
0.196 [0.200]
0.202 [0.161]
0.221 [0.253]
−0.237 [0.183]
−0.299 [0.190]
−0.148 [0.163]
−0.126 [0.199]
Regional output concentration 0.445 [0.526]
0.603 [0.564]
0.897 [0.486]***
0.663 [0.506]
0.112 [0.315]
0.172 [0.329]
0.438 [0.345]
0.522 [0.418]
Regional elections dummy −0.010 [0.115]
−0.039 [0.125]
−0.007 [0.106]
−0.069 [0.134]
0.322 [0.094]***
0.386 [0.103]***
0.305 [0.092]***
0.392 [0.098]***
Log distance to Moscow 0.031 [0.051]
0.032 [0.052]
0.032 [0.048]
0.041 [0.056]
0.133 [0.058]**
0.145 [0.061]**
0.132 [0.062]**
0.123 [0.061]**
Electricity −1.590 [0.194]***
−1.660 [0.198]***
−1.446 [0.190]***
−1.658 [0.199]***
−1.056 [0.220]***
−1.125 [0.220]***
−1.066 [0.214]***
−1.128 [0.217]***
Military 0.421 [0.126]***
0.411 [0.126]***
0.400 [0.126]***
0.420 [0.127]***
0.105 [0.104]
0.090 [0.104]
0.125 [0.110]
0.097 [0.107]
Two-digit industry dummies *** *** *** *** *** *** *** ***Observations 776.000 776.000 771.000 776.000 1164.000 1164.000 1154.000 1164.000R-squared 0.200 0.200 0.220 0.200 0.200 0.200 0.190 0.190
Notes: Robust standard errors adjusted for clustering at the regional level are in brackets.* significant at 10%; ** significant at 5%; *** significant at 1%.

388 Ponomareva and Zhuravskaya
Second, controlling for firms’ liquidity, the hypothesis about regional resistanceto paying federal taxes finds strong support in the data. The coefficients of indicesmeasuring regional bargaining power with the centre and tensions in the relationsof the governor with the centre as well as the political popularity of the governorare always positive (independent of specification) and significant except forthe coefficient of the index of tensions of regional relations with the centre in theregression for arrears on Jan 1, 1997. A one standard deviation increase in theindices led to an increase in the stock of arrears of approximately 15 percent.A one standard deviation increase in the number of votes cast for the governorin the last elections led to an increase in the stock of arrears of approximately 10percent. Regional output concentration is consistently positive (as Sonin’s modelof provincial protectionism predicts) but almost never significant.17 The share ofown revenues in total expenditures also does not have an effect on the stock ofarrears.
Third, neither GRP per capita nor the extent of electoral competition at thenational level is significant (with the exception of one regression for Jan 1, 1998where electoral competition is significant with the wrong sign). Thus, the data arenot consistent with the theory of federal redistribution.
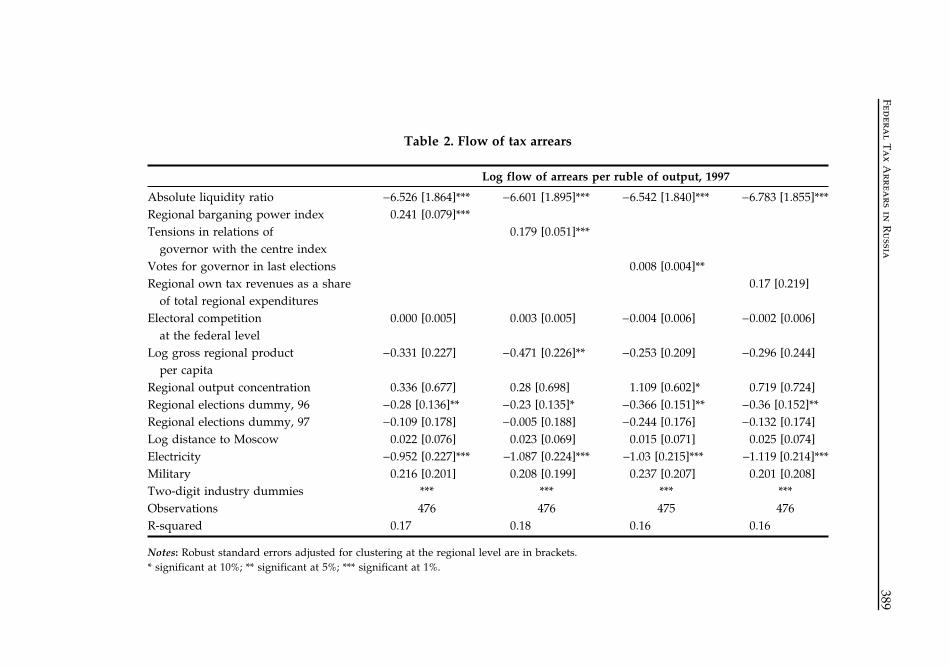
Table 2 presents results of the baseline regressions for the flow of arrears.Again, all liquidity measures are strongly negatively significantly correlated withthe federal arrears that were accumulated during the 1997. A one standard devia-tion increase in the absolute liquidity ratio led to a decrease in accumulation ofarrears per ruble of output of about 25 percent. Indices of the bargaining powerwith central government and of tensions in relationships of the governor with thecentre are positive and strongly significant. So is the governor’s popularity. A onestandard deviation increases in these variables led to 22, 27, and 18 percentincreases in the flow of arrears, respectively. The regional output concentration isconsistently positive, but significant only in one out of four regressions of thebaseline estimation. The share of own revenues is insignificant. Coefficient of thegross regional product per capita has a negative sign in all specifications, butbecomes significant only very infrequently (it is significant in one out of fourbaseline regressions). The effect of electoral competition at the federal level is zero.
Overall, lack of liquidity in firms did have an important effect on accumulationof federal tax arrears, consistent with the LL hypothesis. Regional political resist-ance to federal tax collection is also an important determinant of both the stock andthe flow of federal arrears. Moreover, political power of the regional governments(measured by the governor’s political popularity and the indices of the governor’spolitical relationship with the centre) turns out to be more important than regional
17 In regressions for arrears in Jan 1, 1997, output concentration can be made significant by the exclusion ofmeasures of political bargaining between the centre and the regions. In contrast, in regressions for Jan 1,1998, the coefficients of the regional concentration are insignificant irrespective of specification.
Federa
l Ta
x Arrea
rs in R
ussia
389
Table 2. Flow of tax arrears
Log flow of arrears per ruble of output, 1997
Absolute liquidity ratio −6.526 [1.864]*** −6.601 [1.895]*** −6.542 [1.840]*** −6.783 [1.855]***Regional barganing power index 0.241 [0.079]***Tensions in relations of
governor with the centre index0.179 [0.051]***
Votes for governor in last elections 0.008 [0.004]**Regional own tax revenues as a share
of total regional expenditures0.17 [0.219]
Electoral competition at the federal level
0.000 [0.005] 0.003 [0.005] −0.004 [0.006] −0.002 [0.006]
Log gross regional product per capita
−0.331 [0.227] −0.471 [0.226]** −0.253 [0.209] −0.296 [0.244]
Regional output concentration 0.336 [0.677] 0.28 [0.698] 1.109 [0.602]* 0.719 [0.724]Regional elections dummy, 96 −0.28 [0.136]** −0.23 [0.135]* −0.366 [0.151]** −0.36 [0.152]**Regional elections dummy, 97 −0.109 [0.178] −0.005 [0.188] −0.244 [0.176] −0.132 [0.174]Log distance to Moscow 0.022 [0.076] 0.023 [0.069] 0.015 [0.071] 0.025 [0.074]Electricity −0.952 [0.227]*** −1.087 [0.224]*** −1.03 [0.215]*** −1.119 [0.214]***Military 0.216 [0.201] 0.208 [0.199] 0.237 [0.207] 0.201 [0.208]Two-digit industry dummies *** *** *** ***Observations 476 476 475 476R-squared 0.17 0.18 0.16 0.16
Notes: Robust standard errors adjusted for clustering at the regional level are in brackets.* significant at 10%; ** significant at 5%; *** significant at 1%.
390 Ponomareva and Zhuravskaya
industrial structure (measured by the level of industrial concentration) in explain-ing successful resistance. Unlike the other two hypotheses, the hypothesis aboutthe redistributive nature of federal tax arrears is not robustly supported by thedata. There is only very weak and unrobust evidence that federal arrears are higherin regions with a lower level of gross regional product per capita.
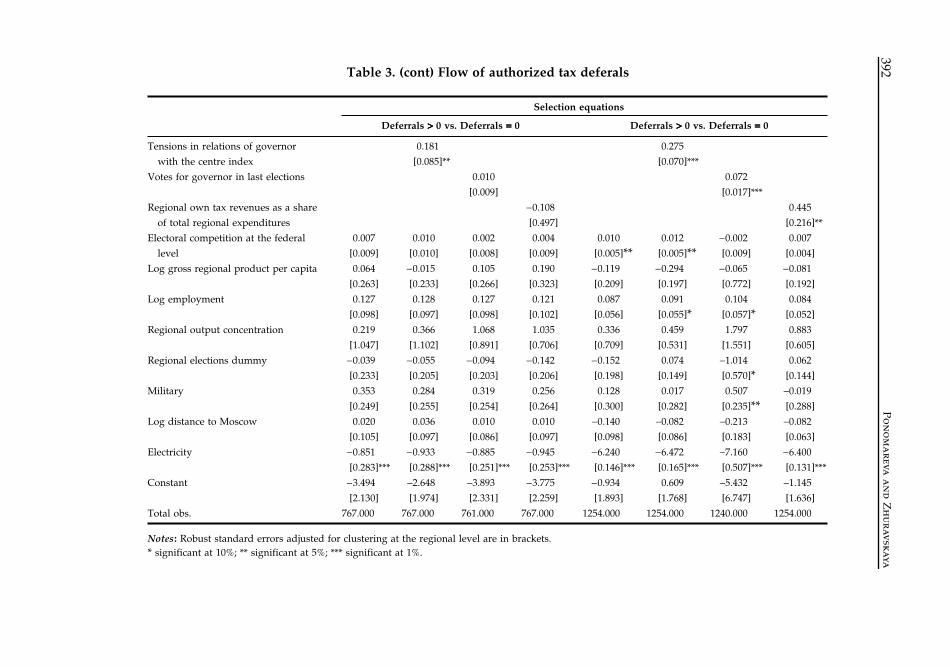
Let us turn to the discussion of the determinants of authorized federal taxdeferrals. Table 3 presents the results for the baseline specification (estimation ofthe system of equations (3)). In contrast to the results for tax arrears, none of theliquidity measures are statistically significant in explaining either the incidence orthe size of federal tax deferrals. There is also no robust significant relationshipbetween the measures of regional political resistance and the size of tax deferrals(given that a deferral was granted).18 Yet, regional bargaining power and tensionsin relationships between regional governments and the federal centre were veryimportant in determining the probability that a particular firm was granted a deferral.One standard deviation increase in the index of the tensions in relationshipsand in the index of bargaining power led to an increase in the probability of gettingan authorized deferral of about 4 and 6 percentage points, respectively. In addition,the effect of political popularity is consistently positive and, in the selectionequation for 1998, significant. Regional output concentration and regional ownrevenue share do not have an effect on the size or frequency of deferrals.
Granting an authorized tax deferral requires an action on behalf of the federalgovernment. Thus, if there is any room for voluntary federal redistribution, weshould see its evidence in these regressions most clearly. Indeed, we find thatgross regional product per capita has a robust negative effect on the size ofdeferrals in both years (absolute values of t-statistics in all specifications are greaterthan unity and in half of regressions coefficients are significant). There is, however,no robust relationship between GRP per capita and the probability of a regionalfirm getting a deferral. On the contrary, if at all, electoral competition seems tobe important for the incidence of tax deferrals rather than their size. (Two out offour baseline regressions have significant positive coefficients of electoral competi-tion in 1998.) One standard deviation increase in electoral competition increasedthe probability of a tax deferral by 2 percentage points. Finally, firms’ employmentsize comes out significantly positive in explaining the probability of getting anauthorized deferral only in 1998. Overall, the results about authorized deferralssuggest that both the political bargaining of the regional governors and the centreand federal redistributive politics do play a role in determining the incidenceof federal tax deferrals. The size of deferrals seems to be determined with theobjective of economic redistribution in mind: firms in poorer regions got largerdeferrals.
18 Only the power in relationships of regions with the center is positive and marginally significant in theregressions for 1997.

Federa
l Ta
x Arrea
rs in R
ussia
391
Table 3. Flow of authorized tax deferals
Size equations
Log flow of officially deferred federal taxes (Apr 1, 97) per ruble of the stock of federal arrears (Jan 1, 97)
Log flow of officially deferred federal taxes (Apr 1, 98) per ruble of the stock
of federal arrears (Jan 1, 98)
Absolute liquidity ratio 0.903
[4.606]
2.696
[4.946]
0.352
[5.478]
1.229
[5.224]
−5.561
[5.464]
−5.769
[5.523]
−5.725
[5.443]
−6.095
[5.698]
Regional barganing power index 0.739
[0.410]*
0.174
[0.526]
Tensions in relations of governor
with the centre index
0.155
[0.182]
−0.190
[0.218]
Votes for governor in last elections −0.019
[0.019]
−0.011
[0.035]
Regional own tax revenues as a share
of total regional expenditures
0.397
[0.876]
−1.095
[0.697]
Electoral competition at the federal level −0.002
[0.017]
−0.003
[0.017]
−0.005
[0.017]
−0.010
[0.016]
0.008
[0.013]
0.000
[0.013]
0.009
[0.012]
0.002
[0.013]
Log gross regional product per capita −0.889
[0.589]
−1.022
[0.568]*
−0.763
[0.611]
−0.927
[0.583]
−0.838
[0.431]*
−0.587
[0.455]
−0.735
[0.368]**
−0.638
[0.346]*
Log employment 0.065
[0.189]
0.062
[0.190]
0.008
[0.251]
0.005
[0.241]
−0.105
[0.256]
−0.104
[0.248]
−0.117
[0.276]
−0.106
[0.238]
Regional elections dummy −0.519
[0.479]
−0.373
[0.528]
−0.446
[0.550]
−0.391
[0.493]
−1.669
[0.654]**
−1.574
[0.598]***
−1.472
[0.762]*
−1.487
[0.550]***
Military −0.751
[0.331]**
−0.778
[0.389]**
−0.946
[0.451]**
−0.894
[0.350]**
−0.613
[0.351]*
−0.533
[0.354]
−0.611
[0.385]
−0.421
[0.304]
Constant 7.032
[6.325]
9.750
[5.679]*
10.607
[6.519]
10.214
[6.667]
10.157
[3.645]***
9.131
[3.742]**
10.320
[4.224]**
10.492
[3.244]***
Uncensored obs. 108.000 108.000 108.000 107.000 116.000 116.000 115.000 116.000
Absolute liquidity ratio 0.837
[1.695]
0.854
[1.745]
1.487
[1.721]
0.553
[1.712]
−0.122
[1.726]
−0.405
[1.599]
−0.223
[2.687]
−0.475
[1.670]
Regional barganing power index 0.342
[0.138]**
0.542
[0.115]***
392P
on
om
areva
an
d Z
hu
ravskayaTable 3. (cont) Flow of authorized tax deferals
Selection equations
Deferrals >>>> 0 vs. Deferrals ==== 0 Deferrals >>>> 0 vs. Deferrals ==== 0
Tensions in relations of governor
with the centre index
0.181
[0.085]**
0.275
[0.070]***
Votes for governor in last elections 0.010
[0.009]
0.072
[0.017]***
Regional own tax revenues as a share
of total regional expenditures
−0.108
[0.497]
0.445
[0.216]**
Electoral competition at the federal
level
0.007
[0.009]
0.010
[0.010]
0.002
[0.008]
0.004
[0.009]
0.010
[0.005]**0.012
[0.005]**−0.002
[0.009]
0.007
[0.004]
Log gross regional product per capita 0.064
[0.263]
−0.015
[0.233]
0.105
[0.266]
0.190
[0.323]
−0.119
[0.209]
−0.294
[0.197]
−0.065
[0.772]
−0.081
[0.192]
Log employment 0.127
[0.098]
0.128
[0.097]
0.127
[0.098]
0.121
[0.102]
0.087
[0.056]
0.091
[0.055]*0.104
[0.057]*0.084
[0.052]
Regional output concentration 0.219
[1.047]
0.366
[1.102]
1.068
[0.891]
1.035
[0.706]
0.336
[0.709]
0.459
[0.531]
1.797
[1.551]
0.883
[0.605]
Regional elections dummy −0.039
[0.233]
−0.055
[0.205]
−0.094
[0.203]
−0.142
[0.206]
−0.152
[0.198]
0.074
[0.149]
−1.014
[0.570]*0.062
[0.144]
Military 0.353
[0.249]
0.284
[0.255]
0.319
[0.254]
0.256
[0.264]
0.128
[0.300]
0.017
[0.282]
0.507
[0.235]**−0.019
[0.288]
Log distance to Moscow 0.020
[0.105]
0.036
[0.097]
0.010
[0.086]
0.010
[0.097]
−0.140
[0.098]
−0.082
[0.086]
−0.213
[0.183]
−0.082
[0.063]
Electricity −0.851
[0.283]***
−0.933
[0.288]***
−0.885
[0.251]***
−0.945
[0.253]***
−6.240
[0.146]***
−6.472
[0.165]***
−7.160
[0.507]***
−6.400
[0.131]***
Constant −3.494
[2.130]
−2.648
[1.974]
−3.893
[2.331]
−3.775
[2.259]
−0.934
[1.893]
0.609
[1.768]
−5.432
[6.747]
−1.145
[1.636]
Total obs. 767.000 767.000 761.000 767.000 1254.000 1254.000 1240.000 1254.000
Notes: Robust standard errors adjusted for clustering at the regional level are in brackets.* significant at 10%; ** significant at 5%; *** significant at 1%.

Federal Tax Arrears in Russia 393
5. Conclusion
This paper provides evidence that in the second half of the 1990s liquidity problemsin firms remained an important factor in the escalation of federal tax arrears.Arrears were greater and accumulated faster in firms with liquidity problems.Enforcement of tax collection, however, varied greatly even for a given level offirms’ liquidity. Politically strong governors successfully resisted federal tax collec-tion in their regions: federal arrears were higher and accumulated faster in regionswhere governors had a larger popular base, in regions that had better bargainingposition vis-à-vis the centre, and with regions that had governors in open politicalopposition to the centre. Moreover, these regions managed not only to disrupt thefederal government’s tax collection efforts; they were also successful in bargainingwith the centre for official tax deferrals on behalf of regional companies. Whileilliquid firms were unable to pay their federal tax obligations, the federal govern-ment did not bail them out directly with the use of authorized tax deferrals.This suggests that the federal government apart from a political objective of notliquidating failing firms pursued the fiscal objective of attempting to enforce taxcollection where it was possible. Instead of bailing out firms with liquidity problems,the federal government allocated tax deferrals strategically to firms in regions withlarger numbers of ‘swing’ voters.
The main lesson from the empirical exercise of this paper is that Russia’s federalstructure and, more precisely, the weakness of central government enforcement atthe level of regions was one of the fundamental reasons for the accumulation offederal tax arrears and the collapse of federal government revenues in the secondhalf of the 1990s.
References
Akhmedov, A. and Zhuravskaya, E. (2003). ‘Opportunistic political cycles: Test in a youngdemocracy setting’, CEFIR working paper no. 25, Moscow: CEFIR.
Alesina, A., Roubini, N. and Cohen, G. (1997). Political Cycles and the Macroeconomy,Cambridge, MA: MIT Press.
Alfandari, G. and Schaffer, M. (1996). ‘On “arrears” in Russia’, Centre for Economic Reformand Transformation discussion paper 9608, Edinburgh: CERT.
Black, B., Kraakman, R., and Tarassova, A. (2000). ‘Russian privatization and corporategovernance: What went wrong?’ Stanford Law Review, 52, pp. 1731–1808.
Brown, A. and Brown, D. J. (1999). ‘The transition of market structure in Russia: Economiclessons and implications for competition’, mimeo, SITE.
Cai, H. and Treisman, D. (2004). ‘State corroding federalism’, Journal of Public Economics,88(4), pp. 819–43.
Dixit, A. and Londregan, J. (1995). ‘Redistribute politics and economic efficiency’, AmericanPolitical Science Review, 89(4), pp. 856–66.
Dixit, A. and Londregan, J. (1998). ‘Fiscal Federalism and redistribute politics’, Journal ofPublic Economics, 68, pp. 153–80.
394 Ponomareva and Zhuravskaya
Gehlbach, S. (2003). ‘Taxability, elections, and government support of business activity’,CEFIR working paper no. 30, Moscow: CEFIR.
Guriev, S. and Ickes, B. (2000). ‘Barter in Russian firms’, in Seabright, P. (ed.) The VanishingRuble: Barter and Currency Substitution in Post-Communist Economies, Cambridge:Cambridge University Press, pp. 147–75.
Ivanova, N. and Wyplosz, C. (1999). ‘Arrears: The tide that is drowning Russia’, RECEPworking paper no. 5, Moscow: RECEP.
Kornai, J. (1980). Economics of Shortage. Amsterdam: North-Holland.Lambert-Mogilianski, A., Sonin, K. and Zhuravskaya, E. (2003). ‘Capture of bankruptcy:
Theory and Russian evidence’, CEFIR working paper no. 9, Moscow: CEFIR.Lavrov, A., Litwack, J. and Sutherland, D. (2001). ‘Fiscal federalist relations in Russia: A case
for subnational autonomy’, OECD Center for co-operation with Non-Members, workingpaper, Paris: OECD.
Lindbeck, A. and Weibull, J. (1987). ‘Balanced-budget redistribution as the outcome of polit-ical competition’, Public Choice, 52, pp. 273–97.
Litwack, J. M. (2002). ‘Central control of regional budgets: Theory with applications toRussia’, Journal of Comparative Economics, 30(1), pp. 51–75.
Maskin, E. and Xu, C. (2001). ‘Soft budget constraint theories: From centralization to themarket’, Economics of Transition, 9(1), pp. 1–27.
OECD (2000). OECD Economic Surveys 1999–2000: The Russian Federation, OECD: Paris.Roland, G. (2000). Transition and Economics: Politics, Markets and Firms, Cambridge, MA: The
MIT Press.Schaffer, M. (1994). ‘Government subsidies to enterprises in Central and Eastern Europe:
Budgetary subsidies and tax arrears’, Centre for Economic Performance Working paper no.671, London: CEP.
Schaffer, M. (1996). ‘The “propagation” of arrears: Empirical evidence from Russia’, mimeo,CERT, Edinburgh.
Schaffer, M. (1998). ‘Do firms in transition economies have soft budget constraints? A recon-sideration of concepts and evidence’, Journal of Comparative Economics, 26, pp. 80–103.
Shleifer, A. and Treisman, D. (2000). Without a Map: Political Tactics and Economic Reform inRussia, Cambridge, MA: MIT Press.
Shleifer, A. and Vishny, R. W. (1993). ‘Corruption’, Quarterly Journal of Economics, 108(3),pp. 599–617.
Shleifer, A. and Vishny, R. W. (1994). ‘Politicians and firms’, Quarterly Journal of Economics,109(4), pp. 995–1025.
Slinko, I., Yakovkev, E. and Zhuravskaya, E. (2003). ‘Institutional subversion: Evidence fromRussian regions’, CEPR Discussion Paper no. 4024, CEPR: London.
Sonin, K. (2003). ‘Provincial protectionism’, mimeo, CEFIR.Treisman, D. (1998). ‘Deciphering Russia’s federal finance: Fiscal appeasement on 1995 and
1996’, Europe–Asia Studies, 50(5), pp. 893–906.Treisman, D. (2000). ‘Fiscal pathologies and Federal politics: Understanding tax arrears in
Russia’s regions’, book chapter, mimeo: UCLA.Treisman, D. and Gimpelson, V. (2001). ‘Political business cycles and Russian elections, or
the manipulations of “Chudar”’, British Journal of Political Science, 31(2), pp. 225–46.
Federal Tax Arrears in Russia 395
Appendix
Table A1. Industrial distribution of firms in the sample
Industry code
Industry name Number of firms
1.1.97 1.1.98
181 Flavouring 44 130141 Engineering (turbine, cables, refrigerators) 74 106113 Coal 85 100147 Other engineering (defence, aviation, ship building) 49 92151 Logging 28 86111 Electricity 74 82161 Construction materials 27 63131 Chemical 51 59143 Instrument engineering 50 59121 Ferrous metallurgy 45 56112 Fuel industry (oil and gas) 40 51171 Textile 30 46149 Repair 23 44152 Wood-working 9 32133 Petrochemical 22 30142 Machine building tool manufacturing 14 21144 Tractors, agricultural equipment 18 21153 Wood-pulp industry 10 19122 Non-ferrous metallurgy 11 16145 Road, construction and public utilities 13 14183 Fish 10 14148 Metal construction 6 13173 Tanning, fur, boot, shoe 5 13165 Glass, porcelain 3 12146 Engineering for light and food industry, home appliances 6 11162 Facing material 1 10124 Noble metals diamonds 4 9182 Meat and Dairy 2 9191 Microbiology 2 8192 Flour-grinding 3 6125 Non-ferrous metalworking 2 4172 Sewing 1 3193 Medical 2 3197 Other 6 4123 Rare-metals and semi-conducting materials 1 2127 Electrode 3 2154 Resin 0 2114 Shale 1 1128 Refractory and high temp. metal alloys 0 1
Total 776 1254

396 Ponomareva and Zhuravskaya
Table A2. Regional distribution of firms in the sample
No. of firms No. of firms
1.1.97 1.1.98 1.1.97 1.1.98
Adygeya republic 2 2 Murmansk oblast 12 10Altai krai 14 23 Nizhny Novgorod oblast 32 40Amur oblast 2 3 North Osetiya republic 0 4Arkhangelsk oblast 13 33 Novgorod oblast 1 3Astrakhan oblast 2 2 Novosibirsk oblast 10 19Bashkortostan republic 20 29 Omsk oblast 9 10Belgorod oblast 6 18 Orenburg oblast 18 21Bryansk oblast 9 12 Oryol oblast 0 4Buryat republic 2 5 Penza oblast 11 13Chelyabinsk oblast 54 63 Perm oblast 19 46Chita oblast 4 5 Primorskii krai 11 19Chuvash republic 4 10 Pskov oblast 3 3Evrei autonomous oblast 1 1 Rostov oblast 21 17Irkutsk oblast 20 22 Ryazan oblast 7 14Ivanovo oblast 21 34 Sakha (Yakutia) republic 6 9Kabardino-Balkar republic 4 3 Sakhalin oblast 14 26Kaliningrad oblast 3 5 Samara oblast 17 22Kaluga oblast 4 8 Saratov oblast 14 15Kamchatka oblast 6 6 Smolensk oblast 6 5Karachaevo-Cherkess republic 0 1 St. Petersburg city 10 35Karelia republic 9 13 Stavropol krai 5 17Kemerovo oblast 64 110 Sverdlovsk oblast 7 54Khabarovsk krai 13 19 Tambov oblast 9 16Khakasia republic 13 13 Tatarstan republic 12 21Kirov oblast 17 25 Tomsk oblast 5 12Komi republic 9 19 Tula oblast 12 17Kostroma oblast 6 17 Tver oblast 9 13Krasnodar krai 11 13 Tyumen oblast 10 27Krasnoyarsk krai 21 31 Ulyanovsk oblast 10 12Kurgan oblast 6 9 Ulyanovsk oblast 0 11Kursk oblast 8 12 Vladimir oblast 12 25Leningrad oblast 4 10 Volgograd oblast 20 24Lipetsk oblast 2 4 Vologda oblast 9 13Magadan oblast 12 11 Voronezh oblast 21 26Mari-El republic 5 9 Yaroslavl oblast 20 23Mordovia republic 3 8 Total 776 1254
Federal Tax Arrears in Russia 397
Table A3. Summary statistics for federal arrears and authorized deferrals
1.1.1998 1.1.1997
Federal tax arrears (billion rubles)Observations 2,288 1,325Median 5,877 5,618Mean 18,012.1 23,674.3Std. Deviation 78,385.3 111,313.8Min 2 1Max 2,830,869 2,855,191
Authorized federal tax deferrals (billion rubles)Observations 2,633 1,323Median 0 0Mean 2,278.5 3,483.8Std. Deviation 29,349.4 29,589.4Min 0 0Max 955,633 619,078
Note: The summary statistics in this table are calculated for the whole sample of firms.(Regressions contain fewer observations because there are no data for many of these firms)
398 Ponomareva and Zhuravskaya
Table A4. Summary statistics of variables used in regressions analysis
Variable Obs Mean Std. Dev. Min Max
Log arrears per ruble of output, stock, 1.1.97
776 −3.040 1.288 −8.047 0.391
Log arrears per ruble of output, stock, 1.1.98
1164 −2.424 1.241 −6.164 0.734
Log flow of arrears per ruble of output, 1997
476 −2.936 1.321 −7.709 3.843
Log flow of authorized deferrals per ruble of arrears stock, 4.1.1997, if deferrals granted
108 −0.189 2.014 −6.959 9.625
Log flow of authorized deferrals per ruble of arrears stock, 4.1.1998, if deferrals granted
116 0.554 2.263 −6.310 7.601
Dummy for ‘deferrals granted,’ 1997 767 0.141 0.348 0 1Dummy for ‘deferrals granted,’ 1998 1254 0.093 0.290 0 1Index of tensions in relations of governor
with the centre, 19971254 3.216 1.398 1 5
Index of regional bargaining power, 1996 1254 2.187 0.842 1 3Votes for governor in the last regional
elections, 19971240 64.049 15.870 30.760 99.425
Votes for governor in the last regional elections, 1996
1240 55.260 20.700 16.600 98.500
Regional own tax revenues as a share of total regional expenditures
1254 1.231 0.289 0.220 1.820
Electoral competition at the federal level, 1996
1254 −20.620 14.972 −59.033 −0.034
Concentration of output among the largest regional firms, 1996
1254 0.189 0.103 0.105 0.622
Absolute liquidity ratio, end of year, 1996 1241 0.020 0.044 0.000000457 0.513Absolute liquidity ratio, end of year, 1997 1164 0.010 0.034 2.18E−08 0.538Regional elections dummy, 1996 1254 0.525 0.500 0 1Regional elections dummy, 1997 1254 0.186 0.389 0 1Electricity industry 1254 0.065 0.247 0 1Log distance to Moscow 1254 7.187 1.018 5.118 9.382Log gross regional product per capita,
19961254 9.393 0.388 7.981 10.964
Log gross regional product per capita, 1997
1254 9.548 0.405 8.542 11.089
Military sector 1254 0.110 0.313 0 1
Note: Control variables are summarized for the maximum sample used in regression analysis.