Embed Size (px)
Citation preview
February 8, 2017
ICICI Securities Ltd | Retail Equity Research
Result Update
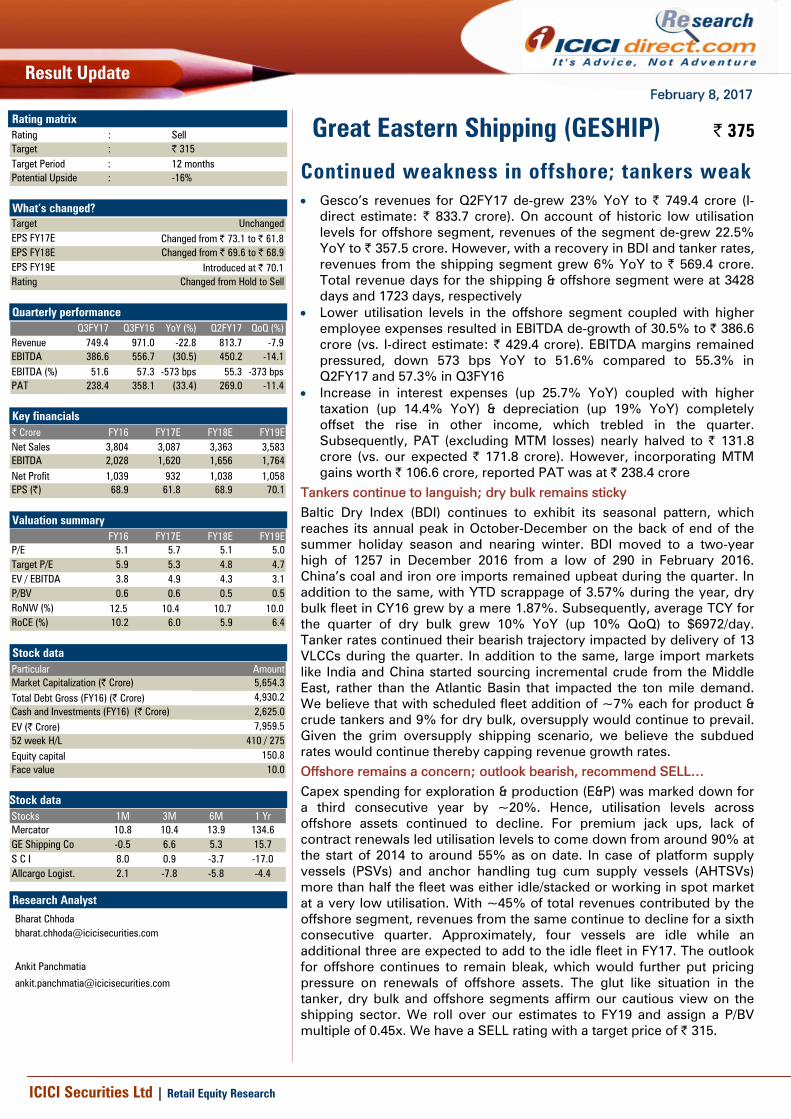
Continued weakness in offshore; tankers weak • Gesco’s revenues for Q2FY17 de-grew 23% YoY to | 749.4 crore (I-
direct estimate: | 833.7 crore). On account of historic low utilisation levels for offshore segment, revenues of the segment de-grew 22.5% YoY to | 357.5 crore. However, with a recovery in BDI and tanker rates, revenues from the shipping segment grew 6% YoY to | 569.4 crore. Total revenue days for the shipping & offshore segment were at 3428 days and 1723 days, respectively
• Lower utilisation levels in the offshore segment coupled with higher employee expenses resulted in EBITDA de-growth of 30.5% to | 386.6 crore (vs. I-direct estimate: | 429.4 crore). EBITDA margins remained pressured, down 573 bps YoY to 51.6% compared to 55.3% in Q2FY17 and 57.3% in Q3FY16
• Increase in interest expenses (up 25.7% YoY) coupled with higher taxation (up 14.4% YoY) & depreciation (up 19% YoY) completely offset the rise in other income, which trebled in the quarter. Subsequently, PAT (excluding MTM losses) nearly halved to | 131.8 crore (vs. our expected | 171.8 crore). However, incorporating MTM gains worth | 106.6 crore, reported PAT was at | 238.4 crore
Tankers continue to languish; dry bulk remains sticky Baltic Dry Index (BDI) continues to exhibit its seasonal pattern, which reaches its annual peak in October-December on the back of end of the summer holiday season and nearing winter. BDI moved to a two-year high of 1257 in December 2016 from a low of 290 in February 2016. China’s coal and iron ore imports remained upbeat during the quarter. In addition to the same, with YTD scrappage of 3.57% during the year, dry bulk fleet in CY16 grew by a mere 1.87%. Subsequently, average TCY for the quarter of dry bulk grew 10% YoY (up 10% QoQ) to $6972/day. Tanker rates continued their bearish trajectory impacted by delivery of 13 VLCCs during the quarter. In addition to the same, large import markets like India and China started sourcing incremental crude from the Middle East, rather than the Atlantic Basin that impacted the ton mile demand. We believe that with scheduled fleet addition of ~7% each for product & crude tankers and 9% for dry bulk, oversupply would continue to prevail. Given the grim oversupply shipping scenario, we believe the subdued rates would continue thereby capping revenue growth rates. Offshore remains a concern; outlook bearish, recommend SELL… Capex spending for exploration & production (E&P) was marked down for a third consecutive year by ~20%. Hence, utilisation levels across offshore assets continued to decline. For premium jack ups, lack of contract renewals led utilisation levels to come down from around 90% at the start of 2014 to around 55% as on date. In case of platform supply vessels (PSVs) and anchor handling tug cum supply vessels (AHTSVs) more than half the fleet was either idle/stacked or working in spot market at a very low utilisation. With ~45% of total revenues contributed by the offshore segment, revenues from the same continue to decline for a sixth consecutive quarter. Approximately, four vessels are idle while an additional three are expected to add to the idle fleet in FY17. The outlook for offshore continues to remain bleak, which would further put pricing pressure on renewals of offshore assets. The glut like situation in the tanker, dry bulk and offshore segments affirm our cautious view on the shipping sector. We roll over our estimates to FY19 and assign a P/BV multiple of 0.45x. We have a SELL rating with a target price of | 315.
Great Eastern Shipping (GESHIP) | 375 Rating matrix Rating : SellTarget : | 315Target Period : 12 monthsPotential Upside : -16%
What’s changed? Target UnchangedEPS FY17E Changed from | 73.1 to | 61.8EPS FY18E Changed from | 69.6 to | 68.9EPS FY19E Introduced at | 70.1Rating Changed from Hold to Sell
Quarterly performance
Q3FY17 Q3FY16 YoY (%) Q2FY17 QoQ (%)Revenue 749.4 971.0 -22.8 813.7 -7.9EBITDA 386.6 556.7 (30.5) 450.2 -14.1EBITDA (%) 51.6 57.3 -573 bps 55.3 -373 bpsPAT 238.4 358.1 (33.4) 269.0 -11.4
Key financials | Crore FY16 FY17E FY18E FY19ENet Sales 3,804 3,087 3,363 3,583 EBITDA 2,028 1,620 1,656 1,764 Net Profit 1,039 932 1,038 1,058 EPS (|) 68.9 61.8 68.9 70.1
Valuation summary
FY16 FY17E FY18E FY19EP/E 5.1 5.7 5.1 5.0Target P/E 5.9 5.3 4.8 4.7 EV / EBITDA 3.8 4.9 4.3 3.1P/BV 0.6 0.6 0.5 0.5 RoNW (%) 12.5 10.4 10.7 10.0RoCE (%) 10.2 6.0 5.9 6.4
Stock data Particular AmountMarket Capitalization (| Crore) 5,654.3 Total Debt Gross (FY16) (| Crore) 4,930.2 Cash and Investments (FY16) (| Crore) 2,625.0 EV (| Crore) 7,959.5 52 week H/L 410 / 275 Equity capital 150.8 Face value 10.0
Stock data Stocks 1M 3M 6M 1 YrMercator 10.8 10.4 13.9 134.6GE Shipping Co -0.5 6.6 5.3 15.7S C I 8.0 0.9 -3.7 -17.0Allcargo Logist. 2.1 -7.8 -5.8 -4.4 Research Analyst
Bharat Chhoda [email protected]
Ankit Panchmatia
ICICI Securities Ltd | Retail Equity Research Page 2
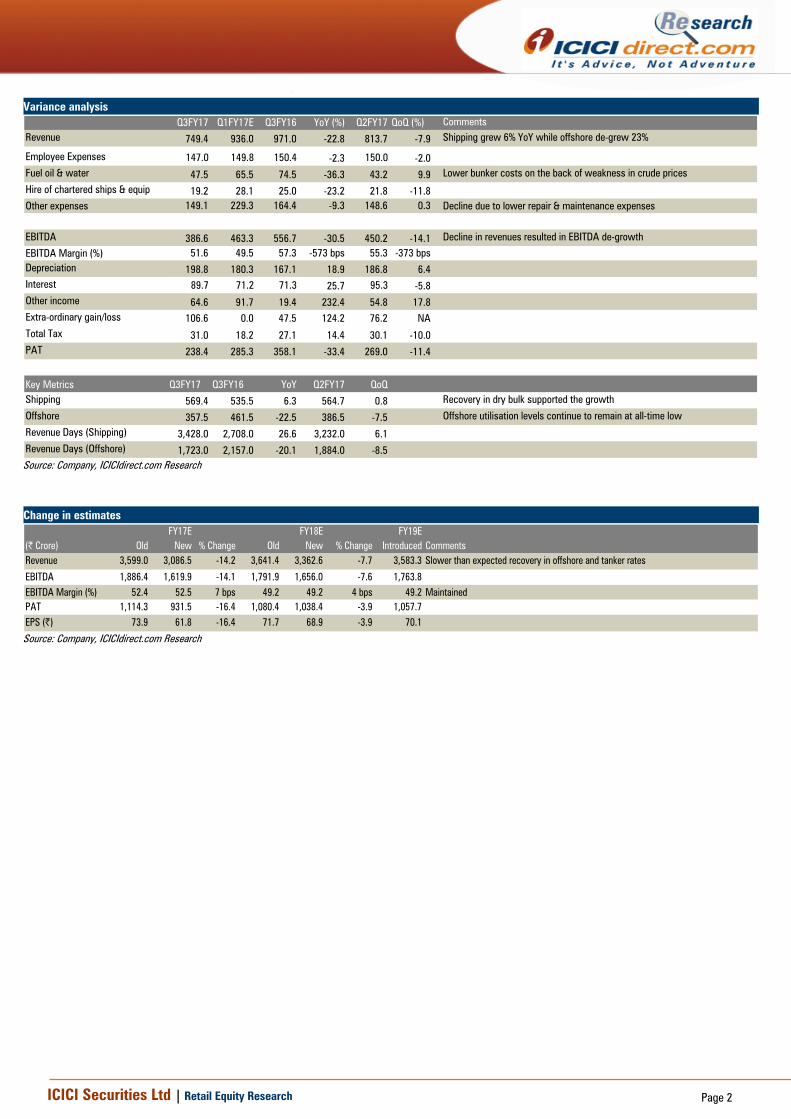
Variance analysis Q3FY17 Q1FY17E Q3FY16 YoY (%) Q2FY17 QoQ (%) Comments
Revenue 749.4 936.0 971.0 -22.8 813.7 -7.9 Shipping grew 6% YoY while offshore de-grew 23%
Employee Expenses 147.0 149.8 150.4 -2.3 150.0 -2.0Fuel oil & water 47.5 65.5 74.5 -36.3 43.2 9.9 Lower bunker costs on the back of weakness in crude prices
Hire of chartered ships & equip 19.2 28.1 25.0 -23.2 21.8 -11.8Other expenses 149.1 229.3 164.4 -9.3 148.6 0.3 Decline due to lower repair & maintenance expenses
EBITDA 386.6 463.3 556.7 -30.5 450.2 -14.1 Decline in revenues resulted in EBITDA de-growth
EBITDA Margin (%) 51.6 49.5 57.3 -573 bps 55.3 -373 bpsDepreciation 198.8 180.3 167.1 18.9 186.8 6.4Interest 89.7 71.2 71.3 25.7 95.3 -5.8Other income 64.6 91.7 19.4 232.4 54.8 17.8Extra-ordinary gain/loss 106.6 0.0 47.5 124.2 76.2 NATotal Tax 31.0 18.2 27.1 14.4 30.1 -10.0PAT 238.4 285.3 358.1 -33.4 269.0 -11.4
Key Metrics Q3FY17 Q3FY16 YoY Q2FY17 QoQShipping 569.4 535.5 6.3 564.7 0.8 Recovery in dry bulk supported the growth
Offshore 357.5 461.5 -22.5 386.5 -7.5 Offshore utilisation levels continue to remain at all-time low
Revenue Days (Shipping) 3,428.0 2,708.0 26.6 3,232.0 6.1Revenue Days (Offshore) 1,723.0 2,157.0 -20.1 1,884.0 -8.5
Source: Company, ICICIdirect.com Research Change in estimates
FY17E FY18E FY19E(| Crore) Old New % Change Old New % Change Introduced CommentsRevenue 3,599.0 3,086.5 -14.2 3,641.4 3,362.6 -7.7 3,583.3 Slower than expected recovery in offshore and tanker rates
EBITDA 1,886.4 1,619.9 -14.1 1,791.9 1,656.0 -7.6 1,763.8EBITDA Margin (%) 52.4 52.5 7 bps 49.2 49.2 4 bps 49.2 MaintainedPAT 1,114.3 931.5 -16.4 1,080.4 1,038.4 -3.9 1,057.7EPS (|) 73.9 61.8 -16.4 71.7 68.9 -3.9 70.1
Source: Company, ICICIdirect.com Research
ICICI Securities Ltd | Retail Equity Research Page 3
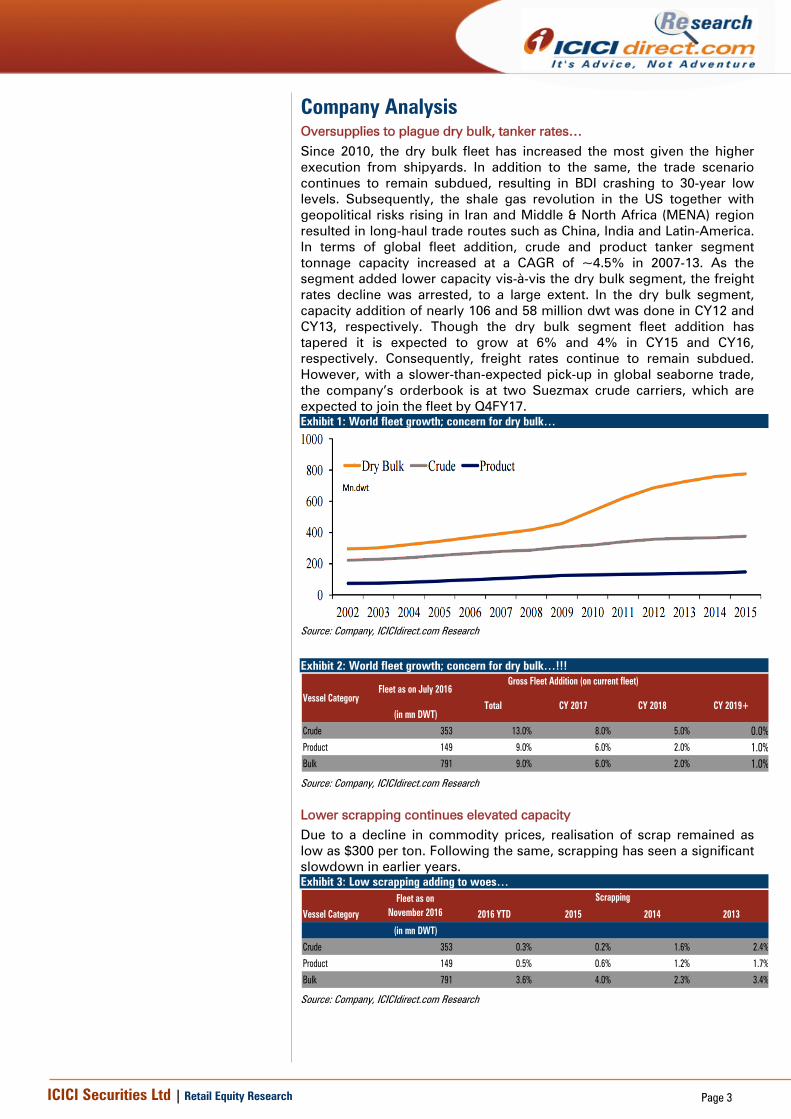
Company Analysis Oversupplies to plague dry bulk, tanker rates… Since 2010, the dry bulk fleet has increased the most given the higher execution from shipyards. In addition to the same, the trade scenario continues to remain subdued, resulting in BDI crashing to 30-year low levels. Subsequently, the shale gas revolution in the US together with geopolitical risks rising in Iran and Middle & North Africa (MENA) region resulted in long-haul trade routes such as China, India and Latin-America. In terms of global fleet addition, crude and product tanker segment tonnage capacity increased at a CAGR of ~4.5% in 2007-13. As the segment added lower capacity vis-à-vis the dry bulk segment, the freight rates decline was arrested, to a large extent. In the dry bulk segment, capacity addition of nearly 106 and 58 million dwt was done in CY12 and CY13, respectively. Though the dry bulk segment fleet addition has tapered it is expected to grow at 6% and 4% in CY15 and CY16, respectively. Consequently, freight rates continue to remain subdued. However, with a slower-than-expected pick-up in global seaborne trade, the company’s orderbook is at two Suezmax crude carriers, which are expected to join the fleet by Q4FY17. Exhibit 1: World fleet growth; concern for dry bulk…
Source: Company, ICICIdirect.com Research
Exhibit 2: World fleet growth; concern for dry bulk…!!!
Vessel Category
(in mn DWT)
Crude 353 13.0% 8.0% 5.0% 0.0%Product 149 9.0% 6.0% 2.0% 1.0%Bulk 791 9.0% 6.0% 2.0% 1.0%
Total CY 2017 CY 2018 CY 2019+
Fleet as on July 2016Gross Fleet Addition (on current fleet)
Source: Company, ICICIdirect.com Research
Lower scrapping continues elevated capacity Due to a decline in commodity prices, realisation of scrap remained as low as $300 per ton. Following the same, scrapping has seen a significant slowdown in earlier years. Exhibit 3: Low scrapping adding to woes…
Vessel Category 2016 YTD 2015 2014 2013
(in mn DWT)
Crude 353 0.3% 0.2% 1.6% 2.4%
Product 149 0.5% 0.6% 1.2% 1.7%
Bulk 791 3.6% 4.0% 2.3% 3.4%
Fleet as on November 2016
Scrapping
Source: Company, ICICIdirect.com Research
ICICI Securities Ltd | Retail Equity Research Page 4
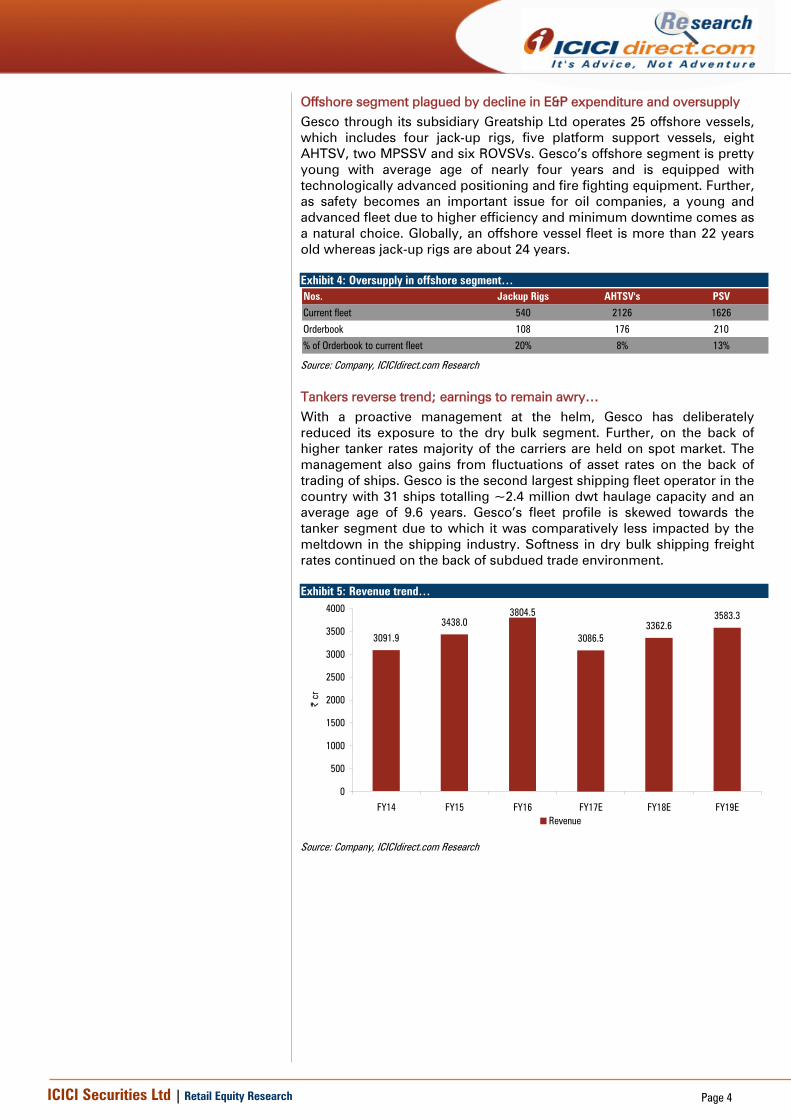
Offshore segment plagued by decline in E&P expenditure and oversupply Gesco through its subsidiary Greatship Ltd operates 25 offshore vessels, which includes four jack-up rigs, five platform support vessels, eight AHTSV, two MPSSV and six ROVSVs. Gesco’s offshore segment is pretty young with average age of nearly four years and is equipped with technologically advanced positioning and fire fighting equipment. Further, as safety becomes an important issue for oil companies, a young and advanced fleet due to higher efficiency and minimum downtime comes as a natural choice. Globally, an offshore vessel fleet is more than 22 years old whereas jack-up rigs are about 24 years. Exhibit 4: Oversupply in offshore segment… Nos. Jackup Rigs AHTSV's PSV
Current fleet 540 2126 1626
Orderbook 108 176 210
% of Orderbook to current fleet 20% 8% 13%
Source: Company, ICICIdirect.com Research
Tankers reverse trend; earnings to remain awry… With a proactive management at the helm, Gesco has deliberately reduced its exposure to the dry bulk segment. Further, on the back of higher tanker rates majority of the carriers are held on spot market. The management also gains from fluctuations of asset rates on the back of trading of ships. Gesco is the second largest shipping fleet operator in the country with 31 ships totalling ~2.4 million dwt haulage capacity and an average age of 9.6 years. Gesco’s fleet profile is skewed towards the tanker segment due to which it was comparatively less impacted by the meltdown in the shipping industry. Softness in dry bulk shipping freight rates continued on the back of subdued trade environment. Exhibit 5: Revenue trend…
3091.9
3438.03804.5
3086.53362.6
3583.3
0
500
1000
1500
2000
2500
3000
3500
4000
FY14 FY15 FY16 FY17E FY18E FY19E
| cr
Revenue
Source: Company, ICICIdirect.com Research
ICICI Securities Ltd | Retail Equity Research Page 5
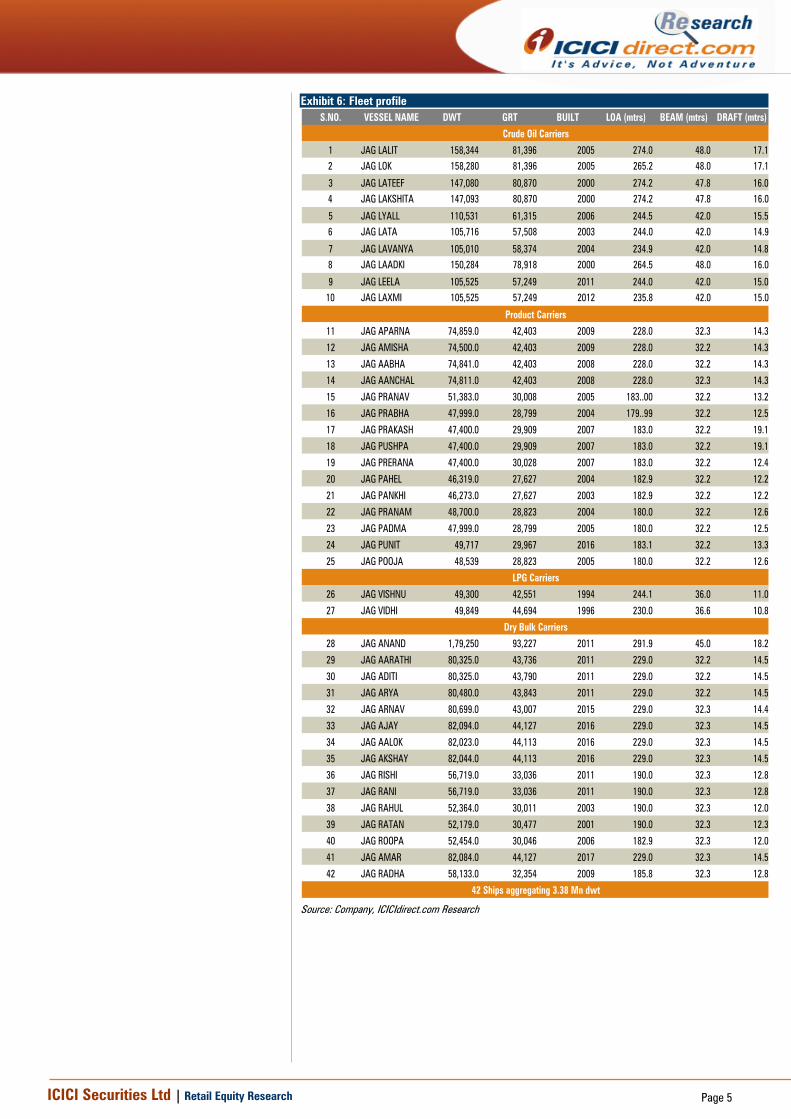
Exhibit 6: Fleet profile S.NO. VESSEL NAME DWT GRT BUILT LOA (mtrs) BEAM (mtrs) DRAFT (mtrs)
1 JAG LALIT 158,344 81,396 2005 274.0 48.0 17.12 JAG LOK 158,280 81,396 2005 265.2 48.0 17.1
3 JAG LATEEF 147,080 80,870 2000 274.2 47.8 16.04 JAG LAKSHITA 147,093 80,870 2000 274.2 47.8 16.0
5 JAG LYALL 110,531 61,315 2006 244.5 42.0 15.56 JAG LATA 105,716 57,508 2003 244.0 42.0 14.9
7 JAG LAVANYA 105,010 58,374 2004 234.9 42.0 14.88 JAG LAADKI 150,284 78,918 2000 264.5 48.0 16.0
9 JAG LEELA 105,525 57,249 2011 244.0 42.0 15.010 JAG LAXMI 105,525 57,249 2012 235.8 42.0 15.0
11 JAG APARNA 74,859.0 42,403 2009 228.0 32.3 14.3
12 JAG AMISHA 74,500.0 42,403 2009 228.0 32.2 14.3
13 JAG AABHA 74,841.0 42,403 2008 228.0 32.2 14.3
14 JAG AANCHAL 74,811.0 42,403 2008 228.0 32.3 14.3
15 JAG PRANAV 51,383.0 30,008 2005 183..00 32.2 13.2
16 JAG PRABHA 47,999.0 28,799 2004 179..99 32.2 12.5
17 JAG PRAKASH 47,400.0 29,909 2007 183.0 32.2 19.1
18 JAG PUSHPA 47,400.0 29,909 2007 183.0 32.2 19.1
19 JAG PRERANA 47,400.0 30,028 2007 183.0 32.2 12.4
20 JAG PAHEL 46,319.0 27,627 2004 182.9 32.2 12.2
21 JAG PANKHI 46,273.0 27,627 2003 182.9 32.2 12.2
22 JAG PRANAM 48,700.0 28,823 2004 180.0 32.2 12.6
23 JAG PADMA 47,999.0 28,799 2005 180.0 32.2 12.5
24 JAG PUNIT 49,717 29,967 2016 183.1 32.2 13.3
25 JAG POOJA 48,539 28,823 2005 180.0 32.2 12.6
26 JAG VISHNU 49,300 42,551 1994 244.1 36.0 11.0
27 JAG VIDHI 49,849 44,694 1996 230.0 36.6 10.8
28 JAG ANAND 1,79,250 93,227 2011 291.9 45.0 18.2
29 JAG AARATHI 80,325.0 43,736 2011 229.0 32.2 14.5
30 JAG ADITI 80,325.0 43,790 2011 229.0 32.2 14.5
31 JAG ARYA 80,480.0 43,843 2011 229.0 32.2 14.5
32 JAG ARNAV 80,699.0 43,007 2015 229.0 32.3 14.4
33 JAG AJAY 82,094.0 44,127 2016 229.0 32.3 14.5
34 JAG AALOK 82,023.0 44,113 2016 229.0 32.3 14.5
35 JAG AKSHAY 82,044.0 44,113 2016 229.0 32.3 14.5
36 JAG RISHI 56,719.0 33,036 2011 190.0 32.3 12.8
37 JAG RANI 56,719.0 33,036 2011 190.0 32.3 12.8
38 JAG RAHUL 52,364.0 30,011 2003 190.0 32.3 12.0
39 JAG RATAN 52,179.0 30,477 2001 190.0 32.3 12.3
40 JAG ROOPA 52,454.0 30,046 2006 182.9 32.3 12.0
41 JAG AMAR 82,084.0 44,127 2017 229.0 32.3 14.5
42 JAG RADHA 58,133.0 32,354 2009 185.8 32.3 12.8
Crude Oil Carriers
Product Carriers
LPG Carriers
Dry Bulk Carriers
42 Ships aggregating 3.38 Mn dwt
Source: Company, ICICIdirect.com Research
ICICI Securities Ltd | Retail Equity Research Page 6
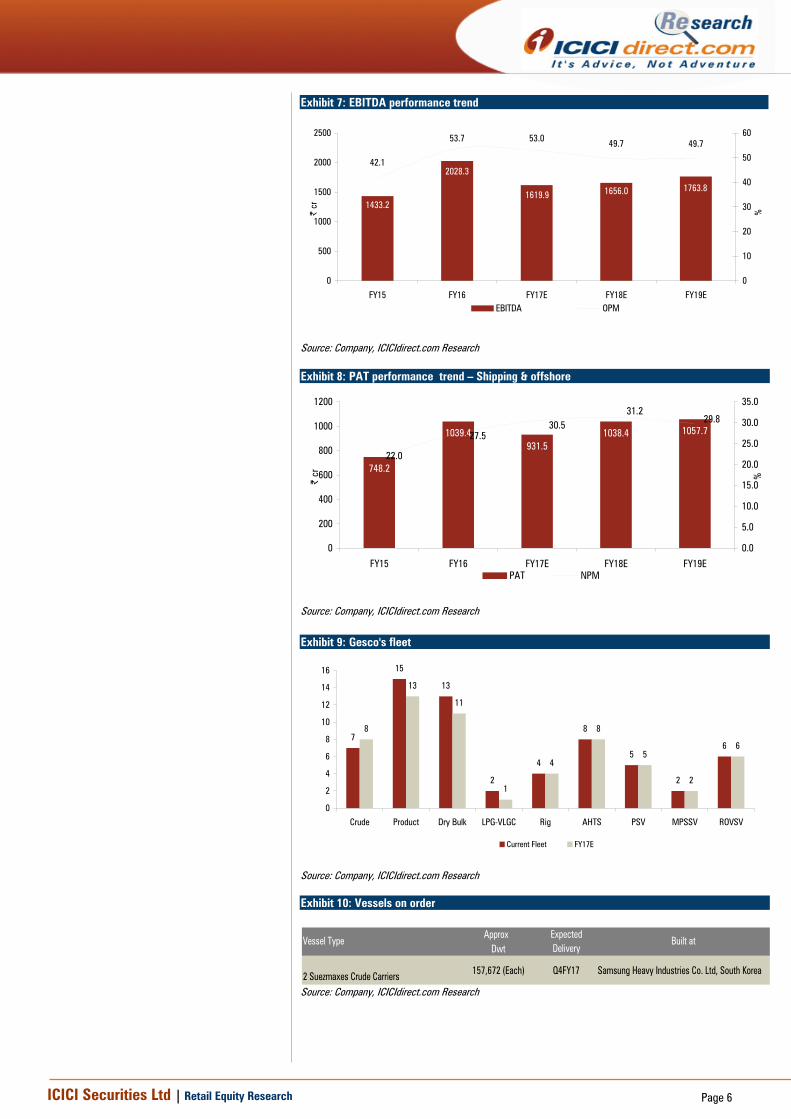
Exhibit 7: EBITDA performance trend
1433.2
2028.3
1619.9 1656.0 1763.8
42.1
53.7 53.0 49.7 49.7
0
500
1000
1500
2000
2500
FY15 FY16 FY17E FY18E FY19E
| cr
0
10
20
30
40
50
60
%
EBITDA OPM
Source: Company, ICICIdirect.com Research
Exhibit 8: PAT performance trend – Shipping & offshore
748.2
1039.4931.5
1038.4 1057.7
22.0
27.530.5
31.229.8
0
200
400
600
800
1000
1200
FY15 FY16 FY17E FY18E FY19E
| cr
0.0
5.0
10.0
15.0
20.0
25.0
30.0
35.0
%
PAT NPM
Source: Company, ICICIdirect.com Research
Exhibit 9: Gesco's fleet
7
15
13
2
4
8
5
2
6
8
13
11
1
4
8
5
2
6
0
2
4
6
8
10
12
14
16
Crude Product Dry Bulk LPG-VLGC Rig AHTS PSV MPSSV ROVSV
Current Fleet FY17E
Source: Company, ICICIdirect.com Research
Exhibit 10: Vessels on order
Approx Dwt
2 Suezmaxes Crude Carriers 157,672 (Each) Q4FY17 Samsung Heavy Industries Co. Ltd, South Korea
Vessel TypeExpected Delivery
Built at
Source: Company, ICICIdirect.com Research
ICICI Securities Ltd | Retail Equity Research Page 7
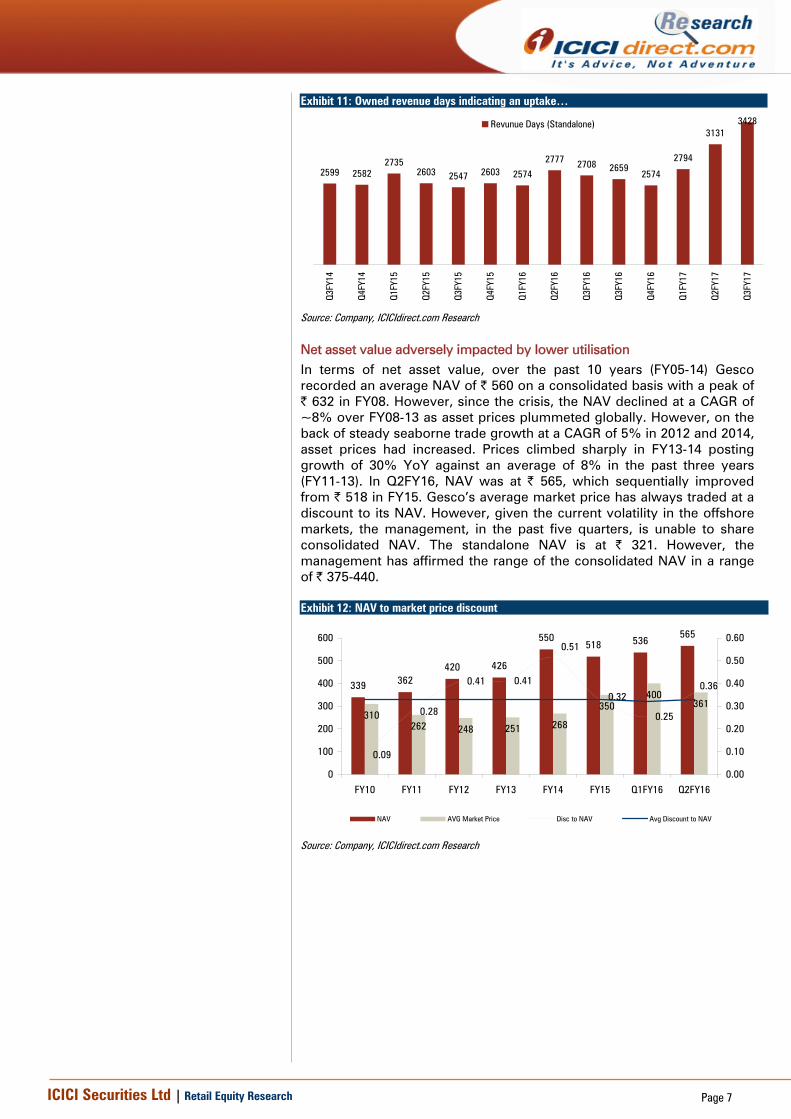
Exhibit 11: Owned revenue days indicating an uptake…
2599 25822735
2603 2547 2603 2574
2777 2708 26592574
2794
31313428
Q3FY
14
Q4FY
14
Q1FY
15
Q2FY
15
Q3FY
15
Q4FY
15
Q1FY
16
Q2FY
16
Q3FY
16
Q3FY
16
Q4FY
16
Q1FY
17
Q2FY
17
Q3FY
17
Revunue Days (Standalone)
Source: Company, ICICIdirect.com Research
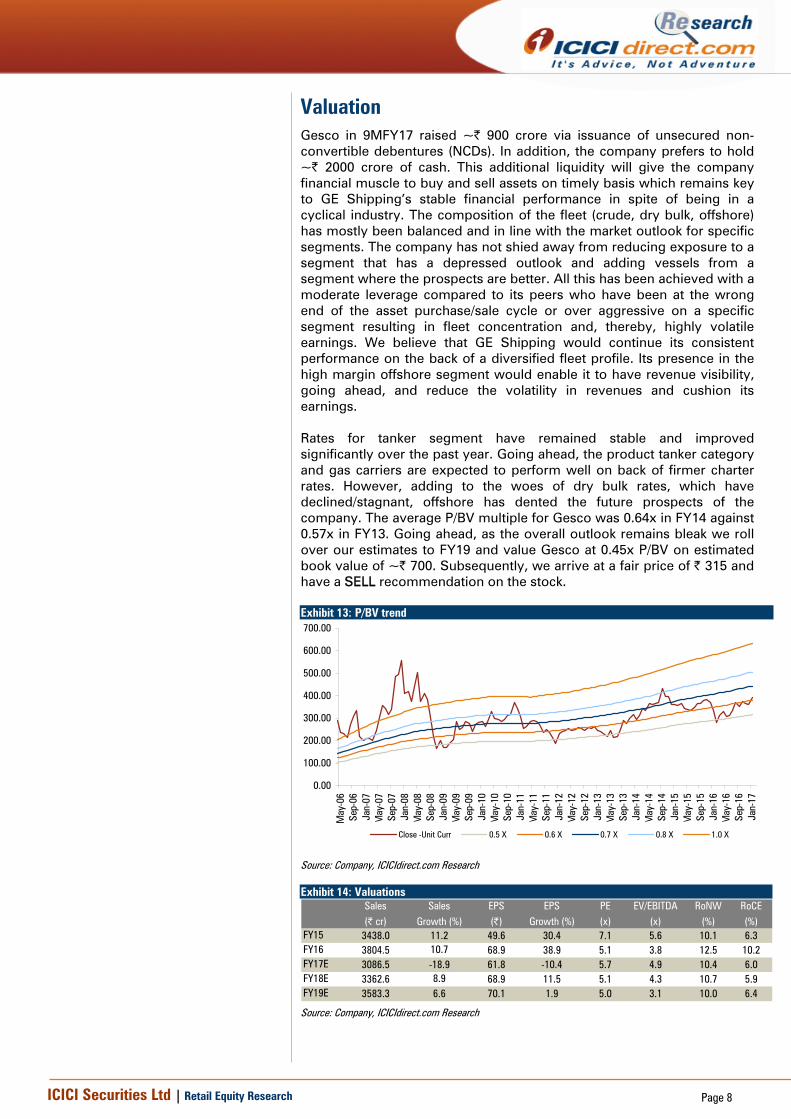
Net asset value adversely impacted by lower utilisation In terms of net asset value, over the past 10 years (FY05-14) Gesco recorded an average NAV of | 560 on a consolidated basis with a peak of | 632 in FY08. However, since the crisis, the NAV declined at a CAGR of ~8% over FY08-13 as asset prices plummeted globally. However, on the back of steady seaborne trade growth at a CAGR of 5% in 2012 and 2014, asset prices had increased. Prices climbed sharply in FY13-14 posting growth of 30% YoY against an average of 8% in the past three years (FY11-13). In Q2FY16, NAV was at | 565, which sequentially improved from | 518 in FY15. Gesco’s average market price has always traded at a discount to its NAV. However, given the current volatility in the offshore markets, the management, in the past five quarters, is unable to share consolidated NAV. The standalone NAV is at | 321. However, the management has affirmed the range of the consolidated NAV in a range of | 375-440. Exhibit 12: NAV to market price discount
339 362420 426
550518 536
565
310262 248 251 268
350400
361
0.09
0.28
0.41 0.41
0.25
0.51
0.320.36
0
100
200
300
400
500
600
FY10 FY11 FY12 FY13 FY14 FY15 Q1FY16 Q2FY16
0.00
0.10
0.20
0.30
0.40
0.50
0.60
NAV AVG Market Price Disc to NAV Avg Discount to NAV
Source: Company, ICICIdirect.com Research
ICICI Securities Ltd | Retail Equity Research Page 8
Valuation Gesco in 9MFY17 raised ~| 900 crore via issuance of unsecured non-convertible debentures (NCDs). In addition, the company prefers to hold ~| 2000 crore of cash. This additional liquidity will give the company financial muscle to buy and sell assets on timely basis which remains key to GE Shipping’s stable financial performance in spite of being in a cyclical industry. The composition of the fleet (crude, dry bulk, offshore) has mostly been balanced and in line with the market outlook for specific segments. The company has not shied away from reducing exposure to a segment that has a depressed outlook and adding vessels from a segment where the prospects are better. All this has been achieved with a moderate leverage compared to its peers who have been at the wrong end of the asset purchase/sale cycle or over aggressive on a specific segment resulting in fleet concentration and, thereby, highly volatile earnings. We believe that GE Shipping would continue its consistent performance on the back of a diversified fleet profile. Its presence in the high margin offshore segment would enable it to have revenue visibility, going ahead, and reduce the volatility in revenues and cushion its earnings. Rates for tanker segment have remained stable and improved significantly over the past year. Going ahead, the product tanker category and gas carriers are expected to perform well on back of firmer charter rates. However, adding to the woes of dry bulk rates, which have declined/stagnant, offshore has dented the future prospects of the company. The average P/BV multiple for Gesco was 0.64x in FY14 against 0.57x in FY13. Going ahead, as the overall outlook remains bleak we roll over our estimates to FY19 and value Gesco at 0.45x P/BV on estimated book value of ~| 700. Subsequently, we arrive at a fair price of | 315 and have a SELL recommendation on the stock. Exhibit 13: P/BV trend
0.00
100.00
200.00
300.00
400.00
500.00
600.00
700.00
May
-06
Sep-
06Ja
n-07
May
-07
Sep-
07Ja
n-08
May
-08
Sep-
08Ja
n-09
May
-09
Sep-
09Ja
n-10
May
-10
Sep-
10Ja
n-11
May
-11
Sep-
11Ja
n-12
May
-12
Sep-
12Ja
n-13
May
-13
Sep-
13Ja
n-14
May
-14
Sep-
14Ja
n-15
May
-15
Sep-
15Ja
n-16
May
-16
Sep-
16Ja
n-17
Close -Unit Curr 0.5 X 0.6 X 0.7 X 0.8 X 1.0 X
Source: Company, ICICIdirect.com Research
Exhibit 14: Valuations Sales Sales EPS EPS PE EV/EBITDA RoNW RoCE(| cr) Growth (%) (|) Growth (%) (x) (x) (%) (%)
FY15 3438.0 11.2 49.6 30.4 7.1 5.6 10.1 6.3FY16 3804.5 10.7 68.9 38.9 5.1 3.8 12.5 10.2FY17E 3086.5 -18.9 61.8 -10.4 5.7 4.9 10.4 6.0FY18E 3362.6 8.9 68.9 11.5 5.1 4.3 10.7 5.9FY19E 3583.3 6.6 70.1 1.9 5.0 3.1 10.0 6.4
Source: Company, ICICIdirect.com Research
ICICI Securities Ltd | Retail Equity Research Page 9
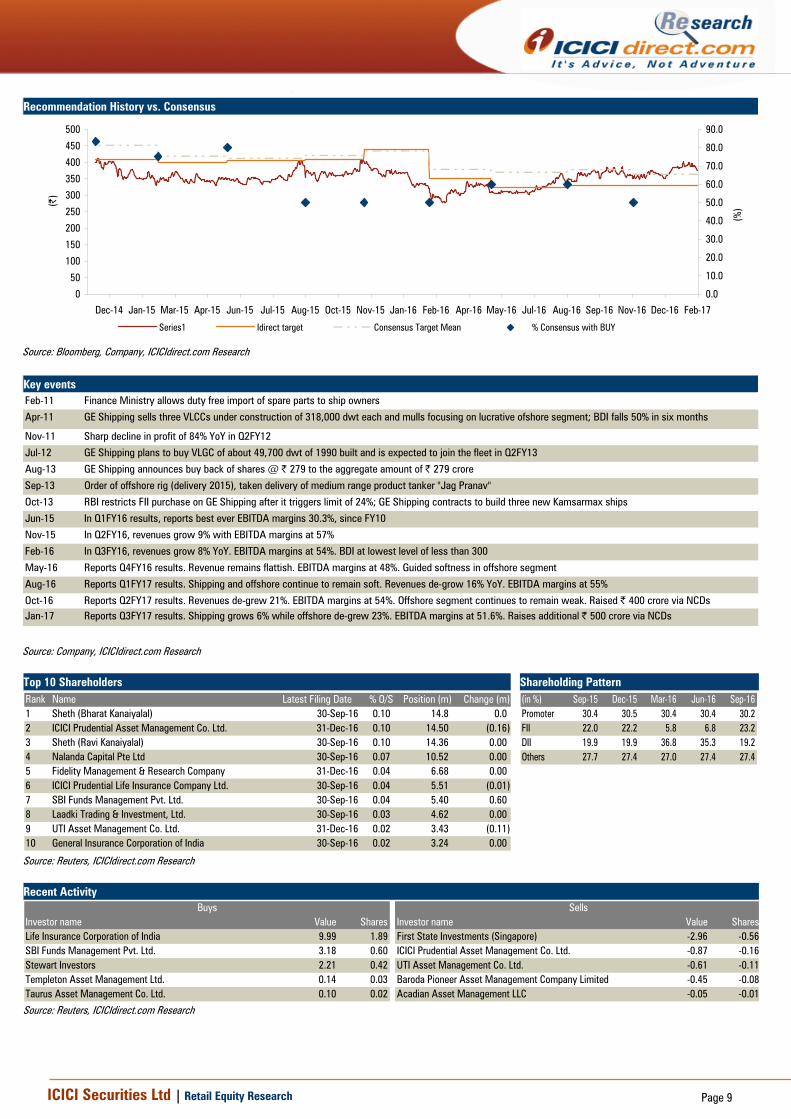
Recommendation History vs. Consensus
0
50
100
150
200
250
300
350
400
450
500
Feb-17Dec-16Nov-16Sep-16Aug-16Jul-16May-16Apr-16Feb-16Jan-16Nov-15Oct-15Aug-15Jul-15Jun-15Apr-15Mar-15Jan-15Dec-14
(|)
0.0
10.0
20.0
30.0
40.0
50.0
60.0
70.0
80.0
90.0
(%)
Series1 Idirect target Consensus Target Mean % Consensus with BUY
Source: Bloomberg, Company, ICICIdirect.com Research Key events Feb-11 Finance Ministry allows duty free import of spare parts to ship owners
Apr-11 GE Shipping sells three VLCCs under construction of 318,000 dwt each and mulls focusing on lucrative ofshore segment; BDI falls 50% in six months
Nov-11 Sharp decline in profit of 84% YoY in Q2FY12
Jul-12 GE Shipping plans to buy VLGC of about 49,700 dwt of 1990 built and is expected to join the fleet in Q2FY13
Aug-13 GE Shipping announces buy back of shares @ | 279 to the aggregate amount of | 279 crore
Sep-13 Order of offshore rig (delivery 2015), taken delivery of medium range product tanker "Jag Pranav"
Oct-13 RBI restricts FII purchase on GE Shipping after it triggers limit of 24%; GE Shipping contracts to build three new Kamsarmax ships
Jun-15 In Q1FY16 results, reports best ever EBITDA margins 30.3%, since FY10
Nov-15 In Q2FY16, revenues grow 9% with EBITDA margins at 57%
Feb-16 In Q3FY16, revenues grow 8% YoY. EBITDA margins at 54%. BDI at lowest level of less than 300
May-16 Reports Q4FY16 results. Revenue remains flattish. EBITDA margins at 48%. Guided softness in offshore segment
Aug-16 Reports Q1FY17 results. Shipping and offshore continue to remain soft. Revenues de-grow 16% YoY. EBITDA margins at 55%
Oct-16 Reports Q2FY17 results. Revenues de-grew 21%. EBITDA margins at 54%. Offshore segment continues to remain weak. Raised | 400 crore via NCDsJan-17 Reports Q3FY17 results. Shipping grows 6% while offshore de-grew 23%. EBITDA margins at 51.6%. Raises additional | 500 crore via NCDs
Source: Company, ICICIdirect.com Research Top 10 Shareholders Shareholding Pattern Rank Name Latest Filing Date % O/S Position (m) Change (m)1 Sheth (Bharat Kanaiyalal) 30-Sep-16 0.10 14.8 0.02 ICICI Prudential Asset Management Co. Ltd. 31-Dec-16 0.10 14.50 (0.16)3 Sheth (Ravi Kanaiyalal) 30-Sep-16 0.10 14.36 0.004 Nalanda Capital Pte Ltd 30-Sep-16 0.07 10.52 0.005 Fidelity Management & Research Company 31-Dec-16 0.04 6.68 0.006 ICICI Prudential Life Insurance Company Ltd. 30-Sep-16 0.04 5.51 (0.01)7 SBI Funds Management Pvt. Ltd. 30-Sep-16 0.04 5.40 0.608 Laadki Trading & Investment, Ltd. 30-Sep-16 0.03 4.62 0.009 UTI Asset Management Co. Ltd. 31-Dec-16 0.02 3.43 (0.11)10 General Insurance Corporation of India 30-Sep-16 0.02 3.24 0.00
(in %) Sep-15 Dec-15 Mar-16 Jun-16 Sep-16Promoter 30.4 30.5 30.4 30.4 30.2FII 22.0 22.2 5.8 6.8 23.2DII 19.9 19.9 36.8 35.3 19.2Others 27.7 27.4 27.0 27.4 27.4
Source: Reuters, ICICIdirect.com Research Recent Activity
Investor name Value Shares Investor name Value SharesLife Insurance Corporation of India 9.99 1.89 First State Investments (Singapore) -2.96 -0.56SBI Funds Management Pvt. Ltd. 3.18 0.60 ICICI Prudential Asset Management Co. Ltd. -0.87 -0.16Stewart Investors 2.21 0.42 UTI Asset Management Co. Ltd. -0.61 -0.11Templeton Asset Management Ltd. 0.14 0.03 Baroda Pioneer Asset Management Company Limited -0.45 -0.08Taurus Asset Management Co. Ltd. 0.10 0.02 Acadian Asset Management LLC -0.05 -0.01
Buys Sells
Source: Reuters, ICICIdirect.com Research
ICICI Securities Ltd | Retail Equity Research Page 10
.
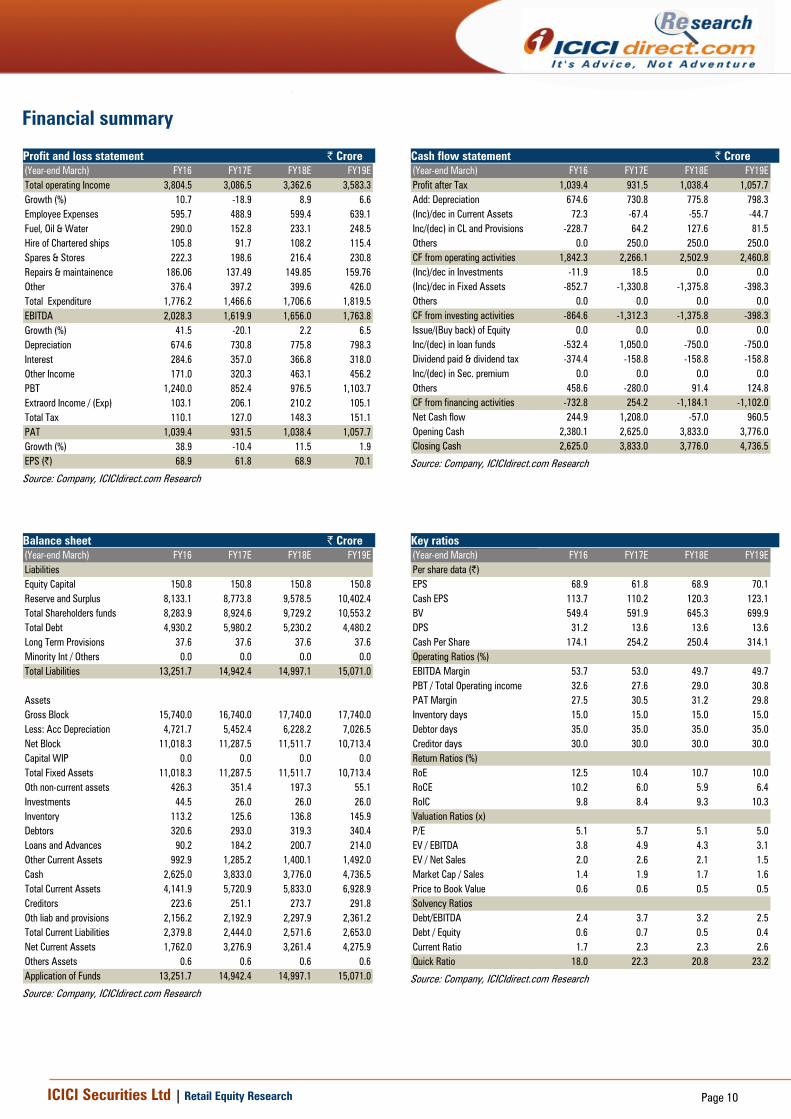
Financial summary Profit and loss statement | Crore (Year-end March) FY16 FY17E FY18E FY19ETotal operating Income 3,804.5 3,086.5 3,362.6 3,583.3Growth (%) 10.7 -18.9 8.9 6.6Employee Expenses 595.7 488.9 599.4 639.1Fuel, Oil & Water 290.0 152.8 233.1 248.5Hire of Chartered ships 105.8 91.7 108.2 115.4Spares & Stores 222.3 198.6 216.4 230.8Repairs & maintainence 186.06 137.49 149.85 159.76Other 376.4 397.2 399.6 426.0Total Expenditure 1,776.2 1,466.6 1,706.6 1,819.5EBITDA 2,028.3 1,619.9 1,656.0 1,763.8Growth (%) 41.5 -20.1 2.2 6.5Depreciation 674.6 730.8 775.8 798.3Interest 284.6 357.0 366.8 318.0Other Income 171.0 320.3 463.1 456.2PBT 1,240.0 852.4 976.5 1,103.7Extraord Income / (Exp) 103.1 206.1 210.2 105.1Total Tax 110.1 127.0 148.3 151.1PAT 1,039.4 931.5 1,038.4 1,057.7Growth (%) 38.9 -10.4 11.5 1.9EPS (|) 68.9 61.8 68.9 70.1
Source: Company, ICICIdirect.com Research
Cash flow statement | Crore (Year-end March) FY16 FY17E FY18E FY19EProfit after Tax 1,039.4 931.5 1,038.4 1,057.7Add: Depreciation 674.6 730.8 775.8 798.3(Inc)/dec in Current Assets 72.3 -67.4 -55.7 -44.7Inc/(dec) in CL and Provisions -228.7 64.2 127.6 81.5Others 0.0 250.0 250.0 250.0CF from operating activities 1,842.3 2,266.1 2,502.9 2,460.8(Inc)/dec in Investments -11.9 18.5 0.0 0.0(Inc)/dec in Fixed Assets -852.7 -1,330.8 -1,375.8 -398.3Others 0.0 0.0 0.0 0.0CF from investing activities -864.6 -1,312.3 -1,375.8 -398.3Issue/(Buy back) of Equity 0.0 0.0 0.0 0.0Inc/(dec) in loan funds -532.4 1,050.0 -750.0 -750.0Dividend paid & dividend tax -374.4 -158.8 -158.8 -158.8Inc/(dec) in Sec. premium 0.0 0.0 0.0 0.0Others 458.6 -280.0 91.4 124.8CF from financing activities -732.8 254.2 -1,184.1 -1,102.0Net Cash flow 244.9 1,208.0 -57.0 960.5Opening Cash 2,380.1 2,625.0 3,833.0 3,776.0Closing Cash 2,625.0 3,833.0 3,776.0 4,736.5
Source: Company, ICICIdirect.com Research
Balance sheet | Crore (Year-end March) FY16 FY17E FY18E FY19ELiabilitiesEquity Capital 150.8 150.8 150.8 150.8Reserve and Surplus 8,133.1 8,773.8 9,578.5 10,402.4Total Shareholders funds 8,283.9 8,924.6 9,729.2 10,553.2Total Debt 4,930.2 5,980.2 5,230.2 4,480.2Long Term Provisions 37.6 37.6 37.6 37.6Minority Int / Others 0.0 0.0 0.0 0.0Total Liabilities 13,251.7 14,942.4 14,997.1 15,071.0
AssetsGross Block 15,740.0 16,740.0 17,740.0 17,740.0Less: Acc Depreciation 4,721.7 5,452.4 6,228.2 7,026.5Net Block 11,018.3 11,287.5 11,511.7 10,713.4Capital WIP 0.0 0.0 0.0 0.0Total Fixed Assets 11,018.3 11,287.5 11,511.7 10,713.4Oth non-current assets 426.3 351.4 197.3 55.1Investments 44.5 26.0 26.0 26.0Inventory 113.2 125.6 136.8 145.9Debtors 320.6 293.0 319.3 340.4Loans and Advances 90.2 184.2 200.7 214.0Other Current Assets 992.9 1,285.2 1,400.1 1,492.0Cash 2,625.0 3,833.0 3,776.0 4,736.5Total Current Assets 4,141.9 5,720.9 5,833.0 6,928.9Creditors 223.6 251.1 273.7 291.8Oth liab and provisions 2,156.2 2,192.9 2,297.9 2,361.2Total Current Liabilities 2,379.8 2,444.0 2,571.6 2,653.0Net Current Assets 1,762.0 3,276.9 3,261.4 4,275.9Others Assets 0.6 0.6 0.6 0.6Application of Funds 13,251.7 14,942.4 14,997.1 15,071.0
Source: Company, ICICIdirect.com Research
Key ratios (Year-end March) FY16 FY17E FY18E FY19EPer share data (|)EPS 68.9 61.8 68.9 70.1Cash EPS 113.7 110.2 120.3 123.1BV 549.4 591.9 645.3 699.9DPS 31.2 13.6 13.6 13.6Cash Per Share 174.1 254.2 250.4 314.1Operating Ratios (%)EBITDA Margin 53.7 53.0 49.7 49.7PBT / Total Operating income 32.6 27.6 29.0 30.8PAT Margin 27.5 30.5 31.2 29.8Inventory days 15.0 15.0 15.0 15.0Debtor days 35.0 35.0 35.0 35.0Creditor days 30.0 30.0 30.0 30.0Return Ratios (%)RoE 12.5 10.4 10.7 10.0RoCE 10.2 6.0 5.9 6.4RoIC 9.8 8.4 9.3 10.3Valuation Ratios (x)P/E 5.1 5.7 5.1 5.0EV / EBITDA 3.8 4.9 4.3 3.1EV / Net Sales 2.0 2.6 2.1 1.5Market Cap / Sales 1.4 1.9 1.7 1.6Price to Book Value 0.6 0.6 0.5 0.5Solvency RatiosDebt/EBITDA 2.4 3.7 3.2 2.5Debt / Equity 0.6 0.7 0.5 0.4Current Ratio 1.7 2.3 2.3 2.6Quick Ratio 18.0 22.3 20.8 23.2
Source: Company, ICICIdirect.com Research
ICICI Securities Ltd | Retail Equity Research Page 11
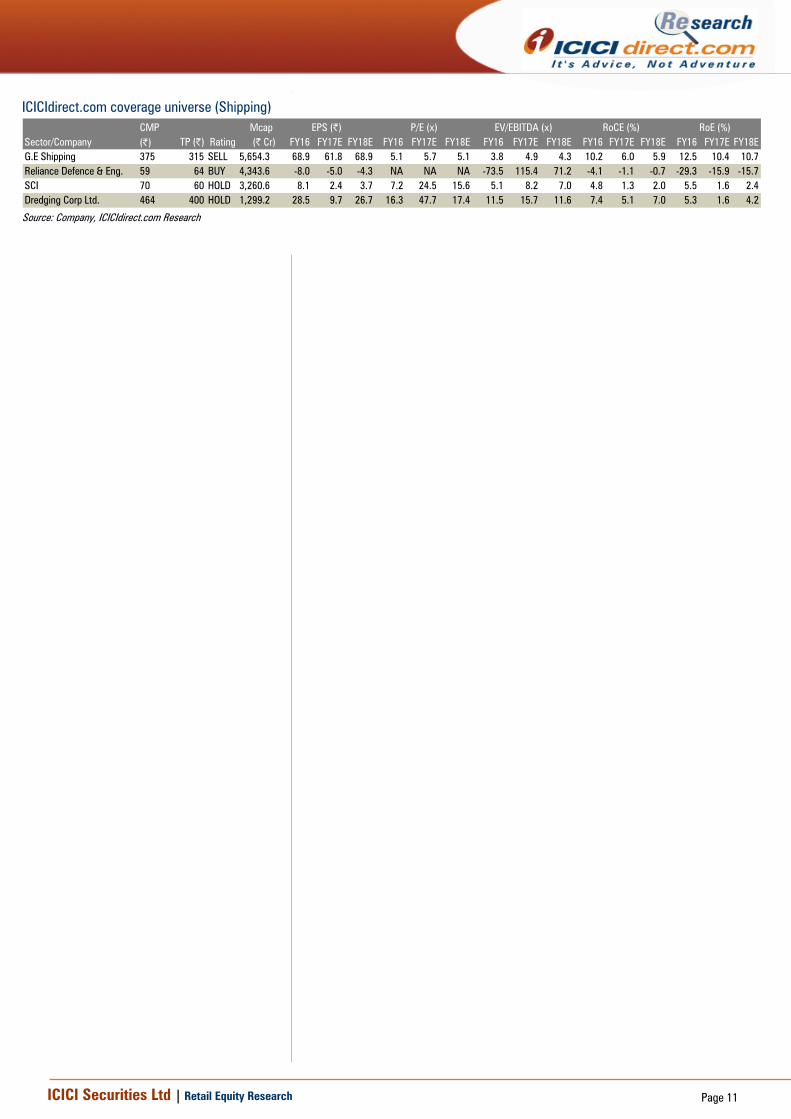
ICICIdirect.com coverage universe (Shipping) CMP Mcap
Sector/Company (|) TP (|) Rating (| Cr) FY16 FY17E FY18E FY16 FY17E FY18E FY16 FY17E FY18E FY16 FY17E FY18E FY16 FY17E FY18EG.E Shipping 375 315 SELL 5,654.3 68.9 61.8 68.9 5.1 5.7 5.1 3.8 4.9 4.3 10.2 6.0 5.9 12.5 10.4 10.7Reliance Defence & Eng. 59 64 BUY 4,343.6 -8.0 -5.0 -4.3 NA NA NA -73.5 115.4 71.2 -4.1 -1.1 -0.7 -29.3 -15.9 -15.7SCI 70 60 HOLD 3,260.6 8.1 2.4 3.7 7.2 24.5 15.6 5.1 8.2 7.0 4.8 1.3 2.0 5.5 1.6 2.4Dredging Corp Ltd. 464 400 HOLD 1,299.2 28.5 9.7 26.7 16.3 47.7 17.4 11.5 15.7 11.6 7.4 5.1 7.0 5.3 1.6 4.2
RoCE (%) RoE (%)EPS (|) P/E (x) EV/EBITDA (x)
Source: Company, ICICIdirect.com Research
ICICI Securities Ltd | Retail Equity Research Page 12
RATING RATIONALE ICICIdirect.com endeavours to provide objective opinions and recommendations. ICICIdirect.com assigns ratings to its stocks according to their notional target price vs. current market price and then categorises them as Strong Buy, Buy, Hold and Sell. The performance horizon is two years unless specified and the notional target price is defined as the analysts' valuation for a stock. Strong Buy: >15%/20% for large caps/midcaps, respectively, with high conviction; Buy: >10%/15% for large caps/midcaps, respectively; Hold: Up to +/-10%; Sell: -10% or more;
Pankaj Pandey Head – Research [email protected]
ICICIdirect.com Research Desk, ICICI Securities Limited, 1st Floor, Akruti Trade Centre, Road No 7, MIDC, Andheri (East) Mumbai – 400 093
ICICI Securities Ltd | Retail Equity Research Page 13
ANALYST CERTIFICATION We /I, Bharat Chhoda, MBA and Ankit Panchmatia, MBA Research Analysts, authors and the names subscribed to this report, hereby certify that all of the views expressed in this research report accurately reflect our views about the subject issuer(s) or securities. We also certify that no part of our compensation was, is, or will be directly or indirectly related to the specific recommendation(s) or view(s) in this report.
Terms & conditions and other disclosures: ICICI Securities Limited (ICICI Securities) is a full-service, integrated investment banking and is, inter alia, engaged in the business of stock brokering and distribution of financial products. ICICI Securities Limited is a Sebi registered Research Analyst with Sebi Registration Number – INH000000990. ICICI Securities is a wholly-owned subsidiary of ICICI Bank which is India’s largest private sector bank and has its various subsidiaries engaged in businesses of housing finance, asset management, life insurance, general insurance, venture capital fund management, etc. (“associates”), the details in respect of which are available on www.icicibank.com. ICICI Securities is one of the leading merchant bankers/ underwriters of securities and participate in virtually all securities trading markets in India. We and our associates might have investment banking and other business relationship with a significant percentage of companies covered by our Investment Research Department. ICICI Securities generally prohibits its analysts, persons reporting to analysts and their relatives from maintaining a financial interest in the securities or derivatives of any companies that the analysts cover. The information and opinions in this report have been prepared by ICICI Securities and are subject to change without any notice. The report and information contained herein is strictly confidential and meant solely for the selected recipient and may not be altered in any way, transmitted to, copied or distributed, in part or in whole, to any other person or to the media or reproduced in any form, without prior written consent of ICICI Securities. While we would endeavour to update the information herein on a reasonable basis, ICICI Securities is under no obligation to update or keep the information current. Also, there may be regulatory, compliance or other reasons that may prevent ICICI Securities from doing so. Non-rated securities indicate that rating on a particular security has been suspended temporarily and such suspension is in compliance with applicable regulations and/or ICICI Securities policies, in circumstances where ICICI Securities might be acting in an advisory capacity to this company, or in certain other circumstances. This report is based on information obtained from public sources and sources believed to be reliable, but no independent verification has been made nor is its accuracy or completeness guaranteed. This report and information herein is solely for informational purpose and shall not be used or considered as an offer document or solicitation of offer to buy or sell or subscribe for securities or other financial instruments. Though disseminated to all the customers simultaneously, not all customers may receive this report at the same time. ICICI Securities will not treat recipients as customers by virtue of their receiving this report. Nothing in this report constitutes investment, legal, accounting and tax advice or a representation that any investment or strategy is suitable or appropriate to your specific circumstances. The securities discussed and opinions expressed in this report may not be suitable for all investors, who must make their own investment decisions, based on their own investment objectives, financial positions and needs of specific recipient. This may not be taken in substitution for the exercise of independent judgment by any recipient. The recipient should independently evaluate the investment risks. The value and return on investment may vary because of changes in interest rates, foreign exchange rates or any other reason. ICICI Securities accepts no liabilities whatsoever for any loss or damage of any kind arising out of the use of this report. Past performance is not necessarily a guide to future performance. Investors are advised to see Risk Disclosure Document to understand the risks associated before investing in the securities markets. Actual results may differ materially from those set forth in projections. Forward-looking statements are not predictions and may be subject to change without notice. ICICI Securities or its associates might have managed or co-managed public offering of securities for the subject company or might have been mandated by the subject company for any other assignment in the past twelve months. ICICI Securities or its associates might have received any compensation from the companies mentioned in the report during the period preceding twelve months from the date of this report for services in respect of managing or co-managing public offerings, corporate finance, investment banking or merchant banking, brokerage services or other advisory service in a merger or specific transaction. ICICI Securities or its associates might have received any compensation for products or services other than investment banking or merchant banking or brokerage services from the companies mentioned in the report in the past twelve months. ICICI Securities encourages independence in research report preparation and strives to minimize conflict in preparation of research report. ICICI Securities or its associates or its analysts did not receive any compensation or other benefits from the companies mentioned in the report or third party in connection with preparation of the research report. Accordingly, neither ICICI Securities nor Research Analysts and their relatives have any material conflict of interest at the time of publication of this report. It is confirmed that Bharat Chhoda, MBA and Ankit Panchmatia, MBA Research Analysts of this report have not received any compensation from the companies mentioned in the report in the preceding twelve months. Compensation of our Research Analysts is not based on any specific merchant banking, investment banking or brokerage service transactions. ICICI Securities or its subsidiaries collectively or Research Analysts or their relatives do not own 1% or more of the equity securities of the Company mentioned in the report as of the last day of the month preceding the publication of the research report. Since associates of ICICI Securities are engaged in various financial service businesses, they might have financial interests or beneficial ownership in various companies including the subject company/companies mentioned in this report. It is confirmed that Bharat Chhoda, MBA and Ankit Panchmatia, MBA Research Analysts do not serve as an officer, director or employee of the companies mentioned in the report. ICICI Securities may have issued other reports that are inconsistent with and reach different conclusion from the information presented in this report. Neither the Research Analysts nor ICICI Securities have been engaged in market making activity for the companies mentioned in the report. We submit that no material disciplinary action has been taken on ICICI Securities by any Regulatory Authority impacting Equity Research Analysis activities. This report is not directed or intended for distribution to, or use by, any person or entity who is a citizen or resident of or located in any locality, state, country or other jurisdiction, where such distribution, publication, availability or use would be contrary to law, regulation or which would subject ICICI Securities and affiliates to any registration or licensing requirement within such jurisdiction. The securities described herein may or may not be eligible for sale in all jurisdictions or to certain category of investors. Persons in whose possession this document may come are required to inform themselves of and to observe such restriction.