Embed Size (px)
Citation preview
How Nutrients and Invasive Species Interact to Overwhelm the Coasts and Starve Offshore Waters
in the Great LakesFEASTANdFAMINE
Feast and Famine in the Great Lakes: How Nutrients and Invasive Species Interact to Overwhelm the Coasts
and Starve Offshore WatersOctober 2011
Researched and written by Julie Mida Hinderer and Michael W. Murray, Ph.D.with additional contributions by Trilby Becker
AcknowledgmentsThis report was made possible due to the generous support of the C.S. Mott Foundation and The Joyce Foundation.
We thank the following National Wildlife Federation staff who provided additional input on this report: Andy Buchsbaum, Marc Smith, and Jordan Lubetkin. We are particularly grateful to those who provided reviews of the report: Mr. Mark Coscarelli, Great Lakes Fishery Trust; Ms. Alice Dove, Environment Canada; Mr. Jim Johnson, Michigan Department of Natural Resources; Mr. Frank Krist, Lake Huron Citizens Fishery Advisory Committee; Mr. Thomas Nalepa, Great Lakes Environmental Research Laboratory, National Oceanic and Atmospheric Administration; Dr. Don Scavia, University of Michigan; and Dr. Kelley Smith, Michigan Department of Natural Resources. We also appreciate provision of data, figures, and/or additional information from Dr. David Baker, Heidelberg College; Dr. Stephen Carpenter, University of Wisconsin-Madison; Dr. David Dolan, University of Wisconsin-Green Bay; Ms. Alice Dove, Environment Canada; Dr. Mary Anne Evans, University of Michigan; Dr. Gary Fahnenstiel, Lake Michigan Field Station, Great Lakes Environmental Research Laboratory, National Oceanic and Atmospheric Administration; Dr. Robert Hecky, Large Lakes Observatory, University of Minnesota-Duluth; Mr. Rob Hyde, Environment Canada; Mr. Thomas Nalepa, Great Lakes Environmental Research Laboratory, National Oceanic and Atmospheric Administration; and Dr. Stephen Riley, Great Lakes Science Center, U.S. Geological Survey. We also thank those who provided additional photos for the report: Ms. Sandy Bihn, Lake Erie Waterkeeper Inc.; Dr. Harvey Bootsma, University of Wisconsin-Milwaukee; and Ms. Sonia Joseph Joshi, Great Lakes Environmental Research Laboratory, National Oceanic and Atmospheric Administration.
National Wildlife Federation is solely responsible for the content of this report. The views expressed in this report are those of NWF and do not necessarily represent the views of reviewers or financial supporters.
Table of Contents1 Executive Summary
4 Section 1: Introduction
6 Section 2: Back from the Brink
9 Section 3: Ongoing Ecosystem Shock
14 Section 4: Eutrophication Relapse
18 Spotlight: FEAST
19 Spotlight: FAMINE
20 Section 5: Existing Nutrient Reduction Programs and Policies
22 Section 6: Looking to the Future
24 Section 7: Recommendations
28 Endnotes
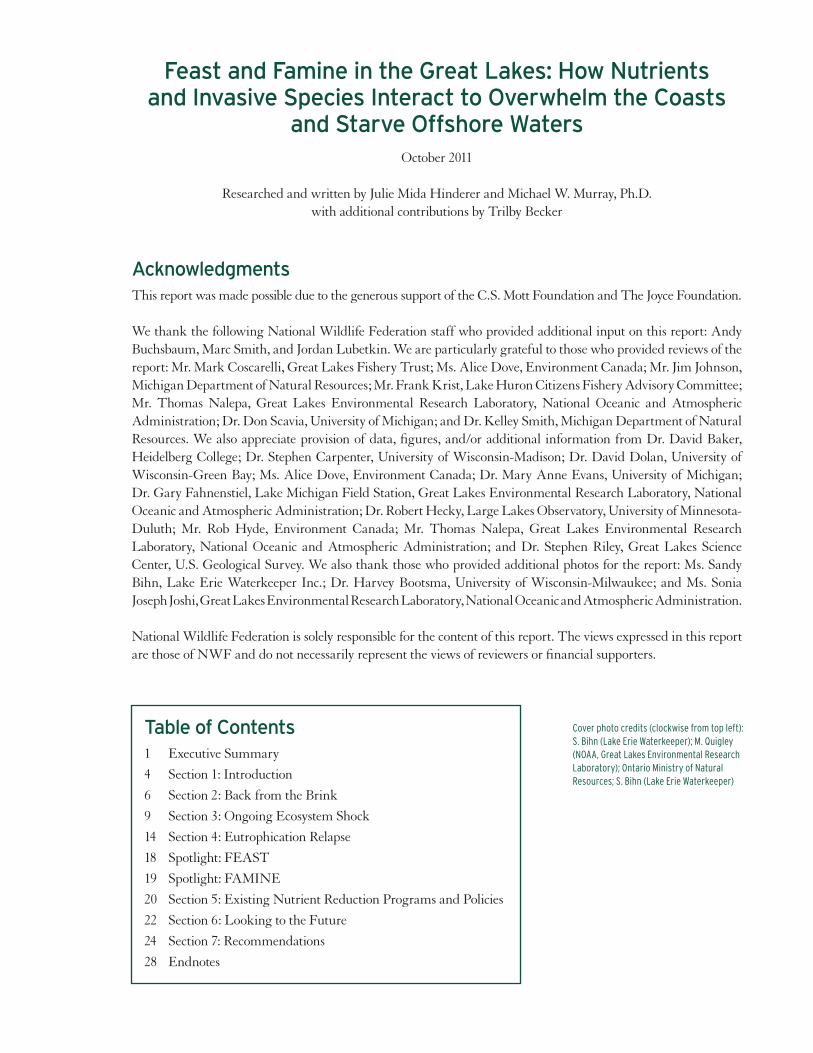
Cover photo credits (clockwise from top left): S. Bihn (Lake Erie Waterkeeper); M. Quigley (NOAA, Great Lakes Environmental Research Laboratory); Ontario Ministry of Natural Resources; S. Bihn (Lake Erie Waterkeeper)
FEAST ANd FAMINE IN THE GrEAT LAkES | 1
ExEcutivE Summary
The Great Lakes: on the road to recovery, veering close to ecosystem collapse, or both? In fact, recent research indicates the lakes have undergone profound changes over the past two decades, and ongoing changes related to various stressors threaten the ecological health of the lakes in ways unseen since human development in the region began.
In 2005, a team of Great Lakes scientists highlighted the many ongoing stressors facing the lakes, from nutrient pollution to hydrological changes to aquatic invasive species. The report, Prescription for Great Lakes Ecosystem Protection and Restoration, warned that the lakes could be facing a tipping point leading to “irreversible ecosystem changes” without urgent actions to address these and other stresses. The report highlighted many instances of Great Lakes “ecosystem breakdown,” including dramatic declines in the lower portions of the food web, particularly of a shrimp-like organism (Diporeia) in the sediments that served as an important food source for many fish species. Though exact mechanisms are not clear, it appears that the widespread colonization of lake bottoms by invasive mussels has impaired the ability of Diporeia and similar organisms to thrive (possibly through changing nutrient cycling), which in turn continues to threaten the well-being of food webs in the Great Lakes.
Six years later, ecosystem problems persist in the lakes, and in some respects have worsened. New research shows that not just Diporeia have been decimated across the lakes — so have populations of prey fish (fish consumed by larger predators). For example, in the offshore waters of Lake Huron, prey fish biomass has declined by 95% in less than 20 years. Scientists predict similar declines could occur in Lake Michigan. Researchers are still investigating the causes, but one likely factor contributing to widespread ecosystem change is the filtering activity of invasive quagga and zebra mussels. This filtering activity, which removes plankton and other suspended particles (including the nutrient phosphorus) from the water column, results in direct
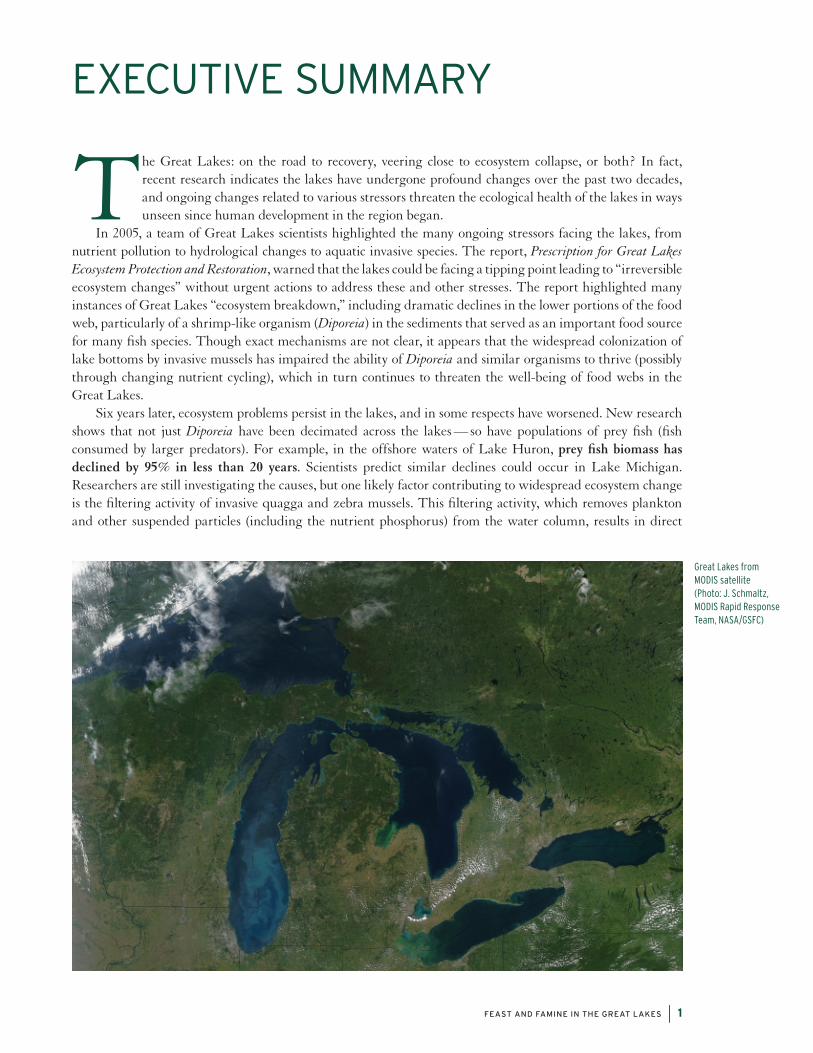
Great Lakes from MODIS satellite(Photo: J. Schmaltz, MODIS Rapid Response Team, NASA/GSFC)
2 | FEAST ANd FAMINE IN THE GrEAT LAkES
competition for food with other species and has fundamentally altered energy and nutrient flow pathways through the food web. One result is that fish in the offshore such as native lake whitefish and burbot and naturalized Chinook salmon in Lake Huron have steeply diminished in numbers and in health as their prey base is altered.
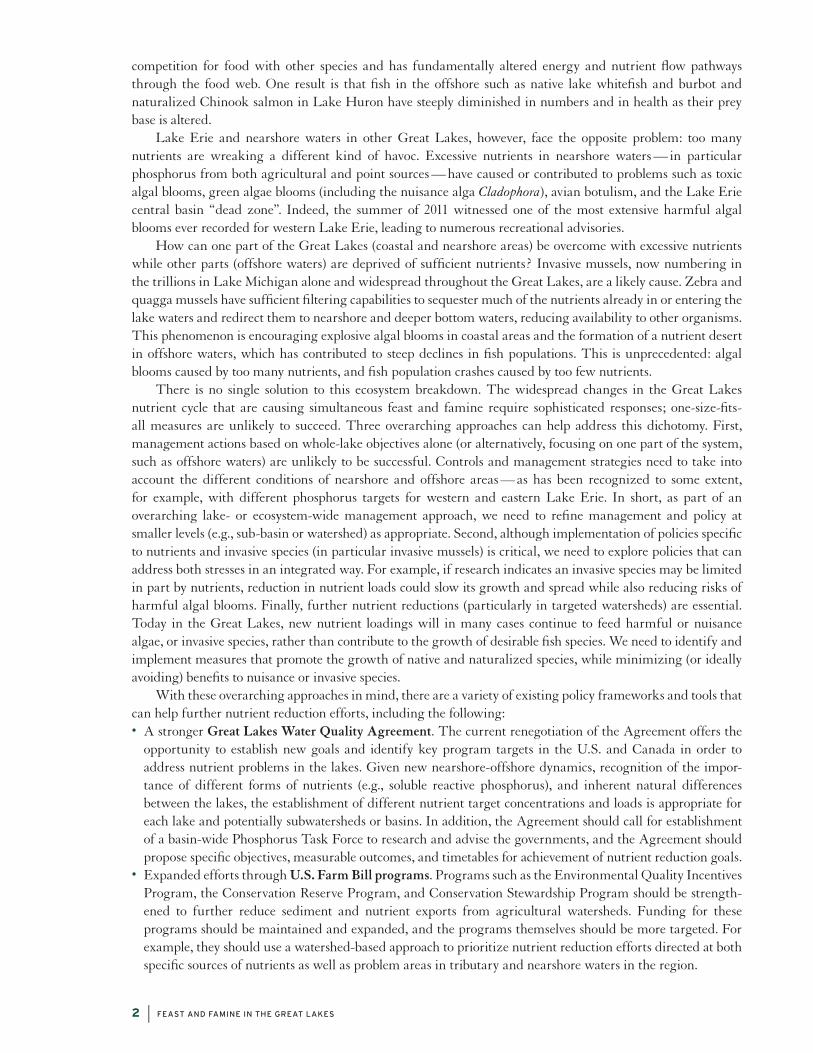
Lake Erie and nearshore waters in other Great Lakes, however, face the opposite problem: too many nutrients are wreaking a different kind of havoc. Excessive nutrients in nearshore waters — in particular phosphorus from both agricultural and point sources — have caused or contributed to problems such as toxic algal blooms, green algae blooms (including the nuisance alga Cladophora), avian botulism, and the Lake Erie central basin “dead zone”. Indeed, the summer of 2011 witnessed one of the most extensive harmful algal blooms ever recorded for western Lake Erie, leading to numerous recreational advisories.
How can one part of the Great Lakes (coastal and nearshore areas) be overcome with excessive nutrients while other parts (offshore waters) are deprived of sufficient nutrients? Invasive mussels, now numbering in the trillions in Lake Michigan alone and widespread throughout the Great Lakes, are a likely cause. Zebra and quagga mussels have sufficient filtering capabilities to sequester much of the nutrients already in or entering the lake waters and redirect them to nearshore and deeper bottom waters, reducing availability to other organisms. This phenomenon is encouraging explosive algal blooms in coastal areas and the formation of a nutrient desert in offshore waters, which has contributed to steep declines in fish populations. This is unprecedented: algal blooms caused by too many nutrients, and fish population crashes caused by too few nutrients.
There is no single solution to this ecosystem breakdown. The widespread changes in the Great Lakes nutrient cycle that are causing simultaneous feast and famine require sophisticated responses; one-size-fits-all measures are unlikely to succeed. Three overarching approaches can help address this dichotomy. First, management actions based on whole-lake objectives alone (or alternatively, focusing on one part of the system, such as offshore waters) are unlikely to be successful. Controls and management strategies need to take into account the different conditions of nearshore and offshore areas — as has been recognized to some extent, for example, with different phosphorus targets for western and eastern Lake Erie. In short, as part of an overarching lake- or ecosystem-wide management approach, we need to refine management and policy at smaller levels (e.g., sub-basin or watershed) as appropriate. Second, although implementation of policies specific to nutrients and invasive species (in particular invasive mussels) is critical, we need to explore policies that can address both stresses in an integrated way. For example, if research indicates an invasive species may be limited in part by nutrients, reduction in nutrient loads could slow its growth and spread while also reducing risks of harmful algal blooms. Finally, further nutrient reductions (particularly in targeted watersheds) are essential. Today in the Great Lakes, new nutrient loadings will in many cases continue to feed harmful or nuisance algae, or invasive species, rather than contribute to the growth of desirable fish species. We need to identify and implement measures that promote the growth of native and naturalized species, while minimizing (or ideally avoiding) benefits to nuisance or invasive species.
With these overarching approaches in mind, there are a variety of existing policy frameworks and tools that can help further nutrient reduction efforts, including the following:• A stronger Great Lakes Water Quality Agreement. The current renegotiation of the Agreement offers the
opportunity to establish new goals and identify key program targets in the U.S. and Canada in order to address nutrient problems in the lakes. Given new nearshore-offshore dynamics, recognition of the impor-tance of different forms of nutrients (e.g., soluble reactive phosphorus), and inherent natural differences between the lakes, the establishment of different nutrient target concentrations and loads is appropriate for each lake and potentially subwatersheds or basins. In addition, the Agreement should call for establishment of a basin-wide Phosphorus Task Force to research and advise the governments, and the Agreement should propose specific objectives, measurable outcomes, and timetables for achievement of nutrient reduction goals.
• Expanded efforts through U.S. Farm Bill programs. Programs such as the Environmental Quality Incentives Program, the Conservation Reserve Program, and Conservation Stewardship Program should be strength-ened to further reduce sediment and nutrient exports from agricultural watersheds. Funding for these programs should be maintained and expanded, and the programs themselves should be more targeted. For example, they should use a watershed-based approach to prioritize nutrient reduction efforts directed at both specific sources of nutrients as well as problem areas in tributary and nearshore waters in the region.
FEAST ANd FAMINE IN THE GrEAT LAkES | 3
• Use of Clean Water Act tools, with an increased focus on nutrients. These include revisions to state water quality standards (in particular water quality criteria) for nutrients, as appropriate; consideration of more stringent permit limits for municipal wastewater treat-ment plants; increased development and implementation of total maximum daily loads for nutrients; and promo-tion (and adequate funding) of Clean Water Act Section 319 projects targeted, within states, at watersheds prioritized based on nutrient impairments.
• A special emphasis on Lake Erie. This should include strengthening point source and nonpoint source control programs in the watershed, including, revisiting permit limits and enhancing education and outreach efforts on agricultural application of fertilizers.
• Targeted Great Lakes Restoration Initiative efforts. GLRI funding should be targeted in ways that emphasize nutrient reduction projects directed at watersheds prioritized based on both sources and nutrient impairments.
Similar efforts are needed on the Canadian side. These include upgrading wastewater treatment plants to reduce nutrient loads, expanding natural vegetation cover in key watersheds, and expanding the scope of and improving best management practices on agricultural lands.
While a number of efforts are needed to address ongoing nutrient problems, it is clear that increased efforts are also needed to prevent additional major ecosystem changes from aquatic invasive species. Prevention must be a cornerstone of efforts addressing major vectors, including adopting more stringent ballast water discharge standards, a more aggressive screening and control program for organisms in trade, and strong measures to address canal and waterway transfer of aquatic invasive species (including restoring the hydrological separation between the Mississippi River and Great Lakes Basins in the Chicago area.) In addition, control and eradication measures for species already established must be pursued, including innovative biocontrol measures and fishery management practices that can target species of concern with minimal risk of other negative impacts.
Finally, there is a need for increased activity and funding in two broader areas related to nutrients and invasive species. First, targeted research and monitoring efforts are needed, particularly in nearshore areas, as well as improved binational coordination of all aspects of monitoring. Increased research efforts are needed to better understand nutrient dynamics and ongoing ecosystem changes and to help inform resource managers and policy makers addressing these complex changes. Second, increased education and outreach efforts are needed to inform the public of problems associated with nutrients and invasive species, along with ways the public can contribute to solutions. These efforts should utilize the numerous existing forums well suited to conduct this work, including agency outreach, university extension, and non-profit programs.
In summary, the Great Lakes are facing feast and famine from invasive species and excessive nutrient pollution. The lakes have faced daunting environmental problems in the past; in the 1960s, Lake Erie was plagued with harmful algal blooms, and many had written it off as beyond revival. However, the concerted efforts of citizens, environmental and conservation advocates, scientists, and policy makers to implement innovative solutions succeeded in restoring the lake. The challenges are no less severe today. While it is clear that further research and monitoring are needed to better understand changes in the nutrient cycle and other lake ecosystem changes, stronger actions are needed now, and we believe a combination of targeted and holistic approaches to address nutrients and invasive species together offers great potential. The lakes remain at a tipping point, and it is time for us to join forces and develop innovative policy solutions to the feast and famine crisis that today plagues the Great Lakes.
Harmful algal bloom near Pelee Island, Lake Erie (Photo: T. Archer, NOAA, Great Lakes Environmental Research Laboratory)

4 | FEAST ANd FAMINE IN THE GrEAT LAkES
SECTION 1
introduction
The five North American Great Lakes — Superior, Michigan, Huron, Erie, and Ontario — comprise the largest freshwater system on Earth, containing nearly 20% of the available surface fresh water in the world.1 This precious natural resource is the ecological, economic, and cultural
backbone for a large region of the United States and Canada. The Great Lakes affect the lives of more than 40 million people who live in the basin and depend upon the lakes for drinking water,2 and the region’s population continues to grow. It is estimated that 30% of the population of the Great Lakes states (besides New York) resides in coastal communities.3
A diversity of plants and animals also calls the Great Lakes home. This unique freshwater system once sup-ported 180 species of fish unique to the Great Lakes, and today is home to fish such as large- and smallmouth bass, muskellunge, walleye, yellow perch, whitefish, lake trout, and lake sturgeon. The abundant green spaces and forests in the Great Lakes basin provide vital habitat to animals such as moose, wolves, bears, foxes, deer, and bald eagles.4 The unique coastal ecosystems and wetlands in the region support threatened and endangered birds such as the piping plover and the whooping crane.5
The abundant freshwater resources and wildlife of the Great Lakes form the foundation of the region’s economy. If it were its own country, The Great Lakes–St. Lawrence River region (encompassing the U.S. and Canada) would be the fourth largest economy in the world.6 Industries such as manufacturing, shipping, and commercial fishing that depend on the lakes are key components of the regional economy. In the U.S. alone, more than 1.5 million jobs are tied directly to the Great Lakes.7 Perhaps the most vital contribution of the Great Lakes to the region’s economy, however, is their importance to recreation and tourism. The unique beauty of Great Lakes shorelines is showcased through four U.S. National Lakeshores and a National Park,8 in addition to countless state and local parks and recreation areas across the basin. Recreational fishing in the Great Lakes is worth more than $7 billion annually,9 and recreational boating creates an economic impact of over $30 billion each year.10 More than 200,000 jobs in the region are supported by Great Lakes recreation and tourism.11
A healthy Great Lakes ecosystem is vital to sustain and promote the wealth of recreational opportunities in the region. Water quality and wildlife must be protected, restored and enhanced to support tourism, economic growth, and other benefits provided by the lakes. There is a long history of cooperative efforts in the U.S. and Canada to protect and restore the Great Lakes, as summarized in Section 5. Coordination was enhanced on the U.S. side in 2005, when federal agencies, governments of the eight Great Lakes states, tribes, industry and nongovernmental organizations recognized the need for a coordinated restoration effort and joined forces to create a shared vision for the lakes under the Great Lakes Regional Collaboration (GLRC) Strategy.12 Through the creation of the GLRC Strategy, the region showed that it was ready to invest in projects that would directly advance common restora-tion goals. In response, the federal government created the Great Lakes Restoration Initiative (GLRI), a five-year investment that included $475 million for restoration and protection programs in its first year.
So far, the GLRI has funded numerous projects across the basin that are restoring wildlife habitats, clean-ing up beaches, and educating the public on invasive species, to name a few.13 In addition to ecological benefits, the GLRI is providing an economic boost to the region: the Brookings Institution estimates that for every $1 invested in Great Lakes restoration, $2 of economic benefit are produced.14
FEAST ANd FAMINE IN THE GrEAT LAkES | 5
Despite this progress towards healthier Great Lakes, ecological problems remain that threaten to stall or even reverse this progress. Major threats to the lakes were highlighted in a 2005 report which noted that stresses such as invasive species, hydrologic alterations, land use changes, and nutrient loadings could interact to cause “ecosystem breakdown” in the Great Lakes, whereby resiliency is overcome and the ecosystem is pushed into a new state.15 Among the most severe of these problems are nutrients — with too much in some places, and too little in others. Excessive nutrients sicken the Great Lakes in nearshore areas by causing toxic algal blooms in shallow areas and oxygen-poor “dead zones” on lake bottoms. This serious problem, which first appeared in the mid-1900s, has returned with a vengeance. Another dire problem facing the Great Lakes is invasive species. Currently, non-native mussels are wiping out food webs in offshore areas of the lakes, turning once-productive waters with a diversity of life into lake monocultures dominated by invasive mussels. These invasive mussels are also concentrating nutrients in nearshore waters (typically defined as waters out to about 30–100 feet depth), further exacerbating algal blooms. Thus, while harmful algae in the nearshore are feasting on excess nutrients, fish populations in deep waters are fighting famine. This dangerous dichotomy requires urgent and drastic action to restore balance to the Great Lakes.
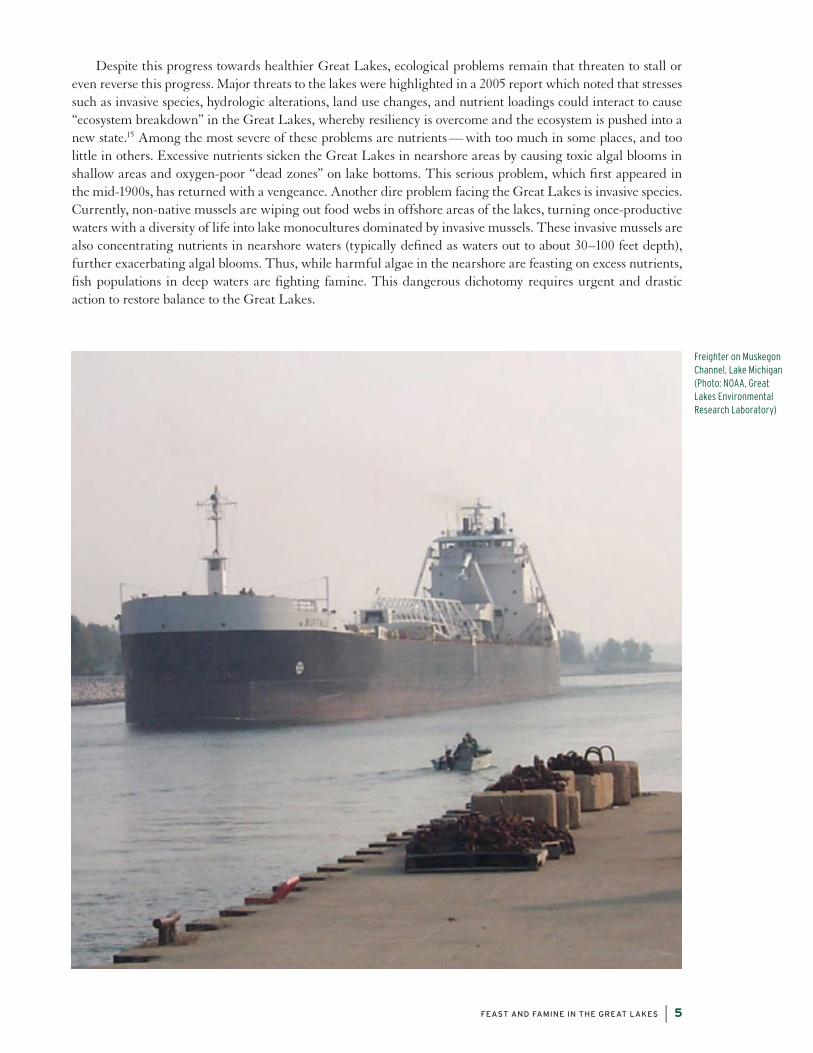
Freighter on Muskegon Channel, Lake Michigan (Photo: NOAA, Great Lakes Environmental Research Laboratory)
6 | FEAST ANd FAMINE IN THE GrEAT LAkES
SECTION 2
Back from thE Brink historical nutrient Pollution and recovery in the Great Lakes
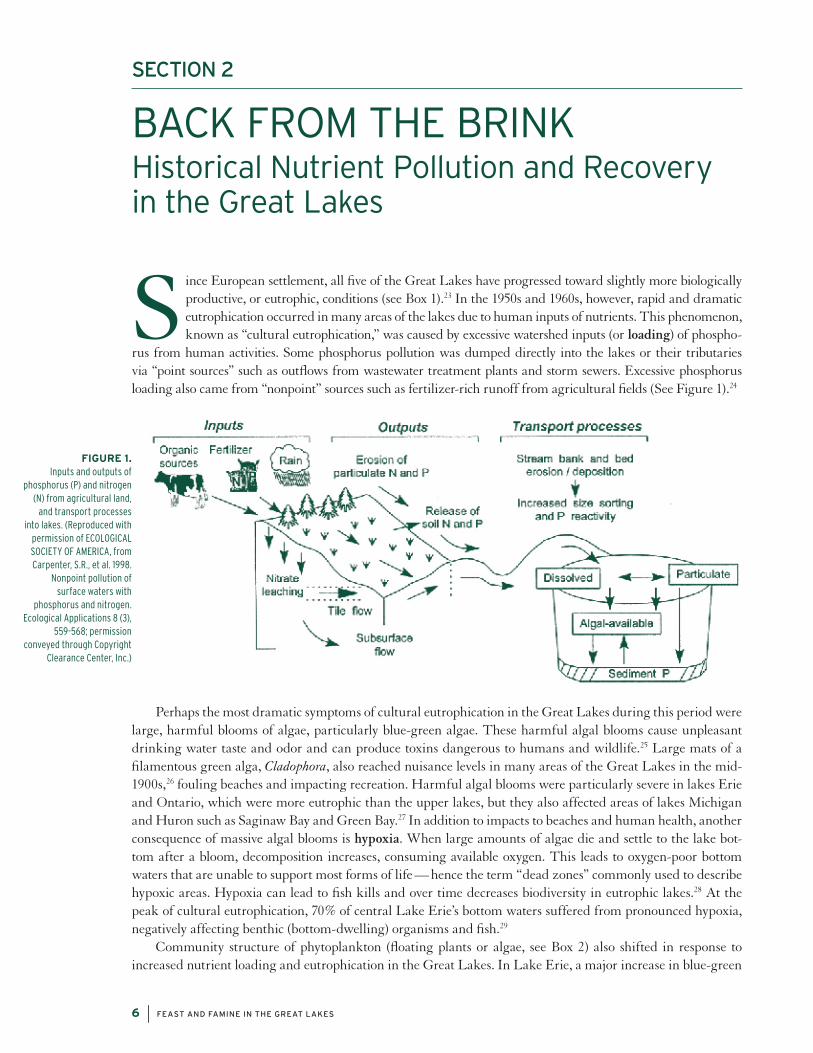
Since European settlement, all five of the Great Lakes have progressed toward slightly more biologically productive, or eutrophic, conditions (see Box 1).23 In the 1950s and 1960s, however, rapid and dramatic eutrophication occurred in many areas of the lakes due to human inputs of nutrients. This phenomenon, known as “cultural eutrophication,” was caused by excessive watershed inputs (or loading) of phospho-
rus from human activities. Some phosphorus pollution was dumped directly into the lakes or their tributaries via “point sources” such as outflows from wastewater treatment plants and storm sewers. Excessive phosphorus loading also came from “nonpoint” sources such as fertilizer-rich runoff from agricultural fields (See Figure 1).24
Perhaps the most dramatic symptoms of cultural eutrophication in the Great Lakes during this period were large, harmful blooms of algae, particularly blue-green algae. These harmful algal blooms cause unpleasant drinking water taste and odor and can produce toxins dangerous to humans and wildlife.25 Large mats of a filamentous green alga, Cladophora, also reached nuisance levels in many areas of the Great Lakes in the mid- 1900s,26 fouling beaches and impacting recreation. Harmful algal blooms were particularly severe in lakes Erie and Ontario, which were more eutrophic than the upper lakes, but they also affected areas of lakes Michigan and Huron such as Saginaw Bay and Green Bay.27 In addition to impacts to beaches and human health, another consequence of massive algal blooms is hypoxia. When large amounts of algae die and settle to the lake bot-tom after a bloom, decomposition increases, consuming available oxygen. This leads to oxygen-poor bottom waters that are unable to support most forms of life — hence the term “dead zones” commonly used to describe hypoxic areas. Hypoxia can lead to fish kills and over time decreases biodiversity in eutrophic lakes.28 At the peak of cultural eutrophication, 70% of central Lake Erie’s bottom waters suffered from pronounced hypoxia, negatively affecting benthic (bottom-dwelling) organisms and fish.29
Community structure of phytoplankton (floating plants or algae, see Box 2) also shifted in response to increased nutrient loading and eutrophication in the Great Lakes. In Lake Erie, a major increase in blue-green
Figure 1. Inputs and outputs of
phosphorus (P) and nitrogen (N) from agricultural land,
and transport processes into lakes. (Reproduced with
permission of ECOLOGICAL SOCIETY OF AMERICA, from Carpenter, S.R., et al. 1998.
Nonpoint pollution of surface waters with
phosphorus and nitrogen. Ecological Applications 8 (3),
559-568; permission conveyed through Copyright
Clearance Center, Inc.)
FEAST ANd FAMINE IN THE GrEAT LAkES | 7
algae, which are well-suited to eutrophic conditions, occurred.34 Changes in benthic communities also occurred in response to eutrophication. Declines in water and sedi-ment quality in western Lake Erie caused populations of the mayfly Hexagenia, once the most dominant benthic invertebrate, to disappear beginning in the late 1950s.35
The serious ecological and economic impacts of cultural eutrophication were well-documented by the scientific commu-nity in the 1960s, and the media brought the issue to the public’s attention. In response, the governments of the U.S. and Canada signed the landmark Great Lakes Water Quality Agreement (GLWQA) in 1972. In the agreement, the two countries pledged to solve the eutrophication problem by reduc-ing loads of the nutrient phosphorus to the lakes, primarily through controls of point sources such as discharges from wastewa-ter treatment plants. In addition, both the U.S. and Canada passed federal legislation and formed new agencies to implement and
BOx 1: TrOpHIC STATES
The five Great Lakes historically vary in their “trophic states.” a body of water’s trophic state represents its biological productivity, which is primarily controlled by the availability of nutrients such as phosphorus and nitrogen.16 these nutrients limit primary production, which is the growth of phytoplankton and other plants (often assessed by measuring the amount of chlorophyll a in the water). in the Great Lakes, phosphorus is the nutrient that limits biological activity under most conditions.17 Primary production in turn limits secondary pro-duction at higher trophic levels, or higher levels of the food web, such as fish. Thus, lakes with fewer nutrients will be less productive overall, or at lower trophic states, than those with more nutrients.
In general, lakes are classified using three trophic states: oligotrophic, mesotrophic, or eutrophic. Oligotrophic lakes (such as Lake Superior) have very low nutrient concentrations and thus low primary productivity. Water in oligotrophic lakes is very clear. Mesotrophic lakes are more productive than oligotrophic lakes, and have moder-ately clear water. Eutrophic lakes (such as Lake Erie) have the highest concentrations of nutrients and thus the most productivity. the dense growth of phytoplankton in eutrophic lakes causes their water to be murkier. the algae community in eutrophic lakes tends to have a larger abundance (especially in warmer months) of blue-green algae (more formally cyanobacteria), which can sometimes produce toxins. these three trophic state classifications are useful, but in reality, lakes fall along a continuous spectrum of productivity; thus, they can be described using terms such as “ultra-oligotrophic,” “meso-eutrophic,” or “hyper-eutrophic.”18
In the absence of human influences, the physical qualities of the Great Lakes (such as their depth, temperature, and geologic setting) and the characteristics of their watersheds determined their trophic state. deep, cold lakes such as Lake Superior and Lake huron were historically oligotrophic.19 Lake Erie, on the other hand, is much warmer and shallower and as a result is more productive (even in the absence of human activities).20 of course, the Great Lakes are complex bodies of water with distinct basins and embayments that often have differ-ent trophic states than their open waters. for example, Lake huron’s Saginaw Bay tends towards mesotrophic or even eutrophic conditions, even though most of the lake is oligotrophic.21 Similarly, nearshore waters of lakes michigan, Erie, and ontario tend to be more eutrophic than offshore areas.22
BOx 2: GrEAT LAkES FOOd WEBS
to appreciate the scope of recent changes in Great Lakes food webs and nutrient dynamics, it is important to under-stand the structure of food webs and their historic condi-tions. Prior to major species invasions, the Great Lakes pelagic (open water) fish community was dominated by lake trout and burbot — piscivorous predators (fish that prey upon other fish) that fed in deep waters on small forage (or prey) fishes such as lake herring, deepwater ciscoes, and bloaters.30 in shallower, nearshore areas of the Great Lakes, the fish community was dominated by smallmouth and largemouth bass, muskellunge, northern pike, walleye, yellow perch, and smaller fishes such as emerald and spot-tail shiners.31
At the base of historic food webs, fish production has histor-ically been supported by large populations of benthic mac-roinvertebrates (small, bottom-dwelling crustaceans and insects), dominated by the amphipod Diporeia.32 Diporeia was vital to the diets of many fish species and was preyed upon by most Great Lakes fishes at some point in their life cycle.33 Pelagic forage fishes also graze on zooplankton (tiny animals that swim in the water column) that in turn feed on phytoplankton (microscopic floating plants).
8 | FEAST ANd FAMINE IN THE GrEAT LAkES
enforce environmental laws protecting water quality. Phase-outs and bans on phosphorus in laundry detergents were enacted by the federal government in Canada and by individual U.S. municipalities and states in the 1970s and 1980s. Revisions to the GLWQA in 1978 recognized the importance of nonpoint sources of nutrient load-ing and the need for programs (such as addressing agricultural practices and urban runoff) to address these sources.36 (For more information on policy efforts to reduce phosphorus pollution, see Section 5.)
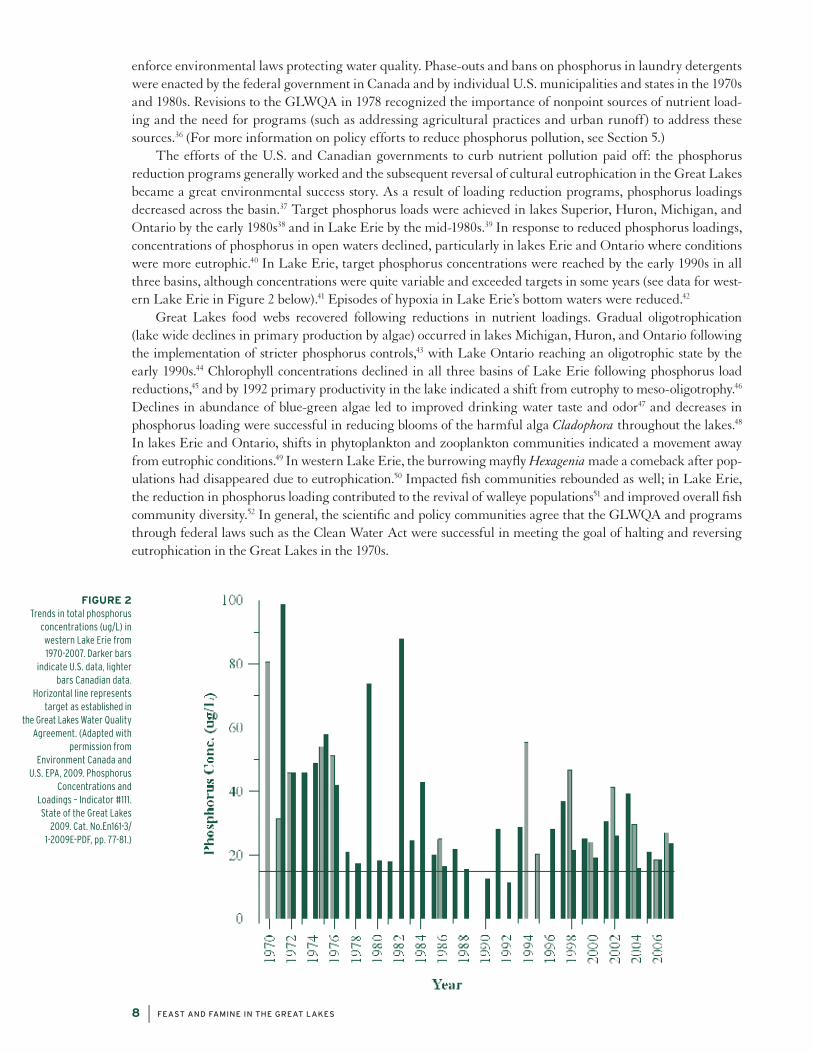
The efforts of the U.S. and Canadian governments to curb nutrient pollution paid off: the phosphorus reduction programs generally worked and the subsequent reversal of cultural eutrophication in the Great Lakes became a great environmental success story. As a result of loading reduction programs, phosphorus loadings decreased across the basin.37 Target phosphorus loads were achieved in lakes Superior, Huron, Michigan, and Ontario by the early 1980s38 and in Lake Erie by the mid-1980s.39 In response to reduced phosphorus loadings, concentrations of phosphorus in open waters declined, particularly in lakes Erie and Ontario where conditions were more eutrophic.40 In Lake Erie, target phosphorus concentrations were reached by the early 1990s in all three basins, although concentrations were quite variable and exceeded targets in some years (see data for west-ern Lake Erie in Figure 2 below).41 Episodes of hypoxia in Lake Erie’s bottom waters were reduced.42
Great Lakes food webs recovered following reductions in nutrient loadings. Gradual oligotrophication (lake wide declines in primary production by algae) occurred in lakes Michigan, Huron, and Ontario following the implementation of stricter phosphorus controls,43 with Lake Ontario reaching an oligotrophic state by the early 1990s.44 Chlorophyll concentrations declined in all three basins of Lake Erie following phosphorus load reductions,45 and by 1992 primary productivity in the lake indicated a shift from eutrophy to meso-oligotrophy.46 Declines in abundance of blue-green algae led to improved drinking water taste and odor47 and decreases in phosphorus loading were successful in reducing blooms of the harmful alga Cladophora throughout the lakes.48 In lakes Erie and Ontario, shifts in phytoplankton and zooplankton communities indicated a movement away from eutrophic conditions.49 In western Lake Erie, the burrowing mayfly Hexagenia made a comeback after pop-ulations had disappeared due to eutrophication.50 Impacted fish communities rebounded as well; in Lake Erie, the reduction in phosphorus loading contributed to the revival of walleye populations51 and improved overall fish community diversity.52 In general, the scientific and policy communities agree that the GLWQA and programs through federal laws such as the Clean Water Act were successful in meeting the goal of halting and reversing eutrophication in the Great Lakes in the 1970s.
Figure 2 Trends in total phosphorus
concentrations (ug/L) in western Lake Erie from 1970-2007. Darker bars
indicate U.S. data, lighter bars Canadian data.
Horizontal line represents target as established in
the Great Lakes Water Quality Agreement. (Adapted with
permission from Environment Canada and
U.S. EPA, 2009. Phosphorus Concentrations and
Loadings – Indicator #111. State of the Great Lakes
2009. Cat. No.En161-3/ 1-2009E-PDF, pp. 77-81.)
FEAST ANd FAMINE IN THE GrEAT LAkES | 9
SECTION 3
onGoinG EcoSyStEm Shockinvasive Species in the Great Lakes
Even before excess nutrient loading caused cultural eutrophication across the Great Lakes, humans were polluting the ecosystem in another way: through the introduction of non-native species.53 This section details two chapters in the history of invasive species in the Great Lakes: top-down food web changes caused by several invasive species that affected fish communities, and bottom-up shifts caused
by invaders that have altered the base of the food web. It is important to note that in analyzing some food web changes, it is difficult to separate the effects of reduced nutrient loading from the impacts of invasive species because these changes were occurring simultaneously.54
Early invasions alter the fish communityGreat lakes fish communities have undergone many drastic changes since human settlement of the region. Fish populations in particular were heavily impacted by several non-native species introductions that began in the mid- to late 1800s. The invasion of the sea lamprey, a species present in Lake Ontario as early as 1835 (and pos-sibly native to the lake) that spread to Lake Erie by 1921, likely had the greatest impact on fish populations.55 Sea lampreys are parasitic, eel-like fishes that attach to other fish and feed on their blood and bodily fluids; one adult sea lamprey can kill up to 40 pounds of fish in as little as a year. Sea lamprey predation, combined with commercial overharvesting (and in some cases other factors such as toxic contaminants56), led to the collapse of populations of native lake trout, burbot, and lake whitefish in the mid-1900s.57
The decline in abundance of top predators allowed populations of the alewife — a small, invasive forage fish that eats zooplankton — to grow unchecked. Alewives, native to the Atlantic coast of the United States, prob-ably invaded the Great Lakes through the Erie Canal and were common in Lake Ontario by 1873, although some scientists believe they were native to that lake.58 The opening of the Welland Canal between Lake Ontario and Lake Erie in 1829 allowed alewives to invade the rest of the Great Lakes, and they spread to Lake Superior by 1954.59 Following the collapse of lake trout that preyed upon alewives, their abundance increased dramati-cally in lakes Michigan and Huron; these large populations of alewives and rainbow smelt, another introduced species, caused declines in native prey fishes such as lake herring and deepwater ciscoes.60 Massive alewife die-offs in the 1960s resulted in carcasses washing ashore in huge numbers, impacting recreational activities.61 In response to the alewife explosion, large-scale stocking of salmonids such as Coho and Chinook salmon was initiated in the 1960s to control nuisance levels of alewives and to establish a sport fishery.62 These efforts were largely successful, leveling off alewife populations and launching a successful recreational fishery centered on introduced salmon.63 In general, Great Lakes offshore fish communities have shifted from being dominated by deep-dwelling piscivores (e.g., lake trout) and native forage fishes (e.g., lake herring) to communities often dominated by introduced species that inhabit shallower waters.64
Although many nearshore areas of the Great Lakes still support strong recreational fisheries,65 fish com-munities in the nearshore have also been impacted by invasive species. Alewife interference with reproduc-tion was blamed for declines in populations of walleye and yellow perch between the 1950s and 1970s.66 The invasive round goby, first discovered in the Great Lakes in 1990,67 is an aggressive bottom-dwelling fish that can tolerate a wide range of environmental conditions, eat a variety of foods including invasive mussels, and spawn prolifically.68 Round gobies have the potential to negatively impact native fish species by competing for food and habitat and interfering with reproduction; for example, gobies were blamed for the local extirpa-tion of the mottled sculpin in Calumet Harbor, Lake Michigan.69 The Eurasian ruffe, an invasive perch-like
10 | FEAST ANd FAMINE IN THE GrEAT LAkES
fish, was found in Lake Superior in 1986 and rapidly became the most abundant fish in the St. Louis River estuary.70 Since its introduction, the ruffe has become established in parts of Lake Michigan (Green Bay) and Lake Huron (Thunder Bay).71 If the Eurasian ruffe becomes established in Lake Erie, it could have disastrous impacts on economically important walleye and perch fisheries.72
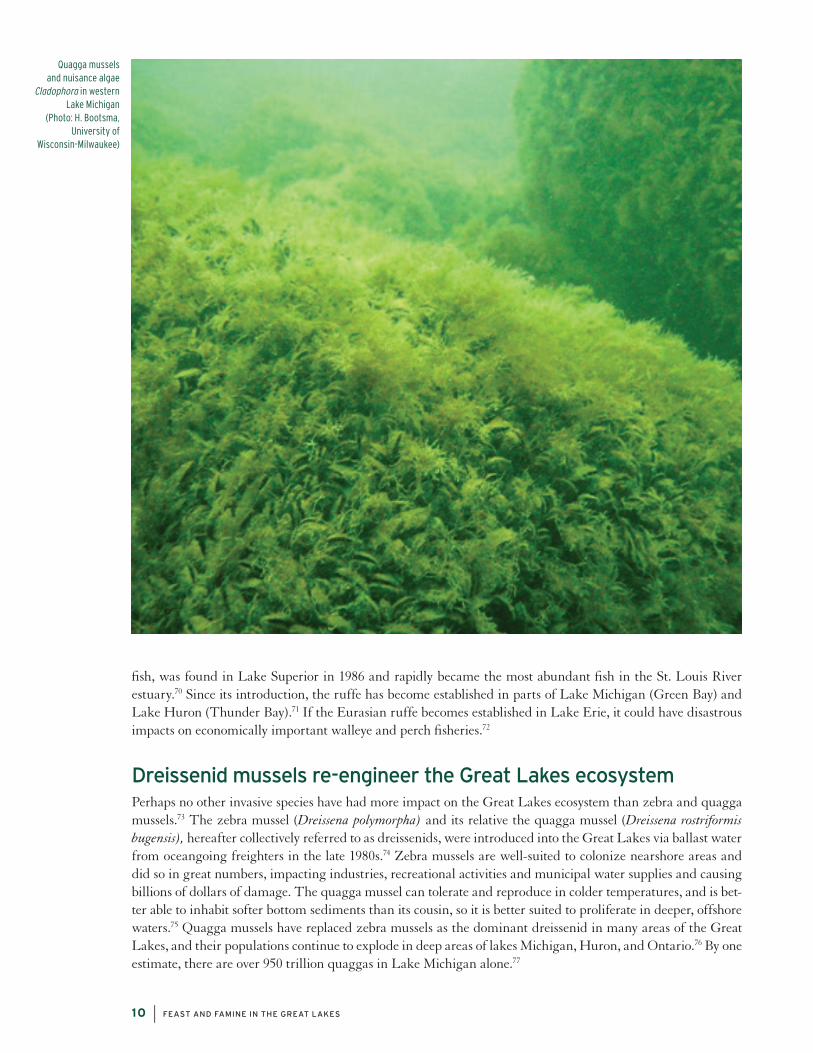
dreissenid mussels re-engineer the Great Lakes ecosystemPerhaps no other invasive species have had more impact on the Great Lakes ecosystem than zebra and quagga mussels.73 The zebra mussel (Dreissena polymorpha) and its relative the quagga mussel (Dreissena rostriformis bugensis), hereafter collectively referred to as dreissenids, were introduced into the Great Lakes via ballast water from oceangoing freighters in the late 1980s.74 Zebra mussels are well-suited to colonize nearshore areas and did so in great numbers, impacting industries, recreational activities and municipal water supplies and causing billions of dollars of damage. The quagga mussel can tolerate and reproduce in colder temperatures, and is bet-ter able to inhabit softer bottom sediments than its cousin, so it is better suited to proliferate in deeper, offshore waters.75 Quagga mussels have replaced zebra mussels as the dominant dreissenid in many areas of the Great Lakes, and their populations continue to explode in deep areas of lakes Michigan, Huron, and Ontario.76 By one estimate, there are over 950 trillion quaggas in Lake Michigan alone.77
Quagga mussels and nuisance algae
Cladophora in western Lake Michigan
(Photo: H. Bootsma, University of
Wisconsin-Milwaukee)
FEAST ANd FAMINE IN THE GrEAT LAkES | 11
Invasive dreissenid mussels impact the Great Lakes ecosystem via several mechanisms. With their large populations and ability to filter water at volumes and rates much greater than native grazers,78 dreissenids can significantly decrease phytoplankton abundance and thus primary productivity.79 This filtration can lead to drastic increases in water clarity,80 a change that — while often welcomed by humans who use the Great Lakes — can have serious implications for the ecosystem (discussed in more detail below). In addition to influ-encing algal primary production, dreissenid mussel filtering and waste-producing processes have significantly altered nutrient cycling and dynamics in large areas of the Great Lakes.81 Although dreissenids can increase the availability of nitrogen in the environment,82 their impacts on phosphorus dynamics are of more interest because phosphorus is usually the limiting factor for algal growth in the Great Lakes.83 Depending on environmental conditions such as existing nutrient levels in the water column, dreissenids can sometimes retain phosphorus and nitrogen in their tissues at relatively constant concentrations84 and can therefore reduce open-water phos-phorus concentrations.85 Given their huge populations, large quantities of phosphorus are locked in dreissenid tissues, with some permanently sequestered in the shells of dead mussels.86 Recent research suggests that up to two-thirds of the entire phosphorus inventory in Lake Michigan is tied up in quagga mussels.87 Environment Canada and the U.S. Environmental Protection Agency (EPA) report that current offshore phosphorus con-centrations in lakes Michigan, Huron, and Ontario may be too low to support healthy levels of biological pro-ductivity.88 As discussed more fully below, however, in shallower nearshore areas dreissenids tend to regenerate soluble forms of the nutrient through excretion and waste egestion, making usable forms more available in the water column.89 Direct filtration, increased water clarity, and changes to nutrient dynamics all contribute to food web impacts of dreissenid grazing.90
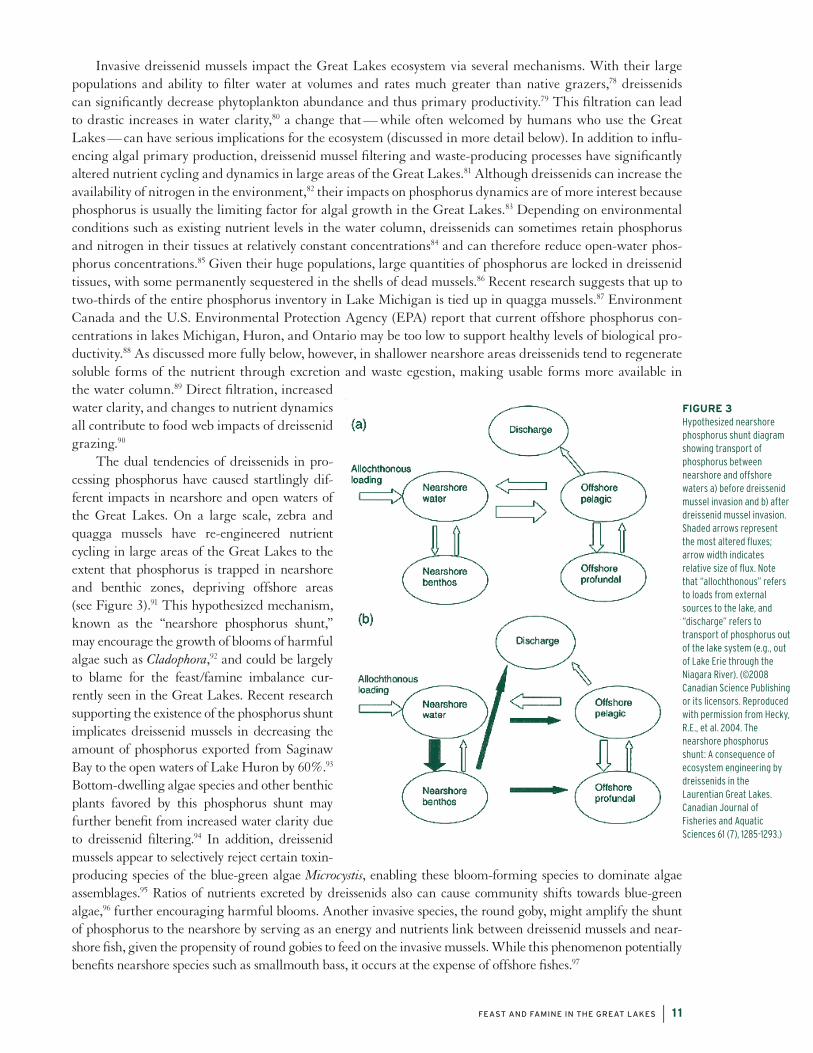
The dual tendencies of dreissenids in pro-cessing phosphorus have caused startlingly dif-ferent impacts in nearshore and open waters of the Great Lakes. On a large scale, zebra and quagga mussels have re-engineered nutrient cycling in large areas of the Great Lakes to the extent that phosphorus is trapped in nearshore and benthic zones, depriving offshore areas (see Figure 3).91 This hypothesized mechanism, known as the “nearshore phosphorus shunt,” may encourage the growth of blooms of harmful algae such as Cladophora,92 and could be largely to blame for the feast/famine imbalance cur-rently seen in the Great Lakes. Recent research supporting the existence of the phosphorus shunt implicates dreissenid mussels in decreasing the amount of phosphorus exported from Saginaw Bay to the open waters of Lake Huron by 60%.93 Bottom-dwelling algae species and other benthic plants favored by this phosphorus shunt may further benefit from increased water clarity due to dreissenid filtering.94 In addition, dreissenid mussels appear to selectively reject certain toxin-producing species of the blue-green algae Microcystis, enabling these bloom-forming species to dominate algae assemblages.95 Ratios of nutrients excreted by dreissenids also can cause community shifts towards blue-green algae,96 further encouraging harmful blooms. Another invasive species, the round goby, might amplify the shunt of phosphorus to the nearshore by serving as an energy and nutrients link between dreissenid mussels and near-shore fish, given the propensity of round gobies to feed on the invasive mussels. While this phenomenon potentially benefits nearshore species such as smallmouth bass, it occurs at the expense of offshore fishes.97
Figure 3 Hypothesized nearshore phosphorus shunt diagram showing transport of phosphorus between nearshore and offshore waters a) before dreissenid mussel invasion and b) after dreissenid mussel invasion. Shaded arrows represent the most altered fluxes; arrow width indicates relative size of flux. Note that “allochthonous” refers to loads from external sources to the lake, and “discharge” refers to transport of phosphorus out of the lake system (e.g., out of Lake Erie through the Niagara River). (©2008 Canadian Science Publishing or its licensors. Reproduced with permission from Hecky, R.E., et al. 2004. The nearshore phosphorus shunt: A consequence of ecosystem engineering by dreissenids in the Laurentian Great Lakes. Canadian Journal of Fisheries and Aquatic Sciences 61 (7), 1285-1293.)
12 | FEAST ANd FAMINE IN THE GrEAT LAkES
The ability of dreissenids to consume large quantities of phytoplankton, and to alter nutrient cycling, has had major impacts on both nearshore and offshore food webs. Dreissenid mussels are implicated in the collapse of the benthic amphipod Diporeia across the lakes, although exact causal mechanisms are unclear.98 Populations of Diporeia, once a vital part of the diets of many Great Lakes offshore fishes and more than 70% of benthic biomass in deep parts of the Great Lakes,99 have all but disappeared in shallow areas of lakes Michigan, Huron, and Ontario and are extremely depressed in deeper offshore zones.100 Diporeia now appears to be completely absent from Lake Erie.101 It is hypothesized that dreissenid filtering may cause food limitation in Diporeia, which relies on phytoplankton blooms settling to the lake bottom.102 Another theory is that mussel waste prod-ucts are toxic to Diporeia.103 Declines in populations of other benthic invertebrates, while likely partially due to decreased nutrient loads, are also linked to the invasion of dreissenid mussels.104 Changes in the benthic commu-nity, in particular the disappearance of Diporeia, have already begun to impact fish populations. Declines in the condition of fishes such as alewives,105 deepwater sculpin,106 and the commercially important lake whitefish107 have been observed.
BOx 3: OTHEr prESSurES ON GrEAT LAkES FOOd WEBS
in addition to impacts on nutrient dynamics and food webs discussed in this section, dreissenid mussels impact the Great Lakes ecosystem in numerous other ways. They can serve as “physical ecosystem engineers,” altering the structure of the lakebed and impacting habitats for other species.116 dreissenids can attach to the shells of native mussels, which has caused extirpation of the latter in many areas of the Great Lakes.117 dreissenids are also implicated in a phenomenon known as “invasional meltdown,” whereby they facilitate the invasion of other species; for example, dreissenids created better conditions for the round goby to establish and proliferate.118 Zebra and quagga mussels have become integrated into food webs in some areas of the Great Lakes, altering pathways for the transfer of energy, nutrients, and contaminants to higher trophic levels. in some cases, native species such as smallmouth bass and whitefish can benefit indirectly from this integration of invasive dreisse-nids into food webs;119 overall, however, the invasion of dreissenids has resulted in declines in the condition of Great Lakes fishes.120 invasive mussels and round gobies are also implicated in outbreaks of botulism that kill wildlife, discussed in more detail in Section 4.
While invasive dreissenids alter nutrient cycling and reduce primary production, Great Lakes food webs are also changing in response to other drivers. Large invasive, predatory zooplankton such as the fishhook waterflea
(Cercopagis pengoi ) and the spiny waterflea (Bythotrephes longimanus ) are placing additional pressure on food webs. Cercopagis has impacted the Lake Ontario food web through predation pressure and by shifting zooplank-ton spatial distribution.121 in lakes michigan, huron, and Erie, the invasion of Bythotrephes has caused drastic declines in the abundance of some zooplankton species and a decrease in overall species diversity.122 in Lake Huron, consumption of zooplankton by Bythotrephes can exceed that due to fish and the opossum shrimp (Mysis
diluviana) combined; the latter is an important food source for a number of fish species.123 Both Bythotrephes
and Cercopagis are implicated in recent declines in populations of Mysis in Lake ontario.124 Whereas historical Great Lakes zooplankton communities were dominated by herbivorous species that fed mostly on phytoplank-ton,125 invasive predatory cladocerans, which are not a good food resource for fish, compete with fish and native invertebrates for zooplankton resources and are clearly capable of altering food webs.
invasive species also have the potential to place pressure on Great Lakes food webs via wetlands. coastal wetlands are being invaded by plants such as the common reed (Phragmites australis),126 reed canary grass (Phalaris arundinacea),127 purple loosestrife (Lythrum salicaria),128 and curly pondweed (Potamogeton crispus)129 that crowd out native plants and decrease the quality and availability of habitat for wildlife. Great Lakes coastal wetlands are important to the health of food webs, serving as crucial habitat for many fish species during early stages of their life cycles.130 Some of these invasive plant species can even alter the function of the wet-lands themselves; for example, Phragmites can “dry up” areas it invades.131 curly pondweed can increase phos-phorus concentrations in surrounding waters, encouraging nearshore algal blooms.132 currently, according to Environment Canada and the U.S. EPA, coastal wetland plant communities are in only “fair” condition in lakes michigan, huron, and Erie, with Lake Erie’s status deteriorating. Lake ontario’s coastal wetland communities are deemed to be in “poor” status.133 if coastal wetlands continue to be lost and degraded due to invasive species and other human-induced stressors, Great Lakes food webs will be further impacted.
FEAST ANd FAMINE IN THE GrEAT LAkES | 13
While the symptoms of nutrient pollution and dreissenid ecosystem engineering are manifested by the increased prevalence of harmful algal blooms in the nearshore (see Section 4), the picture is much different in offshore regions of the Great Lakes. Quagga mussel filtering caused dramatic reductions in spring primary production in the offshore regions of lakes Michigan and Huron beginning in the early to mid-2000s when this species became abundant in this region (see Plot 4, pg. 19).108 Although gradual, long-term oligotrophication resulting from nutrient controls was anticipated,109 this rapid oligotrophication in response to dreissenids has taken the scientific community by surprise. The spring diatom bloom has all but disappeared and the pelagic zones of lakes Michigan and Huron now resemble ultra-oligotrophic Lake Superior.110 The zooplankton com-munity, which once relied on the spring diatom bloom as an important food source, has responded with drastic declines in abundance and shifts in community structure.111 As the foundations of the Great Lakes food web are eroded, fish communities are unable to sustain themselves. In Lake Huron, populations of deepwater prey fishes, including bloaters, sculpin, and smelt, have dramatically declined (see Plot 5, pg. 19),112 contributing to the collapse of populations of Chinook salmon, an important sport fish.113
Although the impacts of dreissenid mussels on nutrient dynamics, primary production, and food webs are not yet fully understood, it is clear that these invasive organisms have caused a significant, and perhaps perma-nent, ecosystem shift in the Great Lakes. As described previously, dreissenids have shifted energy, nutrients, and production to benthic and nearshore areas of the Great Lakes.114 Research also indicates that invasive mussels have “decoupled” the relationship between total phosphorus loads and chlorophyll (a proxy for primary produc-tion).115 Thus, changes in phosphorus loading in Great Lakes waters may no longer result in a predictable, cor-responding response from algae populations throughout the lakes. This alteration of the phosphorus-chlorophyll relationship, driven by invasive dreissenid mussels, further explains how Great Lakes offshore food webs can be collapsing in response to reduced primary production and nutrient depravation even while nearshore areas show symptoms of eutrophication.
These breakdowns are made worse by the incredibly fast rate at which dreissenids are driving ecosystem change. In the past, changes such as cultural eutrophication from nutrient pollution took decades to manifest; now, we are seeing dramatic alterations of the Great Lakes food web occurring in the space of several years. If these rapid ecosystem changes caused by dreissenids were not enough, other invasive species (including preda-tory zooplankton) have also been affecting food webs in the Great Lakes (see Box 3). In addition to these eco-system changes, invasive species are having both direct and indirect effects on the region’s economy (see Box 4).
BOx 4: ECONOMIC IMpACTS OF drEISSENId-drIvEN FOOd WEB CHANGES
In addition to their serious ecological impacts, zebra and quagga mussels have had major economic conse-quences in the Great Lakes. The invasive mussels clog water intake pipes in huge numbers, impacting power plants, municipal water suppliers, and other users.134 Between 1993 and 1999, zebra mussels are estimated to have cost the power industry in the U.S. $3.1 billion, and significant impacts to other sectors have also been seen. 135 Zebra mussels have also impacted recreation and tourism around the Great Lakes basin, fouling boats and docks and washing up on beaches in huge numbers.136 a recent study estimated losses to the region associ-ated with ship-borne invasive species broadly to be at least $200 million annually.137
the indirect economic effects of dreissenid mussel invasion may be even more severe than the direct impacts to infrastructure and beaches. Food web changes (likely caused in large part by dreissenid filtering) contributed to the collapse of the Lake Huron Chinook salmon fishery in the mid-2000s. Coastal communities and busi-nesses such as charter boat companies and tackle shops around the Lake huron basin were hit hard by the loss of this important fishery. The Michigan Department of Natural Resources estimates that 10 ports in Michigan alone have lost more than $19 million annually since 2004 as a direct result of the chinook salmon collapse.138 fishery scientists are beginning to see warning signs that a similar chinook salmon collapse could occur in Lake Michigan, and managers are seeking ways to manage effects of a declining forage base. The economic ramifica-tions of a salmon collapse on Lake Michigan would be severe: in 2009 alone, the fishery brought over $32 million to coastal communities around the lake.139
14 | FEAST ANd FAMINE IN THE GrEAT LAkES
SECTION 4
EutroPhication rELaPSEcurrent nutrient and Water Quality trends and issues
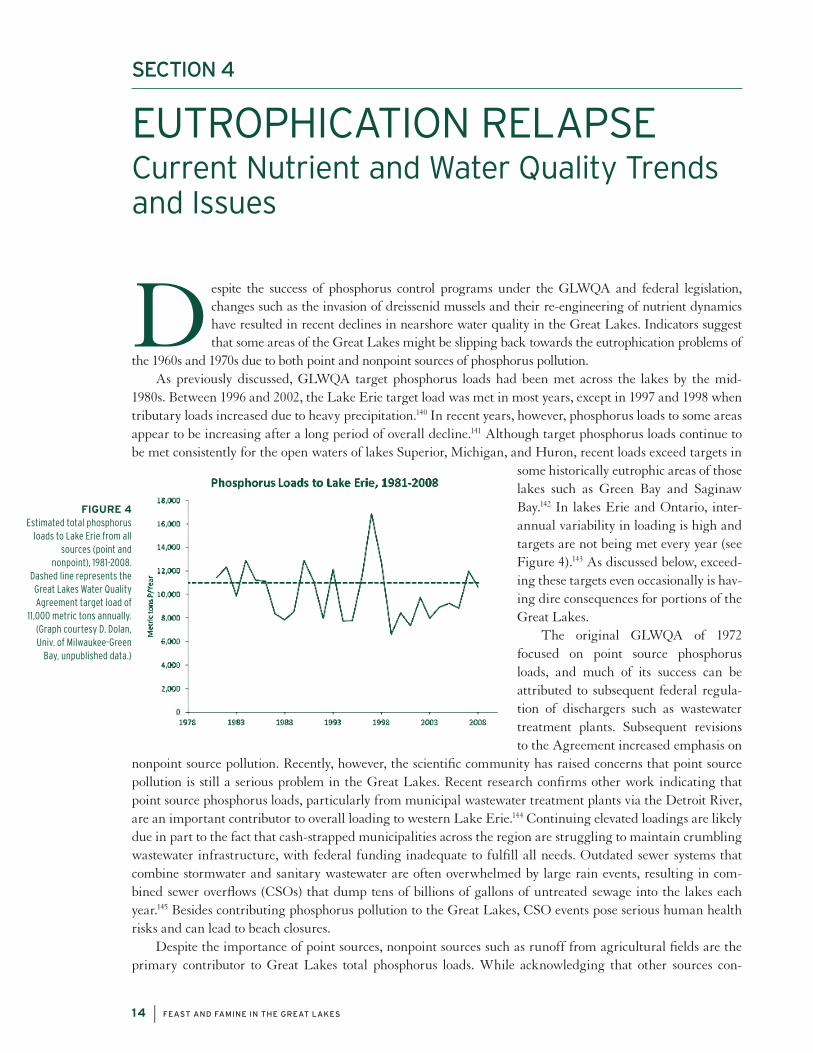
Despite the success of phosphorus control programs under the GLWQA and federal legislation, changes such as the invasion of dreissenid mussels and their re-engineering of nutrient dynamics have resulted in recent declines in nearshore water quality in the Great Lakes. Indicators suggest that some areas of the Great Lakes might be slipping back towards the eutrophication problems of
the 1960s and 1970s due to both point and nonpoint sources of phosphorus pollution.As previously discussed, GLWQA target phosphorus loads had been met across the lakes by the mid-
1980s. Between 1996 and 2002, the Lake Erie target load was met in most years, except in 1997 and 1998 when tributary loads increased due to heavy precipitation.140 In recent years, however, phosphorus loads to some areas appear to be increasing after a long period of overall decline.141 Although target phosphorus loads continue to be met consistently for the open waters of lakes Superior, Michigan, and Huron, recent loads exceed targets in
some historically eutrophic areas of those lakes such as Green Bay and Saginaw Bay.142 In lakes Erie and Ontario, inter-annual variability in loading is high and targets are not being met every year (see Figure 4).143 As discussed below, exceed-ing these targets even occasionally is hav-ing dire consequences for portions of the Great Lakes.
The original GLWQA of 1972 focused on point source phosphorus loads, and much of its success can be attributed to subsequent federal regula-tion of dischargers such as wastewater treatment plants. Subsequent revisions to the Agreement increased emphasis on
nonpoint source pollution. Recently, however, the scientific community has raised concerns that point source pollution is still a serious problem in the Great Lakes. Recent research confirms other work indicating that point source phosphorus loads, particularly from municipal wastewater treatment plants via the Detroit River, are an important contributor to overall loading to western Lake Erie.144 Continuing elevated loadings are likely due in part to the fact that cash-strapped municipalities across the region are struggling to maintain crumbling wastewater infrastructure, with federal funding inadequate to fulfill all needs. Outdated sewer systems that combine stormwater and sanitary wastewater are often overwhelmed by large rain events, resulting in com-bined sewer overflows (CSOs) that dump tens of billions of gallons of untreated sewage into the lakes each year.145 Besides contributing phosphorus pollution to the Great Lakes, CSO events pose serious human health risks and can lead to beach closures.
Despite the importance of point sources, nonpoint sources such as runoff from agricultural fields are the primary contributor to Great Lakes total phosphorus loads. While acknowledging that other sources con-
Figure 4 Estimated total phosphorus
loads to Lake Erie from all sources (point and
nonpoint), 1981-2008. Dashed line represents the Great Lakes Water Quality Agreement target load of
11,000 metric tons annually. (Graph courtesy D. Dolan, Univ. of Milwaukee-Green
Bay, unpublished data.)

FEAST ANd FAMINE IN THE GrEAT LAkES | 15
tribute to nutrient pollution, scientists recog-nize that a majority of phosphorus loading to areas like Saginaw Bay and western Lake Erie come from agricultural nonpoint runoff,146 and some experts recommend focusing efforts and resources on reducing loads from these sources to maximize water quality improve-ment.147 The lack of systematic declines in total phosphorus loading in some areas of the Great Lakes — and potential recent increases — dis-cussed above are largely due to inadequate agricultural practices to control phosphorus pollution in runoff.
In addition to total phosphorus loads exceeding targets in some areas, another trou-bling statistic suggests that the fraction of phos-phorus entering the Great Lakes as dissolved or soluble reactive phosphorus (that is, biologically available phosphorus more easily taken up by algae) is increasing. In recent years, concentra-tions of soluble reactive phosphorus (SRP, also called dissolved reactive phosphorus) in near-shore Lake Ontario and the western basin of Lake Erie have increased.148 Increases in SRP concentrations may be due in part to dreissenid mussels, which can uptake phosphorus in bio-logically unavailable forms and release it to the water column as SRP.149 Increases in loading of
SRP from streams and rivers may also be responsible for increased concentrations in the lakes. Current loads of SRP in the Maumee and Sandusky Rivers, two tributaries to western Lake Erie, are the highest they have been in 35 years (see Plot 1, pg. 18).150 Exact causes of increased SRP loads in tributaries are uncertain, but experts believe they primarily result from farming practices in agriculture-heavy watersheds and from climate-related factors.151
In response to increased phosphorus loads and increases in the fraction of SRP, current phosphorus concentrations in some areas of the Great Lakes are not consistently meeting GLWQA targets (see, for example, Figure 2). Total phosphorus concentrations in Lake Erie, especially in the spring, began increasing as early as 1995.152 Environment Canada and the U.S. EPA report that recently, concentrations in that lake are highly vari-able and frequently exceed targets, particularly in the western basin.153 With respect to phosphorus concentra-tions, the two agencies rate the current condition of Lake Erie as “poor” with a trend of increasing phosphorus levels. 154 Environment Canada and the U.S. EPA also report that phosphorus concentrations in nearshore areas of lakes Michigan, Huron, and Ontario are high enough to support nuisance algae growth, even though phos-phorus levels in offshore areas are at or well below targets.155
Impacts of excessive nutrientsElevated concentrations of phosphorus in nearshore areas of lakes Michigan, Huron, Erie, and Ontario are high enough to encourage harmful blooms of algae such as Cladophora and Microcystis;156 indeed, symptoms of eutrophication including harmful algal blooms and hypoxic zones have returned to parts of all the Great Lakes except Superior.157 Water quality parameters and phytoplankton and zooplankton communities indicated a return to eutrophic conditions in Lake Erie, particularly in the western basin, beginning in the mid-1990s.158 Blooms of blue-green algae re-appeared in Lake Erie in the mid-1990s and have since become an annual occur-rence, with extensive blooms of Microcystis observed in 2007, 2008, and 2009.159 As of late August, the summer
BOx 5: IMpOrTANCE OF NITrOGEN ANd OTHEr NuTrIENTS
TO ALGAL GrOWTH
Phosphorus typically limits primary production in freshwater lakes,177 but the importance of nitrogen should not be ignored, as it too can encourage algal growth under certain conditions. recent research shows that phytoplankton in Lake Erie can be season-ally co-limited by nitrogen,178 which can encourage blooms of nitrogen-fixing toxic blue-green algae such as Anabaena.179 nitrogen can be an important contrib-utor to phytoplankton biomass in Lake Erie, particu-larly when phosphorus concentrations are high.180
the potential contribution of nitrogen to recent algal blooms is not necessarily due to changes in loading, but is primarily attributed to the alteration of in-lake nutri-ent dynamics by dreissenid mussels.181 Experiments have shown that dreissenid mussels cause shifts in nitrogen-to-phosphorus ratios, favoring algae that are well-suited to n-limited conditions.182 once again, as with phosphorus and its relationship to algal growth, dreissenid mussels serve to decouple landscape nutri-ent inputs and primary production in the lakes. in addi-tion to nitrogen, other nutrients such as iron and silica can contribute significantly to the growth of algae in the Great Lakes.183
16 | FEAST ANd FAMINE IN THE GrEAT LAkES
2011 Microcystis bloom in western Lake Erie was 2.5 times denser than the previous record bloom of 2009 (see pg. 18).160 While not all types of Microcystis produce toxins, research shows that toxin-producing strains of these blue-green algae are present in lakes Erie and Ontario and are capable of producing toxin concentrations high enough to be harmful to human health.161 Levels of Microcystis toxins in early stages of the summer 2011 west-ern Lake Erie bloom reached more than 1000 times World Health Organization guidelines for drinking water safety. 162 Recent research indicates that toxic blue-green algal blooms in tributaries to western Lake Erie are starting earlier in the year and farther upstream than was previously the case.163 Washed-up mats of Cladophora are once again a common sight along shorelines of lakes Erie and Ontario, and in some areas of lakes Michigan and Huron.164 In addition to the resurgence of harmful blooms of Cladophora and Microcystis, new bloom-forming algae are beginning to appear in the Great Lakes. Lyngbya wollei, a potentially toxic, mat-forming blue-green alga from the southeastern U.S., was discovered washing onshore in western Lake Erie beginning in 2006. Lyngbya has different light and habitat requirements than similar mat-forming algae like Cladophora, so it may be able to colonize areas the latter has not.165
Coincident with the return of large algal blooms, the size and duration of hypoxic areas in the bottom waters of Lake Erie are increasing.166 In 2005, a hypoxic zone with an area of about 10,000 square kilometers developed in central Lake Erie — one of the largest “dead zones” ever recorded in the lake.167 In addition to negatively impacting fish and other organisms, hypoxia can re-release phosphorus formerly bound up in sediments. Thus, Lake Erie’s hypoxic zones may alter phosphorus cycling to further encourage algal blooms168 — creating a harm-ful feedback loop.
Great Lakes food webs are already being impacted by the reappearance of eutrophic conditions. Hatches of Lake Erie walleye and perch were below average in 5 out of 6 years from 2004 to 2009.169 Hypoxia in Lake Erie’s central basin has reduced habitat quality for many species of fish and has the potential to impact fish com-munity structure and population dynamics.170 Cyanobacterial toxins such as those produced by Microcystis can be harmful to invertebrates and fishes and can accumulate up food webs, significantly impacting their structure and function.171 Mats of Cladophora harbor bacteria responsible for recent outbreaks of avian botulism that have killed thousands of birds along the Great Lakes.172
The resurgence of eutrophication in nearshore areas of the Great Lakes also has serious implications for human health. As previously discussed, chemicals produced by some blue-green algae can be toxic to humans,
BOx 6: ECONOMIC IMpACTS OF GrEAT LAkES EuTrOpHICATION
the return of harmful algal blooms and hypoxia to the Great Lakes poses economic risks. the presence of smelly, unsightly, and potentially toxic algal blooms keeps people away from beaches and other recreational activities, resulting in lost tourism dollars. across the u.S., blooms of harmful alga cause more than $80 million in economic damage annually.184 Cladophora mats that wash ashore house E. coli bacteria whose concentrations are used as indicators of fecal contamination, meaning algal blooms potentially contribute to poor water quality and can trigger beach closures. recent research suggests, however, that measuring E. coli at beaches plagued by Cladophora does not provide an accurate assessment of risks to human health.185 thus, it is possible that the presence of Cladophora has led to unnecessary beach closures — and beach closures are very costly in the Great Lakes, where coastal recreation provides the foundation for a vital tourism industry. for example, closing a Lake michigan beach for a single day is estimated to result in economic losses of up to $37,000.186 at the same time, current information does indicate continuing concerns about beach health: In 2006-07, only 47% of the Lake Erie beaches on the U.S. side were open for more than 95% of the beach season, and the EPA and Environment Canada report that beach water quality conditions on the lake are deteriorating.187
The potential impacts of eutrophication on Great Lakes fish communities are equally troubling. Recurring hypoxic zones in Lake Erie threaten the habitats and food resources that support economically important sport fish such as walleye and yellow perch.188 Lake Erie, the most biologically productive of the Great Lakes, forms the basis of a regional recreational fishery whose estimated worth exceeds $7 billion annually in the U.S.189 clearly, symptoms of nutrient pollution such as harmful algal blooms and hypoxia in the Great Lakes have serious eco-nomic implications, and these problems will only worsen as eutrophication accelerates.
FEAST ANd FAMINE IN THE GrEAT LAkES | 17
causing respiratory and gastrointestinal symptoms, damaging liver tissue, and promoting tumors.173 In 2010, nine people were sickened by toxic blue-green algae in an inland lake in Ohio, and three pets died after coming in contact with the water.174 Blue-green algal toxins can even lead to death in humans; in an infamous example, 55 people in Brazil were killed by toxic Microcystis that had contaminated dialysis units.175 Cladophora blooms harbor and encourage the growth of harmful bacteria such as E.coli and Salmonella that can be released to sur-rounding waters, sickening humans who come in contact with contaminated water or beaches. 176
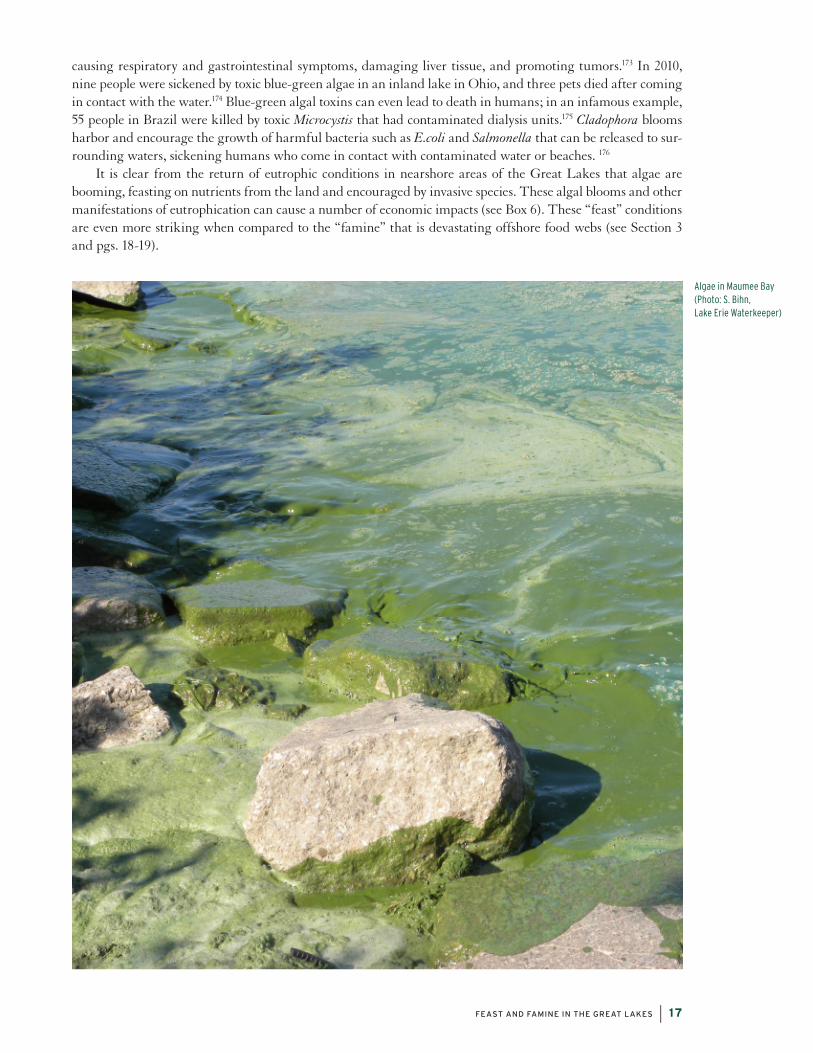
It is clear from the return of eutrophic conditions in nearshore areas of the Great Lakes that algae are booming, feasting on nutrients from the land and encouraged by invasive species. These algal blooms and other manifestations of eutrophication can cause a number of economic impacts (see Box 6). These “feast” conditions are even more striking when compared to the “famine” that is devastating offshore food webs (see Section 3 and pgs. 18-19).
Algae in Maumee Bay(Photo: S. Bihn, Lake Erie Waterkeeper)
18 | FEAST ANd FAMINE IN THE GrEAT LAkES
fEa
St
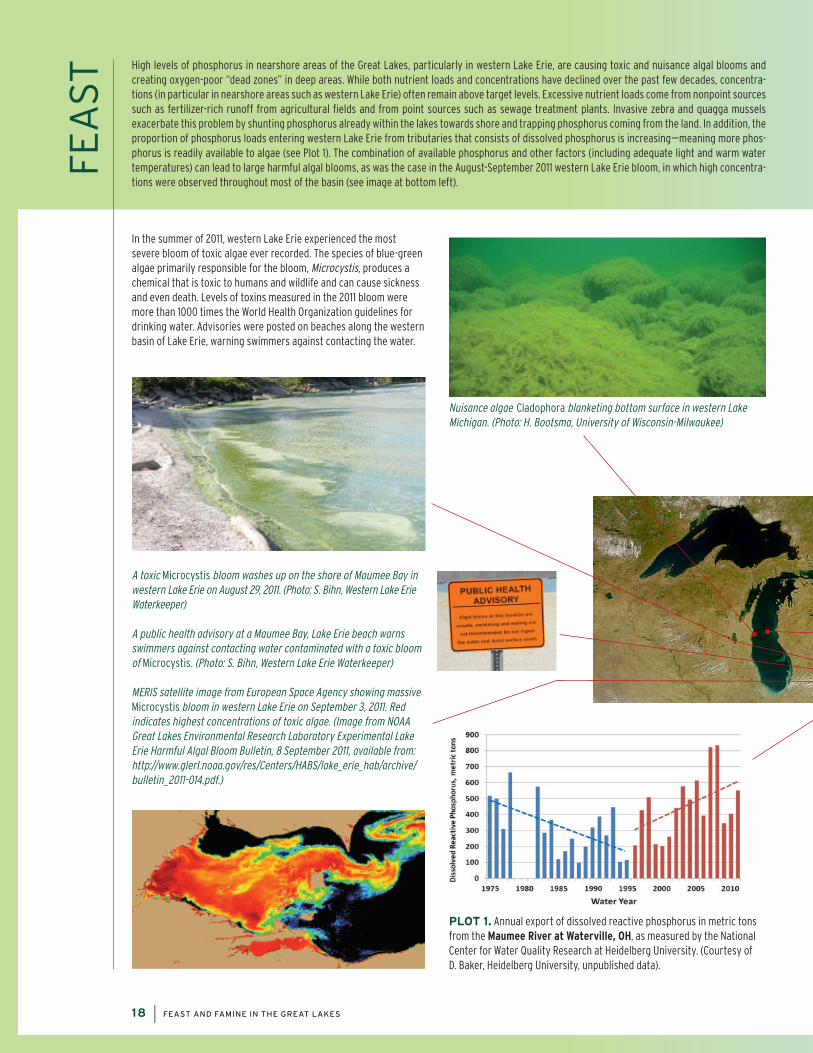
In the summer of 2011, western Lake Erie experienced the most severe bloom of toxic algae ever recorded. The species of blue-green algae primarily responsible for the bloom, Microcystis, produces a chemical that is toxic to humans and wildlife and can cause sickness and even death. Levels of toxins measured in the 2011 bloom were more than 1000 times the World Health Organization guidelines for drinking water. Advisories were posted on beaches along the western basin of Lake Erie, warning swimmers against contacting the water.
A toxic Microcystis bloom washes up on the shore of Maumee Bay in western Lake Erie on August 29, 2011. (Photo: S. Bihn, Western Lake Erie Waterkeeper) A public health advisory at a Maumee Bay, Lake Erie beach warns swimmers against contacting water contaminated with a toxic bloom of Microcystis. (Photo: S. Bihn, Western Lake Erie Waterkeeper) MERIS satellite image from European Space Agency showing massive Microcystis bloom in western Lake Erie on September 3, 2011. Red indicates highest concentrations of toxic algae. (Image from NOAA Great Lakes Environmental Research Laboratory Experimental Lake Erie Harmful Algal Bloom Bulletin, 8 September 2011, available from: http://www.glerl.noaa.gov/res/Centers/HABS/lake_erie_hab/archive/bulletin_2011-014.pdf.)
High levels of phosphorus in nearshore areas of the Great Lakes, particularly in western Lake Erie, are causing toxic and nuisance algal blooms and creating oxygen-poor “dead zones” in deep areas. While both nutrient loads and concentrations have declined over the past few decades, concentra-tions (in particular in nearshore areas such as western Lake Erie) often remain above target levels. Excessive nutrient loads come from nonpoint sources such as fertilizer-rich runoff from agricultural fields and from point sources such as sewage treatment plants. Invasive zebra and quagga mussels exacerbate this problem by shunting phosphorus already within the lakes towards shore and trapping phosphorus coming from the land. In addition, the proportion of phosphorus loads entering western Lake Erie from tributaries that consists of dissolved phosphorus is increasing—meaning more phos-phorus is readily available to algae (see Plot 1). The combination of available phosphorus and other factors (including adequate light and warm water temperatures) can lead to large harmful algal blooms, as was the case in the August-September 2011 western Lake Erie bloom, in which high concentra-tions were observed throughout most of the basin (see image at bottom left).
Plot 1. Annual export of dissolved reactive phosphorus in metric tons from the Maumee River at Waterville, OH, as measured by the National Center for Water Quality Research at Heidelberg University. (Courtesy of D. Baker, Heidelberg University, unpublished data).
Nuisance algae Cladophora blanketing bottom surface in western Lake Michigan. (Photo: H. Bootsma, University of Wisconsin-Milwaukee)
FEAST ANd FAMINE IN THE GrEAT LAkES | 19
fam
inE
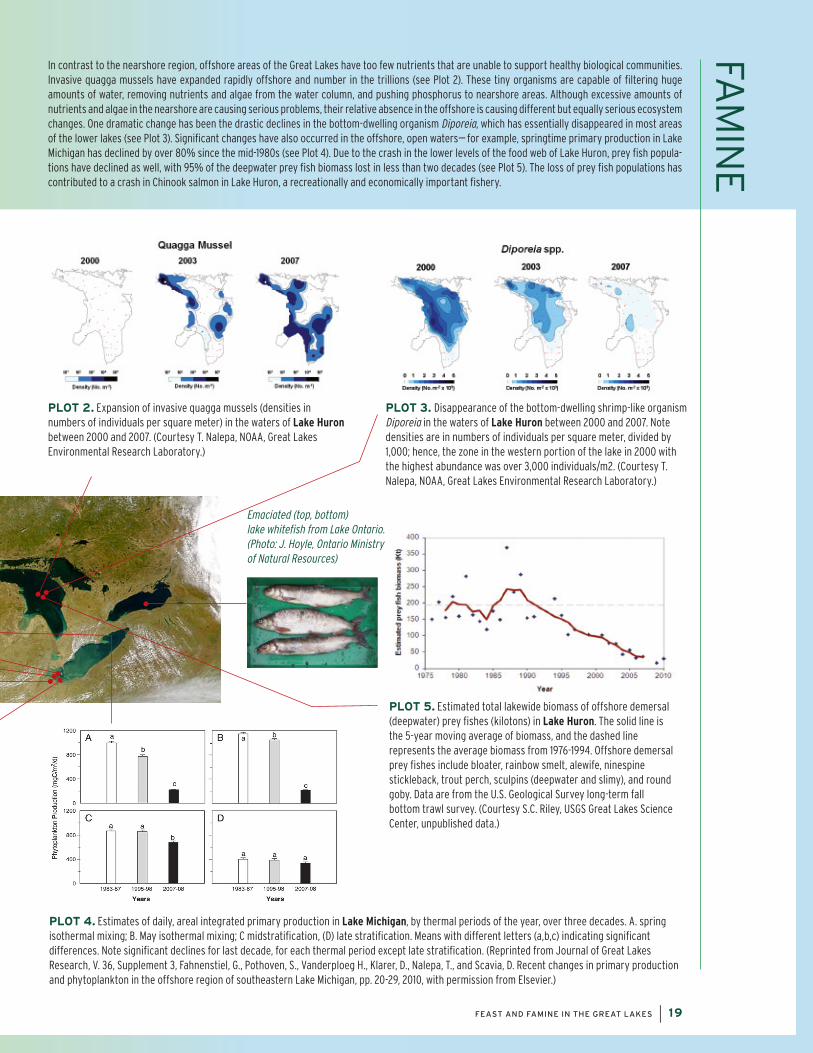
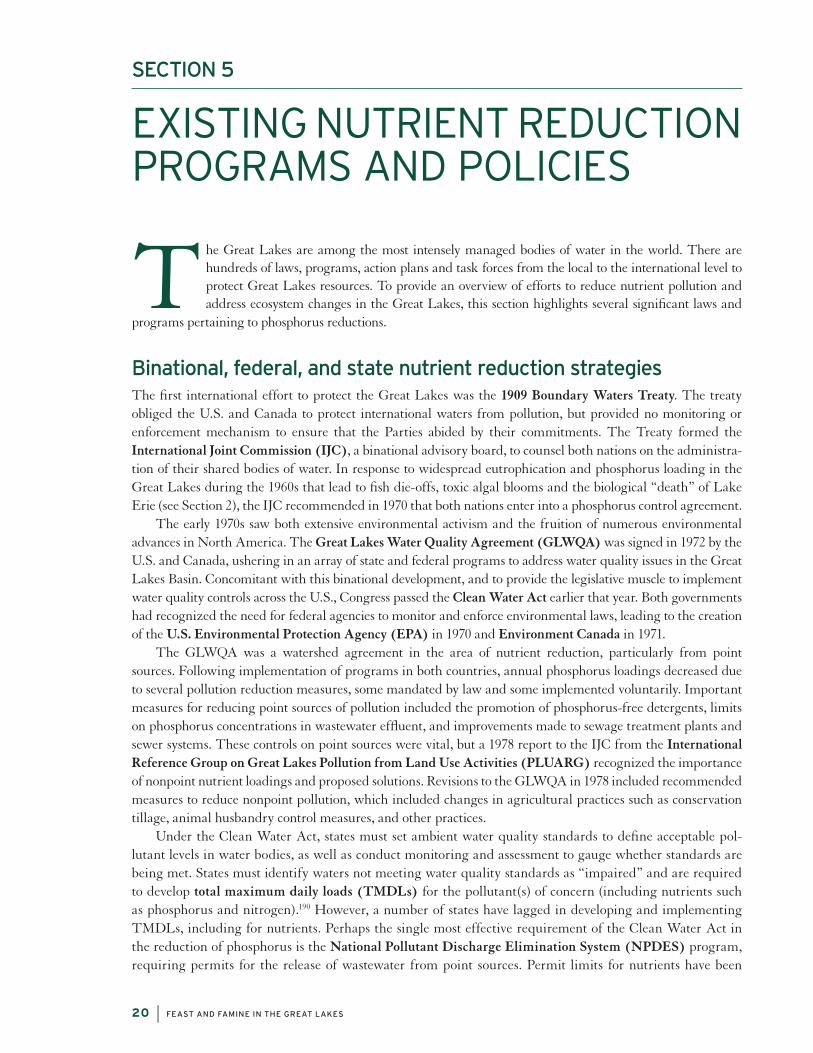
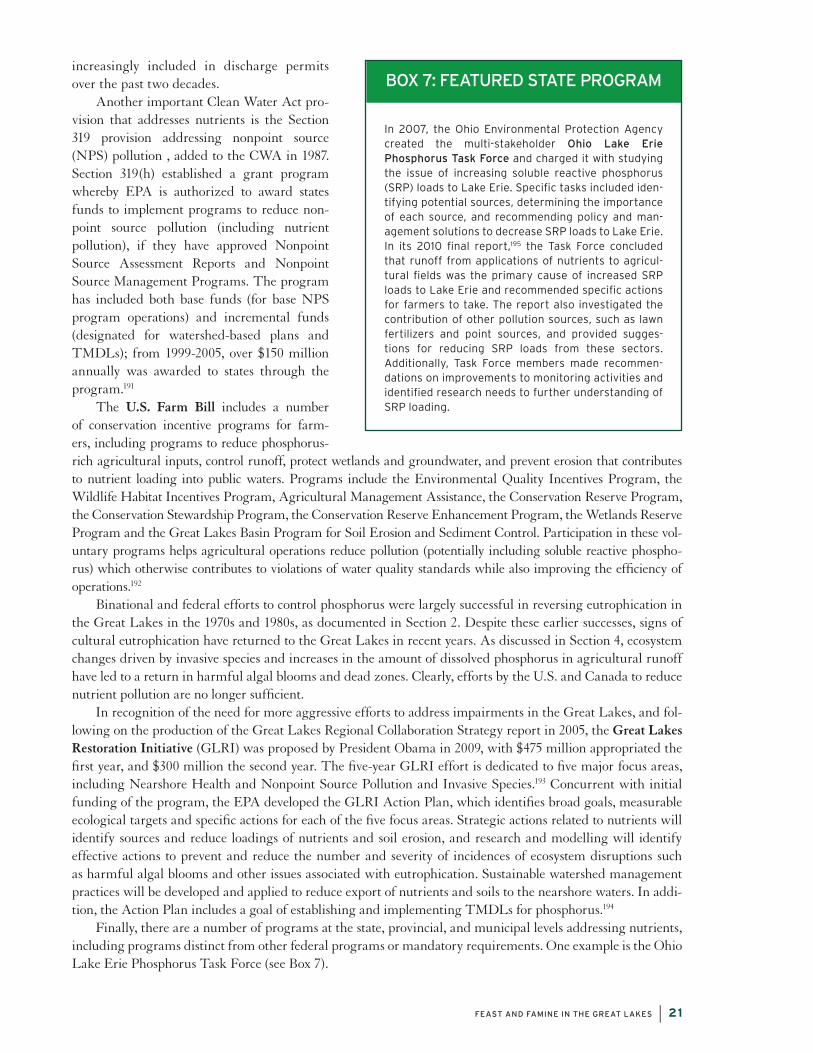
In contrast to the nearshore region, offshore areas of the Great Lakes have too few nutrients that are unable to support healthy biological communities. Invasive quagga mussels have expanded rapidly offshore and number in the trillions (see Plot 2). These tiny organisms are capable of filtering huge amounts of water, removing nutrients and algae from the water column, and pushing phosphorus to nearshore areas. Although excessive amounts of nutrients and algae in the nearshore are causing serious problems, their relative absence in the offshore is causing different but equally serious ecosystem changes. One dramatic change has been the drastic declines in the bottom-dwelling organism Diporeia, which has essentially disappeared in most areas of the lower lakes (see Plot 3). Significant changes have also occurred in the offshore, open waters— for example, springtime primary production in Lake Michigan has declined by over 80% since the mid-1980s (see Plot 4). Due to the crash in the lower levels of the food web of Lake Huron, prey fish popula-tions have declined as well, with 95% of the deepwater prey fish biomass lost in less than two decades (see Plot 5). The loss of prey fish populations has contributed to a crash in Chinook salmon in Lake Huron, a recreationally and economically important fishery.
Plot 3. Disappearance of the bottom-dwelling shrimp-like organism Diporeia in the waters of Lake Huron between 2000 and 2007. Note densities are in numbers of individuals per square meter, divided by 1,000; hence, the zone in the western portion of the lake in 2000 with the highest abundance was over 3,000 individuals/m2. (Courtesy T. Nalepa, NOAA, Great Lakes Environmental Research Laboratory.)
Plot 5. Estimated total lakewide biomass of offshore demersal (deepwater) prey fishes (kilotons) in Lake Huron. The solid line is the 5-year moving average of biomass, and the dashed line represents the average biomass from 1976-1994. Offshore demersal prey fishes include bloater, rainbow smelt, alewife, ninespine stickleback, trout perch, sculpins (deepwater and slimy), and round goby. Data are from the U.S. Geological Survey long-term fall bottom trawl survey. (Courtesy S.C. Riley, USGS Great Lakes Science Center, unpublished data.)
Emaciated (top, bottom) lake whitefish from Lake Ontario. (Photo: J. Hoyle, Ontario Ministry of Natural Resources)
Plot 2. Expansion of invasive quagga mussels (densities in numbers of individuals per square meter) in the waters of Lake Huron between 2000 and 2007. (Courtesy T. Nalepa, NOAA, Great Lakes Environmental Research Laboratory.)
Plot 4. Estimates of daily, areal integrated primary production in Lake Michigan, by thermal periods of the year, over three decades. A. spring isothermal mixing; B. May isothermal mixing; C midstratification, (D) late stratification. Means with different letters (a,b,c) indicating significant differences. Note significant declines for last decade, for each thermal period except late stratification. (Reprinted from Journal of Great Lakes Research, V. 36, Supplement 3, Fahnenstiel, G., Pothoven, S., Vanderploeg H., Klarer, D., Nalepa, T., and Scavia, D. Recent changes in primary production and phytoplankton in the offshore region of southeastern Lake Michigan, pp. 20-29, 2010, with permission from Elsevier.)
20 | FEAST ANd FAMINE IN THE GrEAT LAkES
SECTION 5
ExiStinG nutriEnt rEduction ProGramS and PoLiciES
The Great Lakes are among the most intensely managed bodies of water in the world. There are hundreds of laws, programs, action plans and task forces from the local to the international level to protect Great Lakes resources. To provide an overview of efforts to reduce nutrient pollution and address ecosystem changes in the Great Lakes, this section highlights several significant laws and
programs pertaining to phosphorus reductions.
Binational, federal, and state nutrient reduction strategiesThe first international effort to protect the Great Lakes was the 1909 Boundary Waters Treaty. The treaty obliged the U.S. and Canada to protect international waters from pollution, but provided no monitoring or enforcement mechanism to ensure that the Parties abided by their commitments. The Treaty formed the International Joint Commission (IJC), a binational advisory board, to counsel both nations on the administra-tion of their shared bodies of water. In response to widespread eutrophication and phosphorus loading in the Great Lakes during the 1960s that lead to fish die-offs, toxic algal blooms and the biological “death” of Lake Erie (see Section 2), the IJC recommended in 1970 that both nations enter into a phosphorus control agreement.
The early 1970s saw both extensive environmental activism and the fruition of numerous environmental advances in North America. The Great Lakes Water Quality Agreement (GLWQA) was signed in 1972 by the U.S. and Canada, ushering in an array of state and federal programs to address water quality issues in the Great Lakes Basin. Concomitant with this binational development, and to provide the legislative muscle to implement water quality controls across the U.S., Congress passed the Clean Water Act earlier that year. Both governments had recognized the need for federal agencies to monitor and enforce environmental laws, leading to the creation of the U.S. Environmental Protection Agency (EPA) in 1970 and Environment Canada in 1971.
The GLWQA was a watershed agreement in the area of nutrient reduction, particularly from point sources. Following implementation of programs in both countries, annual phosphorus loadings decreased due to several pollution reduction measures, some mandated by law and some implemented voluntarily. Important measures for reducing point sources of pollution included the promotion of phosphorus-free detergents, limits on phosphorus concentrations in wastewater effluent, and improvements made to sewage treatment plants and sewer systems. These controls on point sources were vital, but a 1978 report to the IJC from the International Reference Group on Great Lakes Pollution from Land Use Activities (PLUARG) recognized the importance of nonpoint nutrient loadings and proposed solutions. Revisions to the GLWQA in 1978 included recommended measures to reduce nonpoint pollution, which included changes in agricultural practices such as conservation tillage, animal husbandry control measures, and other practices.
Under the Clean Water Act, states must set ambient water quality standards to define acceptable pol-lutant levels in water bodies, as well as conduct monitoring and assessment to gauge whether standards are being met. States must identify waters not meeting water quality standards as “impaired” and are required to develop total maximum daily loads (TMDLs) for the pollutant(s) of concern (including nutrients such as phosphorus and nitrogen).190 However, a number of states have lagged in developing and implementing TMDLs, including for nutrients. Perhaps the single most effective requirement of the Clean Water Act in the reduction of phosphorus is the National Pollutant Discharge Elimination System (NPDES) program, requiring permits for the release of wastewater from point sources. Permit limits for nutrients have been
FEAST ANd FAMINE IN THE GrEAT LAkES | 21
increasingly included in discharge permits over the past two decades.
Another important Clean Water Act pro-vision that addresses nutrients is the Section 319 provision addressing nonpoint source (NPS) pollution , added to the CWA in 1987. Section 319(h) established a grant program whereby EPA is authorized to award states funds to implement programs to reduce non-point source pollution (including nutrient pollution), if they have approved Nonpoint Source Assessment Reports and Nonpoint Source Management Programs. The program has included both base funds (for base NPS program operations) and incremental funds (designated for watershed-based plans and TMDLs); from 1999-2005, over $150 million annually was awarded to states through the program.191
The U.S. Farm Bill includes a number of conservation incentive programs for farm-ers, including programs to reduce phosphorus-rich agricultural inputs, control runoff, protect wetlands and groundwater, and prevent erosion that contributes to nutrient loading into public waters. Programs include the Environmental Quality Incentives Program, the Wildlife Habitat Incentives Program, Agricultural Management Assistance, the Conservation Reserve Program, the Conservation Stewardship Program, the Conservation Reserve Enhancement Program, the Wetlands Reserve Program and the Great Lakes Basin Program for Soil Erosion and Sediment Control. Participation in these vol-untary programs helps agricultural operations reduce pollution (potentially including soluble reactive phospho-rus) which otherwise contributes to violations of water quality standards while also improving the efficiency of operations.192
Binational and federal efforts to control phosphorus were largely successful in reversing eutrophication in the Great Lakes in the 1970s and 1980s, as documented in Section 2. Despite these earlier successes, signs of cultural eutrophication have returned to the Great Lakes in recent years. As discussed in Section 4, ecosystem changes driven by invasive species and increases in the amount of dissolved phosphorus in agricultural runoff have led to a return in harmful algal blooms and dead zones. Clearly, efforts by the U.S. and Canada to reduce nutrient pollution are no longer sufficient.
In recognition of the need for more aggressive efforts to address impairments in the Great Lakes, and fol-lowing on the production of the Great Lakes Regional Collaboration Strategy report in 2005, the Great Lakes Restoration Initiative (GLRI) was proposed by President Obama in 2009, with $475 million appropriated the first year, and $300 million the second year. The five-year GLRI effort is dedicated to five major focus areas, including Nearshore Health and Nonpoint Source Pollution and Invasive Species.193 Concurrent with initial funding of the program, the EPA developed the GLRI Action Plan, which identifies broad goals, measurable ecological targets and specific actions for each of the five focus areas. Strategic actions related to nutrients will identify sources and reduce loadings of nutrients and soil erosion, and research and modelling will identify effective actions to prevent and reduce the number and severity of incidences of ecosystem disruptions such as harmful algal blooms and other issues associated with eutrophication. Sustainable watershed management practices will be developed and applied to reduce export of nutrients and soils to the nearshore waters. In addi-tion, the Action Plan includes a goal of establishing and implementing TMDLs for phosphorus.194
Finally, there are a number of programs at the state, provincial, and municipal levels addressing nutrients, including programs distinct from other federal programs or mandatory requirements. One example is the Ohio Lake Erie Phosphorus Task Force (see Box 7).
BOx 7: FEATurEd STATE prOGrAM
in 2007, the ohio Environmental Protection agency created the multi-stakeholder Ohio Lake Erie phosphorus Task Force and charged it with studying the issue of increasing soluble reactive phosphorus (SRP) loads to Lake Erie. Specific tasks included iden-tifying potential sources, determining the importance of each source, and recommending policy and man-agement solutions to decrease SrP loads to Lake Erie. In its 2010 final report,195 the task force concluded that runoff from applications of nutrients to agricul-tural fields was the primary cause of increased SRP loads to Lake Erie and recommended specific actions for farmers to take. the report also investigated the contribution of other pollution sources, such as lawn fertilizers and point sources, and provided sugges-tions for reducing SrP loads from these sectors. additionally, task force members made recommen-dations on improvements to monitoring activities and identified research needs to further understanding of SrP loading.
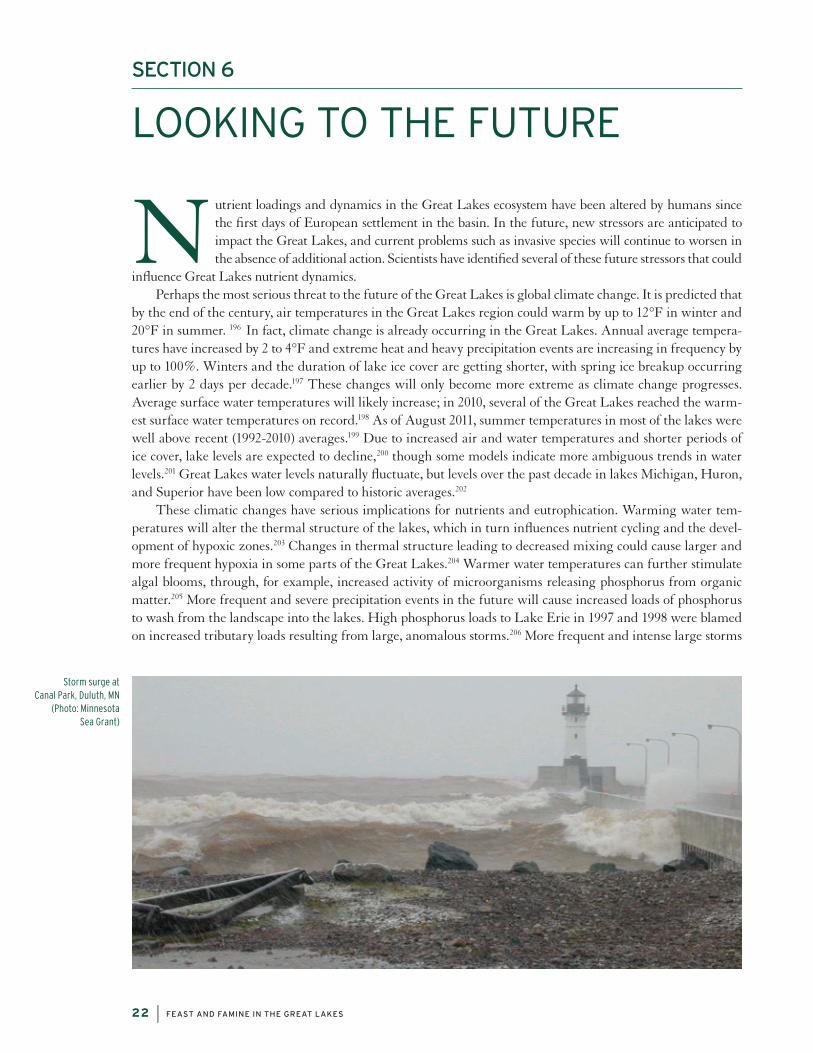
22 | FEAST ANd FAMINE IN THE GrEAT LAkES
SECTION 6
LookinG to thE futurE
Nutrient loadings and dynamics in the Great Lakes ecosystem have been altered by humans since the first days of European settlement in the basin. In the future, new stressors are anticipated to impact the Great Lakes, and current problems such as invasive species will continue to worsen in the absence of additional action. Scientists have identified several of these future stressors that could
influence Great Lakes nutrient dynamics.Perhaps the most serious threat to the future of the Great Lakes is global climate change. It is predicted that
by the end of the century, air temperatures in the Great Lakes region could warm by up to 12°F in winter and 20°F in summer. 196 In fact, climate change is already occurring in the Great Lakes. Annual average tempera-tures have increased by 2 to 4°F and extreme heat and heavy precipitation events are increasing in frequency by up to 100%. Winters and the duration of lake ice cover are getting shorter, with spring ice breakup occurring earlier by 2 days per decade.197 These changes will only become more extreme as climate change progresses. Average surface water temperatures will likely increase; in 2010, several of the Great Lakes reached the warm-est surface water temperatures on record.198 As of August 2011, summer temperatures in most of the lakes were well above recent (1992-2010) averages.199 Due to increased air and water temperatures and shorter periods of ice cover, lake levels are expected to decline,200 though some models indicate more ambiguous trends in water levels.201 Great Lakes water levels naturally fluctuate, but levels over the past decade in lakes Michigan, Huron, and Superior have been low compared to historic averages.202
These climatic changes have serious implications for nutrients and eutrophication. Warming water tem-peratures will alter the thermal structure of the lakes, which in turn influences nutrient cycling and the devel-opment of hypoxic zones.203 Changes in thermal structure leading to decreased mixing could cause larger and more frequent hypoxia in some parts of the Great Lakes.204 Warmer water temperatures can further stimulate algal blooms, through, for example, increased activity of microorganisms releasing phosphorus from organic matter.205 More frequent and severe precipitation events in the future will cause increased loads of phosphorus to wash from the landscape into the lakes. High phosphorus loads to Lake Erie in 1997 and 1998 were blamed on increased tributary loads resulting from large, anomalous storms.206 More frequent and intense large storms
Storm surge at Canal Park, Duluth, MN
(Photo: Minnesota Sea Grant)
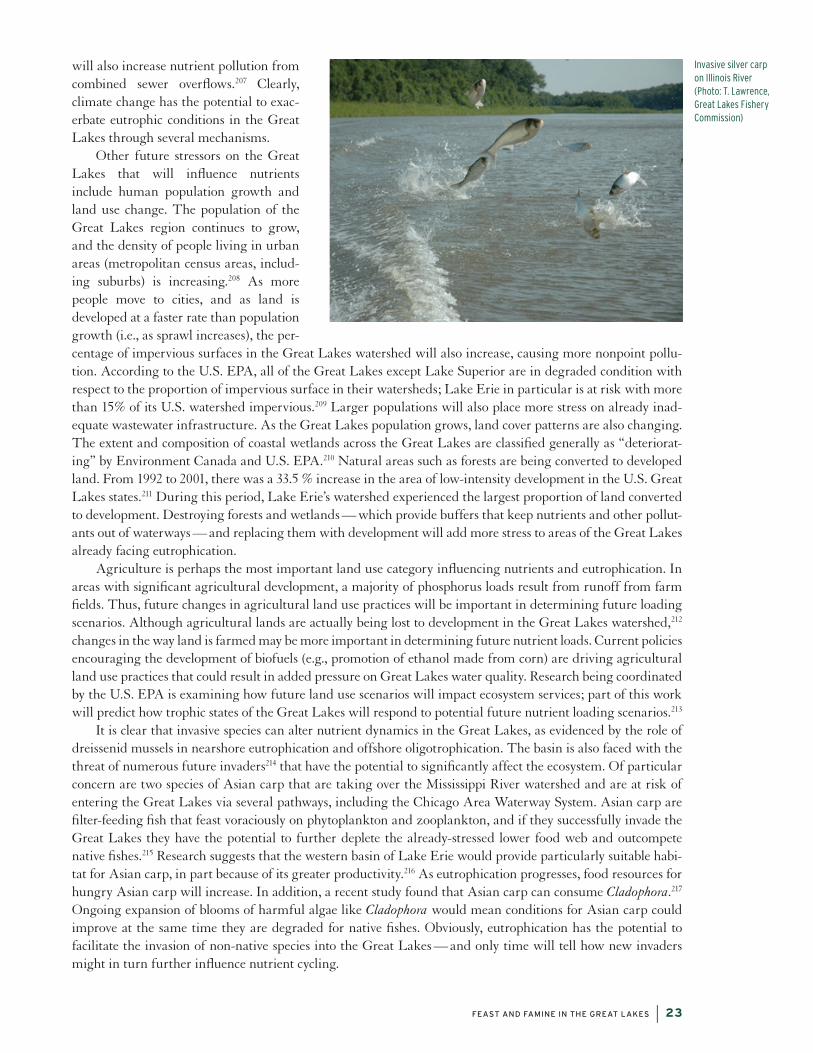
FEAST ANd FAMINE IN THE GrEAT LAkES | 23
will also increase nutrient pollution from combined sewer overflows.207 Clearly, climate change has the potential to exac-erbate eutrophic conditions in the Great Lakes through several mechanisms.
Other future stressors on the Great Lakes that will influence nutrients include human population growth and land use change. The population of the Great Lakes region continues to grow, and the density of people living in urban areas (metropolitan census areas, includ-ing suburbs) is increasing.208 As more people move to cities, and as land is developed at a faster rate than population growth (i.e., as sprawl increases), the per-centage of impervious surfaces in the Great Lakes watershed will also increase, causing more nonpoint pollu-tion. According to the U.S. EPA, all of the Great Lakes except Lake Superior are in degraded condition with respect to the proportion of impervious surface in their watersheds; Lake Erie in particular is at risk with more than 15% of its U.S. watershed impervious.209 Larger populations will also place more stress on already inad-equate wastewater infrastructure. As the Great Lakes population grows, land cover patterns are also changing. The extent and composition of coastal wetlands across the Great Lakes are classified generally as “deteriorat-ing” by Environment Canada and U.S. EPA.210 Natural areas such as forests are being converted to developed land. From 1992 to 2001, there was a 33.5 % increase in the area of low-intensity development in the U.S. Great Lakes states.211 During this period, Lake Erie’s watershed experienced the largest proportion of land converted to development. Destroying forests and wetlands — which provide buffers that keep nutrients and other pollut-ants out of waterways — and replacing them with development will add more stress to areas of the Great Lakes already facing eutrophication.
Agriculture is perhaps the most important land use category influencing nutrients and eutrophication. In areas with significant agricultural development, a majority of phosphorus loads result from runoff from farm fields. Thus, future changes in agricultural land use practices will be important in determining future loading scenarios. Although agricultural lands are actually being lost to development in the Great Lakes watershed,212 changes in the way land is farmed may be more important in determining future nutrient loads. Current policies encouraging the development of biofuels (e.g., promotion of ethanol made from corn) are driving agricultural land use practices that could result in added pressure on Great Lakes water quality. Research being coordinated by the U.S. EPA is examining how future land use scenarios will impact ecosystem services; part of this work will predict how trophic states of the Great Lakes will respond to potential future nutrient loading scenarios.213
It is clear that invasive species can alter nutrient dynamics in the Great Lakes, as evidenced by the role of dreissenid mussels in nearshore eutrophication and offshore oligotrophication. The basin is also faced with the threat of numerous future invaders214 that have the potential to significantly affect the ecosystem. Of particular concern are two species of Asian carp that are taking over the Mississippi River watershed and are at risk of entering the Great Lakes via several pathways, including the Chicago Area Waterway System. Asian carp are filter-feeding fish that feast voraciously on phytoplankton and zooplankton, and if they successfully invade the Great Lakes they have the potential to further deplete the already-stressed lower food web and outcompete native fishes.215 Research suggests that the western basin of Lake Erie would provide particularly suitable habi-tat for Asian carp, in part because of its greater productivity.216 As eutrophication progresses, food resources for hungry Asian carp will increase. In addition, a recent study found that Asian carp can consume Cladophora.217 Ongoing expansion of blooms of harmful algae like Cladophora would mean conditions for Asian carp could improve at the same time they are degraded for native fishes. Obviously, eutrophication has the potential to facilitate the invasion of non-native species into the Great Lakes — and only time will tell how new invaders might in turn further influence nutrient cycling.
Invasive silver carp on Illinois River(Photo: T. Lawrence, Great Lakes Fishery Commission)
24 | FEAST ANd FAMINE IN THE GrEAT LAkES
SECTION 7
rEcommEndationS
Current nutrient and invasive species management policies and programs are insufficient to protect the Great Lakes. Hypoxia persists in central Lake Erie and eutrophication and algal blooms continue to plague western Lake Erie and other nearshore areas of the lakes while many offshore waters (in particu-lar in Lake Huron) have very low nutrient levels and declining fish production. Immediate action must
be taken to prevent further deterioration of these ecosystems on which fish, wildlife and humans depend. This com-plex problem will require creative and integrated solutions in policy, research and monitoring, and public education.
policy and ManagementExisting policies and management programs fall short in recognizing that invasive species such as zebra and quagga mussels have changed the fundamental structure of the lakes. Three overarching recommendations are the following:
1. While emphasizing a broad lake- or ecosystem-wide management approach to nutrient problems, man-agement and policy need to be refined at smaller scales (e.g., sub-basin or watershed) as appropriate, to take into account different extents of problems in different areas.
2. Recognizing that although implementation of policies specific to nutrients and invasive species (in particular invasive mussels) is critical, we need to explore policies that can address both stresses in an integrated way.
3. Further reductions in nutrient loading are necessary, in particular in priority watersheds and from agricul-tural sources, where targeted programs should be pursued to address specific nutrient impairment problems.
There are many agreements, policies and programs that do or can address nutrient problems in the Great Lakes, and it is essential that such efforts be updated as necessary to keep pace with changing ecosystems. Some potential changes in agreements, policies, and programs include the following:• The Great Lakes Water Quality Agreement (GLWQA), the primary framework for coordinated phosphorus
reduction efforts between the U.S. and Canada, must recognize that the Great Lakes are not a single ecosystem, nor can each lake be treated as a single unit. Different areas of the lakes will respond to nutrient inputs in different ways; thus, water quality standards and GLWQA phosphorus loading targets should be developed for individual regions of the lakes (including nearshore vs. offshore). Phosphorus loading targets for western Lake Erie may well be different from targets for the eastern basin. Given that zebra and quagga mussels are redirecting phosphorus away from the offshore and negatively impacting offshore food webs, innovative policy tools and solutions will need to be applied to regain balance in the lakes.
• The current renegotiation of the GLWQA is an excellent opportunity to encourage policies that build on the scientific advances (including understanding food web changes and ecosystem modeling) that have occured since the last update to the Agreement. Updated phosphorus targets must be calculated using the best available scientific information on the state of the Great Lakes. Target levels of phosphorus and chlorophyll representing improved water quality and reduced algae production should be established for distinct lake regions, and scien-tific models should be used to calculate load reductions required to meet in-lake targets. Additionally, targets for community composition of phytoplankton (which are tied to water quality parameters) should be established.
• It is important to continue monitoring and regulating total phosphorus loads, because target loading levels are not being met consistently across the Great Lakes basin. However, the significant contribution of soluble reactive phos-phorus (SRP) in western Lake Erie in particular and the fact that SRP loads are increasing must be recognized. Agricultural practices targeted to reducing SRP should be encouraged in addition to those that reduce overall phos-phorus loading. See report of the Ohio Lake Erie Phosphorus Task Force for more specific recommendations.218
• To increase the effectiveness of the GLWQA, changes should be made to its structure and implementation. The Agreement should include enforcement mechanisms to ensure targets are met, with agreed-upon time
FEAST ANd FAMINE IN THE GrEAT LAkES | 25
tables for meeting water quality objectives. In addition, given the new paradigm of rapid ecosystem change brought about by invasive species, the GLWQA review process might need to be adjusted so that water quality targets are reevaluated on shorter time scales.
• The renegotiated GLWQA should include creation of a Great Lakes-wide Phosphorus Task Force, similar to the Ohio Lake Erie Phosphorus Task Force (see Box 7, Section 5), to investigate the issues of eutrophication and changes in phosphorus loads and concentrations (and components of phosphorus, such as SRP) in the nearshore and offshore. The Task Force should provide the U.S. and Canadian governments and the International Joint Commission with detailed management and policy recommendations for meeting water quality goals across the basin. Such an entity should be well integrated with other relevant bodies (such as Lakewide Management Plans (LaMPs)), and have representatives from all relevant sectors, including federal, state, municipal, and tribal agencies, the International Joint Commission, academia, agriculture and industry, and nongovernmental organizations.
In addition to working binationally, we need to maximize the ability of existing laws, regulations and pro-grams to control nutrient pollution at the municipal, state, and federal levels. Recommendations here are focused on the U.S. side, while it is recognized that strengthening of Canadian programs is also essential to fully address nutrient problems in the Great Lakes. Some key measures/changes needed on the U.S. side include the following:• Programs to reduce nonpoint runoff from agricultural land, including under the Farm Bill, must be
strengthened. – Assist farmers in pursuing financial assistance through Farm Bill Programs, including the Environmental
Quality Incentives Program, the Conservation Reserve Program, the Conservation Stewardship Program, and other programs on targeted priority watersheds, as well as other federal funding sources, to reduce nutrient and sediment runoff from agricultural lands.
– Nutrient management programs should use a watershed-based approach to tailor efforts to specific areas.219 Funding should be targeted to priority areas contributing large amounts of phosphorus loading as identi-fied by research.
– Provide more oversight of agricultural operations participating in Farm Bill programs, and recommend wider buffer zones between all row crops and surface waters.
– Re-invent the Great Lakes Basin Program for Soil Erosion and Sediment Control—currently authorized in the Farm Bill—into a solution-based restoration implementation program. This program has had much success and should be re-designed to improve water quality in targeted areas around the Great Lakes by con-trolling sediment and reducing nutrient runoff that causes harmful algae blooms.
– For Lake Erie in particular, prioritize and implement key recommendations of the Ohio Lake Erie Phosphorus Task Force, including to increase training/outreach on appropriate rates and timing of agronomic application of fertilizers; strengthen and expand use of phosphorus soil test programs; develop or strengthen nutrient management tools (including phosphorus runoff risk screening and assessment tools); and optimize and expand implementation of best management practices, including adoption by cost-share agencies of innova-tive approaches (e.g. fund allocation based on screening tool).
• Although efforts should be centered on reducing nonpoint phosphorus loading, point source pollution should be further addressed through aggressive implementation of Clean Water Act programs. This will include increased activities through: – Establishment of protective nutrient water quality criteria by each of the Great Lakes states (including poten-
tially revising existing criteria). – Effective development and implementation of total maximum daily loads, with U.S. Environmental Protection
Agency (EPA) playing a key role in coordinating individual Great Lake or basin total maximum daily loads for nutrients.
– Tighter National Pollutant Discharge Elimination System permit limits, where necessary, for wastewater treatment plants.
– Consideration of additional limits for nutrients in municipal stormwater permits.
The Clean Water Act should also be used as a vehicle to encourage the reduction of nonpoint source pol-lution through fully funded and implemented Section 319 programs, including emphasizing watersheds with significant nutrient problems.
On the Canadian side, policy advances are needed at the local, provincial, and federal levels. Though the regula-tory and voluntary frameworks differ from the U.S. side, similar types of actions are needed, including the following:220
26 | FEAST ANd FAMINE IN THE GrEAT LAkES
• Address loadings from point sources, including upgrading municipal wastewater treatment plants and reducing levels of phosphorus in detergents.
• Promote expansion or maintenance of natural cover, to reduce flows and sediment, and nutrient export from watersheds;
• Expand the scope and intensity of best management practices in agricultural lands, including through improved tillage practices, improved manure management, and adopting new technologies for erosion control.
• Ensure that all municipalities have a Pollution Prevention Control Plan, with components that may include the retrofit/design of stormwater facilities and adoption of sustainable planning to reduce flows, sediment and nutri-ent loads to surface waters.
Also, improved coordination among programs at all levels of government is needed. Linkages between the GLWQA and Farm Bill programs, for example, should be explored and encouraged. Managers should pursue harmonization of ecosystem goals as appropriate (e.g., GLWQA water quality targets, LaMP objectives,221 fish community objectives as set by the Great Lakes Fishery Commission222, and state water quality criteria). Fishery management is a valuable tool for dealing with ecosystem changes, and while managers must adjust to new eco-system regimes with changes in stocking and other practices,223 innovative solutions to the feast/famine dichotomy might be found by working with fisheries resource groups. For instance, managers could alter stocking practices to encourage top-level predators such as Atlantic salmon that are better adapted to new offshore food webs.224
Finally, it is critical that adequate funding be provided for all programs, including through the Great Lakes Restoration Initiative (GLRI) Focus Area 3: Nearshore Health and Nonpoint Source Pollution.225 The current higher levels of federal funding for the Great Lakes on the U.S. side must be invested wisely in efforts to restore aquatic habitats as well as in projects that reduce runoff from targeted watersheds. Similar increased funding efforts are needed on the Canadian side as well.
research and MonitoringResearch and monitoring programs must evaluate, adjust to, and study new ecosystem regimes to improve our understanding of nutrient dynamics in the Great Lakes. For instance, eutrophication models need to be improved to account for altered nutrient processes following the dreissenid invasions.226 Current monitoring programs, such as the EPA’s offshore surveillance program,227 leave a gap in monitoring nearshore areas of the lakes that pre-vents better understanding of that important part of the ecosystem. Offshore monitoring efforts are important and should be sustained; however, given the new feast/famine dichotomy, standardized, regular, and targeted monitoring is needed in nearshore areas. Monitoring in the nearshore zone is particularly important because blooms of harmful algae such as Microcystis and Cladophora occur there, and human uses are concentrated along shorelines. Continued and enhanced tributary monitoring is also needed to understand how phosphorus is mov-ing from the land into the lakes. Additionally, monitoring efforts could be improved through coordination. For example, EPA’s offshore surveillance program performs more frequent, regular monitoring than Environment Canada, but Canada’s program has greater spatial coverage in each lake. Working together, these two programs could increase the frequency and extent of monitoring. The Binational Coordinated Science and Monitoring Initiative228 offers promise to help integrate and coordinate monitoring efforts, but needs adequate sustained funding and would benefit from ongoing input from stakeholders in each lake basin. Finally, monitoring of fish populations and other organisms must adjust to new ecosystem paradigms. Current fishery assessments and research are focused on the offshore. There is a need to develop new fisheries assessment programs that include both nearshore and offshore habitats. Similarly, increased monitoring of other aspects of the altered nearshore waters and habitats is necessary. 229
In spite of new efforts such as the GLRI, scientists in the Great Lakes are faced with limited funding and resources to carry out research and monitoring programs. Thus, scientific efforts must focus on priority top-ics and geographic areas as identified through expert deliberations. For example, the Lake Erie Millenium Network’s 2011 Synthesis Team Report230 identifies specific research needs to better understand processes of nutrient transport from the landscape to the lakes. The role of nitrogen in encouraging blooms of toxic Microcystis is poorly understood and should be further studied.231
Finally, there is a need to better integrate the results of research and monitoring into development and implementation of policy. As science advances our understanding of new nutrient dynamics, invasive species changes and ecosystem impacts, this knowledge must help guide the development of water quality objectives and loading targets, as well as programs to meet the targets.
FEAST ANd FAMINE IN THE GrEAT LAkES | 27
Education and OutreachChanges to policies and research efforts are necessary to solve the nutrient problems in the Great Lakes, but on their own will not be sufficient. An educated and informed public of water quality stewards will be necessary to ensure that nutrient reduction efforts are successful. Thus, we must enhance outreach and education to inform the public on the feast/famine problem, its causes, and its solutions. It is vital that the public understands both nearshore eutrophication and offshore oligotrophication and how the two problems are linked. This can be par-tially accomplished through the promotion of existing outreach and education efforts, such as EPA’s Nitrogen and Phosphorus Pollution Outreach Portal.232 Outreach efforts must be ramped up across the basin to empower the public by providing simple actions they can take (see “What You Can Do” below). The public also should be made aware of opportunities to weigh in on policies and planning efforts such as watershed plans, and should be encouraged to actively participate in the governance of their precious water resources. Existing public engagement and outreach efforts through bodies and institutions such as LaMP Public Forums, Sea Grant outreach programs, and university extension programs must be fully supported.
Invasive SpeciesThis report has focused on the dichotomy between feast and famine in the Great Lakes, where two invasive mussel species the size of a fingernail have changed the way an entire ecosystem functions and responds to human-induced stressors. Clearly, invasive species can impact the lakes in ways we cannot anticipate. Thus, we must make every effort to prevent the introduction and spread of invasive species in the Great Lakes. Example measures that should be taken include supporting strict regulation of organisms in trade, tightening controls on ballast water in commercial ships, and preventing the movement of organisms through canals and waterways (e.g., through building a permanent separation between the Mississippi River and Great Lakes Basins in the Chicago area). In addition, efforts to include a comprehensive invasive species annex in the GLWQA must be encouraged to reflect the important connections between non-native organisms and water quality.
At present, there is little that can be done to control or eradicate the invasive dreissenid mussels that are wreaking havoc on Great Lakes water quality and food webs. However, we must continue to explore innovative control methods for zebra and quagga mussels and other harmful invasive species. Important work is already underway and should continue to be supported. For example, scientists have developed, and a private company is now marketing, a product that kills only invasive dreissenid mussels. Currently, studies are examining the use of this control method in open waters such as the Great Lakes.233 Researchers at the U.S. Geological Survey are studying the biology of invasive mussels to inform selective control methods.234 Additionally, many fish species in the Great Lakes consume dreissenids,235 potentially representing a powerful biological control method that could be encouraged.236 These and other efforts to develop creative invasive spe-cies control solutions should be supported.
WHAT YOu CAN dO
although residential areas contribute only a small amount to phosphorus pollution, every effort helps to pre-vent eutrophication in the Great Lakes. There are simple things the average citizen can do to reduce runoff of nutrients from their yards:237
• Use only phosphorus-free fertilizer that is designated for lawns;• Apply fertilizer in smaller quantities and less often, and not before anticipated heavy rainfall;• Do not apply fertilizer within 25 feet of any body of water;• Get your soil tested to see what nutrients your lawn needs;• Pick up all pet waste and dispose in a garbage can;• Maintain your septic system properly;• keep water on your property by installing rain gardens and/or rain barrels.
there are also actions you can take to prevent the introduction and transfer of invasive species that might otherwise harm the Great Lakes. If you boat or fish in the Great Lakes or any inland waters in the basin, follow recommended guidelines to prevent the spread of invasive species. visit http://www.protectyourwaters.net/ for more information. Aquarium enthusiasts and water gardeners should be aware of invasive species and avoid releasing them into the environment. See http://www.habitattitude.net/ for recommended guidelines.
28 | FEAST ANd FAMINE IN THE GrEAT LAkES
EndnotES
1 Government of Canada and U.S. Environmental Protection Agency, 1995. The Great Lakes: An Environmental Atlas and Resource Book. Fuller, K., Shear, H., and Wittig, J. (Eds.) Available from: http://www.epa.gov/glnpo/atlas/index.html
2 U.S. Environmental Protection Agency and Environment Canada, 2009. State of the Great Lakes 2009 Highlights. Available from: http://binational.net/solec/sogl2009/sogl_2009_h_en.pdf; Hjartarson, J., Mendelsohn, M., Bramwell, A., and Hintonet, K., 2011. The Vital Commons: An Agenda for the Great Lakes - St. Lawrence Region. Available from: http://www.greatlakessummit.org/wp-content/uploads/2011/03/The%20Vital%20Commons_digital.pdf.
3 National Oceanic and Atmospheric Administration, 2010. Coastal Zone Management Act Performance Measurement System: 2010 Report on Contextual Indicators. Available from: http://coastalmanagement.noaa.gov/success/media/contextualindicator2010.pdf
4 Government of Canada and U.S. Environmental Protection Agency, 1995, supra note 1.5 U.S. Fish and Wildlife Service, 2011. Endangered Species Program in the Upper Midwest. See http://www.
fws.gov/midwest/endangered/lists/cty_indx.html for species lists.6 World Business Chicago, 2011. Great Lakes St. Lawrence Economic Region Profile. Available from: http://
www.worldbusinesschicago.com/files/data/GLSL_Economy_Update_2011%20(2009%20data)_1.pdf7 Vaccaro, L., and Read, J., 2011. Vital to our Nation’s Economy: Great Lakes Jobs Report 2011. Michigan Sea
Grant: Ann Arbor, MI. Available from: http://ww.miseagrant.umich.edu/economy8 National Park Service, 2009. Find a Park. Available from: http://www.nps.gov/findapark/index.htm9 Southwick Associates, 2007. Sportfishing in America: An Economic Engine and Conservation Powerhouse.
Produced for the American Sportfishing Association with funding from the Multistate Conservation Grant Program. Available from: http://www.asafishing.org/images/statistics/resources/Sportfishing%20in%20America%20Rev.%207%2008.pdf
10 Great Lakes Commission, 2007. Great Lakes Recreational Boating’s Economic Punch. Available from: http://www.glc.org/recboat/pdf/rec-boating-final-small.pdf
11 Vaccaro, L., and Read, J., 2011, supra note 7.12 The Great Lakes Regional Collaboration Strategy, 2005. Available from: http://www.glrc.us/strategy.html13 See state-specific fact sheets, Great Lakes Commission, 2011. Available from: http://www.glc.org/restore14 Austin, J.C., Anderson, S., Courant, P.N., and Litan, R.E., 2007. Healthy Waters, Strong Economy: The
Benefits of Restoring the Great Lakes Ecosystem. The Brookings Institution, Washington, D.C. Available from: http://www.brookings.edu/metro/pubs/20070904_gleiecosystem.pdf
15 Bails, J., Beeton, A., Bulkley, J., DePhilip, M., Gannon, J., Murray, M., Regier, H., and Scavia, D., Prescription for Great Lakes Ecosystem protection and restoration. Available from: http://www.health-ylakes.org/site_upload/upload/prescriptionforgreatlakes.pdf.
16 Carlson, R.E., 1977. A trophic state index for lakes. Limnology and Oceanography 22, 361-369; Carlson, R.E., and Simpson, J., 1996. A Coordinator’s Guide to Volunteer Lake Monitoring Methods. North American Lake Management Society. Available from: http://www.secchidipin.org/tsi.htm
17 Schindler, D.W., 1974. Eutrophication and recovery in experimental lakes: implications for lake manage-ment. Science 184, 897-899; Schindler, D.W., 1977. Evolution of phosphorus limitation in lakes. Science 195, 260-262; Correll, D.L., 1998. The role of phosphorus in the eutrophication of receiving waters: A review. Journal of Environmental Quality 27, 261-266
18 Carlson, R.E., and Simpson, J., 1996, supra note 16.19 Patalas, K., 1972. Crustacean plankton and eutrophication of St. Lawrence Great Lakes. Journal of the
Fisheries Research Board of Canada 29, 1451-1462; Dobson, H.F.H., Gilberts M., and Sly, P.G., 1974. Summary and comparison of nutrients and related water-quality in lakes Erie, Ontario, Huron, and
FEAST ANd FAMINE IN THE GrEAT LAkES | 29
Superior. Journal of the Fisheries Research Board of Canada 31, 731-738; Vollenweider, R.A., Munawar, M., and Stadelmann, P., 1974. A comparative review of phytoplankton and primary production in the Laurentian Great Lakes. Journal of the Fisheries Research Board of Canada 31, 739–762; Munawar, M., and Munawar, I.F., 1982. Phycological studies in lakes Ontario, Erie, Huron, and Superior. Canadian Journal of Botany 60, 1837- 1858; Beeton, A.M., and Saylor, J.H., 1995. Limnology of Lake Huron. In: Munawar, M., Edsall, T., and Leach, J. (Eds.), The Lake Huron ecosystem: ecology, fisheries, and manage-ment. Ecovision World Monograph Series, SPB Academic Publ., Amsterdam, pp. 1-37.
20 Patalas, K., 1972, supra note 19; Dobson et al. 1974, supra note 19; Vollenweider et al. 1974, supra note 19; Munawar and Munawar 1982, supra note 19.
21 Vollenweider et al. 1974, supra note 19; Beeton and Saylor 1995, supra note 19.22 Beeton, A.M., and Edmonson, W.T., 1972. The eutrophication problem. Journal of the Fisheries Research
Board of Canada 19, 673-682.23 Stoermer, E.F., Wolin, J.A., and Schelske, C.L., 1993. Paleolimnological comparison of the Laurentian
Great Lakes based on diatoms. Limnology and Oceanography 38, 1311-1316.24 International Joint Commission, 1970. Pollution of Lake Erie, Lake Ontario, and the international sec-
tion of the St. Lawrence River. International Joint Commission, Washington, D.C., and Ottawa, Ontario. Available from: http://www.ijc.org/php/publications/pdf/ID364.pdf; DePinto, J.V., Young, T.C., and McIlroy, L.M., 1986. Great Lakes water quality improvement. Environmental Science and Technology 20, 752-759; Carpenter, S.R., Caraco, N.F., Correll, D.L., Howarth, R.W., Sharpley, A.N., and Smith, V.H., 1998. Nonpoint pollution of surface waters with phosphorus and nitrogen. Ecological Applications 8, 559-568; Correll, D.L., 1998, supra note 16.
25 Carpenter et al. 1998, supra note 24; Watson, S.B., Ridal, J., and Boyer, G.L., 2008. Taste and odour and cyanobacterial toxins: Impairment, prediction, and management in the Great Lakes. Canadian Journal of Fisheries and Aquatic Sciences 65, 1779–1796.
26 International Joint Commission, 1980. Phosphorus management for the Great Lakes: Final report of the Phosphorus Management Strategies Task Force. International Joint Commission, Washington, D.C., and Ottawa, Ontario; Higgins, S.N., Malkin, S.Y., Howell, E.T., Guildford, S.J., Campbell, L., Hiriart-Baer, V., and Hecky, R.E., 2008. An ecological review of Cladophora glomerata (Chlorophyta) in the Laurentian Great Lakes. Journal of Phycology 44, 839-854; Auer, M.T., Tomlinson, L.M., Higgins, S.N., Malkin, S.Y., Howell, E.T., and Bootsma, H.A., 2010. Great Lakes Cladophora in the 21st century: Same algae—differ-ent ecosystem. Journal of Great Lakes Research 36, 248-255.
27 DePinto et al. 1986, supra note 24.28 Carpenter et al. 1998, supra note 24; Correll, D.L., 1998, supra note 17.29 IJC 1980, supra note 26; Ludsin, S.A., Kershner, M.W., Blocksom, K.A., Knight, R.L., and Stein, R.A.,
2001. Life after death in Lake Erie: Nutrient controls drive fish species richness, rehabilitation. Ecological Applications 11, 731-746.
30 Eshenroder, R.L., and Burnham-Curtis, M.K., 1999. Species succession and sustainability of the Great Lakes fish community. In: Taylor, W.W., and Ferreri, C.P. (Eds.), Great Lakes Fishery Policy and Management: A Binational Perspective. The Michigan State University Press, East Lansing, MI, pp. 145-184.
31 Regier, H.A., and Hartman, W.L., 1973. Lake Erie’s fish community: 150 years of cultural stresses. Science 180, 1248-1255; Jude, D.J., and Tesar, F.J., 1985. Recent changes in the inshore forage fish of Lake Michigan. Canadian Journal of Fisheries and Aquatic Sciences 42, 1154-1157; Bence, J.R., and Smith, K.D., 1999. An overview of recreational fisheries of the Great Lakes. In: Taylor, W.W., and Ferreri, C.P. (Eds.), Great Lakes Fishery Policy and Management: A Binational Perspective. The Michigan State University Press, East Lansing, MI, pp. 259-306; Nepszy, S.J., 1999. The changing fishery regime in Lake Erie. In: Munawar, M., Edsall, T., and Munawar, I.F. (Eds.), State of Lake Erie: Past, present and future. Backhuys Publishers, Leiden, the Netherlands, pp. 233-239; Mills, E.L., Casselman, J.M., Dermott, R., Fitzsimons, J.D., Gal, G., Holeck, K.T., Hoyle, J.A., Johannsson, O.E., Lantry, B.F., Makarewicz, J.C., Millard, E.S., Munawar, I.F., Munawar, M., O’Gorman, R., Owens, R.W., Rudstam, L.G., Schaner, T., and Stewart, T.J., 2003. Lake Ontario: Food web dynamics in a changing ecosystem (1970-2000). Canadian Journal of Fisheries and Aquatic Sciences 60, 471-490.
30 | FEAST ANd FAMINE IN THE GrEAT LAkES
32 Cook, D.G., and Johnson, M.G., 1974. Benthic macroinvertebrates of the St. Lawrence Great Lakes. Journal of the Fisheries Research Board of Canada 31, 763–782.
33 Scott, W.B., and Crossman, E.J., 1973. Freshwater fishes of Canada. Bulletin of the Fisheries Research Board of Canada 184, Department of the Environment, Ottawa, ON; Wells, L., 1980. Food of alewives, yellow perch, spottail shiners, trout-perch, and slimy and fourhorn sculpins in southeastern Lake Michigan. U.S. Fish and Wildlife Service Technical Report 98, Ann Arbor, MI.
34 IJC 1980, supra note 26.35 IJC 1980, supra note 26; Krieger, K.A., Schloesser, D.W., Manny, B.A., Trisler, C.E., Heady, S.E., Ciborowski,
J.J.H., and Muth, K.M., 1996. Recovery of burrowing mayflies (Ephemeroptera: Ephemeridae: Hexagenia) in western Lake Erie. Journal of Great Lakes Research 22, 254-263.
36 DePinto et al. 1986, supra note 24.37 Id.38 DePinto et al. 1986, supra note 24; Millard, E.S., Johannsson, O.E., Nielson, M.A., and El-Shaarawi,
A.H., 2003. Long-term seasonal and spatial trends in nutrients, chlorophyll a and light attenuation in Lake Ontario. In: Munawar, M. (Ed.), State of Lake Ontario: Past, present, and future. Ecovision World Monograph Series, Aquatic Ecosystem Health and Management Society, pp. 97-132.
39 Lesht, B.M., Fontaine, T.D., and Dolan, D.M., 1991. Great Lakes total phosphorus model: Post audit and regionalized sensitivity analysis. Journal of Great Lakes Research 17, 3-17.
40 DePinto et al. 1986, supra note 24.41 Neilson M., L’Italien, S., Glumac, V., Williams, D., and Bertram, P., 1995. State of the Lakes Ecosystem
Conference Background Paper. Nutrients: Trends and system response. U.S. Environmental Protection Agency, Chicago, IL and Environment Canada, Burlington, ON. Available from: http://www.epa.gov/solec/archive/1994/1994_Nutrients%20_%20Trends_and_System-Response.pdf; Charlton, M.N., Le Sage R., and Milne, J.E., 1999. Lake Erie in transition: The 1990’s. In: Munawar, M., Edsall, T., and Munawar, I.F. (Eds.), State of Lake Erie: Past, present and future. Backhuys Publishers, Leiden, the Netherlands, pp. 97-123.
42 Dolan, D.M., 1993. Point source loadings of phosphorus to Lake Erie: 1986-1990. Journal of Great Lakes Research 19, 212-223; Matisoff, G., and Ciborowski, J.J.H., 2005. Lake Erie Trophic Status Collaborative Study. Journal of Great Lakes Research 31 (Suppl. 2), 1-10.
43 Millard et al. 2003, supra note 38; Evans, M.E., Fahnenstiel, G., and Scavia, D., 2011. Incidental oligotrophi-cation of North American Great Lakes. Environmental Science and Technology 45, 3297-3303.
44 Dove, A., 2009. Long-term trends in major ions and nutrients in Lake Ontario. Aquatic Ecosystem Health and Management 12, 281–295.
45 Charlton et al. 1999, supra note 41.46 Munawar, M., and Munawar, I.F., 1999. The changing phytoplankton biomass and its composition in Lake
Erie: A lake wide comparative analysis. In: Munawar, M., Edsall, T., and Munawar, I.F. (Eds.), State of Lake Erie: Past, present and future. Backhuys Publishers, Leiden, the Netherlands, pp. 125-154.
47 See for example Bierman, V.J., Dolan, D.M., and Kasprzyk, R., 1984. Retrospective analysis of the response of Saginaw Bay, Lake Huron, to reductions in phosphorus loadings. Environmental Science and Technology 18, 23-31.
48 Auer et al. 2010, supra note 26.49 Makarewicz, J.C., and Bertram, P., 1991. Evidence for the restoration of the Lake Erie ecosystem. BioScience
41, 216-223; Makarewicz, J.C., 1993. Phytoplankton biomass and species composition in Lake Erie, 1970 to 1987. Journal of Great Lakes Research 19, 258-274; Stoermer, E.F., Emmert, G., Julius, M.L., and Schelske, C.L., 1996. Paleolimnologic evidence of rapid recent change in Lake Erie’s trophic status. Canadian Journal of Fisheries and Aquatic Sciences 53, 1451-1458; Johannsson, O.E., Graham, D.M., Einhouse, D.W.E., and Mills, E.L., 1999. Historical and recent changes in the Lake Erie zooplankton community and their relationship to ecosystem function. In: Munawar, M., Edsall, T., and Munawar, I.F. (Eds.), State of Lake Erie: Past, present and future. Backhuys Publishers, Leiden, the Netherlands, pp. 169-196; Johannsson, O.E., 2003. A history of changes in zooplankton community structure and function in Lake Ontario: Responses to whole-lake remediation and exotic invasions. In: Munawar, M. (Ed.), State of Lake Ontario: Past, present, and future. Ecovision World Monograph Series, Aquatic Ecosystem Health and Management Society, pp. 221-256.
FEAST ANd FAMINE IN THE GrEAT LAkES | 31
50 Krieger et al. 1996, supra note 35; Edsall, T.A., Madenjian, C.P., and Manny, B.A., 1999. Burrowing may-flies in Lake Erie – a review. In: Munawar, M., Edsall, T., and Munawar, I.F. (Eds.), State of Lake Erie: Past, present and future. Backhuys Publishers, Leiden, the Netherlands, pp. 219-231.
51 Gopalan, G., Culver, D.A., Wu, L., and Trauben, B.K., 1998. Effects of recent ecosystem changes on the recruitment of young-of-the-year fish in western Lake Erie. Canadian Journal of Fisheries and Aquatic Sciences 55, 2572-2579.
52 Ludsin et al. 2001, supra note 29.53 For a more detailed discussion of the impacts of invasive species up to 2004, please see White, G., Murray,
M., and Jackson, S.E., 2004. Ecosystem Shock: The Devastating Impacts of Invasive Species on the Great Lakes Food Web. National Wildlife Federation. Available from: http://www.nwf.org/~/media/PDFs/Wildlife/EcosystemShock.ashx
54 For discussion and examples, see Stoermer et al. 1993, supra note 23; Nalepa, T.F., Hartson, D.J., Fanslow, D.L., Lang, G.A., and Lozano, S.J., 1998. Declines in benthic macroinvertebrate populations in southern Lake Michigan, 1980-1993. Canadian Journal of Fisheries and Aquatic Sciences 55, 2402-2413; Charlton et al. 1999, supra note 41; Nicholls, K.H., Standke, S.J., and Nepszy, G.J., 1999. Effects of dreisseneid mussles on nitrogen and phosphorus in north shore waters of Lake Erie. In: Munawar, M., Edsall, T., and Munawar, I.F. (Eds.), State of Lake Erie: Past, present and future. Backhuys Publishers, Leiden, the Netherlands, pp. 323-336; Munawar, M., and Munawar, I.F., 2003. In: Munawar, M. (Ed.), State of Lake Ontario: Past, present, and future. Ecovision World Monograph Series, Aquatic Ecosystem Health and Management Society, pp. 187-219; Depew, D.C., Guildford, S.J., and Smith, R.E.H., 2006. Nearshore-offshore compari-son of chlorophyll a and phytoplankton production in the dreissenid-colonized eastern basin of Lake Erie. Canadian Journal of Fisheries and Aquatic Sciences 63, 1115-1129.
55 Mills, E.L., Leach, J.H., Carlton, J.T., and Secor, C.L., 1994. Exotic species and the integrity of the Great Lakes: Lessons from the past. Bioscience 44, 666-676; Eshenroder and Burnham-Curtis 1999, supra note 30.
56 See for example Cook, P.M., Robbins, J.A., Endicott, D.D., Lodge, K.B., Guiney, P.D., Walker, M.K., Zabel, E.W., and Peterson, R.E., 2003. Effects of aryl hydrocarbon receptor-mediated early life stage toxicity on lake trout populations in Lake Ontario during the 20th century. Environmental Science and Technology 37, 3864-3877.
57 Mills et al. 1994, supra note 55; Eshenroder and Burnham-Curtis 1999, supra note 30.58 Fuller, P., Maynard, E., and Raikow, D., 2011. Alosa pseudoharengus. U.S. Geological Survey Nonindigenous
Aquatic Species Database, Gainesville, FL. Available from: http://nas.er.usgs.gov/queries/FactSheet.aspx?SpeciesID=490. Revised 9/24/2009.
59 Eshenroder and Burnham-Curtis 1999, supra note 30.60 Mills et al. 1994, supra note 55; Eshenroder and Burnham-Curtis 1999, supra note 30.61 Eshenroder and Burnham-Curtis 1999, supra note 30; Leach, J.H., Mills, E.L., and Dochoda, M.R., 1999.
Non-indigenous species in the Great Lakes: Ecosystem impacts, binational policies, and management. In: Taylor, W.W., and Ferreri, C.P. (Eds.), Great Lakes Fishery Policy and Management: A Binational Perspective. The Michigan State University Press, East Lansing, MI, pp. 185-207.
62 Mills et al. 1994, supra note 55; Eshenroder and Burnham-Curtis 1999, supra note 30; Madenjian, C.P., Fahnenstiel, G.L., Johengen, T.H., Nalepa, T.F., Vanderploeg, H.A., Fleischer, G.W., Schneeberger, P.J., Benjamin, D.M., Smith, E.B., Bence, J.R., Rutherford, E.S., Lavis, D.S., Robertson, D.M., Jude, D.J., and Ebener, M.P., 2002. Dynamics of the Lake Michigan food web, 1970-2000. Canadian Journal of Fisheries and Aquatic Sciences 59, 736-753; Mills et al. 2003, supra note 31.
63 Bence and Smith 1999, supra note 31; Eshenroder and Burnham-Curtis 1999, supra note 30; Madenjian et al. 2002, supra note 62; Mills et al. 2003, supra note 31.
64 Eshenroder and Burnham-Curtis 1999, supra note 30.65 Bence and Smith 1999, supra note 31; Nepszy 1999, supra note 31.66 Jude and Tesar 1985, supra note 31; Madenjian et al. 2002, supra note 62; Mills et al. 2003, supra note 31.67 Jude, D.J., Reider, R. H., and Smith, G. R., 1992. Establishment of Gobiidae in the Great Lakes Basin.
Canadian Journal of Fisheries and Aquatic Sciences. 49, 416-421.
32 | FEAST ANd FAMINE IN THE GrEAT LAkES
68 Charlebois, P.M., Corkum, L.D., Jude, D.J., and Knight, C., 2001. The round goby (Neogobius melanosto-mus) invasion: Current research and future needs. Journal of Great Lakes Research 27, 263-266.
69 Janssen, J., and Jude, D.J., 2001. Recruitment failure of mottled sculpin Cottus bairdi in Calumet Harbor, southern Lake Michigan, induced by the newly introduced round boby Neogobius melanostomus. Journal of Great Lakes Research 27, 319-328.
70 Bronte, C.R., Evrard, L.M., Brown, W.P., Mayo, K.R., and Edwards, A.J., 1998. Fish community changes in the St. Louis River estuary, Lake Superior, 1989-1996: Is it ruffe or population dynamics? Journal of Great Lakes Research 24, 309-318.
71 Fuller, P., and Jacobs, G., 2011. Gymnocephalus cernuus. U.S. Geological Survey Nonindigenous Aquatic Species Database, Gainesville, FL. Available from: http://nas.er.usgs.gov/queries/FactSheet.aspx?SpeciesID=7. Revised 8/25/2011.
72 Mills et al. 1994, supra note 55.73 Vanderploeg, H.A., Nalepa, T.F., Jude, D.J., Mills, E.L., Holeck, K.T., Liebig, J.R., Grigorovich, I.A., and
Ojaveer, H., 2002. Dispersal and emerging ecological impacts of Ponto-Caspian species in the Laurentian Great Lakes. Canadian Journal of Fisheries and Aquatic Sciences 59, 1209-1228.
74 Hebert, P.D.N., Muncaster, B.W., and Mackie, G.L., 1989. Ecological and genetic studies on Dreissena poly-morpha (Pallas): A new mollusc in the Great Lakes. Canadian Journal of Fisheries and Aquatic Sciences 46: 1587-1591; May, B., and Marsden, J.E., 1992. Genetic identification and implications of another invasive species of dreissenid mussel in the Great Lakes. Canadian Journal of Fisheries and Aquatic Sciences 59, 1209-1228.
75 Vanderploeg et al. 2002, supra note 73.76 Jarvis, P.J., Dow, J., Dermott, R., and Bonnell, R., 2000. Zebra (Dreissena polymorpha) and quagga mus-
sel (Dreissena bugensis) distribution and density in Lake Erie, 1992-1998. Canadian Technical Report of Fisheries and Aquatic Sciences No. 2304; Johannsson, O.E., Dermott, R., Graham, D.M., Dahl, J.A., Millard, E.S., Myles, D.D., and LeBlanc, J., 2000. Benthic and pelagic secondary production in Lake Erie after the invasion of Dreissena spp. with implications for fish production. Journal of Great Lakes Research 26, 31-54; Nalepa, T.F., Fanslow, D.L., Pothoven, S.A., Foley, A.J., and Lang, G.A., 2007. Long-term trends in benthic macroinvertebrate populations in Lake Huron over the past four decades. Journal of Great Lakes Research 33, 421-436; Watkins, J.M., Dermott, R., Lozano, S.J., Mills, E.L., Rudstam, L.G., and Scharold, J.V., 2007. Evidence for remote effects of dreissenid mussels on the amphipod Diporeia: Analysis of Lake Ontario benthic surveys, 1972–2003. Journal of Great Lakes Research 33, 642-657; Dermott, R., and Dow, J., 2008. Changing benthic fauna of Lake Erie between 1993 and 1998. In: Munawar, M., and Heath, R. (Eds.), Checking the Pulse of Lake Erie. Ecovision World Monograph Series, Aquatic Ecosystem Health and Management Society, pp. 409-438; Nalepa, T.F., Fanslow, D.L., and Lang, G.A., 2009. Transformation of the offshore benthic community in Lake Michigan: Recent shift from the native amphipod Diporeia spp. to the invasive mussel Dreissena rostriformis bugensis. Freshwater Biology 54, 466–479; Nalepa, T.F., Fanslow, D.L., and Pothoven, S.A., 2010. Recent changes in density, biomass, recruitment, size structure, and nutritional state of Dreissena populations in southern Lake Michigan. Journal of Great Lakes Research 36, 5-19.
77 Alexander, J. April 15 2011. Quagga mussels: 950 trillion tiny time bombs in our lakes? Muskegon Chronicle. Available from: http://www.mlive.com/outdoors/index.ssf/2011/04/quagga_mussels_950_trillion_ti.html
78 Vanderploeg et al. 2002, supra note 73.79 Fahnenstiel, G.L., Lang, G.A., Nalepa, T.F., and Johengen, T.H., 1995. Effects of zebra mussel (Dreissena
polymorpha) colonization on water quality parameters in Saginaw Bay, Lake Huron. Journal of Great Lakes Research 21, 435-448; Heath, R.T., Fahnenstiel, G.L., Gardner, W.S., Cavaletto, J.F., and Hwang, S., 1995. Ecosystem-level effects of zebra mussels (Dreissena polymorpha): An enclosure experiment in Saginaw Bay, Lake Huron. Journal of Great Lakes Research 21, 501-516; Holland, R.E., Johengen, T.H., and Beeton, A.M., 1995. Trends in nutrient concentrations in hatchery bay, western Lake Erie, before and after Dreissena polymorpha. Canadian Journal of Fisheries and Aquatic Sciences 52, 1202-1209; Depew et al. 2006, supra note 54; Vanderploeg et al. 2002, supra note 73.
FEAST ANd FAMINE IN THE GrEAT LAkES | 33
80 Fahnenstiel et al. 1995, supra note 79; Heath et al. 1995, supra note 79; Holland et al. 1995, supra note 79; Vanderploeg et al. 2002, supra note 73; Higgins, S.N., and Vander Zanden M.J., 2010. What a differ-ence a species makes: A meta-analysis of dreissenid mussel impacts on freshwater ecosystems. Ecological Monographs 80, 179–196.
81 Johengen, T.H., Nalepa, T.F., Fahnenstiel, G.L., and Goudy, G., 1995. Nutrient changes in Saginaw Bay, Lake Huron, after the establishment of the zebra mussel (Dreissena polymorpha). Journal of Great Lakes Research 21, 449-464; Arnott, D.L., and Vanni, M.J., 1996. Nitrogen and phosphorus recycling by the zebra mussel (Dreissena polymorpha) in the western basin of Lake Erie. Canadian Journal of Fisheries and Aquatic Sciences 53, 646-659.
82 Bruesewitz, D.A., Tank, J.L., and Bernot, M.J., 2008. Delineating the effects of zebra mussels (Dreissena polymorpha) on N transformation rates using laboratory mesocosms. Journal of the North American Benthological Society 27, 236-251.
83 Schindler 1974, supra note 17; Schindler 1977, supra note 17; Correll, D.L., 1998, supra note 17.84 Johengen et al. 1995, supra note 81; Vanderploeg et al. 2002, supra note 73.85 Johengen et al. 1995, supra note 81; Charlton et al. 1999, supra note 41; Nicholls et al. 1999, supra note
54; Lam, D.C.L., Schertzer, W.M., McCrimmon, R.C., Charlton, M., and Millard, S., 2008. Modelling phosphorus and dissolved oxygen conditions pre- and post-dreissena arrival in Lake Erie. In: Munawar, M., and Heath, R. (Eds.), Checking the Pulse of Lake Erie. Ecovision World Monograph Series, Aquatic Ecosystem Health and Management Society, pp. 97-121.
86 Nalepa, T.F., NOAA Great Lakes Environmental Research Laboratory, personal communication, 1 Sept 2011.
87 Brown, M.K., Aguilar, C., and Cuhel, R., 2011. Particulate phosphorus content in the tissue of quagga mussels and water column biomass in distinct areas of Lake Michigan [Abstract]. American Society for Limnology and Oceanography Aquatic Sciences Meeting, 12-18 February 2011, San Juan, Puerto Rico. Available from: http://www.sgmeet.com/aslo/sanjuan2011/viewabstract2.asp?AbstractID=7983
88 Dove, A., and Warren, G., 2011. Draft State of the Lakes Ecosystem Conference 2011 Indicator Report: Nutrient Concentrations. U.S. Environmental Protection Agency, Chicago, IL and Environment Canada, Burlington, ON.
89 Johengen et al. 1995, supra note 81; Vanderploeg et al. 2002, supra note 73; Hecky, R.E., Smith. R.E.H., Barton, D.R., Guildford, S.J., Taylor, W.D., Charlton, M.N., and Howell, T., 2004. The nearshore phos-phorus shunt: A consequence of ecosystem engineering by dreissenids in the Laurentian Great Lakes. Canadian Journal of Fisheries and Aquatic Sciences 61, 1285-1293; Ozersky, T., Malkin, S.Y., Barton, D.R., and Hecky, R.E., 2009. Dreissenid phosphorus excretion can sustain C. glomerata growth along a portion of Lake Ontario shoreline. Journal of Great Lakes Research 35, 321-328; Turner, C.B., 2010. Influence of zebra (Dreissena polymorpha) and quagga (Dreissena rostriformis) mussel invasions on benthic nutrient and oxygen dynamics. Canadian Journal of Fisheries and Aquatic Sciences 67, 1899-1908.
90 Fishman, D.B., Adlerstein, S.A., Vanderploeg, H.A., Fahnenstiel, G.L., and Scavia, D., 2009. Causes of phytoplankton changes in Saginaw Bay, Lake Huron, during the zebra mussel invasion. Journal of Great Lakes Research 35, 482-495; Fishman, D.B., Adlerstein, S.A., Vanderploeg, H.A., Fahnenstiel, G.L., and Scavia, D., 2010. Phytoplankton community composition of Saginaw Bay, Lake Huron, during the zebra mussel (Dreissena polymorpha) invasion: A multivariate analysis. Journal of Great Lakes Research 36, 9-19.
91 Hecky et al. 2004, supra note 89.92 Hecky et al. 2004, supra note 89; Higgins, S.N., Howell, E.T., Hecky, R.E., Guildford, S.J., and Smith,
R.E., 2005. The wall of green: The status of Cladophora glomerata on the northern shores of Lake Erie’s eastern basin, 1995–2002. Journal of Great Lakes Research 31, 547-563; Higgins et al. 2008, supra note 26; Ozersky et al. 2009, supra note 89.
93 Cha, Y., Stow, C.A., Nalepa, T.F., and Reckhow, K.H., 2011. Do invasive mussels restrict offshore phospho-rus transport in Lake Huron? Environmental Science and Technology 45, 7226–7231.
94 Fahnenstiel et al. 1995, supra note 79; Lowe, R.L., and Pillsbury, R.W., 1995. Shifts in benthic algal commu-nity structure and function following the appearance of zebra mussels (Dreissena polymorpha) in Saginaw Bay, Lake Huron. Journal of Great Lakes Research 21, 558-566; Skubinna, J.P., Coon, T.G., and Batterson,
34 | FEAST ANd FAMINE IN THE GrEAT LAkES
T.R., 1995. Increased abundance and depth of submersed macrophytes in response to decreased turbidity in Saginaw Bay, Lake Huron. Journal of Great Lakes Research 21, 476-488; Davies, J., and Hecky, R.E., 2005. Initial measurements of benthic photosynthesis and respiration in Lake Erie. Journal of Great Lakes Research 31 (Suppl. 2), 195-207.
95 Vanderploeg, H.A., Liebig, J.R., Carmichael, W.W., Agy, M.A., Johengen, T.H., Fahnenstiel, G.L., and Nalepa, T.F., 2001. Zebra mussel (Dreissena polymorpha) selective filtration promoted toxic Microcystis blooms in Saginaw Bay (Lake Huron) and Lake Erie. Canadian Journal of Fisheries and Aquatic Sciences 58, 1208-1221; Vanderploeg et al. 2002, supra note 73; Fishman et al. 2009, supra note 90.
96 Heath et al. 1995, supra note 79; Arnott and Vanni 1996, supra note 81.97 Campbell, L.M., Thacker, R., Barton, D., Muir, D.C.G., Greenwood, D., and Hecky, R.E., 2009.
Re-engineering the eastern Lake Erie littoral food web: The trophic function of non-indigenous Ponto-Caspian species. Journal of Great Lakes Research 35, 224-231.
98 Nalepa et al. 1998, supra note 54; Lozano, S.J., Scharold, J.V., and Nalepa, T.F., 2001. Recent declines in benthic macroinvertebrate densities in Lake Ontario. Canadian Journal of Fisheries and Aquatic Sciences 58, 518-529; Madenjian et al. 2002, supra note 62; Nalepa, T.F., Fanslow, D.L., Foley, A.J., Lang, G.A., Eadie, B.J., and Quigley, M.A., 2006. Continued disappearance of the benthic amphipod Diporeia spp. in Lake Michigan: Is there evidence for food limitation? Canadian Journal of Fisheries and Aquatic Sciences 63, 872-890; Nalepa et al. 2007, supra note 76; Watkins et al. 2007, supra note 76; Nalepa et al. 2009, supra note 76; Barbiero, R.P., Schmude, K., Lesht, B.M., Riseng, C.M., Warren, G.J., and Tuchman, M.L., 2011. Trends in Diporeia populations across the Laurentian Great Lakes, 1997–2009. Journal of Great Lakes Research 37, 9-17.
99 Scott and Crossman 1973, supra note 33; Wells 1980, supra note 33; Cook and Johnson 1974, supra note 32; Nalepa, T.F., 1989. Estimates of macroinvertebrate biomass in Lake Michigan. Journal of Great Lakes Research 15, 437–443.
100 Watkins et al. 2007, supra note 76; Nalepa et al. 2007, supra note 76; Nalepa et al. 2009, supra note 76; Barbiero et al. 2011, supra note 98.
101 Barbiero et al. 2011, supra note 98.102 Nalepa et al. 1998, supra note 54; Dermott, R., 2001. Sudden disappearance of the amphipod Diporeia from east-
ern Lake Ontario, 1993–1995. Journal of Great Lakes Research 27, 423-433; Nalepa et al. 2006, supra note 98.103 Dermott, R., Munawar, M., Bonnell, R., Carou, S., Niblock, H., Nalepa, T.F., and Messick, G., 2005.
Preliminary investigations for causes of the disappearance of Diporeia spp. from Lake Ontario. In: Mohr, L.C., and Nalepa, T.F. (Eds.), Proceedings of a Workshop on the Dynamics of Lake Whitefish (Coregonus clupeaformis) and the Amphipod Diporeia spp. in the Great Lakes. Great Lakes Fishery Commission Technical Report 66; Nalepa, T.F., Fanslow, D.L., Messick, G., 2005. Characteristics and potential causes of declining Diporeia spp. populations in southern Lake Michigan and Saginaw Bay, Lake Huron. In: Mohr, L.C., and Nalepa, T.F. (Eds.), Proceedings of a Workshop on the Dynamics of Lake Whitefish (Coregonus clupeaformis) and the Amphipod Diporeia spp. in the Great Lakes. Great Lakes Fishery Commission Technical Report 66
104 Lozano et al. 2001, supra note 98.; Mills et al. 2003, supra note 31.105 Pothoven, S.A., and Madenjian, C.P., 2008. Changes in consumption by alewives and lake whitefish
after dreissenid mussel invasions in lakes Michigan and Huron. North American Journal of Fisheries Management 28, 308-320.
106 Pothoven, S.A., Hondorp, D.W., and Nalepa, T.F., 2011. Declines in deepwater sculpin Myoxocephalus thompsonii energy density associated with the disappearance of Diporeia spp. in lakes Huron and Michigan. Ecology of Freshwater Fish 20, 14–22.
107 Pothoven, S.A., Nalepa, T.F., Schneeberger, P.J., and Brandt, S.B., 2001. Changes in diet and body condition of lake whitefish in southern Lake Michigan associated with changes in benthos. North American Journal of Fisheries Management 21, 876-883; Mohr, L.C., and Nalepa, T.F. (Eds.), Proceedings of a Workshop on the Dynamics of Lake Whitefish (Coregonus clupeaformis) and the Amphipod Diporeia spp. in the Great Lakes. Great Lakes Fishery Commission Technical Report 66; Pothoven, S.A., and Nalepa, T.F., 2006.
FEAST ANd FAMINE IN THE GrEAT LAkES | 35
Feeding ecology of lake whitefish in Lake Huron. Journal of Great Lakes Research 32, 489-501; Pothoven and Madenjian 2008, supra note 105.
108 Fahnenstiel, G., Nalepa, T., Pothoven, S., Carrick, H., and Scavia, D., 2010. Lake Michigan lower food web: Long-term observations and Dreissena impact. Journal of Great Lakes Research 36, 1-4; Mida, J.L., Scavia, D., Fahnenstiel, G.L., Pothoven, S.A., Vanderploeg, H.A., and Dolan, D.M., 2010. Long-term and recent changes in southern Lake Michigan water quality with implications for present trophic status. Journal of Great Lakes Research 36, 42-49; Barbiero et al. 2011, supra note 98; Evans et al. 2011, supra note 40.
109 Evans et al. 2011, supra note 43.110 Id.111 Holeck, K.T., Watkins, J.M., Mills, E.L., Johannsson, O., Millard, S., Richardson, V., and Bowen, K.,
2008. Spatial and long-term temporal assessment of Lake Ontario water clarity, nutrients, chlorophyll a, and zooplankton. Aquatic Ecosystem Health and Management 11, 377–391; Barbiero, R.P., Bunnell, D.B., Rockwell, D.C., and Tuchman, M.L., 2009. Recent increases in the large glacial-relict calanoid Limnocalanus macrurus in Lake Michigan. Journal of Great Lakes Research 35, 285-292; Barbiero et al. 2011, supra note 98.
112 Riley, S.C., Roseman, E.F., Nichols, S.J., O’Brien, T.P., Kiley, C.S., and Schaeffer, J.S., 2008. Deepwater demersal fish community collapse in Lake Huron. Transactions of the American Fisheries Society 137, 1879-1890.
113 Lake Huron Binational Partnership, 2008. 2008-2010 Action Plan. Available from: http://www.epa.gov/glnpo/lamp/lh_2008/lh_2008_8.pdf; Michigan Department of Natural Resources, 2010. Changes in Lake Huron’s ecosystem and foodweb cause Chinook salmon collapse. Available from: http://www.michigan.gov/documents/LakeHuronNewEcosystem-foodweb_122463_7.pdf
114 Hecky et al. 2004, supra note 89; Higgins and Vander Zanden 2010, supra note 80.115 Mellina, E., Rasmussen, J.B., and Mills, E.L., 1995. Impact of zebra mussel (Dreissena polymorpha) on phos-
phorus cycling and chlorophyll in lakes. Canadian Journal of Fisheries and Aquatic Sciences 52, 2553-2573; Nicholls et al. 1999, supra note 54; Hall, S.R., Pauliukonis, N.K., Mills, E.L., Rudstam, L.G., Schneider, C.P., Lary, S.J., and Arrhenius, F., 2003. A comparison of total phosphorus, chlorophyll a, and zooplank-ton in embayment, nearshore, and offshore habitats of Lake Ontario. Journal of Great Lakes Research 29, 54-69; Qualls, T.M., Dolan, D.M., Reed, T., Zorn, M.E., and Kennedy, J., 2007. Analysis of the impacts of the zebra mussel, Dreissena polymorpha, on nutrients, water clarity, and the chlorophyll-phosphorus rela-tionship in lower Green Bay. Journal of Great Lakes Research 33, 617-626.
116 Vanderploeg et al. 2002, supra note 73.117 Schloesser, D.W., Nalepa, T.F., and Mackie, G.L., 1996. Zebra mussel infestation of unionid bivalves
(Unionidae) in North America. American Zoologist 36, 300-310; Vanderploeg et al. 2002, supra note 73.118 Ricciardi, A., 2001. Facilitative interactions among aquatic invaders: Is an “invasional meltdown” occurring
in the Great Lakes? Canadian Journal of Fisheries and Aquatic Sciences 58, 2513-2525; Vanderploeg et al. 2002, supra note 73.
119 Campbell et al. 2009, supra note 97; Madenjian, C.P., Pothoven, S.A.,Schneeberger, P.J., Ebener, M.P., Mohr, L.C., Nalepa, T.F., and Bence, J.R., 2010. Dreissenid mussels are not a “dead end” in Great Lakes food webs. Journal of Great Lakes Research 36, 73-77.
120 Pothoven et al. 2001, supra note 107; Mohr and Nalepa 2005, supra note 107; Pothoven et al. 2006, supra note 107; Pothoven and Madenjian 2008, supra note 105.
121 Benoit, H.P., Johannsson, O.E., Warner, D.M., Sprules, W.G., and Rudstam, L.G., 2002. Assessing the impact of a recent predatory invader: The population dynamics, vertical distribution, and potential prey of Cercopagis pengoi in Lake Ontario. Limnology and Oceanography 47, 626-635; Laxson, C.L., McPhedran, K.N., Makarewicz, J.C., Telesh, I.V., and MacIsaac, H.J., 2003. Effects of the non-indigenous cladoceran Cercopagis pengoi on the lower food web of Lake Ontario. Freshwater Biology 48, 2094-2106.
122 Barbiero, R.P., and Tuchman, M.L., 2004. Changes in the crustacean communities of lakes Michigan, Huron, and Erie following the invasion of the predatory cladoceran Bythotrephes longimanus. Canadian Journal of Fisheries and Aquatic Sciences 61, 2111-2125.
36 | FEAST ANd FAMINE IN THE GrEAT LAkES
123 Bunnell, D.B., Davis, B.M., Warner, D.M., Chriscinske, M.A., and Roseman, E.F., 2011. Planktivory in the changing Lake Huron zooplankton community: Bythotrephes consumption exceeds that of Mysis and fish. Freshwater Biology 56, 1281-1296.
124 Johannsson, O.E., Bowen, K.L., Holeck, K.T., and Walsh, M.G., 2011. Mysis diluviana population and cohort dynamics in Lake Ontario before and after the establishment of Dreissena spp., Cercopagis pengoi, and Bythotrephes longimanus. Canadian Journal of Fisheries and Aquatic Sciences 68, 795-811.
125 Patalas, K., 1972, supra note 19; Watson, N.H.F., and Carpenter, G.F., 1974. Seasonal abundance of crus-tacean zooplankton and net plankton biomass of lakes Huron, Erie, and Ontario. Journal of the Fisheries Research Board of Canada 31,309-317.
126 Blossey, B., 2003. Phragmites: Common Reed. Cornell University Ecology and Management of Invasive Plants Program. Available from: http://www.invasiveplants.net/phragmites/
127 Wisconsin Dept. of Natural Resources, 2009. Reed canary grass (Phalaris arundinacea). Available from: http://dnr.wi.gov/invasives/fact/reed_canary.htm
128 Stackpoole, S., 1997. Purple Loosestrife in Michigan: Biology, Ecology, and Management. Michigan Sea Grant, Ann Arbor, MI, Bulletin E-2632. Available from: http://www.miseagrant.umich.edu/downloads/ais/fs-97-501_purple_loosestrife.pdf
129 Cao, L., 2011. Potamogeton crispus. U.S. Geological Survey Nonindigenous Aquatic Species Database, Gainesville, FL. Available from: http://nas.er.usgs.gov/queries/factsheet.aspx?SpeciesID=1134. Revised 8/9/2009.
130 Jude, D.J., and Pappas, J., 1992. Fish utilization of Great Lakes coastal wetlands. Journal of Great Lakes Research 18, 651-672. Wilcox N., D.A., 1995. The role of wetlands as nearshore habitat in Lake Huron. In: Munawar, M., Edsall, T., and Leach, J. (Eds.), The Lake Huron ecosystem: ecology, fisheries, and manage-ment. Ecovision World Monograph Series, SPB Academic Publ., Amsterdam, pp. 223-245.
131 Blossey, B., 2003, supra note 126.132 Cao, L., 2011, supra note 129. 133 Environment Canada and U.S. Environmental Protection Agency, 2009. Coastal Wetland Plant
Communities - Indicator #4862. State of the Great Lakes 2009. Cat. No. En161-3/1-2009E-PDF, pp. 249-254.134 Ludyanskiy, M.L., McDonald, D., and MacNeill, D., 1993. Impact of the zebra mussel, a bivalve invader.
Bioscience 43, 533-544.135 U.S. Army Corps of Engineers Zebra Mussel Research Program, 2002. Economic impacts of zebra mussels.
Zebra Mussel Information System. Available from: http://el.erdc.usace.army.mil/zebra/zmis/zmishelp/economic_impacts_of_zebra_mussel_infestation.htm
136 Ludyanskiy et al. 1993, supra note 134; Stop Aquatic Hitchhikers Campaign. Harmful Aquatic Hitchhikers: Mollusks: Zebra Mussel. Available from: http://www.protectyourwaters.net/hitchhikers/mollusks_zebra_mussel.php#affect
137 Lodge, D., and Finnoff, D., 2008. Annual Losses to Great Lakes Region by Ship-borne Invasive Species at least $200 Million. Center for Aquatic Conservation, University of Notre Dame, Notre Dame, IN.
138 Michigan Dept. of Natural Resources 2010, supra note 113.139 Myerson, H. 17 April 2011. Red flags signal possible trouble for Lake Michigan salmon where chinooks
are king. The Grand Rapids Press. Available from: http://www.mlive.com/outdoors/index.ssf/2011/04/in_lake_michigan_salmon_are_ki.html
140 Dolan, D.M., and McGunagle, K.P., 2005. Lake Erie total phosphorus loading analysis and update: 1996–2002. Journal of Great Lakes Research 31, 11-22; Dolan, D.M., and Richards, R.P., 2008. Analysis of late 90s phosphorus loading pulse to Lake Erie. In: Munawar, M., and Heath, R. (Eds.), Checking the Pulse of Lake Erie. Ecovision World Monograph Series, Aquatic Ecosystem Health and Management Society, pp.79-96.
141 Environment Canada and U.S. Environmental Protection Agency, 2009. Phosphorus Concentrations and Loadings, Indicator #111. State of the Great Lakes 2009. Cat. No. En161-3/1/2009E-PDF, pp. 77-81.
142 Environment Canada and U.S. Environmental Protection Agency, 2009, supra note 141; Dolan, D.M., and Chapra, S.C., 2011. Updating Great Lakes Total Phosphorus Loadings [Abstract]. International Association for Great Lakes Research 54th Annual Conference, 30 May – 3 June 2011, Duluth, MN. Available from: http://iaglr.org/conference/downloads/2011_abstracts.pdf
FEAST ANd FAMINE IN THE GrEAT LAkES | 37
143 Dolan and Chapra, 2011, supra note 142.144 Robertson, D.M., and Saad D.A., 2011. Nutrient inputs to the Laurentian Great Lakes by source and water-
shed estimated using SPARROW watershed models. Journal of the American Water Resources Association, doi: 10.1111/j.1752-1688.2011.00574.x. (Another potentially important point source of phosphorus loading is from Confined Animal Feeding Operations, or CAFOs. For more information on CAFOs, see: Sierra Club Michigan Chapter. Facts about CAFOs. Available from: http://michigan.sierraclub.org/issues/greatlakes/articles/cafofacts.html; U.S. Environmental Protection Agency National Pollutant Discharge Elimination System (NPDES), 2007. Animal Feeding Operations: Frequently Asked Questions. Available from: http://cfpub.epa.gov/npdes/faqs.cfm?program_id=7; U.S. Environmental Protection Agency National Pollutant Discharge Elimination System (NPDES), 2011. General Information on Concentrated Animal Feeding Operations. Available from: http://cfpub.epa.gov/npdes/afo/info.cfm?program_id=7)
145 Alexander, J., and Wallace, B., 2010. Turning the Tide: Investing in Wastewater Infrastructure to Create Jobs and Solve the Sewage Crisis in the Great Lakes. Healing Our Waters-Great Lakes Coalition. Available from: http://healthylakes.org/wordpress/wp-content/uploads/2010/08/08-02-2010HOWSewage ReportFINAL.pdf; Great Lakes Commission and Great Lakes and St. Lawrence Cities Initiative, 2010. The Federal Wastewater Infrastructure Deficit in the Great Lakes Region. Available from: http://www.glc.org/announce/10/pdf/CitiesInvest-20100212-Final.pdf
146 Dyble, J. Phosphorus sources and impacts on water quality in Saginaw Bay. Michigan Dept. of Environmental Quality Saginaw Bay Coastal Initiative. Available from: http://www.michigan.gov/documents/deq/deq-ogl-SBCI-Phos-Sources-Impacts_232394_7.pdf; Ohio Environmental Protection Agency, 2010. Ohio Lake Erie Phosphorus Task Force Final Report. Available from: http://www.epa.ohio.gov/portals/35/lakeerie/ptaskforce/Task_Force_Final_Report_April_2010.pdf
147 Lake Erie Millennium Network Synthesis Team, 2011. Lake Erie Nutrient Loading And Harmful Algal Blooms: Research Findings and Management Implications. Available from: http://go.osu.edu/ts-060
148 Makarewicz, J.C., Bertram, P., and Lewis, T.W., 2000. Chemistry of the offshore surface waters of Lake Erie: Pre- and post-Dreissena introduction (1983–1993). Journal of Great Lakes Research 26, 82-93; Lake Erie Lakewide Management Plan (LaMP) Work Group, 2008. Lake Erie Lakewide Management Plan 2008. U.S. Environmental Protection Agency and Environment Canada. Available from: http://www.epa.gov/lamp/le_2008/index.html; Dove, A., 2009, supra note 44. Ohio Environmental Protection Agency 2010, supra note 146.
149 Johengen et al. 1995, supra note 81; Vanderploeg et al. 2002, supra note 73; Hecky et al. 2004, supra note 89; Ozersky et al. 2009, supra note 89; Turner et al. 2010, supra note 89.
150 Lake Erie Millennium Network Synthesis Team, 2011, supra note 147.151 Ohio Environmental Protection Agency, 2010, supra note 146.152 Charlton et al. 1999, supra note 41; Lake Erie LaMP Work Group, 2008, supra note 148.153 Dove. A., and Warren, G., 2011, supra note 88.154 Id.155 Id.156 Id.157 Environment Canada and U.S. Environmental Protection Agency, 2009, supra note 141; Eutrophication
Advisory Work Group to the International Joint Commission (IJC), 2009. Great Lakes Water Quality Agreement Priorities 2007-09 Series. Work Group Report on Eutrophication, 2009. IJC, Special Publication 2009-02, Windsor, Ontario, Canada. Available from: http://www.ijc.org/en/priorities/2009/reports/2009-eutrophication.pdf; Dove., A., and Warren., G., 2011, supra note 88.
158 Rockwell, D.C., Warren, G.J., Bertram, P.E., Salisbury, D.K., and Burns, N.M., 2005. The U.S. EPA Lake Erie Indicators Monitoring Program 1983-2002: Trends in phosphorus, silica, and chlorophyll a in the central basin. Journal of Great Lakes Research 31 (Suppl. 2), 23-34; Conroy, J.D., Kane, D.D., and Culver, D.A., 2008. In: Munawar, M., and Heath, R. (Eds.), Checking the Pulse of Lake Erie. Ecovision World Monograph Series, Aquatic Ecosystem Health and Management Society, pp. 369-408.
159 Ohio Environmental Protection Agency, 2010, supra note 146; Chaffin, J.D., Bridgeman, T.B., Heckathorn, S.A., and Mishra, S., 2011. Assessment of Microcystis growth rate potential and nutrient status across a tro-phic gradient in western Lake Erie. Journal of Great Lakes Research 37, 92-100.
38 | FEAST ANd FAMINE IN THE GrEAT LAkES
160 The Associated Press. 29 August 2011. State strengthens its algae warning for Lake Erie beach. Available from: http://www.thenews-messenger.com/article/20110829/NEWS01/108290313/State-strengthens-its-algae- warning-Lake-Erie-beach
161 Brittain, S.M., Wang, J., Babcock-Jackson, L., Carmichael, W.W., Rinehart, K.L., and Culver, D.A., 2000. Isolation and characterization of microcystins, cyclic heptapeptide hepatotoxins from a Lake Erie strain of Microcystis aeruginosa. Journal of Great Lakes Research 26, 241-249; Murphy, T.P., Irvine, K., Guo, J., Davies, J., Murkin, H., Charlton, M., and Watson, S.B., 2003. New microcystin concerns in the lower Great Lakes. Water Quality Research Journal of Canada 38, 127-140; Oullette, A.J.A., Handy, S.M., and Wilhelm, S.W., 2006. Toxic Microcystis is widespread in Lake Erie: PCR detection of toxin genes and molecular characterization of associated cyanobacterial communities. Microbial Ecology 51, 154-165; Hotto, A.M., Satchwell, M.F., and Boyer, G.L., 2007. Molecular characterization of potential microcystin-producing cyanobacteria in Lake Ontario embayments and nearshore waters. Applied and Environmental Microbiology 73, 4570–4578.
162 Harmful Algal Blooms in Lake Erie: Experimental HAB Bulletin, 2011. Western Lake Erie Microcystin Samples. National Oceanic and Atmospheric Administration, Center of Excellence for Great Lakes and Human Health, Ann Arbor, MI. Available from: http://www.glerl.noaa.gov/res/Centers/HABS/western_lake_erie.html
163 Lake Erie Millennium Network Synthesis Team, 2011, supra note 147.164 Higgins et al. 2005, supra note 92; Environment Canada and U.S. Environmental Protection Agency, 2009,
supra note 141; Ohio Environmental Protection Agency, 2010, supra note 146.165 Bridgeman, T.B., and Penamon, W.A., 2010. Lyngbya wollei in western Lake Erie. Journal of Great Lakes
Research 36, 167-171.166 Burns, N.M., Rockwell, D.C., Bertram, P.E., Dolan, D.M., and Ciborowski, J.J.H., 2005. Trends in tem-
perature, Secchi depth, and dissolved oxygen depletion rates in the central basin of lake Erie, 1983-2002. Journal of Great Lakes Research 31 (Suppl. 2), 35-49; Hawley, N., Johengen, T.H., Rao, Y.R., Ruberg, S.A,. Beletsky, D., Ludsin, S.A., Eadie, B.J., Schwab, D.J., Croley, T.E., and Brandt, S.B., 2006. Lake Erie hypoxia prompts Canada-U.S. study. Eos 87, 313-324; Lake Erie Lakewide Management Plan Annual Report 2011. Available from: http://binational.net/lamp/le_ar_2011_en.pdf
167 Hawley et al. 2006, supra note 166.168 Id.169 Ohio Environmental Protection Agency, 2010, supra note 146.170 Arend, K.K., Beletsky, D., DePinto, J.V., Ludsin, S.A., Roberts, J.J., Rucinski, D.K., Scavia, D., Schwab,
D.J., and Höök, T.O., 2011. Seasonal and interannual effects of hypoxia on fish habitat quality in central Lake Erie. Freshwater Biology 56, 366-383.
171 Watson et al. 2008, supra note 25.172 Byappanahalli, M.N., and Whitman, R.L., 2009. Clostridium botulinum type E occurs and grows in the alga Cladophora glomerata. Canadian Journal of Fisheries and Aquatic Sciences 66, 879-882.173 Brittain et al. 2000, supra note 161; Watson et al. 2008, supra note 25.174 Hunt, S. 2 August 2010. Algae may be killing pets. The Columbus Dispatch. Available from: http://www.
dispatch.com/content/stories/local/2010/07/30/algae-may-be-killing-pets.html 175 Murphy et al. 2003, supra note 161.176 Byappanahalli, M.N., Sawdey, R., Ishii, S., Shively, D.A., Ferguson, J.A., Whitman, R.L., and Sadowsky,
M.J., 2009. Seasonal stability of Cladophora-associated Salmonella in Lake Michigan watersheds. Water Research 43, 806-814; Vanden Heuvel, A., McDermott, C., Pillsbury, R., Sandrin, T., Kinzelman, J., Ferguson, J., Sadowsky, M., Byappanahalli, M., Whitman, R., and Kleinheinz, G.T., 2010. The green alga, Cladophora, promotes Escherichia coli growth and contamination of recreational waters in Lake Michigan. Journal of Environmental Quality 39, 333-344; Verhougstraete, M.P., Byappanahalli, M.N., Rose, J.B., and Whitman, R.L., 2010. Cladophora in the Great Lakes: impacts on beach water quality and human health. Water Science and Technology 62, 68-76.
177 Schindler 1974, supra note 17; Schindler 1977, supra note 17; Correll, D.L., 1998, supra note 17.
FEAST ANd FAMINE IN THE GrEAT LAkES | 39
178 Moon, J.B., and Carrick, H.J., 2007. Seasonal variation of phytoplankton nutrient limitation in Lake Erie. Aquatic Microbial Ecology 48, 61-71; North, R.L., Guildford, S.J., Smith, R.E.H., Havens, S.M., and Twiss, M.R., 2007. Evidence for phosphorus, nitrogen, and iron colimitation of phytoplankton communi-ties in Lake Erie. Limnology and Oceanography 52, 315-328; Chaffin et al. 2011, supra note 159.
179 Lake Erie Millennium Network Synthesis Team, 2011, supra note 147; Chaffin et al. 2011, supra note 159.180 Moon and Carrick 2007, supra note 178.181 Id.182 Heath et al. 1995, supra note 79.183 Bierman, V.J., and Dolan, D.M., 1981. Modeling of phytoplankton-nutrient dynamics in Saginaw Bay,
Lake Huron. Journal of Great Lakes Research 7, 409-439; Moon and Carrick 2007, supra note 178; North et al. 2007, supra note 178.
184 Hoagland, P., and Scatasta, S., 2006. The economic effects of harmful algal blooms. In: Granéli, E., and Turner, J. (Eds.), Ecology of Harmful Algae. Ecology Studies Series, Dordrecht, The Netherlands: Springer-Verlag, pp. 391-402.
185 Verhougstraete et al. 2010, supra note 176.186 Rabinovici, S.J.M, Bernknopf, R.L., Wein, A.M., Coursey, D.L., and Whitman, R.L., 2004. Economic and
health risk trade-offs of swim closures at a Lake Michigan beach. Environmental Science and Technology 38, 2737-2745.
187 Environment Canada and U.S. Environmental Protection Agency, 2009. Beach Advisories, Postings, and Closures - Indicator #4200. State of the Great Lakes 2009. Cat. No. En161-3/1-2009E-PDF, pp. 167-178.
188 Arend et al. 2011, supra note 170.189 Southwick Associates, 2007, supra note 9. 190 Clean Water Act of 1972 § 303(d), 33 U.S.C. § 1313(d) (2010).191 Government Accountability Office, 2005. Clean Water Act: Improved Resource Planning Would Help
EPA Better Respond to Changing Needs and Fiscal Constraints. Available from: http://www.gao.gov/new.items/d05721.pdf
192 See for example U.S. Department of Agriculture, Natural Resources Conservation Service, 2008 NRCS Farm Bill Conservation Programs, available from: http://www.nrcs.usda.gov/programs/farmbill/; also see Olsen, K., 2007. Cultivating Restoration: How Farm Bill Conservation Programs Help Heal Our Great Lakes. Healing Our Waters – Great Lakes Coalition.
193 Pub. L. No. 111-88, Title II – Environmental Protection Agency (2009).194 U.S. Environmental Protection Agency, 2010. Great Lakes Restoration Initiative Action Plan. Available
from: http://greatlakesrestoration.us/pdfs/glri_actionplan.pdf195 Ohio Environmental Protection Agency, 2010, supra note 146.196 Kling, G.W., Hayhoe, K., Johnson, L.B., Magnuson, J.J., Polasky, S., Robinson, S.K., Shuter, B.J., Wander,
M.M., Wuebbles, D.J., Zak, D.R., Lindroth, R.L., Moser, S.C., and Wilson, M.L., 2003. Confronting Climate Change in the Great Lakes Region: Impacts on our Communities and Ecosystems. Union of Concerned Scientists, Cambridge, Massachusetts, and Ecological Society of America, Washington, D.C. Available from: http://www.ucsusa.org/greatlakes/glchallengereport.html. (Note: some data are from 2005 updated Executive Summary.)
197 Id.198 Kelleher, B. 12 August 2010. Lake Superior reaches record temp. Minnesota Public Radio. Available from:
http://minnesota.publicradio.org/display/web/2010/08/12/warm-lake-superior/199 NOAA Coastwatch, Great Lakes Node, 2011. Great Lakes Statistics. Available from: http://coastwatch.
glerl.noaa.gov/statistic/statistic.html200 Quinn, F.H., and Croley, T.E., 1999. Potential climate change impacts on Lake Erie. In: Munawar, M.,
Edsall, T., and Munawar, I.F. (Eds.), State of Lake Erie: Past, present and future. Backhuys Publishers, Leiden, the Netherlands, pp. 23-20; Kling et al. 2003, supra note 196.
201 Angel, J.R., and Kunkel, K.E., 2010. The response of Great Lakes water levels to future climate scenarios with an emphasis on Lake Michigan-Huron. Journal of Great Lakes Research 36, 51-58.
202 NOAA Great Lakes Environmental Research Laboratory, 2011. Great Lakes Water Level Observations. Available from: http://www.glerl.noaa.gov/data/now/wlevels/levels.html
40 | FEAST ANd FAMINE IN THE GrEAT LAkES
203 Schertzer, W.M., Hamblin, P.F., and Lam, D.C.L., 2008. Lake Erie thermal structure: variability, trends and potential changes. In: Munawar, M., and Heath, R. (Eds.), Checking the Pulse of Lake Erie. Ecovision World Monograph Series, Aquatic Ecosystem Health and Management Society, pp. 3-44.
204 Quinn and Croley 1999, supra note 200; Kling et al. 2003, supra note 196.205 Nicholls, K.H., 1999. Effects of temperature and other factors on summer phosphorus in the inner bay of
Quinte, Lake Ontario: implications for climate warming. Journal of Great Lakes Research 25, 250-262.206 Dolan and McGunagle 2005, supra note 140; Dolan and Richards 2008, supra note 140.207 Great Lakes Commission and Great Lakes and St. Lawrence Cities Initiative, 2010, supra note 145. 208 Environment Canada and U.S. Environmental Protection Agency, 2009. Urban Density - Indicator #7000.
State of the Great Lakes 2009. Cat. No. En161-3/1-2009E-PDF, pp. 259-263.209 Environment Canada and U.S. Environmental Protection Agency, 2009. Ground Surface Hardening -
Indicator #7054. State of the Great Lakes 2009. Cat. No. En161-3/1-2009E-PDF, pp. 281-285.210 Environment Canada and U.S. Environmental Protection Agency, 2005. Coastal Wetland Area by Type -
Indicator #4510. State of the Great Lakes 2005. Cat. No. En161-3/0-2005E-PDF, pp. 191-193.211 Environment Canada and U.S. Environmental Protection Agency, 2009. Land Cover/Land Conversion -
Indicator #7002. State of the Great Lakes 2009. Cat. No. En161-3/1-2009E-PDF, pp. 264-268.212 Id.213 Rowe, M.D., Pauer, J.J., Kreis, R.G., and Dolan, D.M., 2011. Response of nutrient concentrations and pri-
mary productivity in Lake Michigan to nutrient loading scenarios [Abstract]. International Association for Great Lakes Research 54th Annual Conference, 30 May – 3 June 2011, Duluth, MN. Available from: http://iaglr.org/conference/downloads/2011_abstracts.pdf; U.S. Environmental Protection Agency, 2011. Future Midwestern Landscapes Study. Available from: http://www.epa.gov/ecology/quick-finder/mid-west.htm
214 See Baker, E., Fusaro, A., and Sturtevant, R., 2011. Watchlist of Potential Great Lakes Aquatic Invasive Species. NOAA. Available from: http://www.glerl.noaa.gov/res/Programs/glansis/watchlist.html
215 Rasmussen, J.L., Regier, H.A., Sparks, R.E., and Taylor, W.W., 2011. Dividing the waters: The case for hydrologic separation of the North American Great Lakes and Mississippi River Basins. Journal of Great Lakes Research 37, 588-592; Veraldi, F.M., Baerwaldt, K., Herman, B., Herleth-King, S., Shanks, M., Kring, L., and Hannes, A., 2011. Non-Native Species of Concern and Dispersal Risk for the Great Lakes and Mississippi River Interbasin Study. U.S. Army Corps of Engineers. Available from: http://glmris.anl.gov/documents/docs/Non-Native_Species.pdf
216 United Press International. 2 June 2011. Study: Lake Erie could harbor Asian carp. Available from: http://www.upi.com/Science_News/2011/06/02/Study-Lake-Erie-could-harbor-Asian-carp/UPI-68211307041187/
217 Dizikes, C. 28 April 2011. Asian carp possibly hardier than once thought. Chicago Tribune. Available from: http://articles.chicagotribune.com/2011-04-28/news/ct-met-asian-carp-20110428_1_open-navigational-locks- locks-in-chicago-waterways-underwater-barrier
218 Ohio Environmental Protection Agency, 2010, supra note 146.219 Similar recommendations have been made by others, including: Eutrophication Advisory Work Group to
the International Joint Commission (IJC), 2009, supra note 157; Evans et al. 2011, supra note 43.220 Some recommendations derive from Kidd, J., 2009. Workshop Report: Managing Watersheds for Great
Lakes Benefits: Technical Workshop on Nutrients in the Nearshore. Prepared for Conservation Ontario. Available from: http://www.conservationontario.ca/great_lakes_workshop/PDF/Final_Full_Rprt_Mar_ 34_Techl_wrkshp.pdf
221 See U.S. Environmental Protection Agency, 2011. Lakewide Management Plans. Available from: http://www.epa.gov/greatlakes/lamp/
222 See Great Lakes Fishery Commission, Lake Committees. Available from: http://glfc.org/lakecom/ 223 For an example of fisheries management practices changing in response to altered ecosystem regimes,
see Michigan Dept. of Natural Resources Fisheries Division, 2011. Managing Chinook Salmon in Lake Huron:Current Findings and Proposed Management Options. Available from: http://www.michigan.gov/documents/dnr/Lake_Huron_Chinook_Management_Executive_Summary_359037_7.pdf.
224 Krist, F., Michigan Dept. of Natural Resources Lake Huron Citizens Fishery Advisory Committee, per-sonal communication, 13 Sept 2011.
FEAST ANd FAMINE IN THE GrEAT LAkES | 41
225 U.S. Environmental Protection Agency, 2010, supra note 194.226 Pauer, J.J., Anstead, A.M., Melendez, W., Taunt, K.W., and Kreis, R.G., 2011. Revisiting the Great Lakes
Water Quality Agreement phosphorus targets and predicting the trophic status of Lake Michigan. Journal of Great Lakes Research 37, 26-32.
227 See U.S. Environmental Protection Agency, 2011. Great Lakes Monitoring, Limnology Program. Available from: http://www.epa.gov/glnpo/monitoring/limnology/index.html
228 See U.S. Environmental Protection Agency, 2011. Office of Research and Development, Science Activities. Available from: http://www.epa.gov/ord/scievents/lakesci11/activities.htm#csmi
229 Johnson, J., 2011, Michigan Dept. of Natural Resources, personal communication, 12 September 2011.230 Lake Erie Millennium Network Synthesis Team, 2011, supra note 147. 231 Chaffin et al. 2011, supra note 159.232 U.S. Environmental Protection Agency, 2009. Nitrogen and Phosphorus Pollution Outreach Portal.
Available from: http://www.hcdi.com/epa/np_outreachportal409/ed-resources.htm233 Marrone Bio Innovations. Zequanox: A Green Solution to Control Destructive Mussels. Available from:
http://marronebioinnovations.com/products/zequanox/ 234 U.S. Geological Survey Upper Midwest Environmental Sciences Center, 2011. Aquatic Invasive Species
Control. Available from: http://www.umesc.usgs.gov/aquatic_invasives_team.html 235 Madenjian et al. 2010, supra note 119.236 Johnson, J., 2011, Michigan Dept. of Natural Resources, personal communication, 12 September 2011.237 Recommendations adapted from Ohio Environmental Protection Agency, supra note 146, and Huron River
Watershed Council, 2010. Prevent Water Pollution. Available from: http://www.hrwc.org/take-action/homeowners/
Great Lakes Regional Center213 W. Liberty Street, Suite 200Ann Arbor, MI 48104734.769.3351www.nwf.org
Copyright 2011 National Wildlife Federation. All rights reserved.


![Feast and Famine: Regulation of Black Hole Growth in Low ... · arXiv:0812.1224v2 [astro-ph] 27 Apr 2009 Feast and Famine: Regulation of Black Hole Growth in Low Redshift Galaxies](https://img.pdfslide.us/doc/110x75/601364db31b59e2c4238a88c/feast-and-famine-regulation-of-black-hole-growth-in-low-arxiv08121224v2-astro-ph.jpg)