Embed Size (px)
Citation preview

FCE Bank plcBasEl II PIllar 3 DIsClosurEs for the year ended 31 December 2012

Basel II Pillar 3 Disclosure Document for the year ended 31 December 2012
22 FCE Bank plc – Basel II Pillar 3 Disclosure Document – 2012
Definitions
Definitions
For the purpose of this report the term
i. '2012 Annual Report and Accounts' means FCE's consolidated annual financial statements as at and for the year ended
31 December 2012.
ii. 'Interim Report' means FCE's consolidated interim report and financial statements as at and for the half year ended 30
June 2012.
iii. 'Company' means FCE Bank plc including all its European branches, but excluding its subsidiaries and SPE's.
iv. 'Group' or 'FCE' means the Company and its subsidiaries and SPE's.
v. 'FCI' means Ford Credit International, Inc., a company incorporated under the laws of Delaware USA, a subsidiary of Ford
Credit and the Company's immediate shareholder.
vi. 'Ford Credit', or ‘FMCC’, means Ford Motor Credit Company LLC, a limited liability company incorporated under the laws
of Delaware USA and an indirect wholly owned subsidiary of Ford.
vii. 'Ford' means Ford Motor Company, a company incorporated under the laws of Delaware USA and the Company's ultimate
parent company. In some cases, this term may mean Ford Motor Company and all or some of its affiliates.
viii. 'Forso' or 'the Forso JV' means a joint venture finance company established with CA Consumer Finance, a consumer
credit subsidiary of Credit Agricole S.A. in June 2008 which provides customer and dealer automotive financing in the
Nordic markets.
ix. 'SPE' means a bankruptcy-remote special purpose entity whose operations are limited to the acquisition and financing of
specific assets (which may include the issue of asset backed securities and making payments on the securities) and in
which FCE usually has no legal ownership or management control.
x. 'FSA' is the UK Financial Services Authority - an independent non-governmental body, given statutory powers by the
Financial Services and Markets Act 2000. The FSA was FCE's regulator in the UK until it was replaced from 1st April 2013
by the Financial Conduct Authority (FCA) & Prudential Regulation Authority (PRA). FCE is now regulated by both bodies.
For a comprehensive list of definitions refer to the 'Glossary of defined terms' which commences on page 38

Basel II Pillar 3 Disclosure Document for the year ended 31 December 2012
Contents
FCE Bank plc – Basel II Pillar 3 Disclosure Document – 2012 3333333
Contents .................................................................................. 3
Highlights ................................................................................. 4
Introduction ........................................................................... 5-7
Regulation................................................................................ 8
FCE background ...................................................................... 9
Corporate governance ............................................................. 9
Risk appetite .......................................................................... 10
Key risks ................................................................................ 10
Credit risk............................................................................... 11
Financial market risk ......................................................... 12-14
Operational risk ...................................................................... 15
Liquidity risk ........................................................................... 16
Other risks ........................................................................ 17-18
Capital adequacy ................................................................... 19
Internal Capital Adequacy Assessment Process ................... 19
Capital strategy (including dividend policy) ............................ 19
Liquidity Monitoring ................................................................ 20
Liquidity Sources ................................................................... 21
Funding Sources .................................................................... 21
Quantitative information Index ............................................... 22
Capital composition and requirements ................................... 23
Components of capital ...................................................... 24-25
Risk weighted exposures and operational risk capital ...... 26-31
Provision for incurred losses ............................................. 32-33
Analysis of past due exposures ........................................ 34-35
Derivative financial instruments ............................................. 36
Website addresses ................................................................ 37
Glossary of defined terms ................................................. 38-39
www.fcebank.com
FCE Bank plc. Central Office, Eagle Way, Brentwood, Essex CM13 3AR.
Registered in England and Wales no 772784
Introduction
Description of the business
Risk
Capital and funding
Quantitative information
Other information
This Pillar 3 document sets out the 2012 Pillar 3 Disclosures for FCE Bank plc. These disclosures are based on the best available
data at the time of issuance and have been prepared solely to give information on the basis of calculating Basel II capital
requirements and on the management of risks faced by the Group in accordance with the rules laid out in BIPRU Chapter 11.
This document is not and does not replace the Group's statutory Annual Report and Accounts which are available elsewhere on the
website. Certain figures disclosed in this document have been used as management information and have not been externally
verified by independent auditors, although some of the information within it is also disclosed within FCE's audited 2012 Annual
Report and Accounts.
This document will be issued at least on an annual basis in accordance with FSA requirements.

Basel II Pillar 3 Disclosure Document for the year ended 31 December 2012
4 FCE Bank plc – Basel II Pillar 3 Disclosure Document – 2012
Highlights
FCE supports Ford sales by providing financing to Ford retail customers (Retail) and Ford dealers (Corporates)
FCE continues to maintain an adequate capital base for the scale of its business
Tier 1 Capital Ratio = Tier 1 capital / Total risk weighted exposures
Total Capital ratio = Total regulatory capital / Total risk weighted exposures
Solvency Ratio = Total regulatory capital / Total capital requirement
* For details of restatement please refer to Note 1 ‘Accounting policies’ in the 2012 Annual Report and Accounts
0.8 0.90.5 0.5 0.3
9.3
5.2 5.6 5.24.3
7.0
6.04.4
4.0
3.7
2008 2009 2010 2011 2012
Other Corporates Retail
Credit risk weighted exposures *£ Billions
3.43.2
2.8
2.5
2.2
2008 2009 2010 2011 2012
Capital Resources
Total regulatory capital *£ Billions
2008 2009 2010 2011 2012
Tier 1 Capital Ratio * 16.4% 21.1% 21.1% 21.0% 21.5%
Total Capital Ratio * 18.9% 23.8% 23.5% 23.2% 23.8%
Solvency Ratio * 230% 298% 293% 291% 297%
Key Regulatory Ratios

Basel II Pillar 3 Disclosure Document for the year ended 31 December 2012
FCE Bank plc – Basel II Pillar 3 Disclosure Document – 2012 5555555
Introduction
Introduction
Background
The Basel Committee on Banking Supervision has published a framework for calculating minimum capital requirements. The
European Union (EU) Capital Requirements Directive (CRD), commonly referred to as Basel II, replaces the 1988 Basel Capital
Accord. Basel II provides a more robust and risk sensitive framework for determining the capital requirements of financial
institutions.
Basel II is structured around three main 'pillars' which are detailed below.
Capital Requirements Directive Pillar 1 Pillar 2 Pillar 3 Minimum Capital Requirements Internal Capital Adequacy
Assessment (ICAAP) Process
Market Discipline
Credit Risk Independent validation Disclosure
Operational Risk Supervisory Review Process
Financial Market Risk
Basel II has been implemented in the EU through adoption of the provisions of the EU CRD in each EU Member State. The Pillar 3
disclosure requirements complement the other two Pillars and assist market transparency.
The framework not only encompasses capital requirements it also requires disclosures of key pieces of information, such as capital,
risk exposures and risk assessment processes.
Basis of disclosures
This document covers qualitative and quantitative disclosures required under Pillar 3 for FCE Bank plc (FCE) for the year ended 31
December 2012 and prior year figures for comparative purposes. This Pillar 3 disclosure document has been prepared in
accordance with the rules as laid out in chapter 11 of BIPRU. BIPRU is the specific Financial Services Authority (FSA) prudential
sourcebook for Banks, Building Societies and Investment firms and therefore covers the specific requirements for FCE. This
document contains the disclosures required under Basel II Pillar 3 and is not a substitute for FCE's Annual Report and Accounts.
FCE continues to:
Use the Standardised Approach to Credit and Operational Risk when assessing Capital Resource Requirements for Pillar
1 reporting.
Report its main credit risk exposure classes as 'Retail' and 'Wholesale' to ensure consistency with FCE's Annual Report
and Accounts. Retail financing is provided predominately to individual customers for single vehicles. Retail financing also
includes to a lesser extent loans and advances to Corporate and other institutional customers covering single as well as
large and small fleets of vehicles. Wholesale financing is provided to Ford's dealers, primarily to finance stocks of new
and used vehicles.
FCE's Annual Report and Accounts contain comprehensive disclosures of key pieces of information and are prepared in
accordance with International Financial Reporting Standards (IFRS). The Annual Report can be obtained directly from FCE's
corporate website, details of which are provided on page 37.
Frequency of reporting
FCE will publish Pillar 3 disclosures at least annually and the year end disclosures will be as at the accounting reference date. The
Basel II Pillar 3 disclosure document will be published on FCE's corporate website as soon as practicable after publication of FCE's
Annual Report and Accounts.

Basel II Pillar 3 Disclosure Document for the year ended 31 December 2012
6 FCE Bank plc – Basel II Pillar 3 Disclosure Document – 2012
Introduction
Verification
This document has been reviewed and approved by both the Executive Committee and the Chair of the Audit Committee of FCE.
The information contained in this document has not been audited by FCE's external auditors – PricewaterhouseCoopers LLP.
Consolidation basis
FCE prepares both consolidated and solo consolidated regulatory reports to assess its Capital Resources and Large Exposure
positions, (as per Note 1 'Consolidated and solo consolidation' on page 23). Capital adequacy and Large Exposures are reported to
the FSA on a quarterly basis at a minimum in line with BIPRU requirements.
The consolidated regulatory reports are presented in Sterling and prepared in accordance with IFRS and International Financial
Reporting Interpretations Committee (IFRIC) interpretations. Assets and liabilities of each entity of the Group which are
denominated in foreign currencies are translated into Sterling at the exchange rates prevailing at the balance sheet date.
FCE's consolidated reporting includes the following subsidiaries:
In addition FCE, via its subsidiary Saracen Holdco Ab, has a 50% less one share interest in a jointly controlled entity, Forso Nordic
AB (Forso) which provides automotive financial services in Denmark, Finland, Sweden and Norway. For further information in
regard to Forso, please refer to Note 23 ‘Investment in a jointly controlled entity’ in FCE's 2012 Annual Report and Accounts. Forso
is a regulated institution in Sweden and is required, among other things, to maintain minimum capital reserves.
FCE Bank Polska S.A is the only individually regulated subsidiary within FCE. FCE Bank Polska S.A. is a wholly owned subsidiary
of a European Economic Area parent and as such is not required to disclose separate Pillar 3 information.
There are no current or foreseen material practical or legal impediments to the prompt transfer of capital resources or repayment of
liabilities when due between the parent company and its subsidiaries. However, as noted above, FCE Bank Polska S.A is a
regulated bank and is required, among other things, to maintain minimum capital reserves.
Subsidiary undertakings
Entity Country of Principle Activity Accounting Ownership
Incorporation Reference Date
FCE Leasing (Holdings) Limited England and Wales Holding Company 31 December 100%
Ford Automotive Leasing Limited * England and Wales Non trading 30 September 100%
Meritpoint Limited England and Wales Non trading 30 June 100%
Primus Automotive Financial England and Wales Dormant 31 December 100%
Services Limited
Volvo Car Finance Limited England and Wales Dormant 31 December 100%
FCE Credit s.r.o. Czech Republic Finance company 31 December 100%
FCE Credit Hungry Zrt Hungary Finance company 31 December 100%
FCE Services Kft * Hungary Finance company 31 December 100%
FCE Bank Polska S.A. Poland Bank 31 December 100%
FCE Credit Polska S.A. Poland Finance company 31 December 100%
Saracen Holdco Ab Sweden Holding Company 31 December 100%
*subsidiaries indirectly owned by the Company

Basel II Pillar 3 Disclosure Document for the year ended 31 December 2012
FCE Bank plc – Basel II Pillar 3 Disclosure Document – 2012 7777777
Introduction
Consolidation basis continued
The quantitative disclosures in this document are reported on a consolidated basis unless specified otherwise, as the consolidated
Group is not considered materially different from that reported under solo consolidation. The basis of presentation of the FCE
consolidated regulatory reports is similar to the FCE Annual Report and Accounts except for the following key differences:
For regulatory reporting of FCE's capital, adjustments are made to the retained earnings figure reported in the 2012 Annual Report and Accounts to exclude the historical impact of unrealised fair value adjustments to financial instruments. Please see Table 2 'Analysis of capital resources held' on pages 24 and 25 which shows the effect of this adjustment on FCE's capital figure. In the Annual Report and Accounts, derivative financial instrument asset balances are reported at fair value as required by IAS 39 'Financial instruments, recognition and measurement'. Please refer to Note 10 'Derivative financial instruments' on page 36 for these amounts.
The collective impairment allowance as part of FCE's Tier 2 capital resources for regulatory reporting, which appears in this report in Note 2 'Components of capital' on pages 24 and 25, is the collective impairment allowance as detailed in the 2012 Annual Report and Accounts, with the addition of incurred but not yet identified losses relating to Operating Leases. This therefore explains the difference between the collective impairment allowance of £42 million (2011: £62 million) referred to in Note 7 'Provision for incurred losses' on pages 32 and 33 representing incurred but not yet identified losses in both the retail and wholesale portfolios, and the £43 million (2011: £63 million) in Note 2.
The Special Purpose Entities (SPE's) utilised by the Company and which are listed in Note 24 'Investments in other entities' of
FCE's 2012 Annual Report and Accounts, conduct their activities solely to meet securitisation requirements of the Company. In
accordance with the scope of Interpretation SIC-12 'Consolidation – Special Purpose Entities' and IAS 27 'Consolidated financial
statements and accounting for investments in subsidiaries' such entities are consolidated as a subsidiary within the Group balance
sheet.
Neither the Company nor its officers, Directors or employees holds any equity interests in the SPEs utilised or receive any direct or
indirect remuneration from the SPEs. Also such SPEs do not own shares in the Company or shares in any FCE subsidiary or other
Ford affiliates.

Basel II Pillar 3 Disclosure Document for the year ended 31 December 2012
8 FCE Bank plc – Basel II Pillar 3 Disclosure Document – 2012
Introduction Regulation
Regulation
FCE maintains the appropriate regulatory authorisations and permissions for the locations in which it operates. In the UK FCE is
authorised and regulated by both the Financial Conduct Authority (FCA) and the Prudential Regulation Authority (PRA), replacing
the FSA, to carry on a range of regulated activities – both within the UK and throughout its European branch network.
FCE currently has branches in ten other European countries and is subject to consolidated supervision, through varying EU
directives, with the FCA and PRA being FCE’s Home state regulators for all of its European branch operations. Each location may
then in turn be subject to Host state regulatory requirements through local regulators and / or central banks.
The FCA and PRA adopt a risk-based approach to supervision. These supervisory methodologies will evolve in 2013 as the newly
established regulators are formally established and develop and embed their own supervisory strategies and initiatives.
Recovery and Resolution Plan
FCE completed its first Recovery and Resolution Plan in September 2012.
Basel III
The Basel Committee on Banking Supervision has developed a comprehensive set of reform measures to strengthen the regulation,
supervision, and risk management of the banking sector. Basel III outlines a number of approaches to regulatory capital, risk
alignment, liquidity and charges. FCE is in the process of aligning the business to the proposed changes.
European Market Infrastructures Regulation – Regulation (EU) 648/2012 (EMIR)
EMIR is aimed at reducing risk in ‘over-the-counter’ (OTC) derivatives transactions through a combination of measures including
mandatory trade reporting, clearing and collateral posting. Though EMIR itself passed into law on 16 August 2012, many of its
provisions do not take effect until further technical standards have been agreed by the EU. It is expected that these technical
standards and the provisions of EMIR to which they relate will become effective in stages during 2013 and 2014. FCE is monitoring
EMIR and is in the process of aligning its business in order to achieve compliance.

Basel II Pillar 3 Disclosure Document for the year ended 31 December 2012
FCE Bank plc – Basel II Pillar 3 Disclosure Document – 2012 9999999
Description of the business
Description of the business
FCE background
FCE is a United Kingdom (UK) registered bank regulated by the FSA and is a wholly owned subsidiary of Ford Credit International
(FCI). FCI is wholly-owned by Ford Motor Credit Company LLC (Ford Credit), which in turn is wholly owned by Ford Motor
Company (Ford). FCE is authorised by the FSA to carry on a range of regulated activities within the UK and through a branch
network in ten other European countries, and is subject to consolidated supervision by the FSA. The FSA is FCE's home regulator
for all of its branch operations.
Corporate governance
The Directors consider that effective corporate governance is a key factor underlying the strategies and operations of FCE. As only
some of the Company's debt securities are listed on Stock Exchanges there are significantly fewer reporting obligations on the
Company compared with a company with listed equity. Nevertheless the Company chooses to comply with many of the principles of
the UK Corporate Governance Code (the “Code”) except for those provisions that are not appropriate for a wholly-owned subsidiary.
The Company undertakes on a regular basis a benchmarking exercise against the latest guidelines on corporate governance,
making any adjustments it deems necessary and appropriate.
The Company has developed internal controls to ensure that the Group's business is conducted within a strong and defined control
framework. These internal controls are well suited to the evolving demands of corporate governance in regulated, multi-national
environments.
For further information in regard to FCE and its Corporate governance please refer to the 2012 Annual Report and Accounts.

Basel II Pillar 3 Disclosure Document for the year ended 31 December 2012
10 FCE Bank plc – Basel II Pillar 3 Disclosure Document – 2012
Risk
Risk appetite
FCE's risk appetite is set by its Board of Directors and is clearly defined, monitored and managed through its Risk Appetite
Framework. FCE has established dynamic and formalised processes for the identification of the risks that it faces. FCE manages
each form of risk uniquely in the context of its contribution to overall risk. Business decisions are evaluated on a risk aware and risk-
adjusted basis and are priced consistent with these risks.
FCE is exposed to several types of risk. The key risks identified at present include liquidity, concentration, financial market,
operational, pension, interest rate, vehicle residual value, group and credit (retail and wholesale) risks.
FCE’s Risk Appetite Framework is integrated within the Governance structure of FCE and informs the day-to-day risk management
processes/policies which minimise the risk of unexpected losses. FCE conducts close monitoring of the risks in line with its defined
risk appetite, and applies strong, proactive risk mitigating actions and controls which have been developed based on 50 years of
experience in the specialist field of automotive sector related lending.
FCE takes a primarily secured asset lending approach in order to minimise the risk of unexpected losses. FCE continuously reviews
and seeks to improve its risk management practices in line with industry best practices.
Key risks
In section 2.1 of their General Prudential sourcebook (GENPRU), the FSA defines credit risk, financial market and operational risk
as the three main risk categories which each require their own elements of capital within a BIPRU firm. The three elements then
form a firm's variable capital requirement which, when added to a base capital resource figure, gives the capital resources
requirement for that firm.
The nature of the key risks facing FCE is discussed in more detail in the remainder of this section.

Basel II Pillar 3 Disclosure Document for the year ended 31 December 2012
FCE Bank plc – Basel II Pillar 3 Disclosure Document – 2012 11111111111111
Risk
Credit risk
The FSA defines the credit risk element for a BIPRU firm as containing the specific risks of credit risk, counterparty risk and
concentration risk, and this section details each of these in turn.
As a provider of automotive financial products, FCE's primary source of credit risk is the possibility of loss from a retail customer's
or dealer's failure to make payments according to contract terms.
Although credit risk has a significant impact on FCE's business, it is mitigated by the majority of FCE's retail, leasing and wholesale
financing plans having the benefit of a title retention plan or a similar security interest in the financed vehicle. In the case of
customer default, the value of the repossessed collateral provides a source of protection. FCE actively manages the credit risk on
retail and wholesale portfolios to balance the levels of risk and return.
Retail (Consumer and commercial) credit risk management
Retail products (vehicle instalment sale, hire purchase and conditional sale and lease contracts) are classified by term and whether
the vehicle financed is new or used. This segmentation is used to assist with product pricing to ensure risk factors are appropriately
considered. Portfolio performance is monitored regularly and FCE’s originations processes and models are reviewed, revalidated
and recalibrated as necessary. Retail credit loss management strategy is based on extensive historical experience.
Wholesale credit risk management
FCE extends commercial credit to franchised dealers selling Ford vehicles primarily to purchase stocks of new and used vehicles
(vehicle wholesale financing) and financing for dealer vehicles (eg. demonstrator or courtesy vehicles), and to a much lesser extent,
wholesale financing for spare parts and loans for working capital and property acquisitions. For the vast majority of FCE’s dealer
financing products security is taken in the underlying vehicle asset. All credit exposures are scheduled for review at least annually
at the appropriate credit committee. Asset verification processes are in place and include physical audits of vehicle stocks with
increased audit frequency for higher risk dealers.
Concentration risk
Concentration risk is the risk resulting from concentrated exposures to counterparties, specific country markets, particular products
or business segments as well as the automotive sector as a whole. It is the Company’s opinion that there are significant mitigating
factors to the concentration risks that it faces. FCE is internationally active and seeks to maximise geographical diversity whilst
ensuring that its lending is predominantly in countries with an investment grade credit rating. FCE’s largest markets are Germany
(Europe’s largest automotive market) and the UK (FCE’s home market).
On a monthly basis FCE monitors the distribution, by country and product, of its total financing to dynamically enable adjustments to
be made in line with its risk appetite. Within each country where it operates FCE’s lending is geographically dispersed cons istent
with the nationwide nature of representation of the Ford vehicle sales and service network.
FCE’s consumer financing portfolio is inherently granular in nature and this combined with its detailed knowledge of the respective
markets and its long and comprehensive experience within automotive financing provides strong mitigation to concentration risks
that may otherwise arise. Counterparty exposures are closely monitored and managed through a series of processes depending on
counterparty type and associated risk.
Other credit risk information
Due to the nature of FCE's customers, very few are rated by External Credit Assessment Institutions (ECAI's), therefore under the
rules in BIPRU 3.3.1 FCE has opted not to nominate any ECAI's for Credit Risk reporting.
FCE currently has netting agreements with certain Ford affiliates. Under IFRS reporting where there is both a current enforceable
legal right to set off the recognised amounts and an intention to settle on a net basis, financial liabilities can be offset against
financial assets. For regulatory reporting, as per BIPRU 5.3, only the current enforceable legal right needs to be present for this to
occur (See Note 4 'Analysis of capital resources and requirements' on pages 26 and 27).

Basel II Pillar 3 Disclosure Document for the year ended 31 December 2012
12 FCE Bank plc – Basel II Pillar 3 Disclosure Document – 2012
Risk Financial market risk
As defined in the FSA handbook (GENPRU 2.1.52 and BIPRU 11.5.4), the calculation of the financial market risk capital
requirement is made up of a number of risk elements, all of which require their Position Risk Requirement (PRR) to be calculated.
The elements are:
Interest rate PRR
Equity PRR
Commodity PRR
Foreign currency PRR
Option PRR
Collective investment undertaking PRR
As FCE has no trading book, its financial market risk capital requirement is only calculated from its foreign currency PRR, as
detailed in BIPRU section 7. Although the calculation of the PRR for interest rate risk is not required, FCE actively monitors and
manages interest rate risk as detailed in the relevant section below. The remaining risks detailed above are not relevant to FCE's
business model.
Financial market risk management
FCE operates in a variety of currencies and lends and borrows using financial instruments with differing re-pricing characteristics.
Volatility in interest rates and foreign exchange rates exposes FCE to the risk of losses should market rates increase the value of
liabilities in relation to assets. The objective of financial market risk management is to lock-in the financing margin by limiting the
impact of changes in interest rate and foreign exchange rates. Interest rate and currency exposures are monitored and managed by
FCE as an integral part of its overall risk management programme, which recognises the unpredictability of financial markets and
seeks to reduce potential adverse effects on FCE’s operating results. Exposure to financial market risk is reduced through the use
of interest rate and foreign exchange derivatives. FCE’s derivatives strategy is designed to mitigate risk; derivatives are not used for
speculative purposes. (Further details on FCE's use of derivatives are given on page 14 and in Note 10 'Derivative financial
instruments' on page 36 of this document).
Currency risk
FCE faces exposure to currency exchange rates if a mismatch exists between the currency of the receivables and the currency of
the debt funding those receivables. Wherever possible, FCE funds receivables with debt in the same currency, minimising exposure
to exchange rate movements. When a different currency is used, it is the Company’s policy that foreign currency derivatives are
executed to convert substantially all of the foreign currency debt obligations to the local country currency of the receivables.
(Refer to Note 6 'Geographical distribution of exposures' on page 31 of this document, for the analysis of net loans and advances to
customers and total assets by geographical segment, and Note 40a) 'Currency risk' in the 2012 Annual Report and Accounts for
currency risk exposure).
Interest rate risk
FCE’s asset base consists primarily of fixed-rate retail instalment sale, hire purchase, conditional sale and lease contracts, with an
average life of approximately 2.2 years, and floating rate wholesale financing receivables with an average life of about 60 days.
Funding sources consist primarily of securitisation and unsecured term debt.
It is FCE's policy to execute interest rate swaps to change the interest rate characteristics of the debt to match, within a tolerance
range, the interest rate characteristics of FCE’s assets. This matching policy seeks to maintain margins and reduce profit vo latility.

Basel II Pillar 3 Disclosure Document for the year ended 31 December 2012
FCE Bank plc – Basel II Pillar 3 Disclosure Document – 2012 13131313131313
Risk Financial market risk continued
Interest rate risk sensitivity analysis
As a result of FCE's interest rate risk management processes (utilising hedging derivatives), and as a proportion of assets are
funded by equity, the total level of assets re-pricing is greater than the level of debt re-pricing. Other things being equal, this means
that during a period of rising interest rates, the interest income received on FCE's assets will increase more rapidly than the interest
expense paid on its debt, thereby increasing pre-tax net interest income. Correspondingly, during a period of falling interest rates,
FCE would expect its pre-tax net interest income to initially decrease.
To provide a quantitative measure of the sensitivity of pre-tax net interest income to changes in interest rates, FCE uses interest
rate scenarios. These scenarios assume a hypothetical, instantaneous increase or decrease in interest rates of one hundred basis
points across all maturities (a 'parallel shift'), impacting both assets and liabilities, as well as a base case that assumes that interest
rates remain constant at existing levels. These interest rate scenarios do not represent an expectation of future interest rate
movements. The differences in pre-tax net interest income between these scenarios and the base case over a twelve-month period
represent an estimate of the sensitivity of FCE's pre-tax net interest income.
The sensitivity of interest income to changes in interest rates in the 12 months following the year ended 31 December 2012 and
2011 is detailed below:
The sensitivity analysis presented previously assumes a one hundred basis point rate change to the year-end yield curve that is
both instantaneous and parallel and impacts the re-pricing of assets and liabilities. In reality, interest rate changes are rarely
instantaneous or parallel and rates could move more or less than the one percentage point assumed. In addition, management has
discretion over the pricing of its new assets, and may re-price assets to a greater or lesser degree than its liabilities re-price. As a
result, the actual impact to pre-tax net interest income could be higher or lower than the results detailed above.
While the sensitivity analysis presented is FCE's best estimate of the impacts of the specified assumed interest rate scenarios,
actual results could differ from those projected. The model used to conduct this analysis is heavily dependent on assumptions.
Embedded in the model are assumptions regarding the reinvestment of maturing asset principal, refinancing of maturing debt, and
predicted repayment of retail instalment sale and lease contracts ahead of the contract end date. Repayment projections ahead of
contractual maturity are based on historical experience. If interest rates or other factors change, the actual prepayment experience
could be different than projected. FCE has presented its sensitivity analysis on a pre-tax rather than an after-tax basis, to exclude
the potentially distorting impact of assumed tax rates.
The interest rate sensitivity of FCE's assets and liabilities, including derivatives, is evaluated each month.
Net interest income impact of 100 basis point rate change
Increase £ 11 £ 14
Decrease (11) (14)
Group
2012 2011
£ mil £ mil

Basel II Pillar 3 Disclosure Document for the year ended 31 December 2012
14 FCE Bank plc – Basel II Pillar 3 Disclosure Document – 2012
Risk
Financial market risk continued
Use of derivatives
The following table provides examples of certain activities undertaken, the related risks associated with such activities and the types
of derivatives used in managing such risks.
Activity Risk Type of Derivative
Investment and funding in Sensitivity to change - Cross currency interest
foreign currencies in foreign currency exchange rate swaps
rates - Foreign currency forward
contracts
Funding of shorter dated or Sensitivity to changes in - Pay floating rate and
floating rate assets with interest rates arising from the receive fixed rate interest
longer dated fixed rate debt repricing characteristics of rate swaps
assets not matching repricing
of liabilities
Funding of longer dated, Sensitivity to changes in - Pay fixed rate and
fixed rate assets with interest rates arising from the receive floating rate interest
shorter dated or floating rate repricing characteristics of rate swaps
debt assets not matching repricing
of liabilities
Exposure to financial market risk is reduced through the use of interest rate and foreign currency exchange derivatives. FCE’s
derivatives strategy is designed to mitigate risk; derivatives are not used for speculative purposes.
The key derivative policies are:
• Prohibition of use for speculative purposes
• Prohibition of use of leveraged positions
• Requirement for regular in-depth exposure analysis
• Establish and document accounting treatment at onset of
trade
• Establish exposure limits (including cash deposits) with
counterparties
• Treasury employee's remuneration not being linked to
individuals trading performance
The key derivative controls are:
• Regular management reviews of policies, positions and
planned actions
• Transactional controls including segregation of duties,
approval authorities, competitive quotes and confirmation
procedures
• Regular management review of portfolio mark to market
valuations and potential future exposures
• Monitoring of counterparty creditworthiness
• Internal audits to evaluate controls and adherence to
policies

Basel II Pillar 3 Disclosure Document for the year ended 31 December 2012
FCE Bank plc – Basel II Pillar 3 Disclosure Document – 2012 15151515151515
Risk
Operational risk
Operational risk is the risk of loss resulting from inadequate or failed internal processes, people or systems, or from external events.
This definition of operational risk captures events such as Information Technology problems, human error and shortcomings in the
organisational structure, legal changes and lapses in internal controls, fraud or external threats. FCE takes a proactive approach to
operational risk management and continues to seek enhancement opportunities within its Operational Risk Framework. FCE follows
the principles of the “Three Lines of Defence” model for the management of operational risk. Business line management forms the
first line. Compliance, Operational Risk and the Internal Controls Office (ICO) are the second line. Ford’s General Auditor’s Office
(GAO) comprises the third line.
FCE is indemnified under insurance policies for certain operating risks including health and safety. Notwithstanding these control
measures and this insurance coverage, FCE remains exposed to operational risk that could negatively impact its business and
results of operations.
The group has adopted the standardised approach for calculating the Pillar 1 capital requirements for operational risk.
Operational risk management
The Operational Risk Sub-Committee, a sub-committee of the Executive Operational Risk Committee (ORC), co-ordinates the
identification, control and monitoring of the operational risks across business lines, product areas, and geographies. The Executive
ORC has ultimate responsibility for operational risks and for promoting the use of sound operational risk management across FCE.
The main areas of focus for the ORC are the implementation of appropriate policies, processes and procedures to control or
mitigate material exposure to losses, and the maintenance of suitable contingency arrangements for all areas to ensure that FCE
can continue to function in the event of an unforeseen interruption.
A guiding principle is that management at all levels is responsible for managing operational risks. FCE also maintains a strong
internal control culture across the organisation through the Modular Control Review Programme, a self-assessment control process
used by the locations and central office functions. (For further details please refer to the 'Audit Committee Report' in the 2012
Annual Report and Accounts).

Basel II Pillar 3 Disclosure Document for the year ended 31 December 2012
16 FCE Bank plc – Basel II Pillar 3 Disclosure Document – 2012
Risk
Liquidity risk
Liquidity risk is the possibility of being unable to meet present and future financial obligations as they become due. FCE’s funding
strategy is to focus on diversification of funding sources, and investors, to manage liquidity risk in all market conditions. FCE is
funded primarily through securitisation, unsecured debt and equity, with debt that, on average, matures later than assets liquidate.
FCE holds liquidity in the form of cash, marketable securities and committed capacity. FCE’s committed capacity is in the form of
committed securitisation capacity, and contractually committed unsecured credit facilities. For more information on this please see
the Liquidity section on pages 20 and 21 within the 'Capital and funding' section of this document.
FCE has an automated liquidity reporting system, and manages risk around key liquidity risk drivers. (For further details please see
the Liquidity section in the 'Capital and funding' section on pages 20 and 21 of this document, and also Note 5 'Maturity analysis of
exposures' on pages 28 to 30).
Available for use credit facilities
Available committed securitisation capacity
FCE maintains committed securitisation capacity consisting of agreements with banks and asset backed commercial paper conduits
under which these parties are contractually obligated, at FCE's option, to purchase eligible receivables, or make advances under
asset backed securities. For further details please see the 'Capital and funding' section on pages 20 and 21 of this document.
Unsecured credit facilities granted by financial institutions to the company
At 31 December 2012 the Company had £490 million (2011: £440 million) of contractually committed unsecured credit facilities with
financial institutions, of which £0 million (2011: £129 million) was utilised. As at 31 December 2012 £490 million (2011: £311 million)
of the facilities was available for use and reported within the Liquidity Risk tables in Note 5 'Maturity analysis of exposures' on
pages 28 to 30 as 'Available for use credit facilities – Granted by financial institutions to the Company'. These credit facilities, which
expire in 2014, contain certain covenants including an obligation for FCE to maintain its ratio of regulatory capital risk weighted
assets at no less than the applicable regulatory minimum, and for the support agreement between FCE and FMCC to remain in full
force and effect (and enforced by FCE to ensure that its net worth is maintained at no less than $500 million). In addition to
customary payment, representation, bankruptcy and judgement defaults, the credit facilities contain cross-payment and cross-
acceleration defaults with respect to other debt.
Unsecured credit facilities granted by FMCC to the Company
A EUR 1.5 billion (2011: EUR 2.0 billion) short term revolving facility has been provided by FMCC to the Company which matures
on 13 December 2013 or earlier upon 45 days’ notice from FMCC. As at 31 December 2012 no amounts had been drawn under this
facility (2011: nil).
FCE’s Board of Directors recognise that liquidity may be affected by the following factors (not necessarily listed in order of
importance or probability of occurrence).
• Credit ratings assigned to FCE;
• Prolonged disruption of financial markets;
• Global capital market volatility;
• Market capacity for Ford, Ford Credit and FCE sponsored investments;
• General demand for the type of securities FCE offer, including ability to access central banks and government funding;
• The Group's ability to continue funding through asset-backed financing structures;
• Performance of the underlying assets within the existing asset-backed financing structures;
• Regulatory changes;
FCE's ability to maintain credit facilities and renew committed liquidity programmes; and
• FCE's ability to obtain derivatives to manage risk.

Basel II Pillar 3 Disclosure Document for the year ended 31 December 2012
FCE Bank plc – Basel II Pillar 3 Disclosure Document – 2012 17171717171717
Risk
Other risks
In addition to the four key risk elements outlined in the sections above, FCE considers a number of other risk areas significant to its
business which it takes into account when establishing its risk governance and integrated risk management practices.
Vehicle residual value risk
Vehicle residual value risk is the risk that the actual proceeds realised by FCE upon the sale of a returned vehicle at the end of the
contract will be lower than that forecast at the beginning of the contract.
Vehicle residual values represent the estimated value of the vehicle at the end of the retail or leasing financing plan. Vehicle
residual values are calculated after analysing published residual values and FCE's own historical experience in the used vehicle
market. Vehicle residual value provisions are reviewed at least quarterly and are accounted for as an adjustment to the carrying
value of the assets on the balance sheet.
FCE is subject to vehicle residual value risk on certain retail or finance lease balloon payment products where the customer may
choose to return the financed vehicle to FCE at the end of the contract. Vehicle residual values are established by reference to
various sources of independent and proprietary knowledge. Guaranteed Minimum Future Values (GMFV's) on retail plans are set
below the expected future market value to protect customer equity and promote Trade Cycle Management products. FCE’s normal
policy is that the GMFV must be a minimum of 5% of the new vehicle list price below the expected future market value and is
increased to 8% for terms less than 24 months. This policy is a key factor behind the annual rate of return (for vehicles financed
under retail finance plans where FCE is subject to residual risk) being 0.48% (2011: 1.16%) of the maturing portfolio.
All operating lease vehicles are subject to return at the end of the lease period. FCE's exposure to operating lease has reduced due
to the outsourcing of the Full Service Leasing (FSL) portfolio in most markets. The most significant operating lease portfolio is in
Germany which is the main source of FCE’s operating lease residual value risk. Vehicle residual value risk arising from FCE’s
operating lease portfolio was significantly reduced in the year on entering into an arrangement with Ford under which Ford now
receives the majority of residual value gains and losses arising.
The residual values of FCE's retail and operating lease portfolio where FCE is subject to vehicle residual value risk as at 31
December 2012 were: Retail £861 million (2011: £796 million) and operating leases £139 million (2011: £208 million). The retail
residual value figures reported assume that all retail vehicles where FCE is subject to vehicle residual value risk will be returned.
Group risk
This is the risk of loss due to FCE’s association with its parent company. As a captive automotive finance company, FCE has an
inherent exposure to Ford; however this is carefully monitored through FCE’s Large Exposure monitoring process and minimised
through strong adherence to internal policies which ensures an arms-length approach to all transactions/services with the parent.
FCE leverages some services provided by other areas of the wider Ford Credit and Ford corporate organisation; however, these
services are governed and regulated by robust, documented, internal service level agreements and typically provide for ring fenced
capabilities.
Pension risk
This is the risk that arises from FCE’s obligations as a result of supporting pension schemes for its employees, in particular the
defined benefit scheme operated in the UK. The Company operates, in conjunction with Ford, defined benefit plans and it
recognises there is inherent volatility in the investment markets that will affect the liabilities of the scheme at any point in time and
that the pension liabilities increase over time as longevity assumptions extend and active workforce / pensioner balance matures.
FCE uses internal and external auditors to provide independent views of the pension liabilities. Transparent communication of this
and regulation oversight ensures corporate awareness at Board and Executive Management level.
FCE, in conjunction with Ford, leverages in-house US based pensions management expertise to assist with recommendations to
the Pension Fund Trustee on investment strategy and liability management. Contributions by FCE to reduce any deficit are made
over a time frame agreed with the Pension Fund Trustee and Ford.

Basel II Pillar 3 Disclosure Document for the year ended 31 December 2012
18 FCE Bank plc – Basel II Pillar 3 Disclosure Document – 2012
Risk
Further risks
In addition to the risks faced by FCE in the normal course of business, some risks and uncertainties are outside FCE's direct control.
This section outlines specific areas where FCE is particularly sensitive to such risks.
The credit ratings of FCE and Ford Credit have been closely associated with the rating agencies’ opinions of Ford. Lower credit
ratings generally result in higher borrowing costs and reduced access to capital markets. The Group has the benefit of a support
agreement from Ford Credit, (please refer to Note 31 'Ordinary shares and share premium' in the 2012 Annual Report and
Accounts).
In addition, FCE has the benefit of:
• access to on-lent debt from Ford, Ford Credit and Ford Credit International (FCI) from time to time; and
• interest supplements and other support payments from Ford provided for certain financing transactions.
The elimination, reduction or non-availability of support from Ford Credit or Ford could negatively impact FCE’s business and
results of operations.
FCE must compete effectively with other providers of finance in Europe. Ford of Europe currently provides a number of marketing
programmes that employ financing incentives to generate increased sales of vehicles. These financing incentives generate
significant business for FCE. If Ford chose to shift the emphasis from such financing incentives, this could negatively impact FCE's
share of financing related to Ford's automotive brand vehicles.
FCE's business has transitioned from a multi-brand organisation to a focus on supporting the Ford brand as the Jaguar, Land Rover,
Mazda and Volvo brands have been transferred to alternative finance providers over the last three years. This has required FCE to
focus on and implement cost reduction actions to adjust for the change in scale.

Basel II Pillar 3 Disclosure Document for the year ended 31 December 2012
FCE Bank plc – Basel II Pillar 3 Disclosure Document – 2012 19191919191919
Capital and funding
Capital
Capital adequacy
FCE’s policy is to manage its capital base to targeted levels that exceed all regulatory requirements and support anticipated
changes in assets and foreign currency exchange rates.
FCE's consolidated regulatory capital is managed through its monthly Asset and Liability Management Committee (ALCO) in which
actual and projected capital adequacy positions are monitored against capital resource requirements as determined by internal
assessment (ICAAP) and minimum regulatory levels.
FCE's solvency ratio was 297% at 31 December 2012 (2011: 291%). The solvency ratio indicates that FCE is holding capital in
excess of its Basel II minimum capital requirements as assessed under both Pillar 2 ICAAP and Pillar 1 minimum capital
requirements. FCE remains strongly capitalised given its continued role as a secured lender in the specialist automotive financial sector. There
was no change to the Company’s issued share capital during 2012. Regulatory capital is defined by tiers. FCE's Tier 1 capital
comprises shareholder funds, net of intangible assets and goodwill. FCE's Tier 2 capital comprises subordinated debt and collective
impairment losses. As FCE does not have a trading book, its capital structure does not include any Tier 3 capital. (For further
details of FCE's regulatory capital see Note 2 'Analysis of capital resources held' on pages 24 and 25).
FCE Bank Polska S.A. is a regulated bank and is also subject to regulatory capital requirements requiring maintenance of certain
minimum capital levels. During the two years being reported, the individual entities within FCE complied with all of the externally
imposed capital requirements to which they are subject.
Internal Capital Adequacy Assessment Process (ICAAP)
Annually the Board of Directors approves its Internal Capital Adequacy Assessment Process (ICAAP) declaration and submits the
declaration to the FSA. The ICAAP rules require management to recommend a total economic capital level necessary to operate its
business. Each assessment is completed after careful analysis of FCE’s primary risks, risk mitigation, risk appetite, and stress
testing and scenario planning. Each ICAAP is reviewed and approved at FCE Board meetings.
Capital strategy (including dividend policy)
FCE's plan is to gradually align its capital base with the reduced scale of its business while taking account of the funding and
liquidity environment. FCE paid an interim dividend of £315 million, (2011: £370 million) to its sole shareholder FCI in June 2012.
Based on present assumptions and subject to meeting its regulatory requirements, FCE expects to make a dividend payment in
2013.

Basel II Pillar 3 Disclosure Document for the year ended 31 December 2012
20 FCE Bank plc – Basel II Pillar 3 Disclosure Document – 2012
Capital and funding
Funding
FCE’s funding strategy is to have sufficient liquidity to profitably support Ford, its dealers and customers in all economic environments.
Liquidity Monitoring
Annually, since 2010, FCE has completed a Board approved Individual Liquidity Adequacy Assessment (ILAA), which documents
FCE’s approach to the management of liquidity risk, including governance, reporting, stress testing, contingency planning and
liquidity requirements.
FCE's balance sheet is inherently liquid because of the short-term nature of FCE’s loans and advances to customers and cash,
compared to debt. For additional information in regard to contractual maturities of receivables and debt, see Note 41 'Liquidity risk'
in the 2012 Annual Report and Accounts.
* Includes the cash flows arising from cash and advances, marketable securities, gross loans and advances to customers, other assets and gross
cash flows relating to operating leases reported on the balance sheet under property and equipment. Excludes off balance sheet available for use credit facilities.
Basel II Pillar 3 Disclosure Document for the year ended 31 December 2012
FCE Bank plc – Basel II Pillar 3 Disclosure Document – 2012 21212121212121
Capital and funding
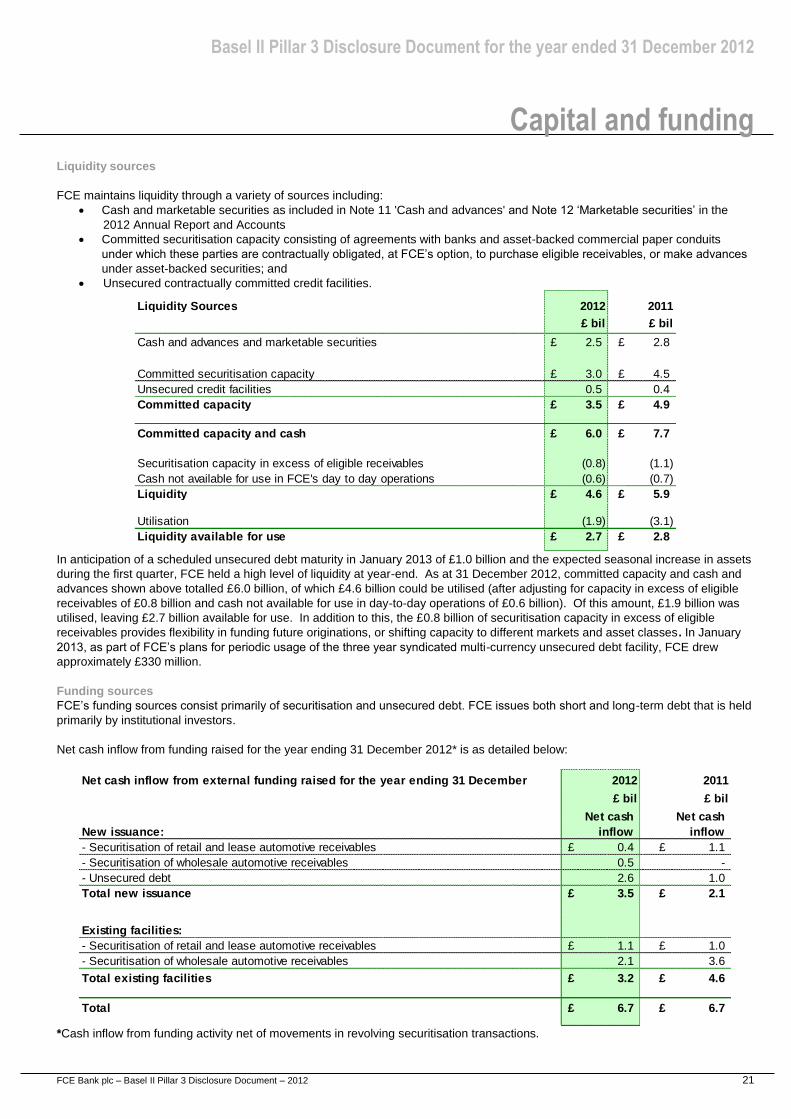
Liquidity sources
FCE maintains liquidity through a variety of sources including:
Cash and marketable securities as included in Note 11 'Cash and advances' and Note 12 ‘Marketable securities’ in the
2012 Annual Report and Accounts
Committed securitisation capacity consisting of agreements with banks and asset-backed commercial paper conduits
under which these parties are contractually obligated, at FCE’s option, to purchase eligible receivables, or make advances
under asset-backed securities; and
Unsecured contractually committed credit facilities.
In anticipation of a scheduled unsecured debt maturity in January 2013 of £1.0 billion and the expected seasonal increase in assets
during the first quarter, FCE held a high level of liquidity at year-end. As at 31 December 2012, committed capacity and cash and
advances shown above totalled £6.0 billion, of which £4.6 billion could be utilised (after adjusting for capacity in excess of eligible
receivables of £0.8 billion and cash not available for use in day-to-day operations of £0.6 billion). Of this amount, £1.9 billion was
utilised, leaving £2.7 billion available for use. In addition to this, the £0.8 billion of securitisation capacity in excess of eligible
receivables provides flexibility in funding future originations, or shifting capacity to different markets and asset classes. In January
2013, as part of FCE’s plans for periodic usage of the three year syndicated multi-currency unsecured debt facility, FCE drew
approximately £330 million.
Funding sources
FCE’s funding sources consist primarily of securitisation and unsecured debt. FCE issues both short and long-term debt that is held
primarily by institutional investors.
Net cash inflow from funding raised for the year ending 31 December 2012* is as detailed below:
*Cash inflow from funding activity net of movements in revolving securitisation transactions.
Liquidity Sources
£ bil £ bil
Cash and advances and marketable securities £ 2.5 £ 2.8
Committed securitisation capacity £ 3.0 £ 4.5
Unsecured credit facilities 0.5 0.4
Committed capacity £ 3.5 £ 4.9
Committed capacity and cash £ 6.0 £ 7.7
Securitisation capacity in excess of eligible receivables (0.8) (1.1)
Cash not available for use in FCE's day to day operations (0.6) (0.7)
Liquidity £ 4.6 £ 5.9
Utilisation (1.9) (3.1)
Liquidity available for use £ 2.7 £ 2.8
2012 2011
Net cash inflow from external funding raised for the year ending 31 December
£ bil £ bil
Net cash Net cash
New issuance: inflow inflow
- Securitisation of retail and lease automotive receivables £ 0.4 £ 1.1
- Securitisation of wholesale automotive receivables 0.5 -
- Unsecured debt 2.6 1.0
Total new issuance £ 3.5 £ 2.1
Existing facilities:
- Securitisation of retail and lease automotive receivables £ 1.1 £ 1.0
- Securitisation of wholesale automotive receivables 2.1 3.6
Total existing facilities £ 3.2 £ 4.6
Total £ 6.7 £ 6.7
2012 2011

Basel II Pillar 3 Disclosure Document for the year ended 31 December 2012
22 FCE Bank plc – Basel II Pillar 3 Disclosure Document – 2012
Quantitative information
Quantitative information
All data reported within the Quantitative information section is stated on a FCE consolidated regulatory basis unless stated
otherwise.
Capital composition and requirements
1 Consolidated and solo consolidation ........................................................................................ 23
Components of capital
2 Analysis of capital resources held ....................................................................................... 24-25
3 Subordinated loans qualifying as Tier 2 capital......................................................................... 25
Risk weighted exposures and operational risk capital
4 Analysis of capital resources and requirements................................................................... 26-27
5 Maturity analysis of exposures............................................................................................. 28-30
6 Geographical distribution of exposures ..................................................................................... 31
Provision for incurred losses
7 Provision for incurred losses ................................................................................................ 32-33
Analysis of past due exposures
8 Exposures analysed by payment due status ............................................................................ 34
9 Geographical analysis of retail exposures past due .................................................................. 35
Derivative financial instruments
10 Derivative financial instruments ................................................................................................ 36
Quantitative information index

Basel II Pillar 3 Disclosure Document for the year ended 31 December 2012
FCE Bank plc – Basel II Pillar 3 Disclosure Document – 2012 23232323232323
Quantitative information
Capital composition and requirements
The graph below shows FCE's regulatory capital held alongside its capital requirements in £ Millions:
* For details of restatement please refer to Note 1 ‘Accounting policies’ in the 2012 Annual Report and Accounts
1 Consolidated and solo consolidation
The primary regulatory reporting basis presented in this document for FCE is on a consolidated basis.
The following table details:
FCE subsidiaries excluded from solo consolidation
Capital resource requirements on a solo consolidated and consolidated basis as at 31 December 2012 and 31 December 2011
Capital resources held as at 31 December 2012 and 31 December 2011 on a consolidated basis
1,369965 847 769 667
71
2,9
38
2,7
97
2,4
87
2,2
24
1,9
80
7897
101
96
293% 291% 297%298%
230%
Dec 08 Dec 09 Dec 10 Dec 11 Dec 12
Total Regulatory Capital *
Tier 1 Capital *
Operational & Market Risk
Credit Risk *
Solvency Ratio *
3,3863,163
2,766
Total regulatory capital & capital
requirements
£ Millions
2,461
2,191
Country of 2012 2011
incorporation Note £ mil £ mil
Restated*
SOLO CONSOLIDATED BASIS Various £ 2,111 £ 2,391
FCE Credit s.r.o Czech Republic 20 18
FCE Credit Hungaria Zrt Hungary 14 13
FCE Services Kft Hungary 1 1
FCE Bank Polska S.A Poland 25 23
FCE Credit Poland S.A Poland 19 14
Saracen Holdco Ab Sweden 1 1
Subsidiaries excluded from solo consolidation £ 80 £ 70
CONSOLIDATED BASIS 4 £ 2,191 £ 2,461
Capital resources
3393
393

Basel II Pillar 3 Disclosure Document for the year ended 31 December 2012
24 FCE Bank plc – Basel II Pillar 3 Disclosure Document – 2012
Quantitative information
Components of capital
2 Analysis of capital resources held
The components of FCE's capital resources as at 31 December are detailed below:
Regulatory capital is divided into Tiers 1 and 2 that cover
primarily credit risk and Tier 3 which supports market risk.
Further information in regard to regulatory capital is detailed
below:
• Tier 1 comprising share capital, share premium, retained
earnings and reserves created by appropriations of
retained earnings. The book value of intangible assets is
deducted in arriving at Tier 1 capital.
• Tier 2 comprising qualifying subordinated loans and
collective impairment allowances relating to loans and
advances to customers and operating leases.
• FCE holds no Tier 3 capital. As FCE does not operate a
trading book, the application of Tier 3 capital would be
limited to supporting market risk requirements outside of
trading book activities.
• Deductions comprising investment in the Forso JV.
Retained earnings included within regulatory capital are net
of tax, dividends and other appropriations. Further valuation
adjustments to retained earnings are made to exclude the
historical impact of unrealised fair value adjustments to
financial instruments.
Capital ratios are calculated against risk weighted exposures
as defined in the 'Glossary of defined terms' on pages 38 and
39. Prior to the audit of the Annual Report and Accounts,
FCE excludes the unaudited profit for the financial year from
regulatory submissions.
For the purposes of calculating the amount of subordinated
debt which may be included in capital resources, the
principal amount must be amortised on a straight line basis
during the final five years to maturity.(For further details
please refer to Note 3 'Subordinated loans qualifying as Tier
2 capital' on page 25).
For the year ended 31 December 2012 2011
Note £ mil £ mil
Restated*
Tier 1
Share capital £ 614 £ 614
Share premium 352 352
Retained earnings 973 1,188
Valuation adjustments to retained earnings (35) (45)
Profit after tax 85 128
Goodwill and intangible assets (9) (13)
Total Tier 1 £ 1,980 £ 2,224
Tier 2
Collective impairment allowance £ 43 £ 63
Qualifying subordinated loans 3 212 220
Total Tier 2 £ 255 £ 283
Total Tier 3 £ - £ -
Deductions
Investment in a jointly controlled entity £ (44) £ (46)
Total deductions £ (44) £ (46)
Total regulatory capital £ 2,191 £ 2,461
Capital ratios
Tier 1 ratio (%) 21.5% 21.0%
Total capital ratio (%) 23.8% 23.2%
Group

Basel II Pillar 3 Disclosure Document for the year ended 31 December 2012
FCE Bank plc – Basel II Pillar 3 Disclosure Document – 2012 25252525252525
Components of capital continued
2 Analysis of capital resources held continued
Tier 1 Capital has decreased in 2012 to £1,980 million (2011:
£2,224 million) primarily resulting from the payment of a
dividend of £315m (2011: £370 million), partially offset by the
inclusion of profit after tax, net of foreign currency translation
differences. (For further details please refer to the
'Consolidated statements of changes in equity' in the 2012
Annual Report and Accounts).
Tier 2 Capital has also decreased in 2012 to £255million
(2011: £283 million). Collective impairment allowances
decreased in 2012 to £43 million (2011: £63 million). The
remaining reduction in Tier 2 capital is due to exchange rate
movements on the underlying currencies of the subordinated
loans.
Quantitative information
FCE is holding more capital than is required by either the
regulatory minimum or FCE's internal risk-based capital
policy. FCE’s policy is to manage its capital base to targeted
levels that exceed all regulatory requirements and support
anticipated changes in assets and foreign currency exchange
rates. For further details please refer to the 'Capital and
funding' section in this document on pages 19 to 21.
FCE Bank Polska S.A. is a regulated bank and is also
subject to regulatory capital requirements requiring
maintenance of certain minimum capital levels. During the
two years being reported, the individual entities within FCE
complied with all of the externally imposed capital
requirements to which they are subject.
3 Subordinated loans qualifying as Tier 2 capital
Details of subordinated loans provided to the Company as at 31 December are as follows:
The loans listed above satisfy the conditions for eligibility as tier two capital instruments as defined by the FSA and are included in
the calculation of capital resources for regulatory reporting purposes.
The loans from Ford Credit are denominated in Euro. The loans from FCI are denominated in US dollars and are drawn under a
US$1 billion subordinated loan facility. This facility enables the Company to respond quickly if additional capital support is required.
Under the agreed terms, the Company is able to request drawdowns up to the maximum principal amount and any undrawn amount
of the facility will be available, subject to the lender consenting to the drawdown request, until it is cancelled either by the Company
or FCI. Foreign currency derivatives are used to minimise currency risks on US dollar denominated funding.
The rights of FCI and Ford Credit to payment and interest in respect of all subordinated loans will, in the event of winding up of the
Company, be subordinated to the rights of all unsubordinated creditors of the Company with respect to their senior claims.
As at 31 December
Perpetual Loans £ 212 £ 220
£ 212 £ 220
£ 212 £ 220
£ 212 £ 220
£ 135 £ 141
77 79
Total subordinated loans £ 212 £ 220
Company/Group
£ mil £ mil
2012 2011
Due to Ford Credit
Total loan amounts
Analysis of subordinated loans
Due to FCI
Tier 2 Value of perpetual loans
Total tier 2 value

Basel II Pillar 3 Disclosure Document for the year ended 31 December 2012
26 FCE Bank plc – Basel II Pillar 3 Disclosure Document – 2012
Quantitative information Risk weighted exposures and operational risk capital
4 Analysis of capital resources and requirements
FCE has followed BIPRU 3.5.3 guidelines and has applied the simplified approach, applying a single risk weighting to all exposures
in each exposure class, when calculating the capital requirements shown in the tables below. The FSA guidelines, BIPRU 3.5.2,
permit an organisation to nominate an External Credit Assessment Institution (ECAI). FCE has the FSA's agreement not to elect an
ECAI as the majority of our financed customers are not rated by any ECAI's. Therefore FCE internal rating models are used as
described in the credit risk section of this document.
Details of the exposures and capital requirements, as at 31 December, along with the average capital requirements and risk
weighted exposures during the period, are detailed within the following tables. Any exposures relating to over the counter derivative
values are included in the relevant categories in the table.
The first table shows the exposure, capital requirement and average capital requirement relating to credit risk, which is the largest
component within FCE's total capital requirement.
Capital requirement relating to Credit Risk = Exposure x Risk weighting x minimum capital requirement (8%)
The average capital requirements, and the average risk weighted exposures shown in a later table, are calculated by adding the
capital requirements or risk weighted exposures at the beginning of the year and the end of each six month period, and dividing by
three.
At 31 December 2012 FCE had 4 large exposures, (2011: 4), defined by the FSA as representing over 10% of its capital base and
reported as such in the FSA008 Large Exposure Return. Three (2011: 3) of these were to banks (two of which were central
government institutions and are therefore a nil net exposure), and are included in the ‘5 largest exposures within cash and
advances’ mentioned below. The remaining exposure is to Ford Motor Company (FMC). Deposits received from companies within
the Group are used to mitigate the gross exposure to FMC leading to a net exposure of 18.19%, (2011: 15.93%). In addition, netting
agreements have been utilised for some Ford affiliated companies. In total the value of the financial liabilities that have been offset
against financial assets with these counterparties was £7 million at 31 December 2012 (2011: £12 million).
FCE's ten largest counterparty exposures including both amounts reported in loans and advances to customers and undrawn
commercial credit facilities, (please refer to Note 36 ‘Commitments’ in the 2012 Annual Report and Accounts), totalled £917 million
as at 31 December 2012 (2011: £866 million). Deposits received from FCI and other deposits are utilised to mitigate exposure
concentrations.
FCE's five largest counterparty exposures included within Cash and advances, (please refer to Note 11 ‘Cash and advances’ in the
2012 Annual Report and Accounts), total £2,223 million (2011: £1,687 million) and have long‑term credit ratings of single‑A or
better.
Risk Capital Capital Capital
weighting Exposure
£ mil £ mil
Credit risk exposure
Wholesale (Corporates) 100% £ 4,252 £ 340 £ 373 £ 5,177 £ 414
Corporates 50% 1 0 - - -
Corporates (Risk mitigated) 0% 150 - - 541 -
Retail 75% 4,998 300 307 5,274 316
Institutions 50% 179 7 7 196 8
Institutions 20% 827 13 18 1,610 26
Central governments and
central banks0% 1,809 - - 1,265 -
Administrative bodies and
non-commercial
undertakings
100% 8 1 - - -
Loans and advances over
90 days past due150% 38 5 4 30 4
Other items 100% 14 1 1 18 1
Other items 20% 7 0 - 3 -
Total Credit risk £ 12,283 £ 667 £ 710 £ 14,115 £ 769
Average
£ mil£ mil£ mil
Exposurerequirement
2012
Restated*
2011
requirementrequirement

Basel II Pillar 3 Disclosure Document for the year ended 31 December 2012
FCE Bank plc – Basel II Pillar 3 Disclosure Document – 2012 27272727272727
Quantitative information Risk weighted exposures and operational risk capital continued
4 Analysis of capital resources and requirements continued
The remaining elements of FCE's total capital requirement are detailed below:
The method for calculating the capital requirement associated with credit risk is described under the table on the preceding page.
The capital requirement associated with market risk is calculated by taking the foreign exchange open currency position and
multiplying it by the minimum capital requirement of 8%. The foreign exchange open currency position as at 31 December 2012
totalled £110 million (2011: £82 million), and represents the notional value of the risk weighted exposures (shown in the table
below).
To calculate the element of capital requirement relating to operational risk, FCE has adopted the standardised approach, where a
firm divides its activities into a number of business lines and applies the relevant minimum capital requirement percentage to each.
FCE divides its business into Retail and Commercial business and has applied 12% to the 'income indicator' relating to Retail of
£287 million as at 31 December 2012, (2011: £362 million), and 15% to the Commercial 'income indicator' of £184 million as at 31
December 2012, (2011: £184 million). (For more detail on the calculation of the 'income indicator' value and the minimum capital
requirement percentages for different business types as prescribed by the FSA, please refer to BIPRU 6.4).
The table below details the risk weighted exposures:
The final table summarises the main capital metrics:
The increase in the solvency ratio in 2012 to 297% (2011: 291%) is primarily attributable to the lower level of risk weighted assets in
2012 compared to 2011. The solvency ratio indicates that FCE is holding more capital than is required by either the regulatory
minimum or FCE's internal risk-based capital policy. (For further details please refer to the 'Capital strategy (including dividend
policy)' section in this document on page 19).
2011
Capital Capital Capital
Note
£ mil £ mil
Restated*
Capital requirement
Credit risk 4 £ 667 £ 710 £ 769
9 6 7
Operational risk 62 65 71
Total capital requirement £ 738 £ 781 £ 847
2012
Average
Market risk
requirementrequirement requirement
£ mil
2011
Risk weighted Risk weighted Risk weighted
Note exposures
£ mil £ mil
Restated*
Risk weighted assets
Credit risk 4 £ 8,337 £ 8,884 £ 9,616
110 74 82
Operational risk 777 814 889
Total risk weighted assets £ 9,224 £ 9,772 £ 10,587
2012
Average
exposures exposures
Market risk
£ mil
£ mil £ mil
Note Restated*
Capital metrics
Total capital requirements £ 738 £ 847
Total capital resources held 2 £ 2,191 £ 2,461
Solvency ratio 297% 291%
2012 2011

Basel II Pillar 3 Disclosure Document for the year ended 31 December 2012
28 FCE Bank plc – Basel II Pillar 3 Disclosure Document – 2012
Quantitative information
Risk weighted exposures and operational risk capital continued
5 Maturity analysis of exposures
Maturity Analysis of exposures as at 31 December analysed into the relevant maturity buckets as detailed below:
Group 1-5 5+
As at 31 December 2012 Years Years
Assets Note
Cash and advances to banks A £ 2,477 £ - £ - £ 68 £ 2,545
Marketable securities F 1 - - - 1
Derivative financial instruments E 26 37 63 - 126
- Retail/Lease B 526 1,798 3,081 12 5,417
- Wholesale B 540 3,380 42 - 3,962
Loans and advances to customers B 1,066 5,178 3,123 12 9,379
Operating leases B 65 109 - - 174
Other assets D 260 - - - 260
Total asset inflows £ 3,895 £ 5,324 £ 3,186 £ 80 £ 12,485
Liabilities
Due to banks and other financial institutions C £ 701 £ 1,668 £ 1,182 £ 1 £ 3,552
Corporate deposits C 45 8 - - 53
Due to parent and related undertakings C 102 342 875 - 1,319
Debt securities in issue C 1,219 867 2,805 4 4,895
Derivative financial instruments E 15 39 43 - 97
Other liabilities D 78 16 8 3 105
Subordinated loans D 1 6 36 212 255
Total liability outflows £ 2,161 £ 2,946 £ 4,949 £ 220 £ 10,276
Net liquidity gap excluding off balance sheet items £ 1,734 £ 2,378 £ (1,763) £ (140) £ 2,209
Cumulative net liquidity gap
excluding off balance sheet items £ 1,734 £ 4,112 £ 2,349 £ 2,209
Available for use credit facilities:
Granted by financial institutions to the company £ 490 £ - £ (490) £ -
Granted by FMCC to the company - - - -
Granted by the company (Note 36) - - - -
Total available for use credit facilities £ 490 £ - £ (490) £ -
Guarantees callable £ (50)
Cumulative net liquidity gap
including off balance sheet items £ 2,174 £ 4,552 £ 2,299 £ 2,159
4-12 Total
Months Months
0-3

Basel II Pillar 3 Disclosure Document for the year ended 31 December 2012
FCE Bank plc – Basel II Pillar 3 Disclosure Document – 2012 29292929292929
Quantitative information
Risk weighted exposures and operational risk capital continued
5 Maturity analysis of exposures continued
Group 1-5 5+
As at 31 December 2011 Years Years
Assets Note
Cash and advances A £ 2,698 £ - £ - £ 69 £ 2,767
Marketable securities F - - - - -
Derivative financial instruments E 45 46 74 - 165
- Retail/Lease B 598 1,718 3,438 25 5,779
- Wholesale B 593 4,118 53 - 4,764
Loans and advances to customers B 1,191 5,836 3,491 25 10,543
Operating leases B 85 144 - - 229
Other assets D 169 - - - 169
Total asset inflows £ 4,188 £ 6,026 £ 3,565 £ 94 £ 13,873
Liabilities
Due to banks and other financial institutions C £ 599 £ 2,416 £ 1,394 £ - £ 4,409
Corporate deposits C 45 5 - - 50
Due to parent and related undertakings C 280 554 - - 834
Debt securities in issue C 1,310 470 3,874 1 5,655
Derivative financial instruments E 28 32 28 - 88
Other liabilities D 85 22 - - 107
Subordinated loans D 1 8 43 220 272
Total liability outflows £ 2,348 £ 3,507 £ 5,339 £ 221 £ 11,415
Net liquidity gap excluding off balance sheet items £ 1,840 £ 2,519 £ (1,774) £ (127) £ 2,458
Cumulative net liquidity gap
excluding off balance sheet items £ 1,840 £ 4,359 £ 2,585 £ 2,458
Available for use credit facilities:
Granted by financial institutions to the company £ 311 £ - £ (311) £ -
Granted by FMCC to the company - - - -
Granted by the company (Note 36) - - - -
Total available for use credit facilities £ 311 £ - £ (311) £ -
Guarantees callable £ (512)
Cumulative net liquidity gap
including off balance sheet items £ 1,639 £ 4,158 £ 2,073 £ 1,946
Months
£ mil
0-3
£ mil£ mil£ mil£ mil
4-12 Total
Months

Basel II Pillar 3 Disclosure Document for the year ended 31 December 2012
30 FCE Bank plc – Basel II Pillar 3 Disclosure Document – 2012
Quantitative information
Risk weighted exposures and operational risk capital continued
5 Maturity analysis of exposures continued
Basis of liquidity risk analysis
The tables within this note analyse gross undiscounted contractual cash flows from assets and liabilities, with the exception of
derivative financial instruments, which are settled net, into relevant maturity groupings based on the criteria detailed in the following
table.
The ‘Net liquidity gap excluding off balance sheet items’ is reported excluding behavioural adjustments for customer early
settlements. The ‘Net liquidity gap including off balance sheet items’ includes available for use credit facilities.
Both of the above gap figures assume that the inflows related to retail, leasing and wholesale financing plans occur on the latest
contractual date and that the repayment of debt occurs at the earliest possible repayment date. Accordingly FCE’s expected
liquidity position based on cash inflows and outflows is more favourable than as presented within this note.
Note Cash flows from assets and liabilities are allocated to the appropriate time bands as follows:
A Based on availability of 'cash and advances' as follows (Please refer to Note 11 in the 2012 Annual Report and
Accounts).
• 'Cash and cash equivalents' classified by contractual maturity date.
• 'Other deposits' which are typically not available for use in day to day operations classified based on the latest possible
repayment date.
B Customer payments are assumed to occur on the latest contractual date and no behavioural adjustments are made for
customer early settlements:
• Retail finance and lease contracts and operating lease vehicles generally require customers to pay equal monthly
instalments over the life of the contract.
• Wholesale financing for new and used vehicles held in dealers inventory - A bullet repayment schedule is utilised as
the principal is typically repaid in one lump sum at the end of the financing period.
C Classified to the earliest possible repayment date which means the first rollover date, or the shortest period of notice
required to withdraw the funds or exercise a break clause where applicable.
D Classified according to the remaining period to maturity.
E
F
Forward foreign exchange contracts and cross currency interest rate swaps are recorded on a contractual cash flow
basis.
Marketable securities are considered as available liquidity on demand.

Basel II Pillar 3 Disclosure Document for the year ended 31 December 2012
FCE Bank plc – Basel II Pillar 3 Disclosure Document – 2012 31313131313131
Quantitative information Risk weighted exposures and operational risk capital continued
6 Geographical distribution of exposures
In line with the focus of management review and the requirements of IFRS 8 'Operating Segments', the performance of the five
major geographical markets, (UK, France, Germany, Italy and Spain), is separately reported in Notes 6, 7, 8 and 9, and in the 2012
Annual Report and Accounts.
Analysis of exposures as at 31 December:
The chart highlights the continued importance of the UK and German markets and reduction in financing in the Italian,
French and Spanish markets
For further details of FCE's operating segments refer to the table below:
Reportable Segment Description
France The Company's branch in France.
Germany The Company's branch in Germany.
Italy The Company's branch in Italy.
Spain The Company's branch in Spain.
United Kingdom UK operations excluding Worldwide Trade Financing (WTF) a UK division and Central Office
Operations (which are included within 'Central/Other').
Central / Other This heading represents operations individually contributing less than 10% of external revenue and
includes the Company's branches in Austria, Belgium, Greece, Ireland, Netherlands and Portugal
and FCE's subsidiaries located in the Czech Republic, Hungary and Poland. In addition
'Central/Other' includes Central Office operations, WTF a UK division, eliminations of intra and
inter-company transactions and an amortising receivable portfolio in Norway.
Reportable segments include Special Purpose Entities supporting securitisation transactions in those markets.
ASSETS (as at 31 December 2012)
Net loans and advances to customers £ £ £ £ £ £ £
Total assets £ £ £ £ £ £ £
TOTAL
FCE
8,703
12,078
704
£ mil £ mil
355 1,259
397 813 2,269 2,891
2,798 2,639
1,091 4,617
948
2012
Spain
£ mil £ mil
2012
UK
2012
ItalyGermany
2012
France
2012
£ mil
2012
Central
2012
/ Other
£ mil £ mil
ASSETS (as at 31 December 2011)
Net loans and advances to customers (Restated *) £ £ £ £ £ £ £
Total assets (Restated *) £ £ £ £ £ £ £
TOTAL
FCE
13,410 2,624 4,379 1,470 537 954 3,446
9,783 854 1,452 2,618 3,118 1,282 459
2011 2011 2011
£ mil £ mil £ mil £ mil £ mil £ mil £ mil
2011 2011 2011 2011
/ Other
France CentralUK Germany Italy Spain
32%
30%
11%
8%
4%
15%
0%
5%
10%
15%
20%
25%
30%
35%
UK Germany Italy France Spain Other
December 2011
June 2012
December 2012
Analysis of net loans and advances to customers by market
Norway
Greece
Portugal
Ireland
Austria
Netherlands
Eastern Europe
0.0% 1.0% 2.0% 3.0% 4.0% 5.0%
'Other' by market
Belgium
WTF
(Retained liquidating portfolio)
0.1%
0.7%
0.7%
1.2%
2.3%
2.3%
2.4%
4.9%

Basel II Pillar 3 Disclosure Document for the year ended 31 December 2012
32 FCE Bank plc – Basel II Pillar 3 Disclosure Document – 2012
Quantitative information Provision for incurred losses
7 Provision for incurred losses
The movement in the provision for incurred losses is as follows:
The collective impairment allowance as detailed forms part of FCE's Tier 2 regulatory capital as disclosed in Note 2 'Analysis of
capital resources held' on pages 24 and 25. Incurred but not yet identified losses relating to operating leases are also included in
the regulatory capital figure but are excluded from the value above.
A provision for impairment losses is made against loans and advances to cover bad and doubtful debts which have been incurred
and not separately identified, but which are known from experience to be present in portfolios of loans and advances. The provision
is determined based on a number of factors including historical loss trends, the credit quality of the present portfolio and general
economic factors.
Retail financing contracts are individually impaired as soon as it is apparent and reasonable to conclude that a credit loss will arise
and at no later than 120 days past due. Following the impairment of a retail financing contract, the carrying value of the loan is
reduced to reflect the average vehicle recovery value. Following the impairment of a wholesale contract, the carrying value of the
loan is reduced to reflect the estimated collectible amount including the effect of partial or full guarantees or other forms of security
(including physical stock).
The majority of FCE's retail, leasing and wholesale financing plans have the benefit of a title retention plan or a similar security
interest in the underlying asset. Over 85% of FCE’s net loans and advances benefit from this security. In the case of customer
default the value of the re-possessed collateral provides a source of protection.
Notes
Balance at 1 January 2011 £ 71 £ 11 £ 82 £ 71 £ 11 £ 82
Impairment losses charged
to income statement £ 3 £ (1) £ 2 £ 4 £ (1) £ 3
Deductions
- Losses written-off (58) (1) (59) (58) (1) (59)
- Recoveries 37 2 39 37 2 39
Net losses £ (21) £ 1 £ (20) £ (21) £ 1 £ (20)
Other:
- Exchange adjustments (1) - (1) (1) - (1)
Balance at
31 December 2011 / 1 January 2012 £ 52 £ 11 £ 63 £ 53 £ 11 £ 64
Impairment losses charged
to income statement £ 3 £ (5) £ (2) £ 3 £ (5) £ (2)
Deductions
- Losses written-off (44) (4) (48) (44) (5) (49)
- Recoveries 28 3 31 28 3 31
Net losses £ (16) £ (1) £ (17) £ (16) £ (2) £ (18)
Other:
- Exchange adjustments - (1) (1) (1) - (1)
Balance at
31 December 2012 / 1 January 2013 £ 39 £ 4 £ 43 £ 39 £ 4 £ 43
Analysis of provision for incurred losses:
- Collective impairment allowance £ 52 £ 9 £ 61 £ 53 £ 9 £ 62
- Specific impairment allowance 2 2 2 2
Balance at
31 December 2011 / 1 January 2012 £ 52 £ 11 £ 63 £ 53 £ 11 £ 64
- Collective impairment allowance £ 39 £ 3 £ 42 £ 39 £ 3 £ 42
- Specific impairment allowance - 1 1 - 1 1
Balance at
31 December 2012 / 1 January 2013 £ 39 £ 4 £ 43 £ 39 £ 4 £ 43
Company Group
Retail Wholesale TotalTotalRetail Wholesale
£ mil £ mil£ mil£ mil £ mil £ mil

Basel II Pillar 3 Disclosure Document for the year ended 31 December 2012
FCE Bank plc – Basel II Pillar 3 Disclosure Document – 2012 33333333333333
Quantitative information
Provision for incurred losses continued
The total of ‘Impairment losses charged / (credited) to income statement’ shown in the above tables as at 31 December 2012 of
(£2) million (2011: £3 million) are analysed by location in the tables below. They are shown alongside the equivalent ‘Past due
exposures’ for each of the locations as disclosed in Note 9 ‘Geographical analysis of retail exposures past due’ on page 35 of this
document.
The ‘Net losses’ shown in the table on page 32 which totalled £18 million as at 31 December 2012 (2011: £20 million), can be
measured as a percentage of loans and advances to customers and referred to as the ‘credit loss ratio’.
The credit loss ratio for FCE’s top 5 markets is shown at each quarter end point from December 2011 to December 2012 in the
graph below. Note that the ratio for total FCE has increased marginally from 0.19% at 31 December 2011 to 0.20% at 31 December
2012. This reflects the consistent quality of FCE’s portfolio despite continued instability in Europe’s economic conditions.
CREDIT RISK (as at 31 December 2012)
Impairment losses charged / (credited) £ £ £ £ £ £ £
Past due exposures £ £ £ £ £ £ £
£ mil
(2)
2012
TOTAL
FCE
Other
2012 2012
France
£ mil £ mil
- -
UK Germany Italy Spain
£ mil £ mil £ mil £ mil
2012 2012 2012 2012
- (3) 7 (6)
46 148 4 25 32 35 6
CREDIT RISK (as at 31 December 2011)
Impairment losses charged / (credited) £ £ £ £ £ £ £
Past due exposures £ £ £ £ £ £ £
TOTAL
FCE
41 168
- 4 3
22 50 38 13 4
5 (5) 6 (7)
2011
£ mil £ mil £ mil £ mil £ mil £ mil £ mil
2011 2011 2011 2011 2011 2011
UK Germany Italy Spain France Other
-0.6%
-0.4%
-0.2%
0.0%
0.2%
0.4%
0.6%
0.8%
1.0%
UK Germany Italy Spain France Total FCE
December 2011 Annualised March 2012 Annualised June 2012 Annualised Sept 2012 December 2012
Net credit losses as percentage of average net loans and advances to customers
7 Provision for incurred losses continued

Basel II Pillar 3 Disclosure Document for the year ended 31 December 2012
34 FCE Bank plc – Basel II Pillar 3 Disclosure Document – 2012
Quantitative information
Analysis of past due exposures
8 Exposures analysed by payment due status
A financial asset is defined as 'past due' when a counterparty fails to make a payment when it is contractually due. In the event of a
past due instalment, the classification of past due applies to the full value of the loan outstanding. A description of how these
assets are monitored and managed within FCE is given in the section below, split into the main credit risk exposure classes of
'Retail' and 'Wholesale'.
Retail
When originating retail loans and advances, FCE uses a proprietary scoring system that measures the credit quality of the related
receivables using several factors such as credit bureau information, consumer credit risk scores, customer characteristics, and
contract characteristics.
Detailed below is a retail delinquency monthly trend graph for the last five years which highlights the percentage of retail contracts
which are 30, 60 and 90 days overdue, but not impaired. The graph highlights that the upward trend in delinquencies peaked in the
first half of 2009; since that time the delinquency trend has steadily improved. FCE's management considers that this improvement
is a consequence of FCE's responsive approach to underwriting and servicing practices that has enabled the portfolio to perform
well despite varying economic pressures.
Source: internal information for all FCE markets – audited as at 31 December points.
Wholesale
FCE uses proprietary models to assign each dealer a risk rating. The Financial model considers financial information including
profitability, capital and liquidity at a point in time. This is supplemented by the Judgmental model which provides a structured
framework within which additional financial information along with other qualitative and non-financial key factors are assessed.
These other factors, that are considered significant in predicting a dealer's ability to meet its current and future obligations, include
such elements as financial trends, management quality, vehicle inventory audit and payment experience. The models are subject
to review to confirm the continued business significance and statistical predictability of the factors and updated to incorporate new
factors or other information that improves their statistical predictability.
In addition, FCE verifies the existence of the assets collateralising the receivables by physical and approved non-physical audits of
vehicle inventories, which are performed with increased frequency for higher risk dealers. Credit reviews are performed on each
dealer at least annually and the dealer’s risk rating adjusted if necessary.
It is FCE's policy that wholesale amounts past due are either resolved to FCE's satisfaction in accordance with established policies
and procedures or the loan is classified as impaired. For further details please refer to Note 38 'Credit risk' in the 2012 Annual
Report and Accounts.
0.0%
0.5%
1.0%
1.5%
2.0%
December 07 December 08 December 09 December 10 December 11 December 12
30 days
60 Days
90 Days
Retail delinquency 5 year monthly trend

Basel II Pillar 3 Disclosure Document for the year ended 31 December 2012
FCE Bank plc – Basel II Pillar 3 Disclosure Document – 2012 35353535353535
Quantitative information Analysis of past due exposures continued
9 Geographical analysis of retail exposures past due
Retail
The tables below provide a geographical analysis of retail contracts which are past due but not impaired for the largest five
locations plus all other locations which are reported under the caption ’Other'. The retail past due contracts are analysed by
payment due status and are shown against the net loans and advances in each location as at 31 December.
(The 2011 Retail net loans and advances have been restated to £5,194 million from £5,222 million. Please see Note 1 ‘Accounting
Policies’ in FCE’s 2012 Annual Report and Accounts for further details on this).
The graph below shows past due retail contracts as a percentage of net loans and advances analysed by location.
Past due exposures (as at 31 December 2012)
Past due under 30 days £ £ £ £ £ £ £
Past due over 30 < 60 days
Past due over 60 < 90 days
Past due over 90 < 120 days
Total past due £ £ £ £ £ £ £
Retail net loans and advances £ £ £ £ £ £ £
Other
2012 2012 20122012 2012
UK Germany Italy Spain France
£ mil£ mil £ mil £ mil £ mil
2012 2012
3 3 35
6 1 1 8
147 288 376
£ mil £ mil
7 7
15 22 24 102
30
5
4,893
2 11
1
4
148 46 4
0
6 35
1
1 0 1
1,983 1,542
32
557
1
2 2
25
1
FCE
TOTAL
Past due exposures (as at 31 December 2011)
Past due under 30 days £ £ £ £ £ £ £
Past due over 30 < 60 days
Past due over 60 < 90 days
Past due over 90 < 120 days
Total past due £ £ £ £ £ £ £
Retail net loans and advances (Restated *) £ £ £ £ £ £ £
TOTAL
FCE
£ mil £ mil £ mil £ mil
France
2011
22
9
3
1
50 38
2
5,194
6
2
0
10
4
7
3
2
631 149
111
15
6
3
13 4
3
28
£ mil £ mil
1
3
303 448
14 35 26 5
1,413 2,250
1
0
0
41 168
36
2011 2011
Italy Spain
2011 20112011
£ mil
Other
2011
UK Germany
0.0%
1.0%
2.0%
3.0%
4.0%
5.0%
6.0%
7.0%
8.0%
9.0%
10.0%
Past due contracts as a % of retail loans and advances by location and year
% Under 30 Days % Over 30 to 60 Days % Over 60 to 90 Days % Over 90 to 120 Days

Basel II Pillar 3 Disclosure Document for the year ended 31 December 2012
36 FCE Bank plc – Basel II Pillar 3 Disclosure Document – 2012
Quantitative information
Derivative financial instruments
10 Derivative financial instruments
The following table analyses the derivative financial instruments by type of contract, giving the underlying notional amount and
estimated fair value.
The notional amounts of the derivative financial instruments do not necessarily represent amounts exchanged by the parties and,
therefore, are not a direct measure of the exposure to financial risks. The amounts exchanged are calculated by reference to the
notional amounts and by other terms of the derivatives, such as interest rates or foreign currency exchange rates.
All derivatives entered into by FCE are for the purpose of matching or minimising risk from potential movements in foreign
exchange rates and/or interest rates inherent in FCE's financial assets and liabilities. All designated hedges are utilised to manage
interest rate risk.
Use of derivatives exposes FCE to the risk that a counterparty may default on a derivative contract. FCE establishes exposure
limits for each counterparty to minimise this risk and provide counterparty diversification. FCE transacts with certain Ford related
parties, which are non-rated entities. Substantially all of FCE's derivative related activities are transacted with financial institutions
that have an investment grade rating.
The aggregate fair value of derivative instruments in asset positions on 31 December 2012 is £125 million, (2011: £163 million),
representing the maximum potential loss at that date if all counterparties failed to perform as contracted. Master agreements in
place with counterparties generally allow for netting of certain exposures; therefore, the actual loss recognised if all counterparties
failed to perform as contracted would be lower.
For further information in regard to derivative usage, policies and controls please refer to the 'Financial market risk' paragraph in the
'Risk' section on pages 10 to 18 of this document.
As at 31 December
Group Amount Assets Amount Assets
Designated as fair value hedges
Interest rate swaps £ 1,184 £ 30 £ - £ 951 £ 32 £ -
Total designated as fair value hedges £ 1,184 £ 30 £ - £ 951 £ 32 £ -
Non-designated derivatives
Interest rate swaps £ 10,571 £ 90 £ 70 £ 9,765 £ 116 £ 61
Cross currency interest rate swaps 970 - 30 475 8 -
Foreign exchange forwards 548 5 0 1,173 7 24
Total non-designated derivatives £ 12,089 £ 95 £ 100 £ 11,413 £ 131 £ 85
Total derivatives £ 13,273 £ 125 £ 100 £ 12,364 £ 163 £ 85
Current £ 63 £ 54 £ 46 £ 25
Non current 62 46 117 60
Total £ 125 £ 100 £ 163 £ 85
2012 2011
Liabilities Liabilities
Notional Fair Values Notional Fair Values
£ mil£ mil £ mil £ mil £ mil £ mil

Basel II Pillar 3 Disclosure Document for the year ended 31 December 2012
Other Information
FCE Bank plc – Basel II Pillar 3 Disclosure Document – 2012 37373737373737
Website addresses
Additional data and web resources, including those listed below, can be obtained from the following website addresses:
Additional data Web site addresses
FCE Bank plc.
'Annual Report'
'Interim Report'
'Management Statement'
http://www.fcebank.com
or
http://www.fordfinancialeurope.com
To access from the above links click on 'Investor
Information'
Ford Motor Company (Ultimate Parent Company) including:
'Financial Results'
'Annual Reports'
'US SEC EDGAR filings' Footnote 1 and 2
http://www.ford.com/about-ford/investor-relations
To access from the above click on 'Company
Reports'.
Ford Motor Credit Company including:
'Company Reports' Footnote 2
'Press Releases'
'Ford Credit public asset-backed securities transactions' Footnote 3
http://www.fordcredit.com/investorcenter
To access from the above link click on 'Company
Reports' and then required item.
Luxembourg's Stock Exchange which includes
Euro Medium Term Note Base Prospectus
(refer to Note 28 'Debt securities in issue' in
FCE's 2012 Annual Report and Accounts).
www.bourse.lu
To access search for 'FCE'
Financial Reporting Council
The Combined Code on Corporate Governance
Financial Services Authority (replaced from 1st
April 2013
by the Prudential Regulation Authority & Financial
Conduct Authority)
Prudential Sourcebooks (GENPRU, BIPRU)
Prudential Regulation Authority (PRA)
Financial Conduct Authority (FCA)
http://www.frc.org.uk
http://www.fsa.gov.uk
http://www.bankofengland.co.uk/pra
http://www.fca.org.uk/
Additional information
Footnote 1: Securities and Exchange Commission (SEC) Electronic Data Gathering and Retrieval (EDGAR)
Footnote 2: SEC filings include both SEC Form 10K Annual report and SEC Form 10Q Quarterly reports.
Footnote 3: ‘Ford Credit public asset-backed securities transactions’. Incorporates European retail public
securitisation data including the following report types:
Offering Circulars
Monthly Rating Agencies Report
Monthly Payments Notification
Monthly Note holders’ Statement

Basel II Pillar 3 Disclosure Document for the year ended 31 December 2012
38 FCE Bank plc – Basel II Pillar 3 Disclosure Document – 2012
Other information
Glossary of defined terms
For the purpose of this report the following terms have the meaning prescribed against them. Certain defined terms may not always
be capitalised in this report.
Financial
Terms
Financial terms meaning
IAS International Accounting Standards
IFRIC International Financial Reporting Interpretations Committee
IFRS International Financial Reporting Standards
Regulatory
Terms
Regulatory terms meaning
ARROW Advanced Risk Response Operating Framework
Basel II An international business standard that banking regulators use when creating regulations and the supervisory environment for
financial institutions in the European Union so that they maintain enough cash reserves to cover financial and operational risks
incurred by their operations. Issued by the Basel Committee on Banking Supervision with the framework detailed in the EU
Capital Requirements Directive and implemented by national legislation.
BIPRU The Financial Services Authority Prudential Sourcebook for Banks, Building Societies and Investment Firms
CAD The Capital Adequacy Directive
CRD The Capital Requirements Directive, commonly referred to as Basel II
CRR Capital Resource Requirement as defined by the FSA
FCA Financial Conduct Authority. On 1st April 2013 the FCA became responsible for regulation of conduct in retail, as well as
wholesale, financial markets and the infrastructure that supports those markets replacing the FSA.
FSA The UK Financial Services Authority – an independent non-governmental body, given statutory powers by the Financial Services
and Markets Act 2000. The FSA was FCE's regulator in the UK until it was replaced from 1st April 2013 by the Financial Conduct
Authority (FCA) & Prudential Regulatory Authority (PRA). FCE is now regulated by both bodies.
GENPRU The Financial Services Authority General Prudential Sourcebook
ICAAP Internal Capital Adequacy Assessment Process
ICG Individual Capital Guidance is what the FSA considers to be an adequate level of capital to meet regulatory objectives
ILAA An Individual Liquidity Adequacy Assessment, required by the FSA under the ILAS regime
ILAS Individual Liquidity Adequacy Standards as set by the FSA
Institutions A credit institution or CAD investment firm
Pillar 1 Capital framework which revises the 1988 Accord’s guidelines by aligning the minimum capital requirements more closely to each
bank's actual risk of economic loss.
Pillar 2 Supervisory Review Process of Basel II whereby regulators evaluate the activities and risk profiles of individual banks to
determine whether such an organisation should hold higher levels of capital.
Pillar 3 Leverages the ability of market discipline to motivate prudent management by enhancing the degree of transparency in banks’
public reporting to shareholders and customers.
PRA Prudential Regulation Authority. On 1 April 2013 the PRA became responsible for the prudential regulation and supervision of
banks, building societies, credit unions, insurers and major investment firms replacing the FSA.
PRR Position Risk Requirement as defined by the FSA
Risk Weighted
exposures
Exposures multiplied by the appropriate percentage risk weighting required for Basel capital adequacy purposes including a
notional asset value for market and operational risk. These are reported in Note 4 'Analysis of capital resources and
requirements'.
Solvency
Ratio
Calculated by dividing total regulatory capital by the minimum capital requirements calculated under Pillar 1 plus other risk capital
requirements and expressing this as a percentage.
Tier 1 Capital FCE's Tier 1 capital comprises shareholder funds, net of intangible assets and goodwill (See Note 2 'Components of capital').
Tier 1 Capital
Ratio
FCE's Tier 1 capital as reported in Note 2 'Components of capital' divided by end of period risk weighted exposures as defined
above.
Tier 2 Capital FCE's Tier 2 capital comprises of subordinated debt, collective impairment losses (See Note 2 'Components of capital').
Tier 2 Capital
Ratio
FCE's Tier 2 capital as reported in Note 2 'Components of capital' divided by end of period risk weighted exposures as defined
above.
Tier 3 Capital FCE does not have a trading book and accordingly its capital structure does not include any Tier 3 capital (See Note 2
'Components of capital').
Total Capital
Ratio
FCE's total regulatory capital as reported in Note 2 'Components of capital' divided by end of period risk weighted exposures as
defined above.

Basel II Pillar 3 Disclosure Document for the year ended 31 December 2012
Other Information
FCE Bank plc – Basel II Pillar 3 Disclosure Document – 2012 39393939393939
Glossary of defined terms continued
Other terms Other terms meaning
2012 Annual
Report and
Accounts
The FCE consolidated annual financial statements as at and for the year ended 31 December 2012
ALCO FCE's Asset and Liability Management Committee
Board or Board of
Directors
The Board of Directors of FCE Bank plc.
Company FCE Bank plc. including all its European branches, but excluding its subsidiaries and SPEs.
Dealer or
Dealership
A wholesaler franchised directly by Ford, or one of its affiliates, to provide vehicle sales, service, repair and financing.
See Wholesale below.
Derivatives Financial instruments which take the form of contracts under which parties agree to payments between them based upon the
value of an underlying asset or other data at a particular point in time
EMTN 1993 European Medium Term Note Programme launched by FCE for the issue of Notes, including retail
securities, to both institutional and retail investors. Maximum programme size is now US$12 billion.
FCE or Group Company and all its subsidiaries (See Note 24 'Investments in other entities’ in the 2012 Annual Report & Accounts.
FCI Ford Credit International, Inc., a company incorporated under the laws of Delaware USA, a subsidiary of Ford
Credit and the Company's immediate shareholder
Finance lease Also known as full payout leasing. A contract involving payment over a primary/basic period of specified sums
sufficient in total to amortise the capital outlay of the lessor, and to provide for the lessor's borrowing costs and
profit. The lessee normally is responsible for the maintenance of the asset.
Ford Credit or
FMCC
Ford Motor Credit Company LLC, a limited liability company incorporated under the laws of Delaware USA and an indirect
wholly owned subsidiary of Ford
Ford Ford Motor Company, a company incorporated under the laws of Delaware USA and the Company's ultimate
parent company. In some cases, this term may mean Ford Motor Company and all or some of its affiliates.
Forso / the Forso
JV
A joint venture finance company established with CA Consumer Finance, a consumer credit subsidiary of Credit Agricole S.A.
in June 2008 which provides customer and dealer automotive financing in the Nordic markets.
Full Service
Leasing or FSL
Fixed monthly vehicle rental for customers, including ongoing maintenance and disposal of vehicle at the end of the hire
period. Typically FCE retains responsibility for marketing and sales, for which it receives a fee income, and outsources
finance, leasing, maintenance and repair services for current and future portfolios of commercial operating leases to a
preferred third party under the ‘Business Partner’ brand.
GMFV Guaranteed Minimum Future Values
Interim Report FCE's consolidated interim report and financial statements as at and for the half year ended 30 June 2012
Operating lease Contracts where the assets are not wholly amortised during the primary period and where the lessor may not rely on rentals
for his profit but may look for recovery of the balance of his costs and of his profits from the sale of the recovered asset at the
lease end. Contract hire is a variation of operating lease.
Retail The part of FCE's business that offers vehicle financing and leasing products and services to individual consumers, sole
traders and businesses, introduced through a Dealer or Dealership that has an established relationship with FCE.
Securitisation A technique for raising finance from income-generating assets such as loans by redirecting their cash flow to support
payments on securities backed by those underlying assets. Legally the securitised assets generally are transferred to and
held by a bankruptcy-remote SPE. FCE normally would be engaged as a servicer to continue to collect and service the
securitised assets. FCE also engages in other structural financing and factoring transactions that have similar features to
securitisation and also are referred to as 'securitisation' in this report.
Special Purpose
Entity or SPE
A bankruptcy-remote special purpose entity whose operations are limited to the acquisition and financing of specific assets
(which may include the issue of asset-backed securities and making payments on the securities) and in which FCE usually
has no legal ownership or management control (Please refer to Note 24 ‘Investments in other entities’ in the 2012 Annual
Report and Accounts for a list of the Company's SPEs).
Wholesale The part of FCE's business that offers financing of a wholesaler's inventory stock of new and used vehicles, parts and
accessories. May also be known as dealer floor-plan or stocking finance. May also include other forms of financing provided
to a wholesaler by FCE such as capital or property loans, improvements in dealership facilities and working capital overdrafts.
See Dealer or Dealership above.