Embed Size (px)
Citation preview
BANK MUAMALAT MALAYSIA BERHAD
Company No. 6175-W
(Incorporated in Malaysia)
BASEL II PILLAR 3 DISCLOSURES
31 MARCH 2016

Bank Muamalat Malaysia Berhad
Basel II Pillar 3 Disclosure
Statement by Chief Executive Officer
In the name of Allah, The Most Beneficent, The Most Merciful
Dato’ Haji Mohd Redza Shah bin Abdul Wahid
Chief Executive Officer
In accordance with the requirement of BNM’s Guideline on Capital Adequacy Framework
for Islamic Banks (‘CAFIB’) – Disclosure Requirement (‘Pillar 3’), and on behalf of the
Board and management of Bank Muamalat Malaysia Berhad, I am pleased to provide an
attestation on the Pillar 3 disclosures of the Group and the Bank for year ended 31 March
2016.
Bank Muamalat Malaysia Berhad
Basel II Pillar 3 Disclosure
Pillar 3 Disclosure Content
Table No. Content Page
Table 1 Capital adequacy ratios 4
Table 2 Capital structure 5
Table 3 Minimum capital requirement and risk-weighted assets 6
Table 4 Minimum capital requirement and risk-weighted assets by
exposures
7
Table 5 Risk governance structure 11
Table 6 Risk Committee functions 12
Table 7 Risk Management Model 13
Table 8 Credit risk exposures and credit risk concentration by sector
analysis
15
Table 9 Credit risk exposures and credit risk concentration by geographical
analysis
19
Table 10 Maturities of financial assets by remaining contractual maturity 21
Table 11 Credit quality financing of customers 25
Table 12 Rescheduled/ restructured financing 29
Table 13 Past due but not impaired 30
Table 14 Impaired financing by economic purpose 33
Table 15 Impaired financing by geographical distribution 37
Table 16 Rating distribution on credit exposures 40
Table 17 Credit risk disclosure by risk weights 46
Table 18 Credit risk mitigation on credit exposures 50
Table 19 Commitments and contingencies 54
Table 20 Derivative financial assets & liabilities 55
Table 21 Minimum regulatory requirement for market risk 59
Table 22 Equity exposures60
Table 23 Rate of return risks 61
Table 24 Sensitivity analysis of rate of return risk62
Table 25 Liquidity risk indicators63
Table 26 Maturity analysis of assets and liabilities based on remaining
contractual maturity
65
Table 27 ORM minimum capital requirement70
Table 28 Shariah governance structure72
Bank Muamalat Malaysia Berhad
Basel II Pillar 3 Disclosure
BASEL II
Abbreviations
ALCO Asset-Liability Management Committee
ALM Asset and Liability Management
BCM Business Continuity Management
BCP Business Continuity Plan
BIA Business Impact Analysis
BOD Board of Director
BNM Bank Negara Malaysia
BRMC Board Risk Management Committee
BU Business Unit
CAFIB Capital Adequacy Framework for Islamic Banks
CBs Corporate Bonds
CC Credit Committee
CCR Counterparty Credit Risk
CEO Chief Executive Officer
CPs Commercial Papers
CR Credit Risk
CRP Credit Risk Policy
CRM Credit Risk Mitigation
CSRD Credit Supervision and Recovery Department
EAR Earning At Risk
ECAI External Credit Assessment Institutions
ERMC Executive Risk Management Committee
EVE Economic Value Perspective
FRS139 Financial Reporting Standards 139
FDI Foreign Direct Investments
GCRP Guidelines to Credit Risk Policies
IC Investment Committee
ICAAP Internal Capital Adequacy Assessment Process
IFIs Islamic Financial Institutions
IFSB-10 Institute Offering Islamic Financial Services
IPRS Islamic Profit Rate Swap
IRB ApproachInternal Ratings Based Approach
MARC Malaysian Rating Corporation Berhad
MDB Multilateral Development Bank
MISB Muamalat Invest Sdn Bhd
MR Market Risk
OR Operational Risk
ORM Operational Risk Management
ORMC Operational Risk Management Committee
PDS Private Debt Securities
PSEs Non- Federal Government Public Sector Entities
RA Risk Assessment
R&I Rating and Investment Information, Inc
RAM RAM Rating Services Berhad
RORBB Rate of Return Risk in Banking Book
PILLAR 3 DISCLOSURE

Bank Muamalat Malaysia Berhad
Basel II Pillar 3 Disclosure
Abbreviations (cont’d.)
RMD Risk Management Department
RWA Risk Weighted Assets
RWCAF Risk Weighted Capital Adequacy Framework
TBPS Trading Book Policy Statement
S&P Standard and Poor's
SC Shariah Committee
SNCI Shariah Non-Compliance Income
SRP Shariah Review Program
SU Support Unit
VaR Value at Risk
Basel II -
Pillar 3 Disclosure
Overview
The Pillar 3 Disclosure is a regulatory requirement aimed at enhancing market transparency
and discipline. It is prepared in accordance to the Bank Negara Malaysia's (BNM’s) guidelines
“Capital Adequacy Framework for Islamic Banks (CAFIB) - Disclosure Requirements (Pillar 3)”
and contains qualitative and quantitative information on Bank Muamalat Malaysia Berhad’s
(BMMB’s) risk exposures and capital adequacy levels as well as on its capital and risk
management practices.
In assessing its capital position, BMMB applies the prescribed Standardised Approach to
measure its credit and market risk exposures and the Basic Indicator Approach for operational
risk, as outlined under the BNM’s CAFIB guidelines.
This Pillar 3 disclosure is published for the financial year ended 31 March 2016 and should be
read in conjunction with BMMB's audited financial statement for the year ended 31 March
2016.
1
Basel II -
Pillar 3 Disclosure
1.0
•
•
• Subject to law-protected confidentiality, such information is not published. In case of
not publishing reserved information or the one which is subject to law-protected
confidentiality, the Group and the Bank disclose information which is less detailed.
Scope of Application
Scope of disclosure
The detailed scope of published disclosure is subject to the following classification of
information:
Insignificant, i.e. its exclusion or distortion cannot influence the assessment or
decision of a person using such information to make economic decisions, or influence
such an assessment or decision,
Reserved, i.e. its public distribution might adversely influence the position of the
Group and the Bank on the market according to regulations on competition and
consumer protection,
The Pillar 3 Disclosure is prepared on a consolidated basis and comprises information on
BMMB and its subsidiaries (hereinafter referred as “the Group and the Bank”). Information
on subsidiaries is available in Note 11 to the financial statements.
The basis of consolidation for financial accounting purposes is described in Notes 2.2 to
the financial statements, and differs from that used for regulatory capital purposes. The
investment in subsidiary companies is deducted from regulatory capital at entity level and
consolidated at group level.
There are no significant restrictions or impediments on the transfer of funds or regulatory
capital within the Group.
There were no capital deficiencies in any of the subsidiary companies of the Group as at
the financial year end.
All information in the ensuing paragraphs is based on the Group’s position. Certain
information on capital adequacy relating to the Group and the Bank is presented on a
voluntary basis to provide additional information to users. The capital-related information of
the Group and the Bank, which is presented on a global basis, includes its offshore
banking activities in Labuan as determined under the CAFIB.
This document discloses the Bank and the Group quantitative disclosures in accordance
with the disclosure requirements as outlined in the Capital Adequacy Framework for
Islamic Banks (“CAFIB”) – Disclosure Requirements (“Pillar 3”) issued by Bank Negara
Malaysia (“BNM”).
These disclosures have been reviewed and verified by internal auditors and approved by
the Board and Directors of the Group.
2
Basel II -
Pillar 3 Disclosure
2.0 Capital Management
2.1 Internal Capital Adequacy Assessment Process (“ICAAP”)
BMMB’s capital management framework was designed to protect the interests of its key
stakeholders and maximize shareholder value through optimum use of its capital resources.
The primary capital management objective is to ensure efficient capital utilization while in
pursuit of strategic and business objectives. It is also aimed at ensuring sufficient level of
capital is maintained at all times to support the business growth targets and that it is kept in line
with the Bank's risk appetite and regulatory requirements.
To determine the appropriate level and composition of capital to be held, the Bank uses the risk
and capital adequacy assessment approaches as outlined under the Internal Capital Adequacy
Assessment Process (ICAAP). The capital levels are assessed based on the Bank's strategic
and business targets, taking into account current and forecasted economic and market
conditions as well as the regulatory capital standards.
The Bank prepares its strategic, business and capital plans on an annual basis. Guided by the
Board-approved risk appetite statement, the plans cover a minimum three-year planning
horizon and are subjected to a stress test covering several possible stressed scenarios. Based
on the ICAAP and stress test analysis, internal capital targets are set for key capital ratios to
facilitate ongoing capital management and monitoring.
Arising from the strategic planning and capital assessment process, an annual capital plan is
drawn up to ensure that sufficient capital is held to meet business growth targets as well as to
maintain adequate buffer under adverse economic scenarios. The capital plan also addresses
any capital issuance requirements, capital instrument composition and maturity profile, and
capital contingency planning.
BMMB’s approach towards assessing the adequacy of its internal capital levels in relation to its
risk profile is addressed in the Internal Capital Adequacy Assessment Process (ICAAP). This is
in line with BNM’s requirement as stipulated under the guideline, “Capital Adequacy Framework
for Islamic Banks (CAFIB) - Internal Capital Adequacy Assessment Process (Pillar 2)”.
The ICAAP covers an assessment of all risk exposures, particularly on those deemed as
material risks, and the effectiveness of related risk controls and mitigations. The risk and capital
assessment also looks at the adequacy of capital in relation to other discretionary and non-
discretionary risk and where required, additional capital and buffers are allocated for risk
exposures that are deemed inadequately covered under the Pillar 1 capital.
The ICAAP further addresses the current and future capital levels to be considered or
maintained to ensure its adequacy to support the Bank’s business operations on a going-
concern basis. In terms of its capital mix, the Bank’s capital consists primarily of Tier 1 capital
and common equity, which enhances the Bank’s ability to absorb potential losses under
unforeseeable circumstances.
3
Basel II -
Pillar 3 Disclosure
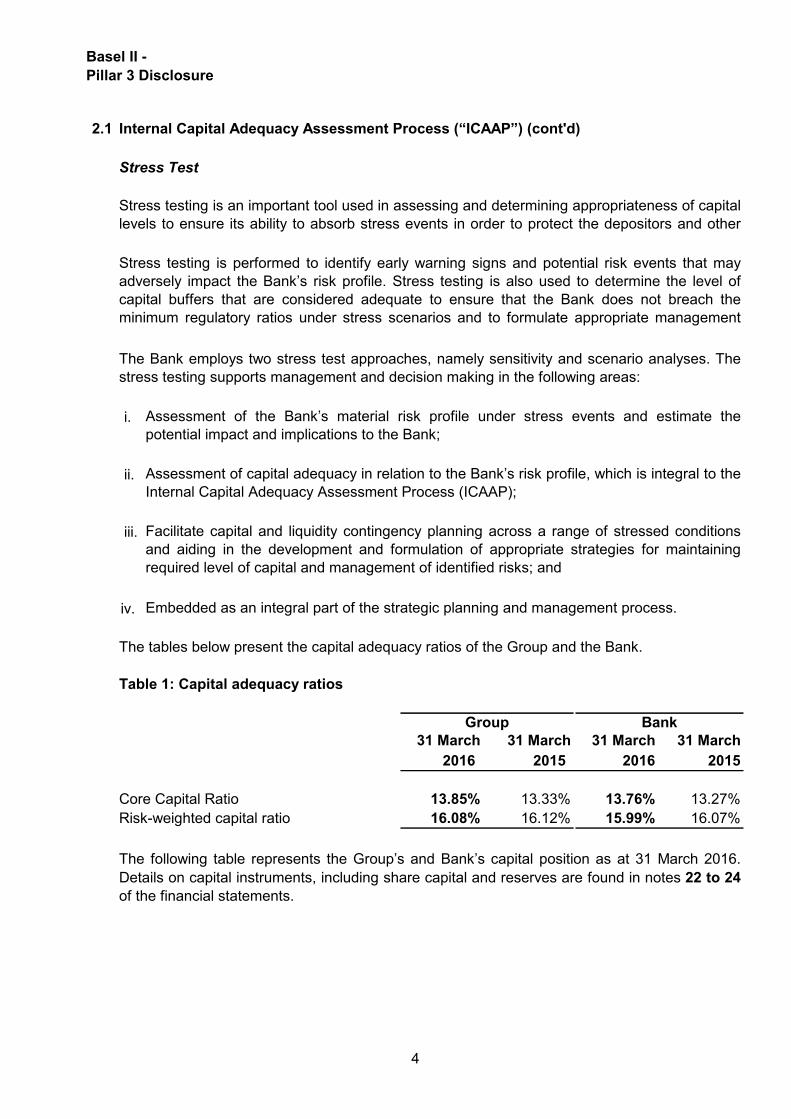
2.1 Internal Capital Adequacy Assessment Process (“ICAAP”) (cont'd)
i.
ii.
iii.
iv.
The tables below present the capital adequacy ratios of the Group and the Bank.
Table 1: Capital adequacy ratios
31 March 31 March 31 March 31 March
2016 2015 2016 2015
Core Capital Ratio 13.85% 13.33% 13.76% 13.27%
Risk-weighted capital ratio 16.08% 16.12% 15.99% 16.07%
The following table represents the Group’s and Bank’s capital position as at 31 March 2016.
Details on capital instruments, including share capital and reserves are found in notes 22 to 24
of the financial statements.
Assessment of the Bank’s material risk profile under stress events and estimate the
potential impact and implications to the Bank;
The Bank employs two stress test approaches, namely sensitivity and scenario analyses. The
stress testing supports management and decision making in the following areas:
Stress testing is an important tool used in assessing and determining appropriateness of capital
levels to ensure its ability to absorb stress events in order to protect the depositors and other
stakeholders.
Stress testing is performed to identify early warning signs and potential risk events that may
adversely impact the Bank’s risk profile. Stress testing is also used to determine the level of
capital buffers that are considered adequate to ensure that the Bank does not breach the
minimum regulatory ratios under stress scenarios and to formulate appropriate management
actions.
Stress Test
Assessment of capital adequacy in relation to the Bank’s risk profile, which is integral to the
Internal Capital Adequacy Assessment Process (ICAAP);
Facilitate capital and liquidity contingency planning across a range of stressed conditions
and aiding in the development and formulation of appropriate strategies for maintaining
required level of capital and management of identified risks; and
Embedded as an integral part of the strategic planning and management process.
Group Bank
4
Basel II -
Pillar 3 Disclosure
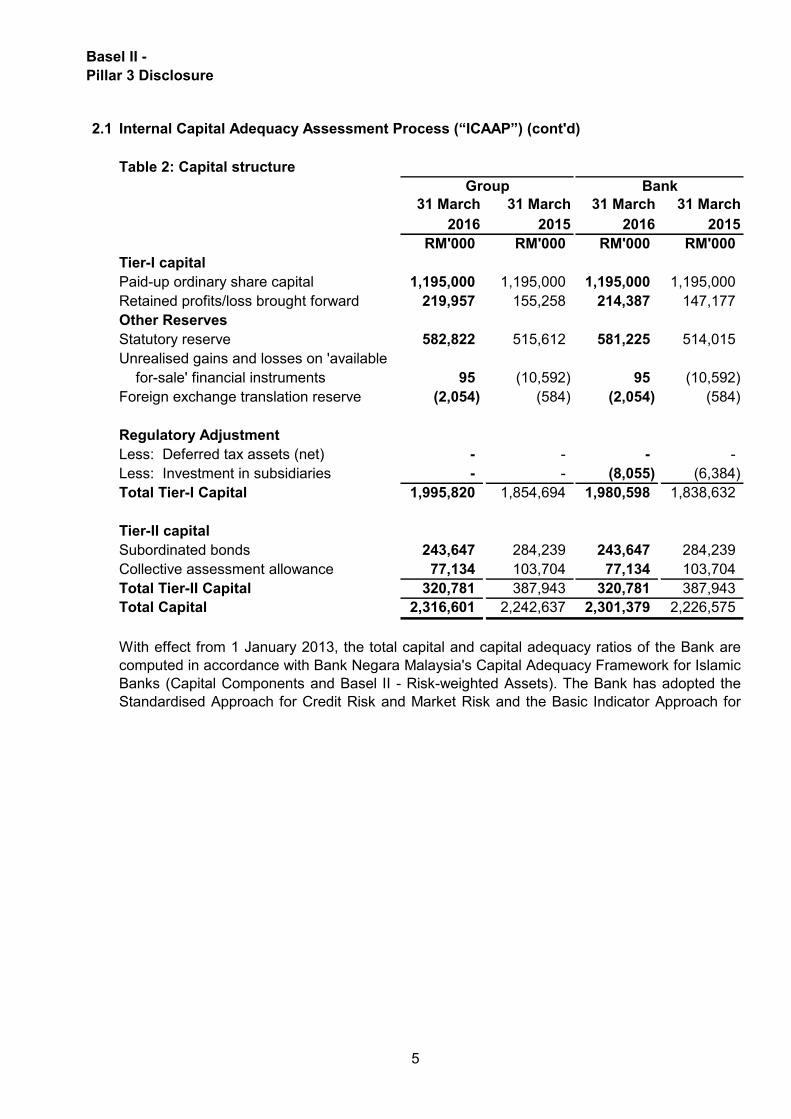
2.1 Internal Capital Adequacy Assessment Process (“ICAAP”) (cont'd)
Table 2: Capital structure
31 March 31 March 31 March 31 March
2016 2015 2016 2015
RM'000 RM'000 RM'000 RM'000
Tier-I capital
Paid-up ordinary share capital 1,195,000 1,195,000 1,195,000 1,195,000
Retained profits/loss brought forward 219,957 155,258 214,387 147,177
Other Reserves
Statutory reserve 582,822 515,612 581,225 514,015
Unrealised gains and losses on 'available
for-sale' financial instruments 95 (10,592) 95 (10,592)
Foreign exchange translation reserve (2,054) (584) (2,054) (584)
Regulatory Adjustment
Less: Deferred tax assets (net) - - - -
Less: Investment in subsidiaries - - (8,055) (6,384)
Total Tier-I Capital 1,995,820 1,854,694 1,980,598 1,838,632
Tier-II capital
Subordinated bonds 243,647 284,239 243,647 284,239
Collective assessment allowance 77,134 103,704 77,134 103,704
Total Tier-II Capital 320,781 387,943 320,781 387,943
Total Capital 2,316,601 2,242,637 2,301,379 2,226,575
BankGroup
With effect from 1 January 2013, the total capital and capital adequacy ratios of the Bank are
computed in accordance with Bank Negara Malaysia's Capital Adequacy Framework for Islamic
Banks (Capital Components and Basel II - Risk-weighted Assets). The Bank has adopted the
Standardised Approach for Credit Risk and Market Risk and the Basic Indicator Approach for
Operational Risk.
5
Basel II -
Pillar 3 Disclosure
2.1 Internal Capital Adequacy Assessment Process (“ICAAP”) (cont'd)
Risk
Weighted
Assets
Minimum
Capital
Requirement
at 8%
Risk
Weighted
Assets
Minimum
Capital
Requirement
at 8%
RM’000 RM’000 RM’000 RM’000
Group
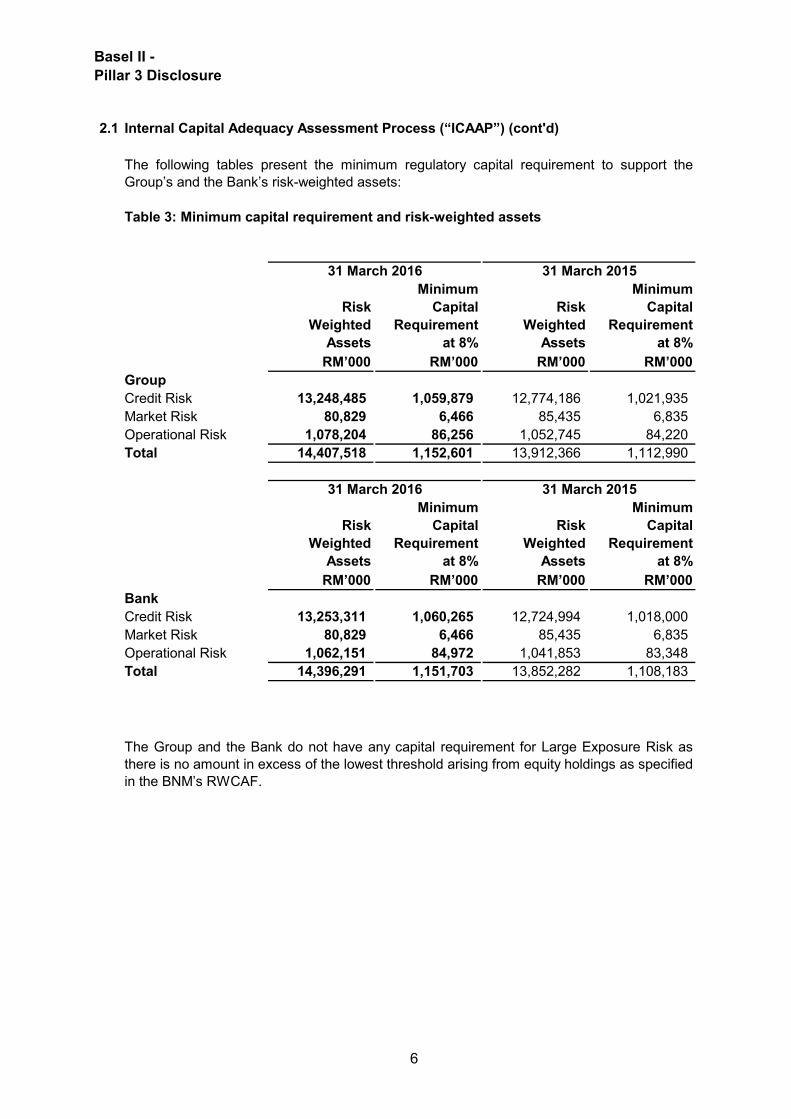
Credit Risk 13,248,485 1,059,879 12,774,186 1,021,935
Market Risk 80,829 6,466 85,435 6,835
Operational Risk 1,078,204 86,256 1,052,745 84,220
Total 14,407,518 1,152,601 13,912,366 1,112,990
Risk
Weighted
Assets
Minimum
Capital
Requirement
at 8%
Risk
Weighted
Assets
Minimum
Capital
Requirement
at 8%
RM’000 RM’000 RM’000 RM’000
Bank
Credit Risk 13,253,311 1,060,265 12,724,994 1,018,000
Market Risk 80,829 6,466 85,435 6,835
Operational Risk 1,062,151 84,972 1,041,853 83,348
Total 14,396,291 1,151,703 13,852,282 1,108,183
The following tables present the minimum regulatory capital requirement to support the
Group’s and the Bank’s risk-weighted assets:
Table 3: Minimum capital requirement and risk-weighted assets
The Group and the Bank do not have any capital requirement for Large Exposure Risk as
there is no amount in excess of the lowest threshold arising from equity holdings as specified
in the BNM’s RWCAF.
31 March 2016 31 March 2015
31 March 2016 31 March 2015
6
Basel II -
Pillar 3 Disclosure
2.1 Internal Capital Adequacy Assessment Process (“ICAAP”) (cont'd)
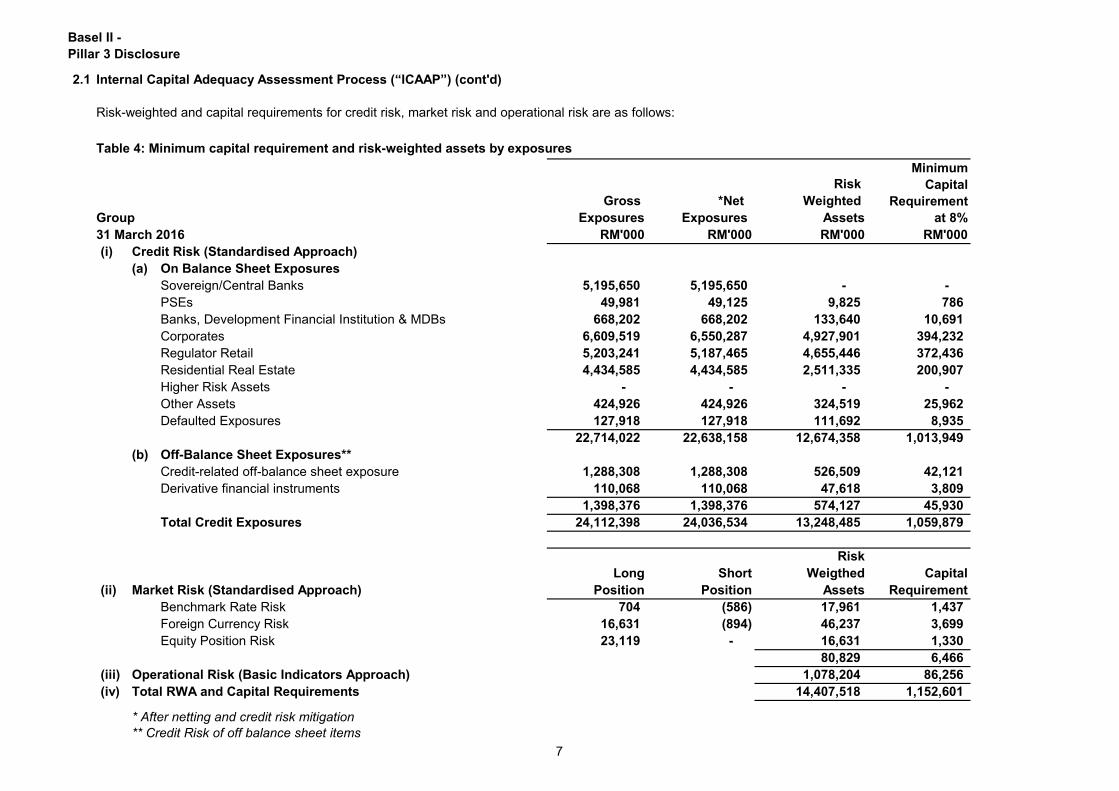
Risk-weighted and capital requirements for credit risk, market risk and operational risk are as follows:
Risk
Gross *Net Weighted
Group Exposures Exposures Assets
31 March 2016 RM'000 RM'000 RM'000 RM'000
(i) Credit Risk (Standardised Approach)
(a) On Balance Sheet Exposures
Sovereign/Central Banks 5,195,650 5,195,650 - -
PSEs 49,981 49,125 9,825 786
Banks, Development Financial Institution & MDBs 668,202 668,202 133,640 10,691
Corporates 6,609,519 6,550,287 4,927,901 394,232
Regulator Retail 5,203,241 5,187,465 4,655,446 372,436
Residential Real Estate 4,434,585 4,434,585 2,511,335 200,907
Higher Risk Assets - - - -
Other Assets 424,926 424,926 324,519 25,962
Defaulted Exposures 127,918 127,918 111,692 8,935
22,714,022 22,638,158 12,674,358 1,013,949
(b) Off-Balance Sheet Exposures**
Credit-related off-balance sheet exposure 1,288,308 1,288,308 526,509 42,121
Derivative financial instruments 110,068 110,068 47,618 3,809
1,398,376 1,398,376 574,127 45,930
Total Credit Exposures 24,112,398 24,036,534 13,248,485 1,059,879
Risk
Long Short Weigthed Capital
(ii) Market Risk (Standardised Approach) Position Position Assets Requirement
Benchmark Rate Risk 704 (586) 17,961 1,437
Foreign Currency Risk 16,631 (894) 46,237 3,699
Equity Position Risk 23,119 - 16,631 1,330
80,829 6,466
(iii) Operational Risk (Basic Indicators Approach) 1,078,204 86,256
(iv) Total RWA and Capital Requirements 14,407,518 1,152,601
* After netting and credit risk mitigation
** Credit Risk of off balance sheet items
Minimum
Capital
Requirement
at 8%
Table 4: Minimum capital requirement and risk-weighted assets by exposures
7
Basel II -
Pillar 3 Disclosure
2.1 Internal Capital Adequacy Assessment Process (“ICAAP”) (cont'd)
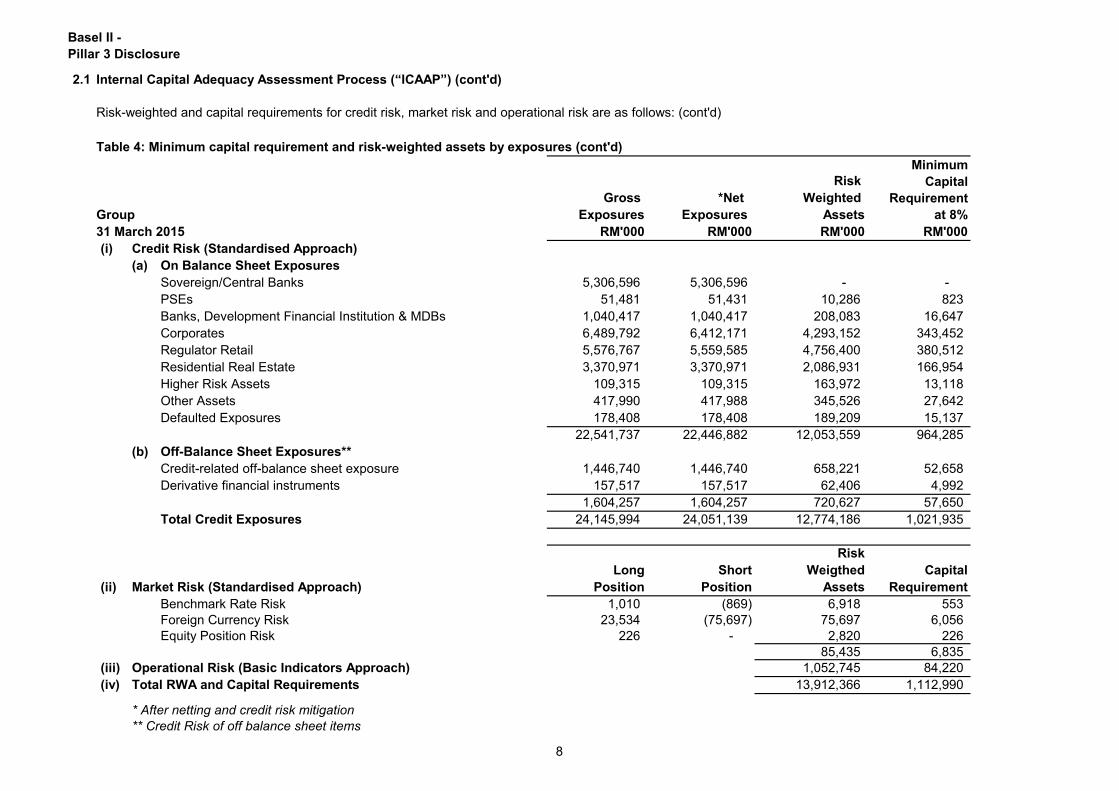
Risk-weighted and capital requirements for credit risk, market risk and operational risk are as follows: (cont'd)
Risk
Gross *Net Weighted
Group Exposures Exposures Assets
31 March 2015 RM'000 RM'000 RM'000 RM'000
(i) Credit Risk (Standardised Approach)
(a) On Balance Sheet Exposures
Sovereign/Central Banks 5,306,596 5,306,596 - -
PSEs 51,481 51,431 10,286 823
Banks, Development Financial Institution & MDBs 1,040,417 1,040,417 208,083 16,647
Corporates 6,489,792 6,412,171 4,293,152 343,452
Regulator Retail 5,576,767 5,559,585 4,756,400 380,512
Residential Real Estate 3,370,971 3,370,971 2,086,931 166,954
Higher Risk Assets 109,315 109,315 163,972 13,118
Other Assets 417,990 417,988 345,526 27,642
Defaulted Exposures 178,408 178,408 189,209 15,137
22,541,737 22,446,882 12,053,559 964,285
(b) Off-Balance Sheet Exposures**
Credit-related off-balance sheet exposure 1,446,740 1,446,740 658,221 52,658
Derivative financial instruments 157,517 157,517 62,406 4,992
1,604,257 1,604,257 720,627 57,650
Total Credit Exposures 24,145,994 24,051,139 12,774,186 1,021,935
Risk
Long Short Weigthed Capital
(ii) Market Risk (Standardised Approach) Position Position Assets Requirement
Benchmark Rate Risk 1,010 (869) 6,918 553
Foreign Currency Risk 23,534 (75,697) 75,697 6,056
Equity Position Risk 226 - 2,820 226
85,435 6,835
(iii) Operational Risk (Basic Indicators Approach) 1,052,745 84,220
(iv) Total RWA and Capital Requirements 13,912,366 1,112,990
* After netting and credit risk mitigation
** Credit Risk of off balance sheet items
Minimum
Capital
Requirement
at 8%
Table 4: Minimum capital requirement and risk-weighted assets by exposures (cont'd)
8

Basel II -
Pillar 3 Disclosure
2.1 Internal Capital Adequacy Assessment Process (“ICAAP”) (cont'd)
Risk-weighted and capital requirements for credit risk, market risk and operational risk are as follows: (cont'd)
Risk
Gross *Net Weighted
Bank Exposures Exposures Assets
31 March 2016 RM'000 RM'000 RM'000 RM'000
(i) Credit Risk (Standardised Approach)
(a) On Balance Sheet Exposures
Sovereign/Central Banks 5,195,650 5,195,650 - -
PSEs 49,981 49,125 9,825 786
Banks, Development Financial Institution & MDBs 668,202 668,202 133,640 10,691
Corporates 6,609,649 6,550,417 4,928,031 394,242
Regulator Retail 5,203,241 5,187,465 4,655,446 372,436
Residential Real Estate 4,434,585 4,434,585 2,511,335 200,907
Higher Risk Assets - - - -
Other Assets 429,621 429,621 329,215 26,337
Defaulted Exposures 127,918 127,918 111,692 8,935
22,718,847 22,642,983 12,679,184 1,014,334
(b) Off-Balance Sheet Exposures**
Credit-related off-balance sheet exposure 1,288,308 1,288,308 526,509 42,121
Derivative financial instruments 110,068 110,068 47,618 3,809
1,398,376 1,398,376 574,127 45,930
Total Credit Exposures 24,117,223 24,041,359 13,253,311 1,060,264
Risk
Long Short Weigthed Capital
(ii) Market Risk (Standardised Approach) Position Position Assets Requirement
Benchmark Rate Risk 704 (586) 17,961 1,437
Foreign Currency Risk 16,631 (894) 46,237 3,699
Equity Position Risk 23,119 - 16,631 1,330
80,829 6,466
(iii) Operational Risk (Basic Indicators Approach) 1,062,151 84,972
(iv) Total RWA and Capital Requirements 14,396,291 1,151,702
* After netting and credit risk mitigation
** Credit Risk of off balance sheet items
Table 4: Minimum capital requirement and risk-weighted assets by exposures (cont'd)
Minimum
Capital
Requirement
at 8%
9

Basel II -
Pillar 3 Disclosure
2.1 Internal Capital Adequacy Assessment Process (“ICAAP”) (cont'd)
Risk-weighted and capital requirements for credit risk, market risk and operational risk are as follows: (cont'd)
Risk
Gross *Net Weighted
Bank Exposures Exposures Assets
31 March 2015 RM'000 RM'000 RM'000 RM'000
(i) Credit Risk (Standardised Approach)
(a) On Balance Sheet Exposures
Sovereign/Central Banks 5,306,596 5,306,596 - -
PSEs 51,481 51,431 10,286 823
Banks, Development Financial Institution & MDBs 1,040,417 1,040,417 208,083 16,647
Corporates 6,606,190 6,528,569 4,409,550 352,764
Regulator Retail 5,576,767 5,559,585 4,756,400 380,512
Residential Real Estate 3,370,971 3,370,971 2,086,931 166,954
Higher Risk Assets - - - -
Other Assets 416,372 416,370 343,908 27,512
Defaulted Exposures 178,408 178,408 189,209 15,137
22,547,202 22,452,347 12,004,367 960,349
(b) Off-Balance Sheet Exposures**
Credit-related off-balance sheet exposure 1,446,740 1,446,740 658,221 52,658
Derivative financial instruments 157,517 157,517 62,406 4,992
1,604,257 1,604,257 720,627 57,650
Total Credit Exposures 24,151,459 24,056,604 12,724,994 1,017,999
Risk
Long Short Weigthed Capital
(ii) Market Risk (Standardised Approach) Position Position Assets Requirement
Benchmark Rate Risk 1,010 (869) 6,918 553
Foreign Currency Risk 23,534 (75,697) 75,697 6,056
Equity Position Risk 226 - 2,820 227
85,435 6,836
(iii) Operational Risk (Basic Indicators Approach) 1,041,853 83,348
(iv) Total RWA and Capital Requirements 13,852,282 1,108,183
* After netting and credit risk mitigation
** Credit Risk of off balance sheet items
** Credit Risk of off balance sheet items
Minimum
Capital
Requirement
at 8%
Table 4: Minimum capital requirement and risk-weighted assets by exposures (cont'd)
10
Basel II -
Pillar 3 Disclosure
3.0 Risk Management
Overview
Risk is inherent in every aspect of our business activity and to manage this effectively, BMMB
has undertaken an integrated risk management approach to ensure that a broad spectrum of
risk types are considered and addressed. The Bank’s risk management framework and
structure are built on formal governance processes that outline responsibilities for risk
management activities, as well as the governance and oversight of these activities.
An integral part of this approach is the systematic process of risk identification and
measurement. Appropriate risk management strategies are then developed in line with the
Bank’s business plans and objectives, which include the ongoing monitoring and control of the
identified risk exposures. The management and control over the principal risk areas of credit,
market, asset and liability management, operational and Shariah are integrated to optimize and
secure the Bank’s strategic and competitive advantage.
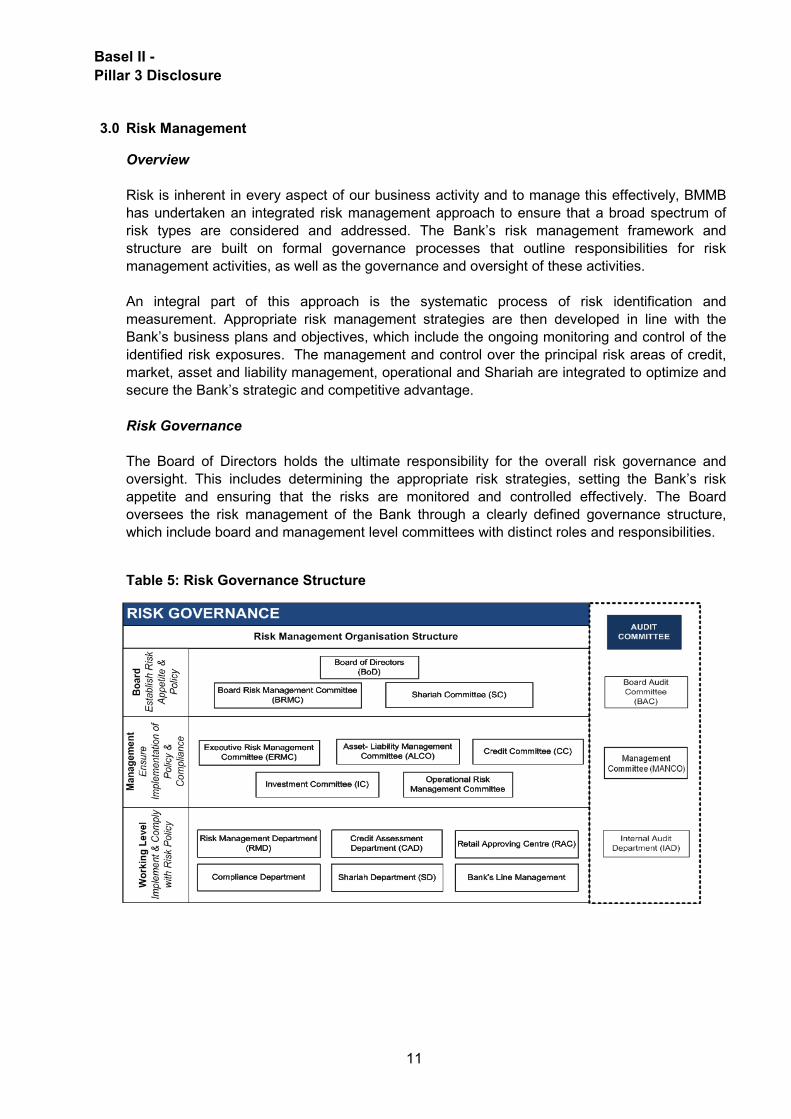
Risk Governance
The Board of Directors holds the ultimate responsibility for the overall risk governance and
oversight. This includes determining the appropriate risk strategies, setting the Bank’s risk
appetite and ensuring that the risks are monitored and controlled effectively. The Board
oversees the risk management of the Bank through a clearly defined governance structure,
which include board and management level committees with distinct roles and responsibilities.
Table 5: Risk Governance Structure
Risk Management Organisation Structure
RISK GOVERNANCE
Ma
na
ge
me
nt
En
sure
Imp
lem
en
tatio
n o
f
Po
licy
&
Co
mp
lian
ce
Wo
rkin
g L
ev
el
Imp
lem
en
t &
Co
mp
ly
with
Ris
k P
olic
y
Bo
ard
Est
ab
lish
Ris
k
Ap
pe
tite
&
Po
licy
Board of Directors
(BoD)
Board Risk Management Committee
(BRMC)
Executive Risk Management
Committee (ERMC)
Asset- Liability Management
Committee (ALCO)Credit Committee (CC)
Investment Committee (IC)
Risk Management Department
(RMD)
Credit Assessment
Department (CAD)Retail Approving Centre (RAC)
Compliance Department Bank’s Line Management
Operational Risk
Management Committee
Board Audit
Committee
(BAC)
Internal Audit
Committee (IAC)
Internal Audit
Department (IAD)
AUDIT
COMMITTEE
Shariah Committee (SC)
Shariah Department (SD)
11
Basel II -
Pillar 3 Disclosure
3.0 Risk Management (cont'd)
Risk Governance (cont'd)
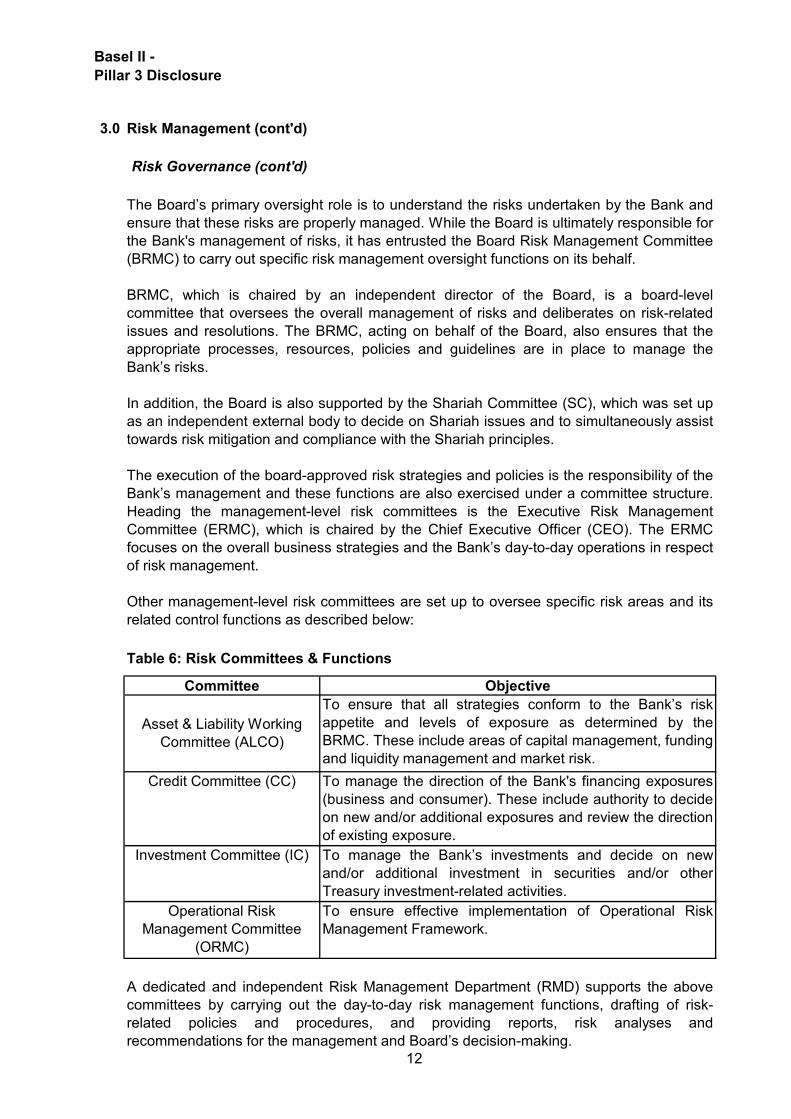
Table 6: Risk Committees & Functions
A dedicated and independent Risk Management Department (RMD) supports the above
committees by carrying out the day-to-day risk management functions, drafting of risk-
related policies and procedures, and providing reports, risk analyses and
recommendations for the management and Board’s decision-making.
The Board’s primary oversight role is to understand the risks undertaken by the Bank and
ensure that these risks are properly managed. While the Board is ultimately responsible for
the Bank's management of risks, it has entrusted the Board Risk Management Committee
(BRMC) to carry out specific risk management oversight functions on its behalf.
BRMC, which is chaired by an independent director of the Board, is a board-level
committee that oversees the overall management of risks and deliberates on risk-related
issues and resolutions. The BRMC, acting on behalf of the Board, also ensures that the
appropriate processes, resources, policies and guidelines are in place to manage the
Bank’s risks.
In addition, the Board is also supported by the Shariah Committee (SC), which was set up
as an independent external body to decide on Shariah issues and to simultaneously assist
towards risk mitigation and compliance with the Shariah principles.
The execution of the board-approved risk strategies and policies is the responsibility of the
Bank’s management and these functions are also exercised under a committee structure.
Heading the management-level risk committees is the Executive Risk Management
Committee (ERMC), which is chaired by the Chief Executive Officer (CEO). The ERMC
focuses on the overall business strategies and the Bank’s day-to-day operations in respect
of risk management.
Other management-level risk committees are set up to oversee specific risk areas and its
related control functions as described below:
Operational Risk
Management Committee
(ORMC)
Objective
To ensure that all strategies conform to the Bank’s risk
appetite and levels of exposure as determined by the
BRMC. These include areas of capital management, funding
and liquidity management and market risk.
To manage the direction of the Bank's financing exposures
(business and consumer). These include authority to decide
on new and/or additional exposures and review the direction
of existing exposure.
To manage the Bank’s investments and decide on new
and/or additional investment in securities and/or other
Treasury investment-related activities.
To ensure effective implementation of Operational Risk
Management Framework.
Committee
Asset & Liability Working
Committee (ALCO)
Credit Committee (CC)
Investment Committee (IC)
12
Basel II -
Pillar 3 Disclosure
3.0 Risk Management (cont'd)
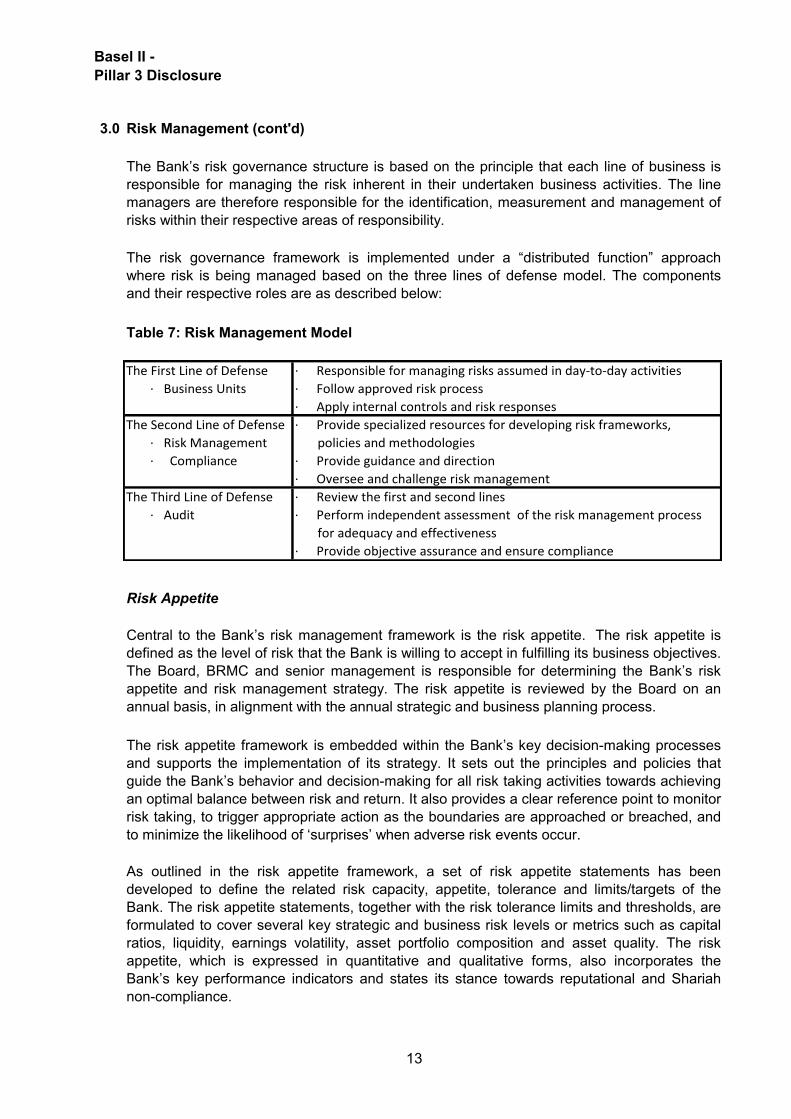
Table 7: Risk Management Model
Risk Appetite
The Bank’s risk governance structure is based on the principle that each line of business is
responsible for managing the risk inherent in their undertaken business activities. The line
managers are therefore responsible for the identification, measurement and management of
risks within their respective areas of responsibility.
The risk appetite framework is embedded within the Bank’s key decision-making processes
and supports the implementation of its strategy. It sets out the principles and policies that
guide the Bank’s behavior and decision-making for all risk taking activities towards achieving
an optimal balance between risk and return. It also provides a clear reference point to monitor
risk taking, to trigger appropriate action as the boundaries are approached or breached, and
to minimize the likelihood of ‘surprises’ when adverse risk events occur.
The risk governance framework is implemented under a “distributed function” approach
where risk is being managed based on the three lines of defense model. The components
and their respective roles are as described below:
Central to the Bank’s risk management framework is the risk appetite. The risk appetite is
defined as the level of risk that the Bank is willing to accept in fulfilling its business objectives.
The Board, BRMC and senior management is responsible for determining the Bank’s risk
appetite and risk management strategy. The risk appetite is reviewed by the Board on an
annual basis, in alignment with the annual strategic and business planning process.
As outlined in the risk appetite framework, a set of risk appetite statements has been
developed to define the related risk capacity, appetite, tolerance and limits/targets of the
Bank. The risk appetite statements, together with the risk tolerance limits and thresholds, are
formulated to cover several key strategic and business risk levels or metrics such as capital
ratios, liquidity, earnings volatility, asset portfolio composition and asset quality. The risk
appetite, which is expressed in quantitative and qualitative forms, also incorporates the
Bank’s key performance indicators and states its stance towards reputational and Shariah
non-compliance.
The First Line of Defense · Responsible for managing risks assumed in day-to-day activities
· Business Units · Follow approved risk process
· Apply internal controls and risk responses
The Second Line of Defense · Provide specialized resources for developing risk frameworks,
· Risk Management policies and methodologies
· Compliance · Provide guidance and direction
· Oversee and challenge risk management
The Third Line of Defense · Review the first and second lines
· Audit · Perform independent assessment of the risk management process
for adequacy and effectiveness
· Provide objective assurance and ensure compliance
13
Basel II -
Pillar 3 Disclosure
4.0 Credit Risk (General Disclosure)
Credit risk is defined as the potential financial loss caused by a retail customer or a wholesale
counterparty failing to meet their obligations to the Bank as they become due. This covers all
credit exposures, including guarantees and irrevocable undrawn facilities.
Risk arising from changes in credit quality is a central feature of the Bank’s business, where
uncertainty over the recoverability of financing and other amounts due from counterparties are
inherent across most of the Bank’s activities.
Adverse changes in the credit quality of a customer/counterparty or a general deterioration in
the economic condition could affect the value of the Bank’s assets and its overall financial
performance. To a lesser degree, the Bank is also exposed to other forms of credit risk, such
as settlement and pre-settlement risks, arising mainly from activities involving foreign
exchange, investment securities, equities, commodities and derivatives transactions.
The BRMC and ERMC are the key board and management-level oversight committees
responsible for the overall credit risk management activities. These include approving and
review of risk strategies and policies, resolving any policy-related issues, and monitoring of the
Bank’s asset portfolios and risk profile.
Credit risk is managed under an established framework of policies, processes and
procedures, which forms part of the overall risk governance framework. The risk management
processes include assessing, measuring, mitigating and managing credit risk and maintaining
it within the Bank’s risk appetite.
Key components of the framework are the Credit Risk Policy (CRP) and Guidelines to Credit
Risk Policies (GCRP), which contain credit-related policies and procedures for the
management of credit risk. These policies and procedures cover risk policies, controls and
prudential limits; risk rating methodologies and application; financing underwriting standards
and pricing; delegated credit approving authority; credit review and management of distressed
assets; and rehabilitation, restructuring and provisioning for impaired financing. The policies
are periodically reviewed and updated to ensure its efficacy and continued relevance.
An important element of credit risk management involves the allocation of the Bank’s
financing exposures into risk rating categories. This approach provides for sufficient level of
granularity and detail of the financing assets to facilitate the identification, monitoring and
management of the overall credit risk profile on a regular basis. These rating categories are
also linked credit pricing and defined in relation to profit spread.
Credit approvals are performed under a formal delegated approving structure comprising a
hierarchy of approving authorities with clearly defined scope and limits. The Credit Committee
(CC) is the main management-level committee involved in the approval of credit proposals (for
amounts exceeding that of the lower individual authority limits) and the monitoring and
management of distressed financing assets.
The Bank conducts regular review of its credit exposures based on portfolio segments and
concentrations to ensure that these exposures are kept within the Board-approved risk
appetite and risk tolerance levels. These review and analysis reports also provide the basis for
ongoing risk management strategy and policy formulation.
14

Basel II -
Pillar 3 Disclosure
4.0 Credit Risk (General Disclosure) (cont'd)
Credit Risk Exposures and Credit Risk Concentration
Table 8: Credit risk exposures and credit risk concentration by sector analysis
Finance, Agriculture,
takaful manufacturing,
Government and wholesale, Construction Purchase of
and statutory business retail and and transport
Group bodies services restaurant real estate vehicles Others Total
31 March 2016 RM'000 RM'000 RM'000 RM'000 RM'000 RM'000 RM'000
On balance sheet exposures
Cash and short-term funds - 1,008,391 - - - - 1,008,391
Cash and placements with
financial institutions - 60,710 - - - - 60,710
Financial investments designated
at fair value through profit and loss - 177,322 9,033 - - - 186,355
Financial investment available-for-sale 3,165,501 701,266 558,673 127,018 - 1,147,707 5,700,165
Financial investment held-to-maturity 140,608 - - - - - 140,608
Islamic derivative financial assets - 40,601 - - - - 40,601
Financing of customers 551,610 963,217 1,138,048 1,409,890 15,095 10,435,017 14,512,877
Statutory deposits with Bank
Negara Malaysia 703,261 - - - - - 703,261
Other financial assets - - - - - 2,092 2,092
4,560,980 2,951,507 1,705,754 1,536,908 15,095 11,584,816 22,355,060
Commitments and contingencies
Contingent liabilities 2,131 32,250 65,774 186,646 8,581 23,604 318,986
Commitments 1,497,869 108,077 557,654 368,915 9,935 144,594 2,687,044
Derivative financial instruments - 5,008,866 - - - - 5,008,866
1,500,000 5,149,193 623,428 555,561 18,516 168,198 8,014,896
Total credit exposures 6,060,980 8,100,700 2,329,182 2,092,469 33,611 11,753,014 30,369,956
15
Basel II -
Pillar 3 Disclosure
4.0 Credit Risk (General Disclosure) (cont'd)
Credit Risk Exposures and Credit Risk Concentration (cont'd)
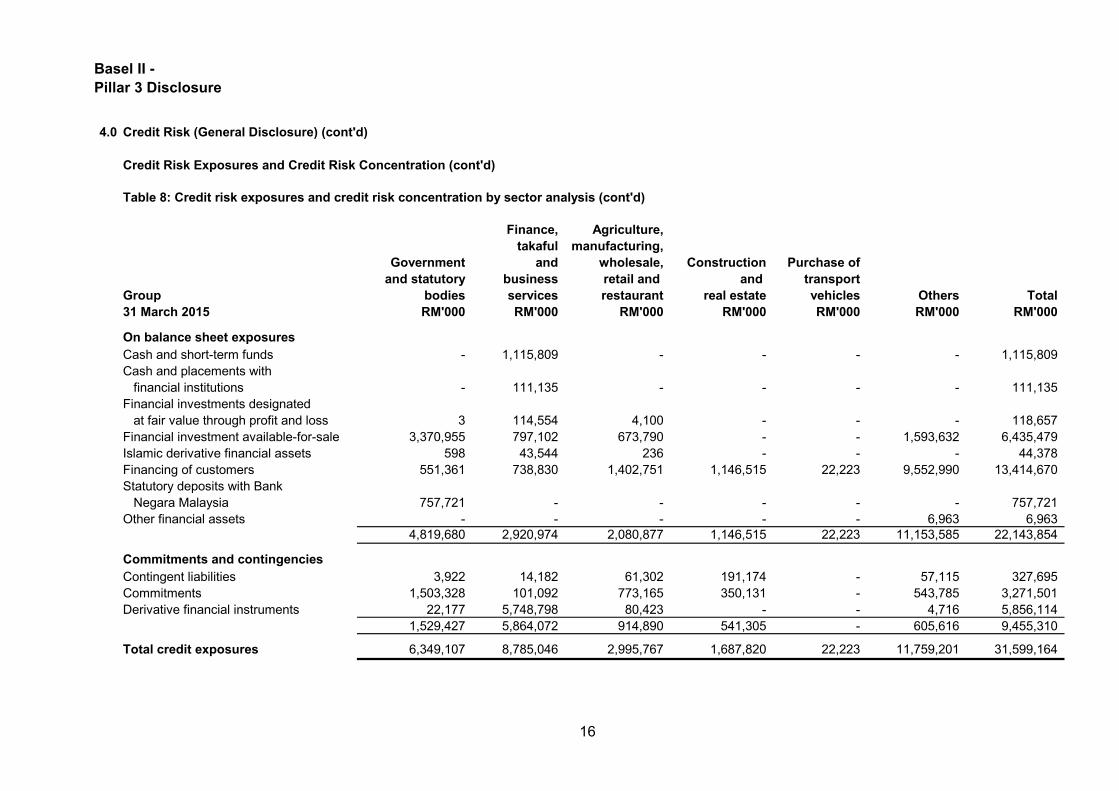
Table 8: Credit risk exposures and credit risk concentration by sector analysis (cont'd)
Finance, Agriculture,
takaful manufacturing,
Government and wholesale, Construction Purchase of
and statutory business retail and and transport
Group bodies services restaurant real estate vehicles Others Total
31 March 2015 RM'000 RM'000 RM'000 RM'000 RM'000 RM'000 RM'000
On balance sheet exposures
Cash and short-term funds - 1,115,809 - - - - 1,115,809
Cash and placements with
financial institutions - 111,135 - - - - 111,135
Financial investments designated
at fair value through profit and loss 3 114,554 4,100 - - - 118,657
Financial investment available-for-sale 3,370,955 797,102 673,790 - - 1,593,632 6,435,479
Islamic derivative financial assets 598 43,544 236 - - - 44,378
Financing of customers 551,361 738,830 1,402,751 1,146,515 22,223 9,552,990 13,414,670
Statutory deposits with Bank
Negara Malaysia 757,721 - - - - - 757,721
Other financial assets - - - - - 6,963 6,963
4,819,680 2,920,974 2,080,877 1,146,515 22,223 11,153,585 22,143,854
Commitments and contingencies
Contingent liabilities 3,922 14,182 61,302 191,174 - 57,115 327,695
Commitments 1,503,328 101,092 773,165 350,131 - 543,785 3,271,501
Derivative financial instruments 22,177 5,748,798 80,423 - - 4,716 5,856,114
1,529,427 5,864,072 914,890 541,305 - 605,616 9,455,310
Total credit exposures 6,349,107 8,785,046 2,995,767 1,687,820 22,223 11,759,201 31,599,164
16
Basel II -
Pillar 3 Disclosure
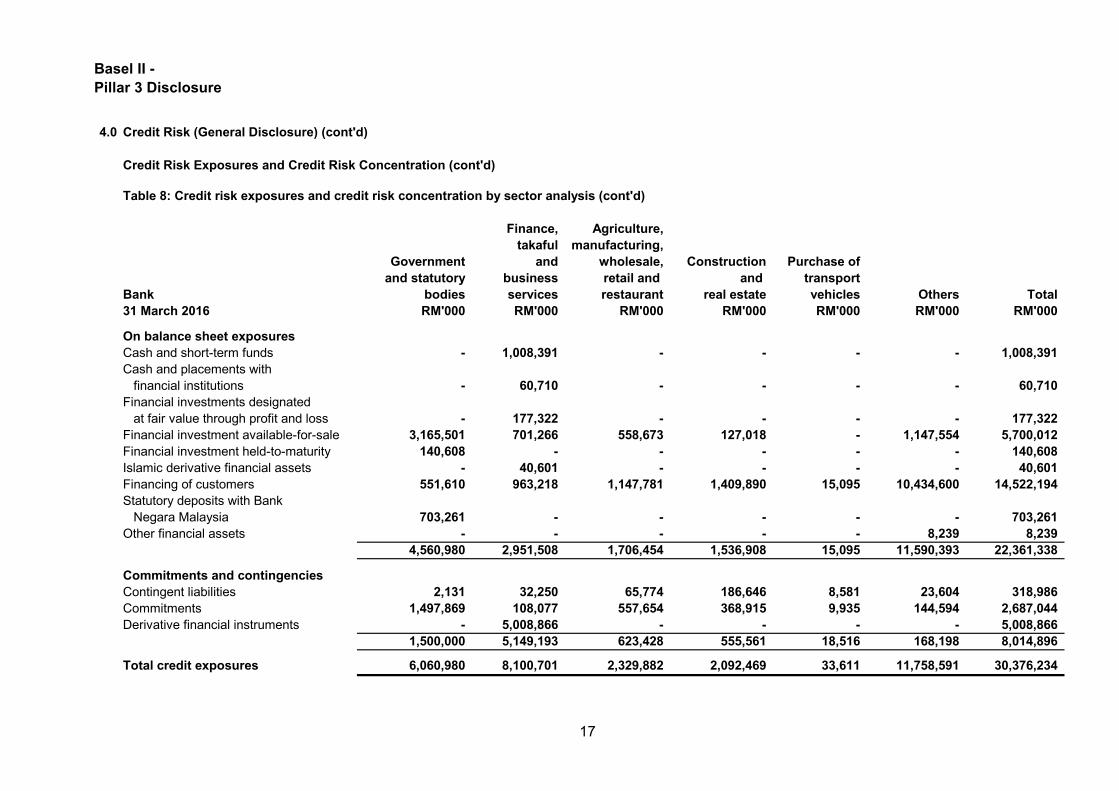
4.0 Credit Risk (General Disclosure) (cont'd)
Credit Risk Exposures and Credit Risk Concentration (cont'd)
Table 8: Credit risk exposures and credit risk concentration by sector analysis (cont'd)
Finance, Agriculture,
takaful manufacturing,
Government and wholesale, Construction Purchase of
and statutory business retail and and transport
Bank bodies services restaurant real estate vehicles Others Total
31 March 2016 RM'000 RM'000 RM'000 RM'000 RM'000 RM'000 RM'000
On balance sheet exposures
Cash and short-term funds - 1,008,391 - - - - 1,008,391
Cash and placements with
financial institutions - 60,710 - - - - 60,710
Financial investments designated
at fair value through profit and loss - 177,322 - - - - 177,322
Financial investment available-for-sale 3,165,501 701,266 558,673 127,018 - 1,147,554 5,700,012
Financial investment held-to-maturity 140,608 - - - - - 140,608
Islamic derivative financial assets - 40,601 - - - - 40,601
Financing of customers 551,610 963,218 1,147,781 1,409,890 15,095 10,434,600 14,522,194
Statutory deposits with Bank
Negara Malaysia 703,261 - - - - - 703,261
Other financial assets - - - - - 8,239 8,239
4,560,980 2,951,508 1,706,454 1,536,908 15,095 11,590,393 22,361,338
Commitments and contingencies
Contingent liabilities 2,131 32,250 65,774 186,646 8,581 23,604 318,986
Commitments 1,497,869 108,077 557,654 368,915 9,935 144,594 2,687,044
Derivative financial instruments - 5,008,866 - - - - 5,008,866
1,500,000 5,149,193 623,428 555,561 18,516 168,198 8,014,896
Total credit exposures 6,060,980 8,100,701 2,329,882 2,092,469 33,611 11,758,591 30,376,234
17
Basel II -
Pillar 3 Disclosure
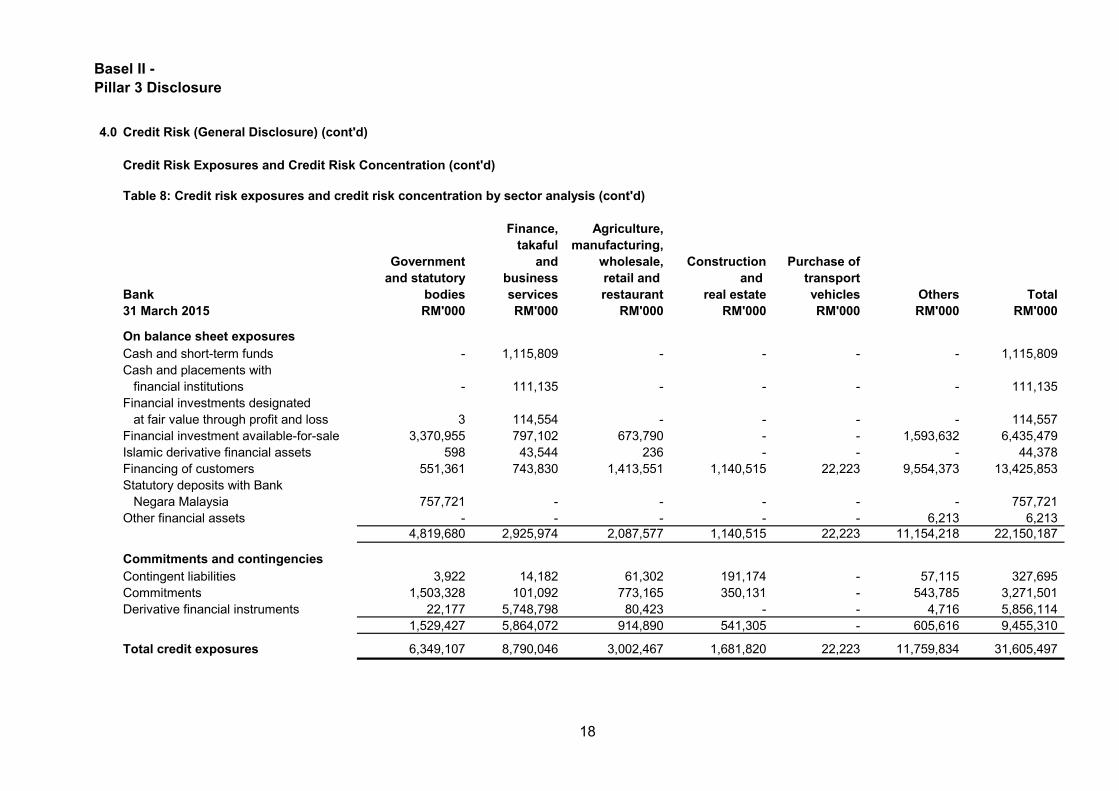
4.0 Credit Risk (General Disclosure) (cont'd)
Credit Risk Exposures and Credit Risk Concentration (cont'd)
Table 8: Credit risk exposures and credit risk concentration by sector analysis (cont'd)
Finance, Agriculture,
takaful manufacturing,
Government and wholesale, Construction Purchase of
and statutory business retail and and transport
Bank bodies services restaurant real estate vehicles Others Total
31 March 2015 RM'000 RM'000 RM'000 RM'000 RM'000 RM'000 RM'000
On balance sheet exposures
Cash and short-term funds - 1,115,809 - - - - 1,115,809
Cash and placements with
financial institutions - 111,135 - - - - 111,135
Financial investments designated
at fair value through profit and loss 3 114,554 - - - - 114,557
Financial investment available-for-sale 3,370,955 797,102 673,790 - - 1,593,632 6,435,479
Islamic derivative financial assets 598 43,544 236 - - - 44,378
Financing of customers 551,361 743,830 1,413,551 1,140,515 22,223 9,554,373 13,425,853
Statutory deposits with Bank
Negara Malaysia 757,721 - - - - - 757,721
Other financial assets - - - - - 6,213 6,213
4,819,680 2,925,974 2,087,577 1,140,515 22,223 11,154,218 22,150,187
Commitments and contingencies
Contingent liabilities 3,922 14,182 61,302 191,174 - 57,115 327,695
Commitments 1,503,328 101,092 773,165 350,131 - 543,785 3,271,501
Derivative financial instruments 22,177 5,748,798 80,423 - - 4,716 5,856,114
1,529,427 5,864,072 914,890 541,305 - 605,616 9,455,310
Total credit exposures 6,349,107 8,790,046 3,002,467 1,681,820 22,223 11,759,834 31,605,497
18
Basel II -
Pillar 3 Disclosure
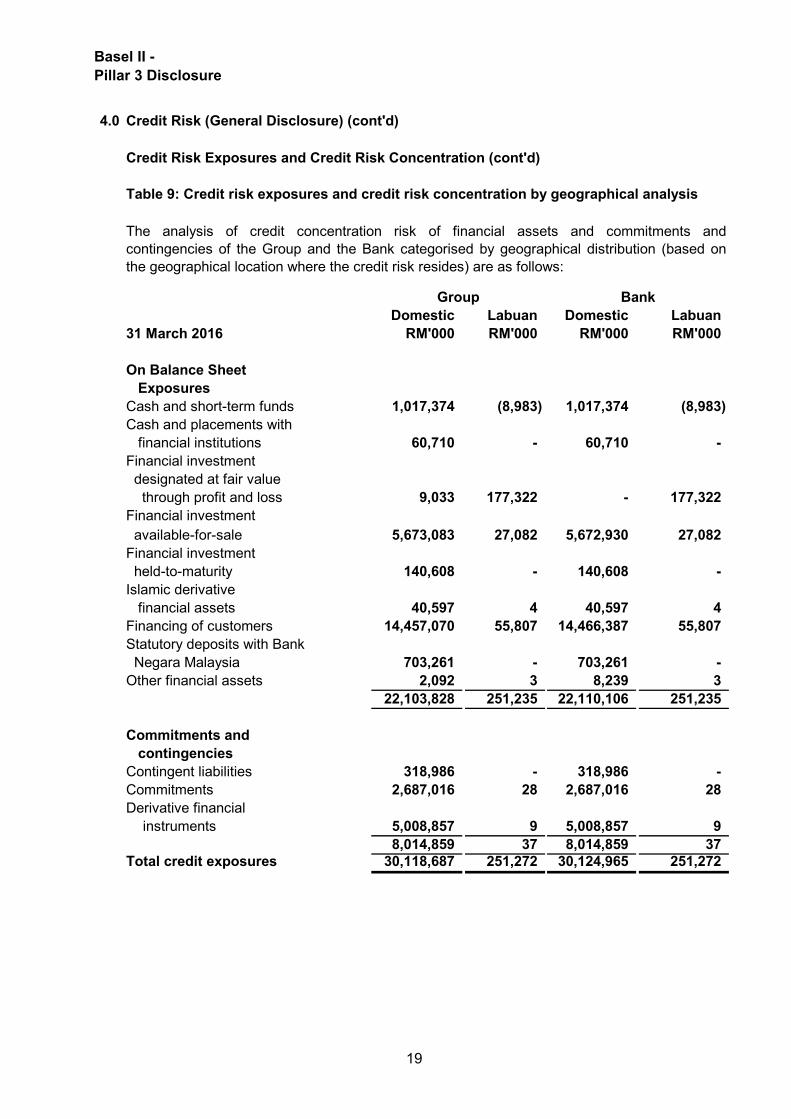
4.0 Credit Risk (General Disclosure) (cont'd)
Credit Risk Exposures and Credit Risk Concentration (cont'd)
Domestic Labuan Domestic Labuan
31 March 2016 RM'000 RM'000 RM'000 RM'000
On Balance Sheet
Exposures
Cash and short-term funds 1,017,374 (8,983) 1,017,374 (8,983)
Cash and placements with
financial institutions 60,710 - 60,710 -
Financial investment
designated at fair value
through profit and loss 9,033 177,322 - 177,322
Financial investment
available-for-sale 5,673,083 27,082 5,672,930 27,082
Financial investment
held-to-maturity 140,608 - 140,608 -
Islamic derivative
financial assets 40,597 4 40,597 4
Financing of customers 14,457,070 55,807 14,466,387 55,807
Statutory deposits with Bank
Negara Malaysia 703,261 - 703,261 -
Other financial assets 2,092 3 8,239 3
22,103,828 251,235 22,110,106 251,235
Commitments and
contingencies
Contingent liabilities 318,986 - 318,986 -
Commitments 2,687,016 28 2,687,016 28
Derivative financial
instruments 5,008,857 9 5,008,857 9
8,014,859 37 8,014,859 37
Total credit exposures 30,118,687 251,272 30,124,965 251,272
Table 9: Credit risk exposures and credit risk concentration by geographical analysis
The analysis of credit concentration risk of financial assets and commitments and
contingencies of the Group and the Bank categorised by geographical distribution (based on
the geographical location where the credit risk resides) are as follows:
Group Bank
19
Basel II -
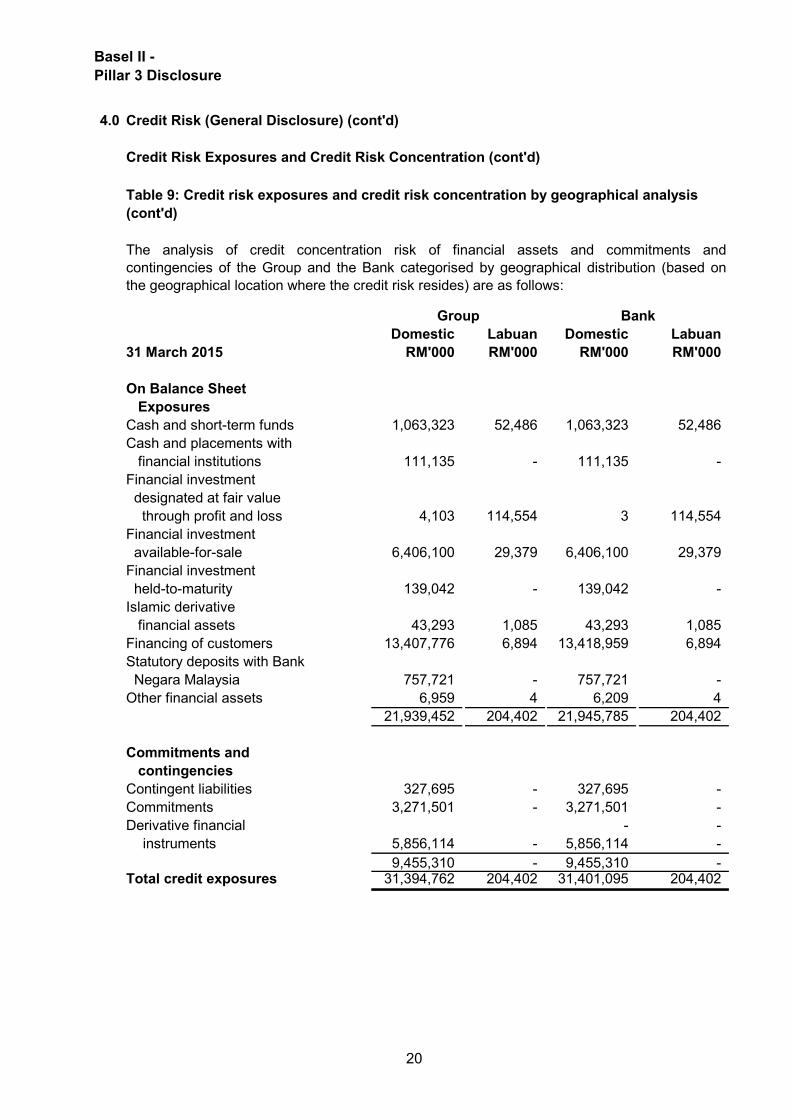
Pillar 3 Disclosure
4.0 Credit Risk (General Disclosure) (cont'd)
Credit Risk Exposures and Credit Risk Concentration (cont'd)
Domestic Labuan Domestic Labuan
31 March 2015 RM'000 RM'000 RM'000 RM'000
On Balance Sheet
Exposures
Cash and short-term funds 1,063,323 52,486 1,063,323 52,486
Cash and placements with
financial institutions 111,135 - 111,135 -
Financial investment
designated at fair value
through profit and loss 4,103 114,554 3 114,554
Financial investment
available-for-sale 6,406,100 29,379 6,406,100 29,379
Financial investment
held-to-maturity 139,042 - 139,042 -
Islamic derivative
financial assets 43,293 1,085 43,293 1,085
Financing of customers 13,407,776 6,894 13,418,959 6,894
Statutory deposits with Bank
Negara Malaysia 757,721 - 757,721 -
Other financial assets 6,959 4 6,209 4
21,939,452 204,402 21,945,785 204,402
Commitments and
contingencies
Contingent liabilities 327,695 - 327,695 -
Commitments 3,271,501 - 3,271,501 -
Derivative financial - -
instruments 5,856,114 - 5,856,114 -
9,455,310 - 9,455,310 - Total credit exposures 31,394,762 204,402 31,401,095 204,402
Table 9: Credit risk exposures and credit risk concentration by geographical analysis
(cont'd)
The analysis of credit concentration risk of financial assets and commitments and
contingencies of the Group and the Bank categorised by geographical distribution (based on
the geographical location where the credit risk resides) are as follows:
Group Bank
20
Basel II -
Pillar 3 Disclosure
4.0 Credit Risk (General Disclosure) (cont'd)
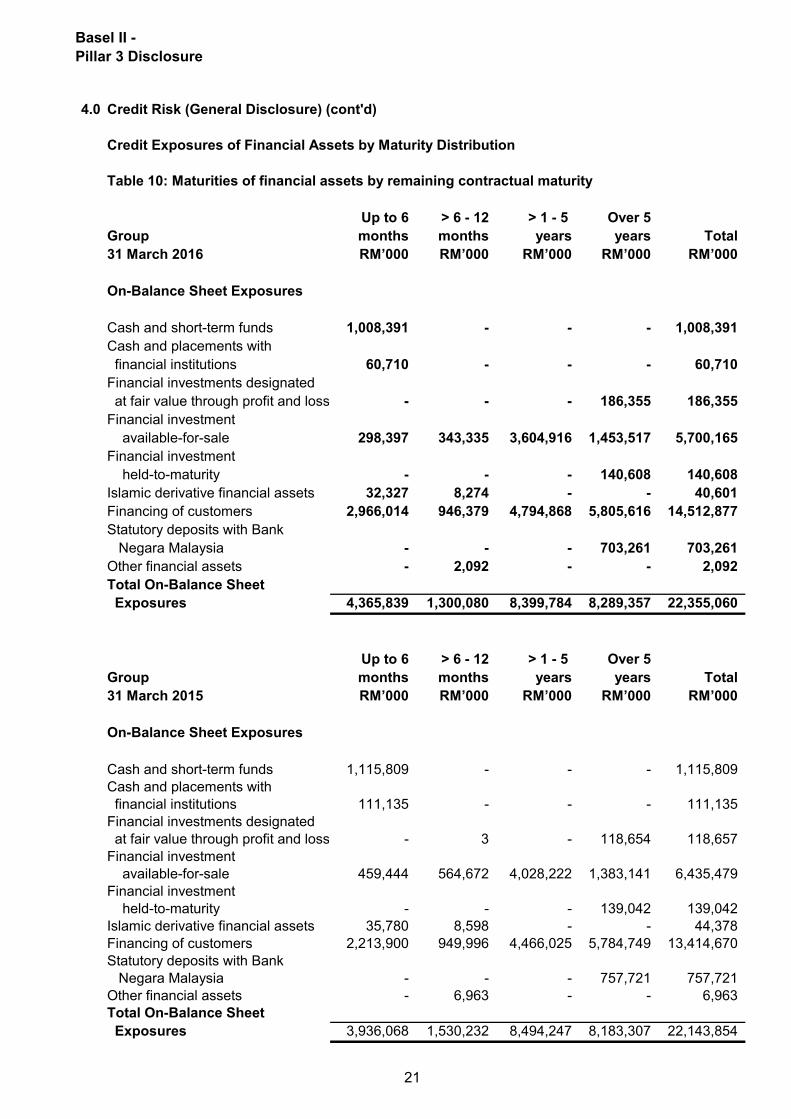
Credit Exposures of Financial Assets by Maturity Distribution
Table 10: Maturities of financial assets by remaining contractual maturity
Up to 6 > 6 - 12 > 1 - 5 Over 5
Group months months years years Total
31 March 2016 RM’000 RM’000 RM’000 RM’000 RM’000
On-Balance Sheet Exposures
Cash and short-term funds 1,008,391 - - - 1,008,391
Cash and placements with
financial institutions 60,710 - - - 60,710
Financial investments designated
at fair value through profit and loss - - - 186,355 186,355
Financial investment
available-for-sale 298,397 343,335 3,604,916 1,453,517 5,700,165
Financial investment
held-to-maturity - - - 140,608 140,608
Islamic derivative financial assets 32,327 8,274 - - 40,601
Financing of customers 2,966,014 946,379 4,794,868 5,805,616 14,512,877
Statutory deposits with Bank
Negara Malaysia - - - 703,261 703,261
Other financial assets - 2,092 - - 2,092
Total On-Balance Sheet
Exposures 4,365,839 1,300,080 8,399,784 8,289,357 22,355,060
Up to 6 > 6 - 12 > 1 - 5 Over 5
Group months months years years Total
31 March 2015 RM’000 RM’000 RM’000 RM’000 RM’000
On-Balance Sheet Exposures
Cash and short-term funds 1,115,809 - - - 1,115,809
Cash and placements with
financial institutions 111,135 - - - 111,135
Financial investments designated
at fair value through profit and loss - 3 - 118,654 118,657
Financial investment
available-for-sale 459,444 564,672 4,028,222 1,383,141 6,435,479
Financial investment
held-to-maturity - - - 139,042 139,042
Islamic derivative financial assets 35,780 8,598 - - 44,378
Financing of customers 2,213,900 949,996 4,466,025 5,784,749 13,414,670
Statutory deposits with Bank
Negara Malaysia - - - 757,721 757,721
Other financial assets - 6,963 - - 6,963
Total On-Balance Sheet
Exposures 3,936,068 1,530,232 8,494,247 8,183,307 22,143,854
21
Basel II -
Pillar 3 Disclosure
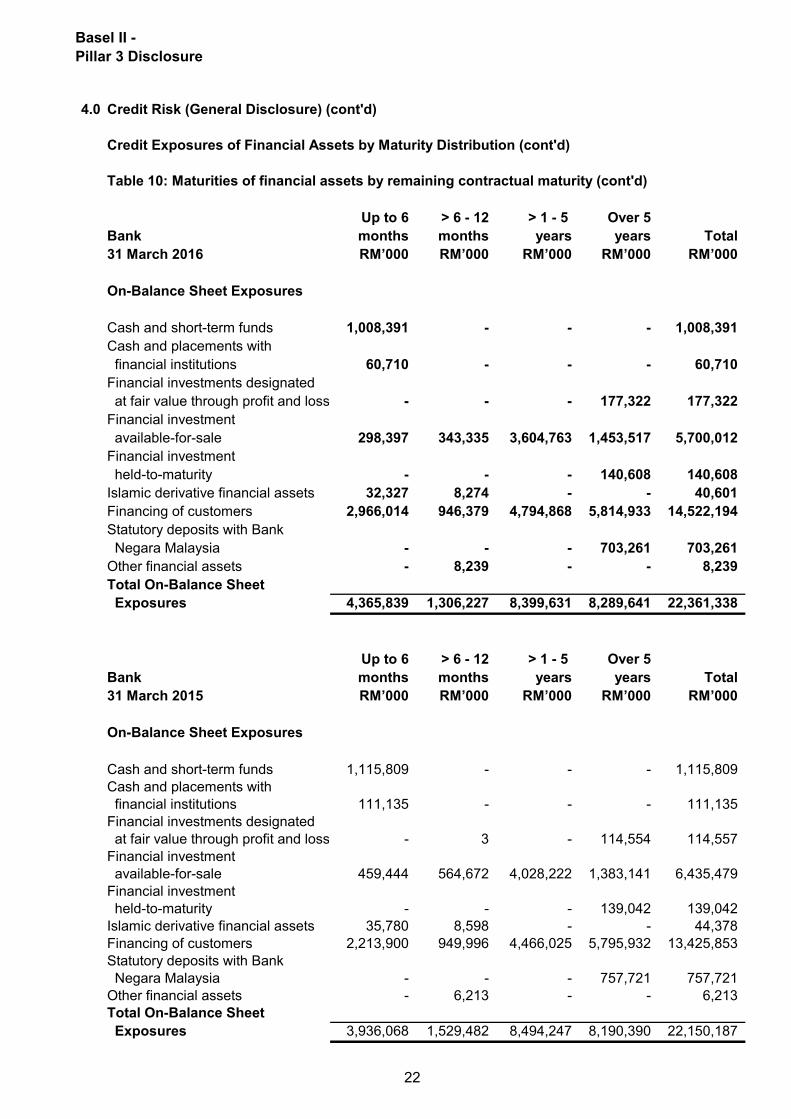
4.0 Credit Risk (General Disclosure) (cont'd)
Credit Exposures of Financial Assets by Maturity Distribution (cont'd)
Table 10: Maturities of financial assets by remaining contractual maturity (cont'd)
Up to 6 > 6 - 12 > 1 - 5 Over 5
Bank months months years years Total
31 March 2016 RM’000 RM’000 RM’000 RM’000 RM’000
On-Balance Sheet Exposures
Cash and short-term funds 1,008,391 - - - 1,008,391
Cash and placements with
financial institutions 60,710 - - - 60,710
Financial investments designated
at fair value through profit and loss - - - 177,322 177,322
Financial investment
available-for-sale 298,397 343,335 3,604,763 1,453,517 5,700,012
Financial investment
held-to-maturity - - - 140,608 140,608
Islamic derivative financial assets 32,327 8,274 - - 40,601
Financing of customers 2,966,014 946,379 4,794,868 5,814,933 14,522,194
Statutory deposits with Bank
Negara Malaysia - - - 703,261 703,261
Other financial assets - 8,239 - - 8,239
Total On-Balance Sheet
Exposures 4,365,839 1,306,227 8,399,631 8,289,641 22,361,338
Up to 6 > 6 - 12 > 1 - 5 Over 5
Bank months months years years Total
31 March 2015 RM’000 RM’000 RM’000 RM’000 RM’000
On-Balance Sheet Exposures
Cash and short-term funds 1,115,809 - - - 1,115,809
Cash and placements with
financial institutions 111,135 - - - 111,135
Financial investments designated
at fair value through profit and loss - 3 - 114,554 114,557
Financial investment
available-for-sale 459,444 564,672 4,028,222 1,383,141 6,435,479
Financial investment
held-to-maturity - - - 139,042 139,042
Islamic derivative financial assets 35,780 8,598 - - 44,378
Financing of customers 2,213,900 949,996 4,466,025 5,795,932 13,425,853
Statutory deposits with Bank
Negara Malaysia - - - 757,721 757,721
Other financial assets - 6,213 - - 6,213
Total On-Balance Sheet
Exposures 3,936,068 1,529,482 8,494,247 8,190,390 22,150,187
22
Basel II -
Pillar 3 Disclosure
4.0 Credit Risk (General Disclosure) (cont'd)
Credit Risk Management Approach
Credit risk is inherent in all credit-related activities such as in the granting of financing facilities
and participation in treasury and investment banking activities.
Credit risk exposures are controlled and managed at every stage of the credit process through
various methods and techniques. At the point of origination, the credit exposure is assessed with
well-defined financing granting criteria, which include the identification of a clear and adequate
source of payment or income generation from the customer, structuring of an effective financing
package and incorporation of appropriate risk mitigants.
The Bank’s credit-origination and granting activities are segregated by business lines based on
customer types/business segments. Specifically, these are Business Banking for corporate,
commercial and retail SME customers, Consumer Banking for retail/individual customers and
Investment Banking for syndications and capital market instruments. These departments are
responsible for marketing, developing and managing the Bank’s financing and investment assets
as well as ensuring the quality and timely delivery of its products and services.
The Bank has an established structure to facilitate the credit approval process which defines the
appropriate level of approving authority and limits. These approving authority and limits are duly
sanctioned by the Board and are subject to periodic reviews to assess its effectiveness as well as
compliance. To enhance the risk identification process, the financing proposals by the origination
departments are subjected to independent credit reviews and risk assessments by the relevant
credit assessment departments prior to submission to the approving authority for decision.
Credit portfolios are managed and monitored against stipulated portfolio exposure limits with the
objective to avoid credit concentration and excessive build-up of exposures and to preserve the
credit portfolios’ quality through timely and appropriate corrective actions.
The Credit Risk report is produced and deliberated at the management and board level
committees on a monthly basis to monitor the overall exposures and limits. Risk Profiling Analysis
on selected asset portfolios is conducted on a regular basis to analyze the asset quality for
possible deterioration or concentration build-up and potential weaknesses or threats arising from
internal and external factors.
Stress Test on credit exposures is used as a tool to identify possible events or future changes in
the financial and economic conditions that could have an unfavorable impact on the Bank’s
exposures. It is also used to assess the Bank’s ability to withstand such changes in relation to
the capacity of capital and earnings to absorb potentially significant losses.
The monitoring and recovery of delinquent and problematic financing accounts are undertaken by
two departments; namely the Consumer Financing Supervision and Recovery Department
(CFSRD) and the Business Financing Supervision and Recovery Department (BFSRD). Within
the BFSRD, the Early Care and Remedial Management units have been tasked to monitor and
undertake pre-emptive measures on business financing with early warning signs to prevent
further deterioration and/or initiate rehabilitation actions such as rescheduling and restructuring of
the affected accounts.
23
Basel II -
Pillar 3 Disclosure
4.0 Credit Risk (General Disclosure) (cont'd)
Credit Risk Management Approach (cont'd.)
Classification and loss provisioning of the Bank’s impaired financing and investment assets is
performed upon determination of impairment evidence and by categorization into individual and
collective assessment. The process and approach is defined in the GCRP and other related
policies and SOPs as prescribed under the FRS139 and BNM guidelines.
The Bank implemented a new risk rating approach for its business and consumer financing
portfolios, introduced gradually from year 2011. Credit scorecards using statistical and heuristic-
based methodologies were developed and applied to assess the customers' risk levels and assist
in the Bank’s credit decision. The credit risk grades are also used in portfolio monitoring and limit
setting and in building a more robust estimation of credit losses in the future as prescribed under
the "Internal Rating Based" (IRB) approach.
Aside from the credit risk rating, the Bank is also enhancing its portfolio management capability
through the development of a data mart and acquisition of more analytical and risk management
systems. These initiatives are undertaken in Phase 2 of the MBS project and are expected to
enhance the Bank’s risk management capability in the longer term.
24
Basel II -
Pillar 3 Disclosure
4.0 Credit Risk (General Disclosure) (cont'd)
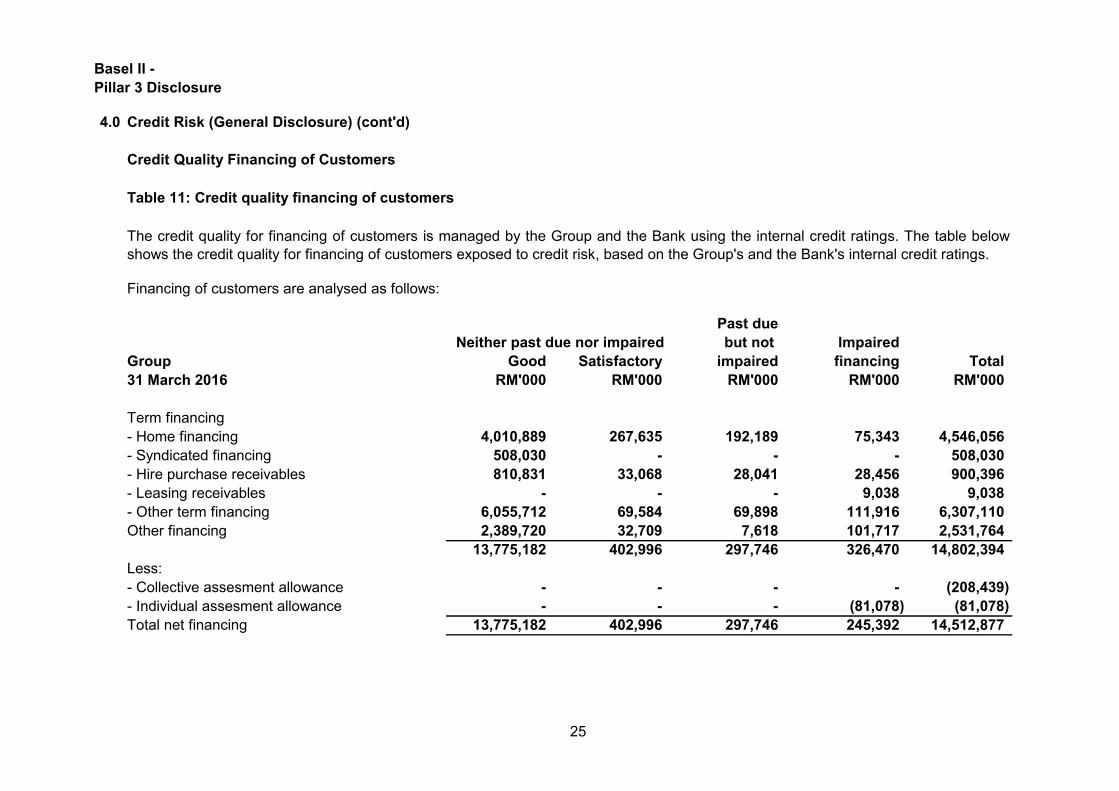
Credit Quality Financing of Customers
Table 11: Credit quality financing of customers
Financing of customers are analysed as follows:
Past due
but not Impaired
Group Good Satisfactory impaired financing Total
RM'000 RM'000 RM'000 RM'000 RM'000
Term financing
- Home financing 4,010,889 267,635 192,189 75,343 4,546,056
- Syndicated financing 508,030 - - - 508,030
- Hire purchase receivables 810,831 33,068 28,041 28,456 900,396
- Leasing receivables - - - 9,038 9,038
- Other term financing 6,055,712 69,584 69,898 111,916 6,307,110
Other financing 2,389,720 32,709 7,618 101,717 2,531,764
13,775,182 402,996 297,746 326,470 14,802,394
Less:
- Collective assesment allowance - - - - (208,439)
- Individual assesment allowance - - - (81,078) (81,078)
Total net financing 13,775,182 402,996 297,746 245,392 14,512,877
Neither past due nor impaired
The credit quality for financing of customers is managed by the Group and the Bank using the internal credit ratings. The table below
shows the credit quality for financing of customers exposed to credit risk, based on the Group's and the Bank's internal credit ratings.
31 March 2016
25
Basel II -
Pillar 3 Disclosure
4.0 Credit Risk (General Disclosure) (cont'd)
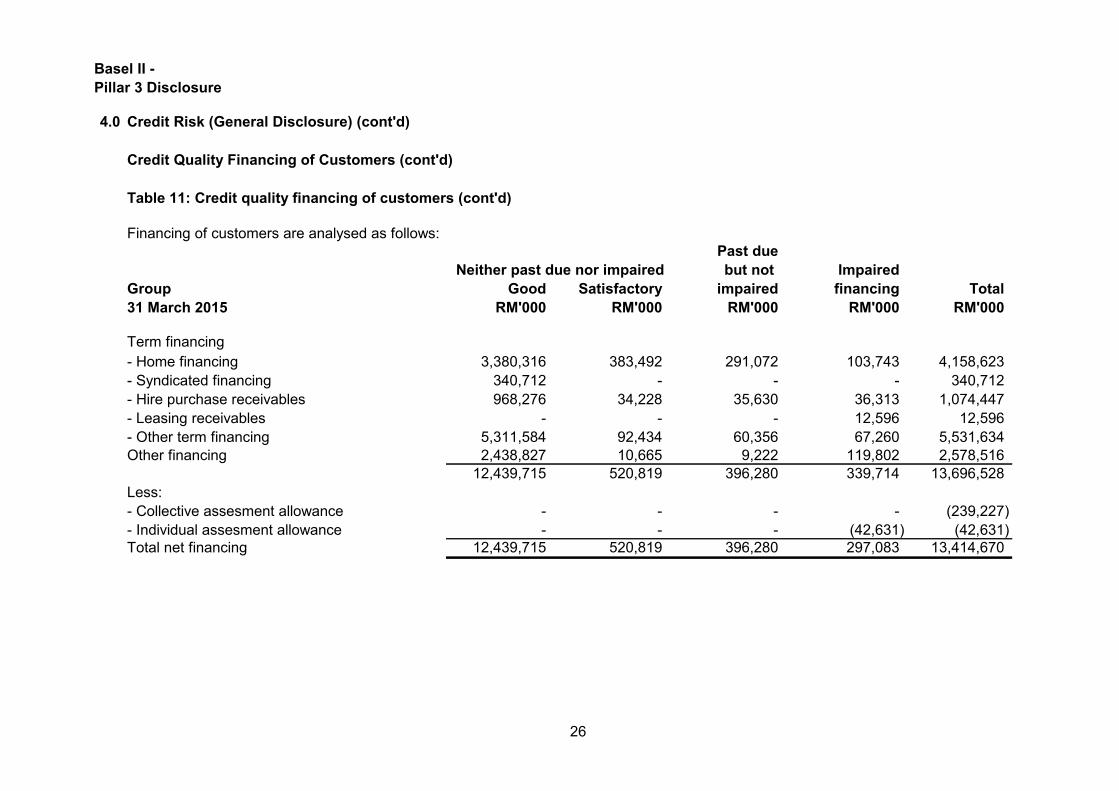
Credit Quality Financing of Customers (cont'd)
Table 11: Credit quality financing of customers (cont'd)
Financing of customers are analysed as follows:
Past due
but not Impaired
Group Good Satisfactory impaired financing Total
RM'000 RM'000 RM'000 RM'000 RM'000
Term financing
- Home financing 3,380,316 383,492 291,072 103,743 4,158,623
- Syndicated financing 340,712 - - - 340,712
- Hire purchase receivables 968,276 34,228 35,630 36,313 1,074,447
- Leasing receivables - - - 12,596 12,596
- Other term financing 5,311,584 92,434 60,356 67,260 5,531,634
Other financing 2,438,827 10,665 9,222 119,802 2,578,516
12,439,715 520,819 396,280 339,714 13,696,528
Less:
- Collective assesment allowance - - - - (239,227)
- Individual assesment allowance - - - (42,631) (42,631)
Total net financing 12,439,715 520,819 396,280 297,083 13,414,670
Neither past due nor impaired
31 March 2015
26
Basel II -
Pillar 3 Disclosure
4.0 Credit Risk (General Disclosure) (cont'd)
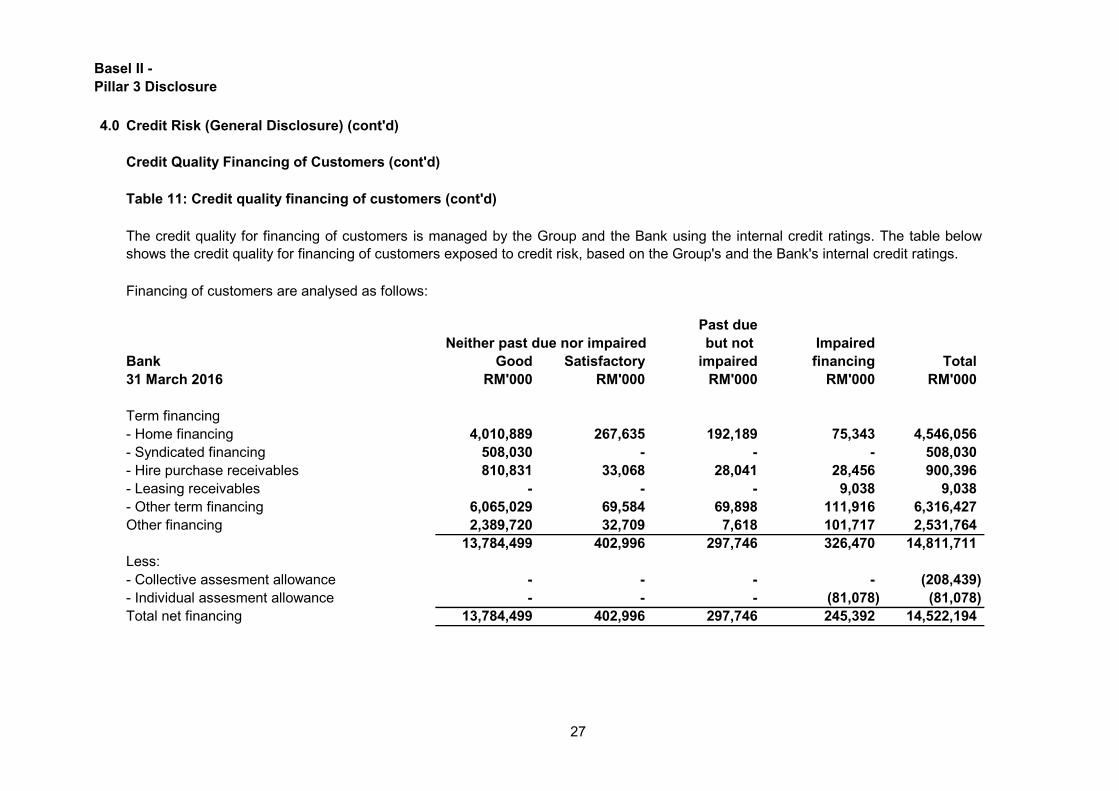
Credit Quality Financing of Customers (cont'd)
Table 11: Credit quality financing of customers (cont'd)
Financing of customers are analysed as follows:
Past due
but not Impaired
Bank Good Satisfactory impaired financing Total
RM'000 RM'000 RM'000 RM'000 RM'000
Term financing
- Home financing 4,010,889 267,635 192,189 75,343 4,546,056
- Syndicated financing 508,030 - - - 508,030
- Hire purchase receivables 810,831 33,068 28,041 28,456 900,396
- Leasing receivables - - - 9,038 9,038
- Other term financing 6,065,029 69,584 69,898 111,916 6,316,427
Other financing 2,389,720 32,709 7,618 101,717 2,531,764
13,784,499 402,996 297,746 326,470 14,811,711
Less:
- Collective assesment allowance - - - - (208,439)
- Individual assesment allowance - - - (81,078) (81,078)
Total net financing 13,784,499 402,996 297,746 245,392 14,522,194
The credit quality for financing of customers is managed by the Group and the Bank using the internal credit ratings. The table below
shows the credit quality for financing of customers exposed to credit risk, based on the Group's and the Bank's internal credit ratings.
Neither past due nor impaired
31 March 2016
27
Basel II -
Pillar 3 Disclosure
4.0 Credit Risk (General Disclosure) (cont'd)
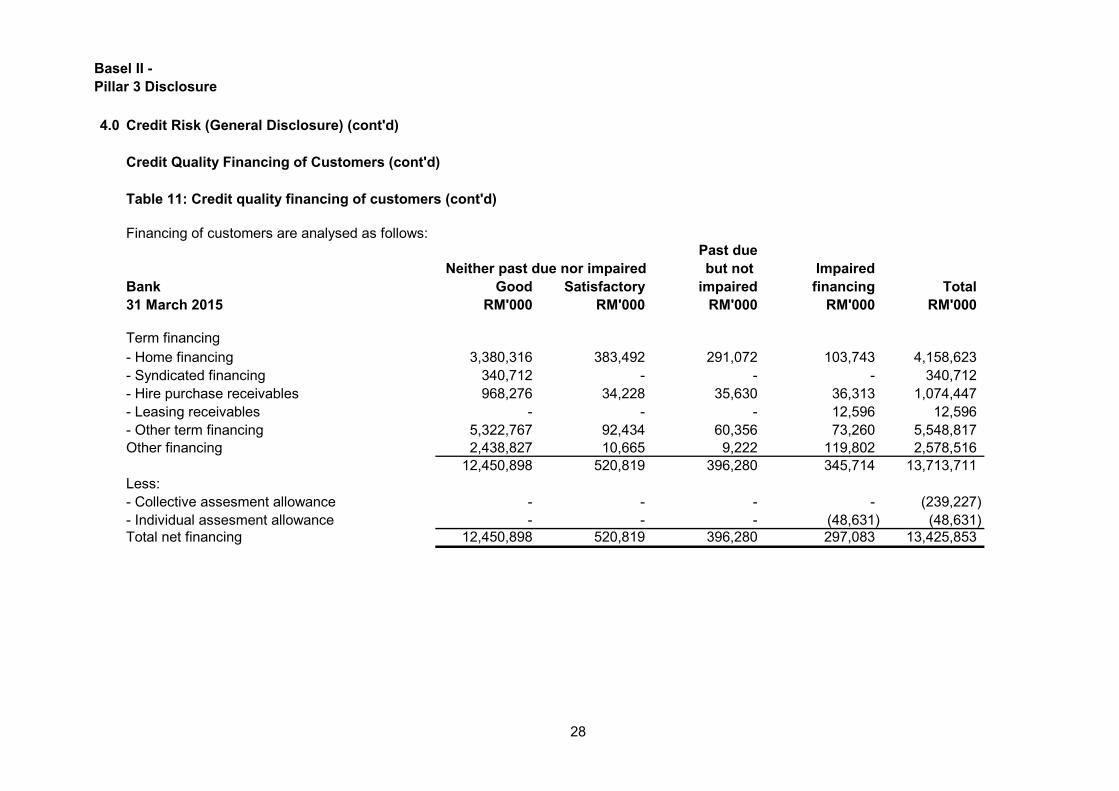
Credit Quality Financing of Customers (cont'd)
Table 11: Credit quality financing of customers (cont'd)
Financing of customers are analysed as follows:
Past due
but not Impaired
Bank Good Satisfactory impaired financing Total
RM'000 RM'000 RM'000 RM'000 RM'000
Term financing
- Home financing 3,380,316 383,492 291,072 103,743 4,158,623
- Syndicated financing 340,712 - - - 340,712
- Hire purchase receivables 968,276 34,228 35,630 36,313 1,074,447
- Leasing receivables - - - 12,596 12,596
- Other term financing 5,322,767 92,434 60,356 73,260 5,548,817
Other financing 2,438,827 10,665 9,222 119,802 2,578,516
12,450,898 520,819 396,280 345,714 13,713,711
Less:
- Collective assesment allowance - - - - (239,227)
- Individual assesment allowance - - - (48,631) (48,631)
Total net financing 12,450,898 520,819 396,280 297,083 13,425,853
Neither past due nor impaired
31 March 2015
28
Basel II -
Pillar 3 Disclosure
4.0 Credit Risk (General Disclosure) (cont'd)
Credit Quality Financing of Customers (cont'd)
Financing of customers are analysed as follows: (cont’d.)
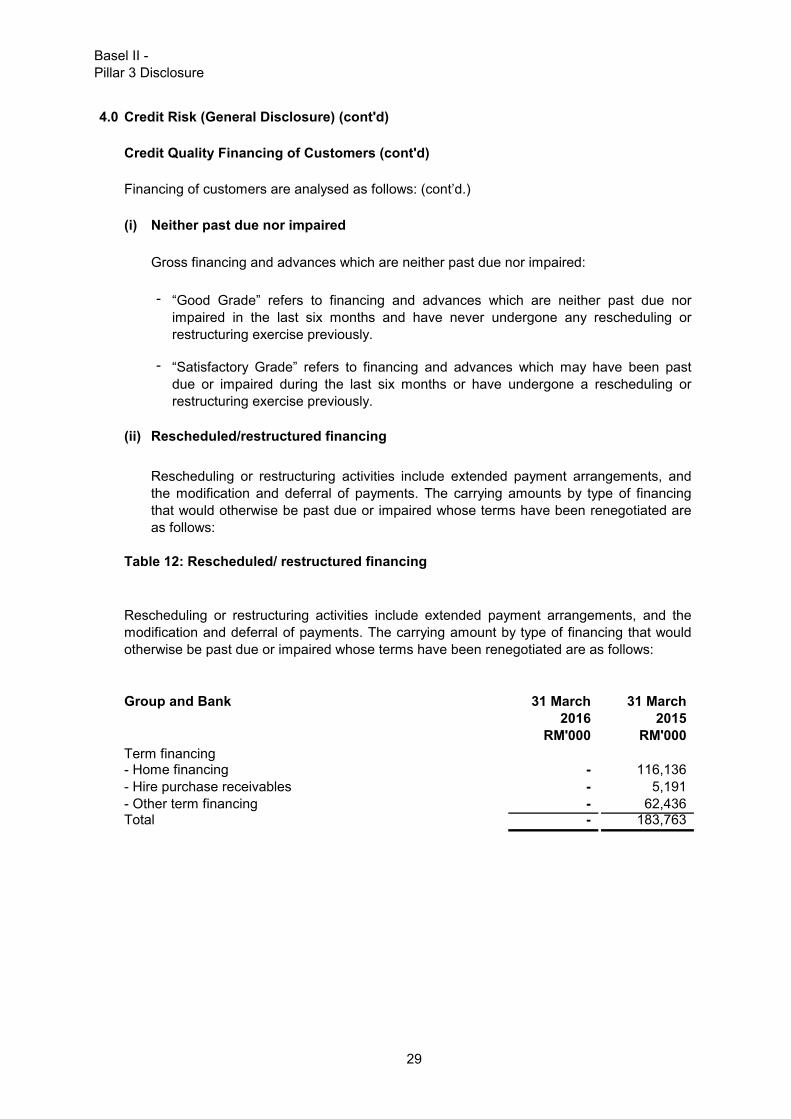
(i) Neither past due nor impaired
-
-
(ii) Rescheduled/restructured financing
Table 12: Rescheduled/ restructured financing
Group and Bank 31 March 31 March
2016 2015
RM'000 RM'000
Term financing- Home financing - 116,136
- Hire purchase receivables - 5,191
- Other term financing - 62,436 Total - 183,763
Rescheduling or restructuring activities include extended payment arrangements, and the
modification and deferral of payments. The carrying amount by type of financing that would
otherwise be past due or impaired whose terms have been renegotiated are as follows:
Gross financing and advances which are neither past due nor impaired:
“Good Grade” refers to financing and advances which are neither past due nor
impaired in the last six months and have never undergone any rescheduling or
restructuring exercise previously.
“Satisfactory Grade” refers to financing and advances which may have been past
due or impaired during the last six months or have undergone a rescheduling or
restructuring exercise previously.
Rescheduling or restructuring activities include extended payment arrangements, and
the modification and deferral of payments. The carrying amounts by type of financing
that would otherwise be past due or impaired whose terms have been renegotiated are
as follows:
29
Basel II -
Pillar 3 Disclosure
4.0 Credit Risk (General Disclosure) (cont'd)
Credit Quality Financing of Customers (cont'd)
Financing of customers are analysed as follows: (cont’d.)
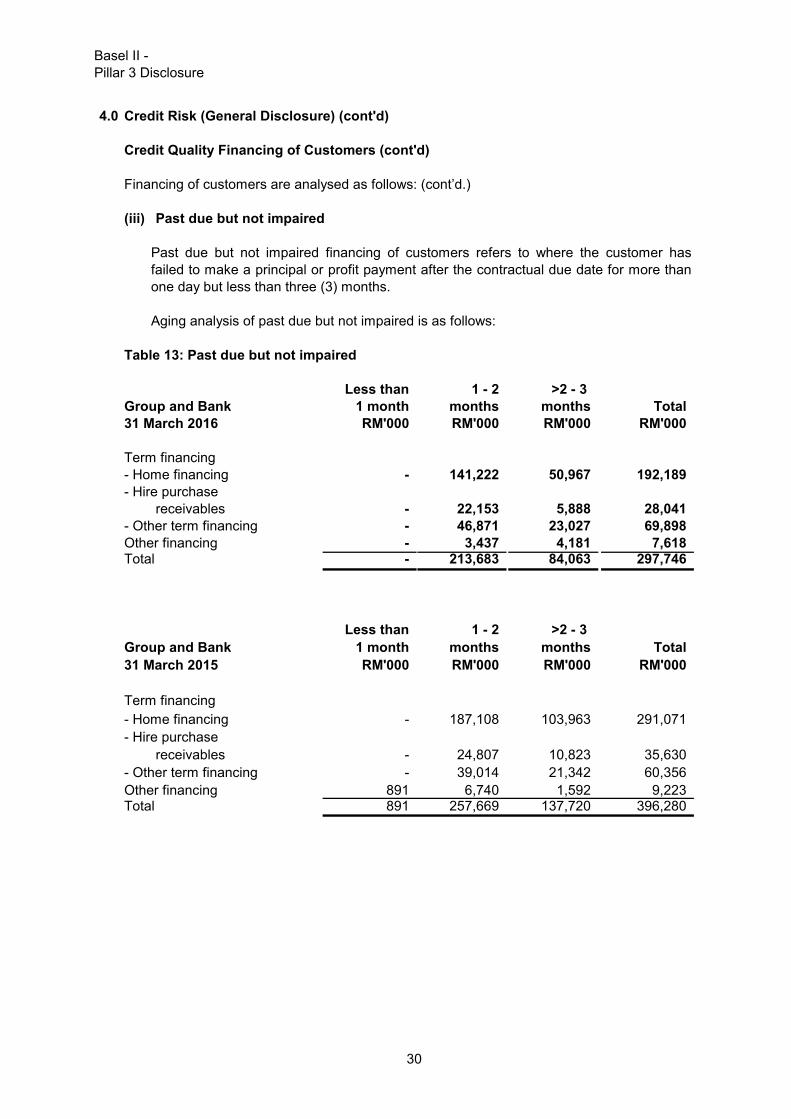
(iii) Past due but not impaired
Aging analysis of past due but not impaired is as follows:
Table 13: Past due but not impaired
Less than 1 - 2 >2 - 3
Group and Bank 1 month months months Total
31 March 2016 RM'000 RM'000 RM'000 RM'000
Term financing
- Home financing - 141,222 50,967 192,189
- Hire purchase
receivables - 22,153 5,888 28,041
- Other term financing - 46,871 23,027 69,898
Other financing - 3,437 4,181 7,618 Total - 213,683 84,063 297,746
Less than 1 - 2 >2 - 3
Group and Bank 1 month months months Total
31 March 2015 RM'000 RM'000 RM'000 RM'000
Term financing
- Home financing - 187,108 103,963 291,071
- Hire purchase
receivables - 24,807 10,823 35,630
- Other term financing - 39,014 21,342 60,356
Other financing 891 6,740 1,592 9,223 Total 891 257,669 137,720 396,280
Past due but not impaired financing of customers refers to where the customer has
failed to make a principal or profit payment after the contractual due date for more than
one day but less than three (3) months.
30
Basel II -
Pillar 3 Disclosure
4.0 Credit Risk (General Disclosure) (cont'd)
Credit Quality Financing of Customers (cont'd)
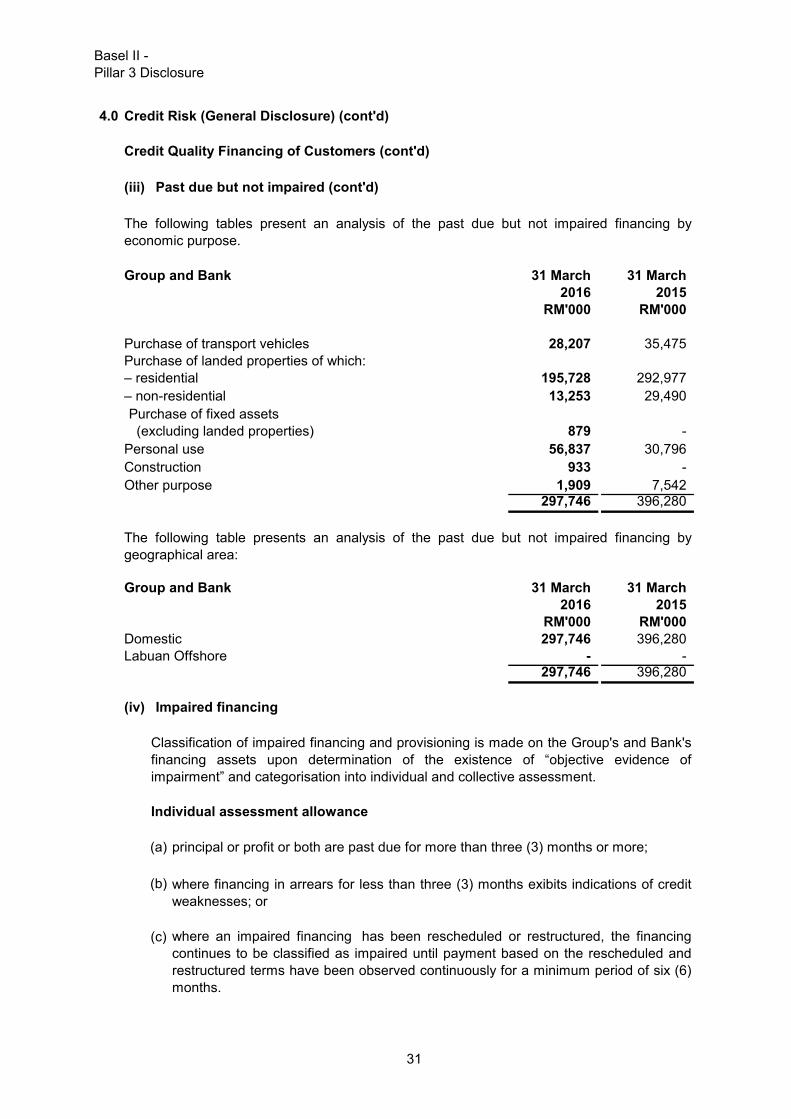
(iii) Past due but not impaired (cont'd)
Group and Bank 31 March 31 March
2016 2015
RM'000 RM'000
Purchase of transport vehicles 28,207 35,475
Purchase of landed properties of which:
– residential 195,728 292,977
– non-residential 13,253 29,490
Purchase of fixed assets
(excluding landed properties) 879 -
Personal use 56,837 30,796
Construction 933 -
Other purpose 1,909 7,542 297,746 396,280
Group and Bank 31 March 31 March
2016 2015
RM'000 RM'000
Domestic 297,746 396,280
Labuan Offshore - - 297,746 396,280
(iv) Impaired financing
(a) principal or profit or both are past due for more than three (3) months or more;
(b)
(c)
Individual assessment allowance
where financing in arrears for less than three (3) months exibits indications of credit
weaknesses; or
where an impaired financing has been rescheduled or restructured, the financing
continues to be classified as impaired until payment based on the rescheduled and
restructured terms have been observed continuously for a minimum period of six (6)
months.
The following table presents an analysis of the past due but not impaired financing by
geographical area:
The following tables present an analysis of the past due but not impaired financing by
economic purpose.
Classification of impaired financing and provisioning is made on the Group's and Bank's
financing assets upon determination of the existence of “objective evidence of
impairment” and categorisation into individual and collective assessment.
31
Basel II -
Pillar 3 Disclosure
4.0 Credit Risk (General Disclosure) (cont'd)
Credit Quality Financing of Customers (cont'd)
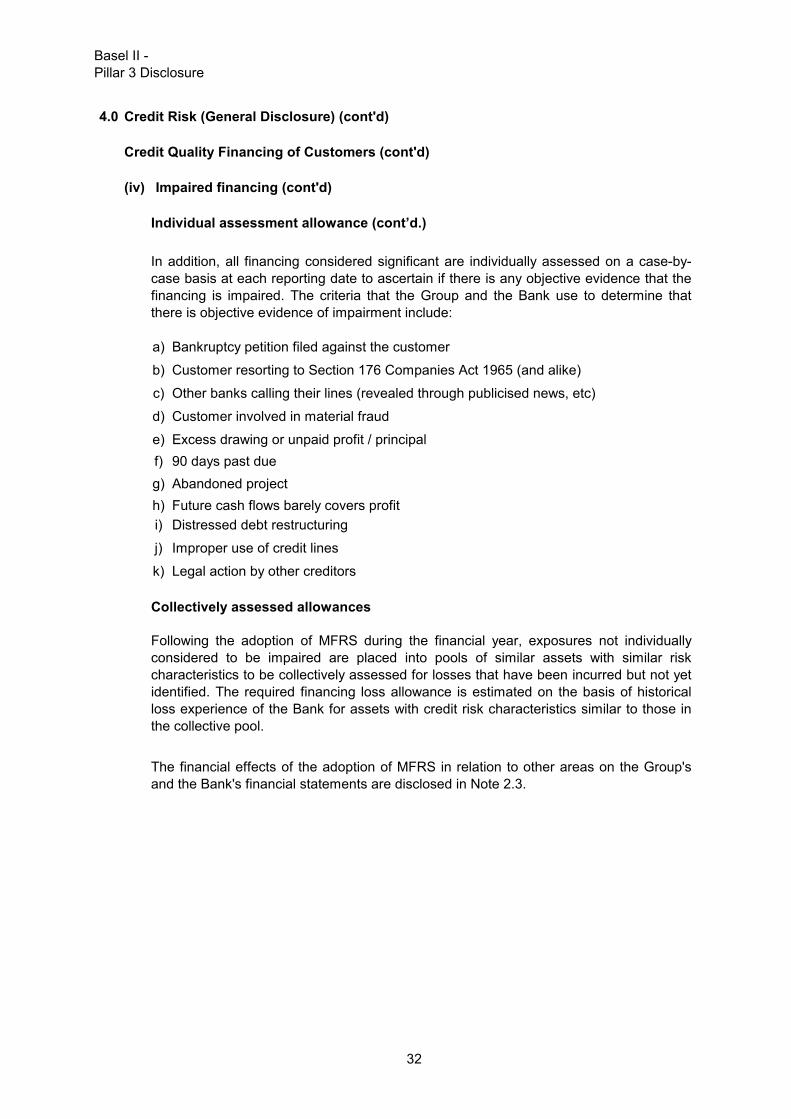
(iv) Impaired financing (cont'd)
a) Bankruptcy petition filed against the customer
b) Customer resorting to Section 176 Companies Act 1965 (and alike)
c) Other banks calling their lines (revealed through publicised news, etc)
d) Customer involved in material fraud
e) Excess drawing or unpaid profit / principal
f) 90 days past due
g) Abandoned project
h) Future cash flows barely covers profit
i) Distressed debt restructuring
j) Improper use of credit lines
k) Legal action by other creditors
Collectively assessed allowances
Following the adoption of MFRS during the financial year, exposures not individually
considered to be impaired are placed into pools of similar assets with similar risk
characteristics to be collectively assessed for losses that have been incurred but not yet
identified. The required financing loss allowance is estimated on the basis of historical
loss experience of the Bank for assets with credit risk characteristics similar to those in
the collective pool.
The financial effects of the adoption of MFRS in relation to other areas on the Group's
and the Bank's financial statements are disclosed in Note 2.3.
Individual assessment allowance (cont’d.)
In addition, all financing considered significant are individually assessed on a case-by-
case basis at each reporting date to ascertain if there is any objective evidence that the
financing is impaired. The criteria that the Group and the Bank use to determine that
there is objective evidence of impairment include:
32
Basel II -
Pillar 3 Disclosure
4.0 Credit Risk (General Disclosure) (cont'd)
Credit Quality Financing of Customers (cont'd)
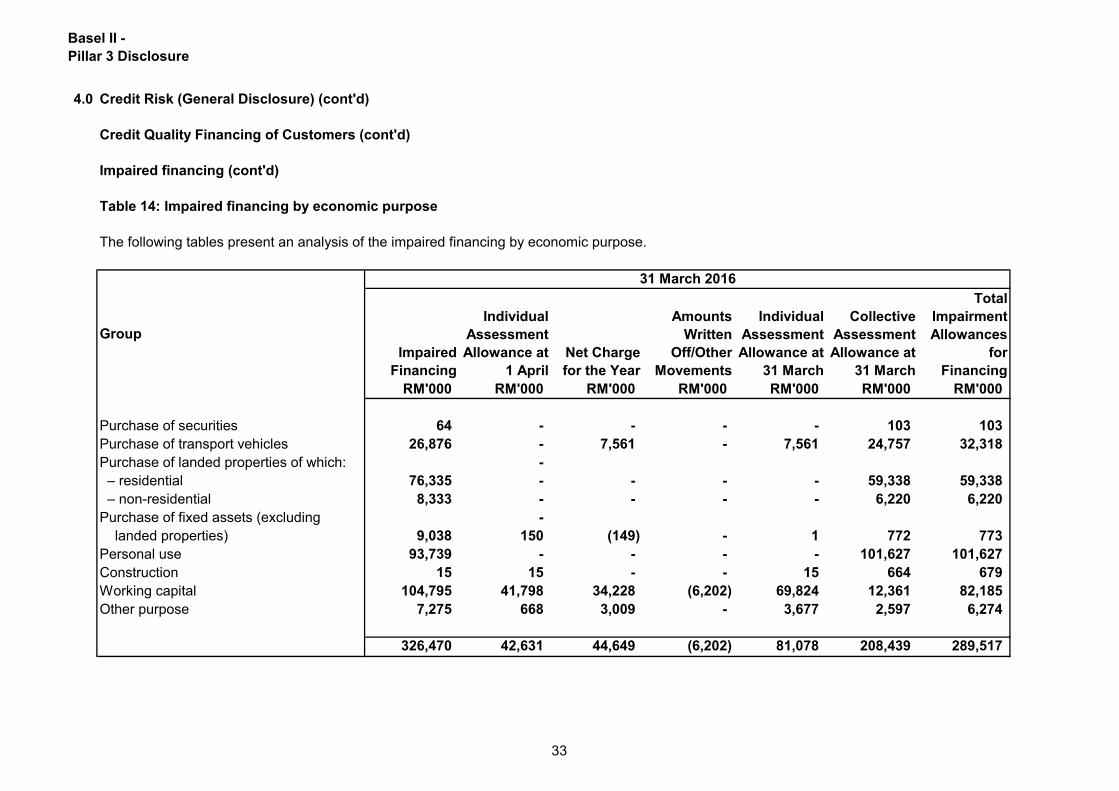
Impaired financing (cont'd)
Table 14: Impaired financing by economic purpose
The following tables present an analysis of the impaired financing by economic purpose.
Group
RM'000 RM'000 RM'000 RM'000 RM'000 RM'000 RM'000
Purchase of securities 64 - - - - 103 103
Purchase of transport vehicles 26,876 - 7,561 - 7,561 24,757 32,318
Purchase of landed properties of which: -
– residential 76,335 - - - - 59,338 59,338
– non-residential 8,333 - - - - 6,220 6,220
Purchase of fixed assets (excluding -
landed properties) 9,038 150 (149) - 1 772 773
Personal use 93,739 - - - - 101,627 101,627
Construction 15 15 - - 15 664 679
Working capital 104,795 41,798 34,228 (6,202) 69,824 12,361 82,185
Other purpose 7,275 668 3,009 - 3,677 2,597 6,274
326,470 42,631 44,649 (6,202) 81,078 208,439 289,517
31 March 2016
Total
Impairment
Allowances
for
Financing
Impaired
Financing
Individual
Assessment
Allowance at
1 April
Net Charge
for the Year
Amounts
Written
Off/Other
Movements
Individual
Assessment
Allowance at
31 March
Collective
Assessment
Allowance at
31 March
33
Basel II -
Pillar 3 Disclosure
4.0 Credit Risk (General Disclosure) (cont'd)
Credit Quality Financing of Customers (cont'd)
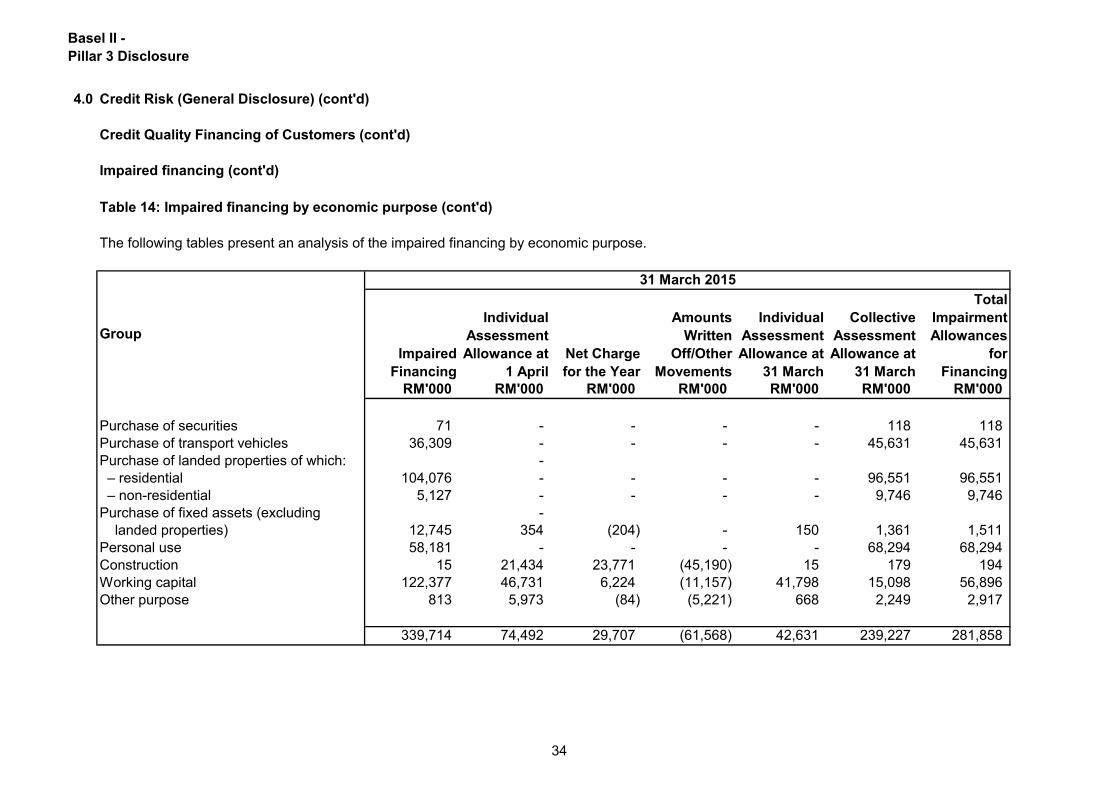
Impaired financing (cont'd)
Table 14: Impaired financing by economic purpose (cont'd)
The following tables present an analysis of the impaired financing by economic purpose.
Group
RM'000 RM'000 RM'000 RM'000 RM'000 RM'000 RM'000
Purchase of securities 71 - - - - 118 118
Purchase of transport vehicles 36,309 - - - - 45,631 45,631
Purchase of landed properties of which: -
– residential 104,076 - - - - 96,551 96,551
– non-residential 5,127 - - - - 9,746 9,746
Purchase of fixed assets (excluding -
landed properties) 12,745 354 (204) - 150 1,361 1,511
Personal use 58,181 - - - - 68,294 68,294
Construction 15 21,434 23,771 (45,190) 15 179 194
Working capital 122,377 46,731 6,224 (11,157) 41,798 15,098 56,896
Other purpose 813 5,973 (84) (5,221) 668 2,249 2,917
339,714 74,492 29,707 (61,568) 42,631 239,227 281,858
31 March 2015
Collective
Assessment
Allowance at
31 March
Total
Impairment
Allowances
for
Financing
Impaired
Financing
Individual
Assessment
Allowance at
1 April
Net Charge
for the Year
Amounts
Written
Off/Other
Movements
Individual
Assessment
Allowance at
31 March
34
Basel II -
Pillar 3 Disclosure
4.0 Credit Risk (General Disclosure) (cont'd)
Credit Quality Financing of Customers (cont'd)
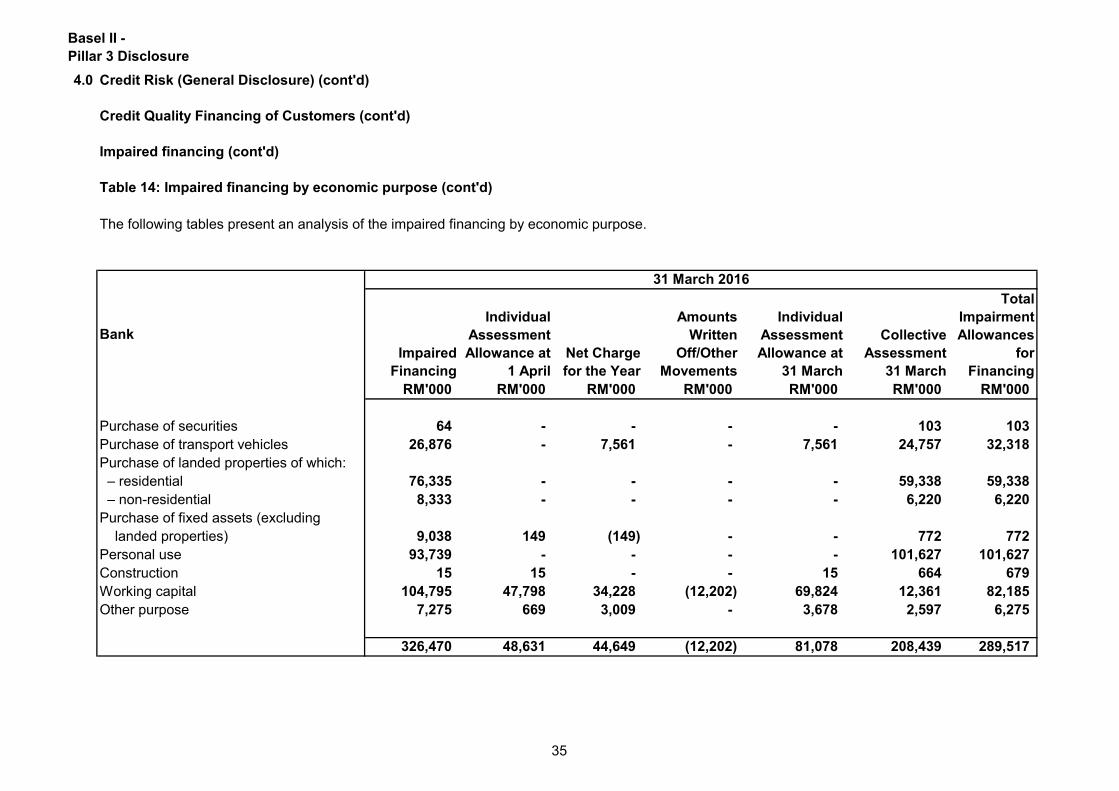
Impaired financing (cont'd)
Table 14: Impaired financing by economic purpose (cont'd)
The following tables present an analysis of the impaired financing by economic purpose.
Bank
RM'000 RM'000 RM'000 RM'000 RM'000 RM'000 RM'000
Purchase of securities 64 - - - - 103 103
Purchase of transport vehicles 26,876 - 7,561 - 7,561 24,757 32,318
Purchase of landed properties of which:
– residential 76,335 - - - - 59,338 59,338
– non-residential 8,333 - - - - 6,220 6,220
Purchase of fixed assets (excluding
landed properties) 9,038 149 (149) - - 772 772
Personal use 93,739 - - - - 101,627 101,627
Construction 15 15 - - 15 664 679
Working capital 104,795 47,798 34,228 (12,202) 69,824 12,361 82,185
Other purpose 7,275 669 3,009 - 3,678 2,597 6,275
326,470 48,631 44,649 (12,202) 81,078 208,439 289,517
31 March 2016
Collective
Assessment
31 March
Total
Impairment
Allowances
for
Financing
Impaired
Financing
Individual
Assessment
Allowance at
1 April
Net Charge
for the Year
Amounts
Written
Off/Other
Movements
Individual
Assessment
Allowance at
31 March
35
Basel II -
Pillar 3 Disclosure
4.0 Credit Risk (General Disclosure) (cont'd)
Credit Quality Financing of Customers (cont'd)
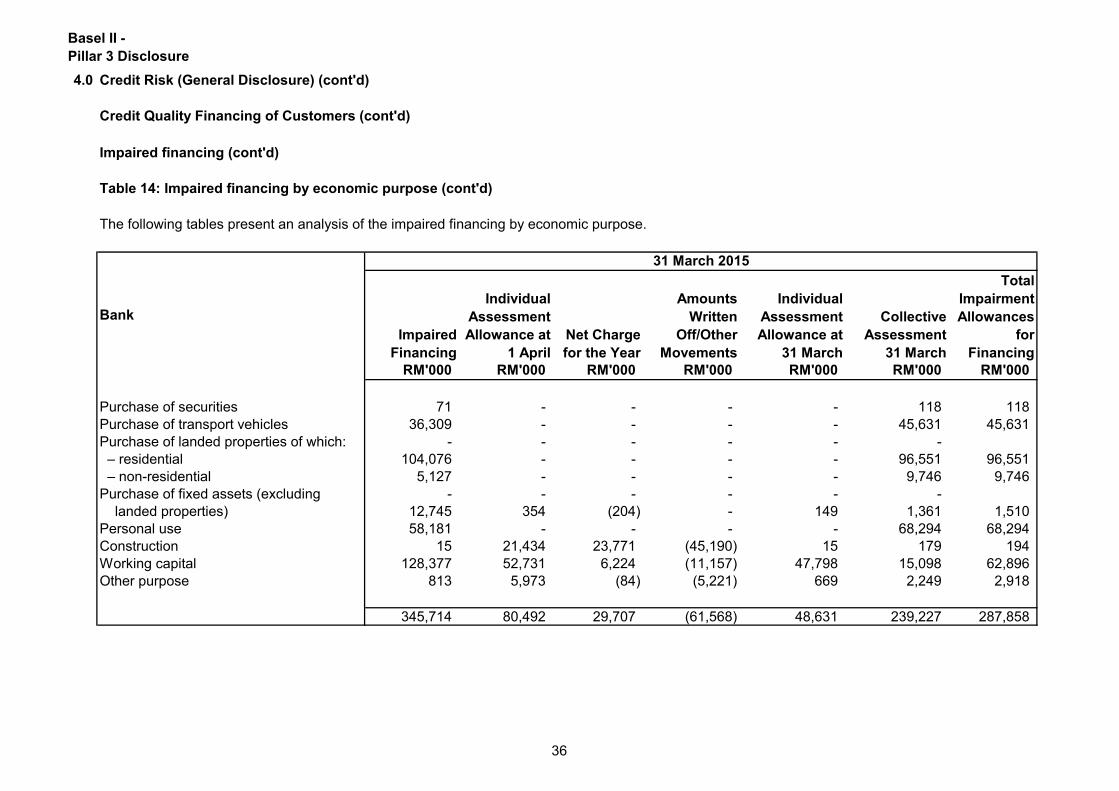
Impaired financing (cont'd)
Table 14: Impaired financing by economic purpose (cont'd)
The following tables present an analysis of the impaired financing by economic purpose.
Bank
RM'000 RM'000 RM'000 RM'000 RM'000 RM'000 RM'000
Purchase of securities 71 - - - - 118 118
Purchase of transport vehicles 36,309 - - - - 45,631 45,631
Purchase of landed properties of which: - - - - - -
– residential 104,076 - - - - 96,551 96,551
– non-residential 5,127 - - - - 9,746 9,746
Purchase of fixed assets (excluding - - - - - -
landed properties) 12,745 354 (204) - 149 1,361 1,510
Personal use 58,181 - - - - 68,294 68,294
Construction 15 21,434 23,771 (45,190) 15 179 194
Working capital 128,377 52,731 6,224 (11,157) 47,798 15,098 62,896
Other purpose 813 5,973 (84) (5,221) 669 2,249 2,918
345,714 80,492 29,707 (61,568) 48,631 239,227 287,858
Individual
Assessment
Allowance at
31 March
Collective
Assessment
31 March
31 March 2015
Total
Impairment
Allowances
for
Financing
Impaired
Financing
Individual
Assessment
Allowance at
1 April
Net Charge
for the Year
Amounts
Written
Off/Other
Movements
36
Basel II -
Pillar 3 Disclosure
4.0 Credit Risk (General Disclosure) (cont'd)
Credit Quality Financing of Customers (cont'd)
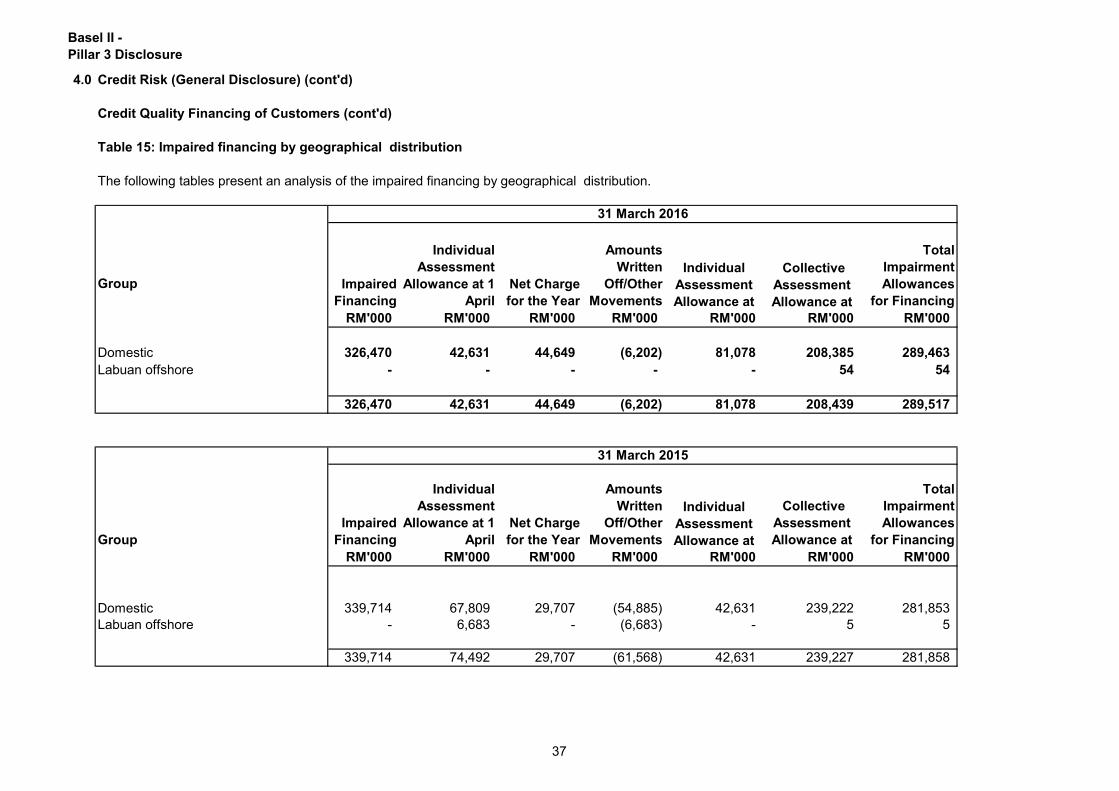
Table 15: Impaired financing by geographical distribution
The following tables present an analysis of the impaired financing by geographical distribution.
Individual
Group
RM'000 RM'000 RM'000 RM'000 RM'000 RM'000 RM'000
Domestic 326,470 42,631 44,649 (6,202) 81,078 208,385 289,463
Labuan offshore - - - - - 54 54
326,470 42,631 44,649 (6,202) 81,078 208,439 289,517
Group
RM'000 RM'000 RM'000 RM'000 RM'000 RM'000 RM'000
Domestic 339,714 67,809 29,707 (54,885) 42,631 239,222 281,853
Labuan offshore - 6,683 - (6,683) - 5 5
339,714 74,492 29,707 (61,568) 42,631 239,227 281,858
31 March 2016
Impaired
Financing
Individual
Assessment
Allowance at 1
April
Net Charge
for the Year
Amounts
Written
Off/Other
Movements
Total
Impairment
Allowances
for Financing
Individual
Assessment
Allowance at
Collective
Assessment
Allowance at
Individual
Assessment
Allowance at
Collective
Assessment
Allowance at
31 March 2015
Impaired
Financing
Individual
Assessment
Allowance at 1
April
Net Charge
for the Year
Amounts
Written
Off/Other
Movements
Total
Impairment
Allowances
for Financing
37
Basel II -
Pillar 3 Disclosure
4.0 Credit Risk (General Disclosure) (cont'd)
Credit Quality Financing of Customers (cont'd)
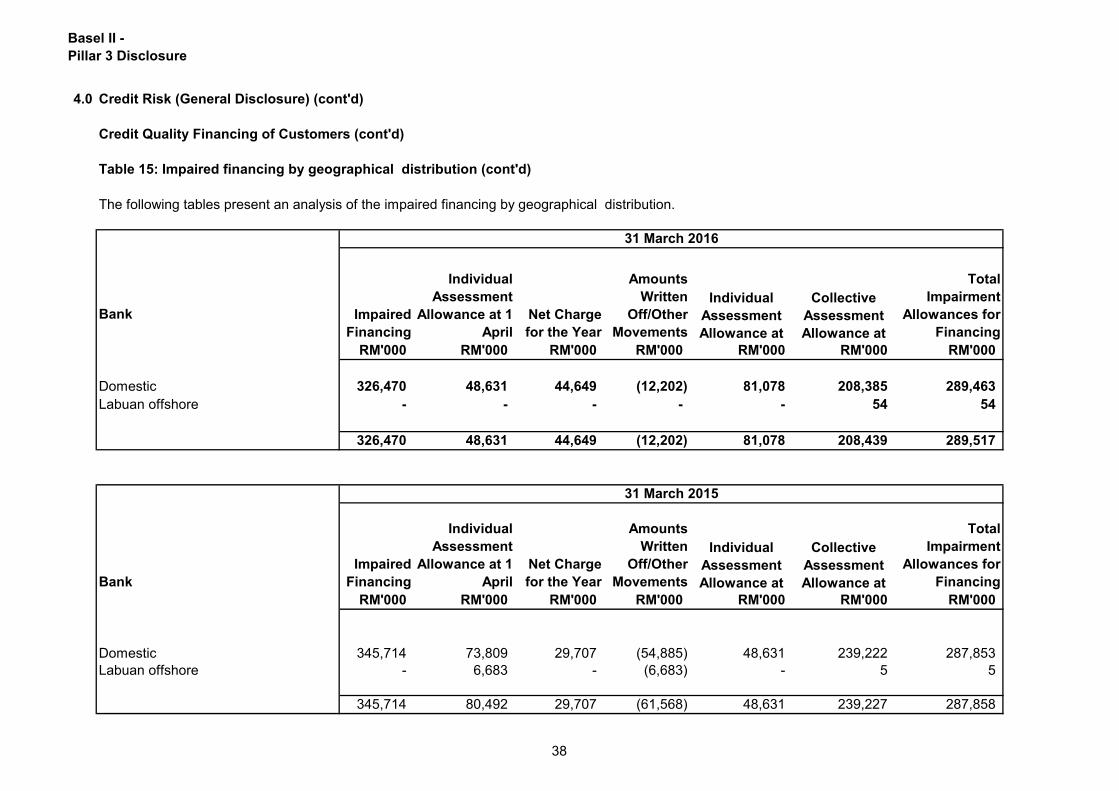
Table 15: Impaired financing by geographical distribution (cont'd)
The following tables present an analysis of the impaired financing by geographical distribution.
Individual .
Bank
RM'000 RM'000 RM'000 RM'000 RM'000 RM'000 RM'000
Domestic 326,470 48,631 44,649 (12,202) 81,078 208,385 289,463
Labuan offshore - - - - - 54 54
326,470 48,631 44,649 (12,202) 81,078 208,439 289,517
Bank
RM'000 RM'000 RM'000 RM'000 RM'000 RM'000 RM'000
Domestic 345,714 73,809 29,707 (54,885) 48,631 239,222 287,853
Labuan offshore - 6,683 - (6,683) - 5 5
345,714 80,492 29,707 (61,568) 48,631 239,227 287,858
Individual
Assessment
Allowance at
Collective
Assessment
Allowance at
Individual
Assessment
Allowance at
Collective
Assessment
Allowance at
31 March 2016
31 March 2015
Impaired
Financing
Individual
Assessment
Allowance at 1
April
Net Charge
for the Year
Amounts
Written
Off/Other
Movements
Total
Impairment
Allowances for
Financing
Impaired
Financing
Individual
Assessment
Allowance at 1
April
Net Charge
for the Year
Amounts
Written
Off/Other
Movements
Total
Impairment
Allowances for
Financing
38
Basel II -
Pillar 3 Disclosure
4.0 Credit Risk (General Disclosure) (cont'd)
Credit Quality Financing of Customers (cont'd)
(iv) Impaired financing (cont'd)
Collateral and other credit enhancements
- For home financing - mortgages over residential properties;
- For syndicated financing - charges over the properties being financed;
- For hire purchase financing - charges over the vehicles financed;
- For share margin financing - pledges over securities from listed exchange;
-
(v) Repossessed Collateral
It is the Group's and the Bank's policy to dispose of repossessed collateral in an
orderly manner. The proceeds are used to reduce or repay the outstanding balance
of financing and securities. Collateral repossessed are subject to disposal as soon
as practicable. Foreclosed properties are recognised in other assets on the
statement of financial position. The Group and the Bank does not occupy
repossessed properties for its own business use.
The amount and type of collateral required depends on as assessment of credit risk
of the counterparty. Guidelines are implemented regarding the acceptability of types
and collateral and valuation parameters.
The main types of collateral obtained by the Group and the Bank are as follows:
For other financing - charges over business assets such as premises,
inventories, trade receivables or deposits.
At 31 March 2016, the fair value of collateral that the Group and Bank hold relating
to financing of customers individually determined to be impaired amounts to
RM84,028,221 as compared with 31 March 2015 of RM100,622,189. The collateral
consists of cash, securities, letters of guarantee and properties.
The financial effect of collateral (quantification of the extent to which collateral and
other credit enhancements mitigate credit risk) held for financing of customer for the
Group and the Bank is at 100.6% as at 31 March 2015, (31 March 2014 of 86.0%
for the Group and the Bank). The financial effect of collateral held for other financial
assets is not significant.
39
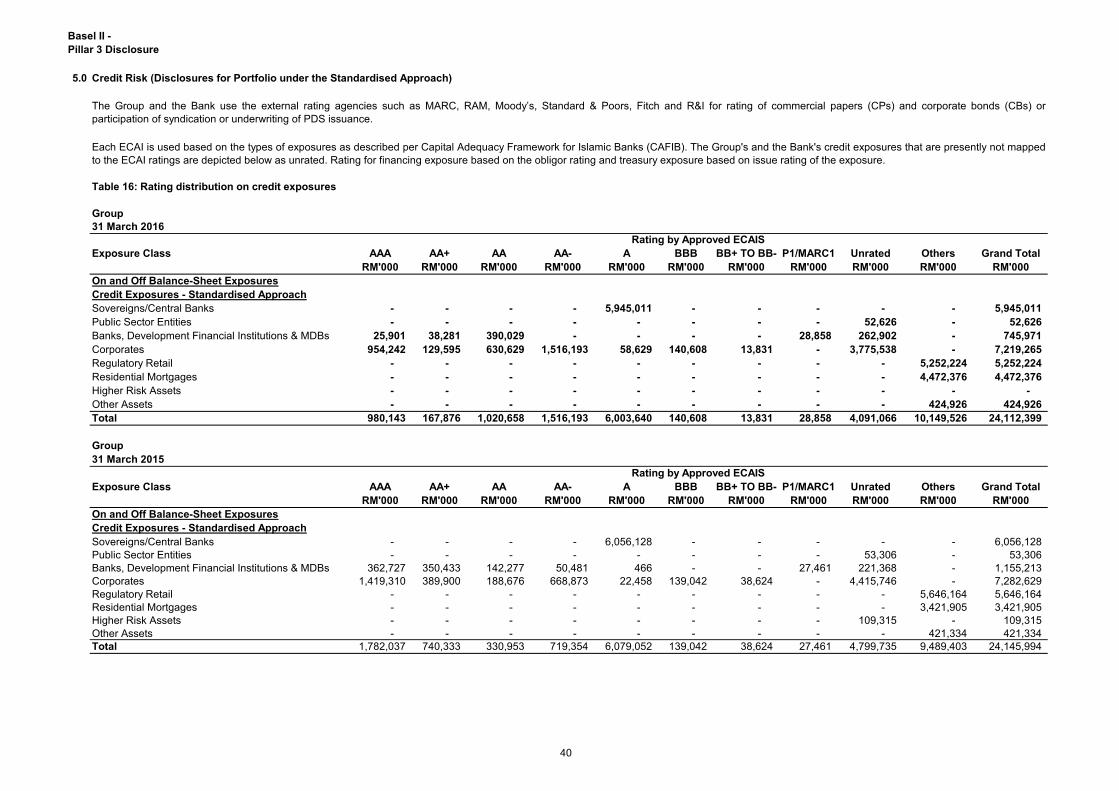
Basel II -
Pillar 3 Disclosure
5.0 Credit Risk (Disclosures for Portfolio under the Standardised Approach)
Table 16: Rating distribution on credit exposures
Group
31 March 2016
Exposure Class AAA AA+ AA AA- A BBB BB+ TO BB- P1/MARC1 Unrated Others Grand Total
RM'000 RM'000 RM'000 RM'000 RM'000 RM'000 RM'000 RM'000 RM'000 RM'000 RM'000
On and Off Balance-Sheet Exposures
Credit Exposures - Standardised Approach
Sovereigns/Central Banks - - - - 5,945,011 - - - - - 5,945,011
Public Sector Entities - - - - - - - - 52,626 - 52,626
Banks, Development Financial Institutions & MDBs 25,901 38,281 390,029 - - - - 28,858 262,902 - 745,971
Corporates 954,242 129,595 630,629 1,516,193 58,629 140,608 13,831 - 3,775,538 - 7,219,265
Regulatory Retail - - - - - - - - - 5,252,224 5,252,224
Residential Mortgages - - - - - - - - - 4,472,376 4,472,376
Higher Risk Assets - - - - - - - - - - -
Other Assets - - - - - - - - - 424,926 424,926
Total 980,143 167,876 1,020,658 1,516,193 6,003,640 140,608 13,831 28,858 4,091,066 10,149,526 24,112,399
Group
31 March 2015
Exposure Class AAA AA+ AA AA- A BBB BB+ TO BB- P1/MARC1 Unrated Others Grand Total
RM'000 RM'000 RM'000 RM'000 RM'000 RM'000 RM'000 RM'000 RM'000 RM'000 RM'000
On and Off Balance-Sheet Exposures
Credit Exposures - Standardised Approach
Sovereigns/Central Banks - - - - 6,056,128 - - - - - 6,056,128
Public Sector Entities - - - - - - - - 53,306 - 53,306
Banks, Development Financial Institutions & MDBs 362,727 350,433 142,277 50,481 466 - - 27,461 221,368 - 1,155,213
Corporates 1,419,310 389,900 188,676 668,873 22,458 139,042 38,624 - 4,415,746 - 7,282,629
Regulatory Retail - - - - - - - - - 5,646,164 5,646,164
Residential Mortgages - - - - - - - - - 3,421,905 3,421,905
Higher Risk Assets - - - - - - - - 109,315 - 109,315
Other Assets - - - - - - - - - 421,334 421,334
Total 1,782,037 740,333 330,953 719,354 6,079,052 139,042 38,624 27,461 4,799,735 9,489,403 24,145,994
The Group and the Bank use the external rating agencies such as MARC, RAM, Moody’s, Standard & Poors, Fitch and R&I for rating of commercial papers (CPs) and corporate bonds (CBs) or
participation of syndication or underwriting of PDS issuance.
Each ECAI is used based on the types of exposures as described per Capital Adequacy Framework for Islamic Banks (CAFIB). The Group's and the Bank's credit exposures that are presently not mapped
to the ECAI ratings are depicted below as unrated. Rating for financing exposure based on the obligor rating and treasury exposure based on issue rating of the exposure.
Rating by Approved ECAIS
Rating by Approved ECAIS
40
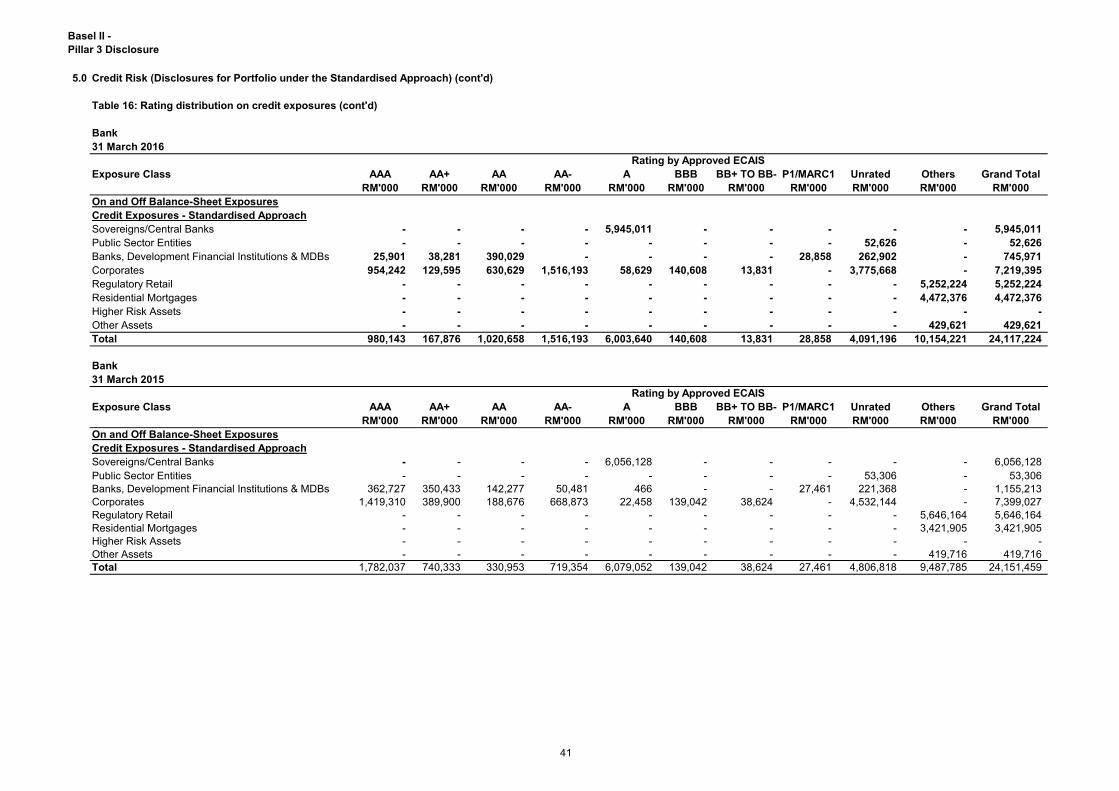
Basel II -
Pillar 3 Disclosure
5.0 Credit Risk (Disclosures for Portfolio under the Standardised Approach) (cont'd)
Table 16: Rating distribution on credit exposures (cont'd)
Bank
31 March 2016
Exposure Class AAA AA+ AA AA- A BBB BB+ TO BB- P1/MARC1 Unrated Others Grand Total
RM'000 RM'000 RM'000 RM'000 RM'000 RM'000 RM'000 RM'000 RM'000 RM'000 RM'000
On and Off Balance-Sheet Exposures
Credit Exposures - Standardised Approach
Sovereigns/Central Banks - - - - 5,945,011 - - - - - 5,945,011
Public Sector Entities - - - - - - - - 52,626 - 52,626
Banks, Development Financial Institutions & MDBs 25,901 38,281 390,029 - - - - 28,858 262,902 - 745,971
Corporates 954,242 129,595 630,629 1,516,193 58,629 140,608 13,831 - 3,775,668 - 7,219,395
Regulatory Retail - - - - - - - - - 5,252,224 5,252,224
Residential Mortgages - - - - - - - - - 4,472,376 4,472,376
Higher Risk Assets - - - - - - - - - - -
Other Assets - - - - - - - - - 429,621 429,621
Total 980,143 167,876 1,020,658 1,516,193 6,003,640 140,608 13,831 28,858 4,091,196 10,154,221 24,117,224
Bank
31 March 2015
Exposure Class AAA AA+ AA AA- A BBB BB+ TO BB- P1/MARC1 Unrated Others Grand Total
RM'000 RM'000 RM'000 RM'000 RM'000 RM'000 RM'000 RM'000 RM'000 RM'000 RM'000
On and Off Balance-Sheet Exposures
Credit Exposures - Standardised Approach
Sovereigns/Central Banks - - - - 6,056,128 - - - - - 6,056,128
Public Sector Entities - - - - - - - - 53,306 - 53,306
Banks, Development Financial Institutions & MDBs 362,727 350,433 142,277 50,481 466 - - 27,461 221,368 - 1,155,213
Corporates 1,419,310 389,900 188,676 668,873 22,458 139,042 38,624 - 4,532,144 - 7,399,027
Regulatory Retail - - - - - - - - - 5,646,164 5,646,164
Residential Mortgages - - - - - - - - - 3,421,905 3,421,905
Higher Risk Assets - - - - - - - - - - -
Other Assets - - - - - - - - - 419,716 419,716
Total 1,782,037 740,333 330,953 719,354 6,079,052 139,042 38,624 27,461 4,806,818 9,487,785 24,151,459
Rating by Approved ECAIS
Rating by Approved ECAIS
41
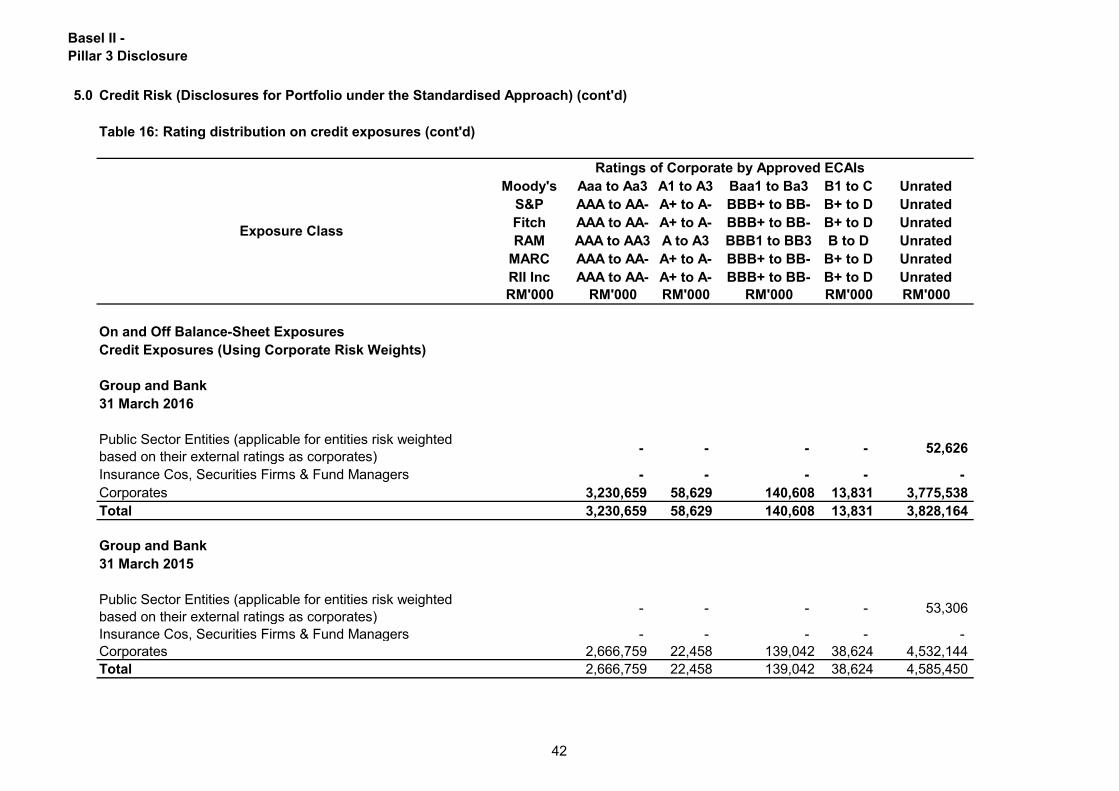
Basel II -
Pillar 3 Disclosure
5.0 Credit Risk (Disclosures for Portfolio under the Standardised Approach) (cont'd)
Table 16: Rating distribution on credit exposures (cont'd)
Moody's Aaa to Aa3 A1 to A3 Baa1 to Ba3 B1 to C Unrated
S&P AAA to AA- A+ to A- BBB+ to BB- B+ to D Unrated
Fitch AAA to AA- A+ to A- BBB+ to BB- B+ to D Unrated
RAM AAA to AA3 A to A3 BBB1 to BB3 B to D Unrated
MARC AAA to AA- A+ to A- BBB+ to BB- B+ to D Unrated
RII Inc AAA to AA- A+ to A- BBB+ to BB- B+ to D Unrated
RM'000 RM'000 RM'000 RM'000 RM'000 RM'000
On and Off Balance-Sheet Exposures
Credit Exposures (Using Corporate Risk Weights)
Group and Bank
31 March 2016
Public Sector Entities (applicable for entities risk weighted
based on their external ratings as corporates) - - - - 52,626
Insurance Cos, Securities Firms & Fund Managers - - - - -
Corporates 3,230,659 58,629 140,608 13,831 3,775,538
Total 3,230,659 58,629 140,608 13,831 3,828,164
Group and Bank
31 March 2015
Public Sector Entities (applicable for entities risk weighted
based on their external ratings as corporates) - - - - 53,306
Insurance Cos, Securities Firms & Fund Managers - - - - -
Corporates 2,666,759 22,458 139,042 38,624 4,532,144
Total 2,666,759 22,458 139,042 38,624 4,585,450
Exposure Class
Ratings of Corporate by Approved ECAIs
42
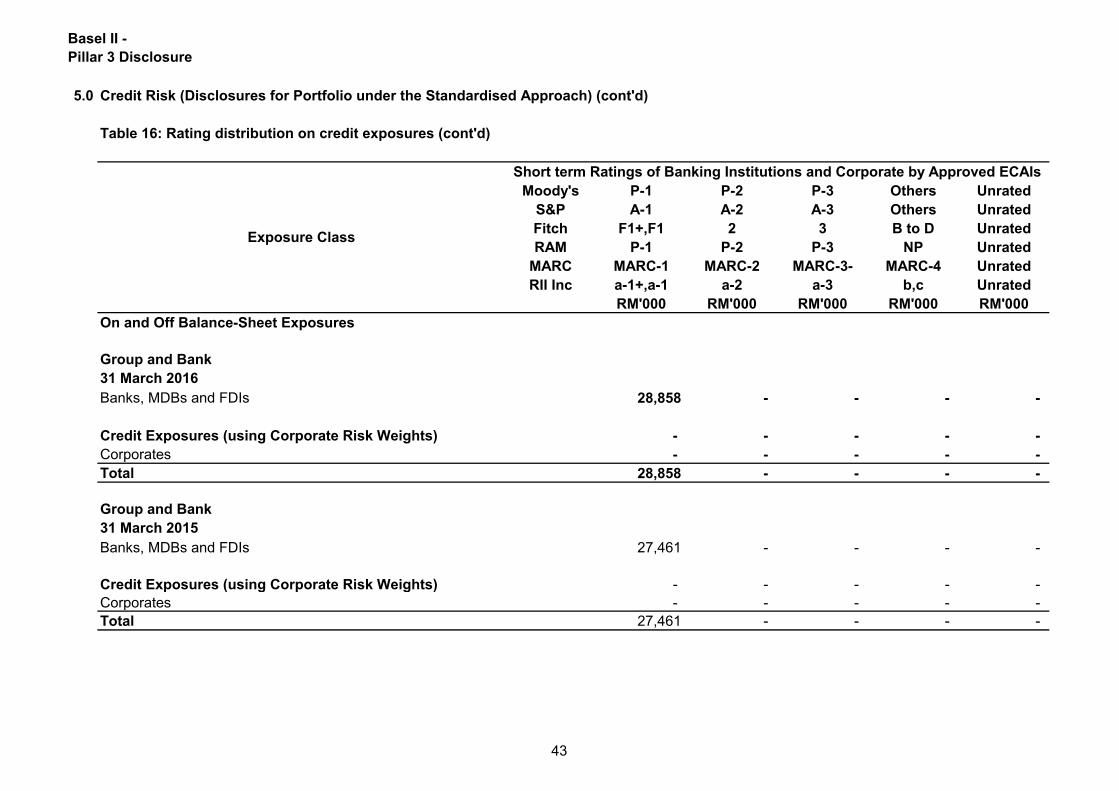
Basel II -
Pillar 3 Disclosure
5.0 Credit Risk (Disclosures for Portfolio under the Standardised Approach) (cont'd)
Moody's P-1 P-2 P-3 Others Unrated
S&P A-1 A-2 A-3 Others Unrated
Fitch F1+,F1 2 3 B to D Unrated
RAM P-1 P-2 P-3 NP Unrated
MARC MARC-1 MARC-2 MARC-3- MARC-4 Unrated
RII Inc a-1+,a-1 a-2 a-3 b,c Unrated
RM'000 RM'000 RM'000 RM'000 RM'000
On and Off Balance-Sheet Exposures
Group and Bank
31 March 2016
Banks, MDBs and FDIs 28,858 - - - -
Credit Exposures (using Corporate Risk Weights) - - - - -
Corporates - - - - -
Total 28,858 - - - -
Group and Bank
31 March 2015
Banks, MDBs and FDIs 27,461 - - - -
Credit Exposures (using Corporate Risk Weights) - - - - -
Corporates - - - - -
Total 27,461 - - - -
Table 16: Rating distribution on credit exposures (cont'd)
Exposure Class
Short term Ratings of Banking Institutions and Corporate by Approved ECAIs
43
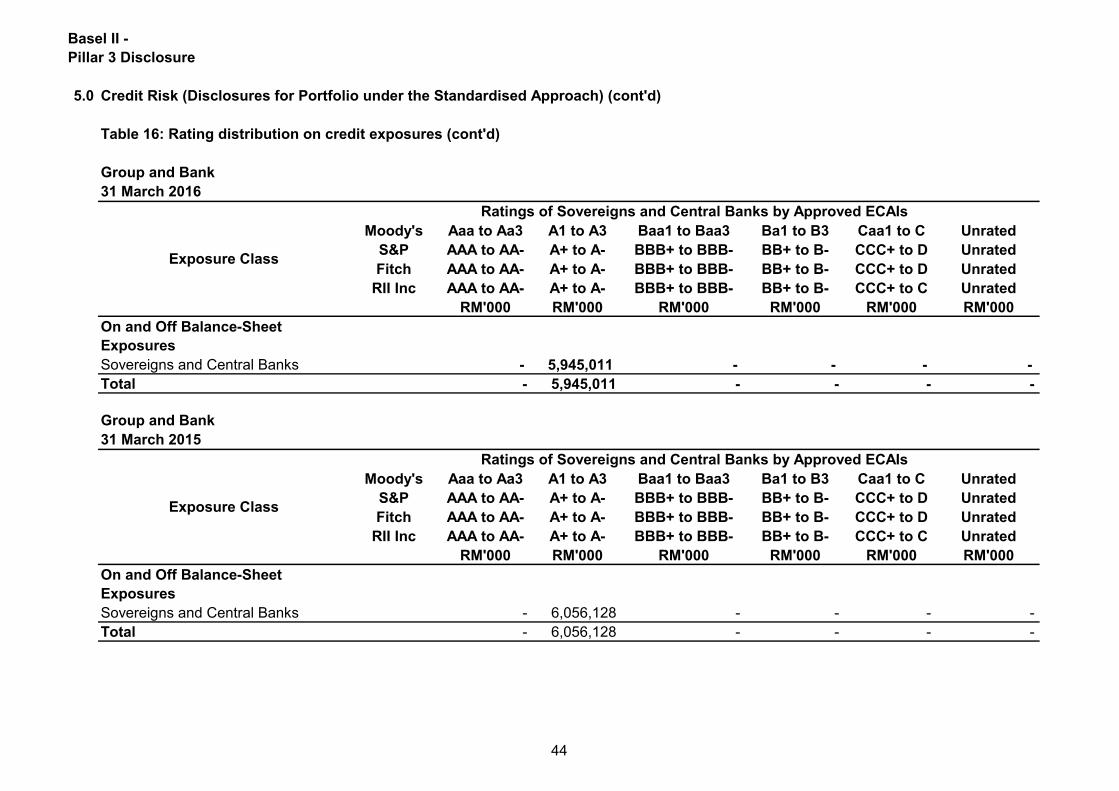
Basel II -
Pillar 3 Disclosure
5.0 Credit Risk (Disclosures for Portfolio under the Standardised Approach) (cont'd)
Group and Bank
31 March 2016
Moody's Aaa to Aa3 A1 to A3 Baa1 to Baa3 Ba1 to B3 Caa1 to C Unrated
S&P AAA to AA- A+ to A- BBB+ to BBB- BB+ to B- CCC+ to D Unrated
Fitch AAA to AA- A+ to A- BBB+ to BBB- BB+ to B- CCC+ to D Unrated
RII Inc AAA to AA- A+ to A- BBB+ to BBB- BB+ to B- CCC+ to C Unrated
RM'000 RM'000 RM'000 RM'000 RM'000 RM'000
On and Off Balance-Sheet
Exposures
Sovereigns and Central Banks - 5,945,011 - - - -
Total - 5,945,011 - - - -
Group and Bank
31 March 2015
Moody's Aaa to Aa3 A1 to A3 Baa1 to Baa3 Ba1 to B3 Caa1 to C Unrated
S&P AAA to AA- A+ to A- BBB+ to BBB- BB+ to B- CCC+ to D Unrated
Fitch AAA to AA- A+ to A- BBB+ to BBB- BB+ to B- CCC+ to D Unrated
RII Inc AAA to AA- A+ to A- BBB+ to BBB- BB+ to B- CCC+ to C Unrated
RM'000 RM'000 RM'000 RM'000 RM'000 RM'000
On and Off Balance-Sheet
Exposures
Sovereigns and Central Banks - 6,056,128 - - - -
Total - 6,056,128 - - - -
Exposure Class
Ratings of Sovereigns and Central Banks by Approved ECAIs
Table 16: Rating distribution on credit exposures (cont'd)
Exposure Class
Ratings of Sovereigns and Central Banks by Approved ECAIs
44
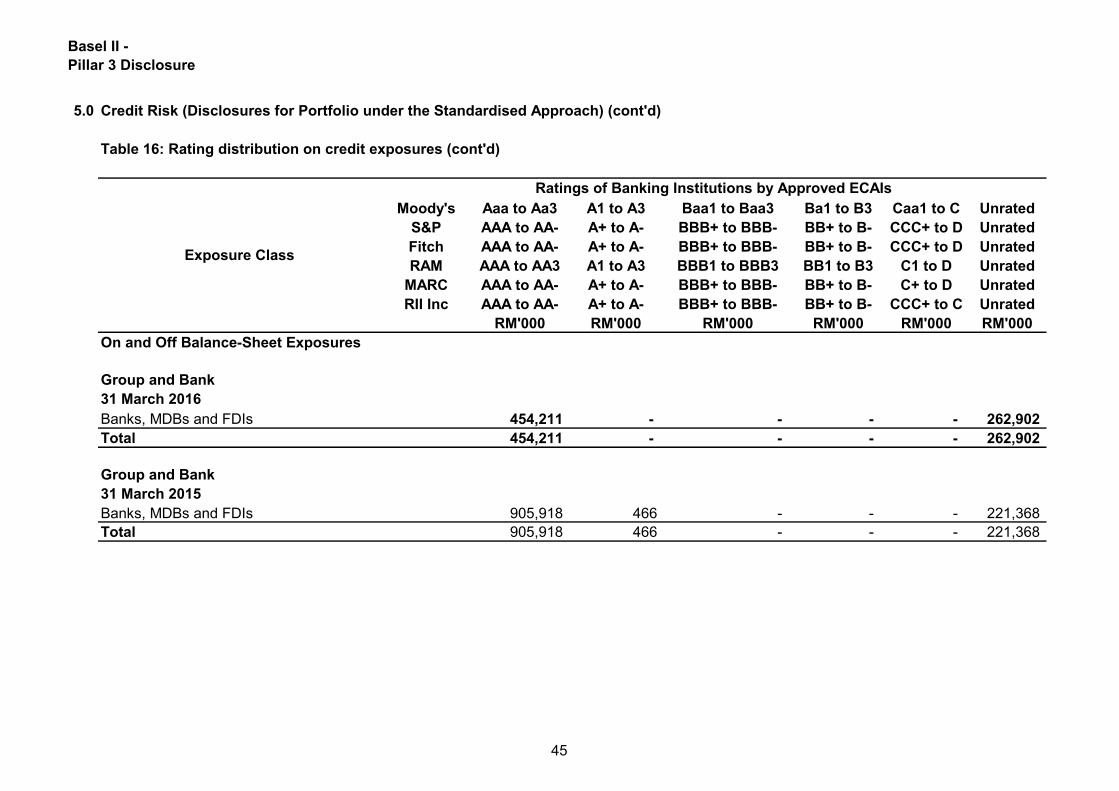
Basel II -
Pillar 3 Disclosure
5.0 Credit Risk (Disclosures for Portfolio under the Standardised Approach) (cont'd)
Moody's Aaa to Aa3 A1 to A3 Baa1 to Baa3 Ba1 to B3 Caa1 to C Unrated
S&P AAA to AA- A+ to A- BBB+ to BBB- BB+ to B- CCC+ to D Unrated
Fitch AAA to AA- A+ to A- BBB+ to BBB- BB+ to B- CCC+ to D Unrated
RAM AAA to AA3 A1 to A3 BBB1 to BBB3 BB1 to B3 C1 to D Unrated
MARC AAA to AA- A+ to A- BBB+ to BBB- BB+ to B- C+ to D Unrated
RII Inc AAA to AA- A+ to A- BBB+ to BBB- BB+ to B- CCC+ to C Unrated
RM'000 RM'000 RM'000 RM'000 RM'000 RM'000
On and Off Balance-Sheet Exposures
Group and Bank
31 March 2016
Banks, MDBs and FDIs 454,211 - - - - 262,902
Total 454,211 - - - - 262,902
Group and Bank
31 March 2015
Banks, MDBs and FDIs 905,918 466 - - - 221,368
Total 905,918 466 - - - 221,368
Table 16: Rating distribution on credit exposures (cont'd)
Exposure Class
Ratings of Banking Institutions by Approved ECAIs
45
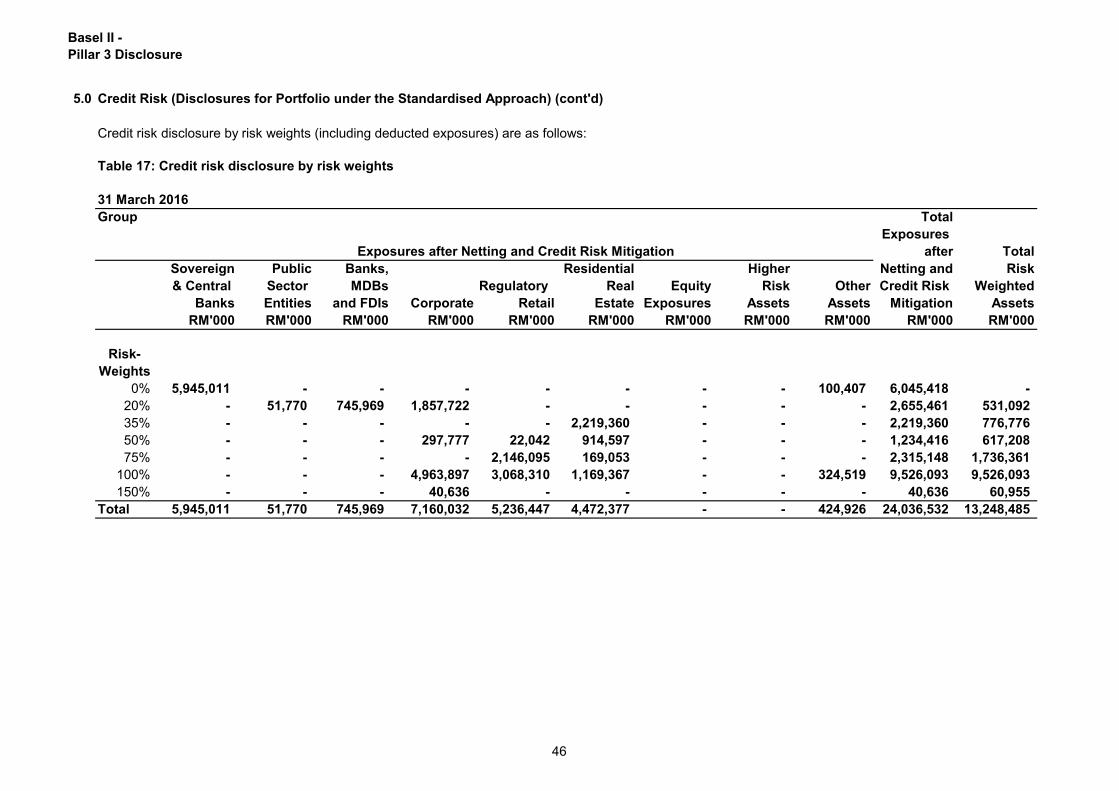
Basel II -
Pillar 3 Disclosure
5.0 Credit Risk (Disclosures for Portfolio under the Standardised Approach) (cont'd)
Credit risk disclosure by risk weights (including deducted exposures) are as follows:
Table 17: Credit risk disclosure by risk weights
31 March 2016
Group Total
Exposures
after Total
Sovereign Public Banks, Residential Higher Netting and Risk
& Central Sector MDBs Regulatory Real Equity Risk Other Credit Risk Weighted
Banks Entities and FDIs Corporate Retail Estate Exposures Assets Assets Mitigation Assets
RM'000 RM'000 RM'000 RM'000 RM'000 RM'000 RM'000 RM'000 RM'000 RM'000 RM'000
Risk-
Weights
0% 5,945,011 - - - - - - - 100,407 6,045,418 -
20% - 51,770 745,969 1,857,722 - - - - - 2,655,461 531,092
35% - - - - - 2,219,360 - - - 2,219,360 776,776
50% - - - 297,777 22,042 914,597 - - - 1,234,416 617,208
75% - - - - 2,146,095 169,053 - - - 2,315,148 1,736,361
100% - - - 4,963,897 3,068,310 1,169,367 - - 324,519 9,526,093 9,526,093
150% - - - 40,636 - - - - - 40,636 60,955
Total 5,945,011 51,770 745,969 7,160,032 5,236,447 4,472,377 - - 424,926 24,036,532 13,248,485
Exposures after Netting and Credit Risk Mitigation
46
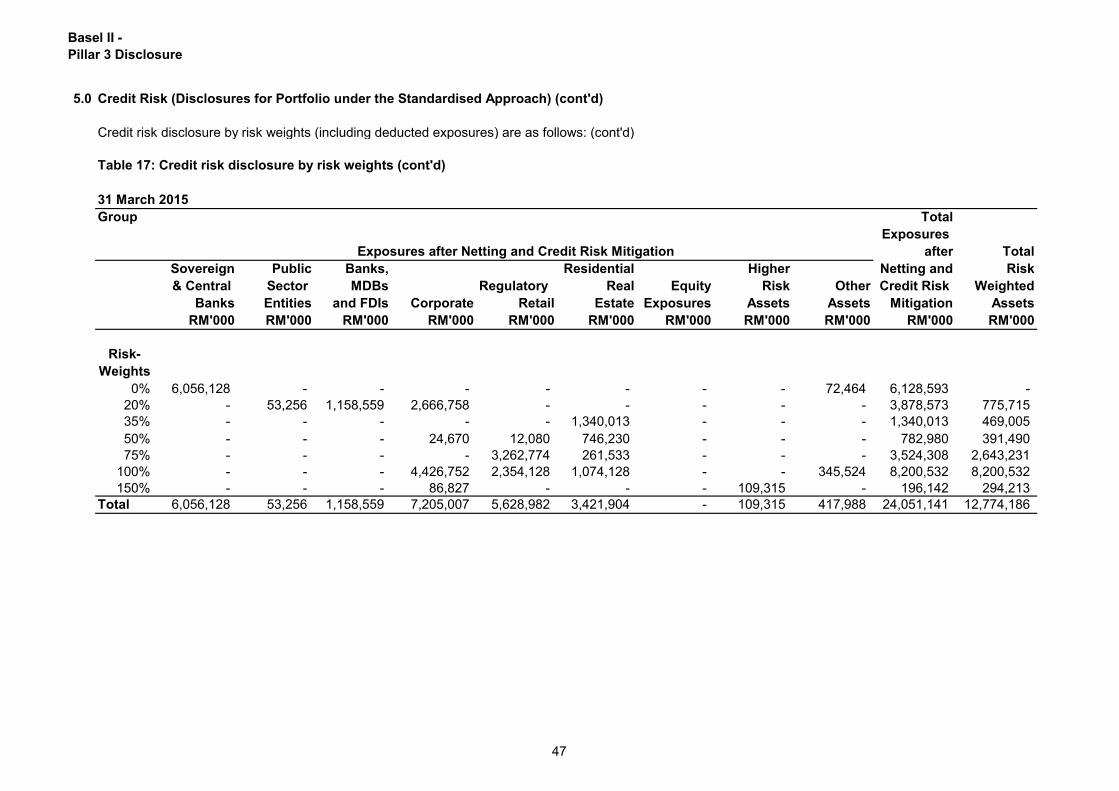
Basel II -
Pillar 3 Disclosure
5.0 Credit Risk (Disclosures for Portfolio under the Standardised Approach) (cont'd)
Credit risk disclosure by risk weights (including deducted exposures) are as follows: (cont'd)
Table 17: Credit risk disclosure by risk weights (cont'd)
31 March 2015
Group Total
Exposures
after Total
Sovereign Public Banks, Residential Higher Netting and Risk
& Central Sector MDBs Regulatory Real Equity Risk Other Credit Risk Weighted
Banks Entities and FDIs Corporate Retail Estate Exposures Assets Assets Mitigation Assets
RM'000 RM'000 RM'000 RM'000 RM'000 RM'000 RM'000 RM'000 RM'000 RM'000 RM'000
Risk-
Weights
0% 6,056,128 - - - - - - - 72,464 6,128,593 -
20% - 53,256 1,158,559 2,666,758 - - - - - 3,878,573 775,715
35% - - - - - 1,340,013 - - - 1,340,013 469,005
50% - - - 24,670 12,080 746,230 - - - 782,980 391,490
75% - - - - 3,262,774 261,533 - - - 3,524,308 2,643,231
100% - - - 4,426,752 2,354,128 1,074,128 - - 345,524 8,200,532 8,200,532
150% - - - 86,827 - - - 109,315 - 196,142 294,213
Total 6,056,128 53,256 1,158,559 7,205,007 5,628,982 3,421,904 - 109,315 417,988 24,051,141 12,774,186
Exposures after Netting and Credit Risk Mitigation
47
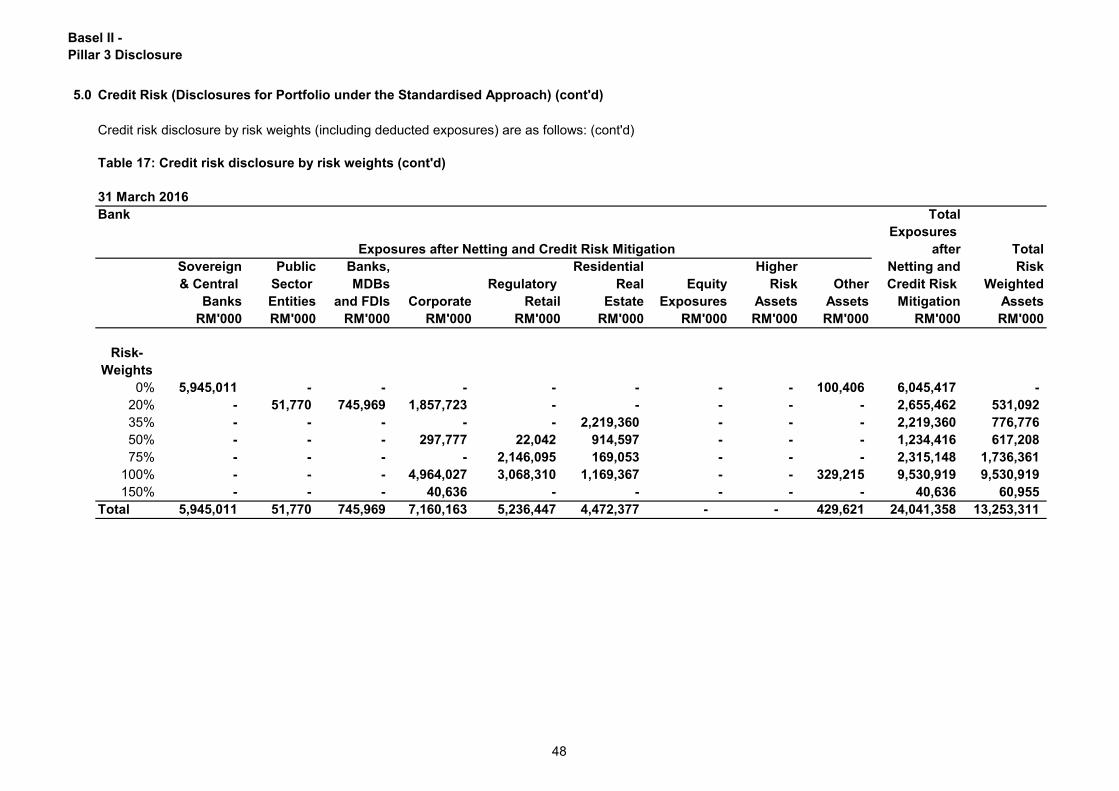
Basel II -
Pillar 3 Disclosure
5.0 Credit Risk (Disclosures for Portfolio under the Standardised Approach) (cont'd)
Credit risk disclosure by risk weights (including deducted exposures) are as follows: (cont'd)
Table 17: Credit risk disclosure by risk weights (cont'd)
31 March 2016
Bank Total
Exposures
after Total
Sovereign Public Banks, Residential Higher Netting and Risk
& Central Sector MDBs Regulatory Real Equity Risk Other Credit Risk Weighted
Banks Entities and FDIs Corporate Retail Estate Exposures Assets Assets Mitigation Assets
RM'000 RM'000 RM'000 RM'000 RM'000 RM'000 RM'000 RM'000 RM'000 RM'000 RM'000
Risk-
Weights
0% 5,945,011 - - - - - - - 100,406 6,045,417 -
20% - 51,770 745,969 1,857,723 - - - - - 2,655,462 531,092
35% - - - - - 2,219,360 - - - 2,219,360 776,776
50% - - - 297,777 22,042 914,597 - - - 1,234,416 617,208
75% - - - - 2,146,095 169,053 - - - 2,315,148 1,736,361
100% - - - 4,964,027 3,068,310 1,169,367 - - 329,215 9,530,919 9,530,919
150% - - - 40,636 - - - - - 40,636 60,955
Total 5,945,011 51,770 745,969 7,160,163 5,236,447 4,472,377 - - 429,621 24,041,358 13,253,311
Exposures after Netting and Credit Risk Mitigation
48
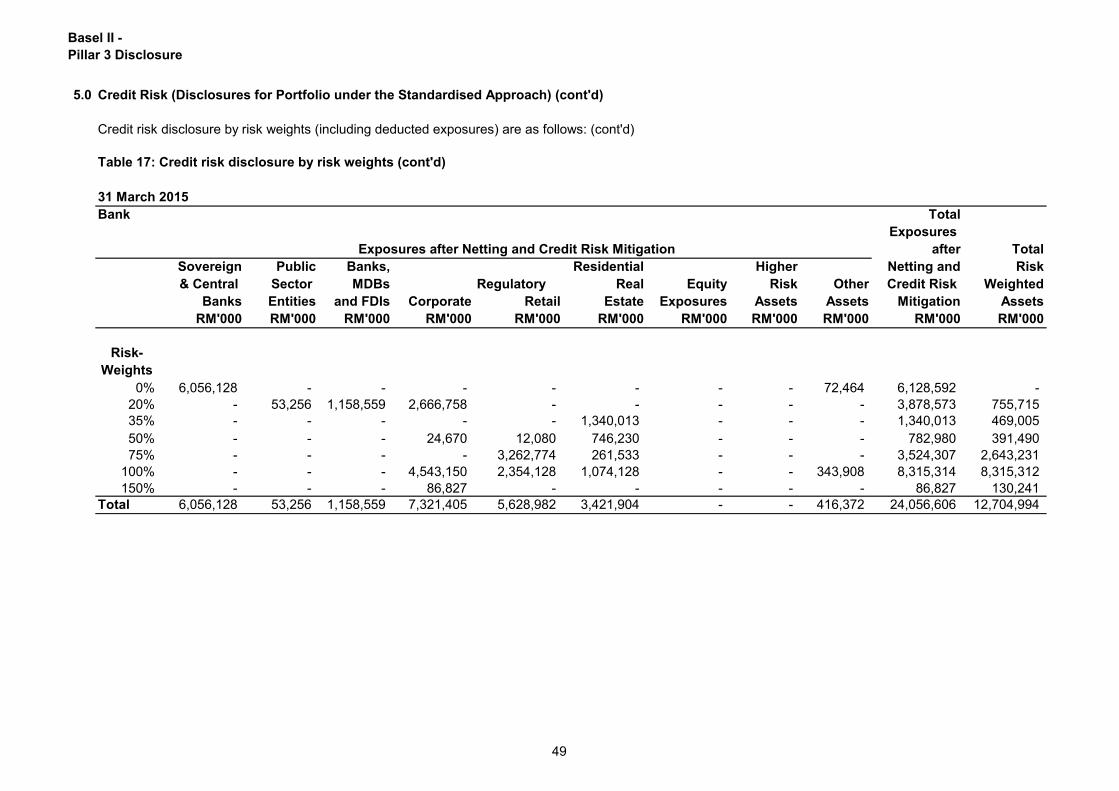
Basel II -
Pillar 3 Disclosure
5.0 Credit Risk (Disclosures for Portfolio under the Standardised Approach) (cont'd)
Credit risk disclosure by risk weights (including deducted exposures) are as follows: (cont'd)
Table 17: Credit risk disclosure by risk weights (cont'd)
31 March 2015
Bank Total
Exposures
after Total
Sovereign Public Banks, Residential Higher Netting and Risk
& Central Sector MDBs Regulatory Real Equity Risk Other Credit Risk Weighted
Banks Entities and FDIs Corporate Retail Estate Exposures Assets Assets Mitigation Assets
RM'000 RM'000 RM'000 RM'000 RM'000 RM'000 RM'000 RM'000 RM'000 RM'000 RM'000
Risk-
Weights
0% 6,056,128 - - - - - - - 72,464 6,128,592 -
20% - 53,256 1,158,559 2,666,758 - - - - - 3,878,573 755,715
35% - - - - - 1,340,013 - - - 1,340,013 469,005
50% - - - 24,670 12,080 746,230 - - - 782,980 391,490
75% - - - - 3,262,774 261,533 - - - 3,524,307 2,643,231
100% - - - 4,543,150 2,354,128 1,074,128 - - 343,908 8,315,314 8,315,312
150% - - - 86,827 - - - - - 86,827 130,241
Total 6,056,128 53,256 1,158,559 7,321,405 5,628,982 3,421,904 - - 416,372 24,056,606 12,704,994
Exposures after Netting and Credit Risk Mitigation
49
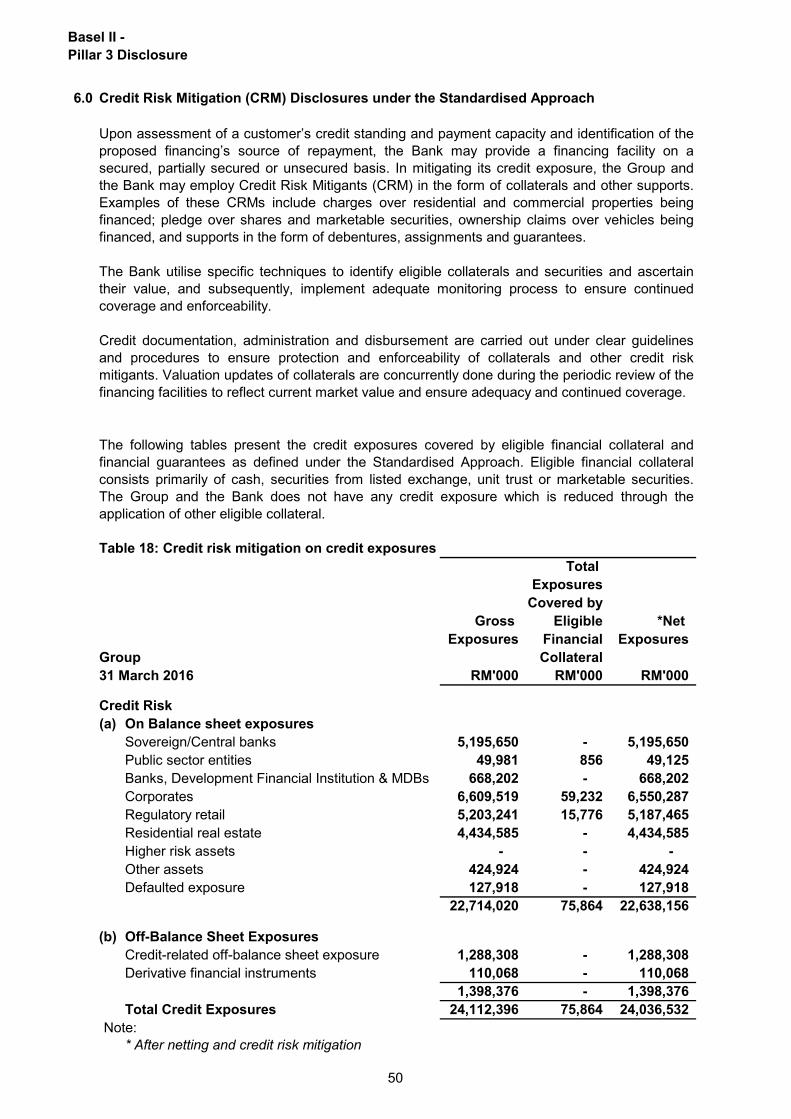
Basel II -
Pillar 3 Disclosure
6.0 Credit Risk Mitigation (CRM) Disclosures under the Standardised Approach
Table 18: Credit risk mitigation on credit exposures
Total
Exposures
Covered by
Gross Eligible *Net
Exposures Financial Exposures
Group Collateral
RM'000 RM'000 RM'000
Credit Risk
(a) On Balance sheet exposures
Sovereign/Central banks 5,195,650 - 5,195,650
Public sector entities 49,981 856 49,125
Banks, Development Financial Institution & MDBs 668,202 - 668,202
Corporates 6,609,519 59,232 6,550,287
Regulatory retail 5,203,241 15,776 5,187,465
Residential real estate 4,434,585 - 4,434,585
Higher risk assets - - -
Other assets 424,924 - 424,924
Defaulted exposure 127,918 - 127,918
22,714,020 75,864 22,638,156
(b) Off-Balance Sheet Exposures
Credit-related off-balance sheet exposure 1,288,308 - 1,288,308
Derivative financial instruments 110,068 - 110,068
1,398,376 - 1,398,376
Total Credit Exposures 24,112,396 75,864 24,036,532
Note:
* After netting and credit risk mitigation
The following tables present the credit exposures covered by eligible financial collateral and
financial guarantees as defined under the Standardised Approach. Eligible financial collateral
consists primarily of cash, securities from listed exchange, unit trust or marketable securities.
The Group and the Bank does not have any credit exposure which is reduced through the
application of other eligible collateral.
Upon assessment of a customer’s credit standing and payment capacity and identification of the
proposed financing’s source of repayment, the Bank may provide a financing facility on a
secured, partially secured or unsecured basis. In mitigating its credit exposure, the Group and
the Bank may employ Credit Risk Mitigants (CRM) in the form of collaterals and other supports.
Examples of these CRMs include charges over residential and commercial properties being
financed; pledge over shares and marketable securities, ownership claims over vehicles being
financed, and supports in the form of debentures, assignments and guarantees.
The Bank utilise specific techniques to identify eligible collaterals and securities and ascertain
their value, and subsequently, implement adequate monitoring process to ensure continued
coverage and enforceability.
Credit documentation, administration and disbursement are carried out under clear guidelines
and procedures to ensure protection and enforceability of collaterals and other credit risk
mitigants. Valuation updates of collaterals are concurrently done during the periodic review of the
financing facilities to reflect current market value and ensure adequacy and continued coverage.
31 March 2016
50
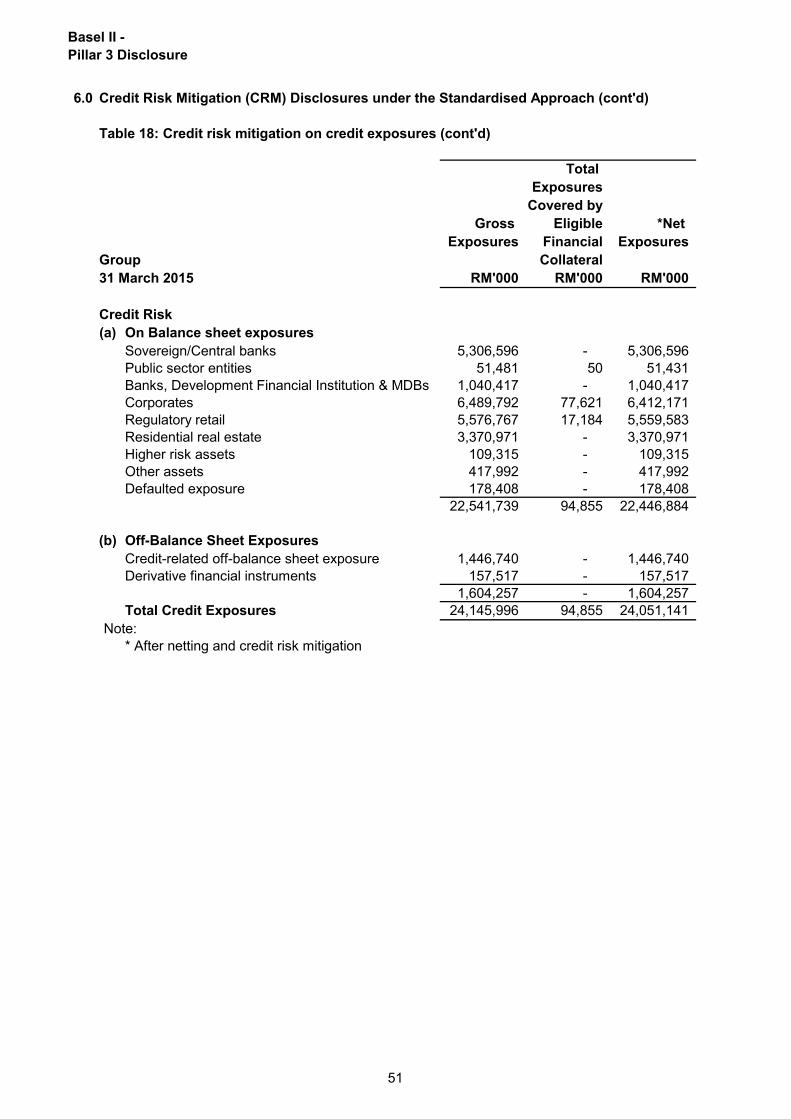
Basel II -
Pillar 3 Disclosure
6.0 Credit Risk Mitigation (CRM) Disclosures under the Standardised Approach (cont'd)
Table 18: Credit risk mitigation on credit exposures (cont'd)
Total
Exposures
Covered by
Gross Eligible *Net
Exposures Financial Exposures
Group Collateral
RM'000 RM'000 RM'000
Credit Risk
(a) On Balance sheet exposures
Sovereign/Central banks 5,306,596 - 5,306,596
Public sector entities 51,481 50 51,431
Banks, Development Financial Institution & MDBs 1,040,417 - 1,040,417
Corporates 6,489,792 77,621 6,412,171
Regulatory retail 5,576,767 17,184 5,559,583
Residential real estate 3,370,971 - 3,370,971
Higher risk assets 109,315 - 109,315
Other assets 417,992 - 417,992
Defaulted exposure 178,408 - 178,408
22,541,739 94,855 22,446,884
(b) Off-Balance Sheet Exposures
Credit-related off-balance sheet exposure 1,446,740 - 1,446,740
Derivative financial instruments 157,517 - 157,517
1,604,257 - 1,604,257
Total Credit Exposures 24,145,996 94,855 24,051,141
Note:
* After netting and credit risk mitigation
31 March 2015
51
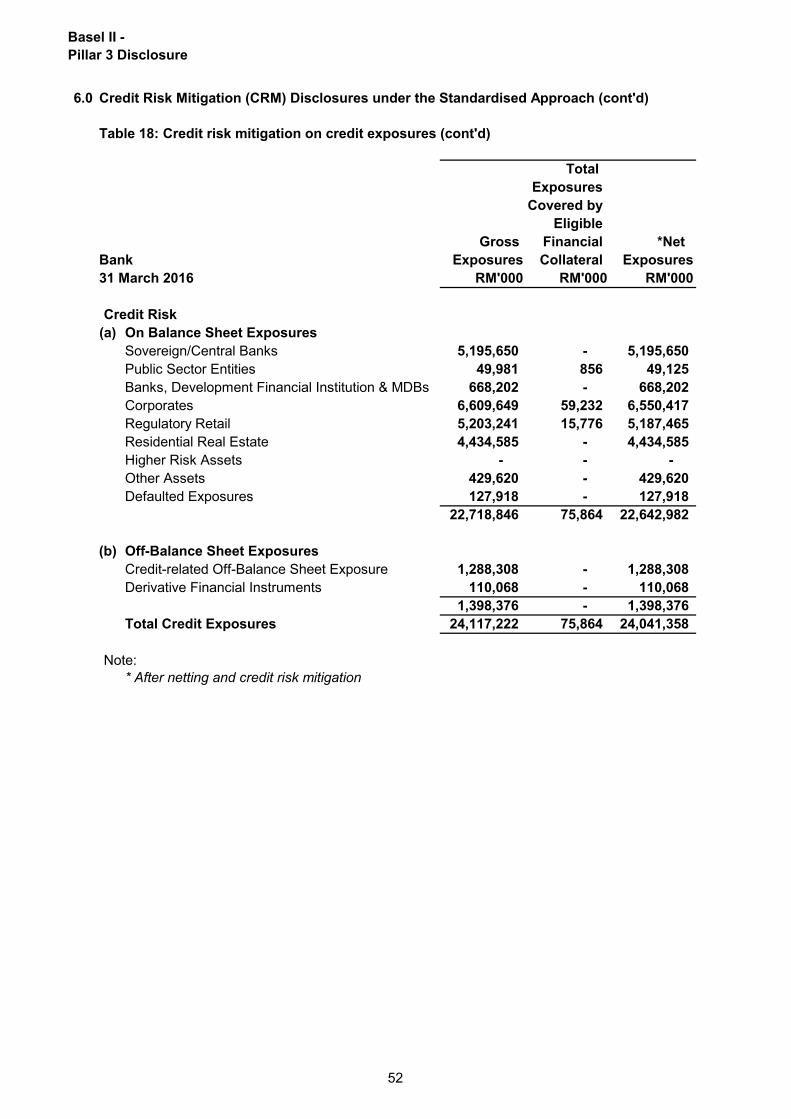
Basel II -
Pillar 3 Disclosure
6.0 Credit Risk Mitigation (CRM) Disclosures under the Standardised Approach (cont'd)
Table 18: Credit risk mitigation on credit exposures (cont'd)
Total
Exposures
Covered by
Eligible
Gross Financial *Net
Bank Exposures Collateral Exposures
RM'000 RM'000 RM'000
Credit Risk
(a) On Balance Sheet Exposures
Sovereign/Central Banks 5,195,650 - 5,195,650
Public Sector Entities 49,981 856 49,125
Banks, Development Financial Institution & MDBs 668,202 - 668,202
Corporates 6,609,649 59,232 6,550,417
Regulatory Retail 5,203,241 15,776 5,187,465
Residential Real Estate 4,434,585 - 4,434,585
Higher Risk Assets - - -
Other Assets 429,620 - 429,620
Defaulted Exposures 127,918 - 127,918
22,718,846 75,864 22,642,982
(b) Off-Balance Sheet Exposures
Credit-related Off-Balance Sheet Exposure 1,288,308 - 1,288,308
Derivative Financial Instruments 110,068 - 110,068
1,398,376 - 1,398,376
Total Credit Exposures 24,117,222 75,864 24,041,358
Note:
* After netting and credit risk mitigation
31 March 2016
52
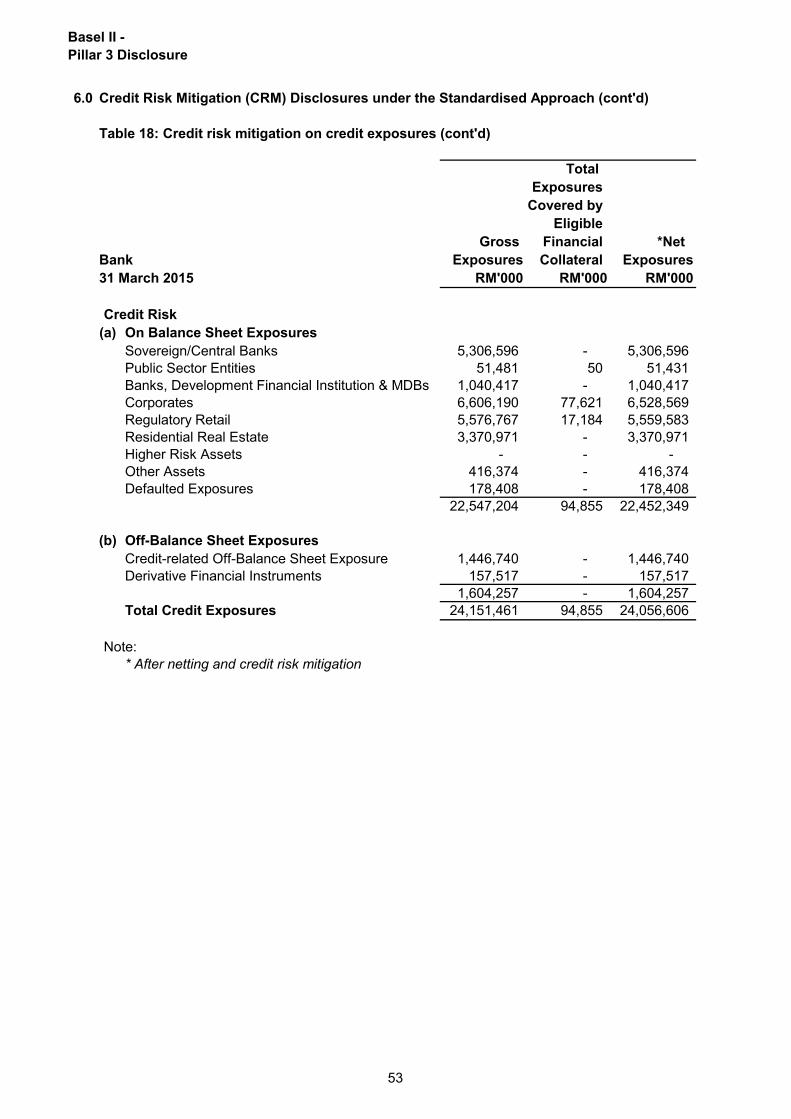
Basel II -
Pillar 3 Disclosure
6.0 Credit Risk Mitigation (CRM) Disclosures under the Standardised Approach (cont'd)
Table 18: Credit risk mitigation on credit exposures (cont'd)
Total
Exposures
Covered by
Eligible
Gross Financial *Net
Bank Exposures Collateral Exposures
RM'000 RM'000 RM'000
Credit Risk
(a) On Balance Sheet Exposures
Sovereign/Central Banks 5,306,596 - 5,306,596
Public Sector Entities 51,481 50 51,431
Banks, Development Financial Institution & MDBs 1,040,417 - 1,040,417
Corporates 6,606,190 77,621 6,528,569
Regulatory Retail 5,576,767 17,184 5,559,583
Residential Real Estate 3,370,971 - 3,370,971
Higher Risk Assets - - -
Other Assets 416,374 - 416,374
Defaulted Exposures 178,408 - 178,408
22,547,204 94,855 22,452,349
(b) Off-Balance Sheet Exposures
Credit-related Off-Balance Sheet Exposure 1,446,740 - 1,446,740
Derivative Financial Instruments 157,517 - 157,517
1,604,257 - 1,604,257
Total Credit Exposures 24,151,461 94,855 24,056,606
Note:
* After netting and credit risk mitigation
31 March 2015
53
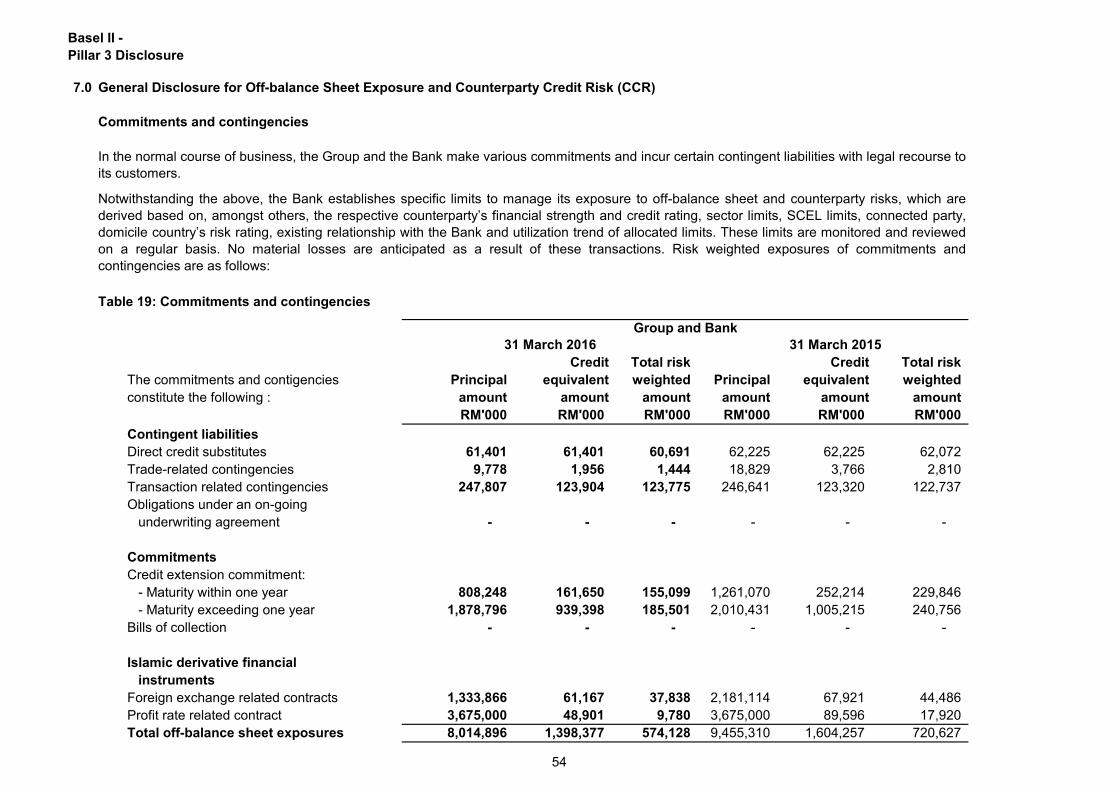
Basel II -
Pillar 3 Disclosure
7.0 General Disclosure for Off-balance Sheet Exposure and Counterparty Credit Risk (CCR)
Commitments and contingencies
Table 19: Commitments and contingencies
Credit Total risk Credit Total risk
The commitments and contigencies Principal equivalent weighted Principal equivalent weighted
constitute the following : amount amount amount amount amount amount
RM'000 RM'000 RM'000 RM'000 RM'000 RM'000
Contingent liabilities
Direct credit substitutes 61,401 61,401 60,691 62,225 62,225 62,072
Trade-related contingencies 9,778 1,956 1,444 18,829 3,766 2,810
Transaction related contingencies 247,807 123,904 123,775 246,641 123,320 122,737
Obligations under an on-going
underwriting agreement - - - - - -
Commitments
Credit extension commitment:
- Maturity within one year 808,248 161,650 155,099 1,261,070 252,214 229,846
- Maturity exceeding one year 1,878,796 939,398 185,501 2,010,431 1,005,215 240,756
Bills of collection - - - - - -
Islamic derivative financial
instruments
Foreign exchange related contracts 1,333,866 61,167 37,838 2,181,114 67,921 44,486
Profit rate related contract 3,675,000 48,901 9,780 3,675,000 89,596 17,920
Total off-balance sheet exposures 8,014,896 1,398,377 574,128 9,455,310 1,604,257 720,627
Group and Bank
31 March 2016 31 March 2015
In the normal course of business, the Group and the Bank make various commitments and incur certain contingent liabilities with legal recourse to
its customers.
Notwithstanding the above, the Bank establishes specific limits to manage its exposure to off-balance sheet and counterparty risks, which are
derived based on, amongst others, the respective counterparty’s financial strength and credit rating, sector limits, SCEL limits, connected party,
domicile country’s risk rating, existing relationship with the Bank and utilization trend of allocated limits. These limits are monitored and reviewed
on a regular basis. No material losses are anticipated as a result of these transactions. Risk weighted exposures of commitments and
contingencies are as follows:
54
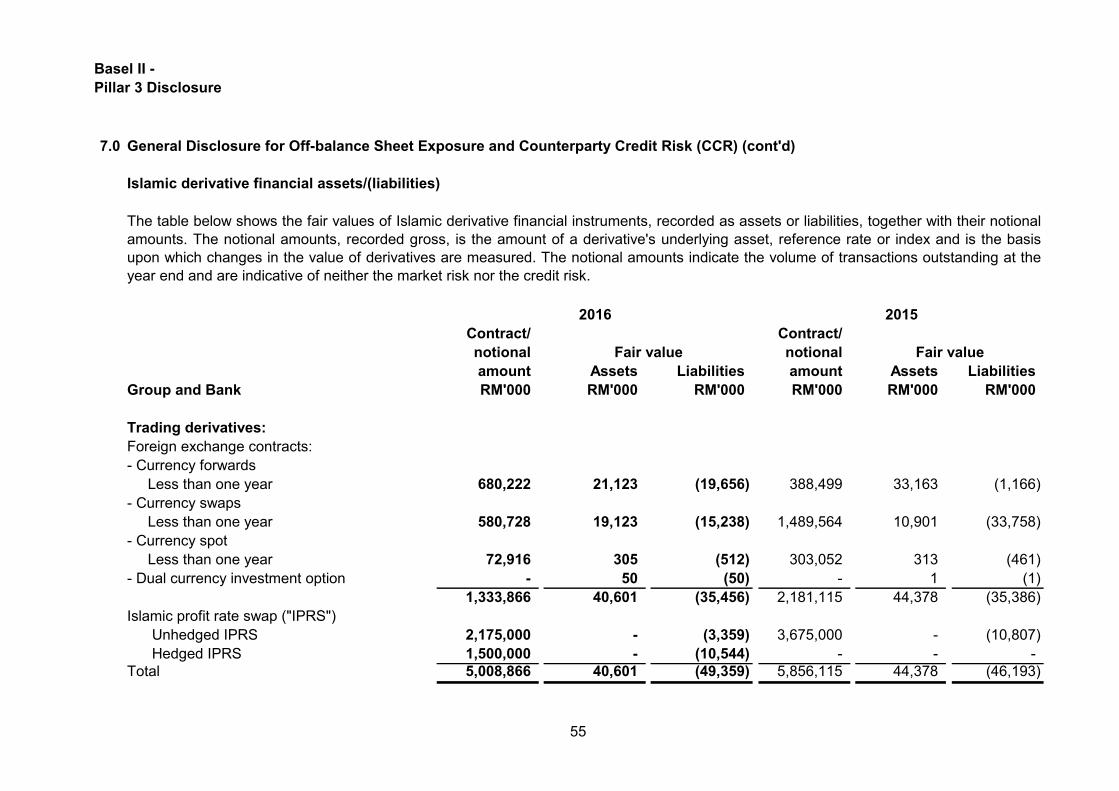
Basel II -
Pillar 3 Disclosure
7.0 General Disclosure for Off-balance Sheet Exposure and Counterparty Credit Risk (CCR) (cont'd)
Islamic derivative financial assets/(liabilities)
Contract/ Contract/
notional notional
amount Assets Liabilities amount Assets Liabilities
Group and Bank RM'000 RM'000 RM'000 RM'000 RM'000 RM'000
Trading derivatives:
Foreign exchange contracts:
- Currency forwards
Less than one year 680,222 21,123 (19,656) 388,499 33,163 (1,166)
- Currency swaps
Less than one year 580,728 19,123 (15,238) 1,489,564 10,901 (33,758)
- Currency spot
Less than one year 72,916 305 (512) 303,052 313 (461)
- Dual currency investment option - 50 (50) - 1 (1)
1,333,866 40,601 (35,456) 2,181,115 44,378 (35,386)
Islamic profit rate swap ("IPRS")
Unhedged IPRS 2,175,000 - (3,359) 3,675,000 - (10,807)
Hedged IPRS 1,500,000 - (10,544) - - -
Total 5,008,866 40,601 (49,359) 5,856,115 44,378 (46,193)
The table below shows the fair values of Islamic derivative financial instruments, recorded as assets or liabilities, together with their notional
amounts. The notional amounts, recorded gross, is the amount of a derivative's underlying asset, reference rate or index and is the basis
upon which changes in the value of derivatives are measured. The notional amounts indicate the volume of transactions outstanding at the
year end and are indicative of neither the market risk nor the credit risk.
2016 2015
Fair value Fair value
55
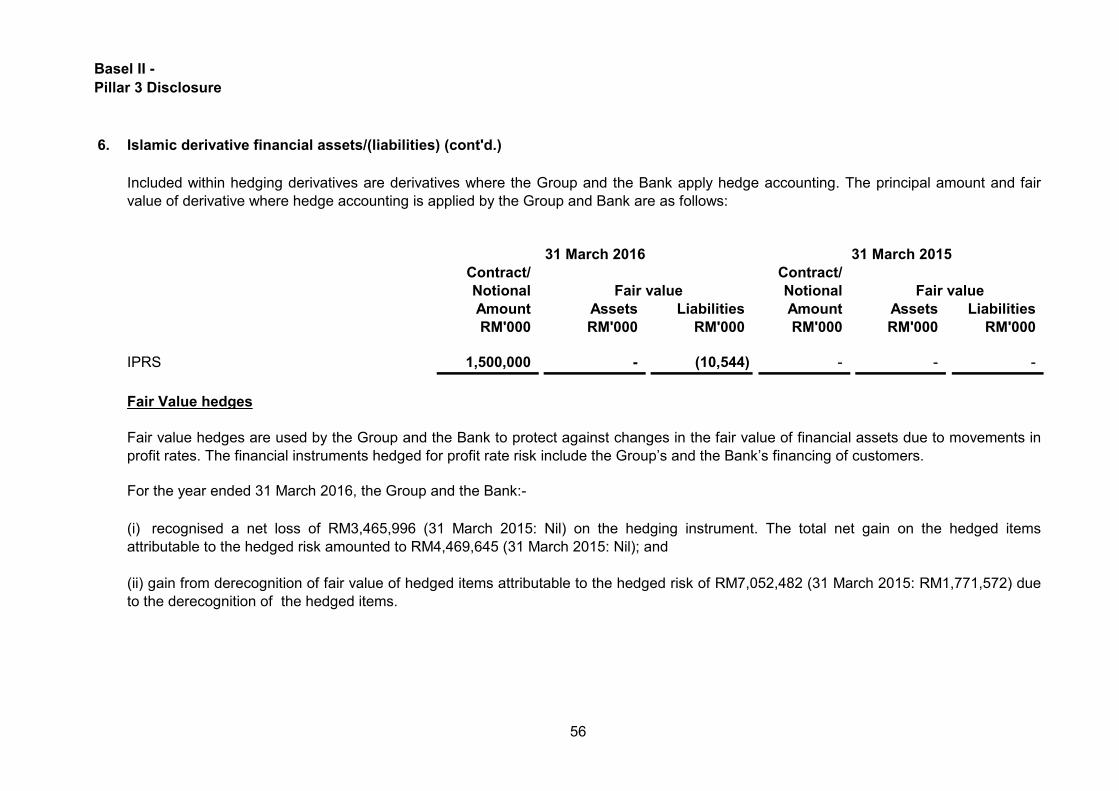
Basel II -
Pillar 3 Disclosure
6. Islamic derivative financial assets/(liabilities) (cont'd.)
Contract/ Contract/
Notional Notional
Amount Assets Liabilities Amount Assets Liabilities
RM'000 RM'000 RM'000 RM'000 RM'000 RM'000
IPRS 1,500,000 - (10,544) - - -
Fair Value hedges
For the year ended 31 March 2016, the Group and the Bank:-
Fair value hedges are used by the Group and the Bank to protect against changes in the fair value of financial assets due to movements in
profit rates. The financial instruments hedged for profit rate risk include the Group’s and the Bank’s financing of customers.
(i) recognised a net loss of RM3,465,996 (31 March 2015: Nil) on the hedging instrument. The total net gain on the hedged items
attributable to the hedged risk amounted to RM4,469,645 (31 March 2015: Nil); and
(ii) gain from derecognition of fair value of hedged items attributable to the hedged risk of RM7,052,482 (31 March 2015: RM1,771,572) due
to the derecognition of the hedged items.
Included within hedging derivatives are derivatives where the Group and the Bank apply hedge accounting. The principal amount and fair
value of derivative where hedge accounting is applied by the Group and Bank are as follows:
31 March 2016 31 March 2015
Fair value Fair value
56
Basel II -
Pillar 3 Disclosure
8.0
The Bank has formulated several strategies to effectively manage and ensure a sound balance sheet
profile that complements both regulatory and business requirements Among the strategies
implemented for FYE 2015/2016 were:
• Build-up of an Islamic Profit Rate Swap (IPRS) portfolio as part of the rate of return risk
management, where strategies have been outlined to optimize and hedge against market rate
movements;
• Establishment of a subordinated sukuk program as part of the Bank's contingency capital and
funding plan that focuses on strengthening the core and stable liquidity requirements as stipulated
in the Basel 3 and CAFIB guidelines;
• Concentrate more on sourcing for deposits from retail and SME customers, longer term retail
deposits, and deposits from transactional and operational accounts; and
• Review and enhancement of deposit products and features and introduction of more innovative
deposit and investment account products.
The Bank’s market risk management and ALM processes, which include risk identification,
measurement, mitigation, monitoring and reporting are guided by the Market Risk and ALM Policies
and Guidelines (“MRAPG”) and the Trading Book Policy Statement (“TBPS”).
The Bank defines and segregates its trading and banking book positions as outlined under the
Trading Book Policy Statement. The policy covers the definition of trading and banking book for
financial instruments, classification, performance and limit monitoring, position valuation and hedging
requirements.
Market Risk and Assets-Liability Management (ALM)
Market risk is defined as the risk of losses in on and off-balance sheet positions arising from
movements in market prices. Asset-Liability Management (ALM) refers to the coordinated
management of the Group’s and the Bank’s balance sheet, which includes assets, liabilities and
capital. The main focus of ALM is on the Group’s and the Bank’s overall performance that can be
measured in terms of net income. In turn, the primary determinant of net income will be the overall
risk-return position of the Group and the Bank.
The key objective of market risk management and ALM of the Bank is to manage and control market
risk exposures in order to optimise return on risk while maintaining a market profile that is consistent
with Bank's strategic and business plan.
The Bank’s market risk management and ALM objectives are to:
The Bank has an independent market risk control function that is responsible for measuring and
managing market risk exposures in accordance with the Board-approved policies and guidelines. The
unit reports to the ALCO Working Committee on a monthly basis, where issues on balance sheet and
capital management are proactively discussed and any recommendation and decision reached are
then escalated to the ERMC, BRMC and Board respectively.
• Ensure the implementation of an effective market risk management system in the Bank;
• Assume an appropriate balance between the level of risk and the level of return desired in order to
maximize the return to shareholders’ funds;
• Ensure prudent management of the Bank’s resources to support the growth of the Bank’s
economic value; and
• Proactively manage the Bank’s balance sheet in order to maximize earnings and attain its
strategic goal within the overall risk/return preferences.
57
Basel II -
Pillar 3 Disclosure
8.0
Market Risk Measurement
1. Value at Risk
2. Sensitivity Analysis
Valuation Policy
• Systems and Controls
• Valuation Methodologies
Level 1 - Quoted (unadjusted) market prices in active markets for identical instruments;
The Group and the Bank adhere to the minimum prudent valuation practices as stipulated in the
CAFIB and FRS139 guidelines. Based on these prudential requirements, broad internal guidelines
have been drawn out as summarized below:
Stress testing and scenario analyses are used as market risk and ALM tools for evaluation of
potential impact on the Bank’s performance under plausible extreme adverse conditions. The stress
testing include the assessment on the funding and market liquidity, rate of return risk, displaced
commercial risk and currency volatility.
The Group and the Bank have established and maintained adequate systems and controls to give the
management and supervisors the confidence that the valuation estimates are prudent and reliable.
There are three levels of fair value hierarchy applied to reflect the level of judgment involved in
estimating fair values. The hierarchy is as follows:
3. Stress Testing and Scenario Analyses
Value at Risk which includes the historical simulation is widely used by the Bank as a tool to measure
the risk of loss on a specific portfolio of financial assets, limit setting activities and market forecasting.
The Bank uses various methodologies in assessing the sensitivity of the Bank’s portfolio against
changes in the market variables.
Market Risk and Assets-Liability Management (ALM) (cont'd)
Level 2 - Valuation techniques for which the lowest level input that is significant to the fair value
measurement that is directly (i.e. prices) or indirectly (i.e. derived from prices), observable; and
Level 3 - Valuation techniques for which the lowest level input that is significant to the fair value
measurement is unobservable
58
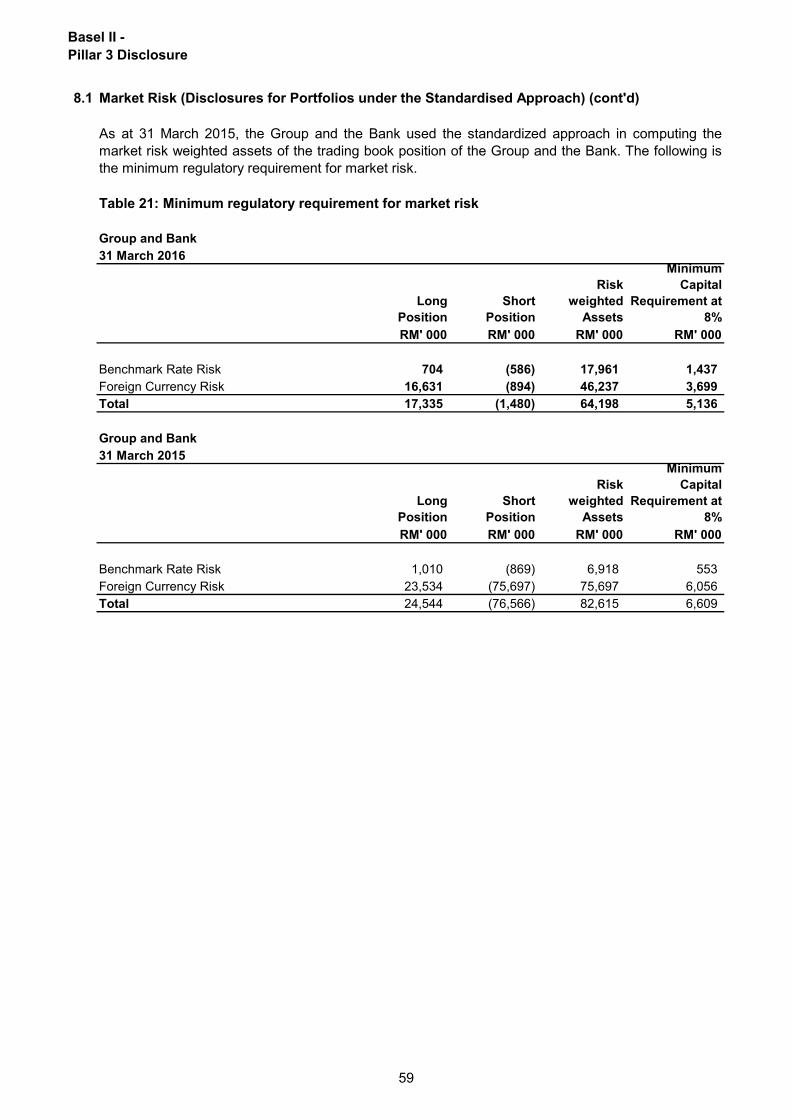
Basel II -
Pillar 3 Disclosure
8.1 Market Risk (Disclosures for Portfolios under the Standardised Approach) (cont'd)
Table 21: Minimum regulatory requirement for market risk
Group and Bank
31 March 2016
Long
Position
Short
Position
Risk
weighted
Assets
Minimum
Capital
Requirement at
8%
RM' 000 RM' 000 RM' 000 RM' 000
Benchmark Rate Risk 704 (586) 17,961 1,437
Foreign Currency Risk 16,631 (894) 46,237 3,699
Total 17,335 (1,480) 64,198 5,136
Group and Bank
31 March 2015
Long
Position
Short
Position
Risk
weighted
Assets
Minimum
Capital
Requirement at
8%
RM' 000 RM' 000 RM' 000 RM' 000
Benchmark Rate Risk 1,010 (869) 6,918 553
Foreign Currency Risk 23,534 (75,697) 75,697 6,056
Total 24,544 (76,566) 82,615 6,609
As at 31 March 2015, the Group and the Bank used the standardized approach in computing the
market risk weighted assets of the trading book position of the Group and the Bank. The following is
the minimum regulatory requirement for market risk.
59
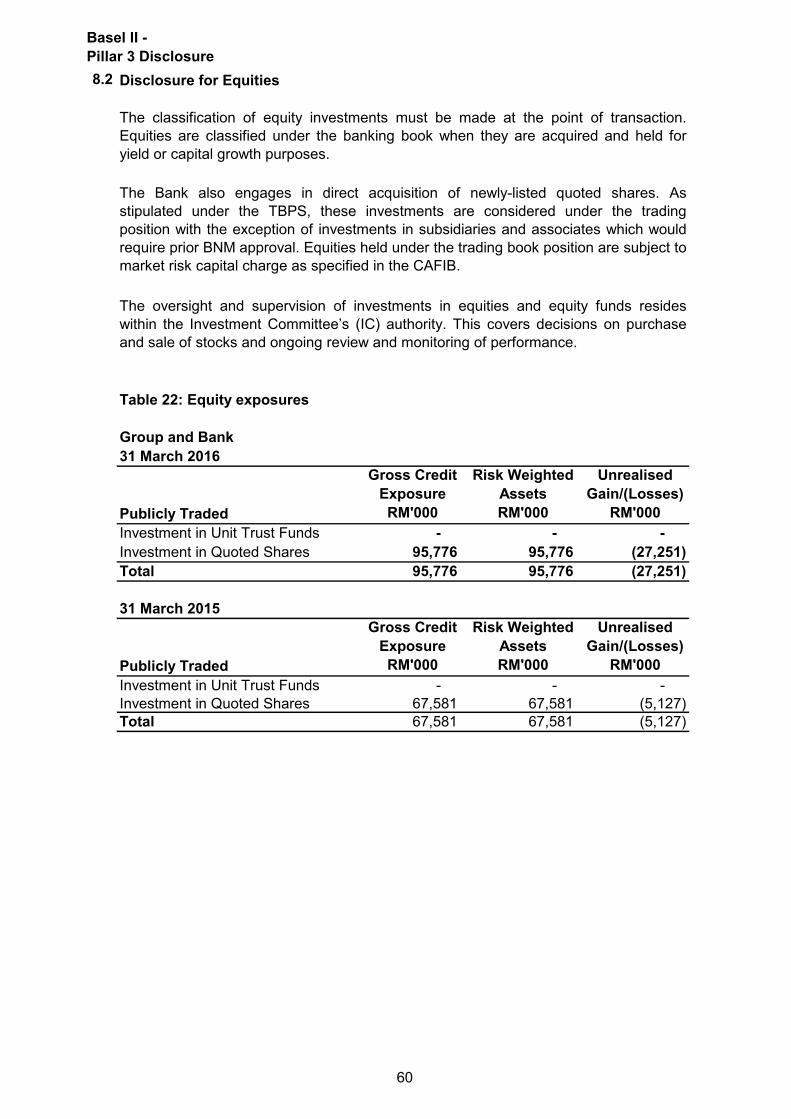
Basel II -
Pillar 3 Disclosure
8.2
Table 22: Equity exposures
Group and Bank
31 March 2016
Publicly Traded
Gross Credit
Exposure
RM'000
Risk Weighted
Assets
RM'000
Unrealised
Gain/(Losses)
RM'000
Investment in Unit Trust Funds - - -
Investment in Quoted Shares 95,776 95,776 (27,251)
Total 95,776 95,776 (27,251)
31 March 2015
Publicly Traded
Gross Credit
Exposure
RM'000
Risk Weighted
Assets
RM'000
Unrealised
Gain/(Losses)
RM'000
Investment in Unit Trust Funds - - -
Investment in Quoted Shares 67,581 67,581 (5,127)
Total 67,581 67,581 (5,127)
The classification of equity investments must be made at the point of transaction.
Equities are classified under the banking book when they are acquired and held for
yield or capital growth purposes.
The oversight and supervision of investments in equities and equity funds resides
within the Investment Committee’s (IC) authority. This covers decisions on purchase
and sale of stocks and ongoing review and monitoring of performance.
Disclosure for Equities
The Bank also engages in direct acquisition of newly-listed quoted shares. As
stipulated under the TBPS, these investments are considered under the trading
position with the exception of investments in subsidiaries and associates which would
require prior BNM approval. Equities held under the trading book position are subject to
market risk capital charge as specified in the CAFIB.
60
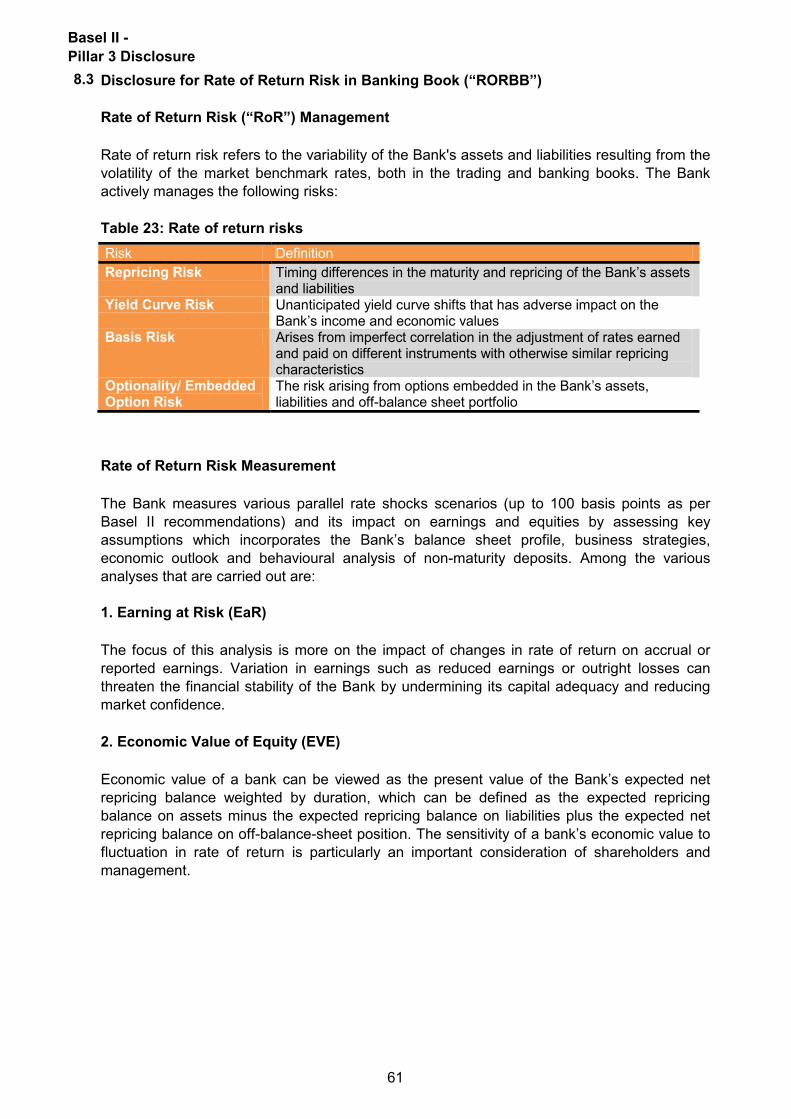
Basel II -
Pillar 3 Disclosure
8.3
Rate of Return Risk (“RoR”) Management
1. Earning at Risk (EaR)
2. Economic Value of Equity (EVE)
The Bank measures various parallel rate shocks scenarios (up to 100 basis points as per
Basel II recommendations) and its impact on earnings and equities by assessing key
assumptions which incorporates the Bank’s balance sheet profile, business strategies,
economic outlook and behavioural analysis of non-maturity deposits. Among the various
analyses that are carried out are:
The focus of this analysis is more on the impact of changes in rate of return on accrual or
reported earnings. Variation in earnings such as reduced earnings or outright losses can
threaten the financial stability of the Bank by undermining its capital adequacy and reducing
market confidence.
Economic value of a bank can be viewed as the present value of the Bank’s expected net
repricing balance weighted by duration, which can be defined as the expected repricing
balance on assets minus the expected repricing balance on liabilities plus the expected net
repricing balance on off-balance-sheet position. The sensitivity of a bank’s economic value to
fluctuation in rate of return is particularly an important consideration of shareholders and
management.
Rate of Return Risk Measurement
Disclosure for Rate of Return Risk in Banking Book (“RORBB”)
Rate of return risk refers to the variability of the Bank's assets and liabilities resulting from the
volatility of the market benchmark rates, both in the trading and banking books. The Bank
actively manages the following risks:
Table 23: Rate of return risks
Risk Definition
Repricing Risk Timing differences in the maturity and repricing of the Bank’s assets and liabilities
Yield Curve Risk Unanticipated yield curve shifts that has adverse impact on the Bank’s income and economic values
Basis Risk Arises from imperfect correlation in the adjustment of rates earned and paid on different instruments with otherwise similar repricing characteristics
Optionality/ Embedded Option Risk
The risk arising from options embedded in the Bank’s assets, liabilities and off-balance sheet portfolio
61
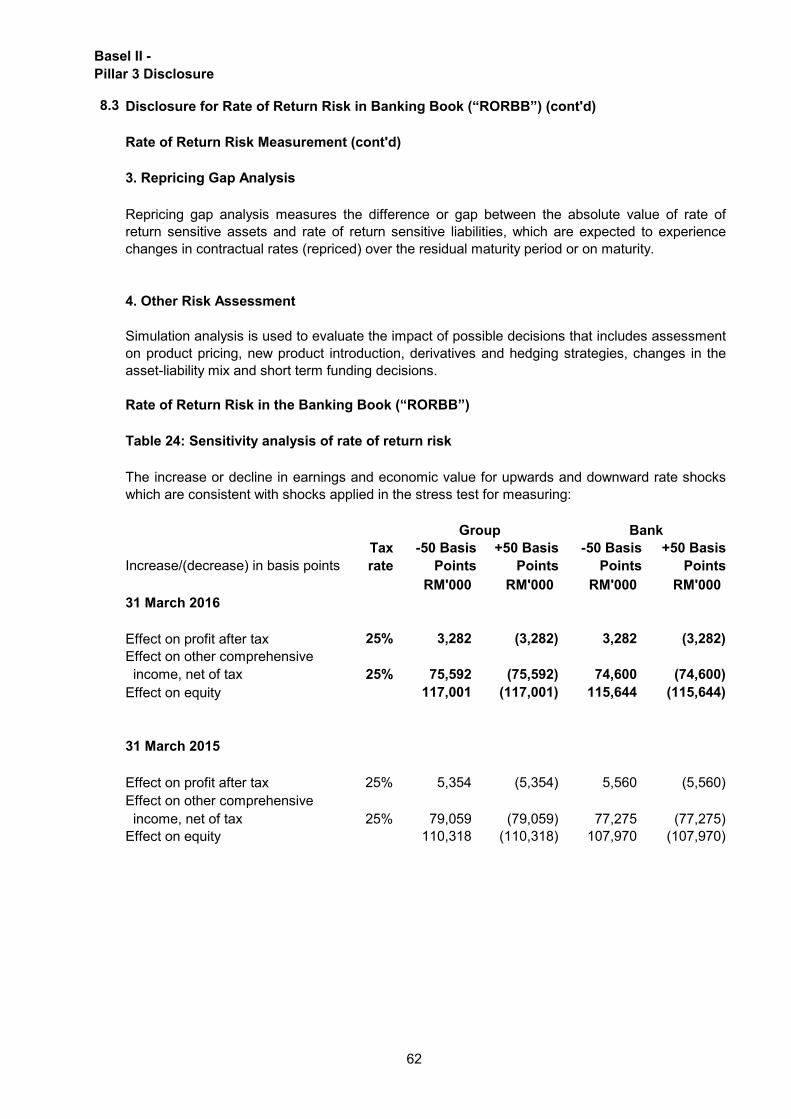
Basel II -
Pillar 3 Disclosure
8.3
3. Repricing Gap Analysis
Rate of Return Risk in the Banking Book (“RORBB”)
Table 24: Sensitivity analysis of rate of return risk
Increase/(decrease) in basis points
Tax
rate
-50 Basis
Points
+50 Basis
Points
-50 Basis
Points
+50 Basis
Points
RM'000 RM'000 RM'000 RM'000
31 March 2016
Effect on profit after tax 25% 3,282 (3,282) 3,282 (3,282)
Effect on other comprehensive
income, net of tax 25% 75,592 (75,592) 74,600 (74,600)
Effect on equity 117,001 (117,001) 115,644 (115,644)
31 March 2015
Effect on profit after tax 25% 5,354 (5,354) 5,560 (5,560)
Effect on other comprehensive
income, net of tax 25% 79,059 (79,059) 77,275 (77,275)
Effect on equity 110,318 (110,318) 107,970 (107,970)
Disclosure for Rate of Return Risk in Banking Book (“RORBB”) (cont'd)
The increase or decline in earnings and economic value for upwards and downward rate shocks
which are consistent with shocks applied in the stress test for measuring:
BankGroup
Rate of Return Risk Measurement (cont'd)
4. Other Risk Assessment
Repricing gap analysis measures the difference or gap between the absolute value of rate of
return sensitive assets and rate of return sensitive liabilities, which are expected to experience
changes in contractual rates (repriced) over the residual maturity period or on maturity.
Simulation analysis is used to evaluate the impact of possible decisions that includes assessment
on product pricing, new product introduction, derivatives and hedging strategies, changes in the
asset-liability mix and short term funding decisions.
62
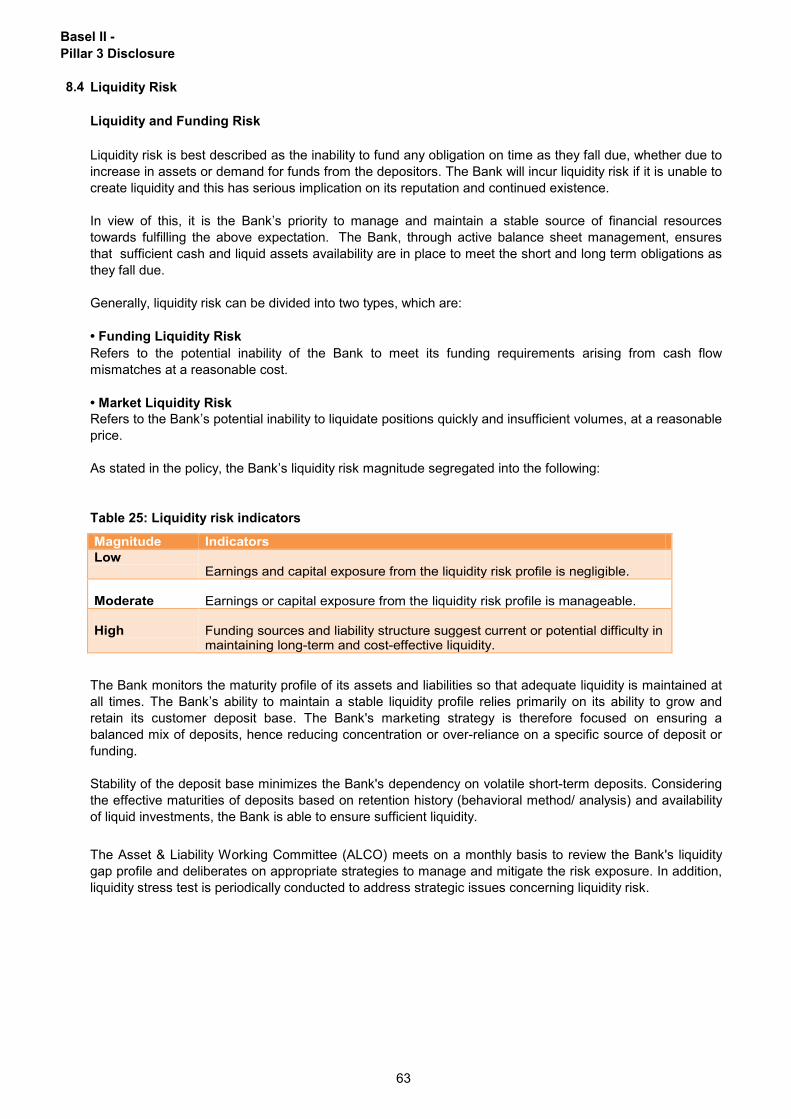
Basel II -
Pillar 3 Disclosure
8.4
Refers to the potential inability of the Bank to meet its funding requirements arising from cash flow
mismatches at a reasonable cost.
The Bank monitors the maturity profile of its assets and liabilities so that adequate liquidity is maintained at
all times. The Bank’s ability to maintain a stable liquidity profile relies primarily on its ability to grow and
retain its customer deposit base. The Bank's marketing strategy is therefore focused on ensuring a
balanced mix of deposits, hence reducing concentration or over-reliance on a specific source of deposit or
funding.
The Asset & Liability Working Committee (ALCO) meets on a monthly basis to review the Bank's liquidity
gap profile and deliberates on appropriate strategies to manage and mitigate the risk exposure. In addition,
liquidity stress test is periodically conducted to address strategic issues concerning liquidity risk.
Liquidity Risk
Liquidity and Funding Risk
Liquidity risk is best described as the inability to fund any obligation on time as they fall due, whether due to
increase in assets or demand for funds from the depositors. The Bank will incur liquidity risk if it is unable to
create liquidity and this has serious implication on its reputation and continued existence.
Stability of the deposit base minimizes the Bank's dependency on volatile short-term deposits. Considering
the effective maturities of deposits based on retention history (behavioral method/ analysis) and availability
of liquid investments, the Bank is able to ensure sufficient liquidity.
• Market Liquidity Risk
Refers to the Bank’s potential inability to liquidate positions quickly and insufficient volumes, at a reasonable
price.
As stated in the policy, the Bank’s liquidity risk magnitude segregated into the following:
Table 25: Liquidity risk indicators
In view of this, it is the Bank’s priority to manage and maintain a stable source of financial resources
towards fulfilling the above expectation. The Bank, through active balance sheet management, ensures
that sufficient cash and liquid assets availability are in place to meet the short and long term obligations as
they fall due.
Generally, liquidity risk can be divided into two types, which are:
• Funding Liquidity Risk
Magnitude Indicators
Low Earnings and capital exposure from the liquidity risk profile is negligible.
Moderate Earnings or capital exposure from the liquidity risk profile is manageable.
High Funding sources and liability structure suggest current or potential difficulty in maintaining long-term and cost-effective liquidity.
Contingency Level
Trigger / Status
Level 0 Business as usual
Level 1 Material change in funding risk, internal or external environment
Level 2 Increasing probability of liquidity crisis – ERMC to invoke contingency plan
Level 3 Liquidity crisis – escalated to BRMC for immediate actions
With effect
from 1-Jun-15 1-Jan-16 1-Jan-17 1-Jan-18
1 January
2019 and
thereafter
Minimum
LCR 60% 70% 80% 90% 100%
63
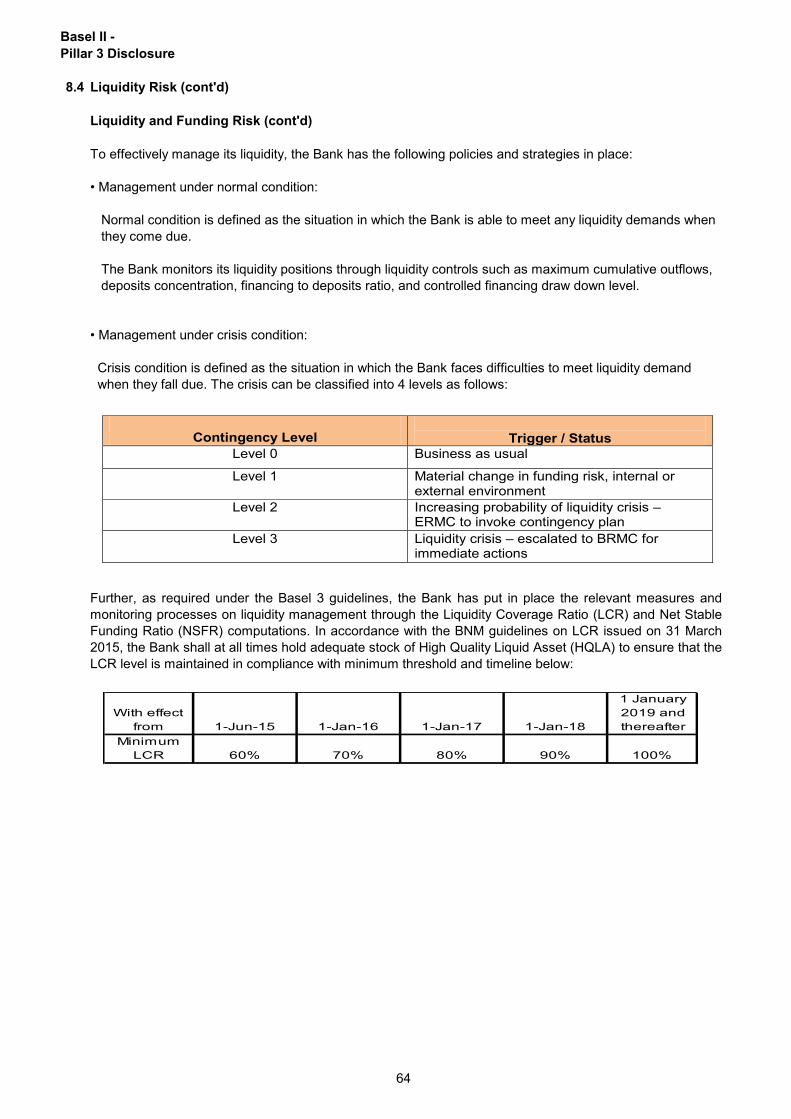
Basel II -
Pillar 3 Disclosure
8.4
To effectively manage its liquidity, the Bank has the following policies and strategies in place:
Further, as required under the Basel 3 guidelines, the Bank has put in place the relevant measures and
monitoring processes on liquidity management through the Liquidity Coverage Ratio (LCR) and Net Stable
Funding Ratio (NSFR) computations. In accordance with the BNM guidelines on LCR issued on 31 March
2015, the Bank shall at all times hold adequate stock of High Quality Liquid Asset (HQLA) to ensure that the
LCR level is maintained in compliance with minimum threshold and timeline below:
• Management under normal condition:
Normal condition is defined as the situation in which the Bank is able to meet any liquidity demands when
they come due.
The Bank monitors its liquidity positions through liquidity controls such as maximum cumulative outflows,
deposits concentration, financing to deposits ratio, and controlled financing draw down level.
• Management under crisis condition:
Crisis condition is defined as the situation in which the Bank faces difficulties to meet liquidity demand
when they fall due. The crisis can be classified into 4 levels as follows:
Liquidity Risk (cont'd)
Liquidity and Funding Risk (cont'd)
Magnitude Indicators
Low Earnings and capital exposure from the liquidity risk profile is negligible.
Moderate Earnings or capital exposure from the liquidity risk profile is manageable.
High Funding sources and liability structure suggest current or potential difficulty in maintaining long-term and cost-effective liquidity.
Contingency Level
Trigger / Status
Level 0 Business as usual
Level 1 Material change in funding risk, internal or external environment
Level 2 Increasing probability of liquidity crisis – ERMC to invoke contingency plan
Level 3 Liquidity crisis – escalated to BRMC for immediate actions
With effect
from 1-Jun-15 1-Jan-16 1-Jan-17 1-Jan-18
1 January
2019 and
thereafter
Minimum
LCR 60% 70% 80% 90% 100%
64
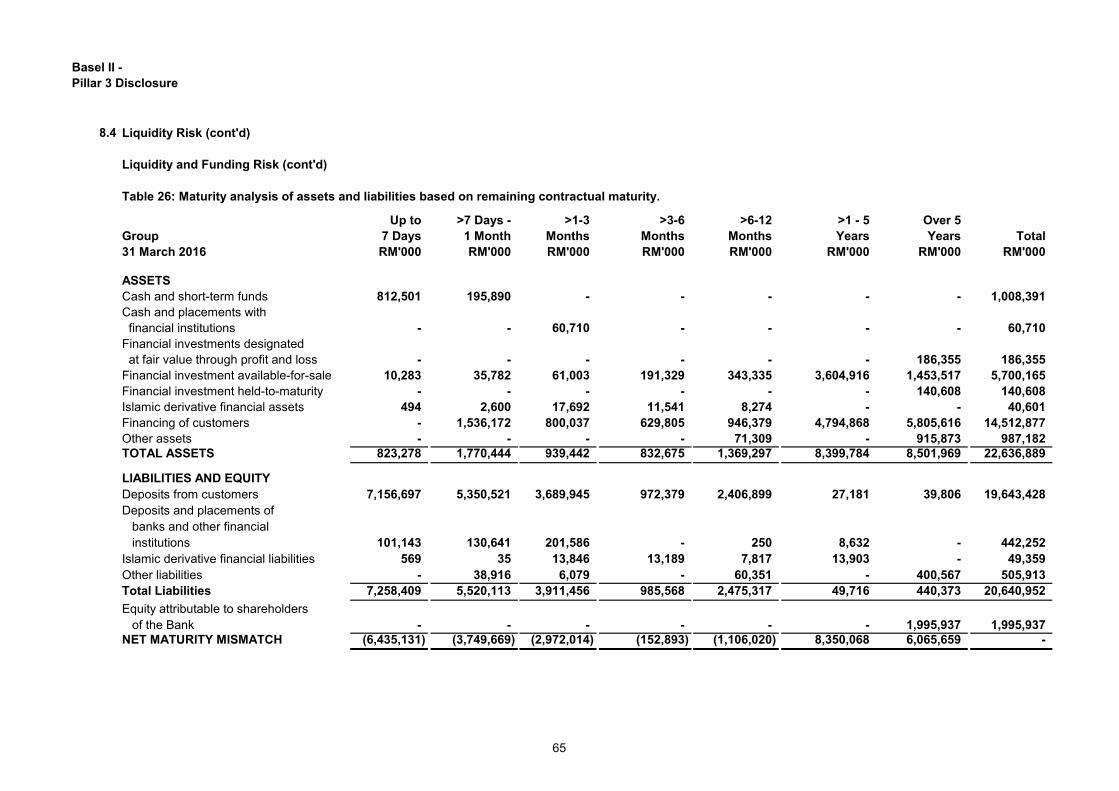
Basel II -
Pillar 3 Disclosure
8.4
Liquidity and Funding Risk (cont'd)
Table 26: Maturity analysis of assets and liabilities based on remaining contractual maturity.
Up to >7 Days - >1-3 >3-6 >6-12 >1 - 5 Over 5
Group 7 Days 1 Month Months Months Months Years Years Total
31 March 2016 RM'000 RM'000 RM'000 RM'000 RM'000 RM'000 RM'000 RM'000
ASSETS
Cash and short-term funds 812,501 195,890 - - - - - 1,008,391
Cash and placements with
financial institutions - - 60,710 - - - - 60,710
Financial investments designated
at fair value through profit and loss - - - - - - 186,355 186,355
Financial investment available-for-sale 10,283 35,782 61,003 191,329 343,335 3,604,916 1,453,517 5,700,165
Financial investment held-to-maturity - - - - - - 140,608 140,608
Islamic derivative financial assets 494 2,600 17,692 11,541 8,274 - - 40,601
Financing of customers - 1,536,172 800,037 629,805 946,379 4,794,868 5,805,616 14,512,877
Other assets - - - - 71,309 - 915,873 987,182
TOTAL ASSETS 823,278 1,770,444 939,442 832,675 1,369,297 8,399,784 8,501,969 22,636,889
LIABILITIES AND EQUITY
Deposits from customers 7,156,697 5,350,521 3,689,945 972,379 2,406,899 27,181 39,806 19,643,428
Deposits and placements of
banks and other financial
institutions 101,143 130,641 201,586 - 250 8,632 - 442,252
Islamic derivative financial liabilities 569 35 13,846 13,189 7,817 13,903 - 49,359
Other liabilities - 38,916 6,079 - 60,351 - 400,567 505,913
Total Liabilities 7,258,409 5,520,113 3,911,456 985,568 2,475,317 49,716 440,373 20,640,952
Equity attributable to shareholders
of the Bank - - - - - - 1,995,937 1,995,937
NET MATURITY MISMATCH (6,435,131) (3,749,669) (2,972,014) (152,893) (1,106,020) 8,350,068 6,065,659 -
Liquidity Risk (cont'd)
65
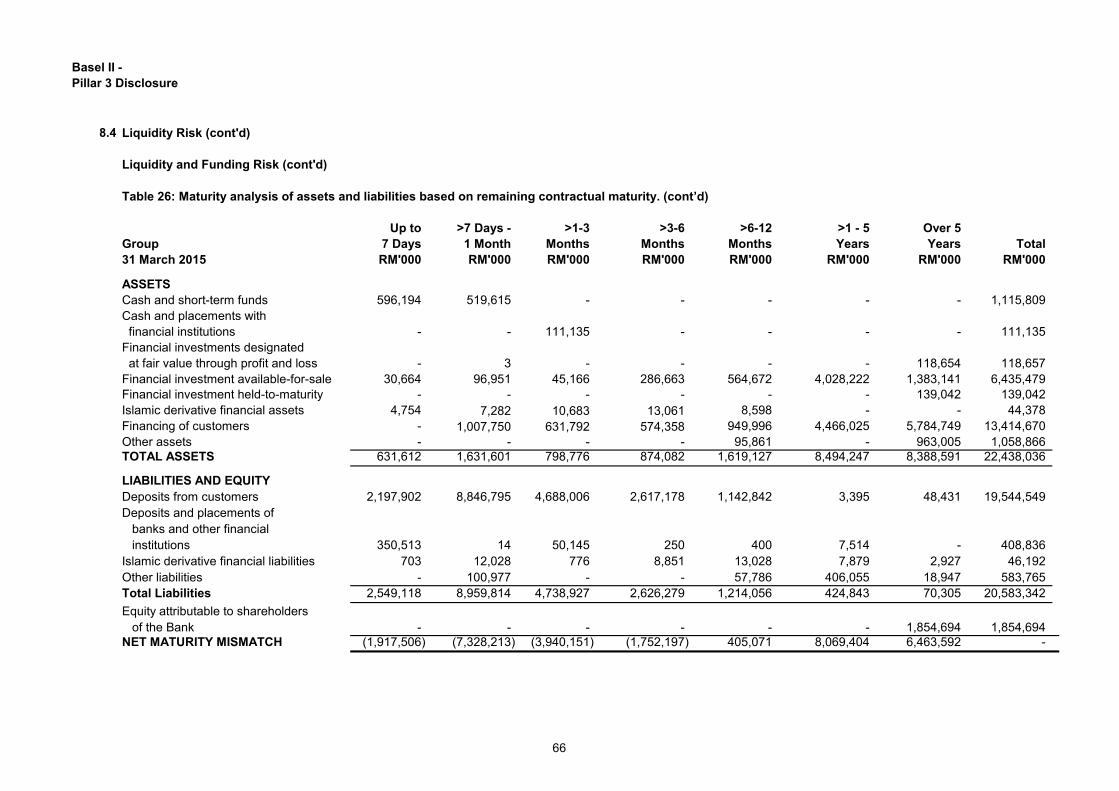
Basel II -
Pillar 3 Disclosure
8.4
Liquidity and Funding Risk (cont'd)
Table 26: Maturity analysis of assets and liabilities based on remaining contractual maturity. (cont’d)
Up to >7 Days - >1-3 >3-6 >6-12 >1 - 5 Over 5
Group 7 Days 1 Month Months Months Months Years Years Total
31 March 2015 RM'000 RM'000 RM'000 RM'000 RM'000 RM'000 RM'000 RM'000
ASSETS
Cash and short-term funds 596,194 519,615 - - - - - 1,115,809
Cash and placements with
financial institutions - - 111,135 - - - - 111,135
Financial investments designated
at fair value through profit and loss - 3 - - - - 118,654 118,657
Financial investment available-for-sale 30,664 96,951 45,166 286,663 564,672 4,028,222 1,383,141 6,435,479
Financial investment held-to-maturity - - - - - - 139,042 139,042
Islamic derivative financial assets 4,754 7,282 10,683 13,061 8,598 - - 44,378
Financing of customers - 1,007,750 631,792 574,358 949,996 4,466,025 5,784,749 13,414,670
Other assets - - - - 95,861 - 963,005 1,058,866
TOTAL ASSETS 631,612 1,631,601 798,776 874,082 1,619,127 8,494,247 8,388,591 22,438,036
LIABILITIES AND EQUITY
Deposits from customers 2,197,902 8,846,795 4,688,006 2,617,178 1,142,842 3,395 48,431 19,544,549
Deposits and placements of
banks and other financial
institutions 350,513 14 50,145 250 400 7,514 - 408,836
Islamic derivative financial liabilities 703 12,028 776 8,851 13,028 7,879 2,927 46,192
Other liabilities - 100,977 - - 57,786 406,055 18,947 583,765
Total Liabilities 2,549,118 8,959,814 4,738,927 2,626,279 1,214,056 424,843 70,305 20,583,342
Equity attributable to shareholders
of the Bank - - - - - - 1,854,694 1,854,694
NET MATURITY MISMATCH (1,917,506) (7,328,213) (3,940,151) (1,752,197) 405,071 8,069,404 6,463,592 -
Liquidity Risk (cont'd)
66
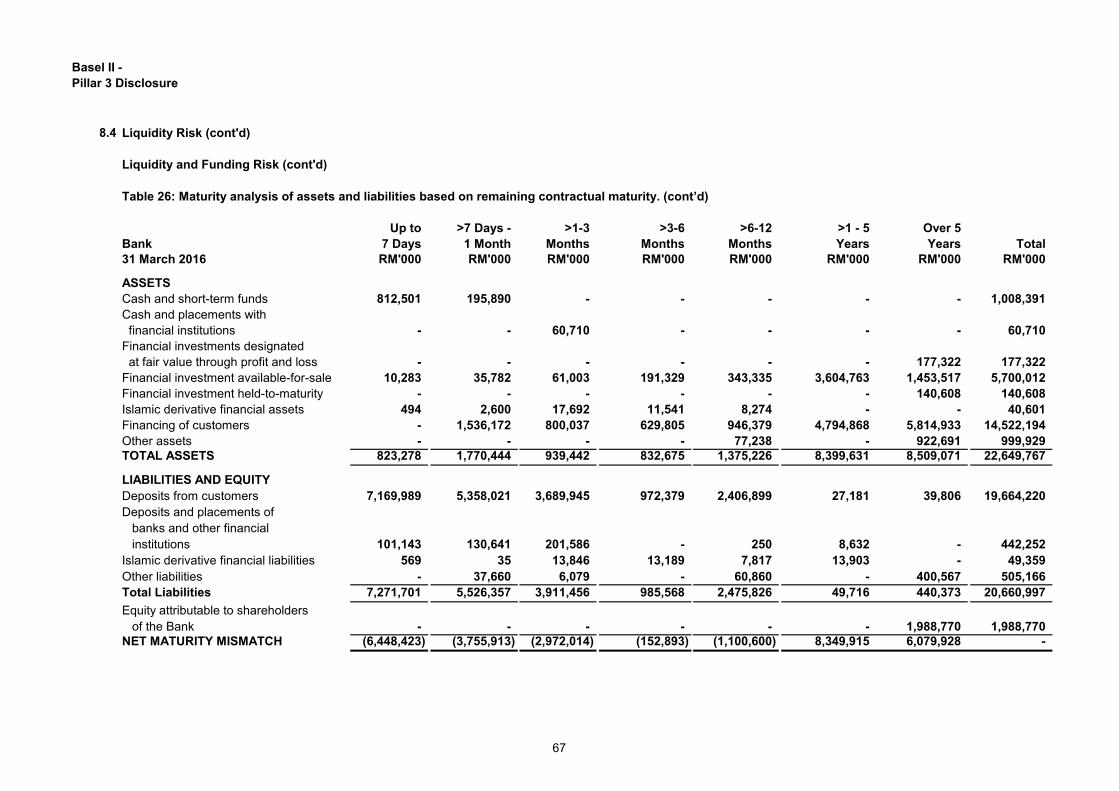
Basel II -
Pillar 3 Disclosure
8.4
Liquidity and Funding Risk (cont'd)
Table 26: Maturity analysis of assets and liabilities based on remaining contractual maturity. (cont’d)
Up to >7 Days - >1-3 >3-6 >6-12 >1 - 5 Over 5
Bank 7 Days 1 Month Months Months Months Years Years Total
31 March 2016 RM'000 RM'000 RM'000 RM'000 RM'000 RM'000 RM'000 RM'000
ASSETS
Cash and short-term funds 812,501 195,890 - - - - - 1,008,391
Cash and placements with
financial institutions - - 60,710 - - - - 60,710
Financial investments designated
at fair value through profit and loss - - - - - - 177,322 177,322
Financial investment available-for-sale 10,283 35,782 61,003 191,329 343,335 3,604,763 1,453,517 5,700,012
Financial investment held-to-maturity - - - - - - 140,608 140,608
Islamic derivative financial assets 494 2,600 17,692 11,541 8,274 - - 40,601
Financing of customers - 1,536,172 800,037 629,805 946,379 4,794,868 5,814,933 14,522,194
Other assets - - - - 77,238 - 922,691 999,929
TOTAL ASSETS 823,278 1,770,444 939,442 832,675 1,375,226 8,399,631 8,509,071 22,649,767
LIABILITIES AND EQUITY
Deposits from customers 7,169,989 5,358,021 3,689,945 972,379 2,406,899 27,181 39,806 19,664,220
Deposits and placements of
banks and other financial
institutions 101,143 130,641 201,586 - 250 8,632 - 442,252
Islamic derivative financial liabilities 569 35 13,846 13,189 7,817 13,903 - 49,359
Other liabilities - 37,660 6,079 - 60,860 - 400,567 505,166
Total Liabilities 7,271,701 5,526,357 3,911,456 985,568 2,475,826 49,716 440,373 20,660,997
Equity attributable to shareholders
of the Bank - - - - - - 1,988,770 1,988,770
NET MATURITY MISMATCH (6,448,423) (3,755,913) (2,972,014) (152,893) (1,100,600) 8,349,915 6,079,928 -
Liquidity Risk (cont'd)
67
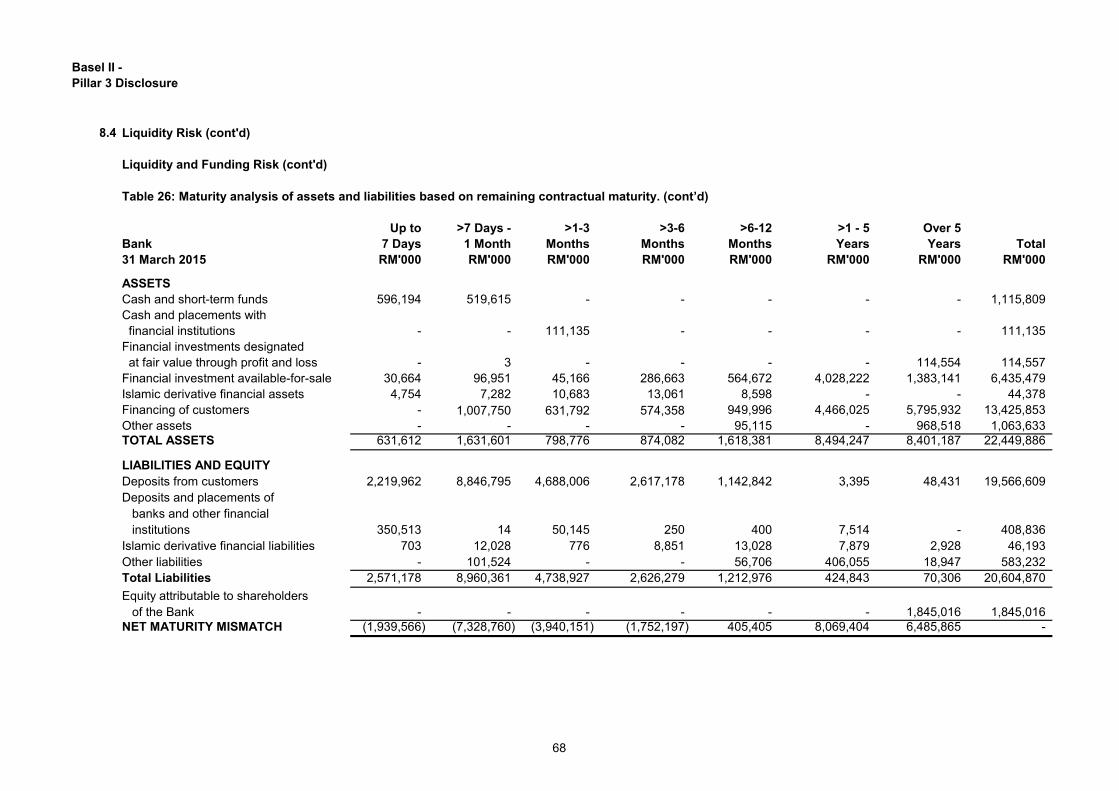
Basel II -
Pillar 3 Disclosure
8.4
Liquidity and Funding Risk (cont'd)
Table 26: Maturity analysis of assets and liabilities based on remaining contractual maturity. (cont’d)
Up to >7 Days - >1-3 >3-6 >6-12 >1 - 5 Over 5
Bank 7 Days 1 Month Months Months Months Years Years Total
31 March 2015 RM'000 RM'000 RM'000 RM'000 RM'000 RM'000 RM'000 RM'000
ASSETS
Cash and short-term funds 596,194 519,615 - - - - - 1,115,809
Cash and placements with
financial institutions - - 111,135 - - - - 111,135
Financial investments designated
at fair value through profit and loss - 3 - - - - 114,554 114,557
Financial investment available-for-sale 30,664 96,951 45,166 286,663 564,672 4,028,222 1,383,141 6,435,479
Islamic derivative financial assets 4,754 7,282 10,683 13,061 8,598 - - 44,378
Financing of customers - 1,007,750 631,792 574,358 949,996 4,466,025 5,795,932 13,425,853
Other assets - - - - 95,115 - 968,518 1,063,633
TOTAL ASSETS 631,612 1,631,601 798,776 874,082 1,618,381 8,494,247 8,401,187 22,449,886
LIABILITIES AND EQUITY
Deposits from customers 2,219,962 8,846,795 4,688,006 2,617,178 1,142,842 3,395 48,431 19,566,609
Deposits and placements of
banks and other financial
institutions 350,513 14 50,145 250 400 7,514 - 408,836
Islamic derivative financial liabilities 703 12,028 776 8,851 13,028 7,879 2,928 46,193
Other liabilities - 101,524 - - 56,706 406,055 18,947 583,232
Total Liabilities 2,571,178 8,960,361 4,738,927 2,626,279 1,212,976 424,843 70,306 20,604,870
Equity attributable to shareholders
of the Bank - - - - - - 1,845,016 1,845,016
NET MATURITY MISMATCH (1,939,566) (7,328,760) (3,940,151) (1,752,197) 405,405 8,069,404 6,485,865 -
Liquidity Risk (cont'd)
68
Basel II -
Pillar 3 Disclosure
9.0 Operational Risk Management(“ORM”) Disclosures
Operational risk is defined as the risk of losses resulting from inadequate or failed internal
processes and systems, human factors, and/or from various external events. The objective of
operational risk management therefore is to effectively manage these risks to minimize possible
financial and non-financial losses.
The management of operational risks is targeted at preventing risk events and damages, proper
handling of critical situations and mitigating potential losses. These are achieved partly by
instituting appropriate process and management controls and implementing clear and
comprehensive contingency plans and business continuity management (BCM).
The risk management processes and controls are established in line with the Bank's own
operational risks while relying on relevant guidelines, regulatory requirements and standard
market practices as guidance and benchmarks. By establishing and operating a system of control
procedures that commensurate with its risks, the Bank limits its exposure to an acceptable level in
accordance with its risk appetite.
The Muamalat Operational Risk Solution (MORiS)
The MORiS is a newly implemented web based application that is used as a tool in risk
identification and assessment, acts as a centralized loss incidents database and tracks risk
exposures against established key risk indicators (KRI) overtime.
Its objective is to improve monitoring and reporting for branches and departments through Risk &
Control Self-Assessment (RCSA), Incident Management Data Collection (IMDC) and Key Risk
Indicator (KRI). The scope of application is primarily intended to be used for management of
operational risk and in time, it will become a single point of entry to aggregate and present the
Directorial Dashboard covering the key areas of risk management.
69
Basel II -
Pillar 3 Disclosure
9.0 Operational Risk Management(“ORM”) Disclosures (cont'd)
Business Continuity Management (BCM)
BCM Methodology
ORM Minimum Capital Requirement
Table 27: ORM minimum capital requirement
Risk
Weighted
Assets
Minimum
Capital
Requirement
at 8%
Risk
Weighted
Assets
Minimum
Capital
Requireme
nt
at 8%
RM’000 RM’000 RM’000 RM’000
Group 1,078,204 86,256 1,052,745 84,220
Bank 1,062,151 84,972 1,041,853 83,348
31 March 2016 31 March 2015
The Group and the Bank adopt the Basic Indicator Approach (BIA) to determine the minimum
capital requirement for its operational risk. Under this approach, the Group and the Bank set aside
a fixed percentage (α or alpha factor) of 15% of positive annual average gross income, averaged
over the previous three years. The Group and the Bank minimum capital is presented in table
below:
The Group and the Bank adopt the Bank Negara Malaysia Guidelines on Business Continuity
Management, which entails enterprise-wide planning and arrangements of key resources and
procedures that enable the Bank to respond and continue to operate critical business functions
across a broad spectrum of interruptions to business, arising from internal or external events.
The Bank prepares the Business Units BCP by completing the Risk Assessment (RA) and the
Business Impact Analysis (BIA). RA is a tool used to identify the potential threat on all business
function. A BIA will be carried out to identify critical business functions recovery time objective
(RTO) and maximum tolerable downtime (MTD) resources and infrastructure of the institution. RA
and BIA session is being conducted annually with business units.
70
Basel II -
Pillar 3 Disclosure
10.0 Shariah Governance Disclosures
Overview
Shariah Governance Structure
Internal Shariah Control
BMMB's shariah governance structure is governed by BNM’s guidelines on "Shariah
Governance Framework for Islamic Financial Institutions (IFIs)", and any related
guidelines issued by the authorities, subject to any variation and amendments from time to
time.
Shariah governance system as defined by The IFSB Guiding Principles on Shariah
Governance System on Institutions Offering Islamic Financial Services (IFSB-10) refers to
a set of institutional and organizational arrangements to oversee Shariah compliance
aspects in IFIs.
Shariah compliance management is driven top down from the BOD through Shariah
Committee (“SC”), who has the responsibility of understanding the Shariah related matters
in the activities assumed by the Group and the Bank.
The Group and the Bank shall realign its Shariah Management & Compliance
organisational responsibilities with the objective of ensuring a single view of risks across
the Group and the Bank and putting in place capabilities for an integrated compliance
management. The SC function independently and shall ensure the integration of
compliance management.
To ensure that the Group’s and the Bank’s compliance management functions are able to
provide an independent evaluation of its overall business decision and strategies, the
functions are segregated to the business operating units.
In this context, Shariah non-compliance risk defined as “The risk that arises from the
Group’s and the Bank’s failure to comply with the Shariah rules and principles determined
by the Shariah Committee (SC) of BMMB and relevant Shariah Authorities (SA)
committees."
This risk is managed through the Shariah Governance Framework ("the Framework"),
which is endorsed by the Shariah Committee and approved by the Board. The Framework
is drawn up inaccordance to the Shariah Governance Framework for Islamic Financial
Institutions issued by BNM on 22 October 2010.
To ensure the operations and business activities of the Bank remain consistent with
Shariah principles and its requirements, the Bank has established its own internal Shariah
Committee and internal Shariah Organs, which consist of Shariah Department, Shariah
Audit under Internal Audit Department, Shariah Review & Compliance under Compliance
Department, Shariah Risk under Risk Management Department.
71
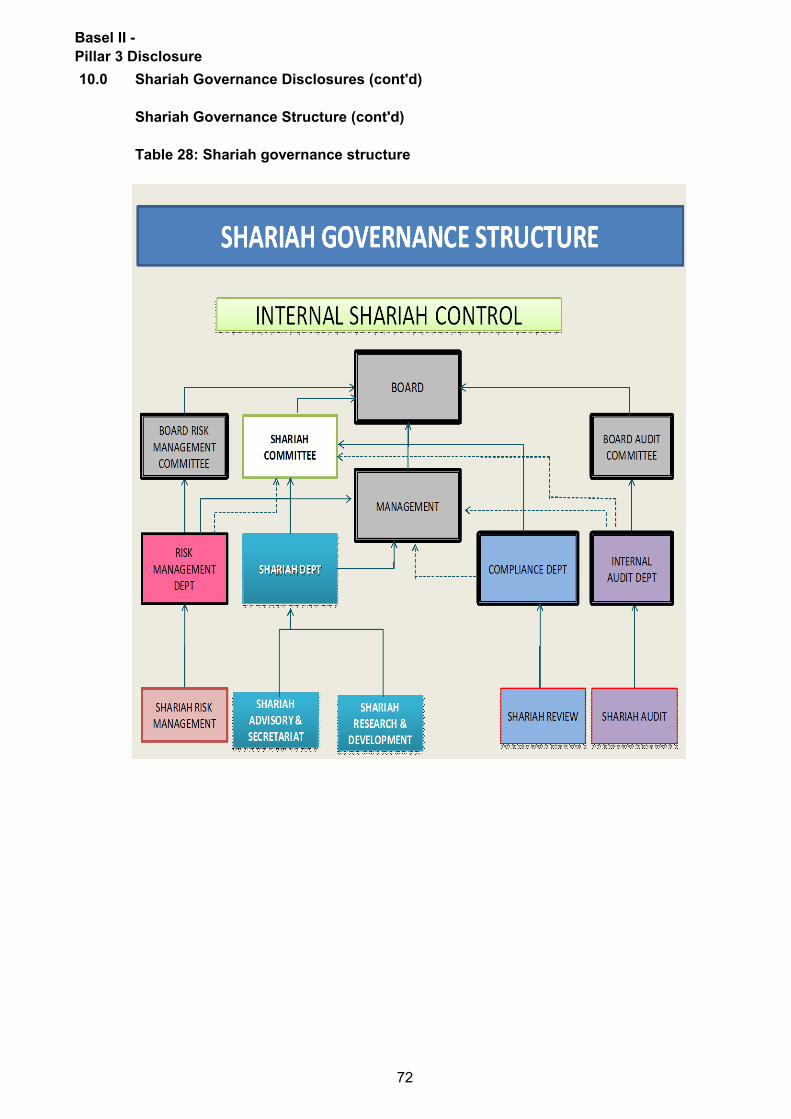
Basel II -
Pillar 3 Disclosure
10.0 Shariah Governance Disclosures (cont'd)
Shariah Governance Structure (cont'd)
Table 28: Shariah governance structure
72
Basel II -
Pillar 3 Disclosure
10.0 Shariah Governance Disclosures (cont'd)
Earning and Expenditure Prohibited by Shariah
The amount of SNCI and events decided by SC is as follows:
31 March 2016 31 March 2015
Event - NIL
plus monthly Nostro interest received
Event - NIL
plus monthly Nostro interest received
Unidentified fund / Shubhah
During the bank's daily operation, there are certain funds received by the bank where the
source is not clear or uncertain. These fund are therefore not recognised as income and
are retained in the Maslahah Ammah account.The utilisation of the fund follows the
similar procedure set for the SNCI funds.
Example of unidentified funds are cash excess at teller and ATM machines and
unidentified credit balances.
The earning prohibited by Shariah and the unidentified fund during the year was recorded
at RM34,722 (2015: RM44,170).
Policy on Management of Shariah Non-Compliant Income is formulated pursuant to the
BNM Shariah Governance Framework for IFI, which define the principles and practices to
be applied by the Bank in managing its SNCI.
Any other relevant Shariah resolutions and rulings as prescribed and determined by
the SC of the Bank from to time.
Shariah Advisory Council of Bank Negara Malaysia.
Shariah Advisory Council of Securities Commission Malaysia.
Any reported SNCI will be utilised to fund charitable activities as guided by SC of the
Bank.
SNCI is an income generated from any transaction(s) that breaches the governing
Shariah principles and requirements determined by the Bank's SC and/or other Shariah
Authorities (SA).
The SA are as follows:
Rectification Process of Shariah Non-Compliance Income (SNCI) and Unidentified
Funds
73