Embed Size (px)
Citation preview
ANZ Basel II Pillar 3 disclosure September 2010
1
2010BASEL IIPILLAR 3
YEAR ENDED 30 SEPTEMBER 2010
APS 330: CAPITAL ADEQUACY & RISK MANAGEMENT IN ANZ

ANZ Basel II Pillar 3 disclosure September 2010
2
Important Notice This document has been prepared by Australia and New Zealand Banking Group Limited (ANZ) to meet its disclosure obligations under the Australian Prudential Regulation Authority (APRA) APS 330 Capital Adequacy: Public Disclosure of Prudential Information. This disclosure was prepared as at 30 September 2010. ANZ has a continuous disclosure policy, under which ANZ will immediately notify the market of any material price sensitive information concerning the Group, in accordance with legislative and regulatory disclosure requirements.
ANZ Basel II Pillar 3 disclosure September 2010
3
TABLE OF CONTENTS1 Chapter 1 – Highlights ............................................................................................4 Chapter 2 – Introduction .........................................................................................6
Purpose of this document .................................................................................6 Chapter 3 - Risk appetite and governance..................................................................8
Risk types ...................................................................................................8 Risk Appetite Framework..................................................................................8 Risk management governance ..........................................................................9
Chapter 4 – Group structure and capital adequacy .................................................... 12
Table 1 Scope of application ..................................................................... 12 Table 2 Capital Structure ......................................................................... 14 Table 3 Capital adequacy ......................................................................... 17
Chapter 5 – Credit risk .......................................................................................... 22
Summary of Credit risk disclosures ................................................................. 22 Table 4 Credit risk – General disclosures .................................................... 22 Table 5 Credit risk – Disclosures for portfolios subject to the Standardised
Approach and supervisory risk weighting in the IRB approach............. 33 Table 6 Credit risk – Disclosures for portfolios subject to IRB approaches ........ 34 Table 7 Credit risk mitigation disclosures .................................................... 43 Table 8 General disclosures for derivatives and counterparty credit risk .......... 47
Chapter 6 – Securitisation ..................................................................................... 49
Table 9 Securitisation disclosures .............................................................. 49 Chapter 7 – Market Risk ........................................................................................ 56
Table 11 Market risk – Internal Models Approach (IMA) .................................. 56 Table 10 Market risk – Standardised Approach .............................................. 59
Chapter 8 – Operational Risk.................................................................................. 60
Table 12 Operational Risk .......................................................................... 60 Chapter 9 – Equities ............................................................................................. 63 Chapter 10 - Interest rate risk in the banking book (IRRBB) ....................................... 65
Table 14 Interest rate risk in the banking book ............................................. 65 Chapter 11 – Liquidity risk ..................................................................................... 68 Appendix - ANZ Bank (Europe) Limited.................................................................... 70
1 Each Table reference adopted in this document aligns to those required by APS 330 to be disclosed at year end.
ANZ Basel II Pillar 3 disclosure September 2010
4
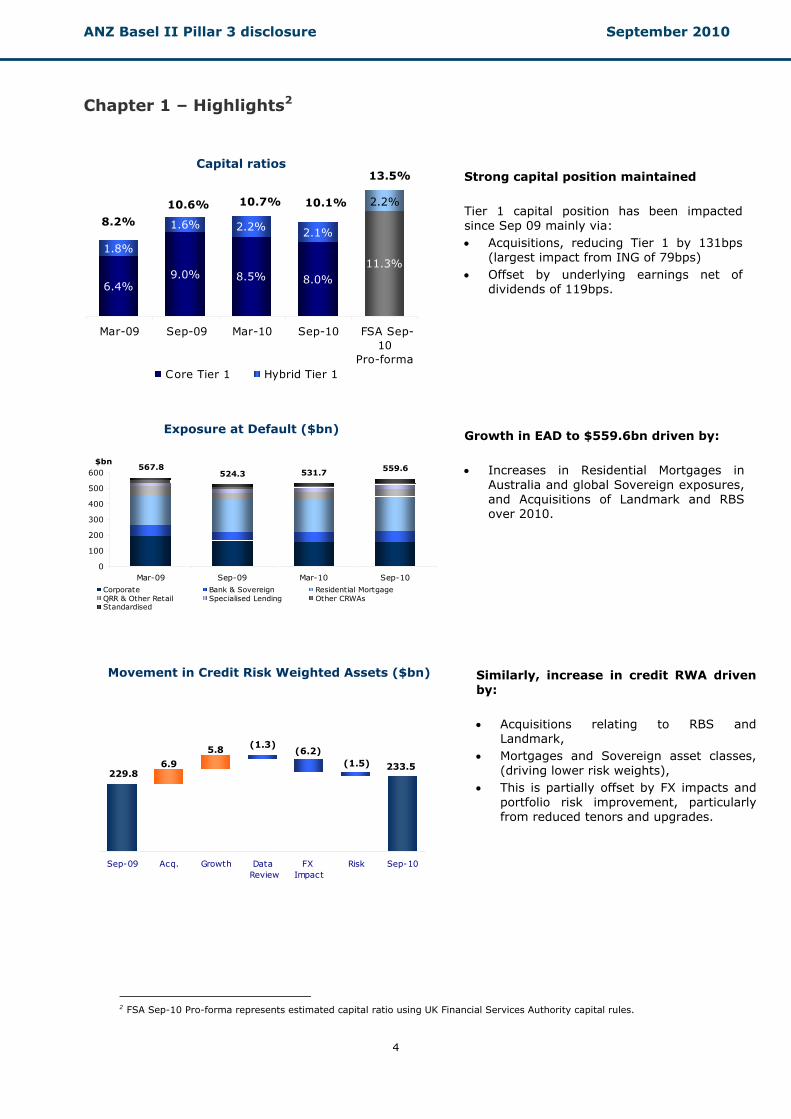
Chapter 1 – Highlights2
6.4%9.0% 8.5% 8.0%
11.3%1.8%
1.6% 2.2% 2.1%
2.2%
Mar-09 Sep-09 Mar-10 Sep-10 FSA Sep-10
Pro-formaCore Tier 1 Hybrid Tier 1
10.6% 10.7% 10.1%
13.5%
8.2%
567.8524.3 531.7 559.6
0
100
200
300
400
500
600
Mar-09 Sep-09 Mar-10 Sep-10
$bn
Corporate Bank & Sovereign Residential Mortgage QRR & Other Retail Specialised Lending Other CRWAsStandardised
233.5229.8
6.9
5.8 (6.2)(1.3)
(1.5)
Sep-09 Acq. Growth Data Review
FX Impact
Risk Sep-10
2 FSA Sep-10 Pro-forma represents estimated capital ratio using UK Financial Services Authority capital rules.
Strong capital position maintained Tier 1 capital position has been impacted since Sep 09 mainly via: • Acquisitions, reducing Tier 1 by 131bps
(largest impact from ING of 79bps) • Offset by underlying earnings net of
dividends of 119bps.
Capital ratios
Exposure at Default ($bn)
Growth in EAD to $559.6bn driven by: • Increases in Residential Mortgages in
Australia and global Sovereign exposures, and Acquisitions of Landmark and RBS over 2010.
Movement in Credit Risk Weighted Assets ($bn) Similarly, increase in credit RWA driven by: • Acquisitions relating to RBS and
Landmark, • Mortgages and Sovereign asset classes,
(driving lower risk weights), • This is partially offset by FX impacts and
portfolio risk improvement, particularly from reduced tenors and upgrades.
ANZ Basel II Pillar 3 disclosure September 2010
5
18%13%
51%
96% 96%
69%64%
0%
20%
40%
60%
80%
100%
120%
Corp
ora
te
Ban
k &
Sove
reig
n
Res
iden
tial
Mort
gag
e
QR
R &
Oth
erR
etai
l
Spec
ialis
edLe
ndin
g
Oth
erC
RW
As
Sta
ndar
dis
ed
Sep-09 Mar-10 Sep-10
560
4,141
4,9226,001 6,420
17 141673
Mar-09 Sep-09 Mar-10 Sep-10
Restructured Impaired Loans/Facilities
1.58%
1.97%2.10% 2.15%
1.06%1.31% 1.38% 1.35%
Mar 09 Sep 09 Mar 10 Sep 10
Total Provision Balance / Credit RWA CP Balance / Credit RWA
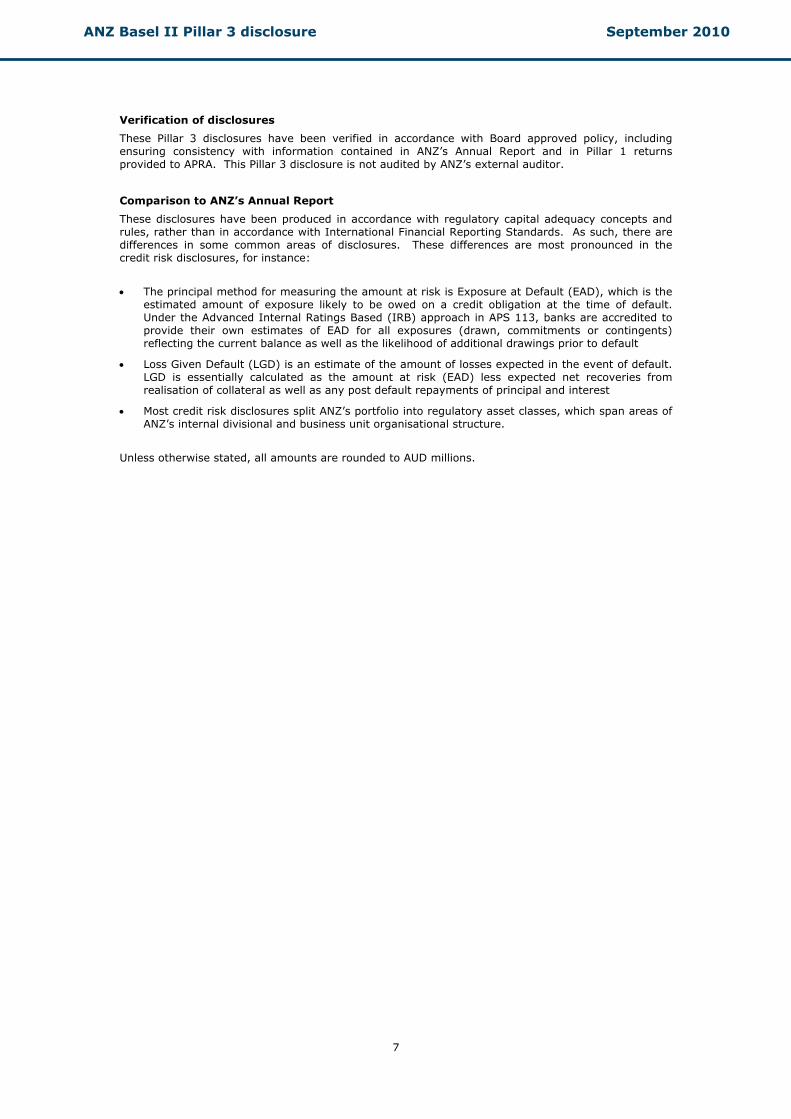
Provision ratios (Provisions/CRWA)
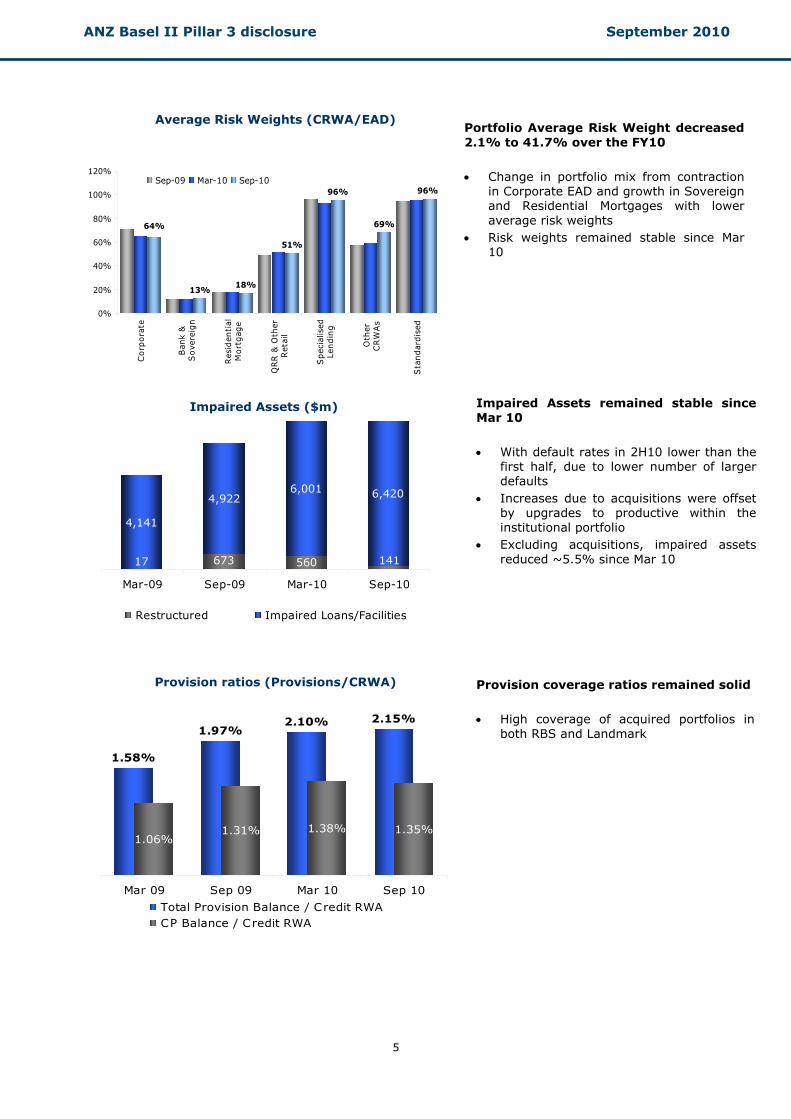
Average Risk Weights (CRWA/EAD)
Portfolio Average Risk Weight decreased 2.1% to 41.7% over the FY10 • Change in portfolio mix from contraction
in Corporate EAD and growth in Sovereign and Residential Mortgages with lower average risk weights
• Risk weights remained stable since Mar 10
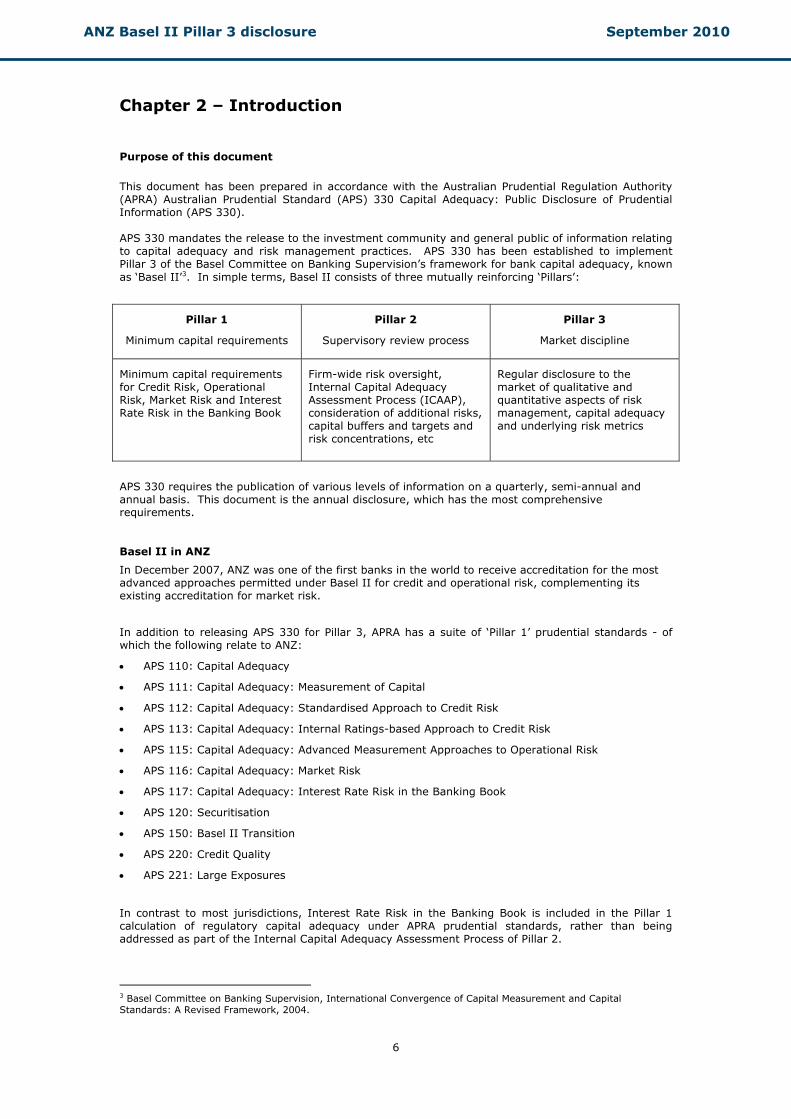
Impaired Assets ($m)
Impaired Assets remained stable since Mar 10 • With default rates in 2H10 lower than the
first half, due to lower number of larger defaults
• Increases due to acquisitions were offset by upgrades to productive within the institutional portfolio
• Excluding acquisitions, impaired assets reduced ~5.5% since Mar 10
Provision coverage ratios remained solid • High coverage of acquired portfolios in
both RBS and Landmark
ANZ Basel II Pillar 3 disclosure September 2010
6
Chapter 2 – Introduction
Purpose of this document
This document has been prepared in accordance with the Australian Prudential Regulation Authority (APRA) Australian Prudential Standard (APS) 330 Capital Adequacy: Public Disclosure of Prudential Information (APS 330). APS 330 mandates the release to the investment community and general public of information relating to capital adequacy and risk management practices. APS 330 has been established to implement Pillar 3 of the Basel Committee on Banking Supervision’s framework for bank capital adequacy, known as ‘Basel II’3. In simple terms, Basel II consists of three mutually reinforcing ‘Pillars’:
Pillar 1
Minimum capital requirements
Pillar 2
Supervisory review process
Pillar 3
Market discipline
Minimum capital requirements for Credit Risk, Operational Risk, Market Risk and Interest Rate Risk in the Banking Book
Firm-wide risk oversight, Internal Capital Adequacy Assessment Process (ICAAP), consideration of additional risks, capital buffers and targets and risk concentrations, etc
Regular disclosure to the market of qualitative and quantitative aspects of risk management, capital adequacy and underlying risk metrics
APS 330 requires the publication of various levels of information on a quarterly, semi-annual and annual basis. This document is the annual disclosure, which has the most comprehensive requirements.
Basel II in ANZ
In December 2007, ANZ was one of the first banks in the world to receive accreditation for the most advanced approaches permitted under Basel II for credit and operational risk, complementing its existing accreditation for market risk.
In addition to releasing APS 330 for Pillar 3, APRA has a suite of ‘Pillar 1’ prudential standards - of which the following relate to ANZ:
• APS 110: Capital Adequacy
• APS 111: Capital Adequacy: Measurement of Capital
• APS 112: Capital Adequacy: Standardised Approach to Credit Risk
• APS 113: Capital Adequacy: Internal Ratings-based Approach to Credit Risk
• APS 115: Capital Adequacy: Advanced Measurement Approaches to Operational Risk
• APS 116: Capital Adequacy: Market Risk
• APS 117: Capital Adequacy: Interest Rate Risk in the Banking Book
• APS 120: Securitisation
• APS 150: Basel II Transition
• APS 220: Credit Quality
• APS 221: Large Exposures
In contrast to most jurisdictions, Interest Rate Risk in the Banking Book is included in the Pillar 1 calculation of regulatory capital adequacy under APRA prudential standards, rather than being addressed as part of the Internal Capital Adequacy Assessment Process of Pillar 2.
3 Basel Committee on Banking Supervision, International Convergence of Capital Measurement and Capital Standards: A Revised Framework, 2004.
ANZ Basel II Pillar 3 disclosure September 2010
7
Verification of disclosures
These Pillar 3 disclosures have been verified in accordance with Board approved policy, including ensuring consistency with information contained in ANZ’s Annual Report and in Pillar 1 returns provided to APRA. This Pillar 3 disclosure is not audited by ANZ’s external auditor.
Comparison to ANZ’s Annual Report
These disclosures have been produced in accordance with regulatory capital adequacy concepts and rules, rather than in accordance with International Financial Reporting Standards. As such, there are differences in some common areas of disclosures. These differences are most pronounced in the credit risk disclosures, for instance:
• The principal method for measuring the amount at risk is Exposure at Default (EAD), which is the estimated amount of exposure likely to be owed on a credit obligation at the time of default. Under the Advanced Internal Ratings Based (IRB) approach in APS 113, banks are accredited to provide their own estimates of EAD for all exposures (drawn, commitments or contingents) reflecting the current balance as well as the likelihood of additional drawings prior to default
• Loss Given Default (LGD) is an estimate of the amount of losses expected in the event of default. LGD is essentially calculated as the amount at risk (EAD) less expected net recoveries from realisation of collateral as well as any post default repayments of principal and interest
• Most credit risk disclosures split ANZ’s portfolio into regulatory asset classes, which span areas of ANZ’s internal divisional and business unit organisational structure.
Unless otherwise stated, all amounts are rounded to AUD millions.
ANZ Basel II Pillar 3 disclosure September 2010
8
Chapter 3 - Risk appetite and governance
Risk types
ANZ is exposed to a broad range of interrelated business risks. The main risks that directly impact determination of regulatory capital are as follows:
• Credit risk - the risk of financial loss resulting from the failure of ANZ’s customers and counterparties to honour or perform fully the terms of a loan or contract
• Market risk - the risk to ANZ’s earnings arising from changes in interest rates, currency exchange rates and credit spreads, or from fluctuations in bond, commodity or equity prices. ANZ has grouped market risk into two broad categories to facilitate the measurement, reporting and control of market risk:
o Traded market risk - the risk of loss from changes in the value of financial instruments due to movements in price factors for physical and derivative trading positions. Trading positions arise from transactions where ANZ acts as principal with clients or with the market
o Non-traded market risk (or balance sheet risk) - comprises Interest Rate Risk in the Banking Book and the risk to the AUD denominated value of ANZ’s capital and earnings due to foreign exchange rate movements
• Operational risk - the risk of loss resulting from inadequate or failed internal controls or from external events, including legal risk and reputation risk4
• Equity risk – is the potential loss that may be incurred on equity investments in the banking book
• Securitisation risk – the risk of credit related losses greater than expected due to a securitisation failing to operate as anticipated, or of the values and risks accepted or transferred, not emerging as expected.
Other key risks faced by ANZ, but which do not directly impact determination of regulatory capital, include:
• Strategic Risk is defined to be the potential for loss arising from a failure in ANZ’s strategies. These include strategies designed to address or anticipate changes in the competitive, client, political or regulatory environments.
• Business Risk is defined as the risk of financial loss due to unexpected movements in volume, profit margin, and operating expenses (excluding risks elsewhere defined) arising from unexpected changes in the business environment, customer preferences and/or competitor actions.
• Liquidity risk - the risk that ANZ has insufficient capacity to fund increases in assets, or is unable to meet its payment obligations as they fall due, including repaying depositors or maturing wholesale debt
• Compliance risk - the risk that ANZ does not conduct its business in accordance with the laws, regulations and adopted codes of the countries in which it operates
Risk Appetite Framework
ANZ's risk appetite is set by the Board and integrated within ANZ’s strategic objectives. The Risk Appetite Framework underpins fundamental principles of strong capitalisation, robust balance sheet and sound earnings, which protects ANZ’s franchise and supports the development of an enterprise-wide risk culture.
4 Regulatory Capital is calculated in accordance with the definition of Operational Risk outlined in APS 115 Capital Adequacy: Advanced Measurement Approaches to Operational Risk, and therefore excludes reputational risk considerations.
ANZ Basel II Pillar 3 disclosure September 2010
9
The framework provides an enforceable risk statement, on the amount of risk ANZ is willing to accept. It supports strategic and core business activities and customer relationships ensuring that: • only permitted activities are engaged in
• the scale of permitted activities, and subsequent risk profile, does not lead to potential losses or earnings volatility that exceeds ANZ approved risk appetite
• risk is expressed quantitatively via limits and tolerances
• management focus is brought to bear on key and emerging risk issues and mitigating actions
• risk is linked to the business by informing, guiding and empowering the business in executing strategy.
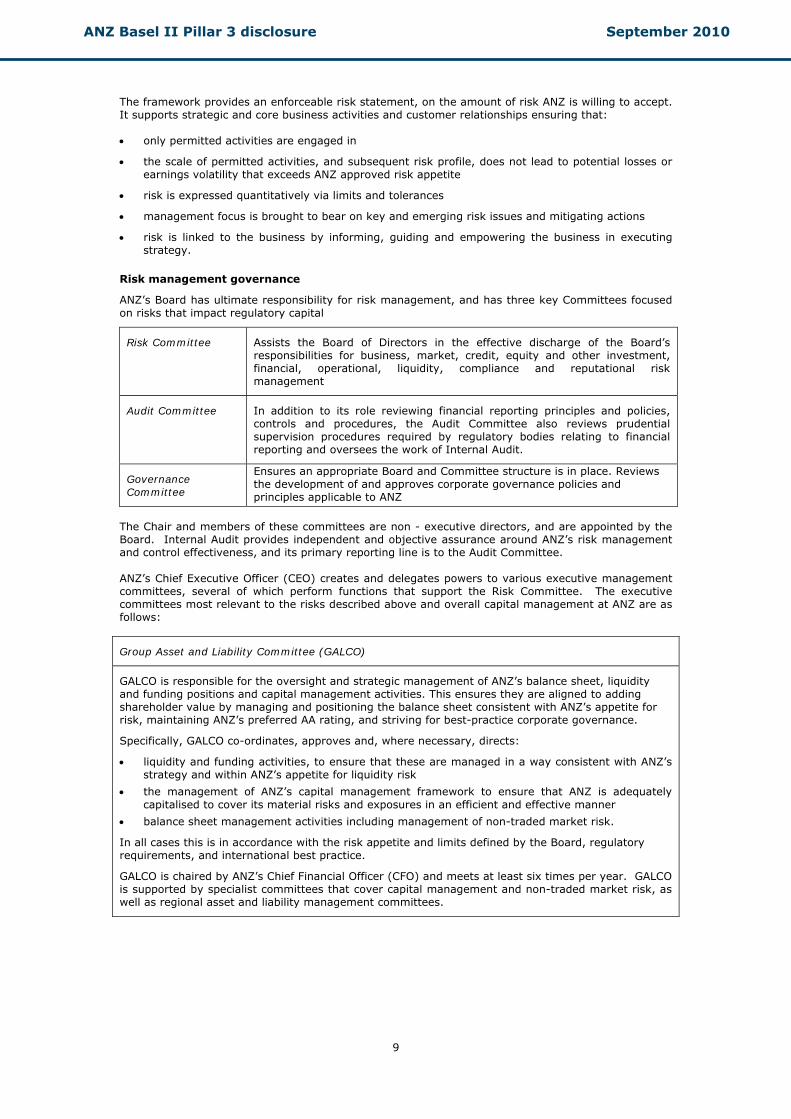
Risk management governance
ANZ’s Board has ultimate responsibility for risk management, and has three key Committees focused on risks that impact regulatory capital
Risk Committee Assists the Board of Directors in the effective discharge of the Board’s responsibilities for business, market, credit, equity and other investment, financial, operational, liquidity, compliance and reputational risk management
Audit Committee
In addition to its role reviewing financial reporting principles and policies, controls and procedures, the Audit Committee also reviews prudential supervision procedures required by regulatory bodies relating to financial reporting and oversees the work of Internal Audit.
Governance Committee
Ensures an appropriate Board and Committee structure is in place. Reviews the development of and approves corporate governance policies and principles applicable to ANZ
The Chair and members of these committees are non - executive directors, and are appointed by the Board. Internal Audit provides independent and objective assurance around ANZ’s risk management and control effectiveness, and its primary reporting line is to the Audit Committee. ANZ’s Chief Executive Officer (CEO) creates and delegates powers to various executive management committees, several of which perform functions that support the Risk Committee. The executive committees most relevant to the risks described above and overall capital management at ANZ are as follows:
Group Asset and Liability Committee (GALCO)
GALCO is responsible for the oversight and strategic management of ANZ’s balance sheet, liquidity and funding positions and capital management activities. This ensures they are aligned to adding shareholder value by managing and positioning the balance sheet consistent with ANZ’s appetite for risk, maintaining ANZ’s preferred AA rating, and striving for best-practice corporate governance.
Specifically, GALCO co-ordinates, approves and, where necessary, directs:
• liquidity and funding activities, to ensure that these are managed in a way consistent with ANZ’s strategy and within ANZ’s appetite for liquidity risk
• the management of ANZ’s capital management framework to ensure that ANZ is adequately capitalised to cover its material risks and exposures in an efficient and effective manner
• balance sheet management activities including management of non-traded market risk.
In all cases this is in accordance with the risk appetite and limits defined by the Board, regulatory requirements, and international best practice.
GALCO is chaired by ANZ’s Chief Financial Officer (CFO) and meets at least six times per year. GALCO is supported by specialist committees that cover capital management and non-traded market risk, as well as regional asset and liability management committees.
ANZ Basel II Pillar 3 disclosure September 2010
10
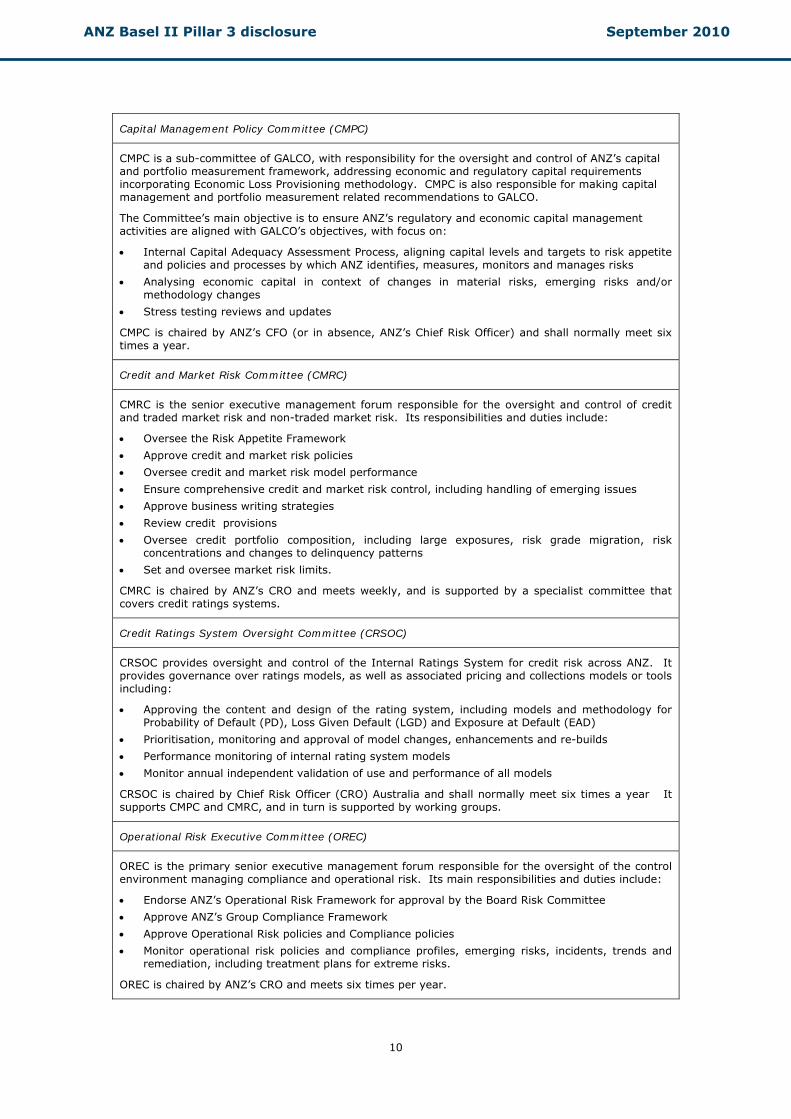
Capital Management Policy Committee (CMPC)
CMPC is a sub-committee of GALCO, with responsibility for the oversight and control of ANZ’s capital and portfolio measurement framework, addressing economic and regulatory capital requirements incorporating Economic Loss Provisioning methodology. CMPC is also responsible for making capital management and portfolio measurement related recommendations to GALCO.
The Committee’s main objective is to ensure ANZ’s regulatory and economic capital management activities are aligned with GALCO’s objectives, with focus on:
• Internal Capital Adequacy Assessment Process, aligning capital levels and targets to risk appetite and policies and processes by which ANZ identifies, measures, monitors and manages risks
• Analysing economic capital in context of changes in material risks, emerging risks and/or methodology changes
• Stress testing reviews and updates
CMPC is chaired by ANZ’s CFO (or in absence, ANZ’s Chief Risk Officer) and shall normally meet six times a year.
Credit and Market Risk Committee (CMRC)
CMRC is the senior executive management forum responsible for the oversight and control of credit and traded market risk and non-traded market risk. Its responsibilities and duties include:
• Oversee the Risk Appetite Framework
• Approve credit and market risk policies
• Oversee credit and market risk model performance
• Ensure comprehensive credit and market risk control, including handling of emerging issues
• Approve business writing strategies
• Review credit provisions
• Oversee credit portfolio composition, including large exposures, risk grade migration, risk concentrations and changes to delinquency patterns
• Set and oversee market risk limits.
CMRC is chaired by ANZ’s CRO and meets weekly, and is supported by a specialist committee that covers credit ratings systems.
Credit Ratings System Oversight Committee (CRSOC)
CRSOC provides oversight and control of the Internal Ratings System for credit risk across ANZ. It provides governance over ratings models, as well as associated pricing and collections models or tools including:
• Approving the content and design of the rating system, including models and methodology for Probability of Default (PD), Loss Given Default (LGD) and Exposure at Default (EAD)
• Prioritisation, monitoring and approval of model changes, enhancements and re-builds
• Performance monitoring of internal rating system models
• Monitor annual independent validation of use and performance of all models
CRSOC is chaired by Chief Risk Officer (CRO) Australia and shall normally meet six times a year It supports CMPC and CMRC, and in turn is supported by working groups.
Operational Risk Executive Committee (OREC)
OREC is the primary senior executive management forum responsible for the oversight of the control environment managing compliance and operational risk. Its main responsibilities and duties include:
• Endorse ANZ’s Operational Risk Framework for approval by the Board Risk Committee
• Approve ANZ’s Group Compliance Framework
• Approve Operational Risk policies and Compliance policies
• Monitor operational risk policies and compliance profiles, emerging risks, incidents, trends and remediation, including treatment plans for extreme risks.
OREC is chaired by ANZ’s CRO and meets six times per year.

ANZ Basel II Pillar 3 disclosure September 2010
11
Reputation Risk Committee (RRC)
The purpose of the RRC is to assist ANZ businesses, Risk, Compliance and Legal in partnership to effectively discharge their responsibility for managing reputation risk in relation to environmental, social, business and regulatory issues.
RRC is chaired by ANZ’s CRO and shall normally meet six times a year.
ANZ Basel II Pillar 3 disclosure September 2010
12
Chapter 4 – Group structure and capital adequacy
Table 1 Scope of application
Top corporate entity
The top corporate entity in the reporting group is Australia and New Zealand Banking Group Limited.
Consolidation, capital reporting and measurement
For financial reporting purposes, ANZ consolidates the financial statements of the Company and all its controlled entities where it is determined that there is a capacity to control. Control means the power to govern directly or indirectly the financial and operating policies of an entity so as to obtain benefits from its activities. In relation to special purpose entities, such control is deemed to exist where, in substance:
• the majority of the residual risks and rewards from the activities of the entity accrue to ANZ; or,
• ANZ controls the entity’s decision making powers so as to obtain the majority of the risks and rewards from the entity’s activities.
To ensure that an Authorised Deposit-taking Institution (ADI) is adequately capitalised on both a stand alone and group basis, APRA adopts a tiered approach to the measurement of an ADI’s capital adequacy by assessing the ADI’s financial strength at three levels:
• Level 1 - being the ADI i.e. Australia and New Zealand Banking Group Limited, consolidated with APRA approved subsidiaries, to form the ADI’s Extended Licensed Entity (ELE)
• Level 2 – being the consolidated group for financial reporting purposes adjusted to exclude associates activities and certain subsidiaries excluded under APS 110 that undertake the following business activities:
• Insurance businesses (including friendly societies and health funds)
• Acting as manager, responsible entity, approved trustee, trustee or similar role in relation to funds management
• Non-financial (commercial) operations
• Securitisation special purpose vehicles to which assets have been transferred in accordance with APRA's requirements as set out in APS 120
• Level 3 - the consolidated group for financial reporting purposes.
ANZ measures capital adequacy monthly and reports for prudential purposes on a Level 1 and Level 2 basis, however is not required to report on a Level 3 basis. This Pillar 3 report is based on the Level 2 prudential structure.
Investments in entities deconsolidated from the Level 3 group to determine Level 2 for prudential purposes are deducted from regulatory capital and the assets of those entities are excluded from aggregate Risk Weighted Assets (RWA).
ANZ Basel II Pillar 3 disclosure September 2010
13
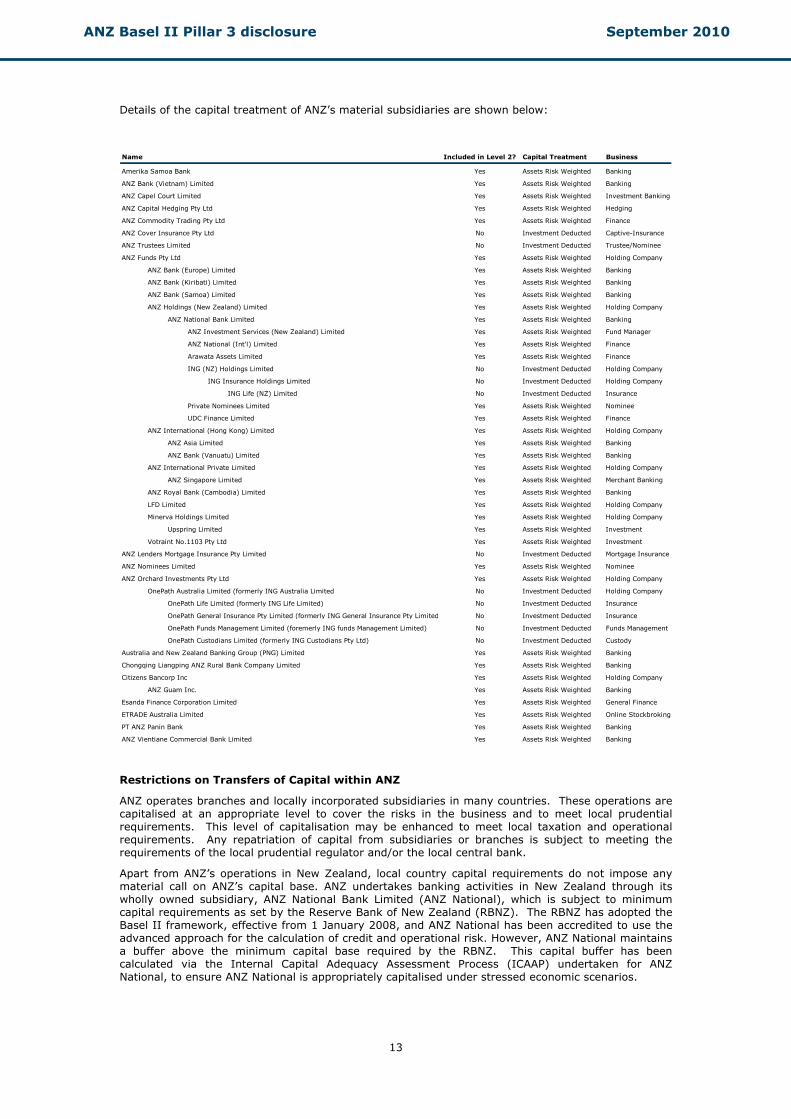
Details of the capital treatment of ANZ’s material subsidiaries are shown below:
Name Included in Level 2? Capital Treatment Business
Amerika Samoa Bank Yes Assets Risk Weighted Banking
ANZ Bank (Vietnam) Limited Yes Assets Risk Weighted Banking
ANZ Capel Court Limited Yes Assets Risk Weighted Investment Banking
ANZ Capital Hedging Pty Ltd Yes Assets Risk Weighted Hedging
ANZ Commodity Trading Pty Ltd Yes Assets Risk Weighted Finance
ANZ Cover Insurance Pty Ltd No Investment Deducted Captive-Insurance
ANZ Trustees Limited No Investment Deducted Trustee/Nominee
ANZ Funds Pty Ltd Yes Assets Risk Weighted Holding Company
ANZ Bank (Europe) Limited Yes Assets Risk Weighted Banking
ANZ Bank (Kiribati) Limited Yes Assets Risk Weighted Banking
ANZ Bank (Samoa) Limited Yes Assets Risk Weighted Banking
ANZ Holdings (New Zealand) Limited Yes Assets Risk Weighted Holding Company
ANZ National Bank Limited Yes Assets Risk Weighted Banking
ANZ Investment Services (New Zealand) Limited Yes Assets Risk Weighted Fund Manager
ANZ National (Int'l) Limited Yes Assets Risk Weighted Finance
Arawata Assets Limited Yes Assets Risk Weighted Finance
ING (NZ) Holdings Limited No Investment Deducted Holding Company
ING Insurance Holdings Limited No Investment Deducted Holding Company
ING Life (NZ) Limited No Investment Deducted Insurance
Private Nominees Limited Yes Assets Risk Weighted Nominee
UDC Finance Limited Yes Assets Risk Weighted Finance
ANZ International (Hong Kong) Limited Yes Assets Risk Weighted Holding Company
ANZ Asia Limited Yes Assets Risk Weighted Banking
ANZ Bank (Vanuatu) Limited Yes Assets Risk Weighted Banking
ANZ International Private Limited Yes Assets Risk Weighted Holding Company
ANZ Singapore Limited Yes Assets Risk Weighted Merchant Banking
ANZ Royal Bank (Cambodia) Limited Yes Assets Risk Weighted Banking
LFD Limited Yes Assets Risk Weighted Holding Company
Minerva Holdings Limited Yes Assets Risk Weighted Holding Company
Upspring Limited Yes Assets Risk Weighted Investment
Votraint No.1103 Pty Ltd Yes Assets Risk Weighted Investment
ANZ Lenders Mortgage Insurance Pty Limited No Investment Deducted Mortgage Insurance
ANZ Nominees Limited Yes Assets Risk Weighted Nominee
ANZ Orchard Investments Pty Ltd Yes Assets Risk Weighted Holding Company
OnePath Australia Limited (formerly ING Australia Limited No Investment Deducted Holding Company
OnePath Life Limited (formerly ING Life Limited) No Investment Deducted Insurance
OnePath General Insurance Pty Limited (formerly ING General Insurance Pty Limited No Investment Deducted Insurance
OnePath Funds Management Limited (foremerly ING funds Management Limited) No Investment Deducted Funds Management
OnePath Custodians Limited (formerly ING Custodians Pty Ltd) No Investment Deducted Custody
Australia and New Zealand Banking Group (PNG) Limited Yes Assets Risk Weighted Banking
Chongqing Liangping ANZ Rural Bank Company Limited Yes Assets Risk Weighted Banking
Citizens Bancorp Inc Yes Assets Risk Weighted Holding Company
ANZ Guam Inc. Yes Assets Risk Weighted Banking
Esanda Finance Corporation Limited Yes Assets Risk Weighted General Finance
ETRADE Australia Limited Yes Assets Risk Weighted Online Stockbroking
PT ANZ Panin Bank Yes Assets Risk Weighted Banking
ANZ Vientiane Commercial Bank Limited Yes Assets Risk Weighted Banking
Restrictions on Transfers of Capital within ANZ
ANZ operates branches and locally incorporated subsidiaries in many countries. These operations are capitalised at an appropriate level to cover the risks in the business and to meet local prudential requirements. This level of capitalisation may be enhanced to meet local taxation and operational requirements. Any repatriation of capital from subsidiaries or branches is subject to meeting the requirements of the local prudential regulator and/or the local central bank.
Apart from ANZ’s operations in New Zealand, local country capital requirements do not impose any material call on ANZ’s capital base. ANZ undertakes banking activities in New Zealand through its wholly owned subsidiary, ANZ National Bank Limited (ANZ National), which is subject to minimum capital requirements as set by the Reserve Bank of New Zealand (RBNZ). The RBNZ has adopted the Basel II framework, effective from 1 January 2008, and ANZ National has been accredited to use the advanced approach for the calculation of credit and operational risk. However, ANZ National maintains a buffer above the minimum capital base required by the RBNZ. This capital buffer has been calculated via the Internal Capital Adequacy Assessment Process (ICAAP) undertaken for ANZ National, to ensure ANZ National is appropriately capitalised under stressed economic scenarios.
ANZ Basel II Pillar 3 disclosure September 2010
14
ANZ established a licensed banking branch in New Zealand in January 2009. The branch structure expands the range of funding options available to ANZ’s New Zealand business, but does not impact the capital requirements of ANZ National.
Capital deficiencies in non-consolidated subsidiaries
The aggregate amount of any under-capitalisation of any non-consolidated subsidiary (or subsidiaries) that is required to be deducted from capital is nil (March 2010 and September 2009: Nil).
Table 2 Capital Structure
ANZ’s regulatory capital calculation is governed by APRA’s prudential standards which adopt a risk-based capital assessment framework, based on the Basel II capital measurement standards. This risk based approach requires eligible capital to be divided by total Risk Weighted Assets (RWA), with the resultant ratio being used as a measure of an ADI’s capital adequacy. APRA determines Prudential Capital Ratios (PCRs) for Tier 1 and Total Capital, with Capital as the numerator and RWAs as the denominator.
APRA determines PCRs for Tier 1 and Total Capital at both Level 1 and Level 2 under its prudential standards APS 110 – Capital Adequacy and APS 111 – Capital Adequacy: Measurement of Capital, with RWA calculations predominantly contained in APS 113 – Capital Adequacy: Internal Ratings-based Approach to Credit Risk, APS 115 – Capital Adequacy: Advanced Measurement Approach to Operational Risk, APS 116 Capital Adequacy: Market Risk and APS 117 – Capital Adequacy: Interest Rate Risk in the Banking Book.
Regulatory capital is divided into Tier 1, carrying the highest capital elements, and Tier 2, which has lower capital elements, but still adds to the overall strength of the ADI.
Tier 1 capital is comprised of ‘Fundamental’ capital, ‘Residual’ capital, and ‘Tier 1 deductions’. Fundamental capital comprises shareholders’ equity adjusted for items which APRA does not allow as regulatory capital or classifies as lower forms of regulatory capital.
Fundamental capital includes the following significant adjustments:
• Residual Tier 1 capital instruments included within shareholders’ equity are excluded.
• Reserves exclude the hedging reserve and available-for-sale revaluation reserve, and reserves of insurance, funds management and securitisation subsidiaries and associates excluded for Level 2 purposes.
• Retained earnings excludes retained earnings of insurance, funds management and securitisation subsidiaries and associates excluded for Level 2 purposes, but includes capitalised deferred fees forming part of loan yields that meet the criteria set out in the prudential standard.
• Current year (net of tax) earnings is net of any dividends paid during the current year and the expected dividend payments (net of the expected dividend reinvestment under the Dividend Reinvestment Plan (DRP) and Bonus Option Plan (BOP)) for ordinary shares and Residual capital instruments, and excludes profits of insurance, funds management and securitisation subsidiaries and associates excluded for Level 2 purposes.
Residual capital covers ‘Non-innovative’ and ‘Innovative’ hybrid Tier 1 instruments with limits restricting the volume that can be counted as Tier 1 capital.
ANZ has on issue three outstanding Non-innovative hybrid Tier 1 capital instruments:
• ANZ Convertible Preference Shares. On 30 September 2008 ANZ issued AUD1,081 million of convertible preference shares (CPS1) and on 17 December 2009 ANZ issued AUD1,969 million of convertible preference shares (CPS2) that mandatorily convert into ordinary shares on 16 June 2014 and 15 December 2016 respectively, subject to certain conditions being satisfied. They may also convert earlier under certain circumstances. The distributions are preferred, non-cumulative, payable quarterly and based on the quarterly Australian Bank Bill Rate plus a margin of 250 and 300 basis points respectively and are subject to Directors resolving to payable quarterly in their absolute discretion and other payment tests being satisfied. In a winding-up of ANZ, the convertible preference shares will rank equal with other preference shares, but behind all depositors and creditors and ahead of ordinary shareholders.
• UK Stapled Securities. On 15 June 2007 ANZ raised GBP450 million of non-cumulative mandatory convertible stapled securities. On 15 June 2012, or an earlier date under certain circumstances, the UK Stapled Securities will mandatorily convert into ordinary shares, subject to certain conditions being satisfied. The distributions are non-cumulative at a fixed rate of 6.54% payable semi-annually. In a winding-up of ANZ, the ANZ preference shares forming part of the UK Stapled Securities will rank equal with other preference shares, but behind all depositors and creditors and ahead of ordinary shareholders.
ANZ Basel II Pillar 3 disclosure September 2010
15
ANZ has on issue two Innovative hybrid Tier 1 capital instruments:
• US Trust Securities. On 27 November 2003, ANZ issued USD1,100 million of non - cumulative trust securities in two tranches of USD350m with an initial call date of 15 January 2010 at a coupon rate of 4.484%, and USD750m with an initial call date of 15 December 2013 and a coupon rate of 5.36%. On 15 January 2010, ANZ redeemed for cash the USD350m tranche of the US Trust Securities. On 15 December 2013, ANZ has the right to redeem the USD750m tranche of the US Trust Securities for cash, subject to APRA approval. If ANZ does not exercise this right, holders are entitled to require ANZ to exchange the US Trust Securities into ordinary shares. The distributions are non-cumulative payable semi-annually. In a winding-up of ANZ, the ANZ preference shares forming part of the US Trust Securities will rank equal with other preference shares, but behind all depositors and creditors and ahead of ordinary shareholders.
• Euro Trust Securities. On 13 December 2004, ANZ issued EUR500 million of non - cumulative trust securities raising AUD871m, at the spot rate on the date of issue. Distributions are non-cumulative payable quarterly based upon the three month EURIBOR rate plus a margin of 66 basis points up until 15 December 2014, at which date ANZ has the right to redeem the Euro Trust Securities for cash (subject to APRA approval). After this date, the distribution rate is a rate based on the three month EURIBOR rate plus a margin of 166 basis points. In a winding-up of ANZ, the ANZ preference shares forming part of the Euro Trust securities will rank equal with other preference shares, but behind all depositors and creditors and ahead of ordinary shareholders.
For more information on these instruments, refer to the Loan Capital and Share Capital notes (Notes 27 and 28 respectively) in the 2010 ANZ Annual Report.
Tier 1 deductions include amounts deducted solely from Tier 1, mainly intangible assets i.e. goodwill, acquired portfolio of insurance/investment business and capitalised software; capitalised brokerage and borrowing expenses; net deferred tax assets and deductions taken 50% from Tier 1 and 50% from Tier 2, which mainly include the tangible component of investment in other subsidiaries and associates regulated by APRA, or their overseas equivalent, and the amount of Expected Losses (EL) in excess of Eligible Provisions for Loan Losses (net of tax).
Tier 2 capital is comprised of Upper and Lower Tier 2 capital, less capital deductions taken 50% from Tier 2 capital. Upper Tier 2 capital mainly comprises perpetual subordinated debt instruments, whilst Lower Tier 2 comprises dated subordinated debt instruments which have a minimum term of 5 years.
ANZ has two instruments that qualify as Upper Tier 2 capital:
• USD300m note issued by ANZ on 30 October 1986 which pays a rate of 6 month LIBOR plus 15 basis points.
• NZD835m note issued by ANZ National Bank Limited on 17 April 2008 which pays a fixed rate of 9.66% for five years payable semi-annually. At the first call date of 18 April 2013 the interest rate resets to the five year swap rate plus 200 basis points, and is callable on any interest payment date thereafter.
To qualify as Lower Tier 2 capital, the instrument must have a minimum term of five years and the amount eligible for inclusion in capital is amortised on a straight line basis at a rate of 20% per annum over the last four years to maturity. For more details on these Lower Tier 2 capital instruments, refer to the Subordinated Notes section of the Loan Capital note (Note 27) in the 2010 ANZ Annual Report.
Total Capital is the sum of Tier 1 capital and Tier 2 capital.
ANZ Basel II Pillar 3 disclosure September 2010
16
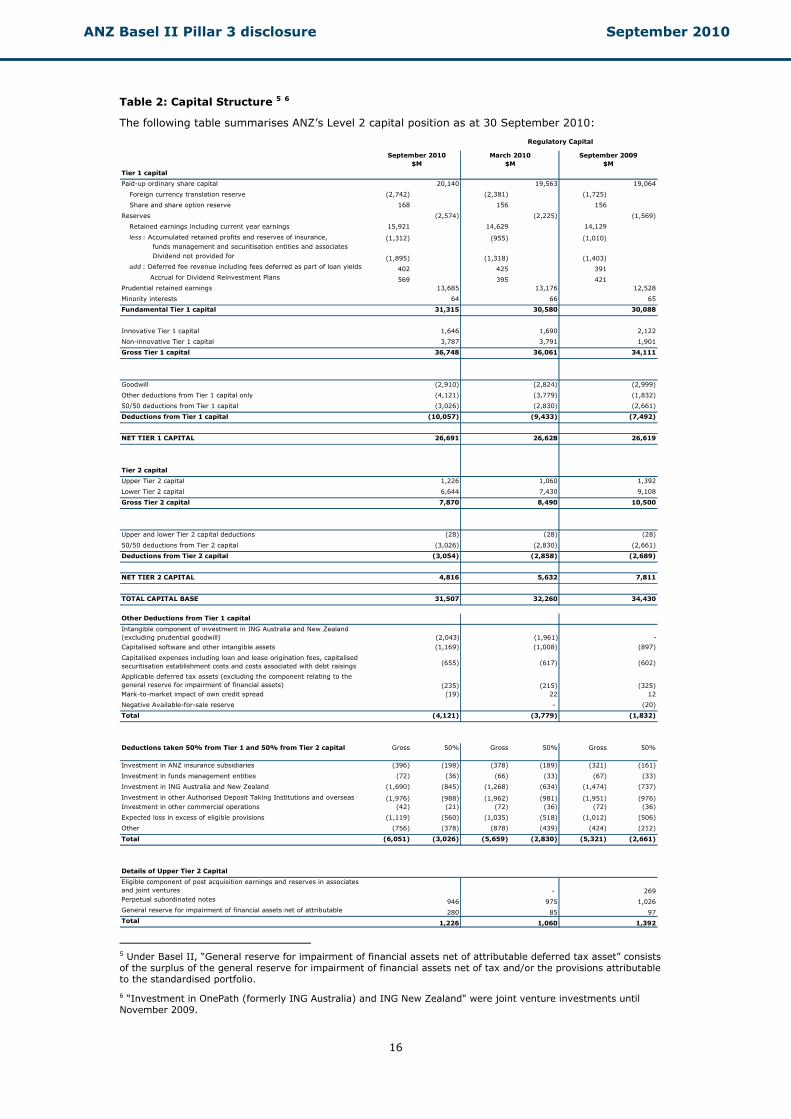
Table 2: Capital Structure 5 6
The following table summarises ANZ’s Level 2 capital position as at 30 September 2010:
Tier 1 capital
Paid-up ordinary share capital 20,140 19,563 19,064
Foreign currency translation reserve (2,742) (2,381) (1,725)
Share and share option reserve 168 156 156
Reserves (2,574) (2,225) (1,569)
Retained earnings including current year earnings 15,921 14,629 14,129
less : Accumulated retained profits and reserves of insurance, (1,312) (955) (1,010) funds management and securitisation entities and associates Dividend not provided for (1,895) (1,318) (1,403)add : Deferred fee revenue including fees deferred as part of loan yields 402 425 391 Accrual for Dividend Reinvestment Plans 569 395 421
Prudential retained earnings 13,685 13,176 12,528
Minority interests 64 66 65
Fundamental Tier 1 capital 31,315 30,580 30,088
Innovative Tier 1 capital 1,646 1,690 2,122
Non-innovative Tier 1 capital 3,787 3,791 1,901
Gross Tier 1 capital 36,748 36,061 34,111
Goodwill (2,910) (2,824) (2,999)
Other deductions from Tier 1 capital only (4,121) (3,779) (1,832)
50/50 deductions from Tier 1 capital (3,026) (2,830) (2,661)
Deductions from Tier 1 capital (10,057) (9,433) (7,492)
NET TIER 1 CAPITAL 26,691 26,628 26,619
Tier 2 capital
Upper Tier 2 capital 1,226 1,060 1,392
Lower Tier 2 capital 6,644 7,430 9,108
Gross Tier 2 capital 7,870 8,490 10,500
Upper and lower Tier 2 capital deductions (28) (28) (28)
50/50 deductions from Tier 2 capital (3,026) (2,830) (2,661)
Deductions from Tier 2 capital (3,054) (2,858) (2,689)
NET TIER 2 CAPITAL 4,816 5,632 7,811
TOTAL CAPITAL BASE 31,507 32,260 34,430
September 2010$M
Regulatory Capital
March 2010$M
September 2009$M
Other Deductions from Tier 1 capital
Intangible component of investment in ING Australia and New Zealand (excluding prudential goodwill) (2,043) (1,961) -
Capitalised software and other intangible assets (1,169) (1,008) (897)
Capitalised expenses including loan and lease origination fees, capitalised securitisation establishment costs and costs associated with debt raisings (655) (617) (602)
Applicable deferred tax assets (excluding the component relating to the general reserve for impairment of financial assets) (235) (215) (325)Mark-to-market impact of own credit spread (19) 22 12
Negative Available-for-sale reserve - (20)
Total (4,121) (3,779) (1,832)
Deductions taken 50% from Tier 1 and 50% from Tier 2 capital Gross 50% Gross 50% Gross 50%
Investment in ANZ insurance subsidiaries (396) (198) (378) (189) (321) (161)
Investment in funds management entities (72) (36) (66) (33) (67) (33)
Investment in ING Australia and New Zealand (1,690) (845) (1,268) (634) (1,474) (737)
Investment in other Authorised Deposit Taking Institutions and overseas (1,976) (988) (1,962) (981) (1,951) (976)Investment in other commercial operations (42) (21) (72) (36) (72) (36)
Expected loss in excess of eligible provisions (1,119) (560) (1,035) (518) (1,012) (506)
Other (756) (378) (878) (439) (424) (212)
Total (6,051) (3,026) (5,659) (2,830) (5,321) (2,661)
Details of Upper Tier 2 Capital
Eligible component of post acquisition earnings and reserves in associates and joint ventures - 269Perpetual subordinated notes 946 975 1,026General reserve for impairment of financial assets net of attributable d f d
280 85 97Total 1,226 1,060 1,392 5 Under Basel II, “General reserve for impairment of financial assets net of attributable deferred tax asset” consists of the surplus of the general reserve for impairment of financial assets net of tax and/or the provisions attributable to the standardised portfolio.
6 “Investment in OnePath (formerly ING Australia) and ING New Zealand" were joint venture investments until November 2009.
ANZ Basel II Pillar 3 disclosure September 2010
17
Table 3 Capital adequacy
Capital Management Approach
ANZ pursues an active approach to capital management, which is designed to protect the interests of depositors, creditors and shareholders. This involves the ongoing review and Board approval of the level and composition of ANZ’s capital base, assessed against the following key policy objectives:
• Regulatory compliance such that capital levels exceed APRA’s PCRs both at Level 1 and Level 27 for Tier 1 and Total Capital, and the US Federal Reserve’s minimum Tier 1 and Total Capital adequacy requirements via ANZ’s Foreign Holding Company licence in the United States of America
• Capital levels are aligned with the risks in the business and to meet strategic and business development plans through ensuring that available capital (i.e. shareholders’ equity including preference shares and Residual Tier 1 capital) exceeds the level of Economic Capital required to support the Ratings Agency ‘default frequency’ confidence level for a “AA” credit rating category bank. Economic Capital is an internal estimate of capital levels required to support risk and unexpected losses above a desired target solvency level
• Capital levels are commensurate with ANZ maintaining its preferred “AA” credit rating category for senior long-term unsecured debt given its risk appetite outlined in its strategic plan
• An appropriate balance between maximising shareholder returns and prudent capital management principles
ANZ achieves these objectives through the ICAAP whereby ANZ conducts detailed strategic and capital planning over a medium term time horizon.
Annually, ANZ conducts a detailed strategic planning process over a three-year time horizon, the outcomes of which are embodied in the Strategic Plan. This process involves forecasting key economic variables which Business Units use to determine key financial data for their existing business. New strategic initiatives to be undertaken over the planning period and their financial impact are then determined. These processes are used for the following:
• A review of capital ratios, targets, and levels of different classes of capital against ANZ’s risk profile and risk appetite outlined in the Strategic Plan. ANZ’s capital targets reflect the key policy objectives above, and the desire to ensure that under specific stressed economic scenarios that capital levels are sufficient to remain above both Economic Capital and PCR requirements.
• Stress tests are performed under different economic conditions to ensure a comprehensive review of ANZ’s capital position both before and after mitigating actions. The stress tests determine the level of additional capital (i.e. the ‘capital buffer’ above Pillar 1 minimum capital) needed to absorb losses that may be experienced during an economic downturn.
• Stress testing is integral to strengthening the predictive approach to risk management and is a key component in managing risks, asset writing strategies and business strategies. It creates greater understanding of the impacts on financial performance through modelling relationships and sensitivities between geographic, industry and business unit exposures under a range of macro economic scenarios. ANZ has a dedicated stress testing team within Risk Management that models and reports to management and the ANZ Board’s Risk Committee on a range of scenarios and stress tests.
• Results are subsequently used to:
• Recalibrate ANZ’s management targets for minimum and operating ranges for its respective classes of capital such that ANZ will remain compliant with APRA’s PCRs and the US Federal Reserve’s minimum Tier 1 and Total Capital requirements; and
• Identify the level of organic capital generation and hence determine current and future capital requirements for the Company (Level 1) and the Group (Level 2).
From these processes, a Capital Plan is developed and approved by the Board which identifies the capital issuance and maturity profile, options around capital products, timing and markets and strategies under differing market and economic conditions.
The Capital Plan is maintained and updated through a monthly review of forecast financial performance, economic conditions and development of business initiatives and strategies. The Board and senior management are provided with monthly updates of ANZ’s capital position. Any actions required to ensure ongoing prudent capital management are submitted to the Board for approval.
7 In addition to the prudential capital oversight by APRA, ANZ’s branch operations and major banking subsidiary operations are overseen by local regulators such as the Reserve Bank of New Zealand, the US Federal Reserve and the UK Financial Services Authority who may impose minimum capitalisation rates on those operations.
ANZ Basel II Pillar 3 disclosure September 2010
18
Capital Targets
Target ratios are set to be consistent with ANZ’s risk appetite and Economic Capital methodology, plus an allowance for the impact of relevant stress testing on the capital position. The approach was developed to ensure capital requirements are manageable and consistent with long term credit ratings and minimum prudential capital requirements, even during periods of stress.
Throughout the financial year, ANZ maintained compliance with the minimum Tier 1 and Total capital ratios at Level 1 and Level 2 set by APRA, and the US Federal Reserve for Level 2, as well as applicable capitalisation rates set by local regulators in countries where ANZ operates branches and subsidiaries.
ANZ has adopted the Core Tier-1 and Tier 1 capital ratios as its principal capital management targets at Level 2. Given recent difficult economic and financial market conditions, ANZ has maintained both ratios well above its minimum target.
Regulatory change
The Basel Committee on Banking Supervision has released a series of consultation papers (Basel III) containing a number of proposals to strengthen the global capital and liquidity framework to improve the banking sector’s ability to absorb shocks arising from financial and economic stress.
The consultation papers aim to increase the quality, quantity, consistency and transparency of the capital base, whilst strengthening the risk coverage of the capital framework by:
• Increasing the minimum level of capital, with new minimum capital targets for Core Tier 1 (4.5%), Tier 1 (6.0%) and Total Capital (8.0%) to be phased in between 2013 and 2015;
• Increasing the capital buffers that banks are required to hold for stress scenarios and to dampen the impact of pro-cyclical elements of the prudential regulators. A capital conservation buffer of 2.5% and a counter-cyclical buffer of 0.0% to 2.5% will be phased in between 2016 and 2019. Failure to maintain the full capital buffers will result in limitations on the amount of current year earnings that can be paid as discretionary bonuses and to Tier 1 and Tier 2 investors as coupons and capital returns;
• Increasing Tier 1 deductions, although a number of the proposals are consistent with the current APRA prudential standards;
• Increasing the focus on Fundamental Tier 1 capital and tightening the regulations for Residual Tier 1 and Tier 2 capital instruments including a proposal that at the time of ‘non-viability’, these instruments will be written off, with any potential compensation for investors limited to an issuance of ordinary shares. Existing Tier 1 and Tier 2 instruments that do not have these requirements will be phased out between 2013 and 2022. these proposals are to be supplemented, by yet to be released details around ‘contingent capital’ and ‘bail in’ instruments, which may not initially be prudential capital, but are converted in part or in full into Fundamental Tier 1 capital at predetermined trigger points;
• Supplementing the risk adjusted capital ratio targets with the introduction of a minimum leverage ratio (Tier 1 capital divided by adjusted total assets including off balance sheet exposures) of 3.0% between 2013 and 2018.
• Introducing measures (yet to be released) to address the impact of system risk and inter connectedness risk;
• Improving transparency of reporting capital ratio calculations in the financial statements; and
• Increasing the capital requirements for traded market risk, credit risk and securitisation transactions.
The Basel Committee is expected to finalise the majority of the reforms by the end of 2010, for implementation between 2012 and 2019. Following the release of the final reforms by the Basel Committee, ANZ expects APRA to engage the Australian banking and insurance industry ahead of the development and implementation of revised Australian prudential standards. It is not possible to accurately determine the impacts associated with these reforms on ANZ, including revised operating capital targets, until APRA’s position is finalised.
ANZ Basel II Pillar 3 disclosure September 2010
19
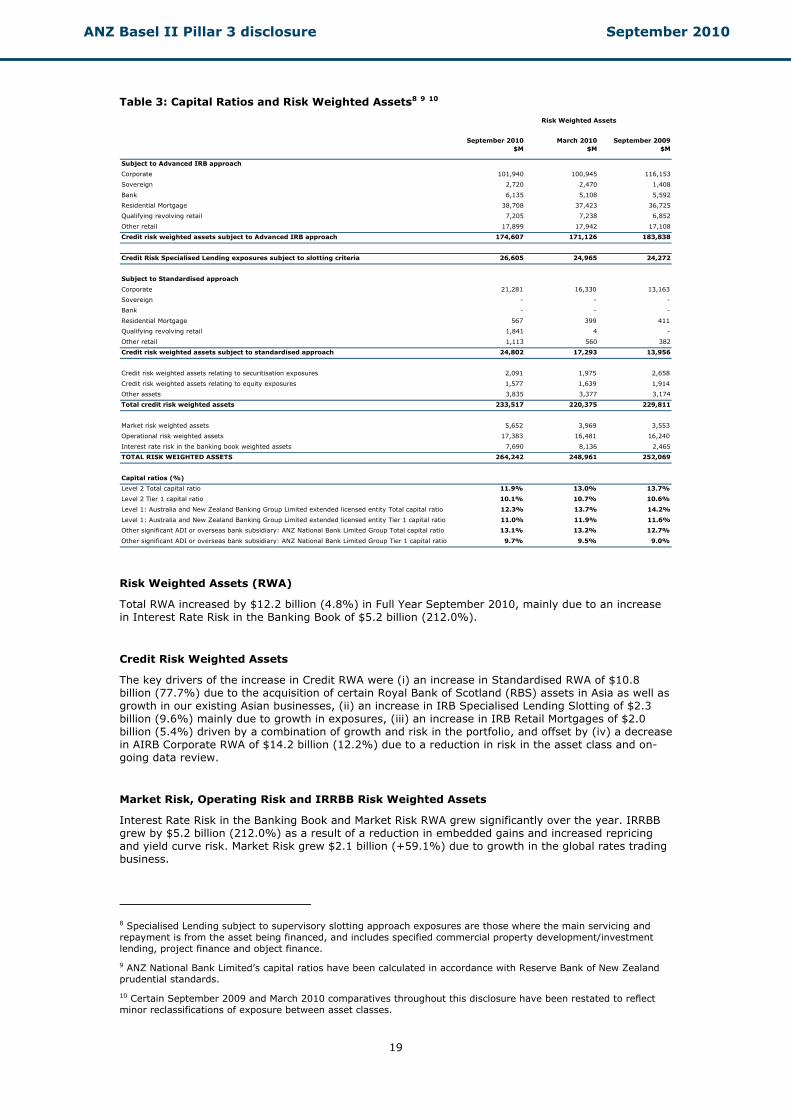
Table 3: Capital Ratios and Risk Weighted Assets8 9 10
September 2010$M
March 2010$M
September 2009$M
Subject to Advanced IRB approach
Corporate 101,940 100,945 116,153
Sovereign 2,720 2,470 1,408
Bank 6,135 5,108 5,592
Residential Mortgage 38,708 37,423 36,725
Qualifying revolving retail 7,205 7,238 6,852
Other retail 17,899 17,942 17,108
Credit risk weighted assets subject to Advanced IRB approach 174,607 171,126 183,838
Credit Risk Specialised Lending exposures subject to slotting criteria 26,605 24,965 24,272
Subject to Standardised approach
Corporate 21,281 16,330 13,163
Sovereign - - -
Bank - - -
Residential Mortgage 567 399 411
Qualifying revolving retail 1,841 4 -
Other retail 1,113 560 382
Credit risk weighted assets subject to standardised approach 24,802 17,293 13,956
Credit risk weighted assets relating to securitisation exposures 2,091 1,975 2,658
Credit risk weighted assets relating to equity exposures 1,577 1,639 1,914
Other assets 3,835 3,377 3,174
Total credit risk weighted assets 233,517 220,375 229,811
Market risk weighted assets 5,652 3,969 3,553
Operational risk weighted assets 17,383 16,481 16,240
Interest rate risk in the banking book weighted assets 7,690 8,136 2,465
TOTAL RISK WEIGHTED ASSETS 264,242 248,961 252,069
Capital ratios (%)
Level 2 Total capital ratio 11.9% 13.0% 13.7%
Level 2 Tier 1 capital ratio 10.1% 10.7% 10.6%
Level 1: Australia and New Zealand Banking Group Limited extended licensed entity Total capital ratio 12.3% 13.7% 14.2%
Level 1: Australia and New Zealand Banking Group Limited extended licensed entity Tier 1 capital ratio 11.0% 11.9% 11.6%
Other significant ADI or overseas bank subsidiary: ANZ National Bank Limited Group Total capital ratio 13.1% 13.2% 12.7%
Other significant ADI or overseas bank subsidiary: ANZ National Bank Limited Group Tier 1 capital ratio 9.7% 9.5% 9.0%
Risk Weighted Assets
Risk Weighted Assets (RWA)
Total RWA increased by $12.2 billion (4.8%) in Full Year September 2010, mainly due to an increase in Interest Rate Risk in the Banking Book of $5.2 billion (212.0%).
Credit Risk Weighted Assets
The key drivers of the increase in Credit RWA were (i) an increase in Standardised RWA of $10.8 billion (77.7%) due to the acquisition of certain Royal Bank of Scotland (RBS) assets in Asia as well as growth in our existing Asian businesses, (ii) an increase in IRB Specialised Lending Slotting of $2.3 billion (9.6%) mainly due to growth in exposures, (iii) an increase in IRB Retail Mortgages of $2.0 billion (5.4%) driven by a combination of growth and risk in the portfolio, and offset by (iv) a decrease in AIRB Corporate RWA of $14.2 billion (12.2%) due to a reduction in risk in the asset class and on-going data review.
Market Risk, Operating Risk and IRRBB Risk Weighted Assets
Interest Rate Risk in the Banking Book and Market Risk RWA grew significantly over the year. IRRBB grew by $5.2 billion (212.0%) as a result of a reduction in embedded gains and increased repricing and yield curve risk. Market Risk grew $2.1 billion (+59.1%) due to growth in the global rates trading business.
8 Specialised Lending subject to supervisory slotting approach exposures are those where the main servicing and repayment is from the asset being financed, and includes specified commercial property development/investment lending, project finance and object finance.
9 ANZ National Bank Limited’s capital ratios have been calculated in accordance with Reserve Bank of New Zealand prudential standards.
10 Certain September 2009 and March 2010 comparatives throughout this disclosure have been restated to reflect minor reclassifications of exposure between asset classes.
ANZ Basel II Pillar 3 disclosure September 2010
20
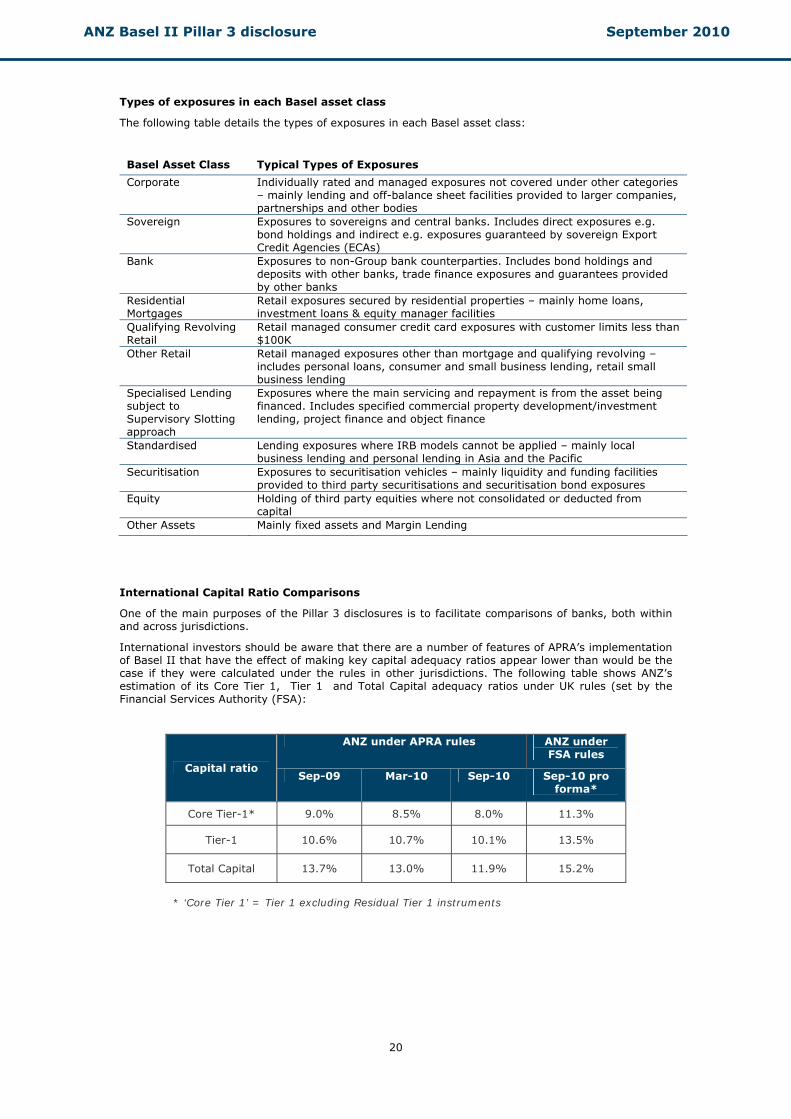
Types of exposures in each Basel asset class
The following table details the types of exposures in each Basel asset class:
Basel Asset Class Typical Types of Exposures
Corporate Individually rated and managed exposures not covered under other categories – mainly lending and off-balance sheet facilities provided to larger companies, partnerships and other bodies
Sovereign Exposures to sovereigns and central banks. Includes direct exposures e.g. bond holdings and indirect e.g. exposures guaranteed by sovereign Export Credit Agencies (ECAs)
Bank Exposures to non-Group bank counterparties. Includes bond holdings and deposits with other banks, trade finance exposures and guarantees provided by other banks
Residential Mortgages
Retail exposures secured by residential properties – mainly home loans, investment loans & equity manager facilities
Qualifying Revolving Retail
Retail managed consumer credit card exposures with customer limits less than $100K
Other Retail Retail managed exposures other than mortgage and qualifying revolving – includes personal loans, consumer and small business lending, retail small business lending
Specialised Lending subject to Supervisory Slotting approach
Exposures where the main servicing and repayment is from the asset being financed. Includes specified commercial property development/investment lending, project finance and object finance
Standardised Lending exposures where IRB models cannot be applied – mainly local business lending and personal lending in Asia and the Pacific
Securitisation Exposures to securitisation vehicles – mainly liquidity and funding facilities provided to third party securitisations and securitisation bond exposures
Equity Holding of third party equities where not consolidated or deducted from capital
Other Assets Mainly fixed assets and Margin Lending
International Capital Ratio Comparisons
One of the main purposes of the Pillar 3 disclosures is to facilitate comparisons of banks, both within and across jurisdictions.
International investors should be aware that there are a number of features of APRA’s implementation of Basel II that have the effect of making key capital adequacy ratios appear lower than would be the case if they were calculated under the rules in other jurisdictions. The following table shows ANZ’s estimation of its Core Tier 1, Tier 1 and Total Capital adequacy ratios under UK rules (set by the Financial Services Authority (FSA):
ANZ under APRA rules ANZ under FSA rules
Capital ratio Sep-09 Mar-10 Sep-10 Sep-10 pro
forma*
Core Tier-1* 9.0% 8.5% 8.0% 11.3%
Tier-1 10.6% 10.7% 10.1% 13.5%
Total Capital 13.7% 13.0% 11.9% 15.2%
* ‘Core Tier 1’ = Tier 1 excluding Residual Tier 1 instruments
ANZ Basel II Pillar 3 disclosure September 2010
21
For Tier 1 capital, the major reasons for the differences are that FSA:
• Does not require a deduction for accrued dividends (although APRA does give credit for expected shares to be issued under a dividend reinvestment plan);
• Does not require a Tier 1 deduction for certain capitalised expenses and net deferred tax assets;
• Allows the comparison of Expected Loss to Eligible Provisions for Loan Loss to be made on a gross basis and any excess is then tax effected, whereas APRA require Expected Losses to be compared to Eligible Provisions for Loan Losses net of tax, and any excess to be taken as 50% Tier-1 deduction and a 50% Tier 2 deduction; and
• Has a more favourable treatment for investments in associates and insurance and funds management subsidiaries.
For RWA, the major reasons for the differences are:
• APRA has set a 20% floor on the downturn LGD for mortgages (as compared with the 10% minimum set by the FSA):
• FSA does not require Interest Rate Risk in the Banking Book to be a Pillar I requirement so it is excluded from prudential capital adequacy ratios; and
• Differences in the treatment of specialised property lending, equity and margin lending products.
The Australian Bankers’ Association (ABA) has released a detailed fact sheet11 documenting the differences between the Australian and UK rules and the implications for prudential capital ratios.
11 bankers.asn.au
ANZ Basel II Pillar 3 disclosure September 2010
22
Chapter 5 – Credit risk
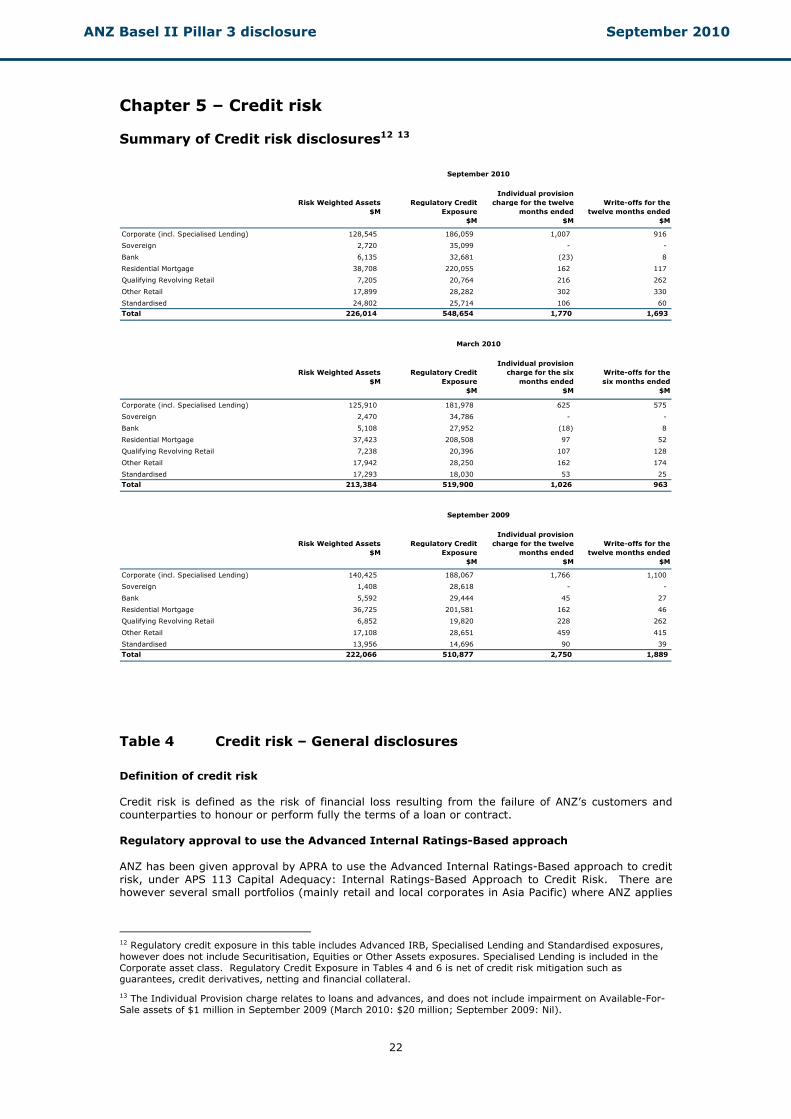
Summary of Credit risk disclosures12 13
Risk Weighted Assets$M
Regulatory CreditExposure
$M
Individual provisioncharge for the twelve
months ended$M
Write-offs for thetwelve months ended
$M
Corporate (incl. Specialised Lending) 128,545 186,059 1,007 916
Sovereign 2,720 35,099 - -
Bank 6,135 32,681 (23) 8
Residential Mortgage 38,708 220,055 162 117
Qualifying Revolving Retail 7,205 20,764 216 262
Other Retail 17,899 28,282 302 330
Standardised 24,802 25,714 106 60
Total 226,014 548,654 1,770 1,693
Risk Weighted Assets$M
Regulatory CreditExposure
$M
Individual provisioncharge for the six
months ended$M
Write-offs for thesix months ended
$M
Corporate (incl. Specialised Lending) 125,910 181,978 625 575
Sovereign 2,470 34,786 - -
Bank 5,108 27,952 (18) 8
Residential Mortgage 37,423 208,508 97 52
Qualifying Revolving Retail 7,238 20,396 107 128
Other Retail 17,942 28,250 162 174
Standardised 17,293 18,030 53 25
Total 213,384 519,900 1,026 963
Risk Weighted Assets$M
Regulatory CreditExposure
$M
Individual provisioncharge for the twelve
months ended$M
Write-offs for thetwelve months ended
$M
Corporate (incl. Specialised Lending) 140,425 188,067 1,766 1,100
Sovereign 1,408 28,618 - -
Bank 5,592 29,444 45 27
Residential Mortgage 36,725 201,581 162 46
Qualifying Revolving Retail 6,852 19,820 228 262
Other Retail 17,108 28,651 459 415
Standardised 13,956 14,696 90 39
Total 222,066 510,877 2,750 1,889
September 2009
March 2010
September 2010
Table 4 Credit risk – General disclosures
Definition of credit risk Credit risk is defined as the risk of financial loss resulting from the failure of ANZ’s customers and counterparties to honour or perform fully the terms of a loan or contract. Regulatory approval to use the Advanced Internal Ratings-Based approach ANZ has been given approval by APRA to use the Advanced Internal Ratings-Based approach to credit risk, under APS 113 Capital Adequacy: Internal Ratings-Based Approach to Credit Risk. There are however several small portfolios (mainly retail and local corporates in Asia Pacific) where ANZ applies
12 Regulatory credit exposure in this table includes Advanced IRB, Specialised Lending and Standardised exposures, however does not include Securitisation, Equities or Other Assets exposures. Specialised Lending is included in the Corporate asset class. Regulatory Credit Exposure in Tables 4 and 6 is net of credit risk mitigation such as guarantees, credit derivatives, netting and financial collateral.
13 The Individual Provision charge relates to loans and advances, and does not include impairment on Available-For-Sale assets of $1 million in September 2009 (March 2010: $20 million; September 2009: Nil).
ANZ Basel II Pillar 3 disclosure September 2010
23
the Standardised Approach to credit risk, under APS 112 Capital Adequacy: Standardised Approach to Credit Risk. Credit risk management framework and policies ANZ has a comprehensive framework to manage credit risk and support sound growth for appropriate returns. The framework is top down, being defined by credit principles and policies. Credit policies and procedures cover all aspects of the credit life cycle such as transaction structuring, risk grading, initial approval, ongoing management and problem debt management, as well as specialist policy topics. The effectiveness of the credit risk management framework is assessed through various compliance and monitoring processes. These, together with portfolio selection, define and guide the credit process, organisation and staff. Organisation
As described in Chapter 3, the Credit and Market Risk Committee (CMRC) is ANZ’s most senior executive level credit risk committee. The Credit Ratings System Oversight Committee supports the CMRC, by providing group-wide scrutiny of ANZ’s rating system.
The primary responsibility for prudent and profitable management of credit risk assets and customer relationships rests with the business units. An independent credit risk management function is staffed by risk specialists. Independence is achieved by having all credit risk staff ultimately report to the Chief Risk Officer, even where they are embedded in business units. Risk provides independent credit assessment and approval on lending decisions, and also performs key roles in portfolio management such as development and validation of credit risk measurement systems, loan asset quality reporting, and development of credit policies. The authority to make credit decisions is delegated by the Board to the CEO who in turn delegates authority to the CRO. The CRO in turn delegates some of his credit discretion to individuals as part of a ‘cascade’ of authority from senior to the most junior credit officers. Within ANZ, credit approval for almost all judgemental lending is made on a ‘dual approval’ basis, jointly by the business writer in the business unit and the respective independent credit risk officer. For retail lending, highly automated risk assessment processes mean that sole credit discretions are the norm, with assessors reviewing the output of decision tools. Individuals must complete appropriate ongoing accreditation training in order to be granted and retain a credit discretion. Credit discretions are reviewed on an annual basis, and may be varied based on the holder’s performance. Portfolio direction and performance The credit risk management framework contains several important portfolio direction and performance tools which enable Risk to play a fundamental role in monitoring the direction and performance of the portfolio. These include:
• Business writing strategies that are prepared by the businesses and set out appetite, planned portfolio growth, capital usage and risk/return profile, and also identify areas that may require attention to mitigate and improve risk management;
• Regular portfolio reviews; and
• Exposure concentration limits, covering single customers, industries and cross border risk, to ensure a diversified portfolio.
ANZ uses portfolio monitoring and analysis tools, technologies and techniques to assist with portfolio risk assessment and management. These assist in:
• Monitoring, analysing and reporting ANZ’s credit risk profile and progress in meeting portfolio objectives;
• Calculating and reporting ANZ’s Collective Provision, Economic Capital, Expected Loss, regulatory RWA and regulatory Expected Loss;
• Assessing impact of emerging issues, and conducting ad hoc investigations and analysis;
• Validating rating/scoring tools and credit estimates; and
• Ongoing review and refinement of ANZ's credit risk measurement and policy framework.
ANZ Basel II Pillar 3 disclosure September 2010
24
Reporting – Overview and Definitions Credit risk management information systems, reporting and analysis are managed centrally and at the divisional and business unit level. Periodic reporting provides confirmation of the effectiveness of processes, highlights emerging issues requiring attention and allows monitoring of portfolio trends by all levels of management and the Board. Examples of reports include exposure at default, portfolio mix, risk grade profiles and migrations, risk weighted assets, large exposure reporting, credit watch and control lists, impaired assets and provisions. Within the retail segments, monthly reporting packs are prepared that focus on such aspects as scoring and delinquency/slippage monitoring. Past due facilities Facilities where a contractual payment has not been met or the customer is outside of contractual arrangements are deemed past due. Past due facilities include those operating in excess of approved arrangements or where scheduled repayments are outstanding. Basel II definition of default ANZ uses the standard APRA definition of default, so that a default is considered to have occurred with regard to a particular obligor when either or both of the two following events have taken place:
• ANZ considers that the obligor is unlikely to pay14 its credit obligations to ANZ in full, without recourse by ANZ to actions such as realising available security; and
• The obligor is at least 90 days past due on a credit obligation to ANZ.
Restructured items Restructured items are facilities in which (1) the original terms have been modified to provide for concessions of interest, or principal, or other payments due, or for an extension in maturity for a non-commercial period for reasons related to the financial difficulties of a customer, and (2) are not considered impaired. Restructured items may include both on and off balance sheet exposures. Impaired assets Irrespective of whether a facility is 90 days past due, individually managed facilities are classified as impaired when there is doubt as to whether the contractual amounts due, including interest and other payments, will be met in a timely manner. Impaired assets include a credit valuation adjustment (CVA), which is a market assessment of the credit risk of the relevant counterparties. Individual Provisions Individual provisions are assessed on a case-by-case basis for all individually managed impaired assets taking into consideration factors such as the realisable value of security (or other credit mitigants), the likely return available upon liquidation or bankruptcy, legal uncertainties, estimated costs involved in recovery, the market price of the exposure in secondary markets and the amount and timing of expected receipts and recoveries. Write-offs Facilities are written off against the related provision for impairment when they are assessed as partially or fully uncollectable, and after proceeds from the realisation of any collateral have been received. Where individual provisions recognised in previous periods have subsequently decreased or are no longer required, such impairment losses are reversed in the current period income statement. Collective Provisions As well as holding individual provisions for credit loss, ANZ also holds a collective provision to cover credit losses which have been incurred but have not yet been specifically identified. Calculation of the collective provision involves placing exposures in pools of similar assets with similar risk characteristics. The required collective provision is estimated on the basis of historical loss
14 Elements to be taken as indications of unlikeliness to pay include the factors relating to impairment (irrespective of whether the credit obligations are well secured) or ANZ selling the credit obligation at a material credit-related economic loss.
ANZ Basel II Pillar 3 disclosure September 2010
25
experience for assets with credit risk characteristics similar to those in the collective pool and includes an allowance for inherent risk associated with the design and use of models. The initial calculation from historical loss experience may be adjusted based on current observable data such as changed economic conditions, and to take account of the impact of inherent risk of large concentrated losses within the portfolio. The methodology underpinning calculation of collective provision from historical experience is predominantly based around the product of an exposure’s Probability of Default (PD), Loss Given Default (LGD) and Exposure at Default (EAD)15. ANZ uses slightly different PD, LGD and EAD factors in the calculation of regulatory capital and expected loss (EL), due to the different requirements of APRA and accounting standards. The key differences are:
• ANZ must use more conservative LGD assumptions for regulatory capital purposes, such as the 20% LGD floor for retail mortgages and downturn LGD factors; and
• ANZ must use cycle-adjusted PDs for regulatory capital purposes, but uses point-in-time estimates to calculate provisions.
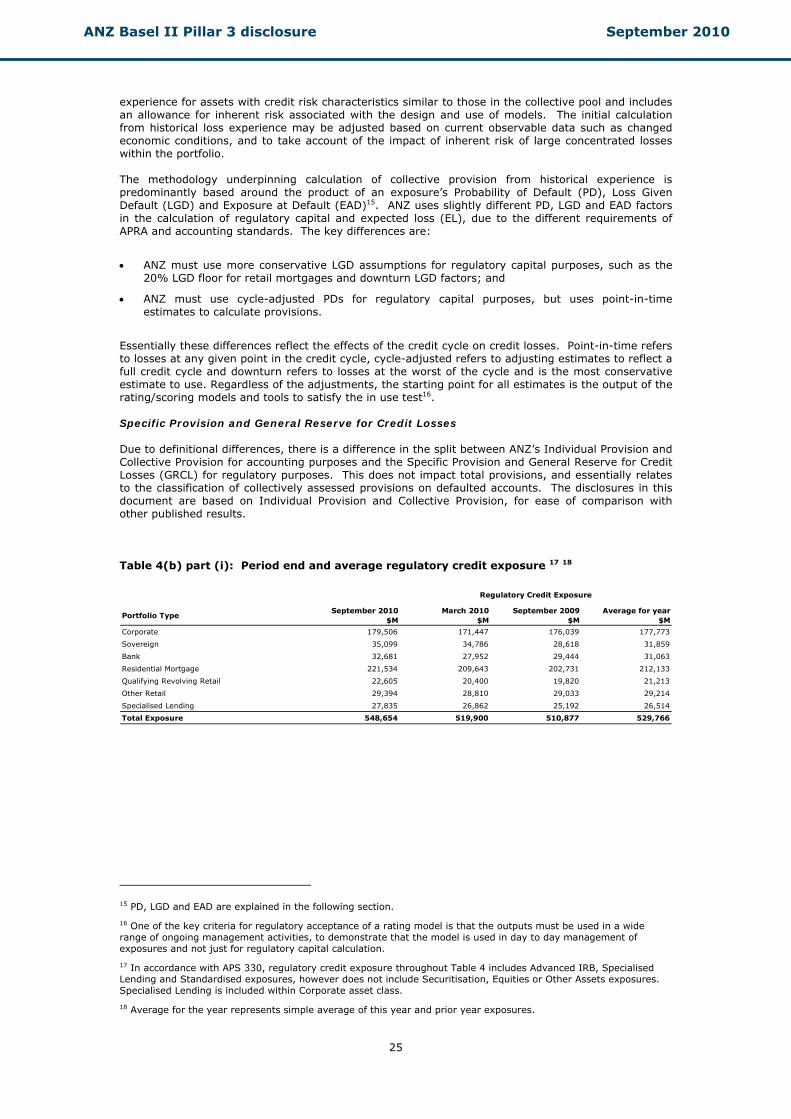
Essentially these differences reflect the effects of the credit cycle on credit losses. Point-in-time refers to losses at any given point in the credit cycle, cycle-adjusted refers to adjusting estimates to reflect a full credit cycle and downturn refers to losses at the worst of the cycle and is the most conservative estimate to use. Regardless of the adjustments, the starting point for all estimates is the output of the rating/scoring models and tools to satisfy the in use test16. Specific Provision and General Reserve for Credit Losses Due to definitional differences, there is a difference in the split between ANZ’s Individual Provision and Collective Provision for accounting purposes and the Specific Provision and General Reserve for Credit Losses (GRCL) for regulatory purposes. This does not impact total provisions, and essentially relates to the classification of collectively assessed provisions on defaulted accounts. The disclosures in this document are based on Individual Provision and Collective Provision, for ease of comparison with other published results. Table 4(b) part (i): Period end and average regulatory credit exposure 17 18
Portfolio TypeSeptember 2010
$MMarch 2010
$MSeptember 2009
$MAverage for year
$M
Corporate 179,506 171,447 176,039 177,773
Sovereign 35,099 34,786 28,618 31,859
Bank 32,681 27,952 29,444 31,063
Residential Mortgage 221,534 209,643 202,731 212,133
Qualifying Revolving Retail 22,605 20,400 19,820 21,213
Other Retail 29,394 28,810 29,033 29,214
Specialised Lending 27,835 26,862 25,192 26,514
Total Exposure 548,654 519,900 510,877 529,766
Regulatory Credit Exposure
15 PD, LGD and EAD are explained in the following section.
16 One of the key criteria for regulatory acceptance of a rating model is that the outputs must be used in a wide range of ongoing management activities, to demonstrate that the model is used in day to day management of exposures and not just for regulatory capital calculation.
17 In accordance with APS 330, regulatory credit exposure throughout Table 4 includes Advanced IRB, Specialised Lending and Standardised exposures, however does not include Securitisation, Equities or Other Assets exposures. Specialised Lending is included within Corporate asset class.
18 Average for the year represents simple average of this year and prior year exposures.
ANZ Basel II Pillar 3 disclosure September 2010
26
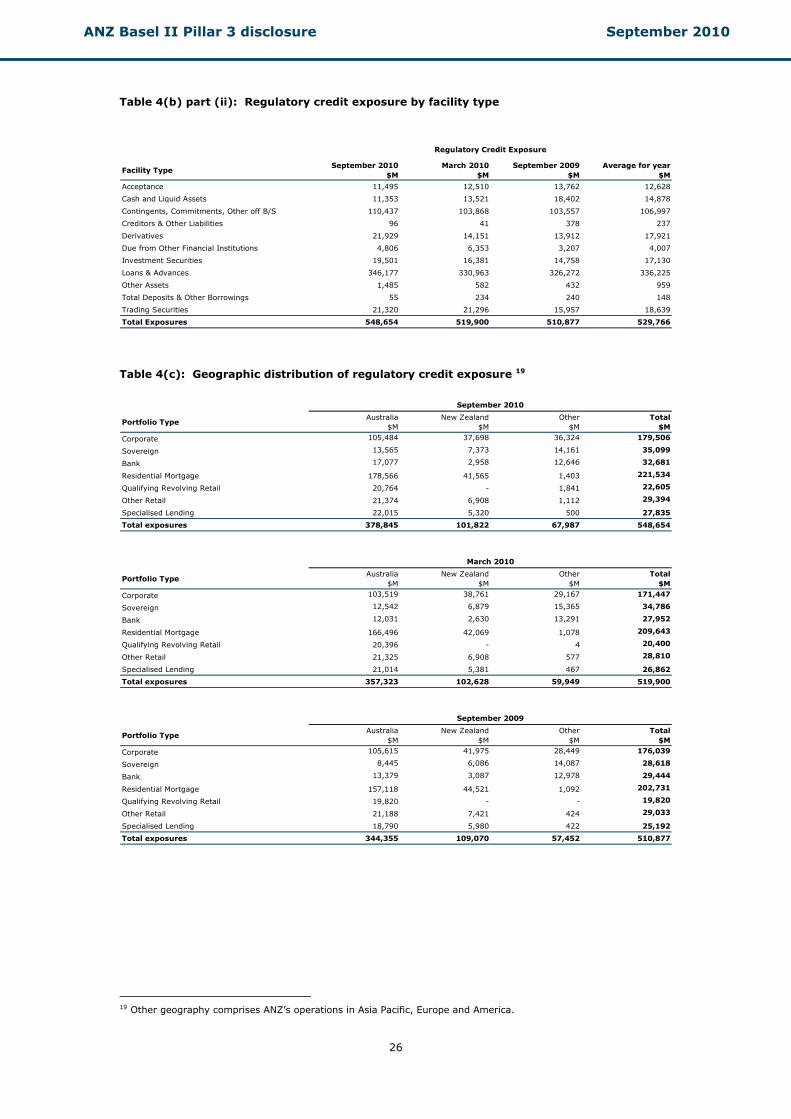
Table 4(b) part (ii): Regulatory credit exposure by facility type
Facility TypeSeptember 2010
$MMarch 2010
$MSeptember 2009
$MAverage for year
$M
Acceptance 11,495 12,510 13,762 12,628
Cash and Liquid Assets 11,353 13,521 18,402 14,878
Contingents, Commitments, Other off B/S 110,437 103,868 103,557 106,997
Creditors & Other Liabilities 96 41 378 237
Derivatives 21,929 14,151 13,912 17,921
Due from Other Financial Institutions 4,806 6,353 3,207 4,007
Investment Securities 19,501 16,381 14,758 17,130
Loans & Advances 346,177 330,963 326,272 336,225
Other Assets 1,485 582 432 959
Total Deposits & Other Borrowings 55 234 240 148
Trading Securities 21,320 21,296 15,957 18,639
Total Exposures 548,654 519,900 510,877 529,766
Regulatory Credit Exposure
Table 4(c): Geographic distribution of regulatory credit exposure 19
Portfolio TypeAustralia
$MNew Zealand
$MOther
$MTotal
$M
Corporate 105,484 37,698 36,324 179,506
Sovereign 13,565 7,373 14,161 35,099
Bank 17,077 2,958 12,646 32,681
Residential Mortgage 178,566 41,565 1,403 221,534
Qualifying Revolving Retail 20,764 - 1,841 22,605
Other Retail 21,374 6,908 1,112 29,394
Specialised Lending 22,015 5,320 500 27,835
Total exposures 378,845 101,822 67,987 548,654
Portfolio TypeAustralia
$MNew Zealand
$MOther
$MTotal
$M
Corporate 103,519 38,761 29,167 171,447
Sovereign 12,542 6,879 15,365 34,786
Bank 12,031 2,630 13,291 27,952
Residential Mortgage 166,496 42,069 1,078 209,643
Qualifying Revolving Retail 20,396 - 4 20,400
Other Retail 21,325 6,908 577 28,810
Specialised Lending 21,014 5,381 467 26,862
Total exposures 357,323 102,628 59,949 519,900
Portfolio TypeAustralia
$MNew Zealand
$MOther
$MTotal
$M
Corporate 105,615 41,975 28,449 176,039
Sovereign 8,445 6,086 14,087 28,618
Bank 13,379 3,087 12,978 29,444
Residential Mortgage 157,118 44,521 1,092 202,731
Qualifying Revolving Retail 19,820 - - 19,820
Other Retail 21,188 7,421 424 29,033
Specialised Lending 18,790 5,980 422 25,192
Total exposures 344,355 109,070 57,452 510,877
September 2009
March 2010
September 2010
19 Other geography comprises ANZ’s operations in Asia Pacific, Europe and America.
ANZ Basel II Pillar 3 disclosure September 2010 September 2010
27
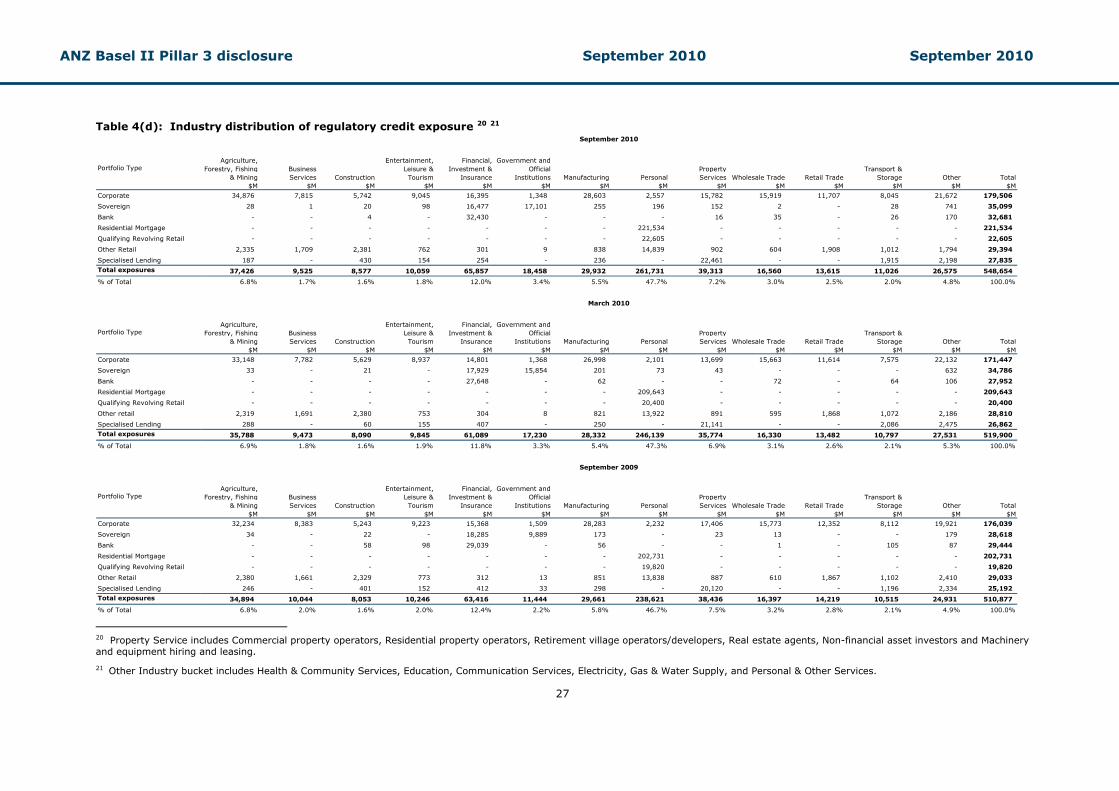
Table 4(d): Industry distribution of regulatory credit exposure 20 21
Portfolio TypeAgriculture,
Forestry, Fishing& Mining
$M
BusinessServices
$MConstruction
$M
Entertainment,Leisure &Tourism
$M
Financial,Investment &
Insurance$M
Government andOfficial
Institutions$M
Manufacturing$M
Personal$M
PropertyServices
$MWholesale Trade
$MRetail Trade
$M
Transport &Storage
$MOther
$MTotal
$M
Corporate 34,876 7,815 5,742 9,045 16,395 1,348 28,603 2,557 15,782 15,919 11,707 8,045 21,672 179,506
Sovereign 28 1 20 98 16,477 17,101 255 196 152 2 - 28 741 35,099
Bank - - 4 - 32,430 - - - 16 35 - 26 170 32,681
Residential Mortgage - - - - - - - 221,534 - - - - - 221,534
Qualifying Revolving Retail - - - - - - - 22,605 - - - - - 22,605
Other Retail 2,335 1,709 2,381 762 301 9 838 14,839 902 604 1,908 1,012 1,794 29,394
Specialised Lending 187 - 430 154 254 - 236 - 22,461 - - 1,915 2,198 27,835 Total exposures 37,426 9,525 8,577 10,059 65,857 18,458 29,932 261,731 39,313 16,560 13,615 11,026 26,575 548,654
% of Total 6.8% 1.7% 1.6% 1.8% 12.0% 3.4% 5.5% 47.7% 7.2% 3.0% 2.5% 2.0% 4.8% 100.0%
Portfolio TypeAgriculture,
Forestry, Fishing& Mining
$M
BusinessServices
$MConstruction
$M
Entertainment,Leisure &Tourism
$M
Financial,Investment &
Insurance$M
Government andOfficial
Institutions$M
Manufacturing$M
Personal$M
PropertyServices
$MWholesale Trade
$MRetail Trade
$M
Transport &Storage
$MOther
$MTotal
$M
Corporate 33,148 7,782 5,629 8,937 14,801 1,368 26,998 2,101 13,699 15,663 11,614 7,575 22,132 171,447
Sovereign 33 - 21 - 17,929 15,854 201 73 43 - - - 632 34,786
Bank - - - - 27,648 - 62 - - 72 - 64 106 27,952
Residential Mortgage - - - - - - - 209,643 - - - - - 209,643
Qualifying Revolving Retail - - - - - - - 20,400 - - - - - 20,400
Other retail 2,319 1,691 2,380 753 304 8 821 13,922 891 595 1,868 1,072 2,186 28,810
Specialised Lending 288 - 60 155 407 - 250 - 21,141 - - 2,086 2,475 26,862 Total exposures 35,788 9,473 8,090 9,845 61,089 17,230 28,332 246,139 35,774 16,330 13,482 10,797 27,531 519,900
% of Total 6.9% 1.8% 1.6% 1.9% 11.8% 3.3% 5.4% 47.3% 6.9% 3.1% 2.6% 2.1% 5.3% 100.0%
Portfolio TypeAgriculture,
Forestry, Fishing& Mining
$M
BusinessServices
$MConstruction
$M
Entertainment,Leisure &Tourism
$M
Financial,Investment &
Insurance$M
Government andOfficial
Institutions$M
Manufacturing$M
Personal$M
PropertyServices
$MWholesale Trade
$MRetail Trade
$M
Transport &Storage
$MOther
$MTotal
$MCorporate 32,234 8,383 5,243 9,223 15,368 1,509 28,283 2,232 17,406 15,773 12,352 8,112 19,921 176,039
Sovereign 34 - 22 - 18,285 9,889 173 - 23 13 - - 179 28,618
Bank - - 58 98 29,039 - 56 - - 1 - 105 87 29,444
Residential Mortgage - - - - - - - 202,731 - - - - - 202,731
Qualifying Revolving Retail - - - - - - - 19,820 - - - - - 19,820
Other Retail 2,380 1,661 2,329 773 312 13 851 13,838 887 610 1,867 1,102 2,410 29,033
Specialised Lending 246 - 401 152 412 33 298 - 20,120 - - 1,196 2,334 25,192
Total exposures 34,894 10,044 8,053 10,246 63,416 11,444 29,661 238,621 38,436 16,397 14,219 10,515 24,931 510,877
% of Total 6.8% 2.0% 1.6% 2.0% 12.4% 2.2% 5.8% 46.7% 7.5% 3.2% 2.8% 2.1% 4.9% 100.0%
September 2009
March 2010
September 2010
20 Property Service includes Commercial property operators, Residential property operators, Retirement village operators/developers, Real estate agents, Non-financial asset investors and Machinery and equipment hiring and leasing.
21 Other Industry bucket includes Health & Community Services, Education, Communication Services, Electricity, Gas & Water Supply, and Personal & Other Services.
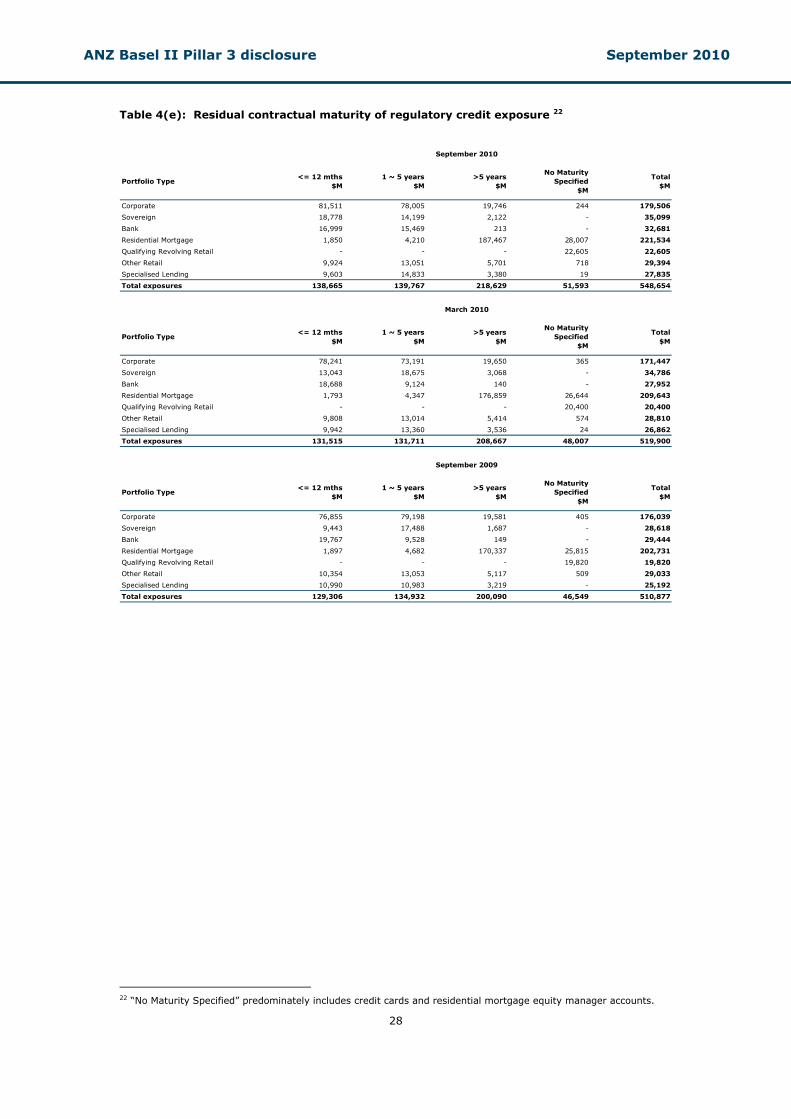
ANZ Basel II Pillar 3 disclosure September 2010
28
Table 4(e): Residual contractual maturity of regulatory credit exposure 22
Portfolio Type<= 12 mths
$M1 ~ 5 years
$M>5 years
$M
No MaturitySpecified
$M
Total$M
Corporate 81,511 78,005 19,746 244 179,506
Sovereign 18,778 14,199 2,122 - 35,099
Bank 16,999 15,469 213 - 32,681
Residential Mortgage 1,850 4,210 187,467 28,007 221,534
Qualifying Revolving Retail - - - 22,605 22,605
Other Retail 9,924 13,051 5,701 718 29,394
Specialised Lending 9,603 14,833 3,380 19 27,835
Total exposures 138,665 139,767 218,629 51,593 548,654
Portfolio Type<= 12 mths
$M1 ~ 5 years
$M>5 years
$M
No MaturitySpecified
$M
Total$M
Corporate 78,241 73,191 19,650 365 171,447
Sovereign 13,043 18,675 3,068 - 34,786
Bank 18,688 9,124 140 - 27,952
Residential Mortgage 1,793 4,347 176,859 26,644 209,643
Qualifying Revolving Retail - - - 20,400 20,400
Other Retail 9,808 13,014 5,414 574 28,810
Specialised Lending 9,942 13,360 3,536 24 26,862
Total exposures 131,515 131,711 208,667 48,007 519,900
Portfolio Type<= 12 mths
$M1 ~ 5 years
$M>5 years
$M
No MaturitySpecified
$M
Total$M
Corporate 76,855 79,198 19,581 405 176,039
Sovereign 9,443 17,488 1,687 - 28,618
Bank 19,767 9,528 149 - 29,444
Residential Mortgage 1,897 4,682 170,337 25,815 202,731
Qualifying Revolving Retail - - - 19,820 19,820
Other Retail 10,354 13,053 5,117 509 29,033
Specialised Lending 10,990 10,983 3,219 - 25,192
Total exposures 129,306 134,932 200,090 46,549 510,877
September 2010
March 2010
September 2009
22 “No Maturity Specified” predominately includes credit cards and residential mortgage equity manager accounts.
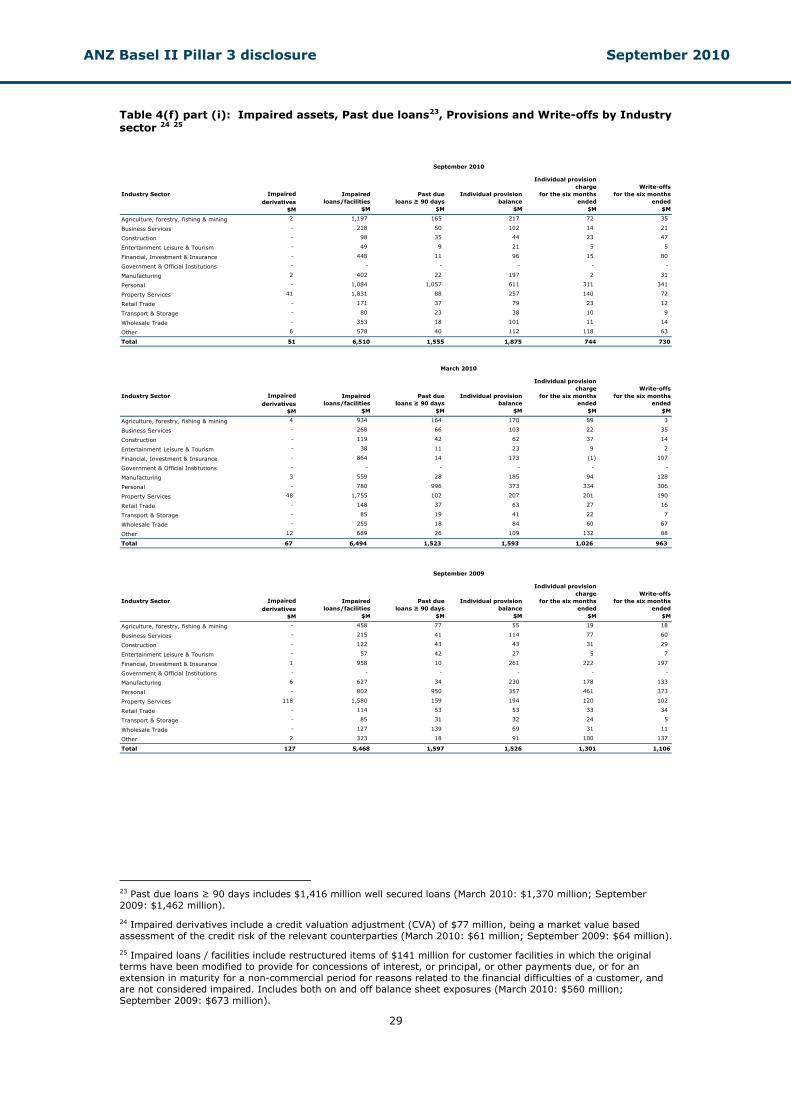
ANZ Basel II Pillar 3 disclosure September 2010
29
Table 4(f) part (i): Impaired assets, Past due loans23, Provisions and Write-offs by Industry sector 24 25
Industry Sector Impairedderivatives
$M
Impairedloans/facilities
$M
Past dueloans ≥ 90 days
$M
Individual provisionbalance
$M
Individual provision charge
for the six monthsended
$M
Write-offsfor the six months
ended$M
Agriculture, forestry, fishing & mining 2 1,197 165 217 72 35
Business Services - 218 50 102 14 21
Construction - 98 35 44 23 47
Entertainment Leisure & Tourism - 49 9 21 5 5
Financial, Investment & Insurance - 448 11 96 15 80
Government & Official Institutions - - - - - -
Manufacturing 2 402 22 197 2 31
Personal - 1,084 1,057 611 311 341
Property Services 41 1,831 88 257 140 72
Retail Trade - 171 37 79 23 12
Transport & Storage - 80 23 38 10 9
Wholesale Trade - 353 18 101 11 14
Other 6 578 40 112 118 63
Total 51 6,510 1,555 1,875 744 730
Industry Sector Impairedderivatives
$M
Impairedloans/facilities
$M
Past dueloans ≥ 90 days
$M
Individual provisionbalance
$M
Individual provision charge
for the six monthsended
$M
Write-offsfor the six months
ended$M
Agriculture, forestry, fishing & mining 4 934 164 170 89 3
Business Services - 268 66 103 22 35
Construction - 119 42 62 37 14
Entertainment Leisure & Tourism - 38 11 23 9 2
Financial, Investment & Insurance - 864 14 173 (1) 107
Government & Official Institutions - - - - - -
Manufacturing 3 559 28 185 94 128
Personal - 780 996 373 334 306
Property Services 48 1,755 102 207 201 190
Retail Trade - 148 37 63 27 16
Transport & Storage - 85 19 41 22 7
Wholesale Trade - 255 18 84 60 67
Other 12 689 26 109 132 88
Total 67 6,494 1,523 1,593 1,026 963
Industry Sector Impairedderivatives
$M
Impairedloans/facilities
$M
Past dueloans ≥ 90 days
$M
Individual provisionbalance
$M
Individual provision charge
for the six monthsended
$M
Write-offsfor the six months
ended$M
Agriculture, forestry, fishing & mining - 458 77 55 19 18
Business Services - 215 41 114 77 60
Construction - 122 43 43 31 29
Entertainment Leisure & Tourism - 57 42 27 5 7
Financial, Investment & Insurance 1 958 10 261 222 197
Government & Official Institutions - - - - - -
Manufacturing 6 627 34 230 178 133
Personal - 802 950 357 461 373
Property Services 118 1,580 159 194 120 102
Retail Trade - 114 53 53 33 34
Transport & Storage - 85 31 32 24 5
Wholesale Trade - 127 139 69 31 11
Other 2 323 18 91 100 137
Total 127 5,468 1,597 1,526 1,301 1,106
September 2010
September 2009
March 2010
23 Past due loans ≥ 90 days includes $1,416 million well secured loans (March 2010: $1,370 million; September 2009: $1,462 million).
24 Impaired derivatives include a credit valuation adjustment (CVA) of $77 million, being a market value based assessment of the credit risk of the relevant counterparties (March 2010: $61 million; September 2009: $64 million).
25 Impaired loans / facilities include restructured items of $141 million for customer facilities in which the original terms have been modified to provide for concessions of interest, or principal, or other payments due, or for an extension in maturity for a non-commercial period for reasons related to the financial difficulties of a customer, and are not considered impaired. Includes both on and off balance sheet exposures (March 2010: $560 million; September 2009: $673 million).
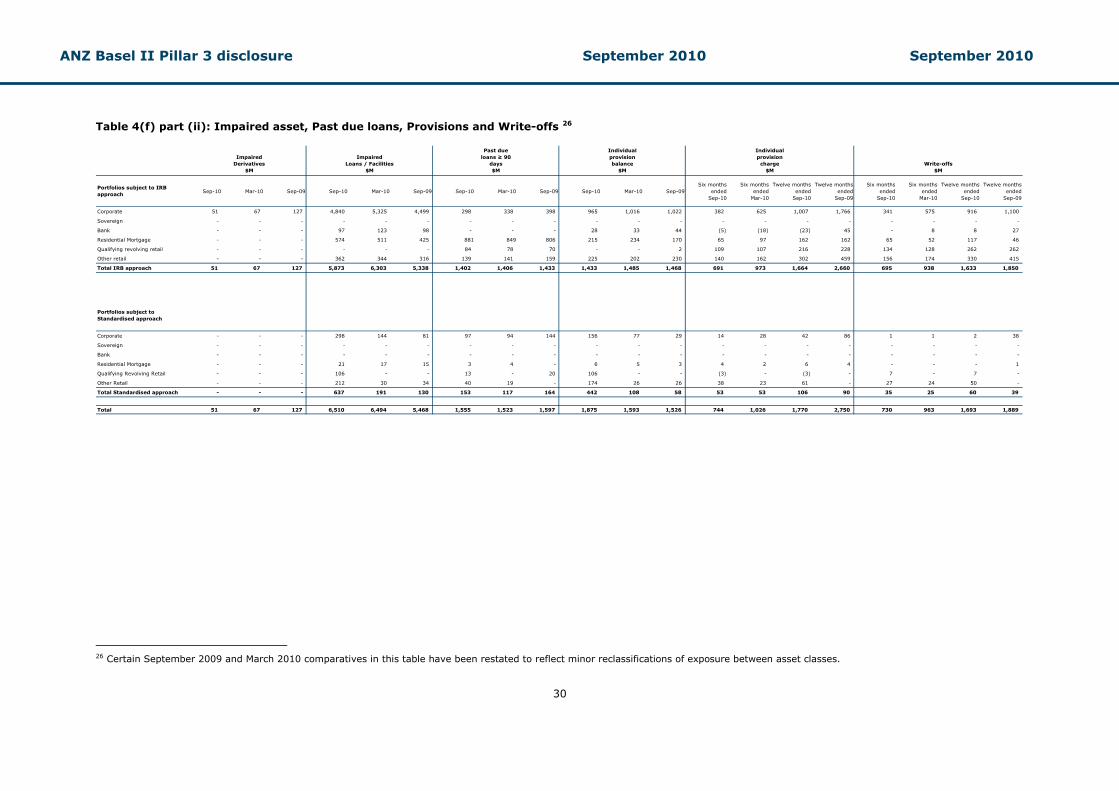
ANZ Basel II Pillar 3 disclosure September 2010 September 2010
30
Table 4(f) part (ii): Impaired asset, Past due loans, Provisions and Write-offs 26
Sep-10 Mar-10 Sep-09 Sep-10 Mar-10 Sep-09 Sep-10 Mar-10 Sep-09 Sep-10 Mar-10 Sep-09Six months
endedSep-10
Six monthsended
Mar-10
Twelve monthsended
Sep-10
Twelve monthsended
Sep-09
Six monthsended
Sep-10
Six monthsended
Mar-10
Twelve monthsended
Sep-10
Twelve monthsended
Sep-09
Corporate 51 67 127 4,840 5,325 4,499 298 338 398 965 1,016 1,022 382 625 1,007 1,766 341 575 916 1,100
Sovereign - - - - - - - - - - - - - - - - - - - -
Bank - - - 97 123 98 - - - 28 33 44 (5) (18) (23) 45 - 8 8 27
Residential Mortgage - - - 574 511 425 881 849 806 215 234 170 65 97 162 162 65 52 117 46
Qualifying revolving retail - - - - - - 84 78 70 - - 2 109 107 216 228 134 128 262 262
Other retail - - - 362 344 316 139 141 159 225 202 230 140 162 302 459 156 174 330 415
Total IRB approach 51 67 127 5,873 6,303 5,338 1,402 1,406 1,433 1,433 1,485 1,468 691 973 1,664 2,660 695 938 1,633 1,850
Corporate - - - 298 144 81 97 94 144 156 77 29 14 28 42 86 1 1 2 38
Sovereign - - - - - - - - - - - - - - - - - - - -
Bank - - - - - - - - - - - - - - - - - - - -
Residential Mortgage - - - 21 17 15 3 4 - 6 5 3 4 2 6 4 - - - 1
Qualifying Revolving Retail - - - 106 - - 13 - 20 106 - - (3) - (3) - 7 - 7 -
Other Retail - - - 212 30 34 40 19 - 174 26 26 38 23 61 - 27 24 50 -
Total Standardised approach - - - 637 191 130 153 117 164 442 108 58 53 53 106 90 35 25 60 39
Total 51 67 127 6,510 6,494 5,468 1,555 1,523 1,597 1,875 1,593 1,526 744 1,026 1,770 2,750 730 963 1,693 1,889
Portfolios subject to IRB approach
ImpairedDerivatives
$M
ImpairedLoans / Facilities
$M
Past dueloans ≥ 90
days$M
Write-offs$M
Portfolios subject to Standardised approach
Individualprovisionbalance
$M
Individualprovision
charge$M
26 Certain September 2009 and March 2010 comparatives in this table have been restated to reflect minor reclassifications of exposure between asset classes.
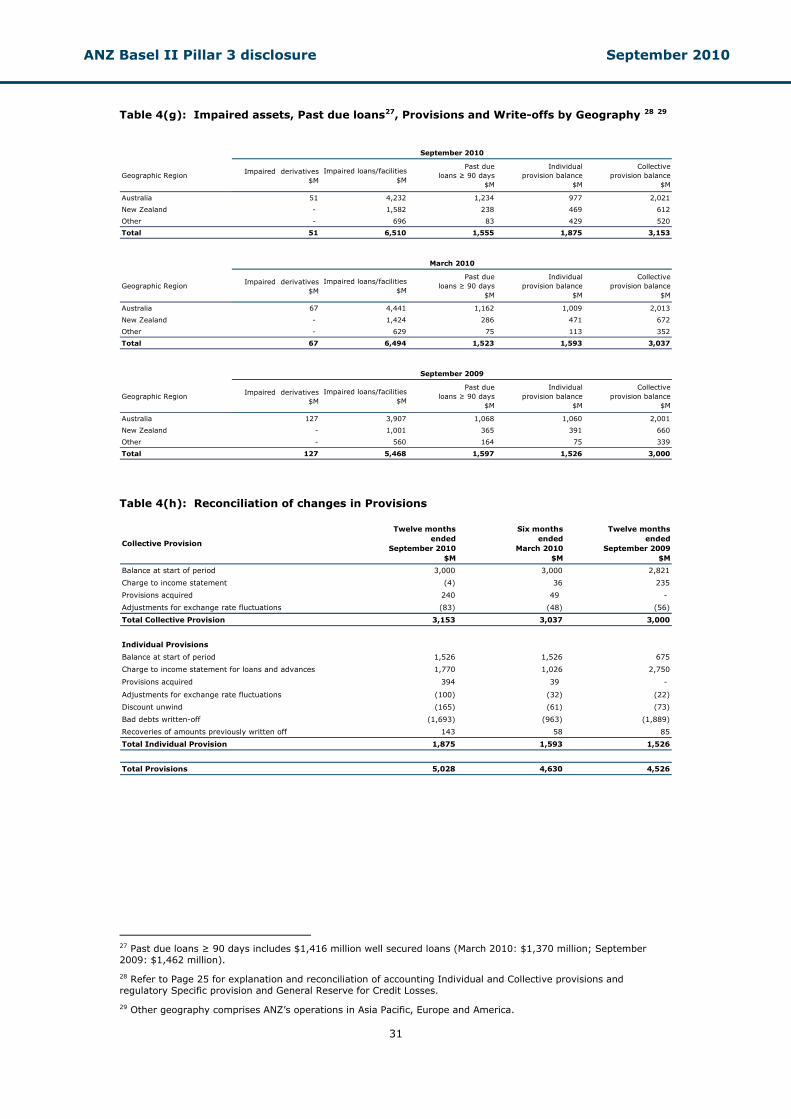
ANZ Basel II Pillar 3 disclosure September 2010
31
Table 4(g): Impaired assets, Past due loans27, Provisions and Write-offs by Geography 28 29
Geographic RegionImpaired derivatives
$MImpaired loans/facilities
$M
Past dueloans ≥ 90 days
$M
Individualprovision balance
$M
Collectiveprovision balance
$M
Australia 51 4,232 1,234 977 2,021
New Zealand - 1,582 238 469 612
Other - 696 83 429 520
Total 51 6,510 1,555 1,875 3,153
Geographic RegionImpaired derivatives
$MImpaired loans/facilities
$M
Past dueloans ≥ 90 days
$M
Individualprovision balance
$M
Collectiveprovision balance
$M
Australia 67 4,441 1,162 1,009 2,013
New Zealand - 1,424 286 471 672
Other - 629 75 113 352
Total 67 6,494 1,523 1,593 3,037
Geographic RegionImpaired derivatives
$MImpaired loans/facilities
$M
Past dueloans ≥ 90 days
$M
Individualprovision balance
$M
Collectiveprovision balance
$M
Australia 127 3,907 1,068 1,060 2,001
New Zealand - 1,001 365 391 660
Other - 560 164 75 339
Total 127 5,468 1,597 1,526 3,000
September 2009
March 2010
September 2010
Table 4(h): Reconciliation of changes in Provisions
Collective Provision
Twelve monthsended
September 2010$M
Six monthsended
March 2010$M
Twelve monthsended
September 2009$M
Balance at start of period 3,000 3,000 2,821
Charge to income statement (4) 36 235
Provisions acquired 240 49 -
Adjustments for exchange rate fluctuations (83) (48) (56)
Total Collective Provision 3,153 3,037 3,000
Individual Provisions
Balance at start of period 1,526 1,526 675
Charge to income statement for loans and advances 1,770 1,026 2,750
Provisions acquired 394 39 -
Adjustments for exchange rate fluctuations (100) (32) (22)
Discount unwind (165) (61) (73)
Bad debts written-off (1,693) (963) (1,889)
Recoveries of amounts previously written off 143 58 85
Total Individual Provision 1,875 1,593 1,526
Total Provisions 5,028 4,630 4,526
27 Past due loans ≥ 90 days includes $1,416 million well secured loans (March 2010: $1,370 million; September 2009: $1,462 million).
28 Refer to Page 25 for explanation and reconciliation of accounting Individual and Collective provisions and regulatory Specific provision and General Reserve for Credit Losses.
29 Other geography comprises ANZ’s operations in Asia Pacific, Europe and America.
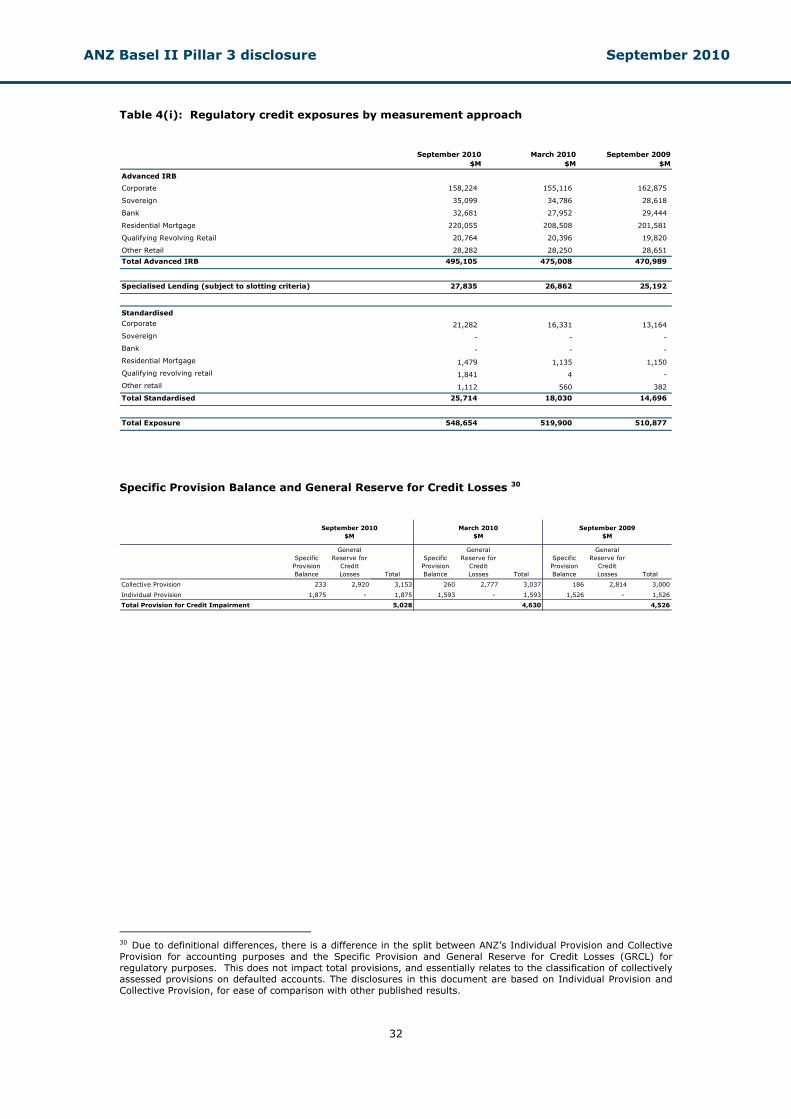
ANZ Basel II Pillar 3 disclosure September 2010
32
Table 4(i): Regulatory credit exposures by measurement approach
September 2010
$MMarch 2010
$MSeptember 2009
$M
Advanced IRB
Corporate 158,224 155,116 162,875
Sovereign 35,099 34,786 28,618
Bank 32,681 27,952 29,444
Residential Mortgage 220,055 208,508 201,581
Qualifying Revolving Retail 20,764 20,396 19,820
Other Retail 28,282 28,250 28,651
Total Advanced IRB 495,105 475,008 470,989
Specialised Lending (subject to slotting criteria) 27,835 26,862 25,192
Standardised
Corporate 21,282 16,331 13,164
Sovereign - - -
Bank - - -
Residential Mortgage 1,479 1,135 1,150
Qualifying revolving retail 1,841 4 -
Other retail 1,112 560 382
Total Standardised 25,714 18,030 14,696
Total Exposure 548,654 519,900 510,877 Specific Provision Balance and General Reserve for Credit Losses 30
Specific Provision Balance
General Reserve for
Credit Losses Total
Specific Provision Balance
General Reserve for
Credit Losses Total
Specific Provision Balance
General Reserve for
Credit Losses Total
Collective Provision 233 2,920 3,153 260 2,777 3,037 186 2,814 3,000
Individual Provision 1,875 - 1,875 1,593 - 1,593 1,526 - 1,526
Total Provision for Credit Impairment 5,028 4,630 4,526
March 2010$M
September 2009$M
September 2010$M
30 Due to definitional differences, there is a difference in the split between ANZ’s Individual Provision and Collective Provision for accounting purposes and the Specific Provision and General Reserve for Credit Losses (GRCL) for regulatory purposes. This does not impact total provisions, and essentially relates to the classification of collectively assessed provisions on defaulted accounts. The disclosures in this document are based on Individual Provision and Collective Provision, for ease of comparison with other published results.
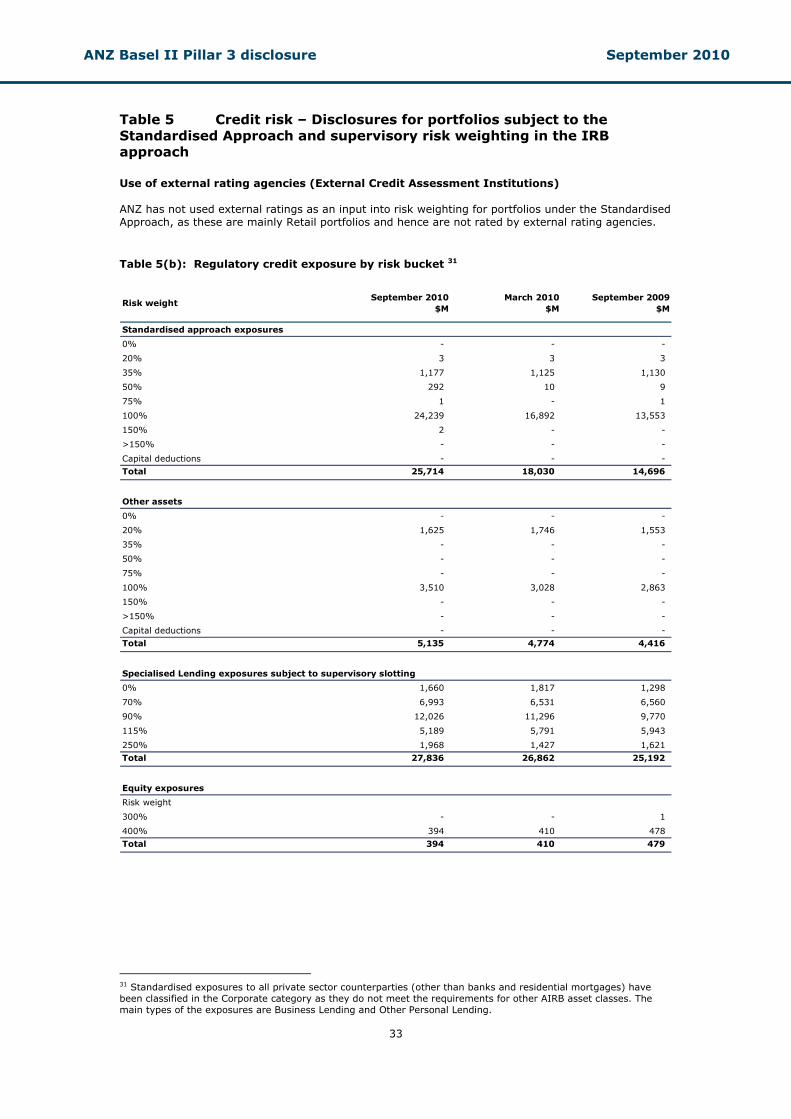
ANZ Basel II Pillar 3 disclosure September 2010
33
Table 5 Credit risk – Disclosures for portfolios subject to the Standardised Approach and supervisory risk weighting in the IRB approach Use of external rating agencies (External Credit Assessment Institutions) ANZ has not used external ratings as an input into risk weighting for portfolios under the Standardised Approach, as these are mainly Retail portfolios and hence are not rated by external rating agencies. Table 5(b): Regulatory credit exposure by risk bucket 31
Risk weightSeptember 2010
$MMarch 2010
$MSeptember 2009
$M
Standardised approach exposures
0% - - -
20% 3 3 3
35% 1,177 1,125 1,130
50% 292 10 9
75% 1 - 1
100% 24,239 16,892 13,553
150% 2 - -
>150% - - -
Capital deductions - - -
Total 25,714 18,030 14,696
Other assets
0% - - -
20% 1,625 1,746 1,553
35% - - -
50% - - -
75% - - -
100% 3,510 3,028 2,863
150% - - -
>150% - - -
Capital deductions - - -
Total 5,135 4,774 4,416
Specialised Lending exposures subject to supervisory slotting
0% 1,660 1,817 1,298
70% 6,993 6,531 6,560
90% 12,026 11,296 9,770
115% 5,189 5,791 5,943
250% 1,968 1,427 1,621
Total 27,836 26,862 25,192
Equity exposures
Risk weight
300% - - 1
400% 394 410 478
Total 394 410 479
31 Standardised exposures to all private sector counterparties (other than banks and residential mortgages) have been classified in the Corporate category as they do not meet the requirements for other AIRB asset classes. The main types of the exposures are Business Lending and Other Personal Lending.
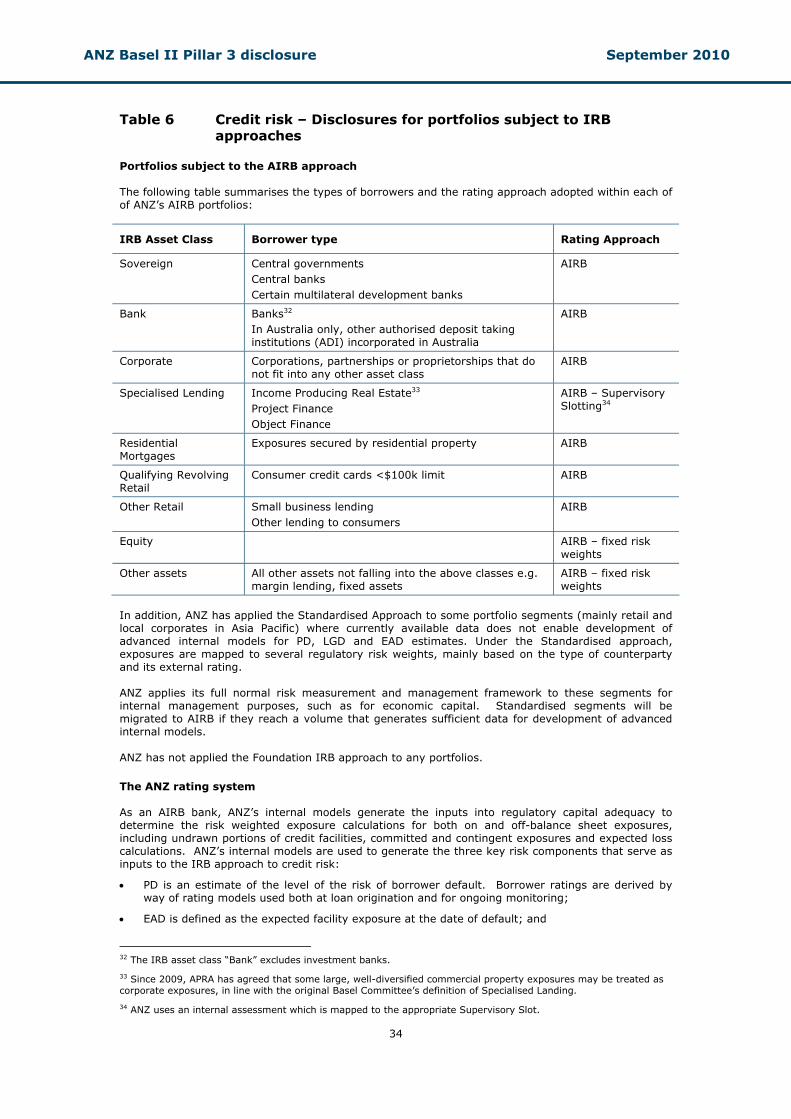
ANZ Basel II Pillar 3 disclosure September 2010
34
Table 6 Credit risk – Disclosures for portfolios subject to IRB approaches
Portfolios subject to the AIRB approach The following table summarises the types of borrowers and the rating approach adopted within each of of ANZ’s AIRB portfolios:
IRB Asset Class Borrower type Rating Approach
Sovereign Central governments Central banks Certain multilateral development banks
AIRB
Bank Banks32 In Australia only, other authorised deposit taking institutions (ADI) incorporated in Australia
AIRB
Corporate Corporations, partnerships or proprietorships that do not fit into any other asset class
AIRB
Specialised Lending Income Producing Real Estate33 Project Finance Object Finance
AIRB – Supervisory Slotting34
Residential Mortgages
Exposures secured by residential property AIRB
Qualifying Revolving Retail
Consumer credit cards <$100k limit AIRB
Other Retail Small business lending Other lending to consumers
AIRB
Equity AIRB – fixed risk weights
Other assets All other assets not falling into the above classes e.g. margin lending, fixed assets
AIRB – fixed risk weights
In addition, ANZ has applied the Standardised Approach to some portfolio segments (mainly retail and local corporates in Asia Pacific) where currently available data does not enable development of advanced internal models for PD, LGD and EAD estimates. Under the Standardised approach, exposures are mapped to several regulatory risk weights, mainly based on the type of counterparty and its external rating. ANZ applies its full normal risk measurement and management framework to these segments for internal management purposes, such as for economic capital. Standardised segments will be migrated to AIRB if they reach a volume that generates sufficient data for development of advanced internal models. ANZ has not applied the Foundation IRB approach to any portfolios.
The ANZ rating system As an AIRB bank, ANZ’s internal models generate the inputs into regulatory capital adequacy to determine the risk weighted exposure calculations for both on and off-balance sheet exposures, including undrawn portions of credit facilities, committed and contingent exposures and expected loss calculations. ANZ’s internal models are used to generate the three key risk components that serve as inputs to the IRB approach to credit risk:
• PD is an estimate of the level of the risk of borrower default. Borrower ratings are derived by way of rating models used both at loan origination and for ongoing monitoring;
• EAD is defined as the expected facility exposure at the date of default; and
32 The IRB asset class “Bank” excludes investment banks.
33 Since 2009, APRA has agreed that some large, well-diversified commercial property exposures may be treated as corporate exposures, in line with the original Basel Committee’s definition of Specialised Landing.
34 ANZ uses an internal assessment which is mapped to the appropriate Supervisory Slot.
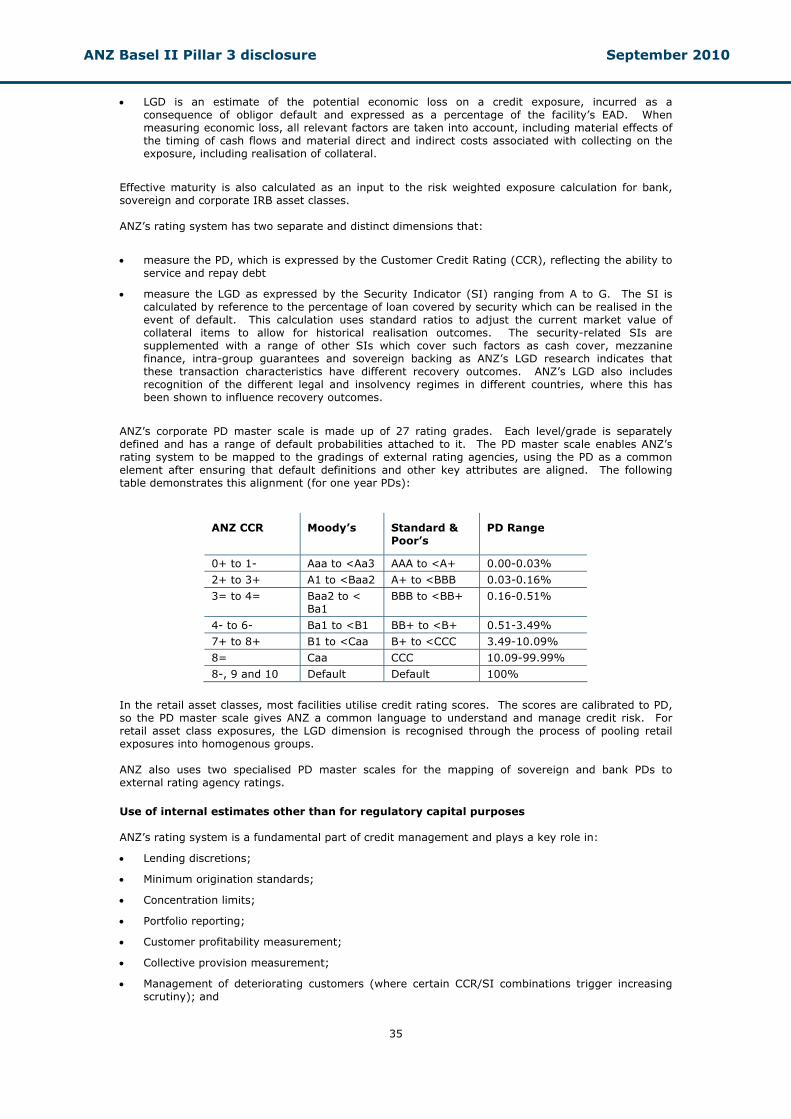
ANZ Basel II Pillar 3 disclosure September 2010
35
• LGD is an estimate of the potential economic loss on a credit exposure, incurred as a consequence of obligor default and expressed as a percentage of the facility’s EAD. When measuring economic loss, all relevant factors are taken into account, including material effects of the timing of cash flows and material direct and indirect costs associated with collecting on the exposure, including realisation of collateral.
Effective maturity is also calculated as an input to the risk weighted exposure calculation for bank, sovereign and corporate IRB asset classes. ANZ’s rating system has two separate and distinct dimensions that:
• measure the PD, which is expressed by the Customer Credit Rating (CCR), reflecting the ability to service and repay debt
• measure the LGD as expressed by the Security Indicator (SI) ranging from A to G. The SI is calculated by reference to the percentage of loan covered by security which can be realised in the event of default. This calculation uses standard ratios to adjust the current market value of collateral items to allow for historical realisation outcomes. The security-related SIs are supplemented with a range of other SIs which cover such factors as cash cover, mezzanine finance, intra-group guarantees and sovereign backing as ANZ’s LGD research indicates that these transaction characteristics have different recovery outcomes. ANZ’s LGD also includes recognition of the different legal and insolvency regimes in different countries, where this has been shown to influence recovery outcomes.
ANZ’s corporate PD master scale is made up of 27 rating grades. Each level/grade is separately defined and has a range of default probabilities attached to it. The PD master scale enables ANZ’s rating system to be mapped to the gradings of external rating agencies, using the PD as a common element after ensuring that default definitions and other key attributes are aligned. The following table demonstrates this alignment (for one year PDs):
ANZ CCR Moody’s Standard & Poor’s
PD Range
0+ to 1- Aaa to <Aa3 AAA to <A+ 0.00-0.03%
2+ to 3+ A1 to <Baa2 A+ to <BBB 0.03-0.16%
3= to 4= Baa2 to < Ba1
BBB to <BB+ 0.16-0.51%
4- to 6- Ba1 to <B1 BB+ to <B+ 0.51-3.49%
7+ to 8+ B1 to <Caa B+ to <CCC 3.49-10.09%
8= Caa CCC 10.09-99.99%
8-, 9 and 10 Default Default 100%
In the retail asset classes, most facilities utilise credit rating scores. The scores are calibrated to PD, so the PD master scale gives ANZ a common language to understand and manage credit risk. For retail asset class exposures, the LGD dimension is recognised through the process of pooling retail exposures into homogenous groups. ANZ also uses two specialised PD master scales for the mapping of sovereign and bank PDs to external rating agency ratings.
Use of internal estimates other than for regulatory capital purposes ANZ’s rating system is a fundamental part of credit management and plays a key role in:
• Lending discretions;
• Minimum origination standards;
• Concentration limits;
• Portfolio reporting;
• Customer profitability measurement;
• Collective provision measurement;
• Management of deteriorating customers (where certain CCR/SI combinations trigger increasing scrutiny); and
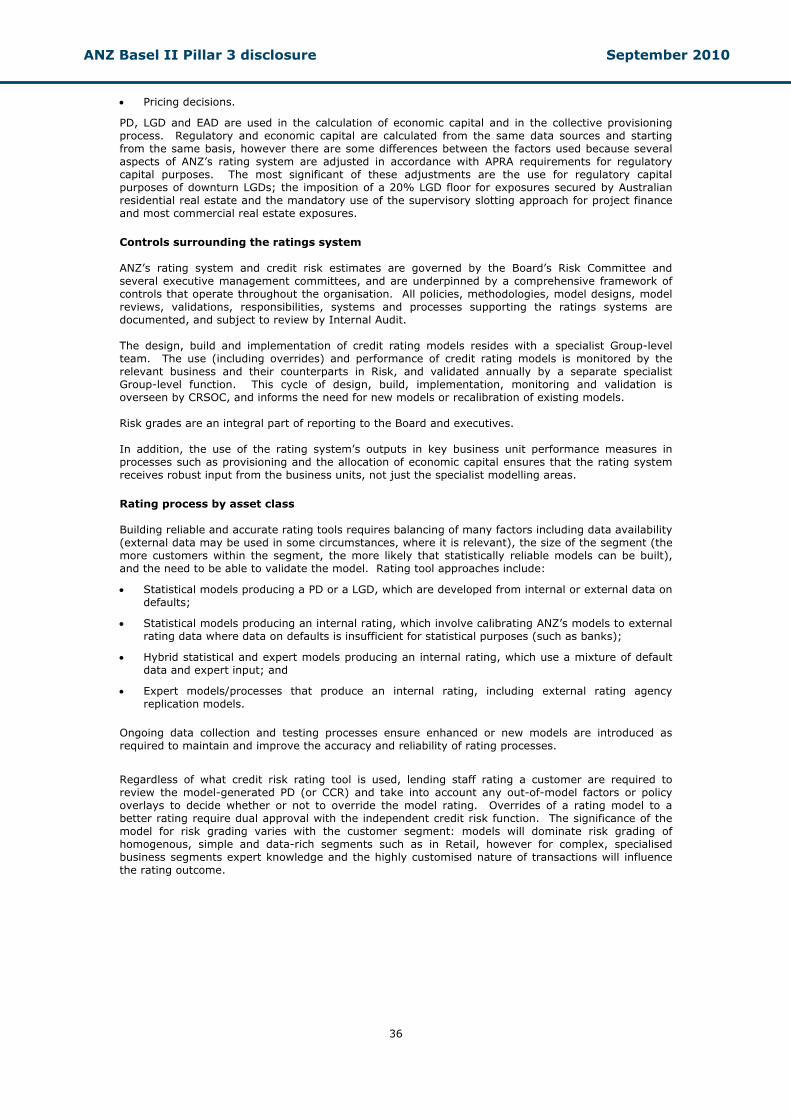
ANZ Basel II Pillar 3 disclosure September 2010
36
• Pricing decisions.
PD, LGD and EAD are used in the calculation of economic capital and in the collective provisioning process. Regulatory and economic capital are calculated from the same data sources and starting from the same basis, however there are some differences between the factors used because several aspects of ANZ’s rating system are adjusted in accordance with APRA requirements for regulatory capital purposes. The most significant of these adjustments are the use for regulatory capital purposes of downturn LGDs; the imposition of a 20% LGD floor for exposures secured by Australian residential real estate and the mandatory use of the supervisory slotting approach for project finance and most commercial real estate exposures.
Controls surrounding the ratings system ANZ’s rating system and credit risk estimates are governed by the Board’s Risk Committee and several executive management committees, and are underpinned by a comprehensive framework of controls that operate throughout the organisation. All policies, methodologies, model designs, model reviews, validations, responsibilities, systems and processes supporting the ratings systems are documented, and subject to review by Internal Audit. The design, build and implementation of credit rating models resides with a specialist Group-level team. The use (including overrides) and performance of credit rating models is monitored by the relevant business and their counterparts in Risk, and validated annually by a separate specialist Group-level function. This cycle of design, build, implementation, monitoring and validation is overseen by CRSOC, and informs the need for new models or recalibration of existing models. Risk grades are an integral part of reporting to the Board and executives. In addition, the use of the rating system’s outputs in key business unit performance measures in processes such as provisioning and the allocation of economic capital ensures that the rating system receives robust input from the business units, not just the specialist modelling areas.
Rating process by asset class Building reliable and accurate rating tools requires balancing of many factors including data availability (external data may be used in some circumstances, where it is relevant), the size of the segment (the more customers within the segment, the more likely that statistically reliable models can be built), and the need to be able to validate the model. Rating tool approaches include:
• Statistical models producing a PD or a LGD, which are developed from internal or external data on defaults;
• Statistical models producing an internal rating, which involve calibrating ANZ’s models to external rating data where data on defaults is insufficient for statistical purposes (such as banks);
• Hybrid statistical and expert models producing an internal rating, which use a mixture of default data and expert input; and
• Expert models/processes that produce an internal rating, including external rating agency replication models.
Ongoing data collection and testing processes ensure enhanced or new models are introduced as required to maintain and improve the accuracy and reliability of rating processes.
Regardless of what credit risk rating tool is used, lending staff rating a customer are required to review the model-generated PD (or CCR) and take into account any out-of-model factors or policy overlays to decide whether or not to override the model rating. Overrides of a rating model to a better rating require dual approval with the independent credit risk function. The significance of the model for risk grading varies with the customer segment: models will dominate risk grading of homogenous, simple and data-rich segments such as in Retail, however for complex, specialised business segments expert knowledge and the highly customised nature of transactions will influence the rating outcome.
ANZ Basel II Pillar 3 disclosure September 2010
37
The following table summarises the types of internal rating approaches used in ANZ:
IRB Asset Class Borrower type Rating Approach
Sovereign Central governments Central banks Certain multilateral development banks
External rating and expert judgement
Bank Banks In Australia only, other ADIs incorporated in Australia
Statistically-based models Review of all relevant and material information including external ratings
Corporate Corporations, partnerships or proprietorships that do not fit into any other asset class
Mainly statistical models Some use of expert models and policy processes
Specialised Lending Income Producing Real Estate Project Finance Object Finance
Supervisory Slotting35
Residential Mortgages
Exposures secured by residential property Statistical models
Qualifying Revolving Retail
Consumer credit cards <$100k limit Statistical models
Other Retail Small business lending Other lending to consumers
Statistical models
For the Retail Basel asset class (Residential Mortgages, Qualifying Revolving Retail and Other Retail exposures) the large number of relatively homogenous exposures enable the development of statistically robust application scoring models for use at origination and behavioural scoring for ongoing management. The scores are calibrated to PD, so the PD master scale gives ANZ a common language to understand and discuss credit risk. LGD is recognised through the process of pooling retail exposures into homogenous groups.
Estimation of LGD and EAD ANZ’s LGD modelling takes into account data on secured recovery, unsecured recovery rates and debt seniority, geography and internal management costs from several major data sources. Internal data is used as the basis for LGD estimation in the retail asset class, and is supplemented by external data for the corporate asset class. Given the scarcity of internal data for Bank and Sovereign Basel asset classes, LGD modelling for these classes is primarily based on external data. EAD represents the expected facility exposure at the date of default, including an estimate of additional drawings prior to default, as well as post-default drawings that were legally committed to prior to default.
35 Specialised Lending exposures are rated with internal rating tools to produce a PD and LGD. These are used in internal processes, but not for regulatory capital purposes where the exposures are mapped to Supervisory Slots.
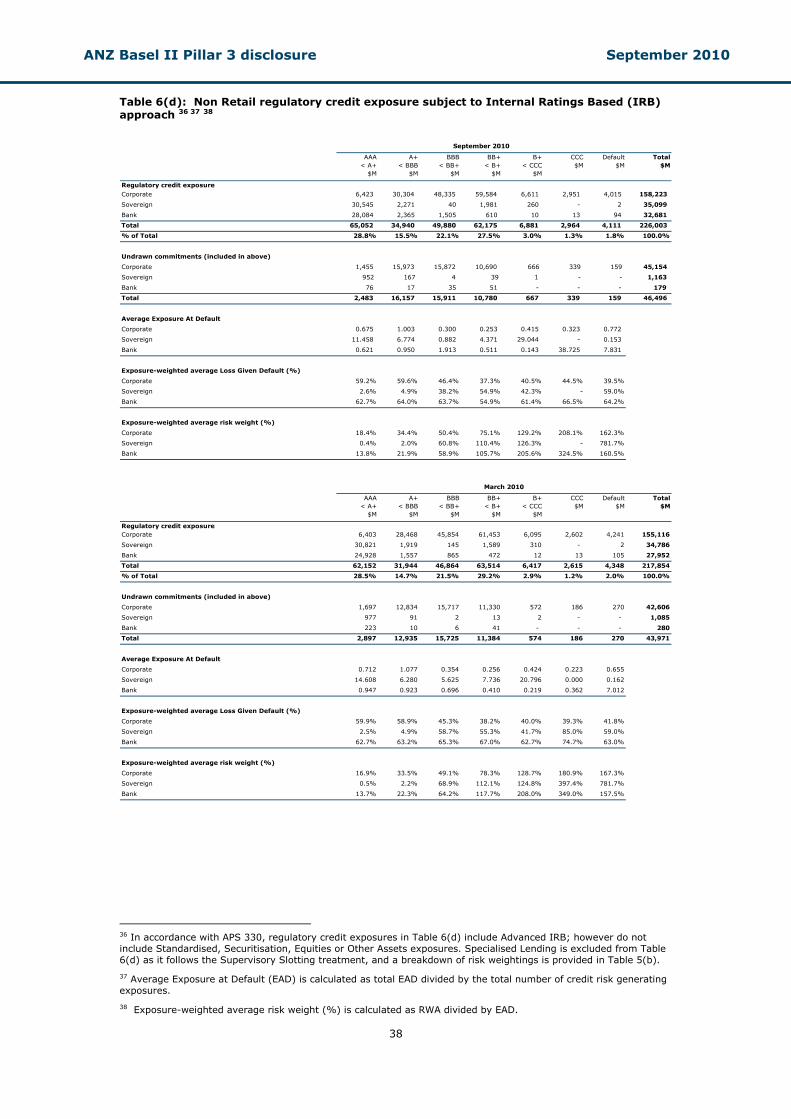
ANZ Basel II Pillar 3 disclosure September 2010
38
Table 6(d): Non Retail regulatory credit exposure subject to Internal Ratings Based (IRB) approach 36 37 38
AAA
< A+$M
A+< BBB
$M
BBB< BB+
$M
BB+< B+
$M
B+< CCC
$M
CCC $M
Default$M
Total$M
Regulatory credit exposureCorporate 6,423 30,304 48,335 59,584 6,611 2,951 4,015 158,223
Sovereign 30,545 2,271 40 1,981 260 - 2 35,099
Bank 28,084 2,365 1,505 610 10 13 94 32,681
Total 65,052 34,940 49,880 62,175 6,881 2,964 4,111 226,003
% of Total 28.8% 15.5% 22.1% 27.5% 3.0% 1.3% 1.8% 100.0%
Undrawn commitments (included in above)
Corporate 1,455 15,973 15,872 10,690 666 339 159 45,154
Sovereign 952 167 4 39 1 - - 1,163
Bank 76 17 35 51 - - - 179
Total 2,483 16,157 15,911 10,780 667 339 159 46,496
Average Exposure At Default
Corporate 0.675 1.003 0.300 0.253 0.415 0.323 0.772
Sovereign 11.458 6.774 0.882 4.371 29.044 - 0.153
Bank 0.621 0.950 1.913 0.511 0.143 38.725 7.831
Exposure-weighted average Loss Given Default (%)
Corporate 59.2% 59.6% 46.4% 37.3% 40.5% 44.5% 39.5%
Sovereign 2.6% 4.9% 38.2% 54.9% 42.3% - 59.0%
Bank 62.7% 64.0% 63.7% 54.9% 61.4% 66.5% 64.2%
Exposure-weighted average risk weight (%)
Corporate 18.4% 34.4% 50.4% 75.1% 129.2% 208.1% 162.3%
Sovereign 0.4% 2.0% 60.8% 110.4% 126.3% - 781.7%
Bank 13.8% 21.9% 58.9% 105.7% 205.6% 324.5% 160.5%
AAA< A+
$M
A+< BBB
$M
BBB< BB+
$M
BB+< B+
$M
B+< CCC
$M
CCC $M
Default$M
Total$M
Regulatory credit exposureCorporate 6,403 28,468 45,854 61,453 6,095 2,602 4,241 155,116
Sovereign 30,821 1,919 145 1,589 310 - 2 34,786
Bank 24,928 1,557 865 472 12 13 105 27,952
Total 62,152 31,944 46,864 63,514 6,417 2,615 4,348 217,854
% of Total 28.5% 14.7% 21.5% 29.2% 2.9% 1.2% 2.0% 100.0%
Undrawn commitments (included in above)
Corporate 1,697 12,834 15,717 11,330 572 186 270 42,606
Sovereign 977 91 2 13 2 - - 1,085
Bank 223 10 6 41 - - - 280
Total 2,897 12,935 15,725 11,384 574 186 270 43,971
Average Exposure At Default
Corporate 0.712 1.077 0.354 0.256 0.424 0.223 0.655
Sovereign 14.608 6.280 5.625 7.736 20.796 0.000 0.162
Bank 0.947 0.923 0.696 0.410 0.219 0.362 7.012
Exposure-weighted average Loss Given Default (%)
Corporate 59.9% 58.9% 45.3% 38.2% 40.0% 39.3% 41.8%
Sovereign 2.5% 4.9% 58.7% 55.3% 41.7% 85.0% 59.0%
Bank 62.7% 63.2% 65.3% 67.0% 62.7% 74.7% 63.0%
Exposure-weighted average risk weight (%)
Corporate 16.9% 33.5% 49.1% 78.3% 128.7% 180.9% 167.3%
Sovereign 0.5% 2.2% 68.9% 112.1% 124.8% 397.4% 781.7%
Bank 13.7% 22.3% 64.2% 117.7% 208.0% 349.0% 157.5%
September 2010
March 2010
36 In accordance with APS 330, regulatory credit exposures in Table 6(d) include Advanced IRB; however do not include Standardised, Securitisation, Equities or Other Assets exposures. Specialised Lending is excluded from Table 6(d) as it follows the Supervisory Slotting treatment, and a breakdown of risk weightings is provided in Table 5(b).
37 Average Exposure at Default (EAD) is calculated as total EAD divided by the total number of credit risk generating exposures.
38 Exposure-weighted average risk weight (%) is calculated as RWA divided by EAD.
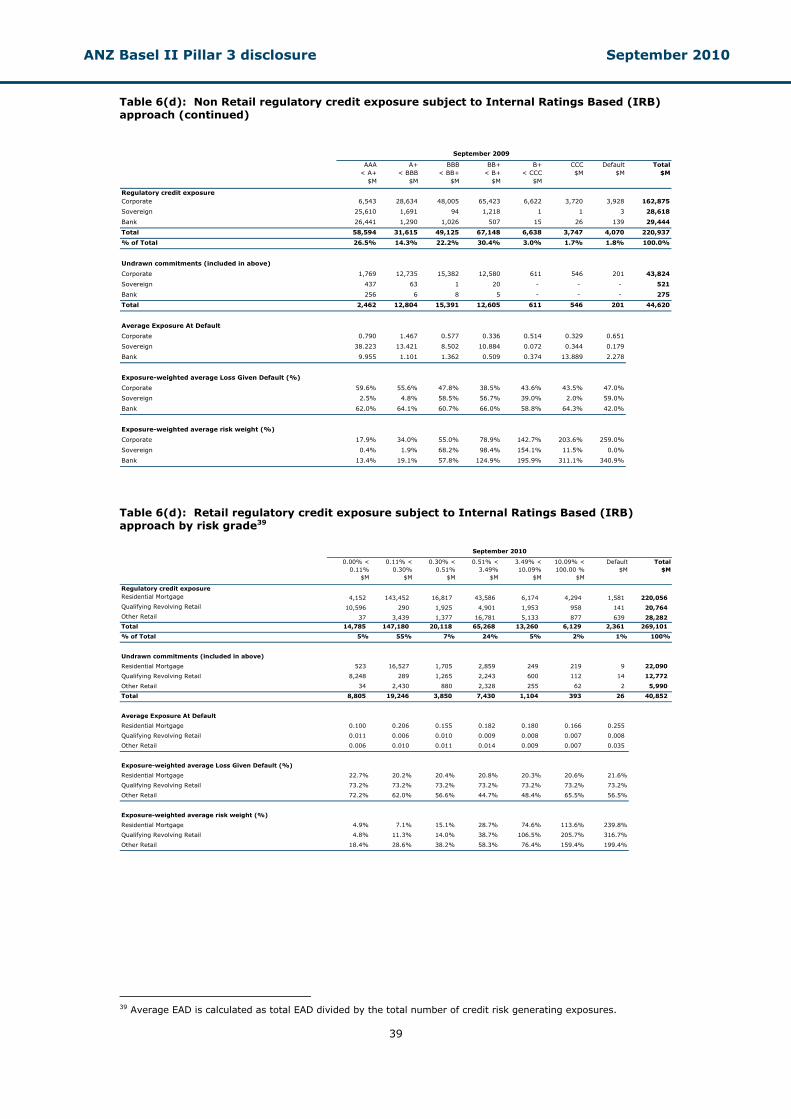
ANZ Basel II Pillar 3 disclosure September 2010
39
Table 6(d): Non Retail regulatory credit exposure subject to Internal Ratings Based (IRB) approach (continued)
AAA< A+
$M
A+< BBB
$M
BBB< BB+
$M
BB+< B+
$M
B+< CCC
$M
CCC $M
Default$M
Total$M
Regulatory credit exposureCorporate 6,543 28,634 48,005 65,423 6,622 3,720 3,928 162,875
Sovereign 25,610 1,691 94 1,218 1 1 3 28,618
Bank 26,441 1,290 1,026 507 15 26 139 29,444
Total 58,594 31,615 49,125 67,148 6,638 3,747 4,070 220,937
% of Total 26.5% 14.3% 22.2% 30.4% 3.0% 1.7% 1.8% 100.0%
Undrawn commitments (included in above)
Corporate 1,769 12,735 15,382 12,580 611 546 201 43,824
Sovereign 437 63 1 20 - - - 521
Bank 256 6 8 5 - - - 275
Total 2,462 12,804 15,391 12,605 611 546 201 44,620
Average Exposure At Default
Corporate 0.790 1.467 0.577 0.336 0.514 0.329 0.651
Sovereign 38.223 13.421 8.502 10.884 0.072 0.344 0.179
Bank 9.955 1.101 1.362 0.509 0.374 13.889 2.278
Exposure-weighted average Loss Given Default (%)
Corporate 59.6% 55.6% 47.8% 38.5% 43.6% 43.5% 47.0%
Sovereign 2.5% 4.8% 58.5% 56.7% 39.0% 2.0% 59.0%
Bank 62.0% 64.1% 60.7% 66.0% 58.8% 64.3% 42.0%
Exposure-weighted average risk weight (%)
Corporate 17.9% 34.0% 55.0% 78.9% 142.7% 203.6% 259.0%
Sovereign 0.4% 1.9% 68.2% 98.4% 154.1% 11.5% 0.0%
Bank 13.4% 19.1% 57.8% 124.9% 195.9% 311.1% 340.9%
September 2009
Table 6(d): Retail regulatory credit exposure subject to Internal Ratings Based (IRB) approach by risk grade39
0.00% <0.11%
$M
0.11% <0.30%
$M
0.30% <0.51%
$M
0.51% <3.49%
$M
3.49% <10.09%
$M
10.09% <100.00 %
$M
Default$M
Total$M
Regulatory credit exposureResidential Mortgage 4,152 143,452 16,817 43,586 6,174 4,294 1,581 220,056
Qualifying Revolving Retail 10,596 290 1,925 4,901 1,953 958 141 20,764
Other Retail 37 3,439 1,377 16,781 5,133 877 639 28,282
Total 14,785 147,180 20,118 65,268 13,260 6,129 2,361 269,101
% of Total 5% 55% 7% 24% 5% 2% 1% 100%
Undrawn commitments (included in above)
Residential Mortgage 523 16,527 1,705 2,859 249 219 9 22,090
Qualifying Revolving Retail 8,248 289 1,265 2,243 600 112 14 12,772
Other Retail 34 2,430 880 2,328 255 62 2 5,990
Total 8,805 19,246 3,850 7,430 1,104 393 26 40,852
Average Exposure At Default
Residential Mortgage 0.100 0.206 0.155 0.182 0.180 0.166 0.255
Qualifying Revolving Retail 0.011 0.006 0.010 0.009 0.008 0.007 0.008
Other Retail 0.006 0.010 0.011 0.014 0.009 0.007 0.035
Exposure-weighted average Loss Given Default (%)
Residential Mortgage 22.7% 20.2% 20.4% 20.8% 20.3% 20.6% 21.6%
Qualifying Revolving Retail 73.2% 73.2% 73.2% 73.2% 73.2% 73.2% 73.2%
Other Retail 72.2% 62.0% 56.6% 44.7% 48.4% 65.5% 56.5%
Exposure-weighted average risk weight (%)
Residential Mortgage 4.9% 7.1% 15.1% 28.7% 74.6% 113.6% 239.8%
Qualifying Revolving Retail 4.8% 11.3% 14.0% 38.7% 106.5% 205.7% 316.7%
Other Retail 18.4% 28.6% 38.2% 58.3% 76.4% 159.4% 199.4%
September 2010
39 Average EAD is calculated as total EAD divided by the total number of credit risk generating exposures.
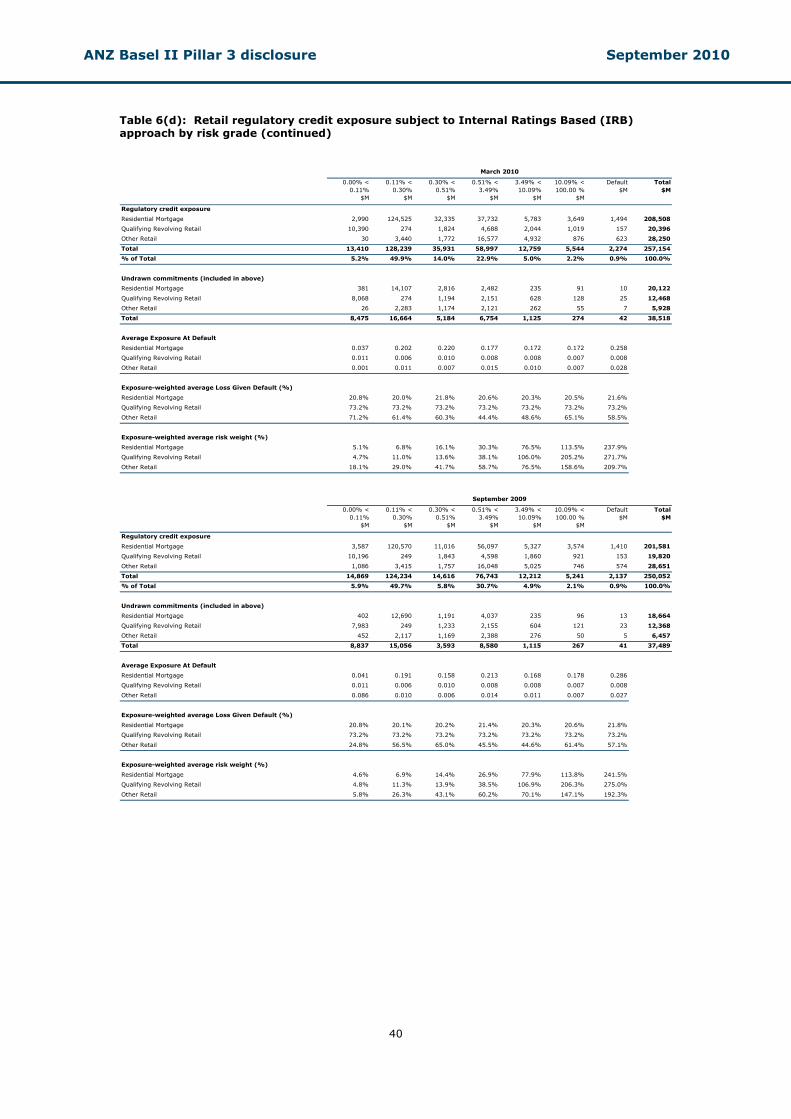
ANZ Basel II Pillar 3 disclosure September 2010
40
Table 6(d): Retail regulatory credit exposure subject to Internal Ratings Based (IRB) approach by risk grade (continued)
0.00% <0.11%
$M
0.11% <0.30%
$M
0.30% <0.51%
$M
0.51% <3.49%
$M
3.49% <10.09%
$M
10.09% <100.00 %
$M
Default$M
Total$M
Regulatory credit exposure
Residential Mortgage 2,990 124,525 32,335 37,732 5,783 3,649 1,494 208,508
Qualifying Revolving Retail 10,390 274 1,824 4,688 2,044 1,019 157 20,396
Other Retail 30 3,440 1,772 16,577 4,932 876 623 28,250
Total 13,410 128,239 35,931 58,997 12,759 5,544 2,274 257,154
% of Total 5.2% 49.9% 14.0% 22.9% 5.0% 2.2% 0.9% 100.0%
Undrawn commitments (included in above)
Residential Mortgage 381 14,107 2,816 2,482 235 91 10 20,122
Qualifying Revolving Retail 8,068 274 1,194 2,151 628 128 25 12,468
Other Retail 26 2,283 1,174 2,121 262 55 7 5,928
Total 8,475 16,664 5,184 6,754 1,125 274 42 38,518
Average Exposure At Default
Residential Mortgage 0.037 0.202 0.220 0.177 0.172 0.172 0.258
Qualifying Revolving Retail 0.011 0.006 0.010 0.008 0.008 0.007 0.008
Other Retail 0.001 0.011 0.007 0.015 0.010 0.007 0.028
Exposure-weighted average Loss Given Default (%)
Residential Mortgage 20.8% 20.0% 21.8% 20.6% 20.3% 20.5% 21.6%
Qualifying Revolving Retail 73.2% 73.2% 73.2% 73.2% 73.2% 73.2% 73.2%
Other Retail 71.2% 61.4% 60.3% 44.4% 48.6% 65.1% 58.5%
Exposure-weighted average risk weight (%)
Residential Mortgage 5.1% 6.8% 16.1% 30.3% 76.5% 113.5% 237.9%
Qualifying Revolving Retail 4.7% 11.0% 13.6% 38.1% 106.0% 205.2% 271.7%
Other Retail 18.1% 29.0% 41.7% 58.7% 76.5% 158.6% 209.7%
0.00% <0.11%
$M
0.11% <0.30%
$M
0.30% <0.51%
$M
0.51% <3.49%
$M
3.49% <10.09%
$M
10.09% <100.00 %
$M
Default$M
Total$M
Regulatory credit exposure
Residential Mortgage 3,587 120,570 11,016 56,097 5,327 3,574 1,410 201,581
Qualifying Revolving Retail 10,196 249 1,843 4,598 1,860 921 153 19,820
Other Retail 1,086 3,415 1,757 16,048 5,025 746 574 28,651
Total 14,869 124,234 14,616 76,743 12,212 5,241 2,137 250,052
% of Total 5.9% 49.7% 5.8% 30.7% 4.9% 2.1% 0.9% 100.0%
Undrawn commitments (included in above)
Residential Mortgage 402 12,690 1,191 4,037 235 96 13 18,664
Qualifying Revolving Retail 7,983 249 1,233 2,155 604 121 23 12,368
Other Retail 452 2,117 1,169 2,388 276 50 5 6,457
Total 8,837 15,056 3,593 8,580 1,115 267 41 37,489
Average Exposure At Default
Residential Mortgage 0.041 0.191 0.158 0.213 0.168 0.178 0.286
Qualifying Revolving Retail 0.011 0.006 0.010 0.008 0.008 0.007 0.008
Other Retail 0.086 0.010 0.006 0.014 0.011 0.007 0.027
Exposure-weighted average Loss Given Default (%)
Residential Mortgage 20.8% 20.1% 20.2% 21.4% 20.3% 20.6% 21.8%
Qualifying Revolving Retail 73.2% 73.2% 73.2% 73.2% 73.2% 73.2% 73.2%
Other Retail 24.8% 56.5% 65.0% 45.5% 44.6% 61.4% 57.1%
Exposure-weighted average risk weight (%)
Residential Mortgage 4.6% 6.9% 14.4% 26.9% 77.9% 113.8% 241.5%
Qualifying Revolving Retail 4.8% 11.3% 13.9% 38.5% 106.9% 206.3% 275.0%
Other Retail 5.8% 26.3% 43.1% 60.2% 70.1% 147.1% 192.3%
March 2010
September 2009
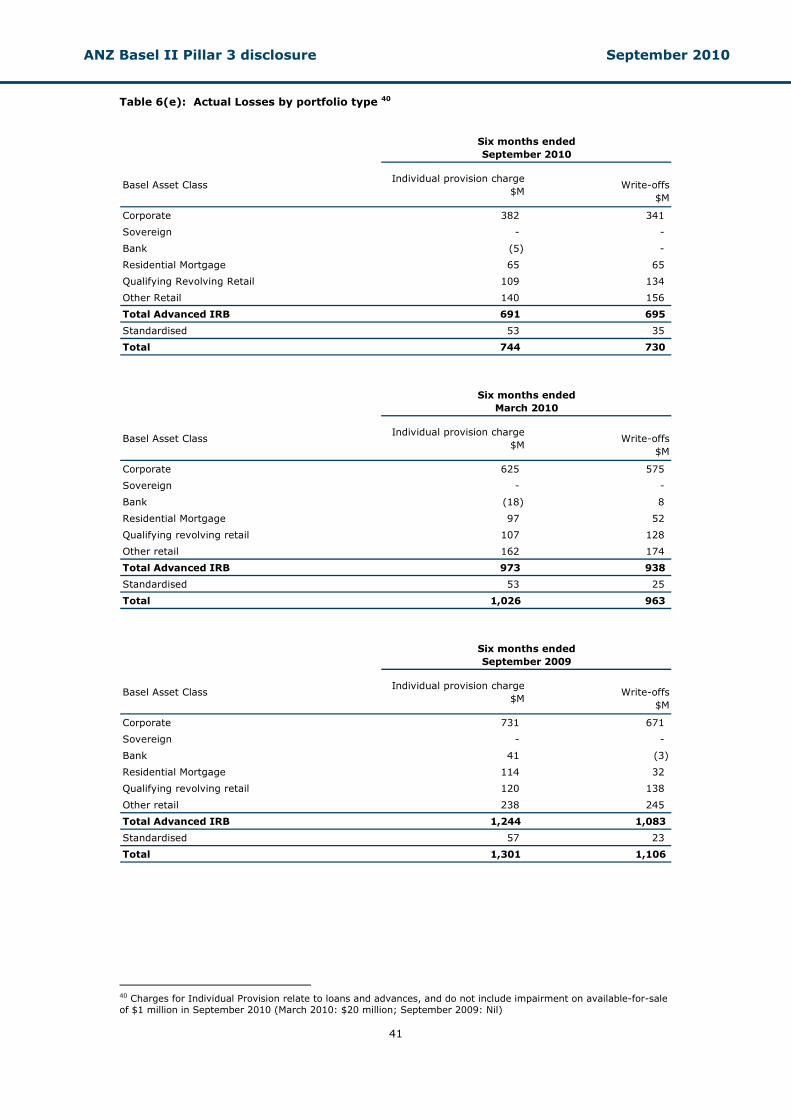
ANZ Basel II Pillar 3 disclosure September 2010
41
Table 6(e): Actual Losses by portfolio type 40
Basel Asset ClassIndividual provision charge
$MWrite-offs
$M
Corporate 382 341
Sovereign - -
Bank (5) -
Residential Mortgage 65 65
Qualifying Revolving Retail 109 134
Other Retail 140 156
Total Advanced IRB 691 695
Standardised 53 35
Total 744 730
Basel Asset ClassIndividual provision charge
$MWrite-offs
$M
Corporate 625 575
Sovereign - -
Bank (18) 8
Residential Mortgage 97 52
Qualifying revolving retail 107 128
Other retail 162 174
Total Advanced IRB 973 938
Standardised 53 25
Total 1,026 963
Basel Asset ClassIndividual provision charge
$MWrite-offs
$M
Corporate 731 671
Sovereign - -
Bank 41 (3)
Residential Mortgage 114 32
Qualifying revolving retail 120 138
Other retail 238 245
Total Advanced IRB 1,244 1,083
Standardised 57 23
Total 1,301 1,106
Six months endedSeptember 2010
Six months endedSeptember 2009
Six months endedMarch 2010
40 Charges for Individual Provision relate to loans and advances, and do not include impairment on available-for-sale of $1 million in September 2010 (March 2010: $20 million; September 2009: Nil)
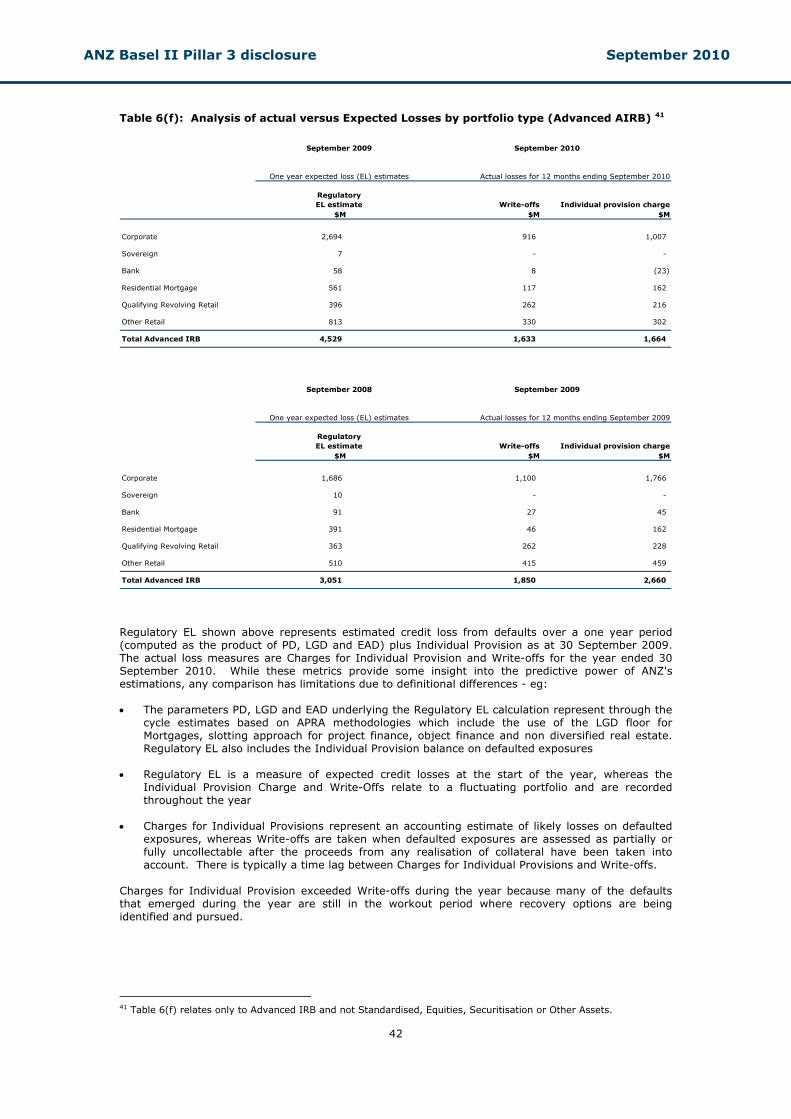
ANZ Basel II Pillar 3 disclosure September 2010
42
Table 6(f): Analysis of actual versus Expected Losses by portfolio type (Advanced AIRB) 41
Write-offs Individual provision charge$M $M $M
Corporate 2,694 916 1,007
Sovereign 7 - -
Bank 58 8 (23)
Residential Mortgage 561 117 162
Qualifying Revolving Retail 396 262 216
Other Retail 813 330 302
Total Advanced IRB 4,529 1,633 1,664
September 2010
Actual losses for 12 months ending September 2010
September 2009
One year expected loss (EL) estimates
Regulatory EL estimate
Write-offs Individual provision charge$M $M $M
Corporate 1,686 1,100 1,766
Sovereign 10 - -
Bank 91 27 45
Residential Mortgage 391 46 162
Qualifying Revolving Retail 363 262 228
Other Retail 510 415 459
Total Advanced IRB 3,051 1,850 2,660
September 2008
One year expected loss (EL) estimates Actual losses for 12 months ending September 2009
Regulatory EL estimate
September 2009
Regulatory EL shown above represents estimated credit loss from defaults over a one year period (computed as the product of PD, LGD and EAD) plus Individual Provision as at 30 September 2009. The actual loss measures are Charges for Individual Provision and Write-offs for the year ended 30 September 2010. While these metrics provide some insight into the predictive power of ANZ's estimations, any comparison has limitations due to definitional differences - eg: • The parameters PD, LGD and EAD underlying the Regulatory EL calculation represent through the
cycle estimates based on APRA methodologies which include the use of the LGD floor for Mortgages, slotting approach for project finance, object finance and non diversified real estate. Regulatory EL also includes the Individual Provision balance on defaulted exposures
• Regulatory EL is a measure of expected credit losses at the start of the year, whereas the
Individual Provision Charge and Write-Offs relate to a fluctuating portfolio and are recorded throughout the year
• Charges for Individual Provisions represent an accounting estimate of likely losses on defaulted
exposures, whereas Write-offs are taken when defaulted exposures are assessed as partially or fully uncollectable after the proceeds from any realisation of collateral have been taken into account. There is typically a time lag between Charges for Individual Provisions and Write-offs.
Charges for Individual Provision exceeded Write-offs during the year because many of the defaults that emerged during the year are still in the workout period where recovery options are being identified and pursued.
41 Table 6(f) relates only to Advanced IRB and not Standardised, Equities, Securitisation or Other Assets.
ANZ Basel II Pillar 3 disclosure September 2010
43
Table 7 Credit risk mitigation disclosures
Main types of collateral taken by ANZ Collateral is used to mitigate credit risk, as the secondary source of repayment in case the counterparty cannot meet its contractual repayment obligations42. Types of collateral typically taken by ANZ include:
• Security over residential, commercial, industrial or rural property;
• Fixed and floating charges over business assets;
• Security over specific plant and equipment;
• Charges over listed shares, bonds or securities;
• Charges over cash deposits; and
• Guarantees and pledges.
In some cases, such as where the customer risk profile is considered very sound or by the nature of the product (for instance, small limit products such as credit cards), a transaction may not be supported by collateral.
Credit policy and procedures set out the acceptable types of collateral, as well as a process by which additional instruments and/or asset types can be considered for approval. ANZ’s credit risk modelling areas use historical internal loss data and other relevant external data to assist in determining the discount that each type would be expected to incur in a forced sale. The discounted value is used in the determination of a Security Indicator for LGD purposes. Policies and processes for collateral valuation and management ANZ has well established policies and processes around collateral valuation and management. The concepts of legal enforceability, certainty and current valuation are central to collateral management. In order to achieve legal enforceability and certainty, ANZ uses standard collateral instruments or has specific documentation drawn up by external legal advisers, and where applicable, security interests are registered. The use of collateral management systems also provides certainty that the collateral has been properly taken, registered and stored. In order to rely on the valuation of collateral assets, ANZ has developed comprehensive rules around acceptable types of valuations (including who may value an asset), the frequency of revaluations and standard extension ratios for typical asset types. Upon receipt of a new valuation, the information is used to recalculate the SI (or to reassess the adequacy of the provision, in the case of an impaired asset), thereby ensuring that the exposure has an updated LGD attached to it for risk quantification purposes.
Guarantee support Guarantee support for lending proposals are an integral component in transaction structuring for ANZ. The guarantee of a financially strong party can help improve the PD of a transaction through its explicit support of the weaker rated borrower. Guarantees that are recognised for risk rating purposes may be provided by parties that include associated entities, banks, sovereigns or individuals. Credit policy provides threshold parameters to determine acceptable counterparties in achieving risk grade enhancement of the transaction. The suitability of the guarantor is determined by risk rating that guarantor. Not all guarantees or guarantors are recognised for risk grade enhancement purposes.
Use of credit derivatives for risk mitigation ANZ uses purchased credit derivatives to mitigate credit risk by lowering exposures to reference entities that generate high concentration risk exposures or to improve risk return performance. Only certain credit derivatives such as credit default swaps (CDS) are recognised for risk mitigation purposes in the determination of regulatory capital. A CDS entails the payment by one party in
42 For some products, the collateral provided is fundamental to its structuring so is not strictly the secondary source of repayment. For example, lending secured by trade receivables is typically repaid by the collection of those receivables.
ANZ Basel II Pillar 3 disclosure September 2010
44
exchange for credit default protection payment if a credit default event on a reference asset occurs. Standard, legally enforceable documentation applies. For regulatory capital purposes, ANZ only recognises protection using credit derivatives where they meet several policy and regulatory requirements around the strength of the protection offered such as being irrevocable. A CDS may only be transacted with banks, ANZ-related conduits and non-bank financial institutions that have been credit assessed and approved by a designated specialist credit officer. All parties must meet minimum credit standards and be allocated a related credit limit. In the event that the creditworthiness of a credit protection provider falls below the minimum required to provide effective protection, the protection is no longer recognised as an effective risk mitigant for regulatory purposes.
The use of netting Netting is a form of credit risk mitigation in that it reduces EAD, by offsetting a customer’s positive and negative balances with ANZ. In order to apply on-balance sheet netting, the arrangement must be specifically documented with the customer and meet a number of legally enforceable requirements. Netting is also used where the credit exposure arises from off balance sheet market related transactions. For close-out netting to be utilised with counterparties, a legally enforceable eligible netting agreement in an acceptable jurisdiction must be in place. This means that each transaction is aggregated into a single net amount and transactions are netted to arrive at a single overall sum.
Transaction structuring to mitigate credit risk Besides collateral, guarantee support and derivatives described above, credit risk mitigation can also be furthered by prudent transaction structuring. For example, the risk in project finance lending can be mitigated by lending covenants, loan syndication and political risk insurance.
Concentrations of credit risk mitigation Taking collateral raises the possibility that ANZ may inadvertently increase its risk by becoming exposed to collateral concentrations. For example, in the same way that an over-exposure to a particular industry may mean that a bank is more sensitive to the fortunes of that industry, an over-exposure to a particular collateral asset type may make ANZ more sensitive to the performance of that asset type. ANZ does not believe that it has any material concentrations of collateral types, given the well diversified nature of its portfolio and conservative asset extension ratios.
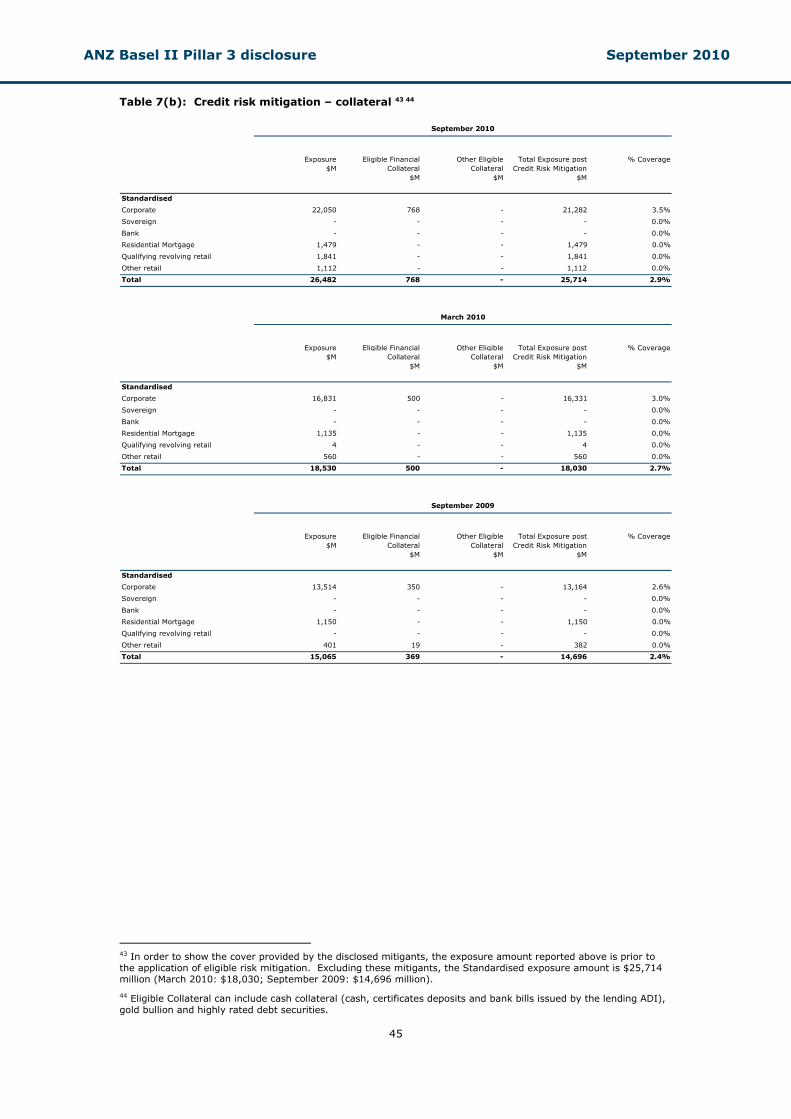
ANZ Basel II Pillar 3 disclosure September 2010
45
Table 7(b): Credit risk mitigation – collateral 43 44
Exposure$M
Eligible FinancialCollateral
$M
Other EligibleCollateral
$M
Total Exposure postCredit Risk Mitigation
$M
% Coverage
Standardised
Corporate 22,050 768 - 21,282 3.5%
Sovereign - - - - 0.0%
Bank - - - - 0.0%
Residential Mortgage 1,479 - - 1,479 0.0%
Qualifying revolving retail 1,841 - - 1,841 0.0%
Other retail 1,112 - - 1,112 0.0%
Total 26,482 768 - 25,714 2.9%
Exposure$M
Eligible FinancialCollateral
$M
Other EligibleCollateral
$M
Total Exposure postCredit Risk Mitigation
$M
% Coverage
Standardised
Corporate 16,831 500 - 16,331 3.0%
Sovereign - - - - 0.0%
Bank - - - - 0.0%
Residential Mortgage 1,135 - - 1,135 0.0%
Qualifying revolving retail 4 - - 4 0.0%
Other retail 560 - - 560 0.0%
Total 18,530 500 - 18,030 2.7%
Exposure$M
Eligible FinancialCollateral
$M
Other EligibleCollateral
$M
Total Exposure postCredit Risk Mitigation
$M
% Coverage
Standardised
Corporate 13,514 350 - 13,164 2.6%
Sovereign - - - - 0.0%
Bank - - - - 0.0%
Residential Mortgage 1,150 - - 1,150 0.0%
Qualifying revolving retail - - - - 0.0%
Other retail 401 19 - 382 0.0%
Total 15,065 369 - 14,696 2.4%
September 2010
September 2009
March 2010
43 In order to show the cover provided by the disclosed mitigants, the exposure amount reported above is prior to the application of eligible risk mitigation. Excluding these mitigants, the Standardised exposure amount is $25,714 million (March 2010: $18,030; September 2009: $14,696 million).
44 Eligible Collateral can include cash collateral (cash, certificates deposits and bank bills issued by the lending ADI), gold bullion and highly rated debt securities.
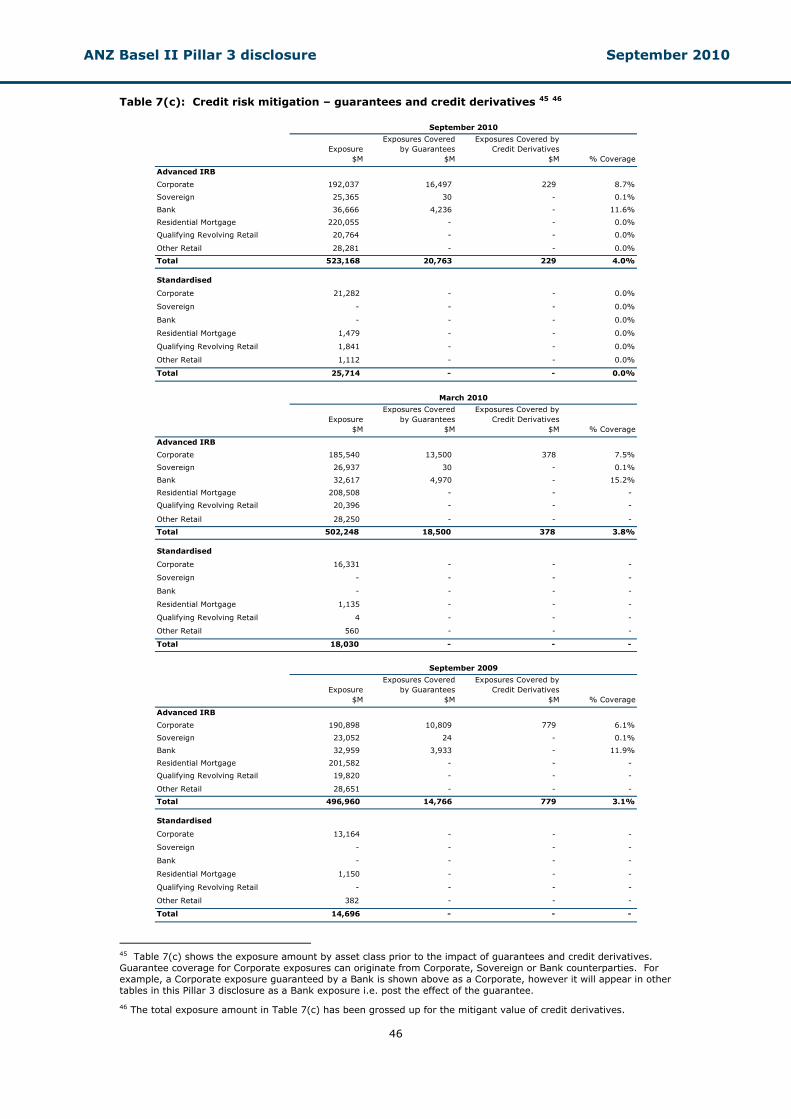
ANZ Basel II Pillar 3 disclosure September 2010
46
Table 7(c): Credit risk mitigation – guarantees and credit derivatives 45 46
Exposure$M
Exposures Coveredby Guarantees
$M
Exposures Covered byCredit Derivatives
$M % Coverage
Advanced IRB
Corporate 192,037 16,497 229 8.7%
Sovereign 25,365 30 - 0.1%
Bank 36,666 4,236 - 11.6%
Residential Mortgage 220,055 - - 0.0%
Qualifying Revolving Retail 20,764 - - 0.0%
Other Retail 28,281 - - 0.0%
Total 523,168 20,763 229 4.0%
Standardised
Corporate 21,282 - - 0.0%
Sovereign - - - 0.0%
Bank - - - 0.0%
Residential Mortgage 1,479 - - 0.0%
Qualifying Revolving Retail 1,841 - - 0.0%
Other Retail 1,112 - - 0.0%
Total 25,714 - - 0.0%
Exposure$M
Exposures Coveredby Guarantees
$M
Exposures Covered byCredit Derivatives
$M % Coverage
Advanced IRB
Corporate 185,540 13,500 378 7.5%
Sovereign 26,937 30 - 0.1%
Bank 32,617 4,970 - 15.2%
Residential Mortgage 208,508 - - -
Qualifying Revolving Retail 20,396 - - -
Other Retail 28,250 - - -
Total 502,248 18,500 378 3.8%
Standardised
Corporate 16,331 - - -
Sovereign - - - -
Bank - - - -
Residential Mortgage 1,135 - - -
Qualifying Revolving Retail 4 - - -
Other Retail 560 - - -
Total 18,030 - - -
Exposure$M
Exposures Coveredby Guarantees
$M
Exposures Covered byCredit Derivatives
$M % Coverage
Advanced IRB
Corporate 190,898 10,809 779 6.1%
Sovereign 23,052 24 - 0.1%
Bank 32,959 3,933 - 11.9%
Residential Mortgage 201,582 - - -
Qualifying Revolving Retail 19,820 - - -
Other Retail 28,651 - - -
Total 496,960 14,766 779 3.1%
Standardised
Corporate 13,164 - - -
Sovereign - - - -
Bank - - - -
Residential Mortgage 1,150 - - -
Qualifying Revolving Retail - - - -
Other Retail 382 - - -
Total 14,696 - - -
September 2009
March 2010
September 2010
45 Table 7(c) shows the exposure amount by asset class prior to the impact of guarantees and credit derivatives. Guarantee coverage for Corporate exposures can originate from Corporate, Sovereign or Bank counterparties. For example, a Corporate exposure guaranteed by a Bank is shown above as a Corporate, however it will appear in other tables in this Pillar 3 disclosure as a Bank exposure i.e. post the effect of the guarantee.
46 The total exposure amount in Table 7(c) has been grossed up for the mitigant value of credit derivatives.
ANZ Basel II Pillar 3 disclosure September 2010
47
Table 8 General disclosures for derivatives and counterparty credit risk
Definition of market-related counterparty credit risk Market-related credit risk is present in market instruments (derivatives and forward contracts), and comprises settlement risk (default at the end of the contract) and market replacement risk (default at any time during the life of the contract). • Settlement risk arises where one party makes payment or delivers value in the expectation but
without certainty that the counterparty will perform the corresponding obligation in a bilateral contract or due to timing differences when one counterparty performs its obligations at settlement date but the other counterparty party fails to perform its payment obligation
• Market replacement risk (pre-settlement risk) exposure is the risk that a counterparty will default before expiry and final settlement of a derivative contract.
ANZ transacts market instruments with end user and professional counterparties. End users are typically customers who require access to over the counter derivative market instruments to hedge specific business risks to protect against price movement risk associated with their core business activity. ANZ provides end user counterparties with hedging instruments to manage price movement risk. In turn, ANZ may seek to hedge out price movement risk including those arising from end user related transactions by entering into transactions with professional counterparties that conduct two way (buy and sell) business. Market-related credit risk requires a different method to calculate EAD because actual and potential market movements impact ANZ’s exposure or replacement cost. The markets covered by this treatment include interest rates, foreign exchange, credit default swaps, equities and commodities.
Market related counterparty credit risk governance
ANZ’s derivative and counterparty credit risk management is governed by credit principles, policies and procedures. A Counterparty Credit Risk function is responsible for determining the counterparty credit risk exposure methodology applied to derivatives, day-to-day capture of relevant transactions in the counterparty credit limit management system and the calculation of counterparty credit risk. Counterparty credit limits are approved by the Credit Approval Discretion (CAD) holder following the same principles as on balance sheet credit limit approval process.
Market related counterparty credit risk measurement and reporting For counterparty credit risk, the general approach is to calculate future exposure as the sum of the mark-to-market value of the exposure, plus the sum of the notional principal multiplied by the potential credit risk exposure (PCRE) for the exposure.
• The mark-to-market value is the current replacement cost of the contract, and can be positive or negative. ANZ measures counterparty credit risk exposure for positive mark to market positions. If it is negative i.e. out of the money, ANZ will apply a factor (amount) to the negative value and if it still remains negative, the value used in the calculation is zero. Positive mark-to-market to ANZ represents the cost of replacing an outstanding contract with a counterparty based on the current market value of the contract if a counterparty defaulted on its obligations
• The PCRE factors recognise that prices may change over the remaining period to maturity, and that risk decreases as the contract’s remaining term to maturity decreases. In general terms PCRE is calculated by applying a risk weighting or volatility factor to the face value of the notional principal of individual trades
• The PCRE factors are also used by credit officers when establishing credit limits, to ensure that credit assessment recognises the potential volatility of the transactions’ values. In terms of reporting, counterparty credit risk is calculated daily and excesses above approved limits are reported to account controllers and risk officers for action.
Credit Valuation Adjustment ANZ uses a credit valuation adjustment (CVA) model to adjust the fair value of derivative instruments over the life of the financial instrument to take into account the impact of counterparty credit quality. This is undertaken by a present value of losses (PVL) methodology which calculates the present value of expected losses over the life of the financial instrument as a function of probability of default, loss given default, expected credit risk exposure and an asset correlation factor.
ANZ Basel II Pillar 3 disclosure September 2010
48
Impaired derivatives are subject to a CVA which is based on an individual assessment of the expected losses on the transaction.
Wrong way risk ANZ’s management of counterparty credit risk also takes into consideration the possibility of wrong way risk arising. Wrong way risk emerges when a counterparty’s probability of default is adversely correlated with market risk factors. ANZ’s credit policies and transaction evaluation by credit risk are central in managing wrong way risk arising from derivative transactions, including credit derivatives. These considerations are made as part of the independent transaction approval processes.
Counterparty credit risk mitigation ANZ’s primary tools to mitigate counterparty credit risk are netting, collateral, structuring derivatives with enhanced credit protection in master agreements and a rigorous control and reporting system. Credit risk mitigation techniques: • A bilateral netting master agreement in the form of an ISDA or other ANZ approved netting
agreement allows close-out netting of in the money and out of the money exposures in a portfolio with offsetting contracts, with a single net payment with the same legal counterparty.
• In some transactions, ANZ or the counterparty may be required to lodge collateral. Standard market documentation in the form of ISDA Master Agreement with Credit Support Annex governs the amount of collateral required to be posted or received by ANZ and counterparty and the re-margining frequency between counterparties. In some agreements the amount of collateral required and other terms may be linked to external credit ratings. This means that in the event that ANZ’s or a counterparty’s external rating was downgraded, ANZ or the counterparty would likely be required to lodge additional collateral. The amount required to be lodged would depend upon the underlying instruments and the state of the markets, so would be different at each re-margining interval
• Use of right to break clauses in master agreement or trade confirmation to reduce term of long dated derivative trades
• Credit exposure control, monitoring and reporting of excesses against approved credit limits • Additional termination triggers such as credit rating downgrade clauses and change in ownership
clauses being including in documentation, resulting in close out of exposure if triggered • Linking covenants and events of default in existing loan facility agreement to master agreement. • Use of credit derivatives to hedge counterparty credit risk exposure • Settlement through Continuous Linked Settlement (CLS) to eliminate settlement risk for foreign
exchange transactions with CLS members. In the event of a downgrading of ANZ’s rating by one notch from AA to AA- at 30 September 2010, ANZ would not have been required to lodge additional collateral with its counterparties. A downgrade of two notches from AA to A+ would have required lodging of an additional USD 580 million. The control system, with the system of counterparty limits and independent calculation and reporting of excesses, has been described above.
ANZ Basel II Pillar 3 disclosure September 2010
49
Chapter 6 – Securitisation
Table 9 Securitisation disclosures
Definition of securitisation A securitisation is a financial structure where the cash flow from a pool of assets is used to service obligations to at least two different tranches or classes of creditors47, typically holders of debt securities, with each class or tranche reflecting a different degree of credit risk. This stratification of credit risk means that one class of creditors is entitled to receive payments from the pool before another class. Securitisations take many forms, and may be categorised as traditional or synthetic, depending on legal ownership of the pool of assets:
Traditional securitisations involve the legal transfer of ownership of the underlying asset pool into a Special Purpose Vehicle (SPV), which finances the purchase by issuing debt instruments (notes) to investors. The assets in the SPV are insulated from the bankruptcy of the seller or servicer of those assets, and principal and interest are paid to the investors from realisation of or regular cash flows from those assets. The notes are commonly referred to as asset backed securities (ABS), and may take the form of residential mortgage backed securities (RMBS)
Synthetic securitisations also transfer the credit risk of the pool of assets to third parties, however legal ownership of the assets remains with the originator. This transfer of credit risk may be achieved via funded structures (eg: credit-linked notes) or may be unfunded (eg: credit default swaps, credit derivatives or guarantees).
Regulatory capital approaches used in ANZ’s securitisation activities For securitisation exposures held in ANZ’s banking book48, ANZ applies an Internal Ratings-Based approach (as outlined in APS 120: Securitisation) to determine the regulatory capital charge related to banking book securitisation exposures. For securitisation exposures held in ANZ’s trading book, regulatory capital is calculated under market risk approaches described in Chapter 7.
Securitisation activities ANZ is involved in four main types of securitisation activities:
Securitisation of ANZ-originated assets - The securitisation of ANZ-originated assets provides diversity in the funding base of ANZ. Such securitisations may or may not involve the transfer of credit risk and as such, may or may not provide regulatory capital relief
Securitisation of third-party originated assets
Facilities and services provided to securitisations - ANZ provides various facilities to securitisations, including: liquidity, funding derivatives and/or credit support as well as services such as structuring and arranging, conduit management and (via ANZ Capel Court Limited) trust management
Investment in securities - ANZ purchases notes issued from securitisation programs for trading or liquidity purposes.
Governance of securitisation activities Governance of securitisation activities is overseen by the Board and Executive Committees described in Chapter 3, and managed in accordance with the credit risk and market risk frameworks described in Chapters 5 and 7. Many functions within ANZ are involved in securitisation activities, due to the range of activities undertaken and risks that need to be managed. For origination and structuring, ANZ has a specialist securitisation team with independent risk personnel overseeing operations. Credit decisions require
47 APRA has extended the definition of securitisation in certain cases where only one tranche or class of creditors is serviced by the cash flow from the pool of assets.
48 Exposures are classified into either the trading book or the banking book. In general terms, the trading book consists of positions in financial instruments and commodities held with trading intent or in order to hedge other elements of the trading book, and the banking book contains all other exposures. Banking book exposures are typically held to maturity, in contrast to the shorter term, trading nature of the trading book.
ANZ Basel II Pillar 3 disclosure September 2010
50
joint risk and business approval. The securitisation team must be involved in all non-trading securitisation transactions, which ensures consistent expert treatment. When ANZ is investing in securitisations, the Global Markets business manages them as they do for any other part of the trading or liquidity portfolios.
Risk measurement and reporting of securitisation exposures
In accordance with APS 120: Securitisation, ANZ has a hierarchy of approaches that can be used to quantify the credit risk of securitisation exposures in the banking book. The most common approach used is the Internal Assessment Approach, whereby ANZ uses a rating agency-type methodology which takes into account historical performance of assets and other (asset-specific) considerations such as underwriting standards.
The rating derived from the above process is used with a conservative LGD and EAD for economic capital.
All facilities for securitisation vehicles are reviewed at least annually, including the risk grade. ANZ undertakes its own internal risk assessments for securitisation exposures and supplements this assessment with external rating agency ratings and/or methodology.
The type and frequency of reporting for ANZ’s securitisation exposures is a function of the nature of those exposures:
Facilities to securitisation vehicles are reported using standard credit reporting systems, distinguished by appropriate product codes. The regular reporting frequency for most of these systems is monthly
In addition, all exposures to SPVs are reported to the Credit and Market Risk Committee on a six-monthly basis. Utilisation of liquidity facilities are reported internally on a weekly basis
Investments in securitisations will be reported through the trading book or other investment reporting systems.
Accounting policies Many securitisation structures will involve the creation of a securitisation SPV. Any SPV in which ANZ has involvement is assessed for control under the requirements of AASB Interpretation 112 Consolidation – Special Purpose Entities, which is based on the concepts of risk and rewards. Where control is determined to exist, the SPV is consolidated into ANZ’s financial statements. This assessment is performed regardless of whether the assets are ANZ or third-party originated. Financial instruments held and issued either from SPVs which are consolidated by ANZ or those held or issued to a non-consolidated SPV are recognised and valued using the principles of AASB 139 Financial Instruments: Recognition and Measurement, depending on their nature. Derecognition of any transferred ANZ originated assets is determined based on the derecognition principles of AASB 139 using a risks and rewards model. Assets may be fully or partially derecognised when substantially all the risks and rewards are transferred to the SPV and control of the asset is not retained. In the case of a synthetic securitisation, any transferred credit exposure is recognised through the fair value measurement of the segregated embedded or stand-alone credit derivative established within the structure.
Use of external rating agencies ANZ typically uses Standard & Poor’s, Moody's Investor Services and/or Fitch Ratings for securitisations. These rating agencies are all used across a variety of asset classes and securitisation activities.
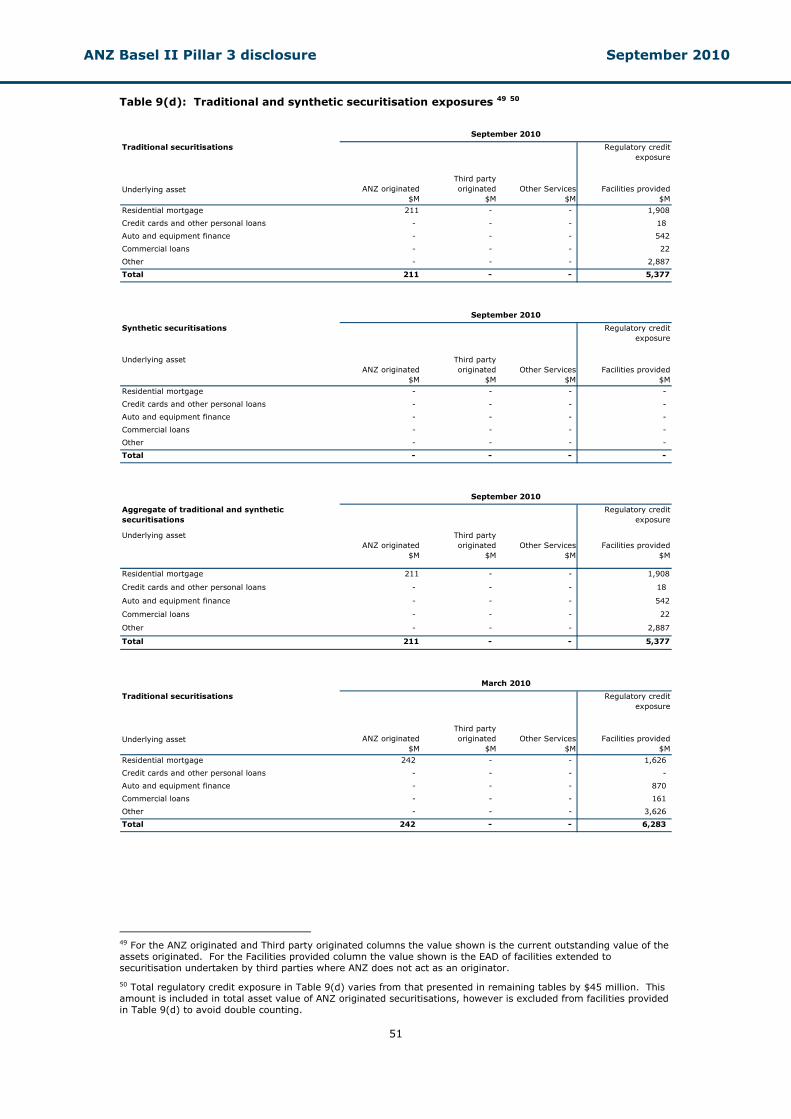
ANZ Basel II Pillar 3 disclosure September 2010
51
Table 9(d): Traditional and synthetic securitisation exposures 49 50
Traditional securitisations Regulatory creditexposure
Underlying asset ANZ originated$M
Third partyoriginated
$MOther Services
$MFacilities provided
$M
Residential mortgage 211 - - 1,908
Credit cards and other personal loans - - - 18
Auto and equipment finance - - - 542
Commercial loans - - - 22
Other - - - 2,887
Total 211 - - 5,377
Synthetic securitisations Regulatory creditexposure
Underlying assetANZ originated
$M
Third partyoriginated
$MOther Services
$MFacilities provided
$M
Residential mortgage - - - -
Credit cards and other personal loans - - - -
Auto and equipment finance - - - -
Commercial loans - - - -
Other - - - -
Total - - - -
Aggregate of traditional and synthetic securitisations
Regulatory creditexposure
Underlying assetANZ originated
$M
Third partyoriginated
$MOther Services
$MFacilities provided
$M
Residential mortgage 211 - - 1,908
Credit cards and other personal loans - - - 18
Auto and equipment finance - - - 542
Commercial loans - - - 22
Other - - - 2,887
Total 211 - - 5,377
Traditional securitisations Regulatory creditexposure
Underlying asset ANZ originated$M
Third partyoriginated
$MOther Services
$MFacilities provided
$M
Residential mortgage 242 - - 1,626
Credit cards and other personal loans - - - -
Auto and equipment finance - - - 870
Commercial loans - - - 161
Other - - - 3,626
Total 242 - - 6,283
September 2010
September 2010
March 2010
September 2010
49 For the ANZ originated and Third party originated columns the value shown is the current outstanding value of the assets originated. For the Facilities provided column the value shown is the EAD of facilities extended to securitisation undertaken by third parties where ANZ does not act as an originator.
50 Total regulatory credit exposure in Table 9(d) varies from that presented in remaining tables by $45 million. This amount is included in total asset value of ANZ originated securitisations, however is excluded from facilities provided in Table 9(d) to avoid double counting.
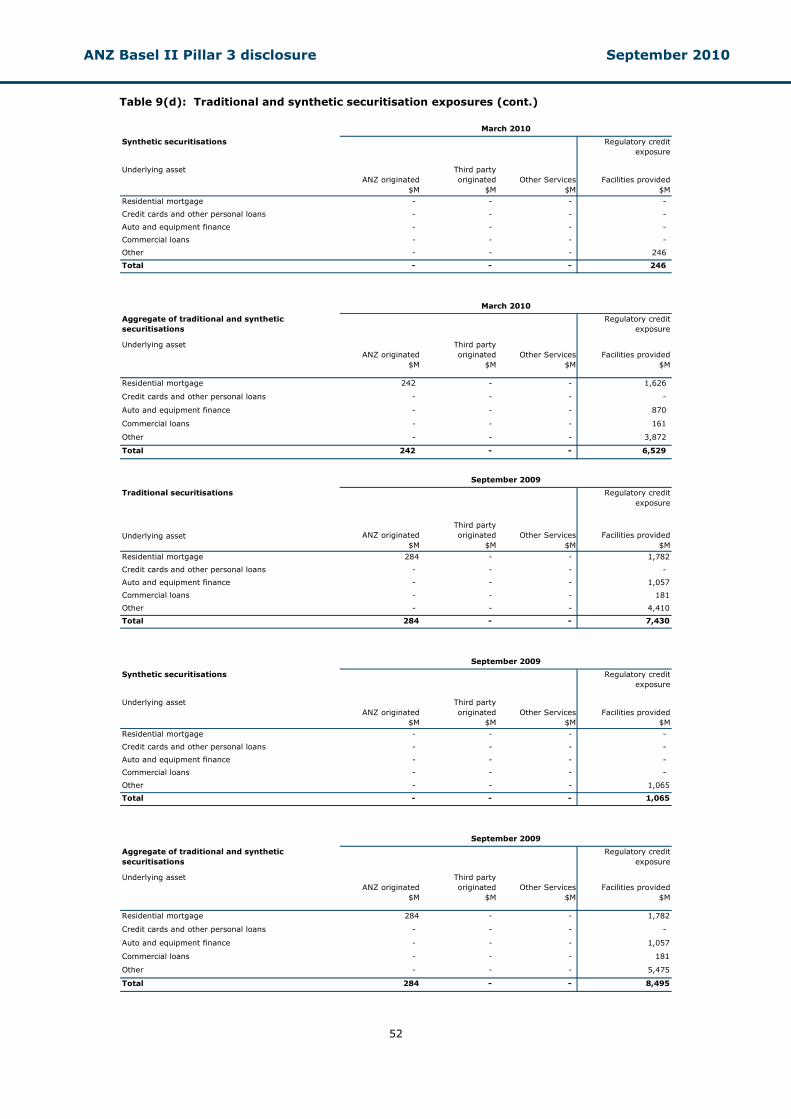
ANZ Basel II Pillar 3 disclosure September 2010
52
Table 9(d): Traditional and synthetic securitisation exposures (cont.)
Synthetic securitisations Regulatory creditexposure
Underlying assetANZ originated
$M
Third partyoriginated
$MOther Services
$MFacilities provided
$M
Residential mortgage - - - -
Credit cards and other personal loans - - - -
Auto and equipment finance - - - -
Commercial loans - - - -
Other - - - 246
Total - - - 246
Aggregate of traditional and synthetic securitisations
Regulatory creditexposure
Underlying assetANZ originated
$M
Third partyoriginated
$MOther Services
$MFacilities provided
$M
Residential mortgage 242 - - 1,626
Credit cards and other personal loans - - - -
Auto and equipment finance - - - 870
Commercial loans - - - 161
Other - - - 3,872
Total 242 - - 6,529
Traditional securitisations Regulatory creditexposure
Underlying asset ANZ originated$M
Third partyoriginated
$MOther Services
$MFacilities provided
$M
Residential mortgage 284 - - 1,782
Credit cards and other personal loans - - - -
Auto and equipment finance - - - 1,057
Commercial loans - - - 181
Other - - - 4,410
Total 284 - - 7,430
Synthetic securitisations Regulatory creditexposure
Underlying assetANZ originated
$M
Third partyoriginated
$MOther Services
$MFacilities provided
$M
Residential mortgage - - - -
Credit cards and other personal loans - - - -
Auto and equipment finance - - - -
Commercial loans - - - -
Other - - - 1,065
Total - - - 1,065
Aggregate of traditional and synthetic securitisations
Regulatory creditexposure
Underlying assetANZ originated
$M
Third partyoriginated
$MOther Services
$MFacilities provided
$M
Residential mortgage 284 - - 1,782
Credit cards and other personal loans - - - -
Auto and equipment finance - - - 1,057
Commercial loans - - - 181
Other - - - 5,475
Total 284 - - 8,495
September 2009
September 2009
March 2010
March 2010
September 2009
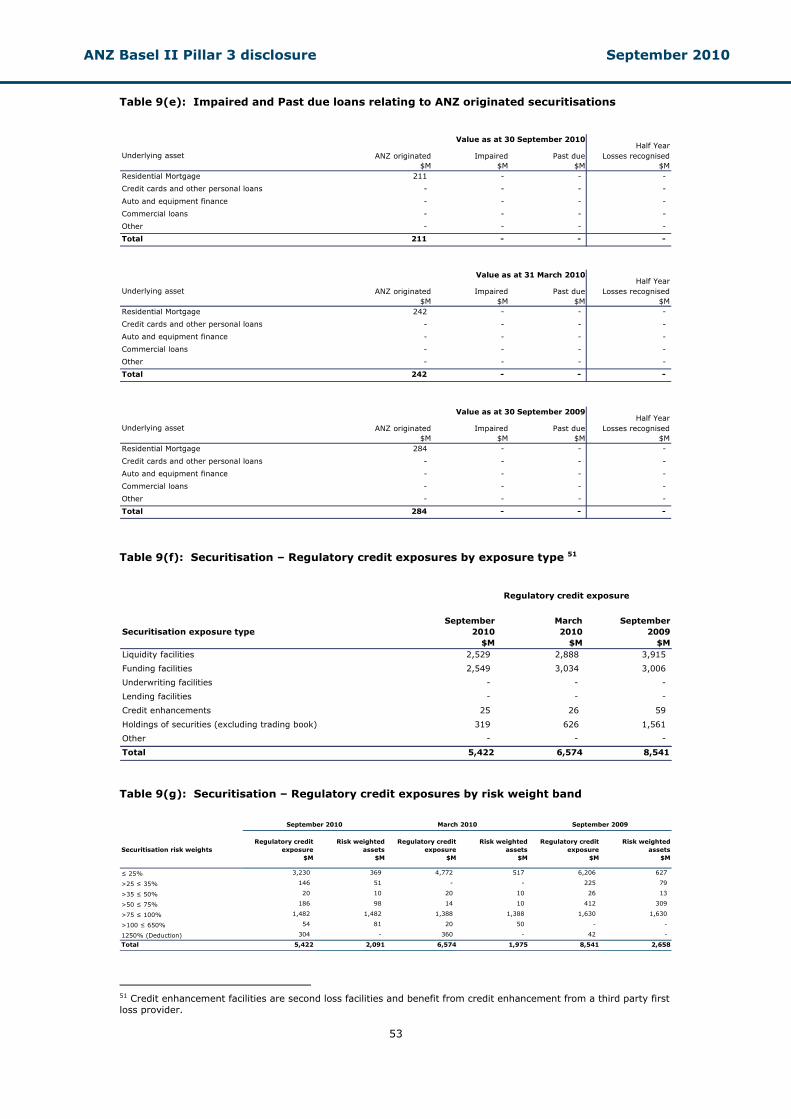
ANZ Basel II Pillar 3 disclosure September 2010
53
Table 9(e): Impaired and Past due loans relating to ANZ originated securitisations
Half YearUnderlying asset ANZ originated
$MImpaired
$MPast due
$MLosses recognised
$MResidential Mortgage 211 - - -
Credit cards and other personal loans - - - -
Auto and equipment finance - - - -
Commercial loans - - - -
Other - - - -
Total 211 - - -
Half YearUnderlying asset ANZ originated
$MImpaired
$MPast due
$MLosses recognised
$MResidential Mortgage 242 - - -
Credit cards and other personal loans - - - -
Auto and equipment finance - - - -
Commercial loans - - - -
Other - - - -
Total 242 - - -
Half YearUnderlying asset ANZ originated
$MImpaired
$MPast due
$MLosses recognised
$MResidential Mortgage 284 - - -
Credit cards and other personal loans - - - -
Auto and equipment finance - - - -
Commercial loans - - - -
Other - - - -
Total 284 - - -
Value as at 31 March 2010
Value as at 30 September 2010
Value as at 30 September 2009
Table 9(f): Securitisation – Regulatory credit exposures by exposure type 51
Securitisation exposure typeSeptember
2010$M
March 2010
$M
September2009
$MLiquidity facilities 2,529 2,888 3,915
Funding facilities 2,549 3,034 3,006
Underwriting facilities - - -
Lending facilities - - -
Credit enhancements 25 26 59
Holdings of securities (excluding trading book) 319 626 1,561
Other - - -
Total 5,422 6,574 8,541
Regulatory credit exposure
Table 9(g): Securitisation – Regulatory credit exposures by risk weight band
Securitisation risk weightsRegulatory credit
exposure$M
Risk weightedassets
$M
Regulatory creditexposure
$M
Risk weightedassets
$M
Regulatory creditexposure
$M
Risk weightedassets
$M
≤ 25% 3,230 369 4,772 517 6,206 627
>25 ≤ 35% 146 51 - - 225 79
>35 ≤ 50% 20 10 20 10 26 13
>50 ≤ 75% 186 98 14 10 412 309
>75 ≤ 100% 1,482 1,482 1,388 1,388 1,630 1,630
>100 ≤ 650% 54 81 20 50 - -
1250% (Deduction) 304 - 360 - 42 -
Total 5,422 2,091 6,574 1,975 8,541 2,658
September 2009March 2010September 2010
51 Credit enhancement facilities are second loss facilities and benefit from credit enhancement from a third party first loss provider.
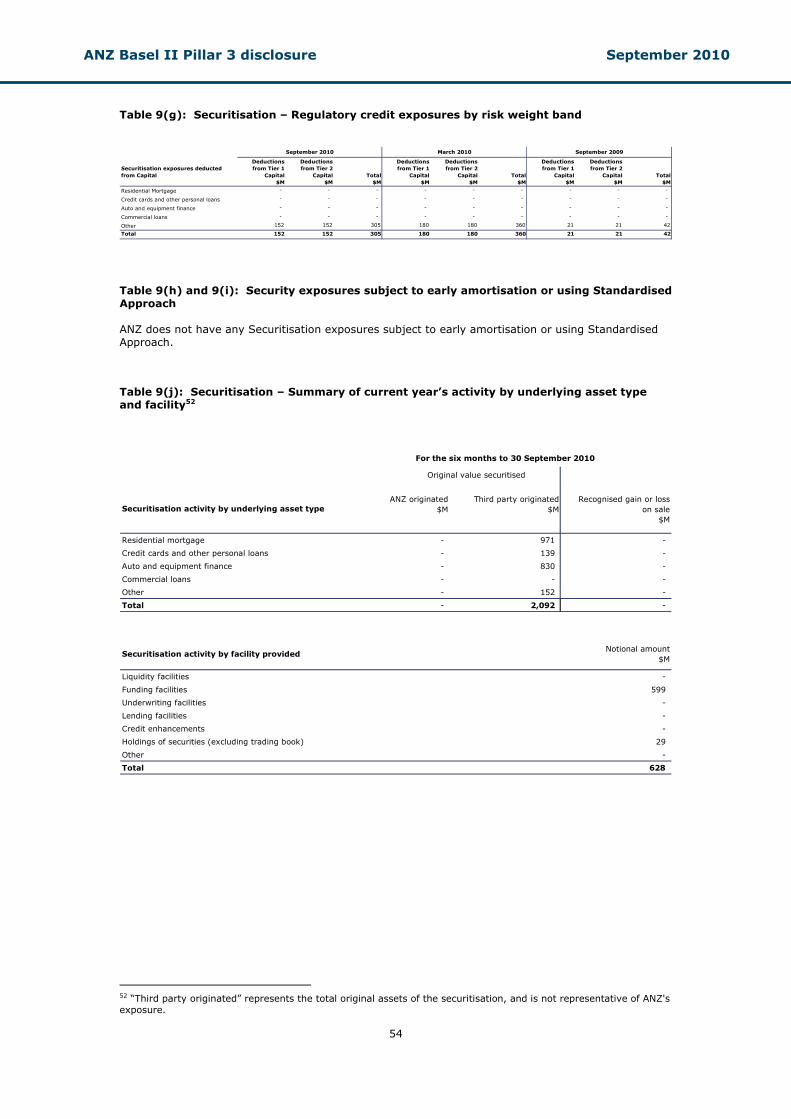
ANZ Basel II Pillar 3 disclosure September 2010
54
Table 9(g): Securitisation – Regulatory credit exposures by risk weight band
Securitisation exposures deducted from Capital
Deductionsfrom Tier 1
Capital$M
Deductionsfrom Tier 2
Capital$M
Total $M
Deductionsfrom Tier 1
Capital$M
Deductionsfrom Tier 2
Capital$M
Total $M
Deductionsfrom Tier 1
Capital$M
Deductionsfrom Tier 2
Capital$M
Total $M
Residential Mortgage - - - - - - - - -
Credit cards and other personal loans - - - - - - - - -
Auto and equipment finance - - - - - - - - -
Commercial loans - - - - - - - - -
Other 152 152 305 180 180 360 21 21 42
Total 152 152 305 180 180 360 21 21 42
September 2009March 2010September 2010
Table 9(h) and 9(i): Security exposures subject to early amortisation or using Standardised Approach ANZ does not have any Securitisation exposures subject to early amortisation or using Standardised Approach.
Table 9(j): Securitisation – Summary of current year’s activity by underlying asset type and facility52
Securitisation activity by underlying asset typeANZ originated
$MThird party originated
$MRecognised gain or loss
on sale$M
Residential mortgage - 971 -
Credit cards and other personal loans - 139 -
Auto and equipment finance - 830 -
Commercial loans - - -
Other - 152 -
Total - 2,092 -
Securitisation activity by facility providedNotional amount
$M
Liquidity facilities -
Funding facilities 599
Underwriting facilities -
Lending facilities -
Credit enhancements -
Holdings of securities (excluding trading book) 29
Other -
Total 628
Original value securitised
For the six months to 30 September 2010
52 “Third party originated” represents the total original assets of the securitisation, and is not representative of ANZ's exposure.
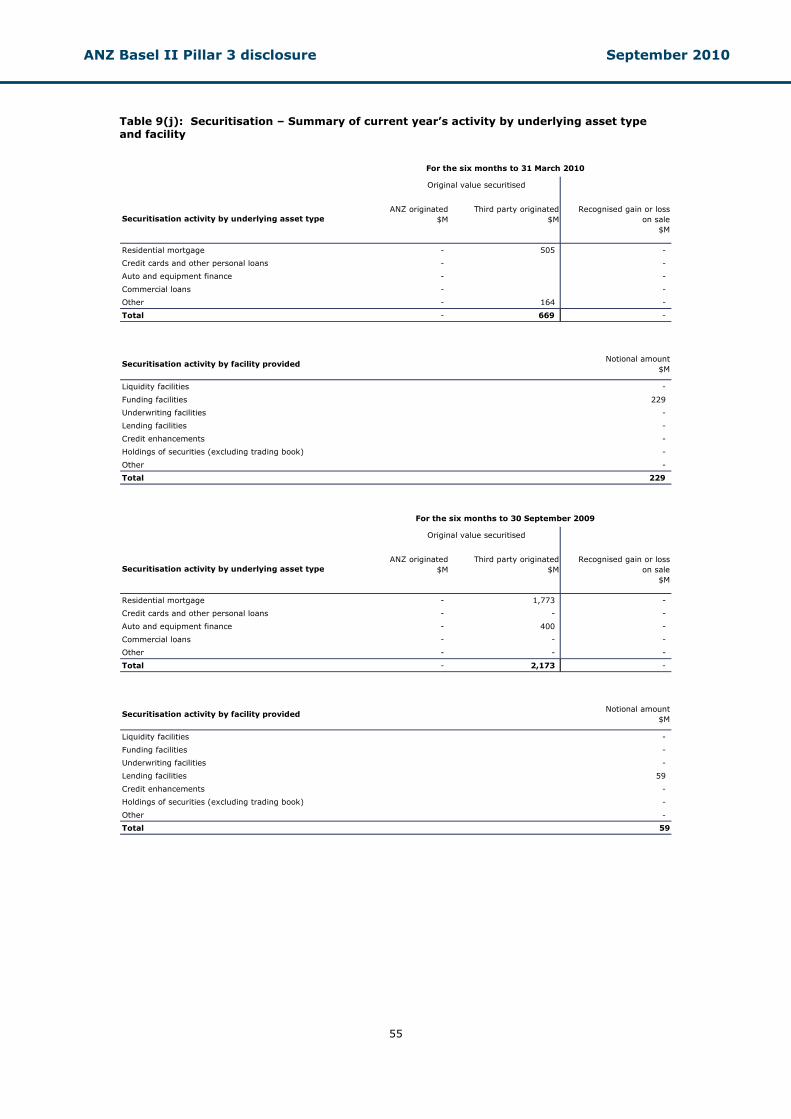
ANZ Basel II Pillar 3 disclosure September 2010
55
Table 9(j): Securitisation – Summary of current year’s activity by underlying asset type and facility
Securitisation activity by underlying asset typeANZ originated
$MThird party originated
$MRecognised gain or loss
on sale$M
Residential mortgage - 505 -
Credit cards and other personal loans - -
Auto and equipment finance - -
Commercial loans - -
Other - 164 -
Total - 669 -
Securitisation activity by facility providedNotional amount
$M
Liquidity facilities -
Funding facilities 229
Underwriting facilities -
Lending facilities -
Credit enhancements -
Holdings of securities (excluding trading book) -
Other -
Total 229
Securitisation activity by underlying asset typeANZ originated
$MThird party originated
$MRecognised gain or loss
on sale$M
Residential mortgage - 1,773 -
Credit cards and other personal loans - - -
Auto and equipment finance - 400 -
Commercial loans - - -
Other - - -
Total - 2,173 -
Securitisation activity by facility providedNotional amount
$M
Liquidity facilities -
Funding facilities -
Underwriting facilities -
Lending facilities 59
Credit enhancements -
Holdings of securities (excluding trading book) -
Other -
Total 59
For the six months to 30 September 2009
Original value securitised
For the six months to 31 March 2010
Original value securitised
ANZ Basel II Pillar 3 disclosure September 2010
56
Chapter 7 – Market Risk
Table 11 Market risk – Internal Models Approach (IMA)
Definition and scope of market risk Market risk is defined as the risk to ANZ’s earnings arising from changes in interest rates, foreign exchange rates and credit spreads, or from fluctuations in bond, commodity or equity prices. Market risk arises through ANZ’s trading and balance sheet activities. This chapter focuses on market risk arising from all traded positions including foreign exchange and commodity risks in the trading book and banking book. Chapter 10 deals with market risk management of interest rate in the banking book.
Regulatory approval to use the Internal Models Approach ANZ has been given approval by APRA to use the Internal Models Approach (IMA) under APS 116 Capital Adequacy: Market Risk for all trading portfolios except for specific interest rate risk, equity trading and electricity trading. ANZ uses the Standardised Approach to market risk capital for these three subsets of market risk.
Governance of market risk The Board’s Risk Committee oversight of market risk is supported by the Credit and Market Risk Committee (CMRC) as described in Chapter 3. The Market Risk function is a specialist risk management unit independent of the business that is responsible for measuring and monitoring market risk, and has designed and implemented policies and procedures to ensure that market risk exposures are managed within the appetite and limit framework set by the Board. Traded market risk Management of traded market risk is governed by the Traded Market Risk Management Framework. Key aspects of this framework include:
• A clear definition of the trading book
• A comprehensive set of market risk policies that promote the proactive identification and communication of risk
• A robust Value at Risk (VaR) quantification approach supplemented by comprehensive stress testing
• A comprehensive market risk limit framework that controls all material market risks
• An independent Market Risk function which actively monitors market risk exposure, compliance with limits and risk policies, as well as the ongoing effectiveness and appropriateness of the risk management framework
• Regular and effective reporting of market risk to executive management and the Board.
Measurement of market risk ANZ’s traded market risk management framework incorporates a risk measurement approach to quantify the magnitude of market risk within trading books. This approach and related analysis identifies the range of possible outcomes that can be expected over a given period of time and establishes the relative likelihood of those outcomes. ANZ’s key tools to measure and manage traded market risk on a daily basis are VaR estimates and sensitivities measures. VaR is calculated using a historical simulation with a 500 day observation period. Traded VaR is calculated at 97.5% confidence interval, one-day holding period for trading activities (for internal purposes) and 99% confidence interval, ten-day holding period for the calculation of regulatory market risk capital. A 97.5% confidence level, one-day holding period VaR means that there is 97.5% chance that a loss will not exceed the VaR estimate on any given day. A 99% confidence level, ten-day holding period VaR means that there is 99% chance that a loss will not exceed the VaR estimate over a period of 10 days, assuming no rebalancing of risk positions. All material market risk factors and all trading portfolios (with the exception of interest rate risk – specific risk, equities and electricity trading, for which capital is calculated using under the Standardised Approach described in Table 10 below) are captured within the VaR model.
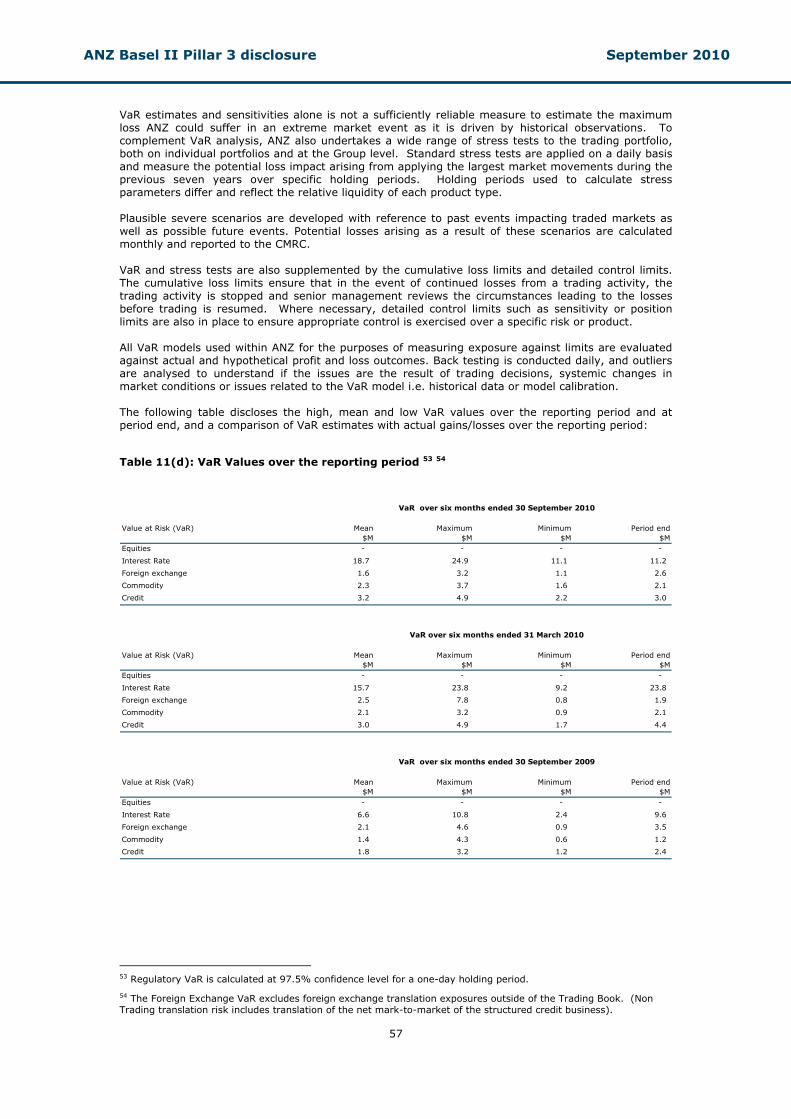
ANZ Basel II Pillar 3 disclosure September 2010
57
VaR estimates and sensitivities alone is not a sufficiently reliable measure to estimate the maximum loss ANZ could suffer in an extreme market event as it is driven by historical observations. To complement VaR analysis, ANZ also undertakes a wide range of stress tests to the trading portfolio, both on individual portfolios and at the Group level. Standard stress tests are applied on a daily basis and measure the potential loss impact arising from applying the largest market movements during the previous seven years over specific holding periods. Holding periods used to calculate stress parameters differ and reflect the relative liquidity of each product type. Plausible severe scenarios are developed with reference to past events impacting traded markets as well as possible future events. Potential losses arising as a result of these scenarios are calculated monthly and reported to the CMRC. VaR and stress tests are also supplemented by the cumulative loss limits and detailed control limits. The cumulative loss limits ensure that in the event of continued losses from a trading activity, the trading activity is stopped and senior management reviews the circumstances leading to the losses before trading is resumed. Where necessary, detailed control limits such as sensitivity or position limits are also in place to ensure appropriate control is exercised over a specific risk or product. All VaR models used within ANZ for the purposes of measuring exposure against limits are evaluated against actual and hypothetical profit and loss outcomes. Back testing is conducted daily, and outliers are analysed to understand if the issues are the result of trading decisions, systemic changes in market conditions or issues related to the VaR model i.e. historical data or model calibration. The following table discloses the high, mean and low VaR values over the reporting period and at period end, and a comparison of VaR estimates with actual gains/losses over the reporting period:
Table 11(d): VaR Values over the reporting period 53 54
Value at Risk (VaR) Mean $M
Maximum$M
Minimum$M
Period end$M
Equities - - - -
Interest Rate 18.7 24.9 11.1 11.2
Foreign exchange 1.6 3.2 1.1 2.6
Commodity 2.3 3.7 1.6 2.1
Credit 3.2 4.9 2.2 3.0
Value at Risk (VaR) Mean $M
Maximum$M
Minimum$M
Period end$M
Equities - - - -
Interest Rate 15.7 23.8 9.2 23.8
Foreign exchange 2.5 7.8 0.8 1.9
Commodity 2.1 3.2 0.9 2.1
Credit 3.0 4.9 1.7 4.4
Value at Risk (VaR) Mean $M
Maximum$M
Minimum$M
Period end$M
Equities - - - -
Interest Rate 6.6 10.8 2.4 9.6
Foreign exchange 2.1 4.6 0.9 3.5
Commodity 1.4 4.3 0.6 1.2
Credit 1.8 3.2 1.2 2.4
VaR over six months ended 30 September 2009
VaR over six months ended 31 March 2010
VaR over six months ended 30 September 2010
53 Regulatory VaR is calculated at 97.5% confidence level for a one-day holding period.
54 The Foreign Exchange VaR excludes foreign exchange translation exposures outside of the Trading Book. (Non Trading translation risk includes translation of the net mark-to-market of the structured credit business).
ANZ Basel II Pillar 3 disclosure September 2010
58
Comparison of VaR estimates to actual gains/losses Back testing involves the comparison of calculated VaR exposures with profit and loss data to identify the frequency of incidents when trading losses exceed the calculated VaR. As a probabilistic measure of potential future gains or losses, it is expected that results exceed VaR a proportion of the time. For APRA backtesting purposes, VaR is calculated at the 99% confidence interval with a one day holding period. Therefore, over the long-run we would expect one back testing outlier every 100 days. ANZ uses actual profit and loss data and hypothetical profit and loss data. Hypothetical profit and loss data is designed to remove the impacts of intraday trading and sales margins. It is calculated as the difference between the value of the prior day portfolio at prior day closing rates and the value at current day closing rates. Markets Finance calculates actual profit and loss while Market Risk calculates hypothetical profit and loss. As at 31 September 2010, based on the prior 250 business days, there were zero hypothetical and zero actual genuine negative outliers, compared to zero hypothetical and 1 actual genuine negative outliers as at 31 March 2010. This decrease in the number of hypothetical and actual genuine negative outliers is in line with expectations as the high market volatility experienced from early 2008 has been rolled out of the current historical VaR model while a reduction in market volatility throughout 2009-2010 has decreased the magnitude of daily actual and hypothetical profit and loss results. Considering this the VaR model continues to be an appropriate model to use for Market Risk calculations.
Reporting of market risk Market Risk conducts daily VaR and stress testing and reports the results to Market Risk management, senior executives and trading management. In the event of breaches, Market Risk will escalate details of the breach to the appropriate discretion holder within Market Risk and Group Risk. All breaches are reported to CMRC on a monthly basis. Market Risk monitors and analyses back testing results on a daily basis and reports quarterly results to CMRC.
Mitigation of market risk ANZ’s system of market risk quantification is fundamental to how market risk is mitigated. The results are compared to established limits and breaches are reported immediately to management who instruct on the appropriate action in accordance with authorised delegations. All breaches are subsequently reported to senior executive Risk committees, i.e. CMRC. The Market Risk group is also an important factor in how ANZ mitigates its market risk. It is a unit independent of the dealing, processing/settlements operations and manages the day-to-day risk management function. Market Risk group has presence in all the major dealing operations centres in Australia, New Zealand, Asia, Europe and America. Commodities risk Commodity price risk arises as a result of movement in prices for various commodities. All exposures to commodity prices are transferred to the trading book and centrally managed by the business and monitored by the Market Risk function in accordance with the Traded Market Risk Management Framework. Foreign exchange risk Foreign exchange risk arises as a result of movements in relative values of various currencies. It arises from ANZ’s operating business activities, trading activities and structural foreign exchange exposures from foreign investments and capital management activities. Foreign exchange exposures from ANZ’s normal operating business and trading activities are recorded in core multi-currency systems and managed within the trading book in accordance with the Traded Market Risk Management Framework. ANZ’s structural foreign exchange exposures are managed in accordance with the policies approved by the Risk Committee of the Board, with the main objective of ensuring that ANZ’s capital ratio is largely protected from the changes in foreign exchange. ANZ’s investment in ANZ National Bank in New Zealand is the main source of the structural foreign exchange exposure.
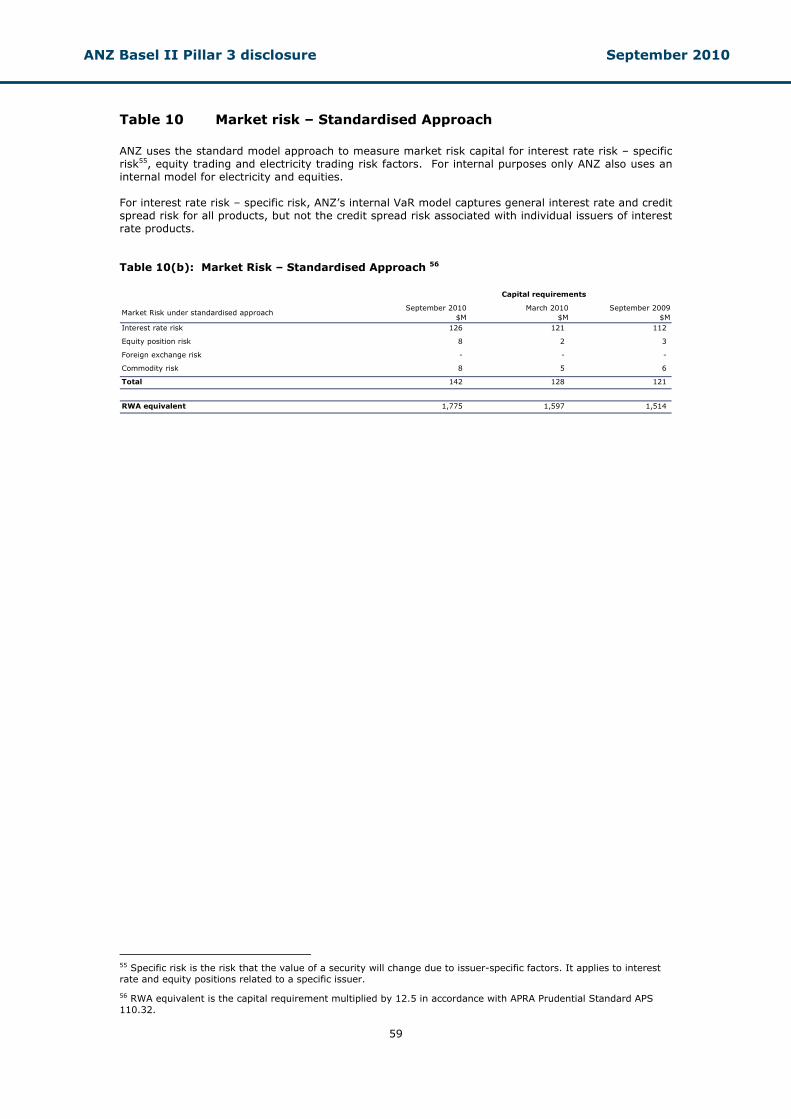
ANZ Basel II Pillar 3 disclosure September 2010
59
Table 10 Market risk – Standardised Approach ANZ uses the standard model approach to measure market risk capital for interest rate risk – specific risk55, equity trading and electricity trading risk factors. For internal purposes only ANZ also uses an internal model for electricity and equities. For interest rate risk – specific risk, ANZ’s internal VaR model captures general interest rate and credit spread risk for all products, but not the credit spread risk associated with individual issuers of interest rate products. Table 10(b): Market Risk – Standardised Approach 56
Market Risk under standardised approachSeptember 2010
$MMarch 2010
$MSeptember 2009
$MInterest rate risk 126 121 112
Equity position risk 8 2 3
Foreign exchange risk - - -
Commodity risk 8 5 6
Total 142 128 121
RWA equivalent 1,775 1,597 1,514
Capital requirements
55 Specific risk is the risk that the value of a security will change due to issuer-specific factors. It applies to interest rate and equity positions related to a specific issuer.
56 RWA equivalent is the capital requirement multiplied by 12.5 in accordance with APRA Prudential Standard APS 110.32.
ANZ Basel II Pillar 3 disclosure September 2010
60
Chapter 8 – Operational Risk
Table 12 Operational Risk
Definition of operational risk Within ANZ, operational risk is defined as the risk of loss resulting from inadequate or failed internal processes, people and systems, or from external events. This definition includes legal risk, and the risk of reputational loss57, however excludes strategic risk. Regulatory approval to use the Advanced Measurement Approach ANZ has been granted approval by APRA to use the Advanced Measurement Approach (AMA) under APS 115 Capital Adequacy: Advanced Measurement Approaches to Operational Risk. The approved AMA applies across all of ANZ, and does not comprise partial use.
Operational risk governance and structure The roles of ANZ Board Risk Committee and the Operational Risk Executive Committee (OREC) are described in Chapter 3. Group Operational Risk are responsible for exercising governance over operational risk through the management of the operational risk framework, policy development, operational risk measurement and capital allocation and reporting of operational risk issues to executive committees. Divisional Risk Committees and Business Unit Risk Forums manage and maintain oversight of operational risks supported by thresholds for escalation and monitoring. Business units are responsible for implementation of the operational risk framework, including the identification, analysis, assessment and treatment of operational risks on a day-to-day basis. Divisional Risk personnel provide oversight of operational risk management undertaken in the business units.. Operational risk principles ANZ has developed a comprehensive framework to manage operational risk which includes the following operational risk management principles:
• Operational risk is recognised as a primary risk within ANZ and has a governance structure responsible for maintaining oversight
• ANZ will create a culture that recognises operational risk as everyone’s responsibility with roles and responsibilities clearly articulated at all levels in the organisation
• ANZ will create an environment for sound, transparent decision-making that includes a framework to identify, assess, control and monitor ANZ’s operational risks
• Key decisions within ANZ will be informed by balancing operational risk with reward
• ANZ will continuously monitor the effectiveness and relevance of its framework for managing operational risk
• ANZ will monitor its exposure to operational risk and changes to its operational risk profile
• ANZ will learn from losses arising from operational risk by identifying and improving the underlying root cause.
The framework is supported by policies and guidelines. Operational risk management Given the wide scope of operational risk, a robust operational risk management framework and sound internal control environment are essential to risk management. The Operational Risk Framework provides the direction for managing operational risk in terms of specifying the accountabilities of business unit line management and staff, Divisional and Group Corporate Centre Governance functions, and the role of Internal Audit in the management of operational risk at ANZ.
57 Regulatory Capital is calculated in accordance with the definition of Operational Risk outlined in APS 115 Capital Adequacy: Advanced Measurement Approaches to Operational Risk, and therefore excludes reputational risk considerations.
ANZ Basel II Pillar 3 disclosure September 2010
61
Day-to-day management of operational risk is the responsibility of business unit line management and staff. This includes:
• Identification of potential risks
• Analysis of identified risks, including assessing the inherent and residual risk after consideration of controls currently in place. This requires analysis of the potential consequences of failing to deal with the risks, the likelihood of the risks being realised and the effectiveness of the key controls in place to prevent or mitigate the risk
• Evaluation of the risk to determine whether it is within Board approved risk appetite
• Identification and implementation of risk treatment options to improve the key controls over the risk for those risks that are outside the risk appetite. When the preferred risk treatment option is selected the risk treatment plan is documented
• Maintaining risk registers and recording operational risk events and compliance incidents on the ANZ loss event database.
• Monitoring and review of treatment plans, operational risks and controls, including testing the key controls and reporting on the current operational risk profile.
Dedicated Divisional and Group Corporate Centre Risk Governance teams provide a support monitoring and oversight function for divisions and business units, with Internal Audit providing independent assurance and review.
Operational risk mitigation In line with industry practice, ANZ obtains insurance cover from third party and captive providers for those operational risks where cost-effective premiums can be obtained. ANZ’s AMA operational risk regulatory capital does not utilise insurance mitigation under APS115. Business disruption is a critical risk to a bank’s ability to operate, so ANZ has comprehensive business continuity, recovery and crisis management plans. The intention of the business continuity and recovery plans is to ensure critical business functions can be maintained, or restored in a timely fashion, in the event of material disruptions arising from internal or external events. Crisis management planning at Group and country levels supplement business continuity plans in the event of a broader Group or country crisis. Crisis management plans include crisis team structures, roles, responsibilities and contact lists, and are subject to testing.
Operational risk reporting
ANZ’s operational risk management process includes the following activities: risk identification and evaluation; control self assessment, testing and remediation; risk mitigation tracking; internal loss event capture, event case management and monitoring. Material risks and events (including actual losses, near misses and breaches) are recorded and required to be escalated and reported to the appropriate level (either within the business, to Divisional Risk committee, CRO or the OREC) in accordance with established risk appetite and reporting thresholds for risk acceptance, remediation approval or tracking. In addition, Division Committees and OREC receive regular reporting on: trends, change in risk profiles, results from reviews or specific test results, remediation tracking and monitoring.
ANZ’s Advanced Measurement Approach Group Operational Risk is responsible for maintaining ANZ’s Advanced Measurement Approach for operational risk measurement and capital allocation. ANZ uses a scenario based methodology to determine its operational risk regulatory capital. This methodology incorporates the use of business risk profiles which consider the current business environment and internal control factors over a twelve month time horizon. Operational risk modelling is performed by a specialist central function. Operational risk capital is derived using probability distributions and calculated using Monte Carlo simulations at the division and event type level referred to as a modelling cell. The data inputs are combined for each cell using a loss distribution approach and include the following:
• Historical internal losses captured and reported in an internal loss database
• Relevant external losses, sourced from a reputable industry supplier. This data is suitably scaled using internally developed rules to ensure relevance to ANZ’s size and operations
• Scenario analysis data for severe but plausible risk events, elicited in workshops with risk and business professionals.

ANZ Basel II Pillar 3 disclosure September 2010
62
Capital outcomes include:
• Operational Risk Regulatory Capital to meet the regulatory capital soundness standard based on a 99.9% confidence interval in accordance with APRA Prudential Standard APS 115
• Economic Capital based on a 99.97% confidence interval.
Compliance Group Compliance has global oversight responsibility for the ANZ Compliance Framework, and each division has responsibility for embedding the Framework into its business operations, identifying all regulatory compliance obligations, and escalating when breaches occur. The Compliance Framework fosters an integrated approach where staff are responsible and accountable for compliance, either within their job role, or within their area of influence.
ANZ Basel II Pillar 3 disclosure September 2010
63
Chapter 9 – Equities
Table 13 Equities – disclosures for banking book positions
Definition and categorisation of equity investments held in the banking book
Equity risk is the potential loss that may be incurred on equity investments in the banking book. ANZ’s equity exposures in the banking book are primarily categorised as follows:
• Equity investments that are taken for strategic reasons - These transactions represent strategic business initiatives and include ANZ’s investments in and partnership arrangements with financial institutions in Asia. These investments are undertaken only after extensive analysis and due diligence by Group Strategic Development, internal specialists and external advisors, where appropriate. Board approval is required prior to committing to any investments over delegated authorities, and all regulatory notification requirements are met. Performance of these investments is monitored by both the owning business unit and Group Strategic Development to ensure that it is within expectations and the values of the investments are tested at least annually for impairment
• Equity investments on which capital gains are expected - These transactions are originated and managed by dedicated equity finance teams. These transactions represent funding solutions for known customers of ANZ and are governed by specific policies. ANZ ensures that the investment in these entities does not constitute a controlling interest in the relevant business
• Equity investments made as the result of a work out of a problem exposure - From time to time, ANZ will take an equity stake in a customer as part of a work out arrangement for problem exposures. These investments are made only where there is no other viable option available and form an immaterial part of ANZ’s equity exposures.
Valuation of and accounting for equity investments in the banking book
The accounting treatment of equity investments, other than for joint ventures, depends on whether ANZ has significant influence over the investee, as described in AASB 128 Investment in Associates. Where significant influence is assessed, the investment is classified as an Investment in Associates in the financial statements. ANZ adopts the equity method of accounting for associates and the Group’s interest in joint venture entities. ANZ’s share of results of associates and joint venture entities is included in the consolidated income statement. Shares in associates and joint venture entities are stated in the consolidated balance sheet at cost plus ANZ’s share of post acquisition net assets. Interests in associates and joint ventures are reviewed annually for impairment, using either market value, or a discounted cash flow methodology to assess value in-use.
In accordance with APS 111 Capital Adequacy: Measurement of Capital, equity accounted earnings from strategic investments in joint ventures and partnerships are excluded from regulatory capital until received in the form of a dividend.
Where ANZ does not have significant influence over the investee, the investment is classified as Available For Sale. The investment is initially recognised at fair value plus transaction costs. Subsequent gains or losses arising from changes in fair value are included as a separate component of equity in the available for sale revaluation reserve, with any impairment recognised in the income statement. When the asset is sold the cumulative gain or loss relating to the asset held in the available for sale revaluation reserve is transferred to the income statement.
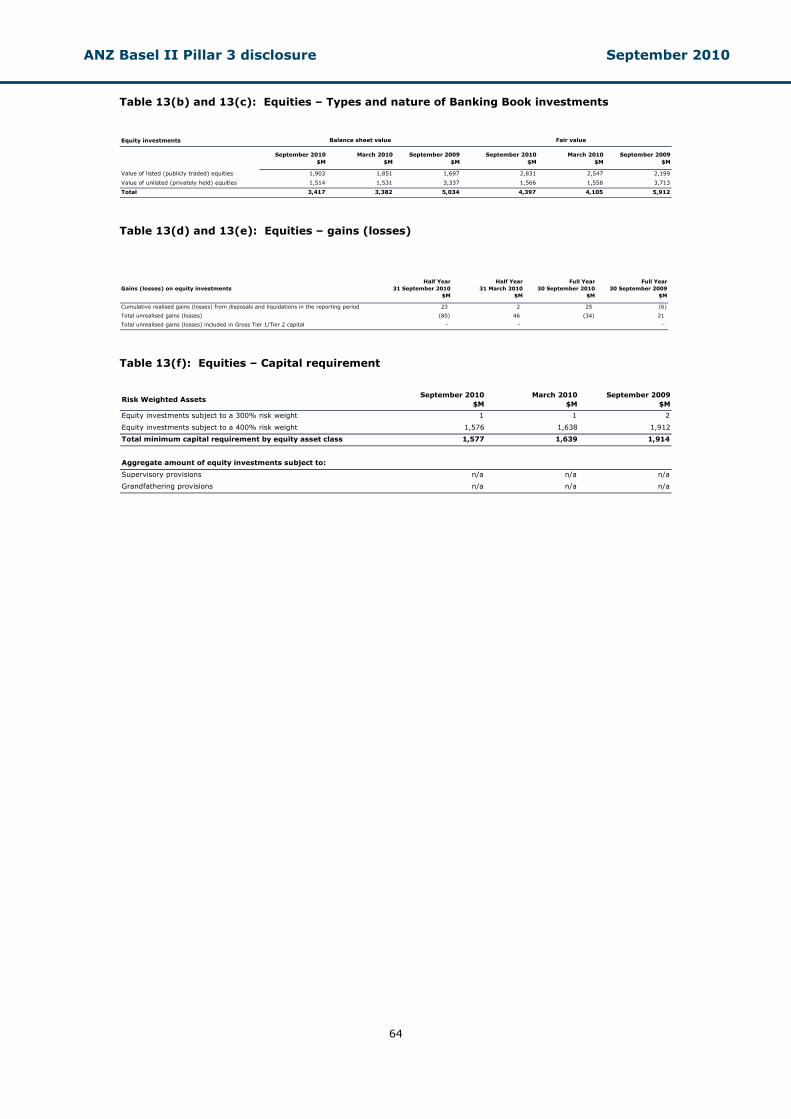
ANZ Basel II Pillar 3 disclosure September 2010
64
Table 13(b) and 13(c): Equities – Types and nature of Banking Book investments Equity investments
September 2010$M
March 2010$M
September 2009$M
September 2010$M
March 2010$M
September 2009$M
Value of listed (publicly traded) equities 1,903 1,851 1,697 2,831 2,547 2,199
Value of unlisted (privately held) equities 1,514 1,531 3,337 1,566 1,558 3,713
Total 3,417 3,382 5,034 4,397 4,105 5,912
Fair valueBalance sheet value
Table 13(d) and 13(e): Equities – gains (losses)
Gains (losses) on equity investments
Half Year31 September 2010
$M
Half Year31 March 2010
$M
Full Year30 September 2010
$M
Full Year30 September 2009
$M
Cumulative realised gains (losses) from disposals and liquidations in the reporting period 23 2 25 (6)
Total unrealised gains (losses) (80) 46 (34) 21
Total unrealised gains (losses) included in Gross Tier 1/Tier 2 capital - - - Table 13(f): Equities – Capital requirement
Risk Weighted Assets
September 2010$M
March 2010$M
September 2009$M
Equity investments subject to a 300% risk weight 1 1 2
Equity investments subject to a 400% risk weight 1,576 1,638 1,912
Total minimum capital requirement by equity asset class 1,577 1,639 1,914
Aggregate amount of equity investments subject to:
Supervisory provisions n/a n/a n/a
Grandfathering provisions n/a n/a n/a
ANZ Basel II Pillar 3 disclosure September 2010
65
Chapter 10 - Interest rate risk in the banking book (IRRBB)
Table 14 Interest rate risk in the banking book
Definition of IRRBB Interest Rate Risk in the Banking Book (IRRBB) relates to the potential adverse impact of changes in market interest rates on ANZ’s future net interest income. The risk arises from the following principal sources:
• Repricing and yield curve risk - the risk to earnings or market value as a result of changes in the overall level of interest rates and/or the relativity of these rates across the yield curve
• Basis risk - the risk to earnings or market value arising from volatility in the interest margin applicable to banking book items
• Optionality risk - the risk to earnings or market value arising from the existence of stand-alone or embedded options in banking book items.
Regulatory capital approach ANZ has received approval to use the Internal Model Approach for the calculation of regulatory capital for IRRBB, under APS 117 Capital Adequacy: Interest Rate Risk in the Banking Book (Advanced ADIs).
Governance The Risk Committee of the Board has established a risk appetite for IRRBB and delegated authority to the GALCO to manage the strategic position (capital investment term) and oversee the interest rate risk arising from the repricing of asset and liabilities (mismatch risk) in the Banking Book. GALCO have delegated the management of this mismatch risk to the Global Markets business. Market Risk is the independent unit responsible for monitoring and measuring IRRBB and has designed and implemented policies and procedures to ensure that IRRBB exposure is managed within the limit framework set by the Risk Committee of the Board. Management framework As with other key risks within ANZ, IRRBB is managed under a comprehensive framework. Key aspects of the measurement and reporting framework which provides the basis for monitoring IRRBB include:
• A comprehensive set of policies that promote the proactive identification and communication of risk
• Funds Transfer Pricing (FTP) framework to transfer interest rate risk from business units so it can be managed by the Global Markets business and monitored by Market Risk
• Quantifying the magnitude of risks and controlling the potential impact that changes in market interest rates can have on the net interest income and balance sheet fair value of ANZ
• An independent Market Risk function which actively monitors market risk exposure, compliance with limits and risk policies, as well as the ongoing effectiveness and appropriateness of the risk management framework
• Regular and effective reporting of IRRBB to Executive Management and the Board.
Measurement of IRRBB ANZ uses the following principal techniques to quantify and monitor IRRBB:
• Interest Rate Sensitivity – this is an estimate of the change in economic value of the banking book due to a 1 basis point move in a specific part of the yield curve
• Earnings-at-Risk (EaR) – this is an estimate of the amount of income that is at risk from interest rate movements over a given holding period, expressed to a 97.5% or 99% level of statistical confidence
• Value-at-Risk (VaR) – this is an estimate of the impact of interest rate changes on the banking book’s market value, expressed to a 97.5% (internal purposes) or 99% (regulatory purposes) level of statistical confidence for a given holding period
• Market Value loss limits – this mitigates the potential for embedded losses within the banking book
• Stress testing – Standard and extraordinary tests are used to highlight potential risk which may not be captured by VaR, and how the portfolio might behave under extraordinary circumstances.

ANZ Basel II Pillar 3 disclosure September 2010
66
The calculations used to quantify IRRBB require assumptions to be made about the repricing term of exposures that do not have a contractually defined repricing date, such as deposits with no set maturity dates, and prepayments. Changes to these assumptions require GALCO approval. Where relevant, IRRBB techniques recognise foreign currency effects as all measures are expressed in Australian dollars. Basis and optionality risks are measured using Monte Carlo simulation techniques, to generate a theoretical worst outcome at a specified confidence level (typically 99%) less the average outcome.
Reporting of IRRBB The output of ANZ’s VaR and EaR calculations are analysed by Global Market Risk on a daily basis. Stress tests are calculated monthly. Compliance with the risk appetite and limit framework is reported to CMRC, GALCO and the Risk Committee of the Board. IRRBB regulatory capital is calculated monthly.
ANZ’s IRRBB capital requirement The IRRBB regulatory capital requirement includes a value for repricing and yield curve risk, basis and optionality risks based on a 99% confidence interval, one year holding period and a six year historical data set. Embedded losses also make up the capital requirement and are calculated as the difference between the book value of banking book items and the current economic value.
Results of standard shock scenario The Basel II framework sets out a standard shock scenario of a 200 basis point parallel shift change in interest rates, in order to establish a comparable test across banks. The table below shows the results of this test by currency of the exposures outside the trading book.
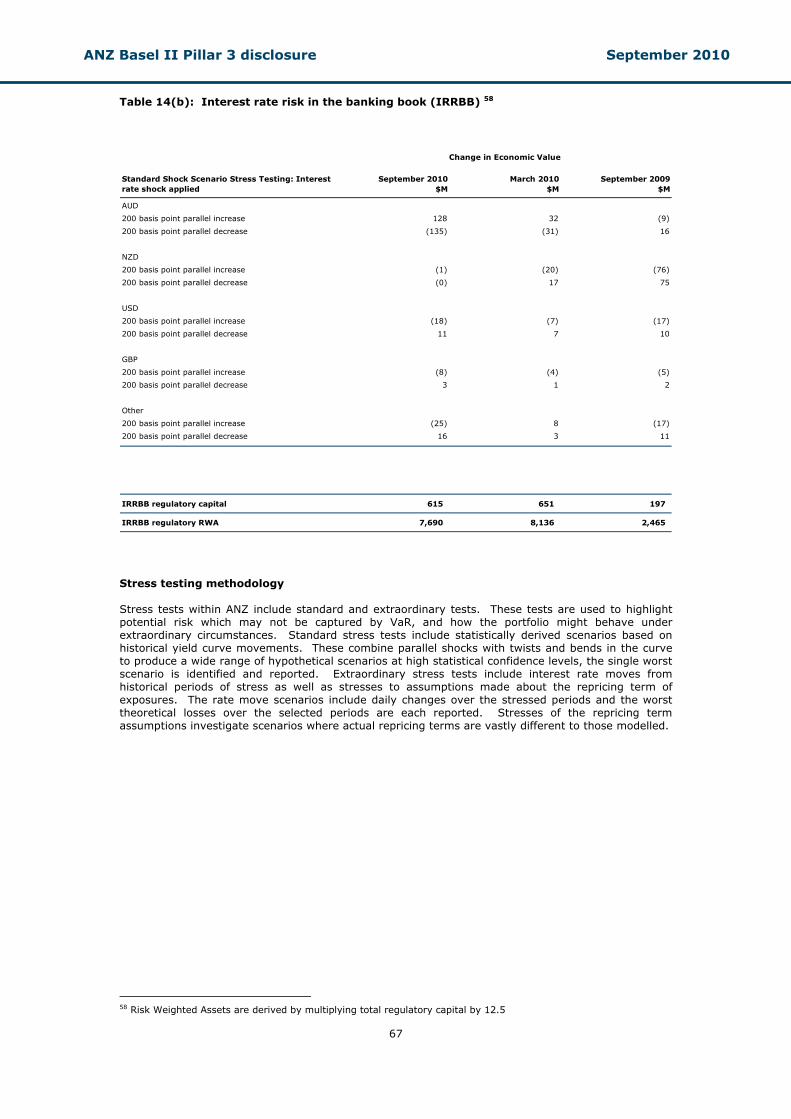
ANZ Basel II Pillar 3 disclosure September 2010
67
Table 14(b): Interest rate risk in the banking book (IRRBB) 58
Standard Shock Scenario Stress Testing: Interest rate shock applied
September 2010$M
March 2010$M
September 2009$M
AUD
200 basis point parallel increase 128 32 (9)
200 basis point parallel decrease (135) (31) 16
NZD
200 basis point parallel increase (1) (20) (76)
200 basis point parallel decrease (0) 17 75
USD
200 basis point parallel increase (18) (7) (17)
200 basis point parallel decrease 11 7 10
GBP
200 basis point parallel increase (8) (4) (5)
200 basis point parallel decrease 3 1 2
Other
200 basis point parallel increase (25) 8 (17)
200 basis point parallel decrease 16 3 11
IRRBB regulatory capital 615 651 197
IRRBB regulatory RWA 7,690 8,136 2,465
Change in Economic Value
Stress testing methodology Stress tests within ANZ include standard and extraordinary tests. These tests are used to highlight potential risk which may not be captured by VaR, and how the portfolio might behave under extraordinary circumstances. Standard stress tests include statistically derived scenarios based on historical yield curve movements. These combine parallel shocks with twists and bends in the curve to produce a wide range of hypothetical scenarios at high statistical confidence levels, the single worst scenario is identified and reported. Extraordinary stress tests include interest rate moves from historical periods of stress as well as stresses to assumptions made about the repricing term of exposures. The rate move scenarios include daily changes over the stressed periods and the worst theoretical losses over the selected periods are each reported. Stresses of the repricing term assumptions investigate scenarios where actual repricing terms are vastly different to those modelled.
58 Risk Weighted Assets are derived by multiplying total regulatory capital by 12.5
ANZ Basel II Pillar 3 disclosure September 2010
68
Chapter 11 – Liquidity risk
Overview
Liquidity risk is the risk that ANZ has insufficient capacity to fund increases in assets or is unable to meet its payment obligations as they fall due, including repaying depositors or maturing wholesale debt. The timing mismatch of cash flows and the related liquidity risk is inherent in all banking operations and is closely monitored by ANZ.
Governance
The management of ANZ’s liquidity and funding risk is overseen by the ANZ Board’s Risk Committee and the GALCO, in accordance with ANZ’s liquidity policy framework.
Scenario modelling
The Global Financial Crisis highlighted the importance of differentiating between stressed and normal market conditions in a name-specific crisis, and the different behaviour that offshore and domestic wholesale funding markets can exhibit during market stress events. Scenario modelling stresses site and total bank cashflow projections against multiple ‘survival horizons’. (A ‘Survival Horizon’ is the period that ANZ is required to remain cash flow positive under a specific scenario or stress.) Scenarios modelled are either prudential requirements i.e.: a ‘going-concern’ scenario or ‘name crisis’ scenario; or Board approved events including ‘Name-specific’ stresses and ‘Funding market’ events. Under these scenarios, customer and wholesale balance sheet asset/liability flows are stressed.
Funding metrics
ANZ manages its funding profile using a range of funding metrics and balance sheet disciplines. This approach is designed to ensure that an appropriate proportion of the Group’s assets are funded by stable funding sources including core customer deposits, longer-dated wholesale funding (with a remaining term exceeding one year) and equity. ANZ’s funding profile strengthened further during 2010 as a result of solid growth in customer deposits and the continued focus on avoiding short-term wholesale funding maturity concentrations.
Customer deposits and other funding liabilities increased by 10% to $267.1 billion at 30 September 2010 (58% of total funding) from $242.4 billion (55% of total funding) at 30 September 2009.
The proportion of total funding from term wholesale source has been maintained.
As a result, the Group’s proportional reliance on short-term wholesale funding decreased from 17% to 12% in the year to 30 September 2010. Proportionate short-term wholesale funding has approximately halved over the last two years (22% as at 30 September 2008).
Wholesale funding
ANZ maintained access to all major wholesale funding markets. Benchmark term debt issues were executed in AUD, USD, EUR, JPY, CAD, CHF and NZD. Short-term wholesale funding markets continue to function effectively, both locally and offshore. $26.4 billion of term wholesale funding (with a remaining term greater than one year at the end of the financial year) was issued during 2010 largely to replace maturing term debt and also to commence pre-funding the 2011 term funding issuance requirement:
The weighted average tenor of new term debt issuance lengthened to 4.7 years (from 3.9 years in 2009)
The weighted average cost of new term debt issuance decreased approximately 42 basis points during 2010 as a result of more stable market conditions relative to the prior year. Average portfolio costs remain substantially above pre-crisis levels and continue to increase as maturing term wholesale funding is replaced at higher spreads
In Feb 2010 the Australian Government announced that the Guarantee Scheme for Large Deposits and Wholesale Funding would close to new liabilities on 31 March 2010. The withdrawal of the Australian Government Guarantee did not have any adverse impact on ANZ’s funding activities. The withdrawal of the Australian Government Guarantee did not

ANZ Basel II Pillar 3 disclosure September 2010
69
adversely impact ANZ’s funding activities. ANZ has not used the Australian Government Guarantee for a benchmark debt issue since June 2009
Guaranteed wholesale funding comprises only 4.6% of ANZ’s total funding.
Liquidity portfolio
The ANZ holds a diversified portfolio of cash and high-quality, highly-liquid securities that may be sold or pledged to provide same-day liquidity. This portfolio helps protect the ANZ’s liquidity position by providing cash in a severely stressed environment. All assets held in this portfolio are securities eligible for repurchase, under agreements with the applicable central bank (repo eligible).
At 30 September 2010 the volume of eligible securities available, post any repurchase (i.e. “repo”) discounts applied by the applicable central bank, was $66.7 billion. In addition, the liquidity portfolio provided cover against over one year of offshore wholesale debt maturities.
The Liquidity portfolio is well diversified by counterparty, currency, and tenor. Under the liquidity policy framework securities purchased must be of a similar or better credit quality to ANZ’s external long-term or short-term credit ratings and continue to be repo eligible.
Supplementing the prime liquid asset portfolio, ANZ holds additional cash and liquid asset balances. The Markets business also holds secondary sources of liquidity in the form of highly liquid instruments in its trading portfolios.
ANZ Basel II Pillar 3 disclosure September 2010
70
Appendix - ANZ Bank (Europe) Limited ANZ Bank (Europe) Limited (ANZBEL) is a 100% owned and controlled subsidiary of ANZ, and is regulated by the Financial Services Authority (FSA). ANZBEL is subject to similar Pillar 3 requirements as ANZ, under the FSA's Prudential Source Book for Banks, Building Societies and Investment Firms (BIPRU). The FSA has granted ANZBEL a Pillar 3 Disclosure waiver direction, which can be found on the FSA website: fsa.gov.uk/pubs/waivers/bipru_waivers.pdf In line with the FSA waiver direction, ANZBEL will rely on disclosures in this document to satisfy most of its Pillar 3 disclosure obligations. The following FSA requirements are not mirrored in APS 330 or included in this disclosure document, and as such are required by the FSA to be reported on an individual basis in the annual ANZBEL Statutory Accounts:
• BIPRU 11.5.4R (4) - Disclosure of the firm’s minimum capital requirements covering position, foreign exchange, commodity, counterparty and concentration risks
• BIPRU 11.5.12R – Disclosure: Market Risk

ANZ Basel II Pillar 3 disclosure September 2010
71
This page has been intentionally left blank

ANZ Basel II Pillar 3 disclosure September 2010
72