Embed Size (px)
Citation preview
5
CORPORATE INFORMATION
MANAGEMENT COMMITTEE
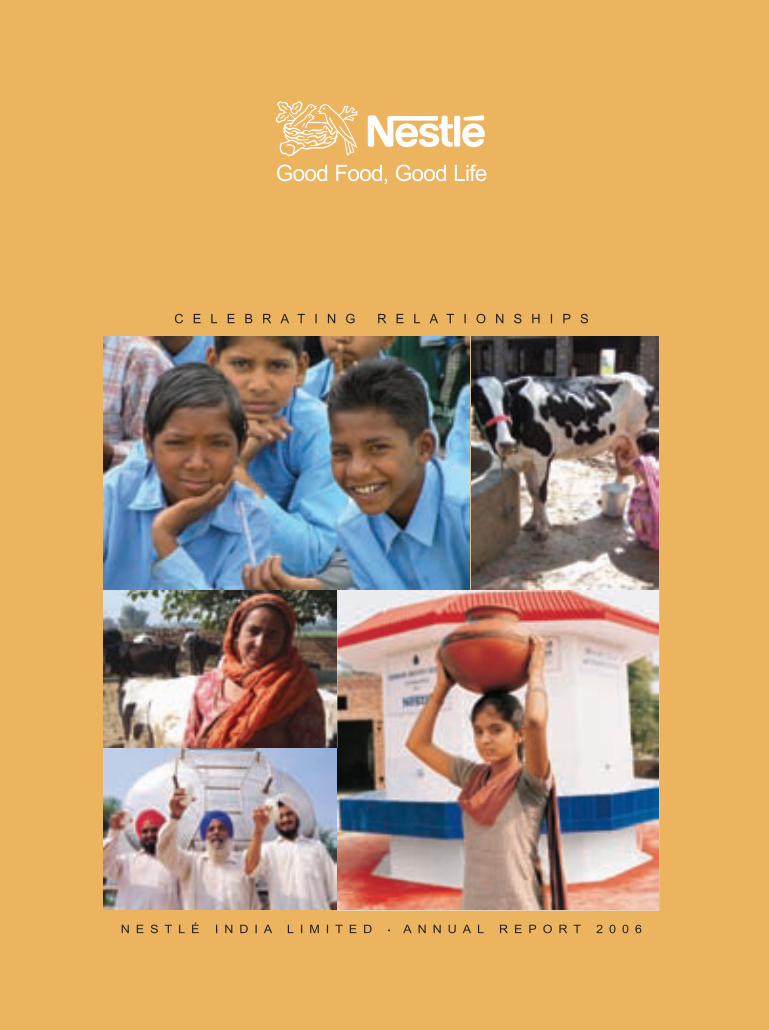
Martial G. Rolland - Chairman & Managing DirectorStewart Dryburgh - Chocolate & ConfectioneryShobinder Duggal - Finance & ControlPascal Fournier - Human ResourcesMuhammed Hamza - Coffee & BeveragesShivani Hegde - FoodsChristian Van Houtteghem - Infant NutritionRoel Keus - TechnicalVineet Khanna - Supply ChainVirat Mehta - CommunicationsB. Murli - Legal & Company SecretarySuresh Narayanan - SalesHari Nariani - GlobeG.G. Pillai - Additional ChannelsRajkamal Sharma- ExportsR. Singh - Corporate Affairs and Strategic PlanningMayank Trivedi - Shelf Stable & Chilled Dairy
BANKERS
ABN Amro Bank N.V.Deutsche BankCitibank N.A.HDFC Bank LimitedICICI Bank LimitedPunjab National BankStandard Chartered BankState Bank of Hyderabad
AUDITORS
A.F. Ferguson & Co.,9, Scindia House,Kasturba Gandhi Marg,New Delhi 110 001
WEBSITE
www.nestle.in
INVESTOR EMAIL ID
REGISTRAR & TRANSFER AGENTS
M/s Alankit Assignments Limited2E/21, Jhandewalan Extension, New Delhi - 110 055Tel. No. : 011-42541234, 23541234Fax No. : 011-42541967
LISTING OF EQUITY SHARES (Listing Fees paid)
The Bombay Stock Exchange Limited,Phiroze Jeejeebhoy Towers, Dalal Street, Mumbai - 400 001
REGISTERED OFFICE
M-5A, Connaught Circus, New Delhi - 110 001Tel. No.: 011- 2341 8891, Fax No. : 011- 2341 5130
HEAD OFFICE
Nestlé HouseJacaranda Marg, ‘M’ Block,DLF City, Phase - II,Gurgaon - 122 002 (Haryana)
BRANCH OFFICES
Spencer Plaza, 6th Floor, 769, Anna Salai, Chennai - 600 002 (Tamil Nadu)
7, Hare Street, Kolkata - 700 001 (West Bengal)
1st Floor, ICC Chambers, Near Saki Vihar Telephone Exchange,Saki Vihar Road, Powai, Mumbai - 400 072 (Maharashtra)
M-5A, Connaught Circus, New Delhi - 110 001
FACTORIES
Village Maulinguem (North), Bicholim Taluka - 403 504 (Goa)
Ludhiana-Ferozepur Road, Near Kingwah Canal, Moga - 142 001(Punjab)
Industrial Area, Nanjangud - 571 301 Mysore District (Karnataka)
P.O. Cherambadi - 643 205 Dist. Nilgiris (Tamil Nadu)
Patti Kalyana, Kiwana Road, Samalkha - 132 101 Dist. Panipat (Haryana)
Plot No. 294-297, Usgao Industrial Area, Ponda - 403 406 (Goa)
Plot No. 1, Sector No. 1A, Integrated Industrial Estate, SIDCUL,Pantnagar- 263145, District: Udhamsingh Nagar (Uttarakhand)
ANNUAL GENERAL MEETING
Thursday, 3rd May, 2007 at 9.30 A.M. atAir Force Auditorium, Subroto Park, New Delhi - 110 010
Shareholders attending the AGM are requested to bring with them theenclosed ATTENDANCE SLIP.
6
NESTLÉ INDIA LIMITED
DIRECTORS’REPORT
Dear Members,
Your Directors have pleasure in submittingtheir report and the statement of accountsfor the year ended 31st December, 2006.
Financial Resultsand Operations
(Rs. in Million)2006 2005
Gross Revenue 28,367 25,006Earning before Interest,Tax and Depreciation excludingOther Income (EBITD) 5,385 5,220
Interest 4 2Depreciation 663 568Impairment Loss onFixed Assets (Net) 4 (26)Provision for Contingencies (Net) 115 223Provision for Tax 1,654 1,595Net Profit 3,151 3,096Profit Brought Forward 72 35Balance Available for Appropriation 3,223 3,131Interim Dividends 2,458 2,218Final Dividend Proposed - 193Corporate Dividend Tax 345 338Transfer to General Reserve 315 310Surplus carried in Profitand Loss Account 105 72
Earnings per Share (Rs.) 32.68 32.11
Dividend per Share (Rs.) 25.50 25.00
Net Sales for the year 2006 increased by13.7% over the previous year. Net DomesticSales grew by 14.4%, both on account ofhigher volumes and price increases. ExportSales grew by 7.9%, but were adverselyimpacted by lower exports of beverages toRussia and Japan, though offset by improvedsales in other categories and geographies.
The EBITD for the year 2006 excludingother income increased by 3.2%. The growthwas adversely impacted by steep increasein prices of commodities, higher operatingcosts associated with upgraded formulationsand manufacturing processes of the Infant
Nutrition products to further enhance theirquality, as well as increase in structuralcosts to better prepare the organisation tobenefit from the opportunities for acceleratedgrowth. Increase in selling prices, highervolumes and the one-time write back partlyoffset the cost increases. Nestlé Group’sOperation Excellence savings initiatives,focusing on more efficient sourcing of rawand packing materials, energy costs andefficiencies, manufacturing processes andoptimisation of line efficiencies/occupationetc., helped mitigate the adverse impact ofinput costs and in controlling other coststhroughout the year. Net Profit for the year
2006 increased by 1.8%, mainly on accountof the lower EBITD growth.
Out of business prudence, in 2006 theCompany supplemented the ContingencyProvision with a further amount of Rs.114.6Million (Net), to provide for contingenciesresulting mainly from matters relating tolitigation/dispute and other items requiringmanagement judgement and discretion.Members are requested to refer to the Notesto the Accounts for the details.
During 2006 the Indian economy sustainedits steady growth. Continuing fiscal
(Rs.
in M
illion
)
EB
ITD
as
a %
of
Gro
ss S
ales
(Rs.
in M
illion
)
Fix
ed A
sset
s T
urn
(tim
es)
7
consolidation, healthy FDI inflows and FIIinvestments, higher growth in services andmanufacturing sectors, bullish stock marketand real estate, boosted the marketsentiments and consumer confidence. Whileincreased investments in the economyduring 2006, coupled with the fiscal prudencebeing exercised by the Government arepositive indicators for the future economicdirection, the agricultural front is an area ofconcern.
The unsatisfactory performance inagriculture and the hardening of internationalprices for primary commodities, mainly agrobased commodities, pushed the inflationarytrend for most part of the year.
Overall, the economic environment hasbeen stable, supportive and in the rightdirection with continuing thrust on inclusivegrowth.
Continuous positive development on theeconomic front, rapid changes in the retailenvironment and an increasing demand forFMCG products are all favourable indicatorsfor your Company. The growing and youngpopulation, rising middle class incomes,various changes in life style and aspirationsand the thrust of Government on inclusivegrowth, present a unique opportunity for aCompany like yours.
However, this economic confidence andincreasing globalisation brings with it a morecomplex and competitive environment. Italso underscores greater understanding ofconsumer needs and trends as well as theability to address them in a sustained andcompetitive manner.
Your Company recognises this and hasbeen responding to it with foresight. TheNestlé name is synonymous with ‘GoodFood, Good Life’. Fulfilling consumer needs,expectations and requirements, has alwaysbeen and will remain the cornerstone of theCompany. Constant focus is maintained in
understanding and anticipating consumerneeds. The Company launched productsthat fulfill such consumer needs andaspirations and also renovated someproducts to better address the consumertrends. Leveraging its access to world classtechnology available from Nestlé Group,your Company made good progress in thethrust area of increasing the Nutrition, Healthand Wellness dimensions across theportfolio of products. Your Companydeveloped/ renovated several products thataddress the nutrition and health attributeswhile continuing to provide the same
excellent taste that they have been preferredfor by the consumers. During the year, theCompany sustained its investments inbuilding brands and maintained its focus onmaking the Nestlé products more visibleand conveniently available whilst ensuringgreater product freshness.
Your Company is stable and healthy, withstrong fundamentals and is focused on longterm, sustainable and profitable growth. Thisstability and health lies in the consumerfranchise, strength and vitality of the brandsin its varied portfolio, which have over the
(Rs.
in M
illion
)
Ret
un o
n E
quity
(%
)
(Rs.
in M
illion
)
Ear
ning
s P
er S
hare
(in
Rup
ees)
8
NESTLÉ INDIA LIMITED
years built a relationship of trust andconfidence with consumers. The Companyremains steadfast in following the fourstrategic pillars for sustainable growth -‘Lowcost, highly efficient operations’; ‘Innovationand Renovation’; ‘Product availability’; and‘Consumer communication’. It also followsan economic model that comprises the sevenvalue drivers that synergise sales growth,profit margins and capital efficiency.
The current year has commenced as perplan. The multi-focal business structure, thestrengthening of consumer insights to focuson Nutrition, Health and Wellness,reorganisation of the sales organisation toadapt to the new Channels, Customers andCategory needs and implementation of theGLOBE project amongst others have createdthe foundation required to seize theopportunities for accelerated growth. YourCompany would maintain a strong focus oninput costs, where inflationary pressuresare likely to continue. We remain confidentof the long term business prospects of theCompany and its ability to sustain fair returnto the shareholders.
Exports
Export Sales during 2006 at Rs.2,796Million, increased by 7.8% over the year2005. This was largely influenced by theincrease in per unit realisation in export ofInstant Coffee due to higher Green Coffeeprices and the improved sales in othercategories and geographies, but wasadversely impacted by lower exports ofbeverages to Russia and Japan. Newbusinesses were developed in Instant Teaexports which continued to do well during2006.
The efforts to develop new geographieshelped to reduce dependence on exports toRussia. Initiatives to develop products forthe Indian ethnic community abroad arecontinuing. Several new products were
introduced for the community abroad,including MAGGI Atta Noodles, OrientalNoodles and some new variants of MAGGISauces. Your Company also commencedexport of Chocolate and Confectioneryproducts to the Asia-Pacific region.
Dividends
For the year 2006, three Interim Dividendsaggregating Rs. 25.50 per equity sharewere declared by the Board of Directors, outof which the first at the rate of Rs. 6/- andsecond at the rate of Rs.18/- per equityshare, were paid on 9th May, 2006 and 21st
December, 2006 respectively, while the thirdat the rate of Rs.1.50 per equity share will bepaid on 29th March, 2007.
Keeping in view the Interim Dividendsdeclared, the Board of Directors have notrecommended any Final Dividend for theyear 2006.
The total payout of Rs.2,803 Million(including the corporate dividend tax) for2006, is the highest dividend payout to date.
Scheme of Arrangement
On 15th January, 2007, the Board of Directorshave approved a Scheme of Arrangement(hereinafter referred to as “Scheme”)between the Company and its Shareholdersand Creditors proposing the utilisation ofthe balance in the Share Premium Accountand a part of the balance in the GeneralReserve Account formed by excess transferof surplus profit in earlier years. Afterevaluation of the various uses of the availablefree cash represented by the Share PremiumAccount (Rs. 432.4 Million) and part of thebalance in the General Reserve Account(Rs. 430.8 Million), your Company believesthat distributing the same would give anopportunity to the shareholders to earnsuperior returns as compared to those, whichthe Company can earn by investing in short
term liquid instruments. The reduction wouldfurther enhance the return on equity, providean opportunity to leverage the balance sheetwhich in turn could further optimise the costof capital and thus improve the economicvalue. Meeting of shareholders would beconvened to approve the Scheme as perdirections of the Hon’ble High Court. TheScheme is subject to the approval of theHon’ble High Court.
Business Development
The Company constantly innovates andrenovates products in its portfolio to createvalue that can be sustained over the longterm, by offering high quality, safe foodproducts at affordable prices, providingNutrition, Health and Wellness. In order todo this successfully, the Company continuedto remain sharply focused in its efforts toobtain relevant consumer insights throughresearch and consumer engagementactivities.
To enable the Company to respond fasterand in a more focused manner to consumerneeds and customer expectations, a newdepartment - the Channel & Category SalesDevelopment (CCSD) had been set up lastyear to develop new solutions for the variouschannels and customers and improve theimplementation of commercial plans in themarket place. The Company had alsocreated a new department the ‘National KeyAccounts Management Organisation’ tofocus on modern formats in retail trade thatare rapidly establishing their presence in theIndian market. In addition, during 2006,steps were taken to strengthen the category/brand and channel focus at the SalesBranches together with augmenting theresources to strengthen route to marketinitiatives. These initiatives have preparedthe Company to effectively address theemerging channel opportunities and formatswhich are expected to contribute toaccelerating growth in the coming years.
9
Your Company’s unique access to Nestléglobal expertise and competence will providethe edge in ensuring the success of theseinitiatives.
During 2005, some internal Companystructures were realigned to make it a multi-focal Company with category specificbusiness units and processes to furtherstrengthen the brands. These and otherstructural changes are now allowing theCompany to benefit from the rapidly changingconsumer and economic environment.
The Company also stepped up initiatives toprovide consumers with relevant informationto make choices for a more balanced diet.The NESTLÉ NUTRITIONAL COMPASSwhich is an initiative to help consumers tonavigate through the nutrition attributes of aproduct and make an informed choice hasbeen implemented on almost all the productpackaging, where it can be implemented.In select areas this communication was alsorolled out through unique in-store initiatives‘NESTLÉ NUTRIWORLD’.
In the ‘Prepared Dishes and Cooking Aids’category, the MAGGI brand witnessed avery good performance and continued tolead the market for Instant Noodles, Soups,Sauces and Ketchups, doing pioneering workin developing new products. During 2005the Company had initiated the pro-position‘Taste Bhi Health Bhi’ and launched theinnovative concept MAGGI Vegetable AttaNoodles, and the very popular MAGGI 2-Minute Noodles were renovated to provideCalcium and Protein for the core target group.During 2006, the portfolio was furthersupplemented with another innovativeconcept MAGGI Dal Atta Noodles, whichoffers the goodness of protein from the uniquecombination of ‘Atta’ and ‘Dal’ in addition tothe wholesome nutrition of dietary fibre fromthe whole wheat (Atta). To address specificconsumer needs “No Onion and No Garlic”MAGGI Noodles were also introduced in
select markets during 2006. All theseinitiatives will strengthen the consumers’bond with MAGGI Noodles, as it enters its25th year of existence in the Indian market.
Your Company is a pioneer in the InstantSoups market and in the last quarter of2005, had launched a range of new MAGGIHealthy Soups that are even more delicious,quick to prepare, convenient and healthy.The products were developed to cater to theunique taste of the Indian consumers anddo not contain any added MSG or addedpreservative, no artificial colours, are lowon fats and cholesterol and have realvegetables. As expected, with the launch ofnew MAGGI Healthy Soups, the overallperformance of Soups improvedsignificantly during 2006. In keeping withyour Company’s focus to meet consumerneeds, a new range of Instant Soups werelaunched during early 2007, under the brandMAGGI Healthy Soups - Sanjeevni thathave met with a satisfactory marketresponse. The new range of Instant Soupsbrings together the Nestlé know how indeveloping Soups with sharper consumerinsights into the relevance of traditionalingredients like ‘Amla’ and ‘Badam’, thatare seen to ensure health and well being.
In Sauces and Ketchups, MAGGImaintained its leadership and continued toadd new and innovative products to its range.The portfolio of Sauces with the uniquetaste of ‘Chutney’ was strengthened withthe addition of MAGGI Teekha Masala,while MAGGI Oriental Chilli Sauce andMAGGI Pizza Maaza were the otherexcellent products that were added to theportfolio. MAGGI Tiffin Pack, a pouchcontaining six Tomato Ketchup sachets,one for each day of school, was introducedfor kids who love taking Sauce in their tiffin.
The performance in the ‘Chocolate andConfectionery’ category was verysatisfactory. The Company continued to
grow its leadership in the chocolate waferscategory and overall the key brandsdemonstrated good health. NESTLÉMUNCH continued to be the largestdistributed brand in India. NESTLÉ KIT KAT,Calcium rich NESTLÉ MILKYBAR, NESTLÉMILKYBAR CHOO and NESTLÉ Eclairscontinued to grow well. A breakthroughinnovation in the category was brought aboutwith the launch of NESTLÉ KIT KAT Lite, aunique product with 50% less sugar and100% great taste. The product wasspecifically developed for India, with thetechnology and expertise from Nestlé Group.The Company also expanded the coreNESTLÉ KIT KAT brand into gifting with thesuccessful launch of the NESTLÉ KIT KAT‘Goldpack’. In the Sugar Confectionerycategory, the Company launched NESTLÉPOLO Powermint, the stronger and biggerPOLO mint, providing instant refreshment,at a 50 paise price point. This proved a verystrong performer. NESTLÉ FUNBAR wasalso launched during the year in selecttowns, positioned as another chocolaty treatat the price point of Rs. 2/-. The initialresponse has been very encouraging.
In the ‘Beverages’ category, NESCAFEcontinued to be the largest brand of InstantCoffee in the Indian market and initiativesare being put in place to strengthen it evenfurther. During the year MILO ChocolateEnergy Food Drink was renovated. Theimproved new MILO is superior in taste andis fortified with ACTIGEN-E [a proprietarybranded active benefit BAB] that helps tooptimise the release of energy from food.The performance of this modified MILO isbeing closely monitored.
In the ‘Milk Products and Nutrition’category, the Company continued toleverage the Nestlé Group’s experience inmilk and nutrition and the superior R&Dcompetencies. Based on advancedpaediatric research, the Companyrenovated the premium formula NAN.
10
NESTLÉ INDIA LIMITED
The upgraded NAN helps to enhance thenatural immunity of infants through a uniquecombination of nutrients. Overall the qualityof Infant Nutrition products was furtherenhanced, by the upgradation of formulationand manufacturing processes.
The Dairy business is a strategic area forthe Company and an area which offerspossibilities for development of high qualityproducts that provide Nutrition, Health andWellness. With increasing consumerpreference for NESTLÉ FRESH ‘N’NATURAL Dahi, the volumes have doubledin the past few years making it a leadingbrand in all the metros. During the year theCompany extended to other key markets,the availability of NESTLÉ FRESH ‘N’NATURAL Jeera Raita that is accepted byconsumers as convenient, consistent,delicious and healthy. While NESTLÉEVERYDAY Dairy Whitener sustainedits performance during the year, theCompany launched a new formulation forInstant Dairy Whitener in select marketsthat could add even greater value to theconsumers.
During the year 2006 the Company workedon several path breaking concepts that havebeen launched in the last quarter of 2006 orin early 2007 and highlight the Company’scapacity to use science based technologyand Nestlé Group’s vast experience innutrition to develop relevant products forconsumers.
• MAGGI Rice Noodle Mania offers thedelicious taste of MAGGI Noodles withthe healthy goodness of rice.
• MAGGI Healthy Soups - Sanjeevni.
• NESTLÉ EVERYDAY Slim is the first lowfat Tea Whitener in India, speciallydeveloped for India and is targeted at theurban health conscious consumer.
• NESTLÉ KIT KAT Lite.
• NESTLÉ MUNCH POPCHOC, a uniquechoco-wafer cube that can be nibbledanytime, anywhere and is great value formoney.
• NESTLÉ FRESH ‘N’ NATURAL Slim Dahiis the first low fat dahi available in thecountry.
With rapidly increasing opportunities in the‘Out of Home’ segment, especially in coffeesand beverages the Company has continuedto increase ‘NESTLÉ Consumption Zones’and vending machines in offices, colleges,and other locations that experience highfootfalls. The Company has by far the largestnumber of vending machines installed in themarket. Your Company sees the ‘Out ofHome’ opportunities as significant toleverage its skills and competencies invending and using its product portfolio toaddress consumer needs therein.
Technology and Quality
The Company’s General Licence Agreementwith the Nestlé Group, Switzerland, enablesit to access the most advanced technologyin the world for foods and beverages. TheCompany leverages this continuously toprovide consumers in India with high qualityand safe food products that add value tothem and are affordable. The SamalkhaFactory is amongst the ten most modernplants for Infant Nutrition products in theNestlé Group, worldwide, consequent to theupgradation of the production technology,which was commissioned in the later part of2005.
In order to ensure that manufacturingprocesses follow best practices and areefficient, the Company has a strong technicalteam that follows strict norms. Todemonstrate that your Company’s processesare certainly at par with the best, theCompany has initiated a process of externalcertification. In the first phase, the factoriesat Nanjangud and Choladi were assessed
and awarded the ISO 14001:2004certification for the factory’s environmentalmanagement system. ISO 14001:2004 isthe international standard for environmentalsystem and the certification demonstratesthe strict environment norms being followed.
New Factory in Uttarakhand
In 2005 the Company had announced theintention to set up the seventh plant in theState of Uttarakhand mainly for themanufacture of culinary products. The newstate-of-art factory was set up with thetechnology and support received from theNestlé Group, at record speed andcommissioned in July 2006 as planned.The completion of the initial phase in recordtime of less than seven months was abenchmark and reflects the capability,professionalism and dedication of theCompany’s personnel.
Manpower Development
The Company believes that in order tounleash 100% potential, it is necessary toempower talent and prepare its people withthe necessary skills to exploit their ownpotential and the potential of the Company.To enable this, the Company continued toprovide employees with appropriate traininginitiatives and development programs tocontinuously improve their skills; andinternational exposures, where feasible andrelevant. During 2006, the Companyincreased its focus on people development.In the current environment people attractionand retention remains a key challenge andfocus area for the Company. During 2006,some specific measures were initiated todeal with this challenge.
SWOT Analysis for the Company
Strengths:
• Access to the Nestlé Group’s proprietarytechnology / brands, expertise and theextensive centralised Research and
11
Development facilities under the GeneralLicence Agreement.
• High quality and safe food products ataffordable prices, endorsed by the NestléSeal of Guarantee.
• Strong and well differentiated brands withleading market shares.
• Strong equity with consumers as aCompany with “high quality” brands.
• Ongoing product innovation andrenovation, to convert consumer insights.
• Well diversified product portfolio.
• Efficient supply chain.
• Distribution structure that allows widereach and coverage in the target markets.
• Capable and committed humanresources.
• Integrated and advanced InformationSystems - GLOBE.
Weakness :
• Exports of coffee to Russia constitutessignificant part of overall exports.
• Complex supply chain configuration.
• Ability to pass through cost increases inprice point Stock Keeping Units.
Threat:
• Competitive environment with diverseplayers.
• People attraction and retention.
• Rising prices of commodities and fuels.
• Change in fiscal benefits/ laws.
Opportunities:
• Potential for expansion in the smallertowns and other geographies.
• Development of modern retail formats.
• Potential for growth through increasedpenetration.
• Growing trend for ‘Out of Home’consumption.
• Leverage Nestlé Technology to developmore products that provide Nutrition,Health and Wellness.
• Growing per capita income.
Contributions to the Exchequer
Your Company has been a leading taxpayerof the country and over the years has beencontributing significantly to various taxes.During the year 2006, the Company throughits operations, enabled tax collections atCentral and State level, of close to Rs. 7.2Billion in the aggregate.
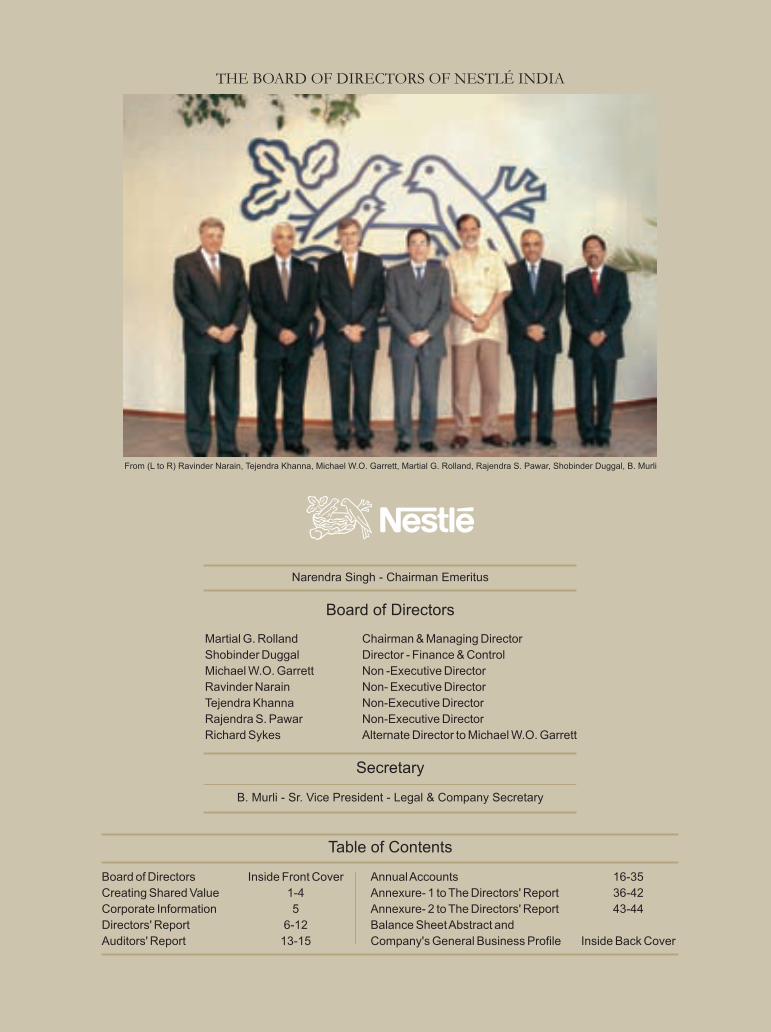
Community Development
The Company has always believed thatcorporate social responsibility is an inherentpart of its business approach and that, tocreate value for its shareholders over thelong term, the business must bring value tosociety. Since the very beginning ofoperations in India the Company hascatalysed economic growth and fosteredsocial progress and helped communitiesaround its factories. The Company has doneexcellent work with the farmers in Moga,helping them to be productive, successfuland economically empowered. Variousprogrammes are being conducted to helpthe village women improve their knowledgeand skills so that they can participate andadd greater value to economic activity oftheir families.
The Company endorses the United NationsGlobal Compact and the MillenniumDevelopment goals that encouragecompanies to take a long-term view topromote prosperity in the society. It isaccepted that access to clean drinking wateris one of the most important areas that affectthe welfare of society. The Company believesthat it is important to create awarenessabout this and has developed a model thatinvolves the community and the schoolchildren in the village schools to educatethem and help them experience thedifference that clean drinking water canbring to their quality of life. The Companyhas already completed 74 such projects,directly benefiting over 27,000 schoolchildren every year. But more important is
the fact that this enables the communities tobecome more aware of the role that they canplay in protecting the resources in theircommunity and become active partners insociety.
Awards & Recognitions
Over the years your Company has earnedthe trust of every strata of society that itcomes in contact with and is consideredamongst the ‘Most respected Companies ofIndia.’
During the year the Company was felicitatedby Guru Angad Dev University of Veterinaryand Animal Sciences, Ludhiana for itscontribution to the economic development ofPunjab and for outstanding support andinvestment to develop an entrepreneurialmodel of sustainable dairy business in Punjab.
Your Company was again recognised for itsoutstanding performance in Exports by theCoffee Board of India in the Export Awards2005-06 as the Second Highest Exporter ofInstant Coffee and Second Highest Exporterof Coffee to the Far East countries. YourCompany has received the highest coffeeexporter awards from the Coffee Board ofIndia for many years.
It is also an honour for the Company that ina survey conducted by A.C.Nielsen forCNBC, consumers voted NESCAFE as themost preferred coffee brand of the nation.On another occasion the Company washonoured by the Central Excise Departmentfor the excellent and clean track record ofthe Nanjangud factory. Only thoseestablishments were considered who werelarge contributors to the exchequer.
Directors’ ResponsibilityStatement
Pursuant to Section 217(2AA) of theCompanies Act, 1956, the Directors confirmthat:
12
NESTLÉ INDIA LIMITED
– in the preparation of the annualaccounts, the applicable accountingstandards have been followed and nomaterial departures have been madefrom the same;
– they have selected such accountingpolicies and applied them consistentlyand made judgments and estimatesthat are reasonable and prudent so asto give a true and fair view of the stateof affairs of the Company at the end ofthe financial year and of the profits forthat period;
– they have taken proper and sufficientcare for the maintenance of adequateaccounting records in accordance withthe provisions of the Companies Act,1956 for safeguarding the assets ofthe Company and for preventingand detecting fraud and otherirregularities;
– they have prepared the annual accountson a going concern basis.
Corporate Governance
In compliance with the requirements ofClause 49 of the Listing Agreement with theStock Exchange, a separate report onCorporate Governance along with Auditors’certificate on its compliance is attached asAnnexure –1 to this Report.
Cautionary Statement
Statements in this Report, particularly thosewhich relate to Management Discussionand Analysis as explained in the CorporateGovernance Report, describing theCompany’s objectives, projections,estimates and expectations may constitute“forward looking statements” within themeaning of applicable laws and regulations.Actual results might differ materiallyfrom those either expressed or implied inthe statement depending on thecircumstances.
Directors
In accordance with Article 119 of the Articlesof Association, Mr. Ravinder Narain retiresby rotation and being eligible offers himselffor re-appointment.
Auditors
The Statutory Auditors of the Company,M/s. A. F. Ferguson & Co., CharteredAccountants, New Delhi, retire in accordancewith the provisions of the Companies Act,1956 and are eligible for re-appointment.M/s. A. F. Ferguson & Co., CharteredAccountants, New Delhi have sought there-appointment and have confirmed that theirre-appointment if made, shall be within thelimits of Section 224(1)(B) of the CompaniesAct, 1956. The Audit Committee and theBoard recommends the re-appointment ofM/s. A. F. Ferguson & Co., CharteredAccountants, as the Auditors of the Company.
Complying with the provisions of Section233-B of the Companies Act, 1956, theBoard of Directors have appointed, subjectto the approval of the Central Government,M/s. Ramanath Iyer and Co., CostAccountants, New Delhi to carry out anaudit of cost accounts of the Company inrespect of milk foods for the year 2007.
Information regardingConservation of Energy etc. andEmployees
Information required under Section 217(1)(e)of the Companies Act, 1956 (hereinafterreferred to as “the Act”) read with Rule 2 ofthe Companies (Disclosure of Particulars inthe Report of Board of Directors) Rules,1988 is given in the Annexure - 2 formingpart of this Report. Information as per Section217(2A) of the Act, read with the Companies(Particulars of Employees) Rules, 1975, asamended from time to time, forms part ofthis Report. However, as per the provisionsof Section 219(1)(b)(iv) of the Act, the Report
and Accounts are being sent to all themembers excluding the statement containingthe particulars of employees to be providedunder Section 217(2A) of the Act. Anymember interested in obtaining suchparticulars may inspect the same at theRegistered Office of the Company or writeto the Company Secretary for a copy.
Trade Relations
The Company maintained healthy, cordialand harmonious industrial relations at alllevels. Despite severe competition, theenthusiasm and unstinting efforts of theemployees have enabled the Company toremain at the forefront of the Industry.
Your Company continued to receive co-operation and unstinted support from thedistributors, retailers, stockists, suppliersand others associated with the Company asits trading partners. The Directors wish toplace on record their appreciation for thesame and your Company will continue in itsendeavour to build and nurture strong linkswith trade, based on mutuality, respect andco-operation with each other and consistentwith consumer interest.
Appreciation
Your Company has been able to operateefficiently because of the culture ofprofessionalism, creativity, integrity andcontinuous improvement in all functions andareas to ensure efficient utilisation of theCompany’s resources for sustainable andprofitable growth. The Directors wish tothank each and every employee for theircontribution to the good performance of theCompany.
On behalf of the Board of Directors
20th March, 2007 MARTIAL G. ROLLAND
Gurgaon CHAIRMAN
13
AUDITORS’ REPORTTO THE MEMBERSOF NESTLÉ INDIA LIMITED
1. We have audited the attached balancesheet of Nestlé India Limited as atDecember 31, 2006, the profit and lossaccount and also the cash flowstatement for the year ended on thatdate annexed thereto. These financialstatements are the responsibility of theCompany’s management. Ourresponsibility is to express an opinionon these financial statements based onour audit.
2. We conducted our audit in accordancewith auditing standards generallyaccepted in India. Those standardsrequire that we plan and perform theaudit to obtain reasonable assuranceabout whether the financial statementsare free of material misstatements. Anaudit includes examining, on a test basis,evidence supporting the amounts anddisclosures in the financial statements.An audit also includes assessing theaccounting principles used andsignificant estimates made bymanagement, as well as evaluating theoverall financial statement presentation.We believe that our audit provides areasonable basis for our opinion.
3. As required by the Companies (Auditor’sReport) Order, 2003 issued by theCentral Government of India in terms ofsub-section (4A) of section 227 of theCompanies Act, 1956, we enclose in theannexure a statement on the mattersspecified in paragraphs 4 and 5 of thesaid Order.
4. Further to our comments in the annexurereferred to in paragraph 3 above, wereport that:
a) we have obtained all the informationand explanations which to the bestof our knowledge and belief werenecessary for the purposes of ouraudit;
b) in our opinion, proper books ofaccount as required by law have beenkept by the Company, so far asappears from our examination of thebooks;
c) the balance sheet, the profit and lossaccount and cash flow statementdealt with by this report are inagreement with the books of account;
d) in our opinion, the balance sheet,profit and loss account and the cashflow statement dealt with by thisreport comply with the mandatoryaccounting standards referred to insub-section (3C) of section 211 of theCompanies Act, 1956;
e) on the basis of writtenrepresentations received from thedirectors and taken on record by theBoard of Directors, we report thatnone of the directors of the Companyis disqualified as on December 31,2006 from being appointed asdirector of the Company under clause(g) of sub-section (1) of section 274of the Companies Act, 1956;
f) in our opinion and to the best of ourinformation and according to theexplanations given to us, theaccounts give the informationrequired by the Companies Act,1956, in the manner so required andgive a true and fair view in conformitywith the accounting principlesgenerally accepted in India:
(i) in the case of the balance sheet,of the state of affairs of theCompany as at December 31,2006;
(ii) in the case of the profit and lossaccount, of the profit of theCompany for the year ended onthat date; and
(iii) in the case of cash flowstatement, of the cash flows forthe year ended on that date.
For A.F. FERGUSON & CO.,Chartered Accountants
(MANJULA BANERJI)20th March, 2007 PartnerNew Delhi (Membership No. 86423)
14
NESTLÉ INDIA LIMITED
ANNEXURE REFERRED TO INPARAGRAPH ‘3’ OF THE AUDITORS’REPORT TO THE MEMBERS OFNESTLÉ INDIA LIMITED ON THEACCOUNTS FOR THE YEAR ENDEDDECEMBER 31, 2006.(i) (a) The Company is maintaining proper
records showing full particularsincluding quantitative details andsituation of fixed assets.
(b) The fixed assets of the Companyare physically verified by themanagement in a phased mannerat regular intervals. In our opinion,the frequency of physicalverification is reasonable havingregard to the size of the Companyand nature of its fixed assets.The discrepancies noticed on suchverification were not material andhave been properly dealt with inthe books of account.
(c) In our opinion and according to theinformation and explanations givento us, the Company has notdisposed off a substantial part ofits fixed assets during the year.
(ii) (a) During the year, the inventorieshave been physically verified bythe management. In our opinion,the frequency of verification isreasonable.
(b) In our opinion and according to theinformation and explanations givento us, the procedures of physicalverification of stocks followed bythe management are reasonableand adequate in relation to the sizeof the Company and the nature ofits business.
(c) On the basis of our examination ofthe records of inventories, we areof the opinion that the Company ismaintaining proper records ofinventories. The discrepanciesnoticed on physical verification ofinventories as compared to bookrecords were not material and havebeen properly dealt with in thebooks of account.
(iii) (a) According to the information andexplanations given to us, theCompany has, during the year, not
granted any loans, secured orunsecured to companies, firms orother parties covered in the registermaintained under section 301 ofthe Companies Act, 1956.Accordingly, paragraphs 4 (iii) (a),(b), (c) and (d) of the Companies(Auditor’s Report) Order, 2003(hereinafter referred to as theOrder) are not applicable.
(b) According to the information andexplanations given to us, theCompany has, during the year, nottaken any loans, secured orunsecured from companies, firmsor other parties covered in theregister maintained under section301 of the Companies Act, 1956.Accordingly, paragraphs 4 (iii) (e),(f) and (g) of the Order, are notapplicable.
(iv) In our opinion and according toinformation and explanations given tous, there are adequate internal controlsystems commensurate with the sizeof the Company and the nature of itsbusiness with regard to the purchaseof inventories, fixed assets and withregard to sale of goods. There is nosale of services. Further, on the basisof our examination and according tothe information and explanations givento us, no major weaknesses in theaforesaid internal control system, hasbeen noticed.
(v) (a) In our opinion and according tothe information and explanationsgiven to us, there are notransactions that need to be enteredinto the Register maintained underSection 301 of the Companies Act,1956.
(b) In our opinion and according to theinformation and explanations givento us, as there are no transactionsthat need to be entered into theRegister maintained under Section301 of the Companies Act, 1956,paragraph 4 (v) (b) of the Order isnot applicable.
(vi) As, the Company has not acceptedany deposits from the public, paragraph4 (vi) of the Order is not applicable.
(vii) In our opinion, the Company has aninternal audit system commensuratewith its size and the nature of itsbusiness.
(viii) We have broadly reviewed the booksof account maintained by the Companyin respect of products where, pursuantto the rules made by the CentralGovernment, the maintenance of costrecords have been prescribed under209 (1) (d) of the Companies Act, 1956and are of the opinion that, prima facie,the prescribed accounts and recordshave been made and maintained. Wehave not, however, made a detailedexamination of records with a view todetermining whether they are accurateor complete.
(ix) (a) According to the information andexplanations given to us and therecords of the Company examinedby us, the Company has beenregular in depositing undisputedstatutory dues including providentfund, employees’ state insurancedues, income-tax, InvestorEducation and Protection Fund,sales tax, wealth tax, service tax,customs duty, excise duty, cessand other material statutory duesapplicable to it with the appropriateauthorities. We are informed thatthere are no undisputed statutorydues as at the year end, outstandingfor a period of more than six monthsfrom the date they became payable.
(b) According to the information andexplanations given to us and therecords of the Company examinedby us, there are no disputed duesof customs duty, wealth tax andcess, which have not beendeposited. The details of disputeddues as at December 31, 2006 inrespect of excise duty, sales taxand income-tax that have not beendeposited by the Company, are asfollows :-
15
Name of the Statute Nature of the Dues Amount * (Rs.) Period to which the amount Forum where dispute is pending(’000s) relates (various years
covering the period)
Central Excise Laws Excise Duty 44,298 1996 – 2003 Supreme Court11,866 2000 – 2005 Customs, Excise and Service Tax Appellate Tribunal
Service Tax 180,850 2002 – 2004 Appellate authority upto Commissioners’ levelSales Tax Laws Sales Tax 4,776 1996 – 2005 High Court
62,065 1992 – 2006 Appellate authority upto Commissioners’ level1,361 2000 – 2006 Appellate Tribunal
Income Tax Act, 1961 Income tax 118,558 1992 – 1994 High Court229,906 1993 – 2004 Commissioner of Income-tax (Appeals)
1,431 2004 – 2005 Assessing Officer
* Amount as per demand orders including interest and penalty wherever indicated in the Order.
The following matters, which have been excluded from the table above, have been decided in favour of the Company but the department has preferred appealsat higher levels. The details are given below:-
Name of the Statute Nature of the Dues Amount (Rs.) Period to which the amount Forum where department has(’000s) relates (various years preferred appeals
covering the period)
Central Excise Laws Excise Duty 36,982 1994 – 2000 High Court
Sales Tax Laws Sales Tax 4,300 1994 – 1998 High Court
Income Tax Act, 1961 Income tax 111,157 1983 – 1998 High Court353,310 1993 – 2002 Income-tax Appellate Tribunal
(x) The Company does not haveaccumulated losses at the end of thefinancial year December 31, 2006.Further, the Company has notincurred cash losses during thefinancial year ended December 31,2006 and in the immediatelypreceding financial year endedDecember 31, 2005.
(xi) According to the records of theCompany examined by us and on thebasis of information and explanationsgiven to us, the Company has notdefaulted in repayment of dues tobanks during the year. The Companyhas not taken any loans from financialinstitutions and has not issueddebentures during the year.
(xii) The Company has not granted anyloans and advances on the basis ofsecurity by way of pledge of shares,debentures and other securities,accordingly paragraph 4 (xii) of theOrder is not applicable.
(xiii) The Company is not a chit fund / nidhi/mutual benefit fund / society to which
the provisions of special statuterelating to chit fund are applicable,accordingly paragraph 4 (xiii) of theOrder, is not applicable.
(xiv) As the Company is not dealing ortrading in shares, securities,debentures and other investments,paragraph 4 (xiv) of the Order is notapplicable.
(xv) According to the information andexplanations given to us, theCompany has not given anyguarantee during the year for loanstaken by others from banks or financialinstitutions.
(xvi) In our opinion and according to theinformation and explanations givento us, the Company has not taken anyterm loans during the year.
(xvii) According to the information andexplanations given to us and on anoverall examination of the balancesheet of the Company, we reportthat, during the year, short term fundshave not been used to finance longterm investments.
(xviii) The Company has not made anypreferential allotment of shares duringthe year.
(xix) The Company has not issued anydebentures during the year.
(xx) The Company has not raised anymoney by way of public issue duringthe year.
(xxi) Based upon the audit proceduresperformed and information andexplanations given by themanagement, we report that no fraudon or by the Company has beennoticed or reported during the yearended December 31, 2006.
For A.F. FERGUSON & CO.,Chartered Accountants
(MANJULA BANERJI)20th March, 2007 PartnerNew Delhi (Membership No. 86423)
16
NESTLÉ INDIA LIMITED
BALANCE SHEET OF NESTLÉ INDIA LIMITED AS AT DECEMBER 31, 2006
2006 2005(Rs. in (Rs. in
SOURCES OF FUNDS SCHEDULE thousands) thousands)
SHAREHOLDERS' FUNDSShare Capital A 964,157 964,157Reserves and surplus B 2,924,722 3,888,879 2,577,176 3,541,333
LOAN FUNDSSecured Loans C 162,676 143,045
4,051,555 3,684,378APPLICATION OF FUNDS
FIXED ASSETS DGross block 10,582,749 9,494,439Less: Depreciation 5,164,780 4,756,737
Net block 5,417,969 4,737,702Capital work-in-progress 382,400 5,800,369 228,251 4,965,953
INVESTMENTS E 777,732 1,044,276
DEFERRED TAX ASSETS/(LIABILITIES) (NET) F (191,559) (99,521)
CURRENT ASSETS, LOANS AND ADVANCES GInventories 2,762,185 2,530,993Sundry debtors 557,569 305,247Cash and bank balances 763,560 366,453Loans and advances 1,270,424 1,424,272
5,353,738 4,626,965Less: CURRENT LIABILITIES AND PROVISIONS HLiabilities 3,735,917 3,198,326Provisions 3,952,808 3,654,969
7,688,725 6,853,295
NET CURRENT ASSETS/(LIABILITIES) (2,334,987) (2,226,330)
4,051,555 3,684,378
NOTES TO THE ACCOUNTS O
March 20, 2007 MARTIAL G. ROLLAND SHOBINDER DUGGAL B. MURLIGurgaon Chairman & Managing Director Director - Finance & Control Sr. VP - Legal & Company Secretary
As per our report attachedFor A.F. FERGUSON & CO.,
Chartered Accountants
(MANJULA BANERJI)March 20, 2007 PartnerNew Delhi (Membership No. 86423)
17
2006 2005(Rs. in (Rs. in
SCHEDULE thousands) thousands)INCOMESales
Domestic 26,646,111 23,847,096Export 2,795,852 2,591,776Gross 29,441,963 26,438,872Less: Excise Duty 1,281,317 1,669,862Net Sales 28,160,646 24,769,010
Other Income I 206,100 237,433 28,366,746 25,006,443
EXPENDITUREMaterials consumed and purchase of goods J 13,366,621 11,280,564Manufacturing and other expenses K 9,574,238 8,390,049Interest L 4,408 2,122Depreciation D 662,846 568,377Adjustment due to decrease / (increase) in stock of finishedgoods and work-in-progress M (165,123) (122,093)
23,442,990 20,119,019
PROFIT BEFORE IMPAIRMENT, CONTINGENCIESAND TAXATION 4,923,756 4,887,424Impairment loss/(gain) on fixed assets (Refer Note 1 - Schedule O) D 3,871 (26,369)Provision for contingencies (Refer Note 2 - Schedule O) N 114,646 223,219
PROFIT BEFORE TAXATION 4,805,239 4,690,574Income tax expense
Current tax 1,521,876 1,447,900Deferred tax 92,038 111,559Fringe benefit tax 40,360 1,654,274 35,400 1,594,859
PROFIT AFTER TAXATION 3,150,965 3,095,715Balance brought forward 72,239 34,548
BALANCE AVAILABLE FOR APPROPRIATION 3,223,204 3,130,263Appropriations:
Dividends:Interim dividend 2,458,601 2,217,562Final proposed – 192,831
Corporate dividend tax 344,818 338,059General reserve 315,096 309,572
SURPLUS CARRIED TO THE BALANCE SHEET 104,689 72,239
BASIC AND DILUTED EARNINGS PER SHARE (IN RUPEES) O 32.68 32.11
NOTES TO THE ACCOUNTS O
PROFIT AND LOSS ACCOUNT OF NESTLÉ INDIA LIMITEDFOR THE YEAR ENDED DECEMBER 31, 2006
March 20, 2007 MARTIAL G. ROLLAND SHOBINDER DUGGAL B. MURLIGurgaon Chairman & Managing Director Director - Finance & Control Sr. VP - Legal & Company Secretary
As per our report attachedFor A.F. FERGUSON & CO.,
Chartered Accountants
(MANJULA BANERJI)March 20, 2007 PartnerNew Delhi (Membership No. 86423)
18
NESTLÉ INDIA LIMITED
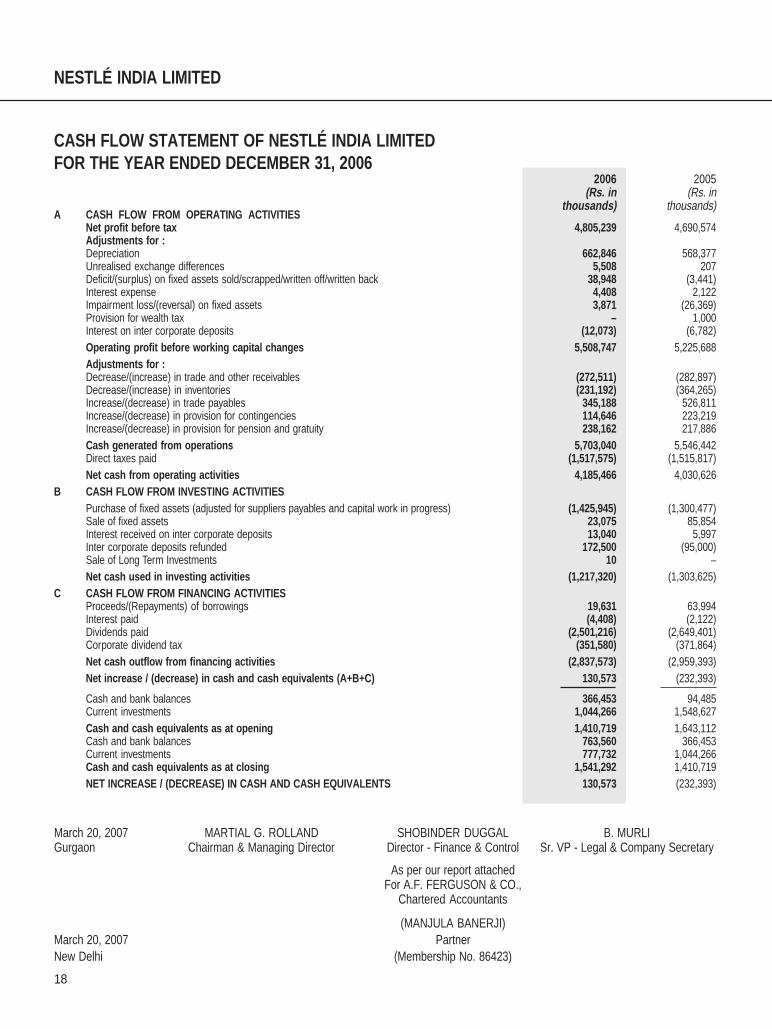
A CASH FLOW FROM OPERATING ACTIVITIESNet profit before tax 4,805,239 4,690,574Adjustments for :Depreciation 662,846 568,377Unrealised exchange differences 5,508 207Deficit/(surplus) on fixed assets sold/scrapped/written off/written back 38,948 (3,441)Interest expense 4,408 2,122Impairment loss/(reversal) on fixed assets 3,871 (26,369)Provision for wealth tax – 1,000Interest on inter corporate deposits (12,073) (6,782)Operating profit before working capital changes 5,508,747 5,225,688Adjustments for :Decrease/(increase) in trade and other receivables (272,511) (282,897)Decrease/(increase) in inventories (231,192) (364,265)Increase/(decrease) in trade payables 345,188 526,811Increase/(decrease) in provision for contingencies 114,646 223,219Increase/(decrease) in provision for pension and gratuity 238,162 217,886Cash generated from operations 5,703,040 5,546,442Direct taxes paid (1,517,575) (1,515,817)Net cash from operating activities 4,185,466 4,030,626
B CASH FLOW FROM INVESTING ACTIVITIESPurchase of fixed assets (adjusted for suppliers payables and capital work in progress) (1,425,945) (1,300,477)Sale of fixed assets 23,075 85,854Interest received on inter corporate deposits 13,040 5,997Inter corporate deposits refunded 172,500 (95,000)Sale of Long Term Investments 10 –Net cash used in investing activities (1,217,320) (1,303,625)
C CASH FLOW FROM FINANCING ACTIVITIESProceeds/(Repayments) of borrowings 19,631 63,994Interest paid (4,408) (2,122)Dividends paid (2,501,216) (2,649,401)Corporate dividend tax (351,580) (371,864)Net cash outflow from financing activities (2,837,573) (2,959,393)Net increase / (decrease) in cash and cash equivalents (A+B+C) 130,573 (232,393)
Cash and bank balances 366,453 94,485Current investments 1,044,266 1,548,627Cash and cash equivalents as at opening 1,410,719 1,643,112Cash and bank balances 763,560 366,453Current investments 777,732 1,044,266Cash and cash equivalents as at closing 1,541,292 1,410,719NET INCREASE / (DECREASE) IN CASH AND CASH EQUIVALENTS 130,573 (232,393)
2006 2005(Rs. in (Rs. in
thousands) thousands)
CASH FLOW STATEMENT OF NESTLÉ INDIA LIMITEDFOR THE YEAR ENDED DECEMBER 31, 2006
March 20, 2007 MARTIAL G. ROLLAND SHOBINDER DUGGAL B. MURLIGurgaon Chairman & Managing Director Director - Finance & Control Sr. VP - Legal & Company Secretary
As per our report attachedFor A.F. FERGUSON & CO.,
Chartered Accountants
(MANJULA BANERJI)March 20, 2007 PartnerNew Delhi (Membership No. 86423)
19
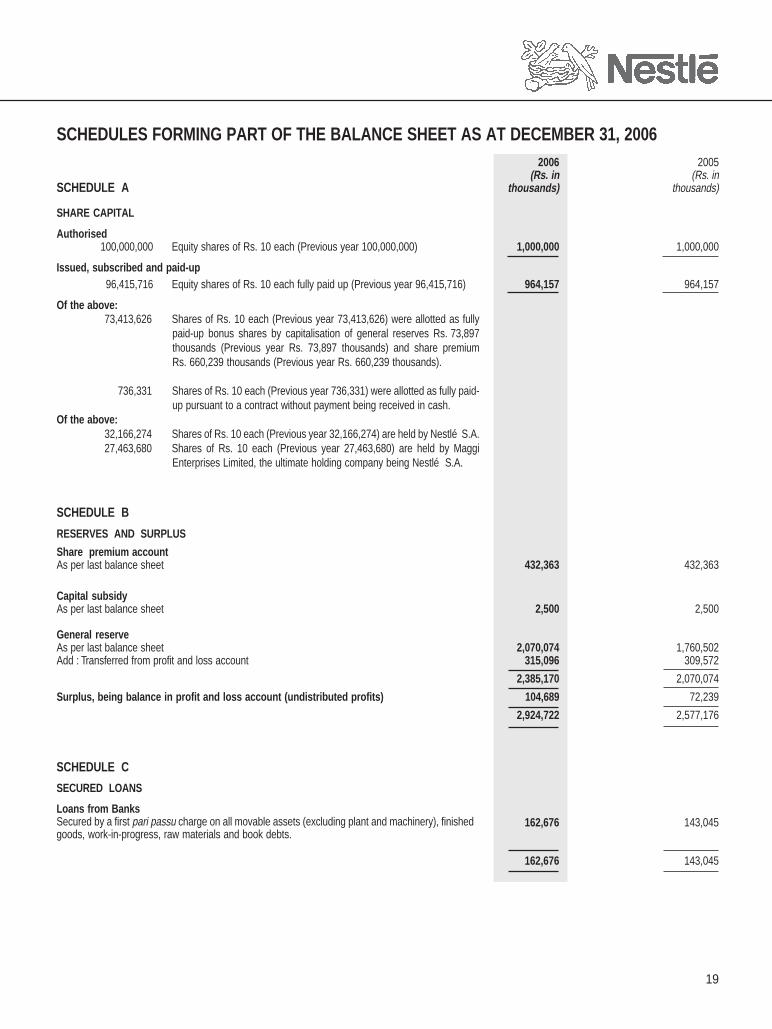
SCHEDULE C
SECURED LOANS
Loans from BanksSecured by a first pari passu charge on all movable assets (excluding plant and machinery), finishedgoods, work-in-progress, raw materials and book debts.
162,676 143,045
162,676 143,045
SCHEDULES FORMING PART OF THE BALANCE SHEET AS AT DECEMBER 31, 20062006 2005
(Rs. in (Rs. inSCHEDULE A thousands) thousands)
SHARE CAPITAL
Authorised100,000,000 Equity shares of Rs. 10 each (Previous year 100,000,000) 1,000,000 1,000,000
Issued, subscribed and paid-up96,415,716 Equity shares of Rs. 10 each fully paid up (Previous year 96,415,716) 964,157 964,157
Of the above:73,413,626 Shares of Rs. 10 each (Previous year 73,413,626) were allotted as fully
paid-up bonus shares by capitalisation of general reserves Rs. 73,897thousands (Previous year Rs. 73,897 thousands) and share premiumRs. 660,239 thousands (Previous year Rs. 660,239 thousands).
736,331 Shares of Rs. 10 each (Previous year 736,331) were allotted as fully paid-up pursuant to a contract without payment being received in cash.
Of the above:32,166,274 Shares of Rs. 10 each (Previous year 32,166,274) are held by Nestlé S.A.27,463,680 Shares of Rs. 10 each (Previous year 27,463,680) are held by Maggi
Enterprises Limited, the ultimate holding company being Nestlé S.A.
SCHEDULE B
RESERVES AND SURPLUS
Share premium accountAs per last balance sheet 432,363 432,363
Capital subsidyAs per last balance sheet 2,500 2,500
General reserveAs per last balance sheet 2,070,074 1,760,502Add : Transferred from profit and loss account 315,096 309,572
2,385,170 2,070,074
Surplus, being balance in profit and loss account (undistributed profits) 104,689 72,239
2,924,722 2,577,176
20
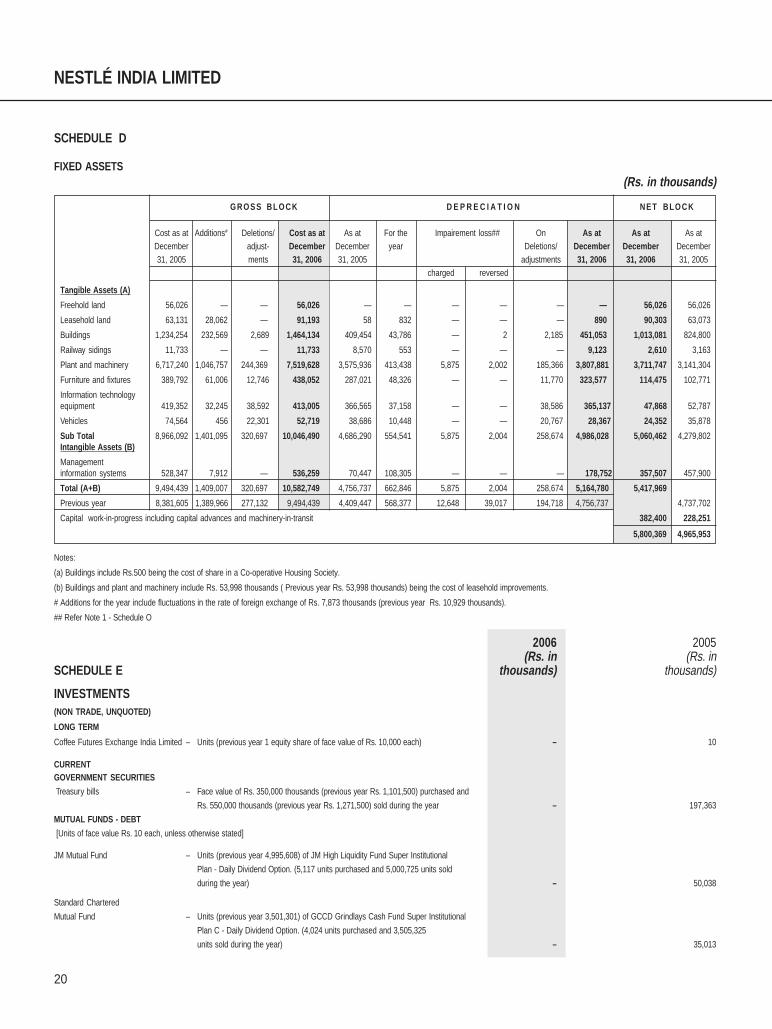
NESTLÉ INDIA LIMITED
SCHEDULE D
FIXED ASSETS (Rs. in thousands)
2006 2005(Rs. in (Rs. in
SCHEDULE E thousands) thousands)
INVESTMENTS(NON TRADE, UNQUOTED)
LONG TERM
Coffee Futures Exchange India Limited – Units (previous year 1 equity share of face value of Rs. 10,000 each) – 10
CURRENTGOVERNMENT SECURITIES
Treasury bills – Face value of Rs. 350,000 thousands (previous year Rs. 1,101,500) purchased and
Rs. 550,000 thousands (previous year Rs. 1,271,500) sold during the year – 197,363
MUTUAL FUNDS - DEBT
[Units of face value Rs. 10 each, unless otherwise stated]
JM Mutual Fund – Units (previous year 4,995,608) of JM High Liquidity Fund Super Institutional
Plan - Daily Dividend Option. (5,117 units purchased and 5,000,725 units sold
during the year) – 50,038
Standard Chartered
Mutual Fund – Units (previous year 3,501,301) of GCCD Grindlays Cash Fund Super Institutional
Plan C - Daily Dividend Option. (4,024 units purchased and 3,505,325
units sold during the year) – 35,013
G R O S S B L O C K D E P R E C I A T I O N NET BLOCK
Cost as at Additions# Deletions/ Cost as at As at For the Impairement loss## On As at As at As atDecember adjust- December December year Deletions/ December December December31, 2005 ments 31, 2006 31, 2005 adjustments 31, 2006 31, 2006 31, 2005
charged reversed
Tangible Assets (A)
Freehold land 56,026 — — 56,026 — — — — — — 56,026 56,026
Leasehold land 63,131 28,062 — 91,193 58 832 — — — 890 90,303 63,073
Buildings 1,234,254 232,569 2,689 1,464,134 409,454 43,786 — 2 2,185 451,053 1,013,081 824,800
Railway sidings 11,733 — — 11,733 8,570 553 — — — 9,123 2,610 3,163
Plant and machinery 6,717,240 1,046,757 244,369 7,519,628 3,575,936 413,438 5,875 2,002 185,366 3,807,881 3,711,747 3,141,304
Furniture and fixtures 389,792 61,006 12,746 438,052 287,021 48,326 — — 11,770 323,577 114,475 102,771
Information technologyequipment 419,352 32,245 38,592 413,005 366,565 37,158 — — 38,586 365,137 47,868 52,787
Vehicles 74,564 456 22,301 52,719 38,686 10,448 — — 20,767 28,367 24,352 35,878
Sub Total 8,966,092 1,401,095 320,697 10,046,490 4,686,290 554,541 5,875 2,004 258,674 4,986,028 5,060,462 4,279,802Intangible Assets (B)
Managementinformation systems 528,347 7,912 — 536,259 70,447 108,305 — — — 178,752 357,507 457,900
Total (A+B) 9,494,439 1,409,007 320,697 10,582,749 4,756,737 662,846 5,875 2,004 258,674 5,164,780 5,417,969
Previous year 8,381,605 1,389,966 277,132 9,494,439 4,409,447 568,377 12,648 39,017 194,718 4,756,737 4,737,702
Capital work-in-progress including capital advances and machinery-in-transit 382,400 228,251
5,800,369 4,965,953
Notes:
(a) Buildings include Rs.500 being the cost of share in a Co-operative Housing Society.
(b) Buildings and plant and machinery include Rs. 53,998 thousands ( Previous year Rs. 53,998 thousands) being the cost of leasehold improvements.
# Additions for the year include fluctuations in the rate of foreign exchange of Rs. 7,873 thousands (previous year Rs. 10,929 thousands).
## Refer Note 1 - Schedule O
21
2006 2005(Rs. in (Rs. in
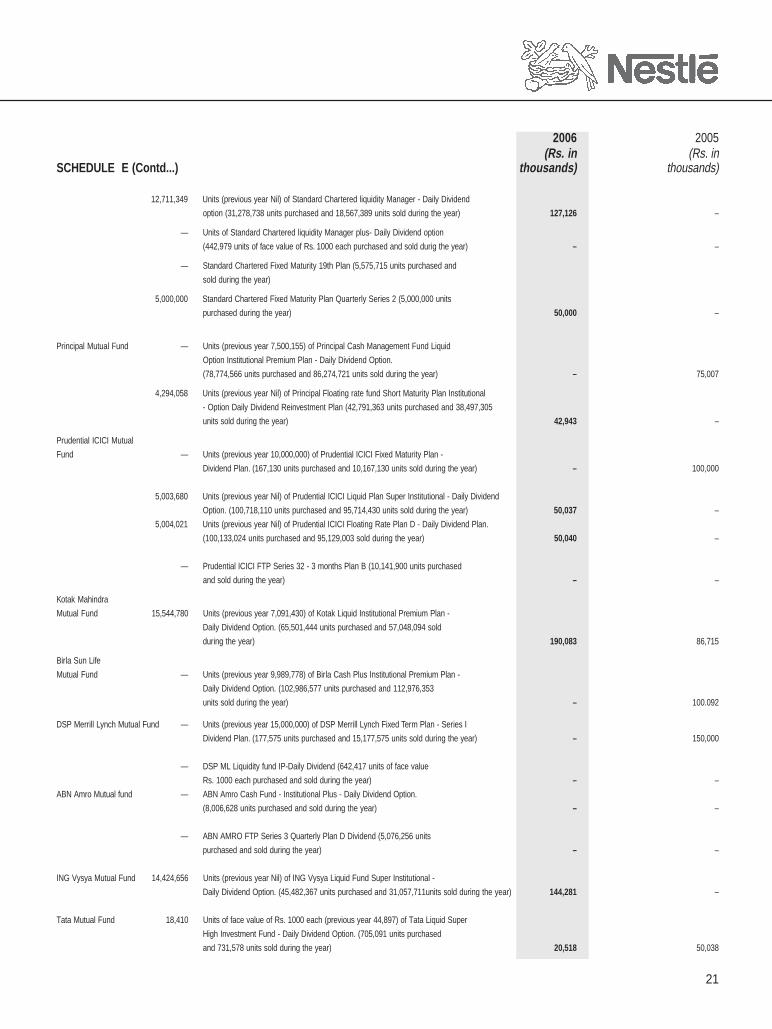
SCHEDULE E (Contd...) thousands) thousands)
12,711,349 Units (previous year Nil) of Standard Chartered liquidity Manager - Daily Dividend
option (31,278,738 units purchased and 18,567,389 units sold during the year) 127,126 –
— Units of Standard Chartered liquidity Manager plus- Daily Dividend option
(442,979 units of face value of Rs. 1000 each purchased and sold durig the year) – –
— Standard Chartered Fixed Maturity 19th Plan (5,575,715 units purchased and
sold during the year)
5,000,000 Standard Chartered Fixed Maturity Plan Quarterly Series 2 (5,000,000 units
purchased during the year) 50,000 –
Principal Mutual Fund — Units (previous year 7,500,155) of Principal Cash Management Fund Liquid
Option Institutional Premium Plan - Daily Dividend Option.
(78,774,566 units purchased and 86,274,721 units sold during the year) – 75,007
4,294,058 Units (previous year Nil) of Principal Floating rate fund Short Maturity Plan Institutional
- Option Daily Dividend Reinvestment Plan (42,791,363 units purchased and 38,497,305
units sold during the year) 42,943 –
Prudential ICICI Mutual
Fund — Units (previous year 10,000,000) of Prudential ICICI Fixed Maturity Plan -
Dividend Plan. (167,130 units purchased and 10,167,130 units sold during the year) – 100,000
5,003,680 Units (previous year Nil) of Prudential ICICI Liquid Plan Super Institutional - Daily Dividend
Option. (100,718,110 units purchased and 95,714,430 units sold during the year) 50,037 –
5,004,021 Units (previous year Nil) of Prudential ICICI Floating Rate Plan D - Daily Dividend Plan.
(100,133,024 units purchased and 95,129,003 sold during the year) 50,040 –
— Prudential ICICI FTP Series 32 - 3 months Plan B (10,141,900 units purchased
and sold during the year) – –
Kotak Mahindra
Mutual Fund 15,544,780 Units (previous year 7,091,430) of Kotak Liquid Institutional Premium Plan -
Daily Dividend Option. (65,501,444 units purchased and 57,048,094 sold
during the year) 190,083 86,715
Birla Sun Life
Mutual Fund — Units (previous year 9,989,778) of Birla Cash Plus Institutional Premium Plan -
Daily Dividend Option. (102,986,577 units purchased and 112,976,353
units sold during the year) – 100.092
DSP Merrill Lynch Mutual Fund — Units (previous year 15,000,000) of DSP Merrill Lynch Fixed Term Plan - Series I
Dividend Plan. (177,575 units purchased and 15,177,575 units sold during the year) – 150,000
— DSP ML Liquidity fund IP-Daily Dividend (642,417 units of face value
Rs. 1000 each purchased and sold during the year) – –
ABN Amro Mutual fund — ABN Amro Cash Fund - Institutional Plus - Daily Dividend Option.
(8,006,628 units purchased and sold during the year) – –
— ABN AMRO FTP Series 3 Quarterly Plan D Dividend (5,076,256 units
purchased and sold during the year) – –
ING Vysya Mutual Fund 14,424,656 Units (previous year Nil) of ING Vysya Liquid Fund Super Institutional -
Daily Dividend Option. (45,482,367 units purchased and 31,057,711units sold during the year) 144,281 –
Tata Mutual Fund 18,410 Units of face value of Rs. 1000 each (previous year 44,897) of Tata Liquid Super
High Investment Fund - Daily Dividend Option. (705,091 units purchased
and 731,578 units sold during the year) 20,518 50,038
22
NESTLÉ INDIA LIMITED
2006 2005(Rs. in (Rs. in
SCHEDULE E (Contd...) thousands) thousands)
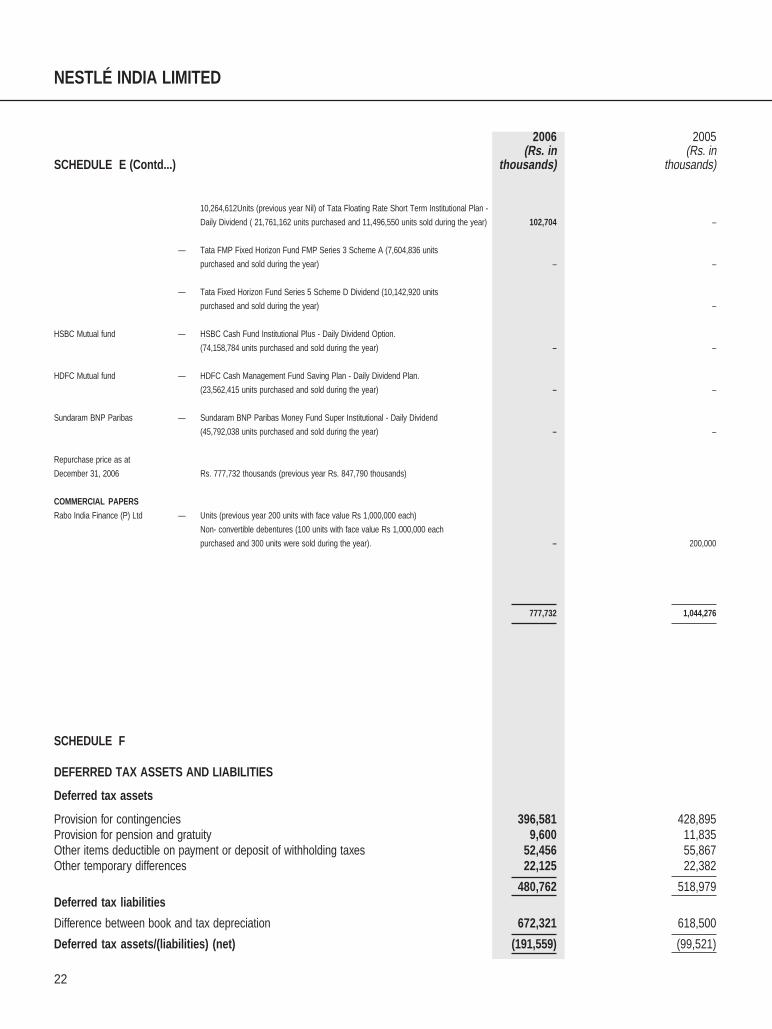
SCHEDULE F
DEFERRED TAX ASSETS AND LIABILITIES
Deferred tax assets
Provision for contingencies 396,581 428,895Provision for pension and gratuity 9,600 11,835Other items deductible on payment or deposit of withholding taxes 52,456 55,867Other temporary differences 22,125 22,382
480,762 518,979Deferred tax liabilities
Difference between book and tax depreciation 672,321 618,500
Deferred tax assets/(liabilities) (net) (191,559) (99,521)
10,264,612Units (previous year Nil) of Tata Floating Rate Short Term Institutional Plan -
Daily Dividend ( 21,761,162 units purchased and 11,496,550 units sold during the year) 102,704 –
— Tata FMP Fixed Horizon Fund FMP Series 3 Scheme A (7,604,836 units
purchased and sold during the year) – –
— Tata Fixed Horizon Fund Series 5 Scheme D Dividend (10,142,920 units
purchased and sold during the year) –
HSBC Mutual fund — HSBC Cash Fund Institutional Plus - Daily Dividend Option.
(74,158,784 units purchased and sold during the year) – –
HDFC Mutual fund — HDFC Cash Management Fund Saving Plan - Daily Dividend Plan.
(23,562,415 units purchased and sold during the year) – –
Sundaram BNP Paribas — Sundaram BNP Paribas Money Fund Super Institutional - Daily Dividend
(45,792,038 units purchased and sold during the year) – –
Repurchase price as at
December 31, 2006 Rs. 777,732 thousands (previous year Rs. 847,790 thousands)
COMMERCIAL PAPERS
Rabo India Finance (P) Ltd — Units (previous year 200 units with face value Rs 1,000,000 each)
Non- convertible debentures (100 units with face value Rs 1,000,000 each
purchased and 300 units were sold during the year). – 200,000
777,732 1,044,276
23
2006 2005(Rs. in (Rs. in
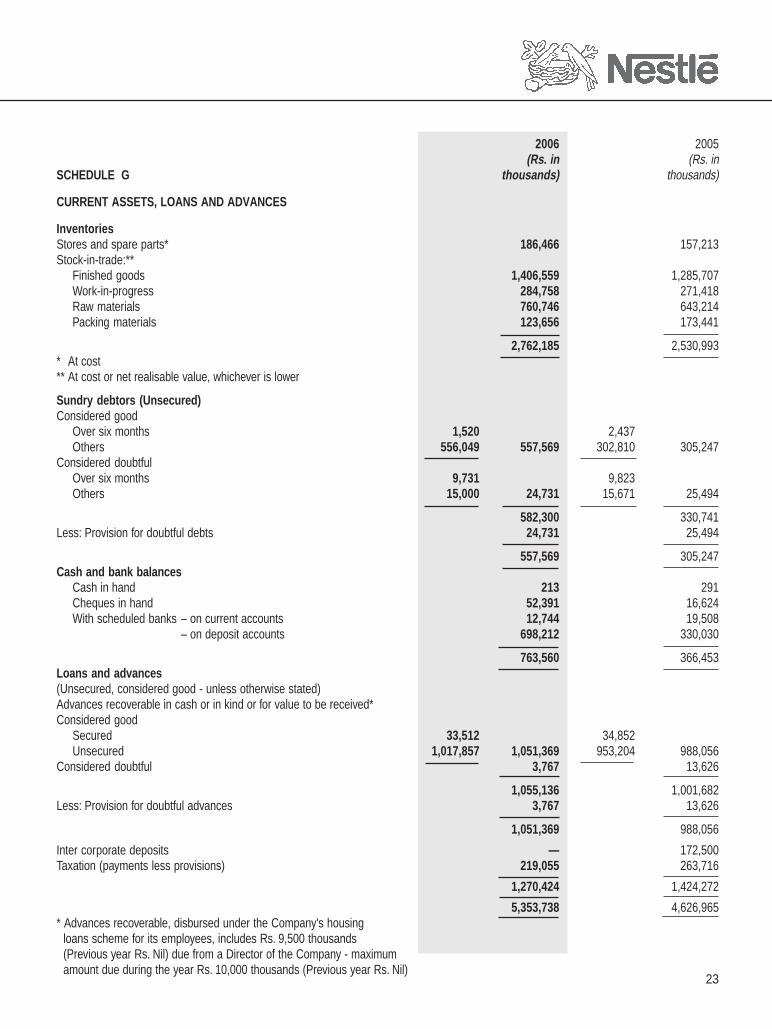
SCHEDULE G thousands) thousands)
CURRENT ASSETS, LOANS AND ADVANCES
InventoriesStores and spare parts* 186,466 157,213Stock-in-trade:**
Finished goods 1,406,559 1,285,707Work-in-progress 284,758 271,418Raw materials 760,746 643,214Packing materials 123,656 173,441
2,762,185 2,530,993* At cost** At cost or net realisable value, whichever is lower
Sundry debtors (Unsecured)Considered good
Over six months 1,520 2,437Others 556,049 557,569 302,810 305,247
Considered doubtfulOver six months 9,731 9,823Others 15,000 24,731 15,671 25,494
582,300 330,741Less: Provision for doubtful debts 24,731 25,494
557,569 305,247Cash and bank balances
Cash in hand 213 291Cheques in hand 52,391 16,624With scheduled banks – on current accounts 12,744 19,508
– on deposit accounts 698,212 330,030
763,560 366,453Loans and advances(Unsecured, considered good - unless otherwise stated)Advances recoverable in cash or in kind or for value to be received*Considered good
Secured 33,512 34,852Unsecured 1,017,857 1,051,369 953,204 988,056
Considered doubtful 3,767 13,626
1,055,136 1,001,682Less: Provision for doubtful advances 3,767 13,626
1,051,369 988,056
Inter corporate deposits — 172,500Taxation (payments less provisions) 219,055 263,716
1,270,424 1,424,272
5,353,738 4,626,965* Advances recoverable, disbursed under the Company's housing
loans scheme for its employees, includes Rs. 9,500 thousands(Previous year Rs. Nil) due from a Director of the Company - maximumamount due during the year Rs. 10,000 thousands (Previous year Rs. Nil)
24
NESTLÉ INDIA LIMITED
2006 2005(Rs. in (Rs. in
SCHEDULE H thousands) thousands)
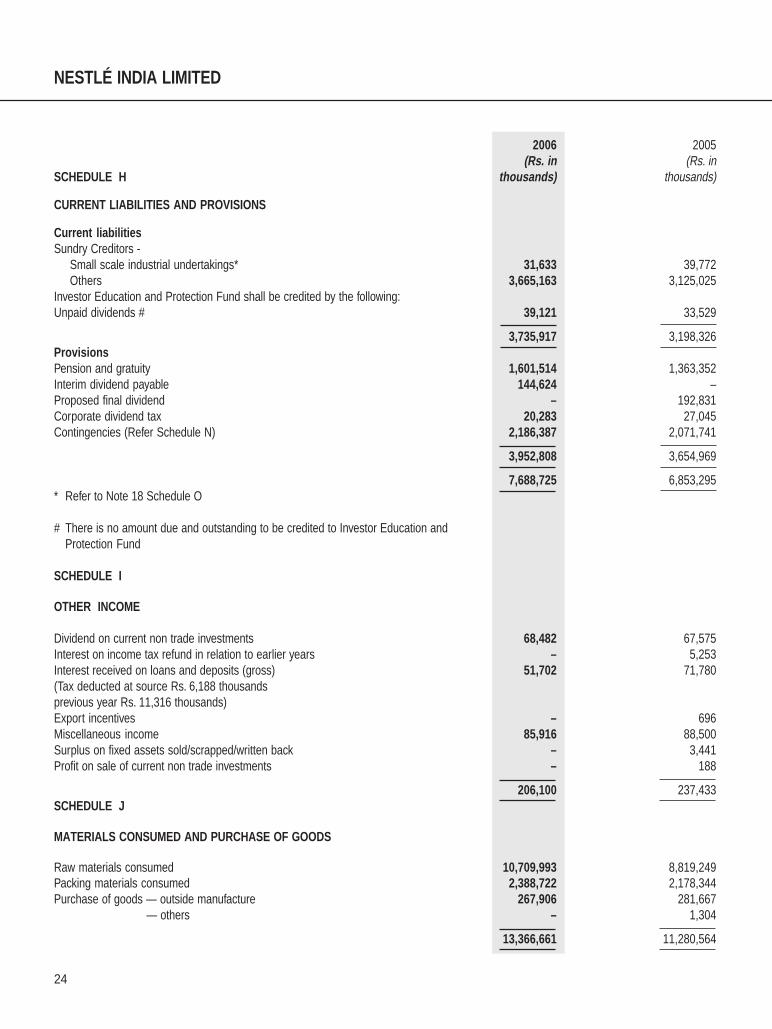
CURRENT LIABILITIES AND PROVISIONS
Current liabilitiesSundry Creditors -
Small scale industrial undertakings* 31,633 39,772Others 3,665,163 3,125,025
Investor Education and Protection Fund shall be credited by the following:Unpaid dividends # 39,121 33,529
3,735,917 3,198,326ProvisionsPension and gratuity 1,601,514 1,363,352Interim dividend payable 144,624 –Proposed final dividend – 192,831Corporate dividend tax 20,283 27,045Contingencies (Refer Schedule N) 2,186,387 2,071,741
3,952,808 3,654,969
7,688,725 6,853,295* Refer to Note 18 Schedule O
# There is no amount due and outstanding to be credited to Investor Education andProtection Fund
SCHEDULE I
OTHER INCOME
Dividend on current non trade investments 68,482 67,575Interest on income tax refund in relation to earlier years – 5,253Interest received on loans and deposits (gross) 51,702 71,780(Tax deducted at source Rs. 6,188 thousandsprevious year Rs. 11,316 thousands)Export incentives – 696Miscellaneous income 85,916 88,500Surplus on fixed assets sold/scrapped/written back – 3,441Profit on sale of current non trade investments – 188
206,100 237,433SCHEDULE J
MATERIALS CONSUMED AND PURCHASE OF GOODS
Raw materials consumed 10,709,993 8,819,249Packing materials consumed 2,388,722 2,178,344Purchase of goods — outside manufacture 267,906 281,667
— others – 1,304
13,366,661 11,280,564
25
2006 2005(Rs. in (Rs. in
SCHEDULE K thousands) thousands)
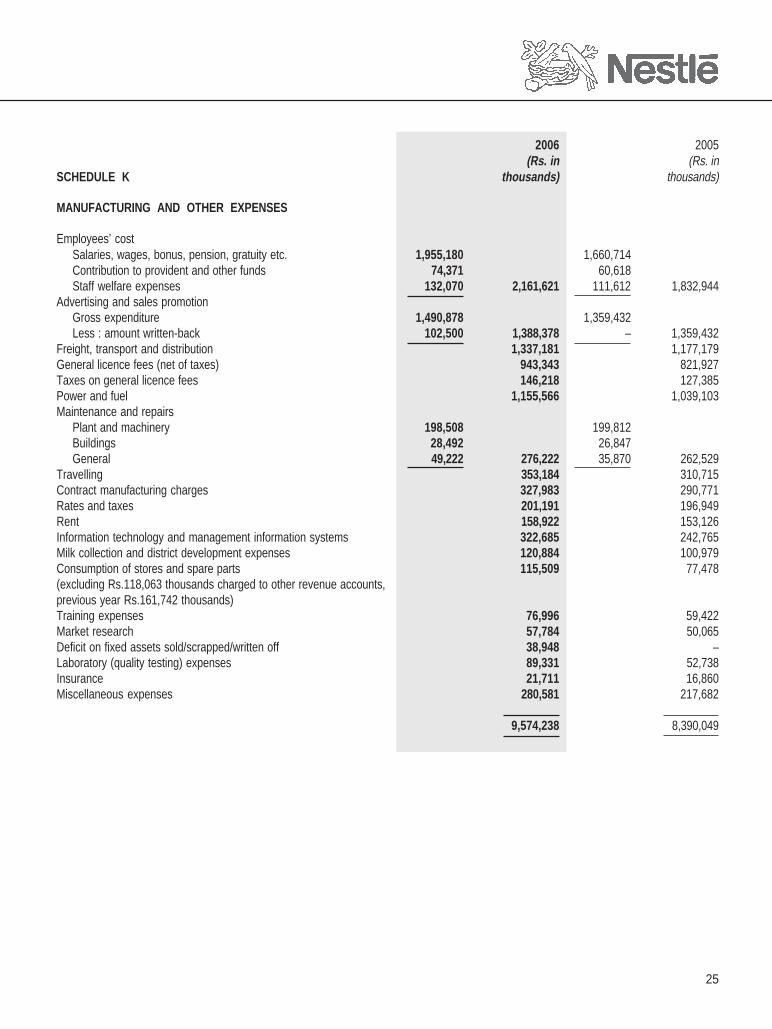
MANUFACTURING AND OTHER EXPENSES
Employees’ costSalaries, wages, bonus, pension, gratuity etc. 1,955,180 1,660,714Contribution to provident and other funds 74,371 60,618Staff welfare expenses 132,070 2,161,621 111,612 1,832,944
Advertising and sales promotionGross expenditure 1,490,878 1,359,432Less : amount written-back 102,500 1,388,378 – 1,359,432
Freight, transport and distribution 1,337,181 1,177,179General licence fees (net of taxes) 943,343 821,927Taxes on general licence fees 146,218 127,385Power and fuel 1,155,566 1,039,103Maintenance and repairs
Plant and machinery 198,508 199,812Buildings 28,492 26,847General 49,222 276,222 35,870 262,529
Travelling 353,184 310,715Contract manufacturing charges 327,983 290,771Rates and taxes 201,191 196,949Rent 158,922 153,126Information technology and management information systems 322,685 242,765Milk collection and district development expenses 120,884 100,979Consumption of stores and spare parts 115,509 77,478(excluding Rs.118,063 thousands charged to other revenue accounts,previous year Rs.161,742 thousands)Training expenses 76,996 59,422Market research 57,784 50,065Deficit on fixed assets sold/scrapped/written off 38,948 –Laboratory (quality testing) expenses 89,331 52,738Insurance 21,711 16,860Miscellaneous expenses 280,581 217,682
9,574,238 8,390,049
26
NESTLÉ INDIA LIMITED
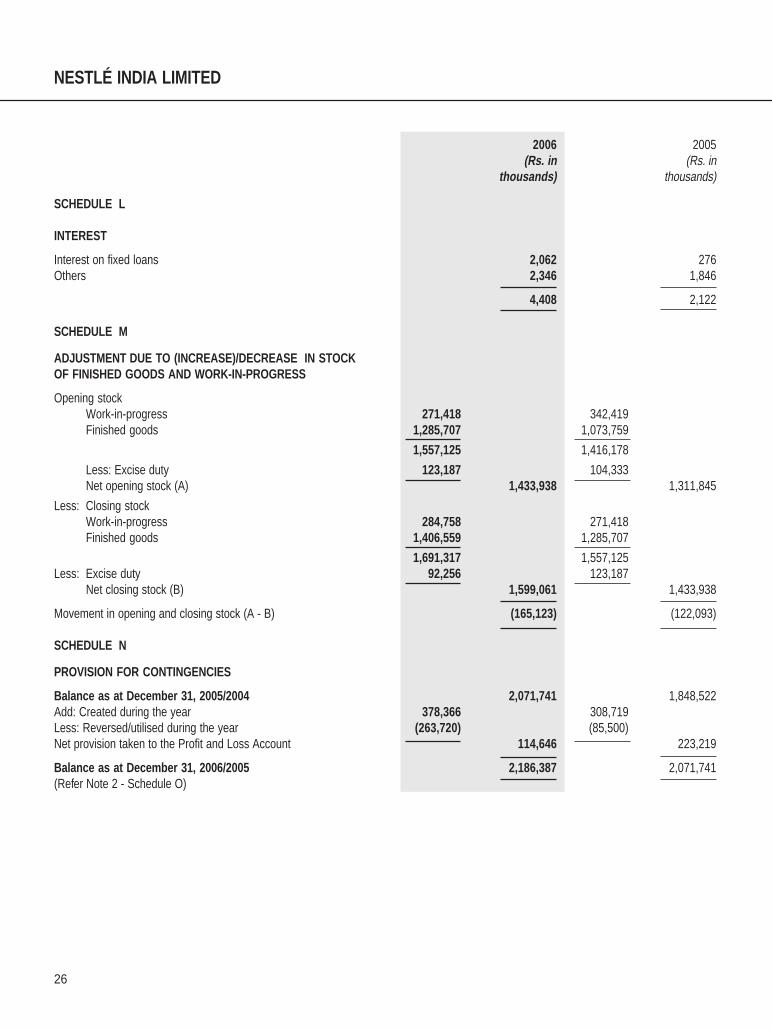
SCHEDULE L
INTEREST
Interest on fixed loans 2,062 276Others 2,346 1,846
4,408 2,122
SCHEDULE M
ADJUSTMENT DUE TO (INCREASE)/DECREASE IN STOCKOF FINISHED GOODS AND WORK-IN-PROGRESS
Opening stockWork-in-progress 271,418 342,419Finished goods 1,285,707 1,073,759
1,557,125 1,416,178
Less: Excise duty 123,187 104,333Net opening stock (A) 1,433,938 1,311,845
Less: Closing stockWork-in-progress 284,758 271,418Finished goods 1,406,559 1,285,707
1,691,317 1,557,125Less: Excise duty 92,256 123,187
Net closing stock (B) 1,599,061 1,433,938
Movement in opening and closing stock (A - B) (165,123) (122,093)
SCHEDULE N
PROVISION FOR CONTINGENCIES
Balance as at December 31, 2005/2004 2,071,741 1,848,522Add: Created during the year 378,366 308,719Less: Reversed/utilised during the year (263,720) (85,500)Net provision taken to the Profit and Loss Account 114,646 223,219
Balance as at December 31, 2006/2005 2,186,387 2,071,741(Refer Note 2 - Schedule O)
2006 2005(Rs. in (Rs. in
thousands) thousands)
27
2006 2005(Rs. in (Rs. in
thousands) thousands)
SCHEDULE O
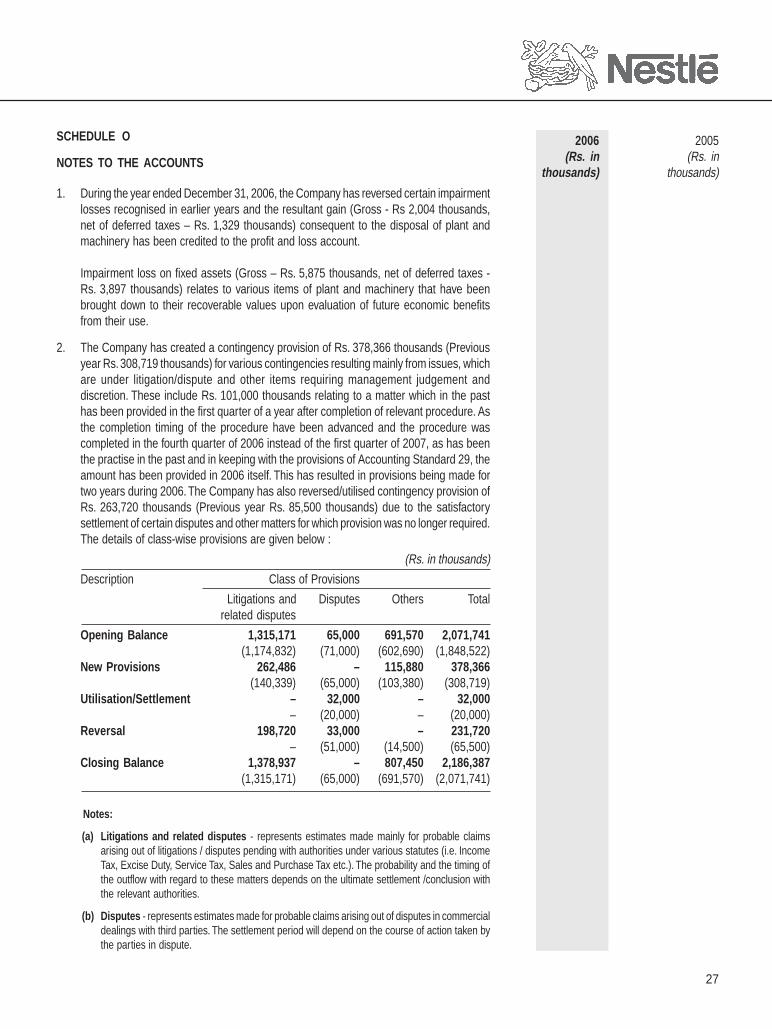
NOTES TO THE ACCOUNTS
1. During the year ended December 31, 2006, the Company has reversed certain impairmentlosses recognised in earlier years and the resultant gain (Gross - Rs 2,004 thousands,net of deferred taxes – Rs. 1,329 thousands) consequent to the disposal of plant andmachinery has been credited to the profit and loss account.
Impairment loss on fixed assets (Gross – Rs. 5,875 thousands, net of deferred taxes -Rs. 3,897 thousands) relates to various items of plant and machinery that have beenbrought down to their recoverable values upon evaluation of future economic benefitsfrom their use.
2. The Company has created a contingency provision of Rs. 378,366 thousands (Previousyear Rs. 308,719 thousands) for various contingencies resulting mainly from issues, whichare under litigation/dispute and other items requiring management judgement anddiscretion. These include Rs. 101,000 thousands relating to a matter which in the pasthas been provided in the first quarter of a year after completion of relevant procedure. Asthe completion timing of the procedure have been advanced and the procedure wascompleted in the fourth quarter of 2006 instead of the first quarter of 2007, as has beenthe practise in the past and in keeping with the provisions of Accounting Standard 29, theamount has been provided in 2006 itself. This has resulted in provisions being made fortwo years during 2006. The Company has also reversed/utilised contingency provision ofRs. 263,720 thousands (Previous year Rs. 85,500 thousands) due to the satisfactorysettlement of certain disputes and other matters for which provision was no longer required.The details of class-wise provisions are given below :
(Rs. in thousands)
Description Class of Provisions
Litigations and Disputes Others Totalrelated disputes
Opening Balance 1,315,171 65,000 691,570 2,071,741(1,174,832) (71,000) (602,690) (1,848,522)
New Provisions 262,486 – 115,880 378,366(140,339) (65,000) (103,380) (308,719)
Utilisation/Settlement – 32,000 – 32,000– (20,000) – (20,000)
Reversal 198,720 33,000 – 231,720– (51,000) (14,500) (65,500)
Closing Balance 1,378,937 – 807,450 2,186,387(1,315,171) (65,000) (691,570) (2,071,741)
Notes:
(a) Litigations and related disputes - represents estimates made mainly for probable claimsarising out of litigations / disputes pending with authorities under various statutes (i.e. IncomeTax, Excise Duty, Service Tax, Sales and Purchase Tax etc.). The probability and the timing ofthe outflow with regard to these matters depends on the ultimate settlement /conclusion withthe relevant authorities.
(b) Disputes - represents estimates made for probable claims arising out of disputes in commercialdealings with third parties. The settlement period will depend on the course of action taken bythe parties in dispute.
28
NESTLÉ INDIA LIMITED
2006 2005(Rs. in (Rs. in
thousands) thousands)
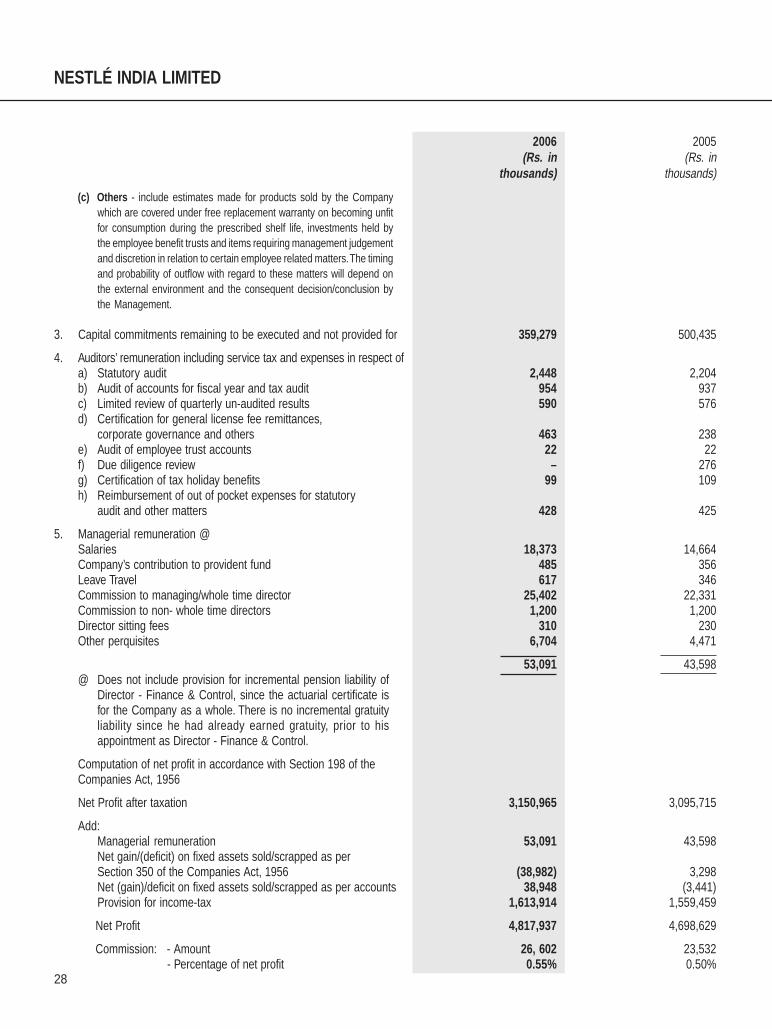
(c) Others - include estimates made for products sold by the Companywhich are covered under free replacement warranty on becoming unfitfor consumption during the prescribed shelf life, investments held bythe employee benefit trusts and items requiring management judgementand discretion in relation to certain employee related matters. The timingand probability of outflow with regard to these matters will depend onthe external environment and the consequent decision/conclusion bythe Management.
3. Capital commitments remaining to be executed and not provided for 359,279 500,435
4. Auditors’ remuneration including service tax and expenses in respect ofa) Statutory audit 2,448 2,204b) Audit of accounts for fiscal year and tax audit 954 937c) Limited review of quarterly un-audited results 590 576d) Certification for general license fee remittances,
corporate governance and others 463 238e) Audit of employee trust accounts 22 22f) Due diligence review – 276g) Certification of tax holiday benefits 99 109h) Reimbursement of out of pocket expenses for statutory
audit and other matters 428 425
5. Managerial remuneration @Salaries 18,373 14,664Company’s contribution to provident fund 485 356Leave Travel 617 346Commission to managing/whole time director 25,402 22,331Commission to non- whole time directors 1,200 1,200Director sitting fees 310 230Other perquisites 6,704 4,471
53,091 43,598@ Does not include provision for incremental pension liability of
Director - Finance & Control, since the actuarial certificate isfor the Company as a whole. There is no incremental gratuityliability since he had already earned gratuity, prior to hisappointment as Director - Finance & Control.
Computation of net profit in accordance with Section 198 of theCompanies Act, 1956
Net Profit after taxation 3,150,965 3,095,715
Add:Managerial remuneration 53,091 43,598Net gain/(deficit) on fixed assets sold/scrapped as perSection 350 of the Companies Act, 1956 (38,982) 3,298Net (gain)/deficit on fixed assets sold/scrapped as per accounts 38,948 (3,441)Provision for income-tax 1,613,914 1,559,459
Net Profit 4,817,937 4,698,629
Commission: - Amount 26, 602 23,532- Percentage of net profit 0.55% 0.50%
29
Quantity (Rs. in Quantity (Rs. in(MT) thousands) (MT) thousands)
10. Raw materials consumed:Fresh milk and milk concentrate 334,256 4,075,542 312,580 3,529,934Green coffee 23,790 1,351,333 28,691 1,278,942Sugar 41,191 826,675 37,455 695,035Vegetable oils 17,507 894,684 14,095 644,371Skimmed milk powder 9,806 950,951 6,550 555,753Wheat flour 65,798 850,818 53,673 547,601Cocoa based raw materials 954 98,759 1,020 138,727Tomato Paste 3,657 128,451 3,535 124,293Whey powder 1,397 139,889 1,283 113,990Black tea/green leaf 9,718 106,217 7,200 70,106Chicory 3,511 62,382 3,630 66,247Tapioca starch 386 14,964 3,926 61,395Apple concentrate 841 45,373 800 39,139Others (net of sale proceeds of by-products/surplus materials) 1,163,955 953,716
10,709,993 8,819,249
(Rs. in % (Rs. in %thousands) thousands)
Of the above:Imported 1,204,719 11.2 1,284,025 14.6Indigenous 9,505,274 88.8 7,535,224 85.4
10,709,993 100.0 8,819,249 100.0
2006 2005
(Rs. in % (Rs. in %thousands) thousands)
6. Exchange difference (net) amounting to Rs. 9,953 thousands debited(Previous year Rs. 3,075 thousand credited) to respective revenueheads in the profit and loss account.
7. Stores and spare parts consumedImported 28,292 12.1 35,375 14.8Indigenous 205,280 87.9 203,845 85.2
233,572 100.0 239,220 100.08. Earnings from exports:
Export of goods in:- Foreign Currency at F.O.B value (including sales
to Russia invoiced in rupees) 2,217,544 2,063,900- Rupees (all inclusive sales to Nepal & Bhutan) 538,898 445,135Proceeds from sale of fixed assets in foreign currency at F.O.B value 2,226 66,559
9. C. I. F. value of imports:Raw materials 685,084 1,208,556Capital goods 423,706 188,887Goods – outside manufacture 38,384 40,250Components and spare parts 43,240 44,188
30
NESTLÉ INDIA LIMITED
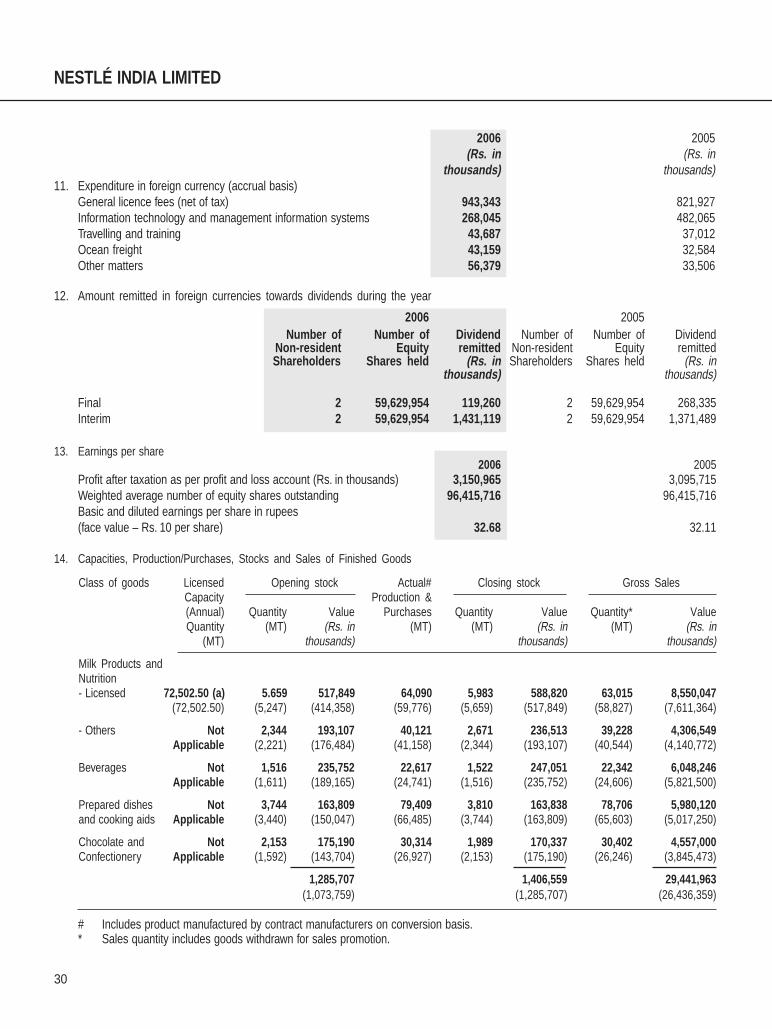
14. Capacities, Production/Purchases, Stocks and Sales of Finished Goods
Class of goods Licensed Opening stock Actual# Closing stock Gross SalesCapacity Production &(Annual) Quantity Value Purchases Quantity Value Quantity* ValueQuantity (MT) (Rs. in (MT) (MT) (Rs. in (MT) (Rs. in
(MT) thousands) thousands) thousands)
Milk Products andNutrition- Licensed 72,502.50 (a) 5.659 517,849 64,090 5,983 588,820 63,015 8,550,047
(72,502.50) (5,247) (414,358) (59,776) (5,659) (517,849) (58,827) (7,611,364)
- Others Not 2,344 193,107 40,121 2,671 236,513 39,228 4,306,549Applicable (2,221) (176,484) (41,158) (2,344) (193,107) (40,544) (4,140,772)
Beverages Not 1,516 235,752 22,617 1,522 247,051 22,342 6,048,246Applicable (1,611) (189,165) (24,741) (1,516) (235,752) (24,606) (5,821,500)
Prepared dishes Not 3,744 163,809 79,409 3,810 163,838 78,706 5,980,120and cooking aids Applicable (3,440) (150,047) (66,485) (3,744) (163,809) (65,603) (5,017,250)
Chocolate and Not 2,153 175,190 30,314 1,989 170,337 30,402 4,557,000Confectionery Applicable (1,592) (143,704) (26,927) (2,153) (175,190) (26,246) (3,845,473)
1,285,707 1,406,559 29,441,963(1,073,759) (1,285,707) (26,436,359)
# Includes product manufactured by contract manufacturers on conversion basis.* Sales quantity includes goods withdrawn for sales promotion.
13. Earnings per share2006 2005
Profit after taxation as per profit and loss account (Rs. in thousands) 3,150,965 3,095,715Weighted average number of equity shares outstanding 96,415,716 96,415,716Basic and diluted earnings per share in rupees(face value – Rs. 10 per share) 32.68 32.11
2006 2005(Rs. in (Rs. in
thousands) thousands)11. Expenditure in foreign currency (accrual basis)
General licence fees (net of tax) 943,343 821,927Information technology and management information systems 268,045 482,065Travelling and training 43,687 37,012Ocean freight 43,159 32,584Other matters 56,379 33,506
12. Amount remitted in foreign currencies towards dividends during the year
2006 2005Number of Number of Dividend Number of Number of Dividend
Non-resident Equity remitted Non-resident Equity remittedShareholders Shares held (Rs. in Shareholders Shares held (Rs. in
thousands) thousands)
Final 2 59,629,954 119,260 2 59,629,954 268,335Interim 2 59,629,954 1,431,119 2 59,629,954 1,371,489
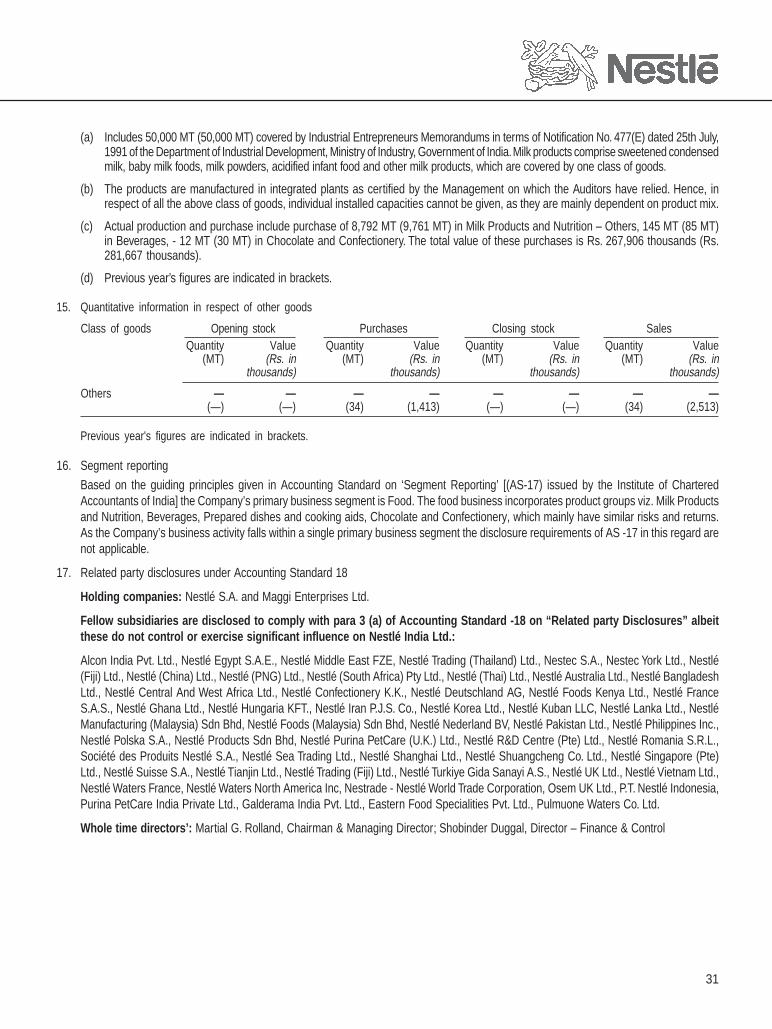
31
(a) Includes 50,000 MT (50,000 MT) covered by Industrial Entrepreneurs Memorandums in terms of Notification No. 477(E) dated 25th July,1991 of the Department of Industrial Development, Ministry of Industry, Government of India. Milk products comprise sweetened condensedmilk, baby milk foods, milk powders, acidified infant food and other milk products, which are covered by one class of goods.
(b) The products are manufactured in integrated plants as certified by the Management on which the Auditors have relied. Hence, inrespect of all the above class of goods, individual installed capacities cannot be given, as they are mainly dependent on product mix.
(c) Actual production and purchase include purchase of 8,792 MT (9,761 MT) in Milk Products and Nutrition – Others, 145 MT (85 MT)in Beverages, - 12 MT (30 MT) in Chocolate and Confectionery. The total value of these purchases is Rs. 267,906 thousands (Rs.281,667 thousands).
(d) Previous year’s figures are indicated in brackets.
15. Quantitative information in respect of other goods
Class of goods Opening stock Purchases Closing stock SalesQuantity Value Quantity Value Quantity Value Quantity Value
(MT) (Rs. in (MT) (Rs. in (MT) (Rs. in (MT) (Rs. inthousands) thousands) thousands) thousands)
Others — — — — — — — —(—) (—) (34) (1,413) (—) (—) (34) (2,513)
Previous year's figures are indicated in brackets.
16. Segment reporting
Based on the guiding principles given in Accounting Standard on ‘Segment Reporting’ [(AS-17) issued by the Institute of CharteredAccountants of India] the Company’s primary business segment is Food. The food business incorporates product groups viz. Milk Productsand Nutrition, Beverages, Prepared dishes and cooking aids, Chocolate and Confectionery, which mainly have similar risks and returns.As the Company’s business activity falls within a single primary business segment the disclosure requirements of AS -17 in this regard arenot applicable.
17. Related party disclosures under Accounting Standard 18
Holding companies: Nestlé S.A. and Maggi Enterprises Ltd.
Fellow subsidiaries are disclosed to comply with para 3 (a) of Accounting Standard -18 on “Related party Disclosures” albeitthese do not control or exercise significant influence on Nestlé India Ltd.:
Alcon India Pvt. Ltd., Nestlé Egypt S.A.E., Nestlé Middle East FZE, Nestlé Trading (Thailand) Ltd., Nestec S.A., Nestec York Ltd., Nestlé(Fiji) Ltd., Nestlé (China) Ltd., Nestlé (PNG) Ltd., Nestlé (South Africa) Pty Ltd., Nestlé (Thai) Ltd., Nestlé Australia Ltd., Nestlé BangladeshLtd., Nestlé Central And West Africa Ltd., Nestlé Confectionery K.K., Nestlé Deutschland AG, Nestlé Foods Kenya Ltd., Nestlé FranceS.A.S., Nestlé Ghana Ltd., Nestlé Hungaria KFT., Nestlé Iran P.J.S. Co., Nestlé Korea Ltd., Nestlé Kuban LLC, Nestlé Lanka Ltd., NestléManufacturing (Malaysia) Sdn Bhd, Nestlé Foods (Malaysia) Sdn Bhd, Nestlé Nederland BV, Nestlé Pakistan Ltd., Nestlé Philippines Inc.,Nestlé Polska S.A., Nestlé Products Sdn Bhd, Nestlé Purina PetCare (U.K.) Ltd., Nestlé R&D Centre (Pte) Ltd., Nestlé Romania S.R.L.,Société des Produits Nestlé S.A., Nestlé Sea Trading Ltd., Nestlé Shanghai Ltd., Nestlé Shuangcheng Co. Ltd., Nestlé Singapore (Pte)Ltd., Nestlé Suisse S.A., Nestlé Tianjin Ltd., Nestlé Trading (Fiji) Ltd., Nestlé Turkiye Gida Sanayi A.S., Nestlé UK Ltd., Nestlé Vietnam Ltd.,Nestlé Waters France, Nestlé Waters North America Inc, Nestrade - Nestlé World Trade Corporation, Osem UK Ltd., P.T. Nestlé Indonesia,Purina PetCare India Private Ltd., Galderama India Pvt. Ltd., Eastern Food Specialities Pvt. Ltd., Pulmuone Waters Co. Ltd.
Whole time directors’: Martial G. Rolland, Chairman & Managing Director; Shobinder Duggal, Director – Finance & Control
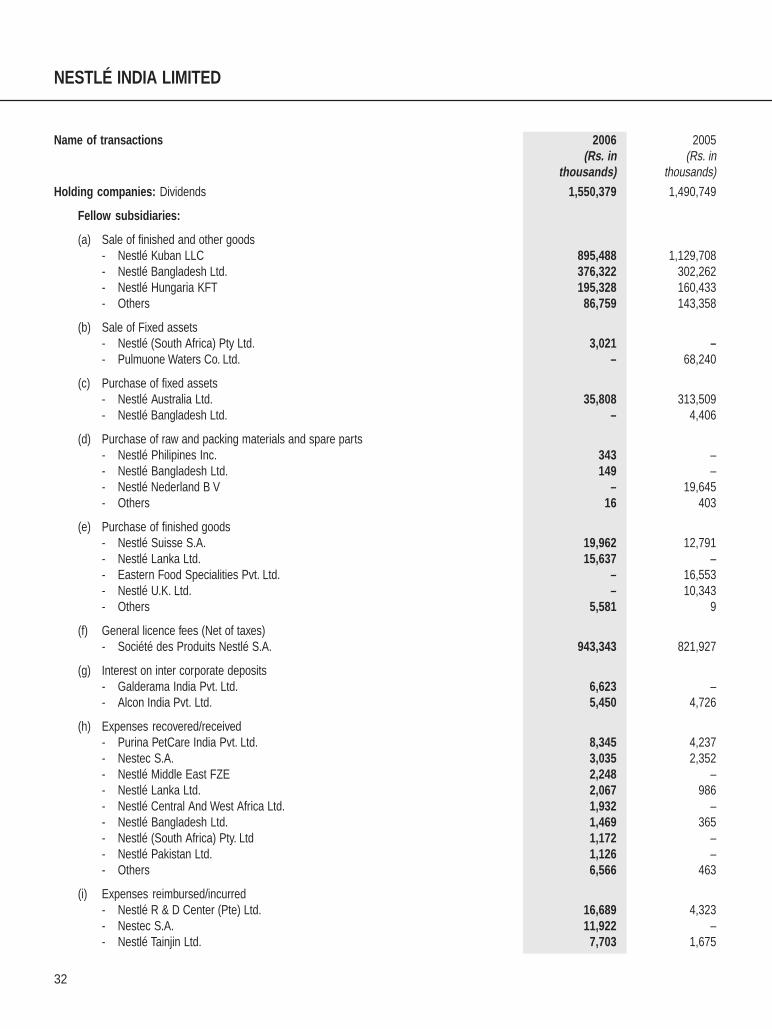
32
NESTLÉ INDIA LIMITED
Name of transactions 2006 2005(Rs. in (Rs. in
thousands) thousands)
Holding companies: Dividends 1,550,379 1,490,749
Fellow subsidiaries:
(a) Sale of finished and other goods- Nestlé Kuban LLC 895,488 1,129,708- Nestlé Bangladesh Ltd. 376,322 302,262- Nestlé Hungaria KFT 195,328 160,433- Others 86,759 143,358
(b) Sale of Fixed assets- Nestlé (South Africa) Pty Ltd. 3,021 –- Pulmuone Waters Co. Ltd. – 68,240
(c) Purchase of fixed assets- Nestlé Australia Ltd. 35,808 313,509- Nestlé Bangladesh Ltd. – 4,406
(d) Purchase of raw and packing materials and spare parts- Nestlé Philipines Inc. 343 –- Nestlé Bangladesh Ltd. 149 –- Nestlé Nederland B V – 19,645- Others 16 403
(e) Purchase of finished goods- Nestlé Suisse S.A. 19,962 12,791- Nestlé Lanka Ltd. 15,637 –- Eastern Food Specialities Pvt. Ltd. – 16,553- Nestlé U.K. Ltd. – 10,343- Others 5,581 9
(f) General licence fees (Net of taxes)- Société des Produits Nestlé S.A. 943,343 821,927
(g) Interest on inter corporate deposits- Galderama India Pvt. Ltd. 6,623 –- Alcon India Pvt. Ltd. 5,450 4,726
(h) Expenses recovered/received- Purina PetCare India Pvt. Ltd. 8,345 4,237- Nestec S.A. 3,035 2,352- Nestlé Middle East FZE 2,248 –- Nestlé Lanka Ltd. 2,067 986- Nestlé Central And West Africa Ltd. 1,932 –- Nestlé Bangladesh Ltd. 1,469 365- Nestlé (South Africa) Pty. Ltd 1,172 –- Nestlé Pakistan Ltd. 1,126 –- Others 6,566 463
(i) Expenses reimbursed/incurred- Nestlé R & D Center (Pte) Ltd. 16,689 4,323- Nestec S.A. 11,922 –- Nestlé Tainjin Ltd. 7,703 1,675
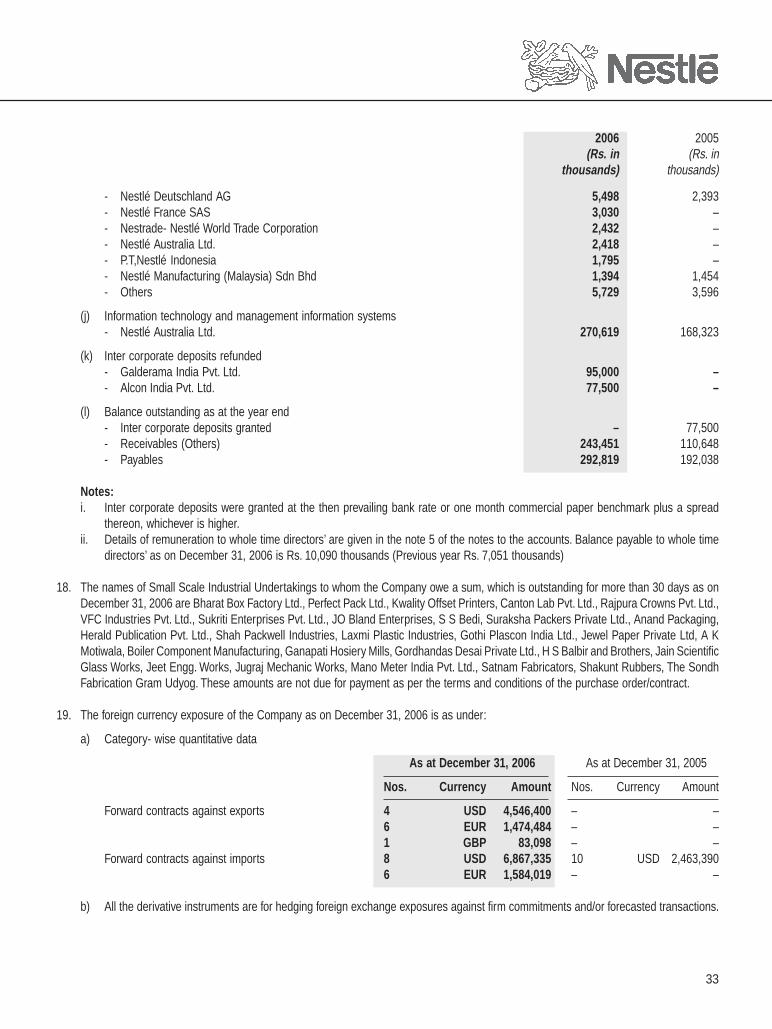
33
- Nestlé Deutschland AG 5,498 2,393- Nestlé France SAS 3,030 –- Nestrade- Nestlé World Trade Corporation 2,432 –- Nestlé Australia Ltd. 2,418 –- P.T,Nestlé Indonesia 1,795 –- Nestlé Manufacturing (Malaysia) Sdn Bhd 1,394 1,454- Others 5,729 3,596
(j) Information technology and management information systems- Nestlé Australia Ltd. 270,619 168,323
(k) Inter corporate deposits refunded- Galderama India Pvt. Ltd. 95,000 –- Alcon India Pvt. Ltd. 77,500 –
(l) Balance outstanding as at the year end- Inter corporate deposits granted – 77,500- Receivables (Others) 243,451 110,648- Payables 292,819 192,038
Notes:i. Inter corporate deposits were granted at the then prevailing bank rate or one month commercial paper benchmark plus a spread
thereon, whichever is higher.ii. Details of remuneration to whole time directors’ are given in the note 5 of the notes to the accounts. Balance payable to whole time
directors’ as on December 31, 2006 is Rs. 10,090 thousands (Previous year Rs. 7,051 thousands)
18. The names of Small Scale Industrial Undertakings to whom the Company owe a sum, which is outstanding for more than 30 days as onDecember 31, 2006 are Bharat Box Factory Ltd., Perfect Pack Ltd., Kwality Offset Printers, Canton Lab Pvt. Ltd., Rajpura Crowns Pvt. Ltd.,VFC Industries Pvt. Ltd., Sukriti Enterprises Pvt. Ltd., JO Bland Enterprises, S S Bedi, Suraksha Packers Private Ltd., Anand Packaging,Herald Publication Pvt. Ltd., Shah Packwell Industries, Laxmi Plastic Industries, Gothi Plascon India Ltd., Jewel Paper Private Ltd, A KMotiwala, Boiler Component Manufacturing, Ganapati Hosiery Mills, Gordhandas Desai Private Ltd., H S Balbir and Brothers, Jain ScientificGlass Works, Jeet Engg. Works, Jugraj Mechanic Works, Mano Meter India Pvt. Ltd., Satnam Fabricators, Shakunt Rubbers, The SondhFabrication Gram Udyog. These amounts are not due for payment as per the terms and conditions of the purchase order/contract.
19. The foreign currency exposure of the Company as on December 31, 2006 is as under:
a) Category- wise quantitative data
As at December 31, 2006 As at December 31, 2005
Nos. Currency Amount Nos. Currency Amount
Forward contracts against exports 4 USD 4,546,400 – –6 EUR 1,474,484 – –1 GBP 83,098 – –
Forward contracts against imports 8 USD 6,867,335 10 USD 2,463,3906 EUR 1,584,019 – –
b) All the derivative instruments are for hedging foreign exchange exposures against firm commitments and/or forecasted transactions.
2006 2005(Rs. in (Rs. in
thousands) thousands)
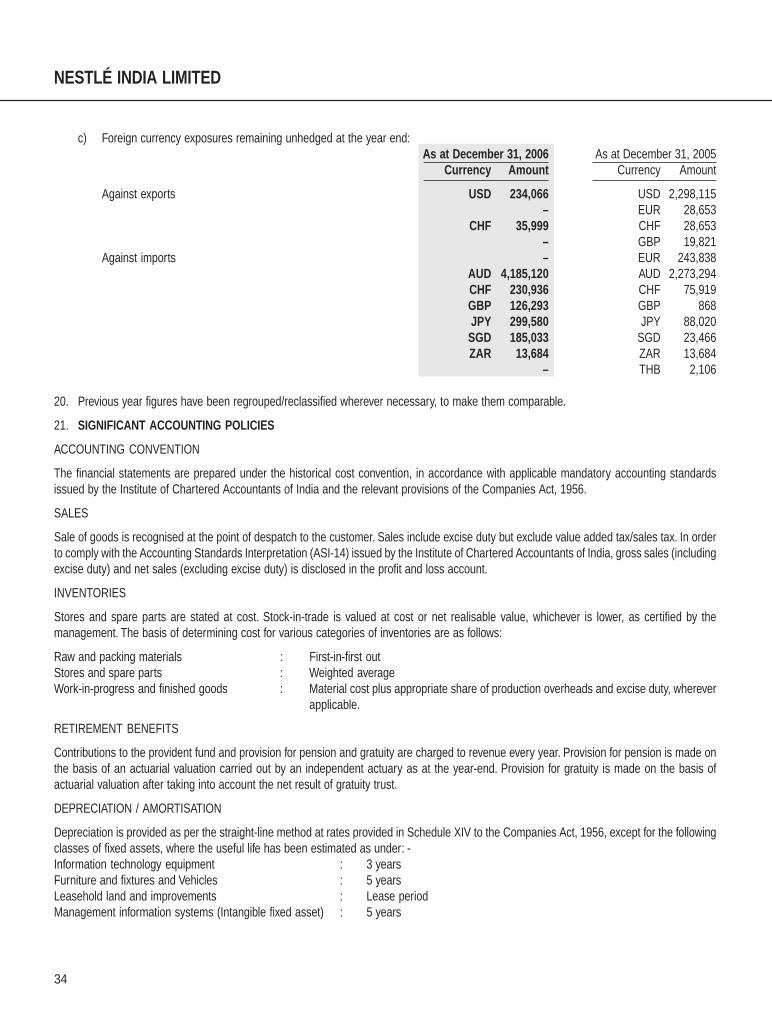
34
NESTLÉ INDIA LIMITED
c) Foreign currency exposures remaining unhedged at the year end:As at December 31, 2006 As at December 31, 2005
Currency Amount Currency Amount
Against exports USD 234,066 USD 2,298,115– EUR 28,653
CHF 35,999 CHF 28,653– GBP 19,821
Against imports – EUR 243,838AUD 4,185,120 AUD 2,273,294CHF 230,936 CHF 75,919GBP 126,293 GBP 868JPY 299,580 JPY 88,020SGD 185,033 SGD 23,466ZAR 13,684 ZAR 13,684
– THB 2,106
20. Previous year figures have been regrouped/reclassified wherever necessary, to make them comparable.
21. SIGNIFICANT ACCOUNTING POLICIES
ACCOUNTING CONVENTION
The financial statements are prepared under the historical cost convention, in accordance with applicable mandatory accounting standardsissued by the Institute of Chartered Accountants of India and the relevant provisions of the Companies Act, 1956.
SALES
Sale of goods is recognised at the point of despatch to the customer. Sales include excise duty but exclude value added tax/sales tax. In orderto comply with the Accounting Standards Interpretation (ASI-14) issued by the Institute of Chartered Accountants of India, gross sales (includingexcise duty) and net sales (excluding excise duty) is disclosed in the profit and loss account.
INVENTORIES
Stores and spare parts are stated at cost. Stock-in-trade is valued at cost or net realisable value, whichever is lower, as certified by themanagement. The basis of determining cost for various categories of inventories are as follows:
Raw and packing materials : First-in-first outStores and spare parts : Weighted averageWork-in-progress and finished goods : Material cost plus appropriate share of production overheads and excise duty, wherever
applicable.
RETIREMENT BENEFITS
Contributions to the provident fund and provision for pension and gratuity are charged to revenue every year. Provision for pension is made onthe basis of an actuarial valuation carried out by an independent actuary as at the year-end. Provision for gratuity is made on the basis ofactuarial valuation after taking into account the net result of gratuity trust.
DEPRECIATION / AMORTISATION
Depreciation is provided as per the straight-line method at rates provided in Schedule XIV to the Companies Act, 1956, except for the followingclasses of fixed assets, where the useful life has been estimated as under: -Information technology equipment : 3 yearsFurniture and fixtures and Vehicles : 5 yearsLeasehold land and improvements : Lease periodManagement information systems (Intangible fixed asset) : 5 years
35
IMPAIRMENT OF FIXED ASSETS
Consideration is given at each balance sheet date to determine whether there is any indication of impairment of the carrying amount of theCompany’s fixed assets. If any indication exists, an asset’s recoverable amount is estimated. An impairment loss is recognised whenever thecarrying amount of an asset exceeds its recoverable amount. The recoverable amount is the greater of the net selling price and value in use. Inassessing value in use, the estimated future cash flows are discounted to their present value based on an appropriate discount factor.
Reversal of impairment losses recognised in prior years is recorded when there is an indication that the impairment losses recognised for theasset no longer exist or have decreased. However, the increase in carrying amount of an asset due to reversal of an impairment loss isrecognised to the extent it does not exceed the carrying amount that would have been determined (net of depreciation) had no impairment lossbeen recognised for the asset in prior years.
TAXATION
The provision for taxation for the period comprises the residual tax liability for the assessment year 2006-2007 relevant to the period April 1,2005 to March 31, 2006 and the liability, which has accrued on the profit for the period April 1, 2006 to December 31, 2006.
Deferred tax is recognised, subject to the consideration of prudence, on timing difference, being the difference between taxable income andaccounting income that originate in one period and are capable of reversal in one or more subsequent periods.
CONTINGENT LIABILITIES AND PROVISIONS
Contingent liabilities are disclosed after a careful evaluation of the facts and legal aspects of the matter involved. Provisions are recognisedwhen the Company has a legal/constructive obligation and on management discretion as a result of a past event, for which it is probable that acash outflow may be required and a reliable estimate can be made of the amount of the obligation.
FIXED ASSETS
Fixed assets are stated at cost (net of CENVAT, wherever applicable) less accumulated depreciation. Cost is inclusive of freight, duties, leviesand any directly attributable cost of bringing the assets to their working condition for intended use.
An intangible asset is measured at cost and amortised so as to reflect the pattern in which the asset’s economic benefits are consumed.
INVESTMENTS
Investments are classified into current and long-term investments. Current investments are stated at the lower of cost and fair value. Long-terminvestments are stated at cost.
FOREIGN EXCHANGE TRANSACTIONS
Transactions in foreign currency are recorded on initial recognition at the exchange rate prevailing at the time of the transaction.
Monetary items (i.e. receivables, payables, loans etc.) denominated in foreign currency are reported using the closing exchange rate on eachbalance sheet date.
The exchange difference arising on the settlement of monetary items or on reporting these items at rates different from rates at which thesewere initially recorded/reported in previous financial statements are recognised as income/expense in the period in which they arise exceptwhere the foreign currency liabilities have been incurred in connection with fixed assets acquired up to March 31, 2004 and subsequent theretoin case of fixed assets acquired from a country outside India, where exchange difference are adjusted in the carrying amount of fixed assets.
In case of forward exchange contracts, the premium or discount arising at the inception of such contracts, is amortised as income or expenseover the life of contract as well as exchange difference on such contracts i.e. difference between the exchange rate at the reporting/settlementdate and the exchange rate on the date of inception/the last reporting date, is recognised as income/expense for the period except where theforeign currency liabilities have been incurred in connection with fixed assets acquired up to March 31, 2004 and subsequent thereto in case offixed assets acquired from a country outside India, where the exchange differences are adjusted in the carrying amount of the fixed assets.
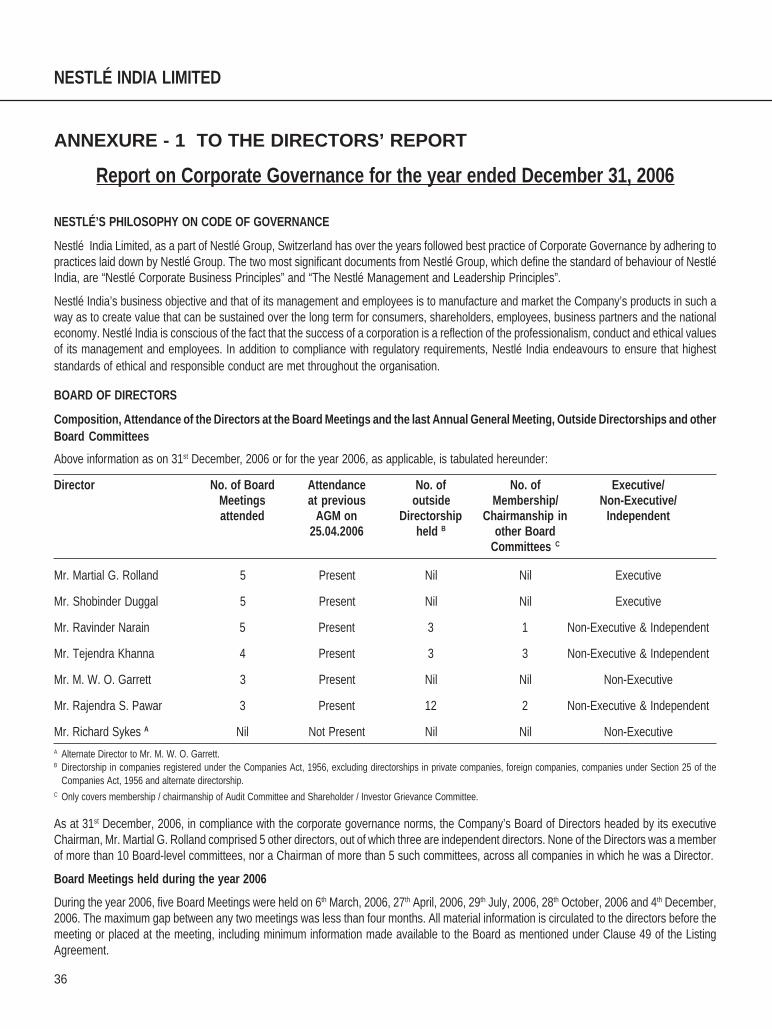
36
NESTLÉ INDIA LIMITED
ANNEXURE - 1 TO THE DIRECTORS’ REPORT
Report on Corporate Governance for the year ended December 31, 2006
NESTLÉ’S PHILOSOPHY ON CODE OF GOVERNANCE
Nestlé India Limited, as a part of Nestlé Group, Switzerland has over the years followed best practice of Corporate Governance by adhering topractices laid down by Nestlé Group. The two most significant documents from Nestlé Group, which define the standard of behaviour of NestléIndia, are “Nestlé Corporate Business Principles” and “The Nestlé Management and Leadership Principles”.
Nestlé India’s business objective and that of its management and employees is to manufacture and market the Company’s products in such away as to create value that can be sustained over the long term for consumers, shareholders, employees, business partners and the nationaleconomy. Nestlé India is conscious of the fact that the success of a corporation is a reflection of the professionalism, conduct and ethical valuesof its management and employees. In addition to compliance with regulatory requirements, Nestlé India endeavours to ensure that higheststandards of ethical and responsible conduct are met throughout the organisation.
BOARD OF DIRECTORS
Composition, Attendance of the Directors at the Board Meetings and the last Annual General Meeting, Outside Directorships and otherBoard Committees
Above information as on 31st December, 2006 or for the year 2006, as applicable, is tabulated hereunder:
Director No. of Board Attendance No. of No. of Executive/Meetings at previous outside Membership/ Non-Executive/attended AGM on Directorship Chairmanship in Independent
25.04.2006 held B other BoardCommittees C
Mr. Martial G. Rolland 5 Present Nil Nil Executive
Mr. Shobinder Duggal 5 Present Nil Nil Executive
Mr. Ravinder Narain 5 Present 3 1 Non-Executive & Independent
Mr. Tejendra Khanna 4 Present 3 3 Non-Executive & Independent
Mr. M. W. O. Garrett 3 Present Nil Nil Non-Executive
Mr. Rajendra S. Pawar 3 Present 12 2 Non-Executive & Independent
Mr. Richard Sykes A Nil Not Present Nil Nil Non-ExecutiveA Alternate Director to Mr. M. W. O. Garrett.B Directorship in companies registered under the Companies Act, 1956, excluding directorships in private companies, foreign companies, companies under Section 25 of the
Companies Act, 1956 and alternate directorship.C Only covers membership / chairmanship of Audit Committee and Shareholder / Investor Grievance Committee.
As at 31st December, 2006, in compliance with the corporate governance norms, the Company’s Board of Directors headed by its executiveChairman, Mr. Martial G. Rolland comprised 5 other directors, out of which three are independent directors. None of the Directors was a memberof more than 10 Board-level committees, nor a Chairman of more than 5 such committees, across all companies in which he was a Director.
Board Meetings held during the year 2006
During the year 2006, five Board Meetings were held on 6th March, 2006, 27th April, 2006, 29th July, 2006, 28th October, 2006 and 4th December,2006. The maximum gap between any two meetings was less than four months. All material information is circulated to the directors before themeeting or placed at the meeting, including minimum information made available to the Board as mentioned under Clause 49 of the ListingAgreement.
37
The Company has established procedures to enable the Board to periodically review compliance reports of laws applicable to the Company,prepared by the Company as well as steps taken by the Company to rectify instances of non-compliances. The Board reviewed the reportsprepared by the Company on half yearly periodicity.
Compliance with the Code of Conduct
The Company has adopted a “Code of Conduct for the Directors and Senior Management”. The Code is available on the official website of theCompany www.nestle.in.
It is hereby affirmed that the Directors and Senior Management have given an annual affirmation of compliance with the code of conduct duringthe year 2006.
AUDIT COMMITTEE
The powers, role and terms of reference of the Audit Committee covers the areas as mentioned under Clause 49 of the Listing Agreement andSection 292A of the Companies Act, 1956 besides other terms as may be referred by the Board of Directors. These include oversight of Company’sfinancial reporting process and disclosure of financial information to ensure that the financial statement is correct, sufficient and credible;recommending the appointment and removal of external auditor, fixation of audit fee and approval of payment for other services; discussing withinternal auditors any significant findings and follow up there on; reviewing annual and quarterly financial statements with management beforesubmission to the Board; reviewing the adequacy of internal control systems with management, external and internal auditors and reviewing theCompany’s financial risk and management policies.
The Audit Committee comprises of Mr. Tejendra Khanna (Chairman), Mr. Ravinder Narain and Mr. Rajendra S. Pawar, all being Non-Executiveand Independent Directors. All members of the Audit Committee are financially literate and both Mr. Tejendra Khanna and Mr. Rajendra S. Pawar,have related financial management expertise by virtue of their comparable experience and background. Mr. B. Murli, Company Secretary, actsas the Secretary to the Committee.
The Audit Committee met five times during the year 2006 on 21st February, 2006, 6th March, 2006, 27th April, 2006, 29th July, 2006 and 28th October,2006. All members of the Committee attended the aforesaid meetings except for the Audit Committee Meeting held on 27th April, 2006, in whichMr. Rajendra S. Pawar was granted leave of absence. The maximum gap between any two meetings was less than four months.
SHAREHOLDER/INVESTOR GRIEVANCE COMMITTEE
The Shareholder / Investor Grievance Committee oversees redressal of shareholder and investor grievances, transfer of shares, non-receipt ofbalance sheet, non-receipt of declared dividends and related matters.
Mr. Ravinder Narain, a Non-Executive and Independent Director, is the Chairman of the Shareholder/ Investor Grievance Committee. The othermember is the Managing Director, Mr. Martial G. Rolland. Mr. B. Murli, Company Secretary is the Compliance Officer. The Committee met fourtimes during the year on 9th January, 2006, 10th April 2006, 29th July, 2006 and 28th October, 2006. All members of the Committee attended theaforesaid meetings.
During the year 2006, 22 complaints were received from shareholders and investors. All the complaints have generally been solved to thesatisfaction of the complainants and no investor complaint was pending at the beginning or at the end of the year. The Company has acted uponall valid requests for share transfer received during 2006 and no such transfer is pending.
REMUNERATION COMMITTEE
Matters of remuneration of Executive Directors are considered by the Board of Directors of the Company, with the interested Executive Director(s),not participating or voting. The terms of remuneration of Executive Directors are approved by the shareholders at the Annual General Meeting.Therefore, no separate Remuneration Committee has been constituted.
The remuneration of Non-Executive Directors is decided by the Board of Directors as per the terms approved by the shareholders at the AnnualGeneral Meeting.
The remuneration policy of the Company is to remain competitive in the industry to attract and retain talent and appropriately reward employeeson their contributions.
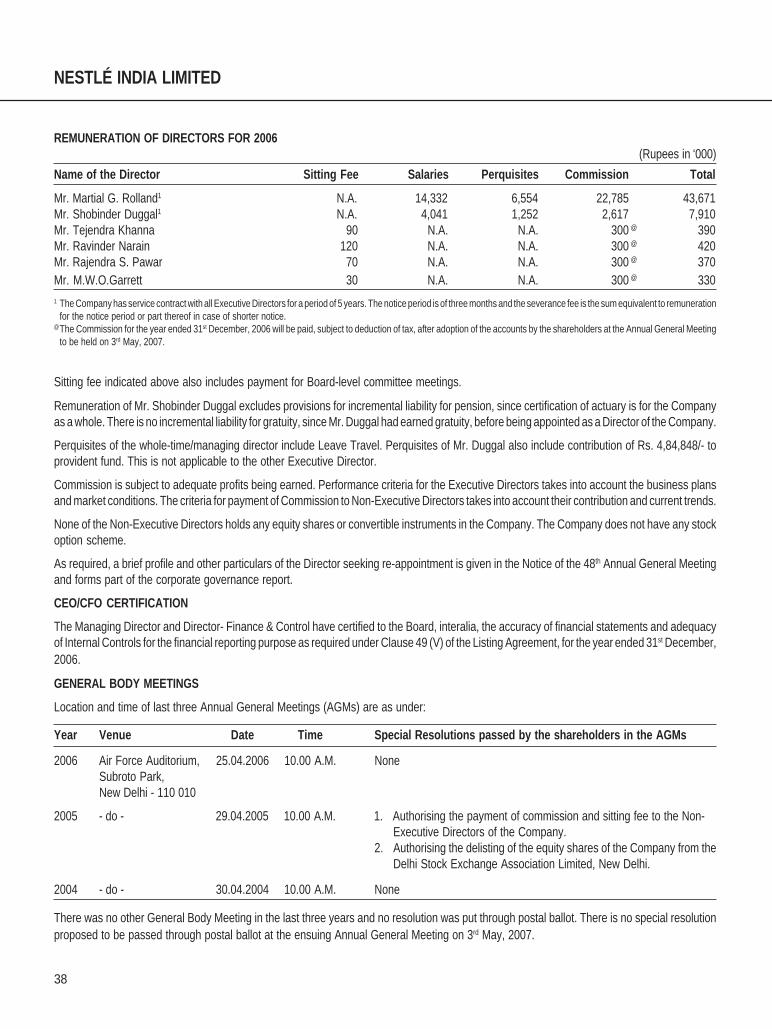
38
NESTLÉ INDIA LIMITED
REMUNERATION OF DIRECTORS FOR 2006 (Rupees in ‘000)
Name of the Director Sitting Fee Salaries Perquisites Commission Total
Mr. Martial G. Rolland1 N.A. 14,332 6,554 22,785 43,671Mr. Shobinder Duggal1 N.A. 4,041 1,252 2,617 7,910Mr. Tejendra Khanna 90 N.A. N.A. 300 @ 390Mr. Ravinder Narain 120 N.A. N.A. 300 @ 420Mr. Rajendra S. Pawar 70 N.A. N.A. 300 @ 370Mr. M.W.O.Garrett 30 N.A. N.A. 300 @ 3301 The Company has service contract with all Executive Directors for a period of 5 years. The notice period is of three months and the severance fee is the sum equivalent to remuneration
for the notice period or part thereof in case of shorter notice.@The Commission for the year ended 31st December, 2006 will be paid, subject to deduction of tax, after adoption of the accounts by the shareholders at the Annual General Meeting
to be held on 3rd May, 2007.
Sitting fee indicated above also includes payment for Board-level committee meetings.
Remuneration of Mr. Shobinder Duggal excludes provisions for incremental liability for pension, since certification of actuary is for the Companyas a whole. There is no incremental liability for gratuity, since Mr. Duggal had earned gratuity, before being appointed as a Director of the Company.
Perquisites of the whole-time/managing director include Leave Travel. Perquisites of Mr. Duggal also include contribution of Rs. 4,84,848/- toprovident fund. This is not applicable to the other Executive Director.
Commission is subject to adequate profits being earned. Performance criteria for the Executive Directors takes into account the business plansand market conditions. The criteria for payment of Commission to Non-Executive Directors takes into account their contribution and current trends.
None of the Non-Executive Directors holds any equity shares or convertible instruments in the Company. The Company does not have any stockoption scheme.
As required, a brief profile and other particulars of the Director seeking re-appointment is given in the Notice of the 48th Annual General Meetingand forms part of the corporate governance report.
CEO/CFO CERTIFICATION
The Managing Director and Director- Finance & Control have certified to the Board, interalia, the accuracy of financial statements and adequacyof Internal Controls for the financial reporting purpose as required under Clause 49 (V) of the Listing Agreement, for the year ended 31st December,2006.
GENERAL BODY MEETINGS
Location and time of last three Annual General Meetings (AGMs) are as under:
Year Venue Date Time Special Resolutions passed by the shareholders in the AGMs
2006 Air Force Auditorium, 25.04.2006 10.00 A.M. NoneSubroto Park,New Delhi - 110 010
2005 - do - 29.04.2005 10.00 A.M. 1. Authorising the payment of commission and sitting fee to the Non-Executive Directors of the Company.
2. Authorising the delisting of the equity shares of the Company from theDelhi Stock Exchange Association Limited, New Delhi.
2004 - do - 30.04.2004 10.00 A.M. None
There was no other General Body Meeting in the last three years and no resolution was put through postal ballot. There is no special resolutionproposed to be passed through postal ballot at the ensuing Annual General Meeting on 3rd May, 2007.
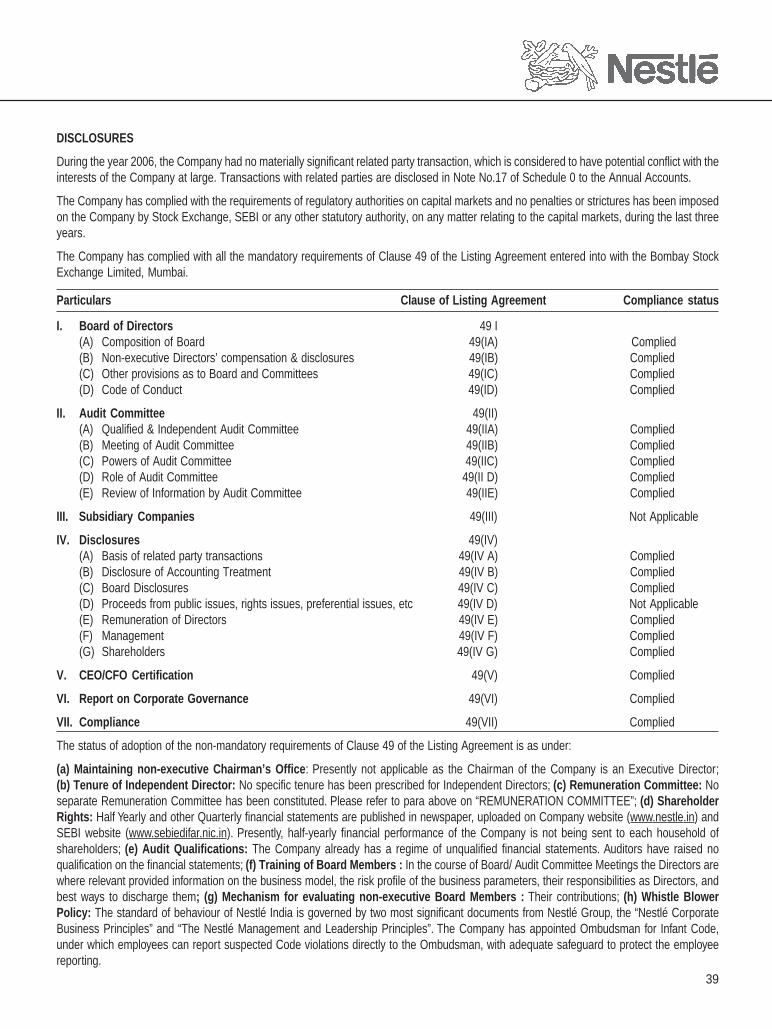
39
DISCLOSURES
During the year 2006, the Company had no materially significant related party transaction, which is considered to have potential conflict with theinterests of the Company at large. Transactions with related parties are disclosed in Note No.17 of Schedule 0 to the Annual Accounts.
The Company has complied with the requirements of regulatory authorities on capital markets and no penalties or strictures has been imposedon the Company by Stock Exchange, SEBI or any other statutory authority, on any matter relating to the capital markets, during the last threeyears.
The Company has complied with all the mandatory requirements of Clause 49 of the Listing Agreement entered into with the Bombay StockExchange Limited, Mumbai.
Particulars Clause of Listing Agreement Compliance status
I. Board of Directors 49 I(A) Composition of Board 49(IA) Complied(B) Non-executive Directors’ compensation & disclosures 49(IB) Complied(C) Other provisions as to Board and Committees 49(IC) Complied(D) Code of Conduct 49(ID) Complied
II. Audit Committee 49(II)(A) Qualified & Independent Audit Committee 49(IIA) Complied(B) Meeting of Audit Committee 49(IIB) Complied(C) Powers of Audit Committee 49(IIC) Complied(D) Role of Audit Committee 49(II D) Complied(E) Review of Information by Audit Committee 49(IIE) Complied
III. Subsidiary Companies 49(III) Not Applicable
IV. Disclosures 49(IV)(A) Basis of related party transactions 49(IV A) Complied(B) Disclosure of Accounting Treatment 49(IV B) Complied(C) Board Disclosures 49(IV C) Complied(D) Proceeds from public issues, rights issues, preferential issues, etc 49(IV D) Not Applicable(E) Remuneration of Directors 49(IV E) Complied(F) Management 49(IV F) Complied(G) Shareholders 49(IV G) Complied
V. CEO/CFO Certification 49(V) Complied
VI. Report on Corporate Governance 49(VI) Complied
VII. Compliance 49(VII) Complied
The status of adoption of the non-mandatory requirements of Clause 49 of the Listing Agreement is as under:
(a) Maintaining non-executive Chairman’s Office: Presently not applicable as the Chairman of the Company is an Executive Director;(b) Tenure of Independent Director: No specific tenure has been prescribed for Independent Directors; (c) Remuneration Committee: Noseparate Remuneration Committee has been constituted. Please refer to para above on “REMUNERATION COMMITTEE”; (d) ShareholderRights: Half Yearly and other Quarterly financial statements are published in newspaper, uploaded on Company website (www.nestle.in) andSEBI website (www.sebiedifar.nic.in). Presently, half-yearly financial performance of the Company is not being sent to each household ofshareholders; (e) Audit Qualifications: The Company already has a regime of unqualified financial statements. Auditors have raised noqualification on the financial statements; (f) Training of Board Members : In the course of Board/ Audit Committee Meetings the Directors arewhere relevant provided information on the business model, the risk profile of the business parameters, their responsibilities as Directors, andbest ways to discharge them; (g) Mechanism for evaluating non-executive Board Members : Their contributions; (h) Whistle BlowerPolicy: The standard of behaviour of Nestlé India is governed by two most significant documents from Nestlé Group, the “Nestlé CorporateBusiness Principles” and “The Nestlé Management and Leadership Principles”. The Company has appointed Ombudsman for Infant Code,under which employees can report suspected Code violations directly to the Ombudsman, with adequate safeguard to protect the employeereporting.
40
NESTLÉ INDIA LIMITED
MEANS OF COMMUNICATION
The Quarterly, Half Yearly and Annual Results are generally published by the Company in all editions of the Financial Express and in Jansatta,Delhi.
As per the requirement of Clause 51 of the Listing Agreement, all the data related to financial results, shareholding pattern etc. are posted onthe SEBI’s EDIFAR System and the same can be viewed on the SEBI’s website www.sebiedifar.nic.in.
The domain name of the Company’s website is www.nestle.in and up-to-date financial results, official press releases, presentations to analystsand institutional investors and other general information about the Company, is available on this website.
The presentations made to the institutional investors or analysts, if any, are not communicated to individual shareholders of the Company.However, in addition to uploading on the official website of the Company, the presentations are sent to the Stock Exchange for dissemination.
MANAGEMENT DISCUSSION AND ANALYSIS REPORT(within the limits set by the Company’s competitive position)
Industry structure and developments, opportunities and threats, segment wise or product-wise performance, outlook, risks and concerns of theCompany and discussion on financial performance with respect to the operational performance, has been covered in the Directors’ Report – morespecifically under the sections on Financial Results and Operations, Exports, Business Development and SWOT Analysis of the Company.
The Company has an adequate system of internal controls to ensure that transactions are properly recorded, authorised and reported apart fromsafeguarding its assets. The internal control system is supplemented by well-documented policies, guidelines and procedures and review carriedout by the Company’s internal audit function, which submits reports periodically to the Management and the Audit Committee of the Board.
In order to foster an improved controls culture in the Company, wherein every employee is fully aware of all the major risk/controls faced in his/her work sphere and assumes responsibility for the controls performed therein, the Company has implemented a tool called “Controls Manager”which works on the basic concept of Control Self Assessment. The self assessments by process / control owner is also used as the basis ofCEO/CFO certification as required under Clause 49 of the Listing Agreement with the Bombay Stock Exchange.
There has been no material development in Human Resources/Industrial relations during the period covered by this Annual Report.Your Company has a favourable work environment that motivates performance, customer focus and innovation while adhering to the highestdegree of quality and integrity. As part of manpower development and training and with an aim to enhance operational efficiency, employees ofthe Company have been sent on postings and assignments to the other Nestlé Group Companies.
Manpower figure of the Company as on 31st December, 2006 was 3,502.
GENERAL SHAREHOLDER INFORMATIONAnnual General MeetingDate and Time: : 3rd May, 2007 at 9.30 a.m.Venue : Air Force Auditorium, Subroto Park, New Delhi – 110 010.
Financial Calender, 2007 :First Quarter Results : Last week April, 2007Second Quarter and Half Yearly Results : Last week July, 2007Third Quarter Results : Last week October, 2007Annual Results : March, 2008
Financial Year : 1st January to 31st December
Date of Book Closure : 27th April, 2007 to 3rd May, 2007, both days inclusive.
Dividend payment date: Three Interim Dividends were declared for the year 2006, first at the rate of Rs. 6/- per share, second at the rate ofRs. 18/- per share and the third at the rate of Rs.1.50 per equity share. The first and second interim dividends were paid on and from 9th May,2006 and 21st December, 2006, respectively, while the third interim dividend shall be paid on and from 29th March, 2007.
Outstanding ADRs / GDRs / Warrants or any convertible instruments, conversion date and likely impact on equity:
Not applicable.
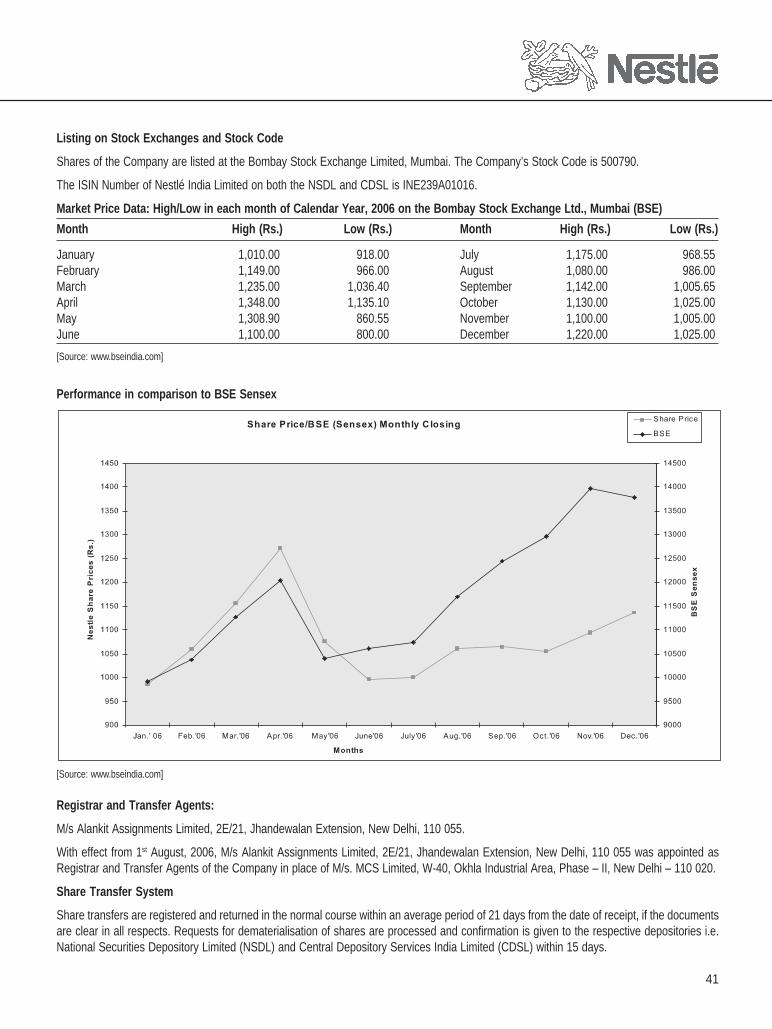
41
Listing on Stock Exchanges and Stock Code
Shares of the Company are listed at the Bombay Stock Exchange Limited, Mumbai. The Company’s Stock Code is 500790.
The ISIN Number of Nestlé India Limited on both the NSDL and CDSL is INE239A01016.
Market Price Data: High/Low in each month of Calendar Year, 2006 on the Bombay Stock Exchange Ltd., Mumbai (BSE)
Month High (Rs.) Low (Rs.) Month High (Rs.) Low (Rs.)
January 1,010.00 918.00 July 1,175.00 968.55 February 1,149.00 966.00 August 1,080.00 986.00 March 1,235.00 1,036.40 September 1,142.00 1,005.65 April 1,348.00 1,135.10 October 1,130.00 1,025.00 May 1,308.90 860.55 November 1,100.00 1,005.00 June 1,100.00 800.00 December 1,220.00 1,025.00
[Source: www.bseindia.com]
Performance in comparison to BSE Sensex
[Source: www.bseindia.com]
Registrar and Transfer Agents:
M/s Alankit Assignments Limited, 2E/21, Jhandewalan Extension, New Delhi, 110 055.
With effect from 1st August, 2006, M/s Alankit Assignments Limited, 2E/21, Jhandewalan Extension, New Delhi, 110 055 was appointed asRegistrar and Transfer Agents of the Company in place of M/s. MCS Limited, W-40, Okhla Industrial Area, Phase – II, New Delhi – 110 020.
Share Transfer System
Share transfers are registered and returned in the normal course within an average period of 21 days from the date of receipt, if the documentsare clear in all respects. Requests for dematerialisation of shares are processed and confirmation is given to the respective depositories i.e.National Securities Depository Limited (NSDL) and Central Depository Services India Limited (CDSL) within 15 days.
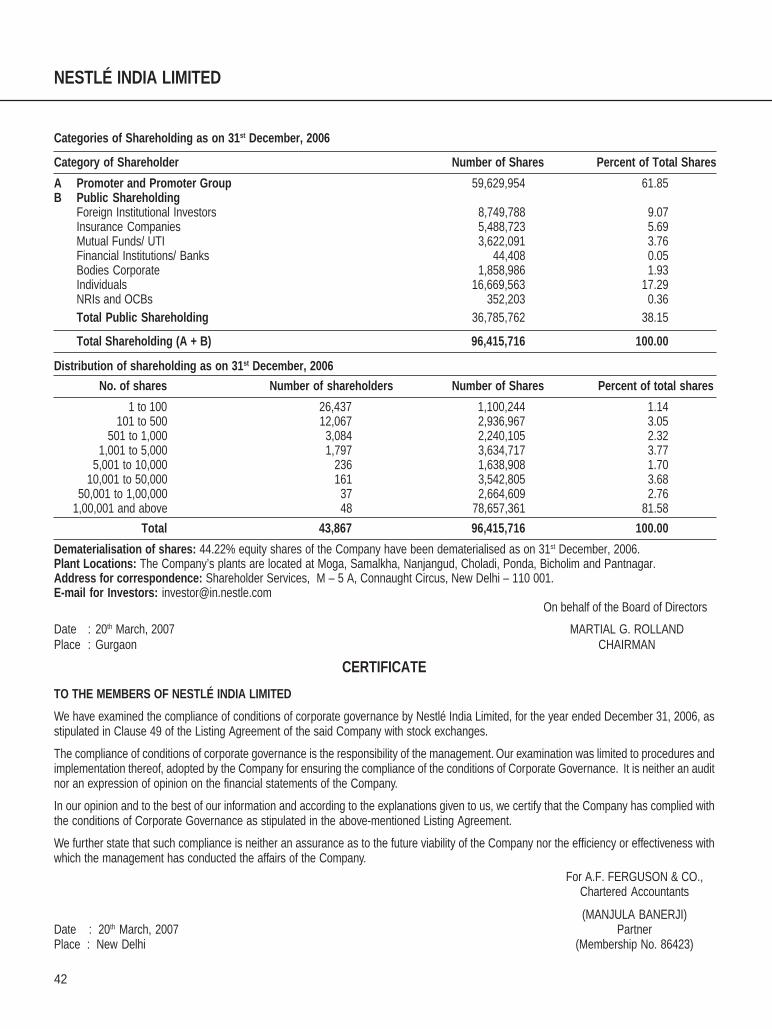
42
NESTLÉ INDIA LIMITED
Categories of Shareholding as on 31st December, 2006
Category of Shareholder Number of Shares Percent of Total Shares
A Promoter and Promoter Group 59,629,954 61.85B Public Shareholding
Foreign Institutional Investors 8,749,788 9.07Insurance Companies 5,488,723 5.69Mutual Funds/ UTI 3,622,091 3.76Financial Institutions/ Banks 44,408 0.05Bodies Corporate 1,858,986 1.93Individuals 16,669,563 17.29NRIs and OCBs 352,203 0.36Total Public Shareholding 36,785,762 38.15
Total Shareholding (A + B) 96,415,716 100.00
Distribution of shareholding as on 31st December, 2006
No. of shares Number of shareholders Number of Shares Percent of total shares
1 to 100 26,437 1,100,244 1.14101 to 500 12,067 2,936,967 3.05
501 to 1,000 3,084 2,240,105 2.321,001 to 5,000 1,797 3,634,717 3.77
5,001 to 10,000 236 1,638,908 1.7010,001 to 50,000 161 3,542,805 3.68
50,001 to 1,00,000 37 2,664,609 2.761,00,001 and above 48 78,657,361 81.58
Total 43,867 96,415,716 100.00
Dematerialisation of shares: 44.22% equity shares of the Company have been dematerialised as on 31st December, 2006.Plant Locations: The Company’s plants are located at Moga, Samalkha, Nanjangud, Choladi, Ponda, Bicholim and Pantnagar.Address for correspondence: Shareholder Services, M – 5 A, Connaught Circus, New Delhi – 110 001.E-mail for Investors: [email protected]
On behalf of the Board of Directors
Date : 20th March, 2007 MARTIAL G. ROLLANDPlace : Gurgaon CHAIRMAN
CERTIFICATE
TO THE MEMBERS OF NESTLÉ INDIA LIMITED
We have examined the compliance of conditions of corporate governance by Nestlé India Limited, for the year ended December 31, 2006, asstipulated in Clause 49 of the Listing Agreement of the said Company with stock exchanges.
The compliance of conditions of corporate governance is the responsibility of the management. Our examination was limited to procedures andimplementation thereof, adopted by the Company for ensuring the compliance of the conditions of Corporate Governance. It is neither an auditnor an expression of opinion on the financial statements of the Company.
In our opinion and to the best of our information and according to the explanations given to us, we certify that the Company has complied withthe conditions of Corporate Governance as stipulated in the above-mentioned Listing Agreement.
We further state that such compliance is neither an assurance as to the future viability of the Company nor the efficiency or effectiveness withwhich the management has conducted the affairs of the Company.
For A.F. FERGUSON & CO.,Chartered Accountants
(MANJULA BANERJI)Date : 20th March, 2007 PartnerPlace : New Delhi (Membership No. 86423)
43
Information as required under Section 217(1)(e) ofthe Companies Act, 1956 read with the Companies(Disclosure of Particulars in the Report of Board ofDirectors) Rules, 1988 forming part of Directors’Report for the year ended 31st December, 2006.
A. CONSERVATION OF ENERGY
(a) Energy Conservation Measures TakenDuring the year, the Company continued to stressupon the measures for the conservation and optimalutilisation of energy in all the areas of operations,including those for energy generation and effectiveusage of sources / equipment used for generation.The significant measures taken/continued during2006, which have contributed to energyconservation, were:• Improvement in steam generation ratio (Steam/
Fuel ratio) by improving steam condensaterecovery; stack losses and lower blow downlosses.
• Continued usage of non-conventional fuelscomprising coconut shells, spent coffee/ teawaste to substitute coal usage.
• Grid power utilisation maximised over captivepower usage.
• Usage of Superior Kerosene Oil for roasters,in place of Diesel and Light Diesel Oil.
• Usage of air pre-heater in boiler for betterefficiency (heat recovery).
• Hot air generation cost optimised by partialsubstitution with low priced heat source (fromoil fired source to coal/coconut/coffee wastefired heat generating source).
• Heat recovery in inert gas generation and fromroasting operations.
• Utilisation of Reverse Osmosis Plant for themake up water in boiler operations, resulting inreduction of blow down losses.
• Installation of Wiped Film Evaporator (WFE) incoffee processing for energy saving.
• Continuous energy review by internal expertsto track the inefficient equipments and phasethem out in planned manner e.g. old aircompressors were phased out and replacedwith energy efficient air compressors.
• Tracking and trending of all energy usage forcontinuous improvements.
• Adoption of new Cleaning-in Process (CIP)technology for the milk processing operationsresulting in less water consumption.
• Usage of treated water for gardening andplantation.
• Optimisation of power usage in waste waterplant.
• Improvement in Power Factor through autooperation of capacitor banks and installationof energy efficient equipments/ lightings.
• Installation of variable frequency drives onhigh capacity motors.
• Installation of equipment with less specificpower consumption for the fuel feeding systemto boiler.
• Installation of Spray Dryers for pre-heating ofprimary air with steam, thereby reducing theusage of Heavy Petroleum Stock for hot airgeneration.
• Installation of Desuper Heating System inChilled Water Plant for heat recovery.
(b) Additional Investment
Following proposals are at various stages ofimplementation:• Installation of incinerator with Wet Scrubber.• Installation of centrifuge filters for Heavy
Petroleum Stock and Furnace Oil forimprovement in fuel consumption.
• Enhancing the capacity of waste watertreatment plant.
• Expansion/ Improvement of effluent treatmentplants.
• Installation of Reverse Osmosis Plant for therecycling of the waste water.
(c) Impact of the measures at (a) and (b) abovefor reduction of energy consumption andconsequent impact on the cost of productionof goods.The measures taken during 2006, includingmeasures initiated in the past in the above directionhave facilitated efforts for conservation of energyand helped contain the energy costs.
(d) Energy consumptionTotal energy consumption and energy consumptionper unit of production, as per prescribed Form Atogether with the comparative figures for 2005, aregiven at the end of this part. The Companymanufactures varieties of products each of themusing a combination of various sources of energyin different proportions. Therefore the comparisonas mentioned in Form A, does not truly reflect theefforts of the Company at reducing consumption interms of units of consumption.
B. TECHNOLOGY ABSORPTIONEfforts made in technology absorption as perForm B are furnished below.
Research & Development (R&D)
1. Specific areas in which R&D carried out by theCompany
Your Company as a part of Nestlé Group andunder the General Licence Agreement has accessto and advantage of drawing from the extensivecentral Research and Development efforts andactivities of the Nestlé Group. Nestlé Groupspends enormous amounts and efforts in research
and development and in gaining industrialexperiences. It has therefore been possible foryour Company to focus its efforts on testing andmodification of products for local conditions.Improving and maintaining the quality of certainkey raw materials also continued to receive closeattention.
2. Benefits derived as a result of the above R&DThe ability to leverage the Research andDevelopment (R&D) expertise and knowledge ofNestlé Group, has helped your Company toinnovate and renovate, manufacture high qualityand safe products, improve yields, input substitutionand achieve more efficient operations.Consequently the consumers perceive the productsof your Company as a high value for their money.
3. Future plan of actionSteps are continuously being taken for innovationand renovation of products including new productdevelopment, improvement of packaging andenhancement of product quality / profile, to offerbetter products at relatively affordable prices tothe consumers.
4. Expenditure on R&D
Your Company benefits from the extensivecentralised Research & Development (R&D)activity and expenditure of the Nestlé Group, at anannual outlay around 1.7 billion Swiss Francs.Expenditure of the Company in the nature ofResearch and Development are those incurredlocally, primarily relating to testing and modifyingof products for local conditions and are as under:
(Rs. in thousands)a) Capital 34,798b) Recurring 89,331c) Total 124,129d) Total R&D as a percentage
of total turnover. 0.44%
Technology absorption, adaptation andinnovation
1. Efforts, in brief, made towards technologyabsorption, adoption and innovation
As a result of the Company’s ongoing access tothe international technology from Nestlé Group,Switzerland, the Company absorbs and adaptsthe technologies on a continuous basis to meet itsspecific needs from time to time.
2. Benefits derived as a result of the above effortsProduct innovation and renovation, improvementin yield, product quality, input substitution, costeffectiveness and energy conservation are themajor benefits.
ANNEXURE - 2 TO THE DIRECTORS’ REPORT
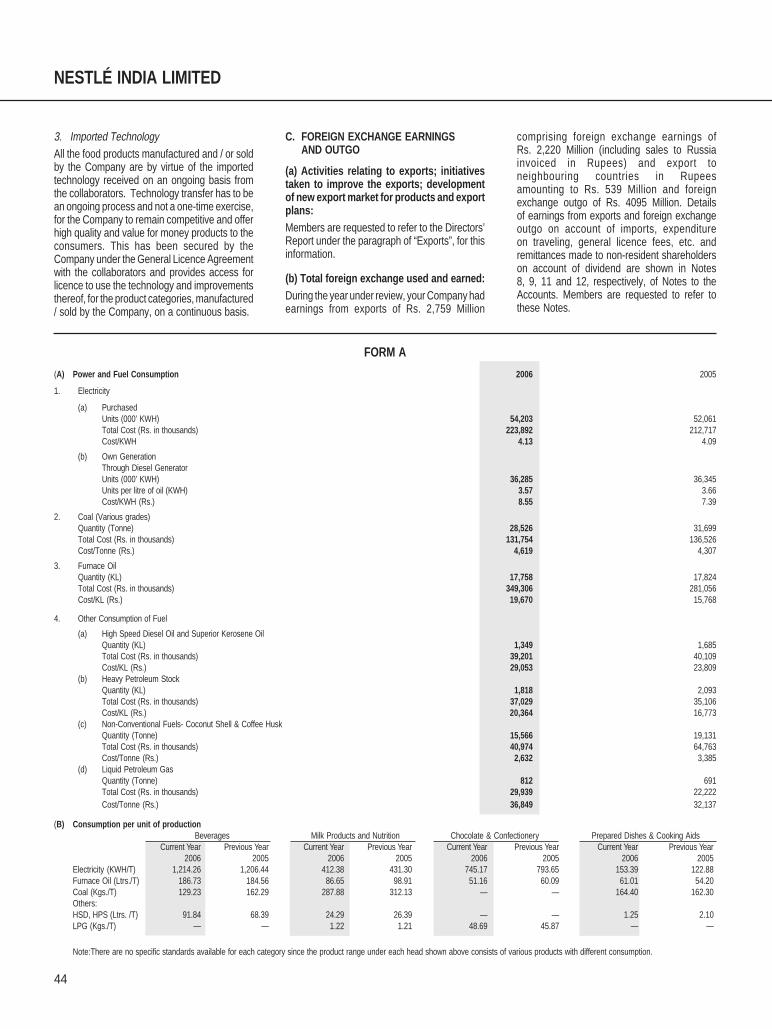
44
NESTLÉ INDIA LIMITED
3. Imported TechnologyAll the food products manufactured and / or soldby the Company are by virtue of the importedtechnology received on an ongoing basis fromthe collaborators. Technology transfer has to bean ongoing process and not a one-time exercise,for the Company to remain competitive and offerhigh quality and value for money products to theconsumers. This has been secured by theCompany under the General Licence Agreementwith the collaborators and provides access forlicence to use the technology and improvementsthereof, for the product categories, manufactured/ sold by the Company, on a continuous basis.
C. FOREIGN EXCHANGE EARNINGSAND OUTGO
(a) Activities relating to exports; initiativestaken to improve the exports; developmentof new export market for products and exportplans:Members are requested to refer to the Directors’Report under the paragraph of “Exports”, for thisinformation.
(b) Total foreign exchange used and earned:During the year under review, your Company hadearnings from exports of Rs. 2,759 Million
comprising foreign exchange earnings ofRs. 2,220 Million (including sales to Russiainvoiced in Rupees) and export toneighbouring countries in Rupeesamounting to Rs. 539 Million and foreignexchange outgo of Rs. 4095 Million. Detailsof earnings from exports and foreign exchangeoutgo on account of imports, expenditureon traveling, general licence fees, etc. andremittances made to non-resident shareholderson account of dividend are shown in Notes8, 9, 11 and 12, respectively, of Notes to theAccounts. Members are requested to refer tothese Notes.
FORM A
(A) Power and Fuel Consumption 2006 2005
1. Electricity
(a) PurchasedUnits (000’ KWH) 54,203 52,061Total Cost (Rs. in thousands) 223,892 212,717Cost/KWH 4.13 4.09
(b) Own GenerationThrough Diesel GeneratorUnits (000’ KWH) 36,285 36,345Units per litre of oil (KWH) 3.57 3.66Cost/KWH (Rs.) 8.55 7.39
2. Coal (Various grades)Quantity (Tonne) 28,526 31,699Total Cost (Rs. in thousands) 131,754 136,526Cost/Tonne (Rs.) 4,619 4,307
3. Furnace OilQuantity (KL) 17,758 17,824Total Cost (Rs. in thousands) 349,306 281,056Cost/KL (Rs.) 19,670 15,768
4. Other Consumption of Fuel
(a) High Speed Diesel Oil and Superior Kerosene OilQuantity (KL) 1,349 1,685Total Cost (Rs. in thousands) 39,201 40,109Cost/KL (Rs.) 29,053 23,809
(b) Heavy Petroleum StockQuantity (KL) 1,818 2,093Total Cost (Rs. in thousands) 37,029 35,106Cost/KL (Rs.) 20,364 16,773
(c) Non-Conventional Fuels- Coconut Shell & Coffee HuskQuantity (Tonne) 15,566 19,131Total Cost (Rs. in thousands) 40,974 64,763Cost/Tonne (Rs.) 2,632 3,385
(d) Liquid Petroleum GasQuantity (Tonne) 812 691Total Cost (Rs. in thousands) 29,939 22,222Cost/Tonne (Rs.) 36,849 32,137
(B) Consumption per unit of productionBeverages Milk Products and Nutrition Chocolate & Confectionery Prepared Dishes & Cooking Aids
Current Year Previous Year Current Year Previous Year Current Year Previous Year Current Year Previous Year2006 2005 2006 2005 2006 2005 2006 2005
Electricity (KWH/T) 1,214.26 1,206.44 412.38 431.30 745.17 793.65 153.39 122.88Furnace Oil (Ltrs./T) 186.73 184.56 86.65 98.91 51.16 60.09 61.01 54.20Coal (Kgs./T) 129.23 162.29 287.88 312.13 — — 164.40 162.30Others:HSD, HPS (Ltrs. /T) 91.84 68.39 24.29 26.39 — — 1.25 2.10LPG (Kgs./T) — — 1.22 1.21 48.69 45.87 — —
Note:There are no specific standards available for each category since the product range under each head shown above consists of various products with different consumption.
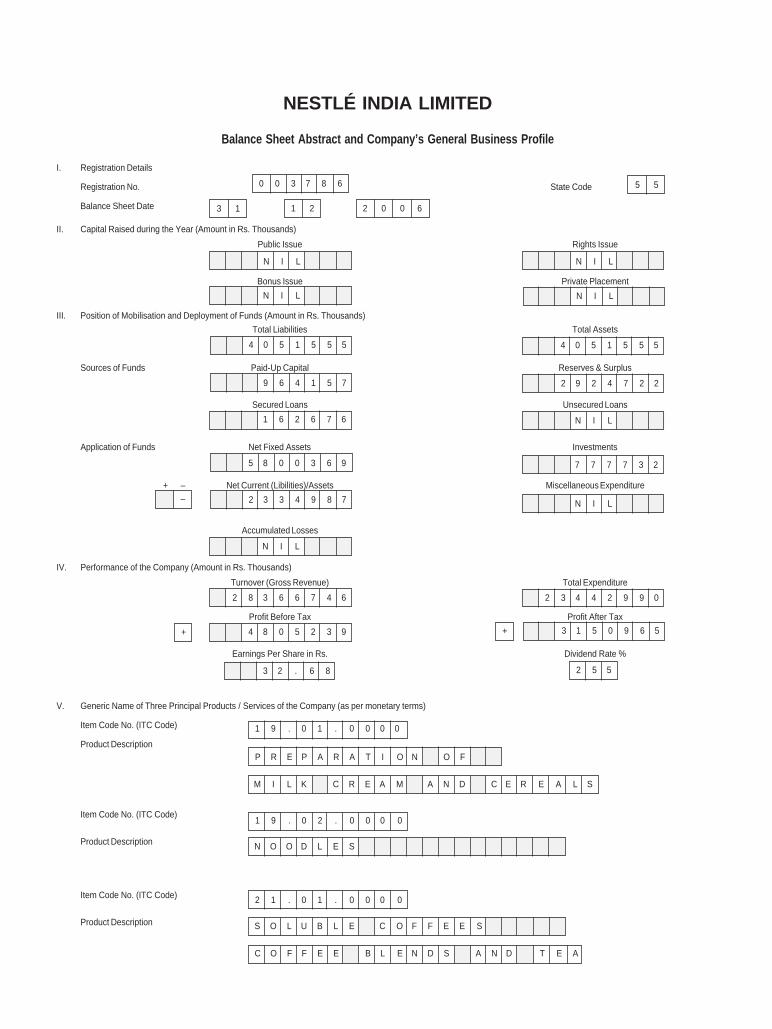
NESTLÉ INDIA LIMITED
Balance Sheet Abstract and Company’s General Business Profile
I. Registration Details
Registration No. State Code
Balance Sheet Date
II. Capital Raised during the Year (Amount in Rs. Thousands)
Public Issue Rights Issue
Bonus Issue Private Placement
III. Position of Mobilisation and Deployment of Funds (Amount in Rs. Thousands)
Total Liabilities Total Assets
Sources of Funds Paid-Up Capital Reserves & Surplus
Secured Loans Unsecured Loans
Application of Funds Net Fixed Assets Investments
+ – Net Current (Libilities)/Assets Miscellaneous Expenditure
Accumulated Losses
IV. Performance of the Company (Amount in Rs. Thousands)
Turnover (Gross Revenue) Total Expenditure
Profit Before Tax OOOO Profit After Tax
Earnings Per Share in Rs. Dividend Rate %
V. Generic Name of Three Principal Products / Services of the Company (as per monetary terms)
Item Code No. (ITC Code)
Product Description
Item Code No. (ITC Code)
Product Description
Item Code No. (ITC Code)
Product Description
5 50 0 3 7 8 6
N I L
1 9 . 0 1 . 0 0 0 0
3 1 1 2 2 0 0 6
3 1 5 0 9 6 5+
M I L K C R E A M A N D C E R E A L S
P R E P A R A T I O N O F
N O O D L E S
2 1 . 0 1 . 0 0 0 0
S O L U B L E C O F F E E S
C O F F E E B L E N D S A N D T E A
1 9 . 0 2 . 0 0 0 0
N I L
N I L
4 0 5 1 5 5 5
9 6 4 1 5 7
1 6 2 6 7 6
2 3 3 4 9 8 7
5 8 0 0 3 6 9
N I L
2 8 3 6 6 7 4 6
4 8 0 5 2 3 9
3 2 . 6 8
N I L
2 9 2 4 7 2 2
7 7 7 7 3 2
N I L
2 3 4 4 2 9 9 0
4 0 5 1 5 5 5
2 5 5
+
–
N I L