Embed Size (px)
Citation preview
Fatigue Assessment of Cable Systems of Long Span Cable-Stayed Bridges
Kazuo Tada, Yuji Fujii, and Harukazu Ohashi, Honshu-Shikoku Bridge Authority, Japan Chitoshi Miki, Tokyo Institute of Technology, Japan
Cable systems of a cable-stayed bridge consist of cable and cable anchorage. Cable tension caused by prestress, dead load, and live load acts directly on the cable anchorage. In addition to direct tension, bending deformation caused by live load, temperature changes, and wind load act on the anchored stay cables. Furthermore, wind-induced ocsilla-tions may be considered. Because cable tension and bending deformation occur repeatedly, it is necessary to verify fatigue behavior. The structural details of cable anchorages are complex, making it difficult to evaluate their fatigue resistance. Therefore, fatigue tests were conducted on full-scale specimens that include proposed anchorages and cables to examine their performance. The obtained results show that fatigue cracks initiated at the welded toe of the bearing plate to anchor web plates were caused by plate bending; therefore, some refinements of structural details are necessary. The bending fatigue strength of semi-parallel wire cables socketed by two types of anchorage were both proved to be sufficient for use as stay cables for an 870-m span cable-stayed bridge.
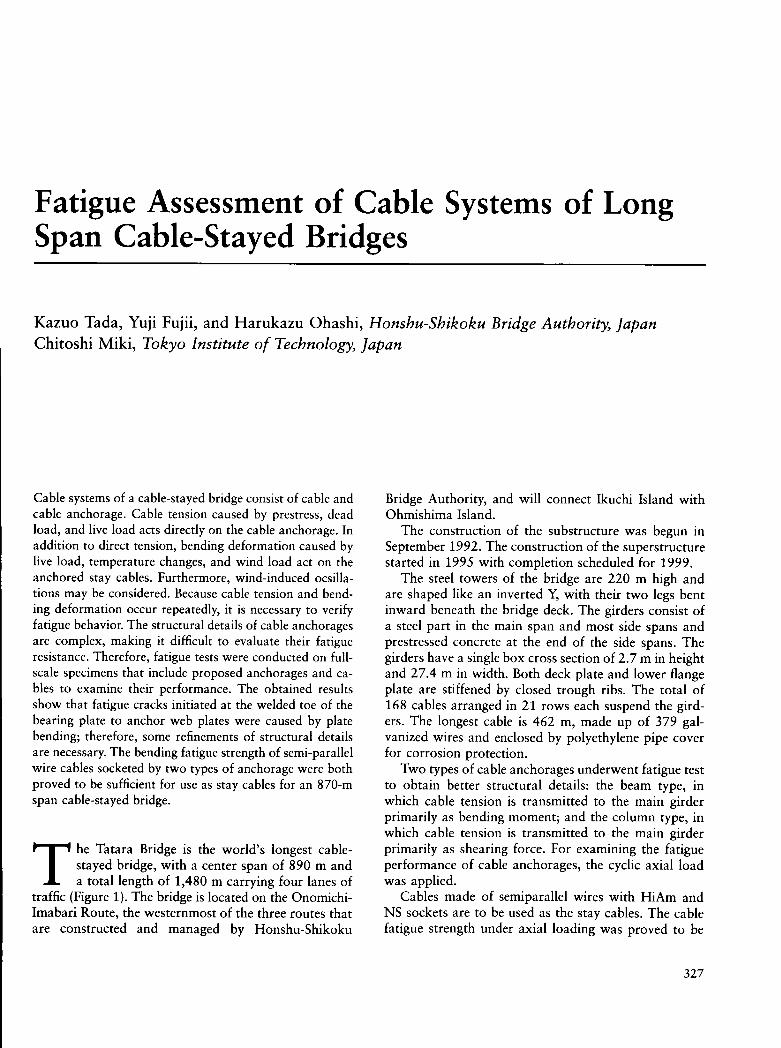
^ I * he Tatara Bridge is the world's longest cable-I stayed bridge, with a center span of 890 m and
J L a total length of 1,480 m carrying four lanes of traffic (Figure 1). The bridge is located on the Onomichi-Imabari Route, the westernmost of the three routes that are constructed and managed by Honshu-Shikoku
Bridge Authority, and will connect Ikuchi Island with Ohmishima Island.
The construction of the substructure was begun in September 1992. The construction of the superstructure started in 1995 with completion scheduled for 1999.
The steel towers of the bridge are 220 m high and are shaped like an inverted Y, with their two legs bent inward beneath the bridge deck. The girders consist of a steel part in the main span and most side spans and prestressed concrete at the end of the side spans. The girders have a single box cross section of 2.7 m in height and 27.4 m in width. Both deck plate and lower flange plate are stiffened by closed trough ribs. The total of 168 cables arranged in 21 rows each suspend the girders. The longest cable is 462 m, made up of 379 galvanized wires and enclosed by polyethylene pipe cover for corrosion protection.
Two types of cable anchorages underwent fatigue test to obtain better structural details: the beam type, in which cable tension is transmitted to the main girder primarily as bending moment; and the column type, in which cable tension is transmitted to the main girder primarily as shearing force. For examining the fatigue performance of cable anchorages, the cyclic axial load was applied.
Cables made of semiparallel wires with HiAm and NS sockets are to be used as the stay cables. The cable fatigue strength under axial loading was proved to be
327
328 F O U R T H I N T E R N A T I O N A L B R I D G E E N G I N E E R I N G C O N F E R E N C E
sufficient; however, the bending fatigue performance was not known. Therefore, the bending fatigue test of cables was conducted.
CABLE ANCHORAGE FATIGUE TESTING
Specimens
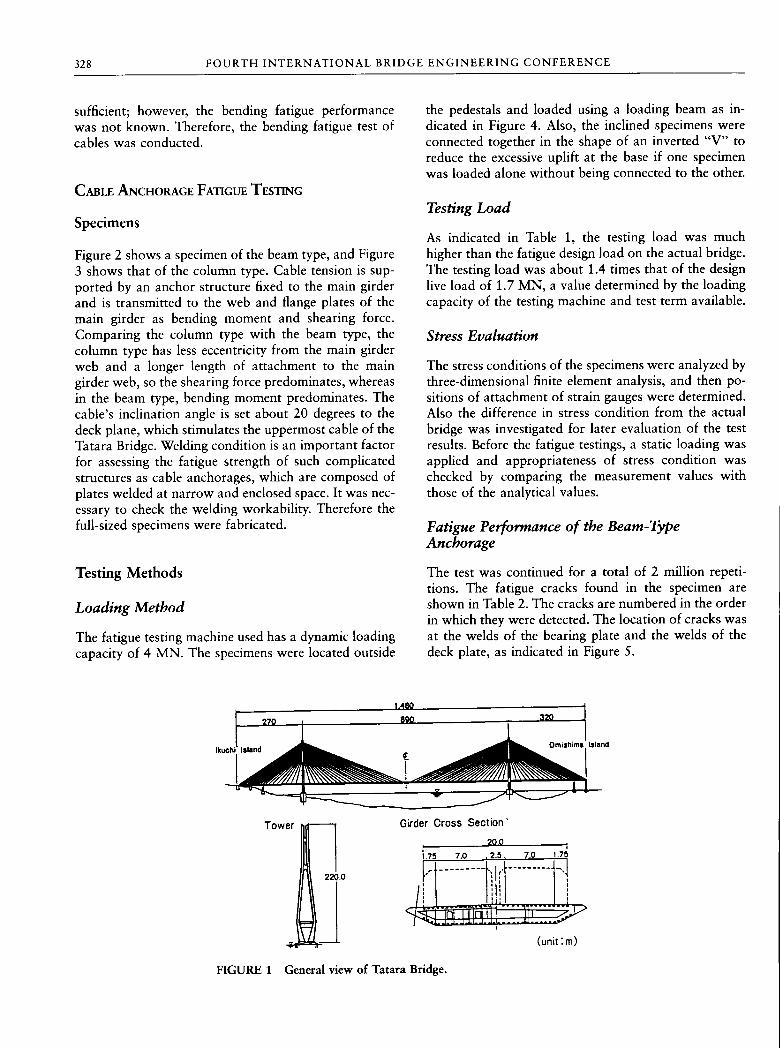
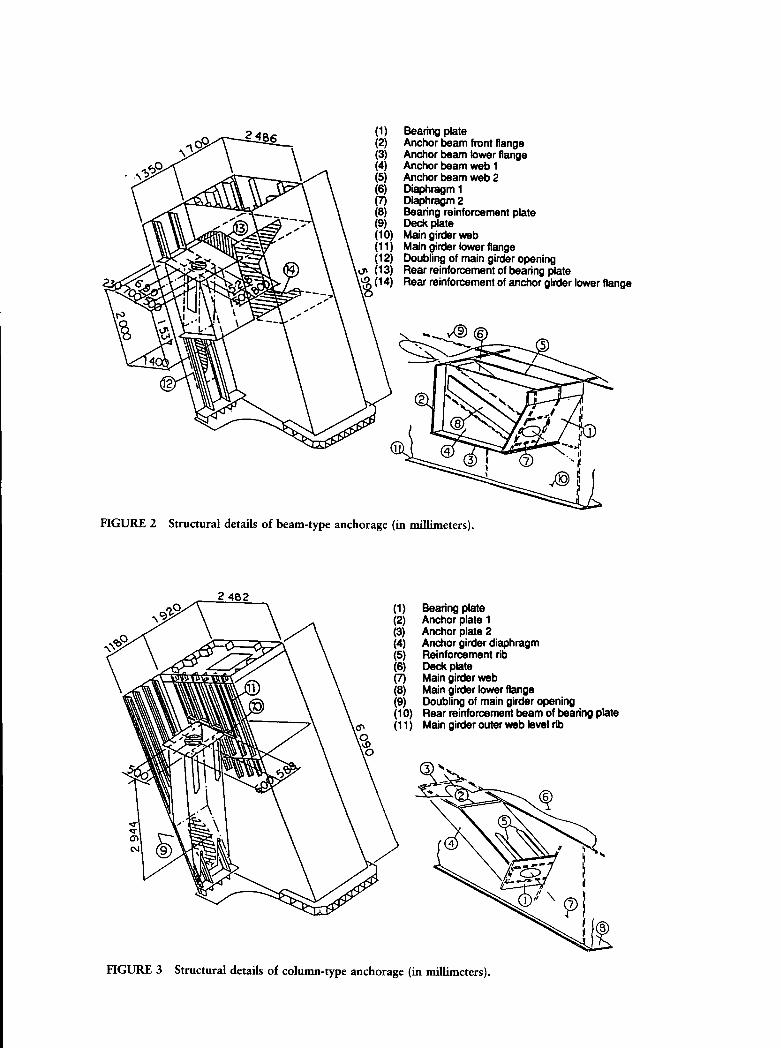
Figure 2 shows a specimen of the beam type, and Figure 3 shows that of the column type. Cable tension is supported by an anchor structure fixed to the main girder and is transmitted to the web and flange plates of the main girder as bending moment and shearing force. Comparing the column type with the beam type, the column type has less eccentricity from the main girder web and a longer length of attachment to the main girder web, so the shearing force predominates, whereas in the beam type, bending moment predominates. The cable's inclination angle is set about 20 degrees to the deck plane, which stimulates the uppermost cable of the Tatara Bridge. Welding condition is an important factor for assessing the fatigue strength of such complicated structures as cable anchorages, which are composed of plates welded at narrow and enclosed space. It was necessary to check the welding workability. Therefore the full-sized specimens were fabricated.
Testing Methods
Loading Method
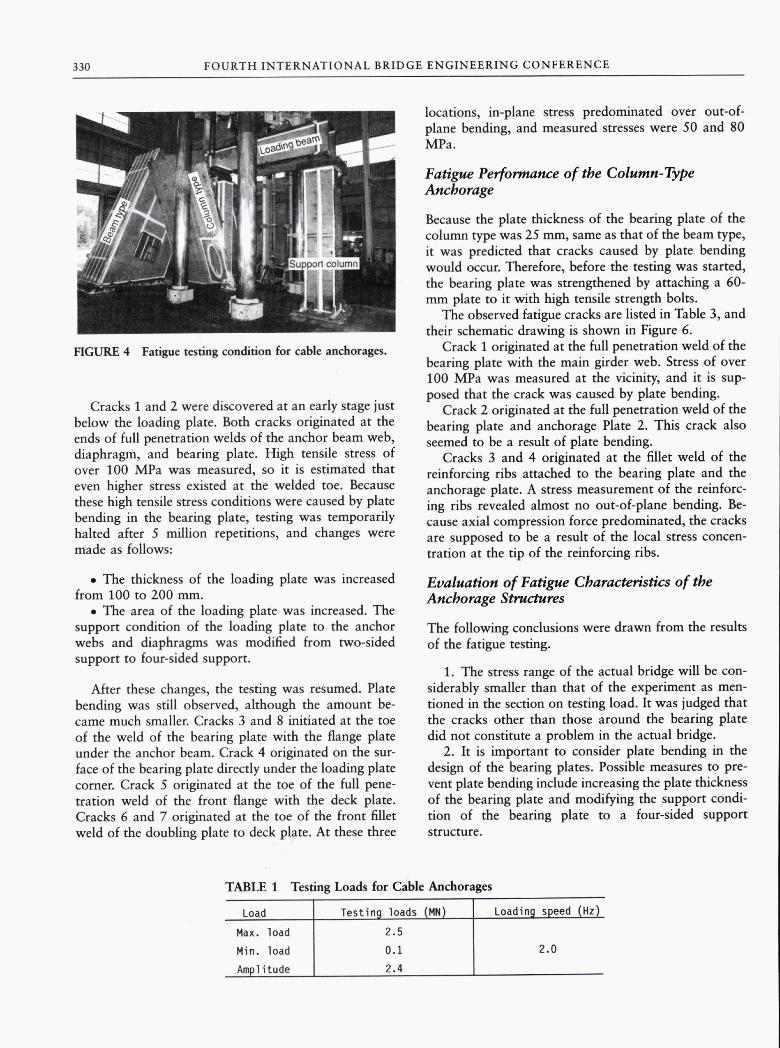
The fatigue testing machine used has a dynamic loading capacity of 4 MN. The specimens were located outside
the pedestals and loaded using a loading beam as indicated in Figure 4. Also, the inclined specimens were connected together in the shape of an inverted "V" to reduce the excessive uplift at the base if one specimen was loaded alone without being connected to the other.
Testing Load
As indicated in Table 1, the testing load was much higher than the fatigue design load on the actual bridge. The testing load was about 1.4 times that of the design live load of 1.7 MN, a value determined by the loading capacity of the testing machine and test term available.
Stress Evaluation
The stress conditions of the specimens were analyzed by three-dimensional finite element analysis, and then positions of attachment of strain gauges were determined. Also the difference in stress condition from the actual bridge was investigated for later evaluation of the test results. Before the fatigue testings, a static loading was applied and appropriateness of stress condition was checked by comparing the measurement values with those of the analytical values.
Fatigue Performance of the Beam-Type Anchorage
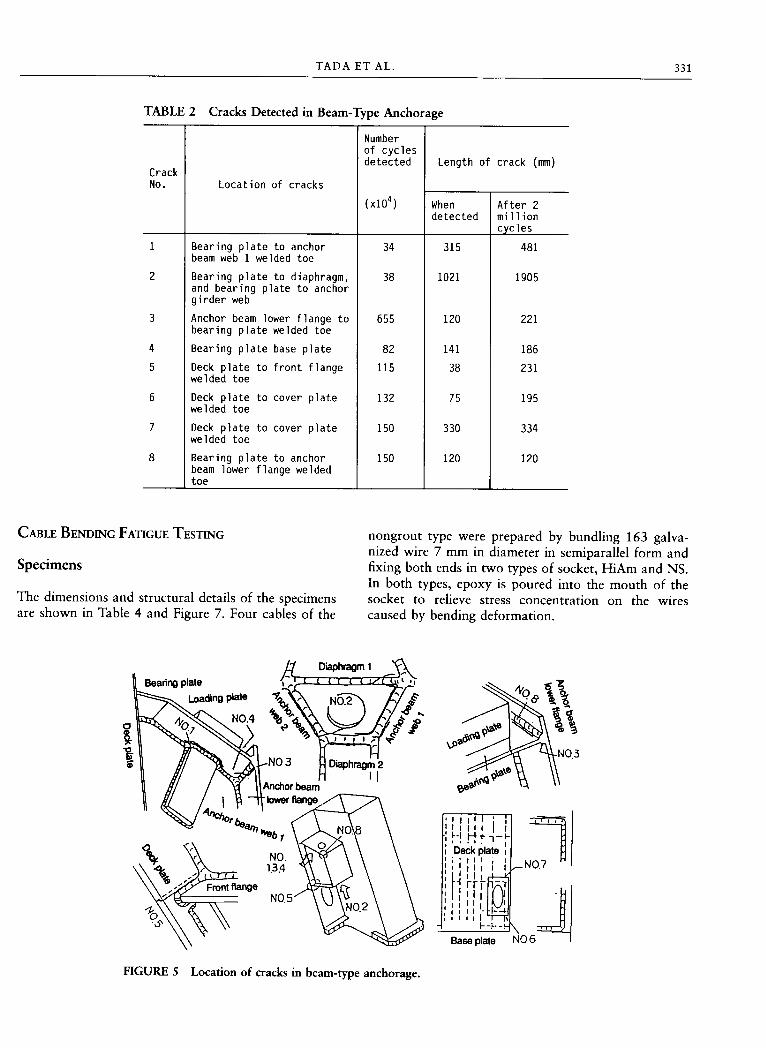
The test was continued for a total of 2 million repetitions. The fatigue cracks found in the specimen are shown in Table 2. The cracks are numbered in the order in which they were detected. The location of cracks was at the welds of the bearing plate and the welds of the deck plate, as indicated in Figure 5.
1.480
IkuchI Omishimt Island Island
T o w e r
220.0
Girder C r o s s S e c t i o n '
. 202 .
( u n i t i m )
FIGURE 1 General view of Tatara Bridge.
Bear ing plate A n c h o r b e a m front flange A n c h o r b e a m lower flange A n c h o r b e a m w e b 1 A n c h o r b e a m w e b 2 Diaphragm 1 Diaphragm 2 B e a r i n g reinforcement plate D e c k plate Main girder w e b Main girder lower flange Doubl ing of main girder opening R e a r re inforcement of bear ing plate R e a r reinforcement of a n c h o r girder lower flange
FIGURE 2 Structural details of beam-type anchorage (in millimeters).
2 462 Bear ing plate A n c h o r plate 1 A n c h o r plate 2 A n c h o r girder d iaphragm R e i n f o r c e m e n t rib D e c k plate Main girder w e b Main girder lower flange Doubling of main girder opening R e a r reinforcement b e a m of bear ing plate Main girder outer w e b level rib
FIGURE 3 Structural details of column-type anchorage (in millimeters).
330 F O U R T H I N T E R N A T I O N A L B R I D G E E N G I N E E R I N G C O N F E R E N C E
Support column
FIGURE 4 Fatigue testing condition for cable anchorages.
Cracks 1 and 2 were discovered at an early stage just below the loading plate. Both cracks originated at the ends of full penetration welds of the anchor beam web, diaphragm, and bearing plate. High tensile stress of over 100 MPa was measured, so it is estimated that even higher stress existed at the welded toe. Because these high tensile stress conditions were caused by plate bending in the bearing plate, testing was temporarily halted after 5 miUion repetitions, and changes were made as follows:
• The thickness of the loading plate was increased from 100 to 200 mm.
• The area of the loading plate was increased. The support condition of the loading plate to the anchor webs and diaphragms was modified from two-sided support to four-sided support.
After these changes, the testing was resumed. Plate bending was still observed, although the amount became much smaller. Cracks 3 and 8 initiated at the toe of the weld of the bearing plate with the flange plate under the anchor beam. Crack 4 originated on the surface of the bearing plate directly under the loading plate corner. Crack 5 originated at the toe of the full penetration weld of the front flange with the deck plate. Cracks 6 and 7 originated at the toe of the front fillet weld of the doubling plate to deck plate. At these three
locations, in-plane stress predominated over out-of-plane bending, and measured stresses were 50 and 80 MPa.
Fatigue Performance of the Column-Type Anchorage
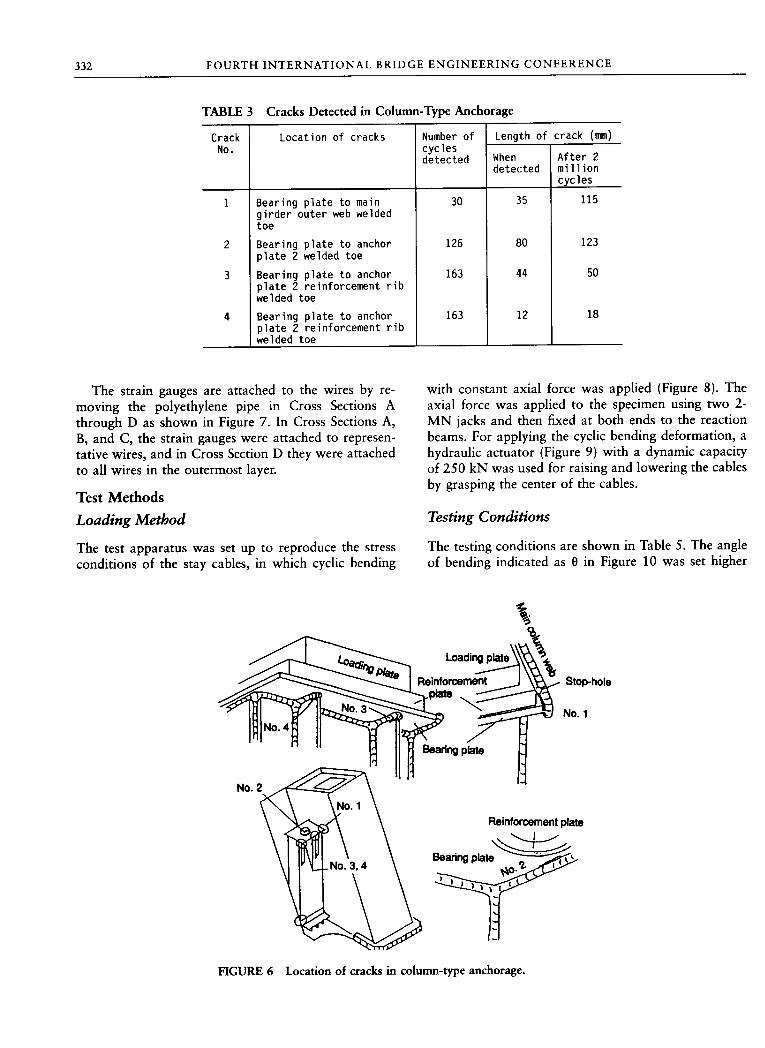
Because the plate thickness of the bearing plate of the column type was 25 mm, same as that of the beam type, it was predicted that cracks caused by plate bending would occur. Therefore, before the testing was started, the bearing plate was strengthened by attaching a 60-mm plate to it with high tensile strength bolts.
The observed fatigue cracks are listed in Table 3, and their schematic drawing is shown in Figure 6.
Crack 1 originated at the full penetration weld of the bearing plate with the main girder web. Stress of over 100 MPa was measured at the vicinity, and it is supposed that the crack was caused by plate bending.
Crack 2 originated at the full penetration weld of the bearing plate and anchorage Plate 2. This crack also seemed to be a result of plate bending.
Cracks 3 and 4 originated at the fillet weld of the reinforcing ribs attached to the bearing plate and the anchorage plate. A stress measurement of the reinforcing ribs revealed almost no out-of-plane bending. Because axial compression force predominated, the cracks are supposed to be a result of the local stress concentration at the tip of the reinforcing ribs.
Evaluation of Fatigue Characteristics of the Anchorage Structures
The following conclusions were drawn from the results of the fatigue testing.
1. The stress range of the actual bridge will be considerably smaller than that of the experiment as mentioned in the section on testing load. It was judged that the cracks other than those around the bearing plate did not constitute a problem in the actual bridge.
2. It is important to consider plate bending in the design of the bearing plates. Possible measures to prevent plate bending include increasing the plate thickness of the bearing plate and modifying the support condition of the bearing plate to a four-sided support structure.
TABLE 1 Testing Loads for Cable Anchorages
Load Testing loads (MN) Loading speed (Hz)
Max. load 2.5
Min. load 0.1 2.0
Amplitude 2.4
T A D A E T A L . 331
TABLE 2 Cracks Detected in Beam-Type Anchorage
Crack No.
Number of cycles detected Length of crack (mm)
Crack No. Location of cracks
(xlO^) When detected
A f t e r 2 mi 11 ion cycles
1 Bearing plate to anchor beam web 1 welded toe
34 315 481
2 Bearing plate to diaphragm, and bearing plate to anchor girder web
38 1021 1905
3 Anchor beam lower f lange to bearing plate welded toe
655 120 221
4 Bearing plate base plate 82 141 186 5 Deck plate to f r o n t f lange
welded toe 115 38 231
6 Deck plate to cover plate welded toe
132 75 195
7 Deck plate to cover plate welded toe
150 330 334
8 Bearing plate to anchor beam lower flange welded toe
150 120 120
CABLE BENDEVTG FATIGUE TESTING
Specimens
The dimensions and structural details of the specimens are shown in Table 4 and Figure 7. Four cables of the
nongrout type were prepared by bundling 163 galvanized wire 7 mm in diameter in semiparallel form and fixing both ends in two types of socket, HiAm and NS. In both types, epoxy is poured into the mouth of the socket to relieve stress concentration on the caused by bending deformation.
wires
Bearing plate
Loading plate
/ / Diaphragm 1
Diaphragm 2
Anchor beam lower flange
Front flange
. 1 1 1 1 1 ! 1 ' 1 ' 1 !
- i - | -
i Deck pl< ; 1 1 1
ite 1 , 1
1 J i l l 1 1
'A! .Pi , 1
I I I -1 1 1 1
1-
-N0.7
Baseplate NO 6
FIGURE 5 Location of cracks in beam-type anchorage.
332 F O U R T H I N T E R N A T I O N A L B R I D G E E N G I N E E R I N G C O N F E R E N C E
TABLE 3 Cracks Detected in Column-Type Anchorage
Crack Location of cracks Number of Length of crack (mm) No. cycles
detected When detected
A f t e r 2 mi 11 ion cycles
1 Bearing plate to main gi rder outer web welded toe
30 35 115
2 Bearing plate to anchor plate 2 welded toe
126 80 123
3 Bearing plate to anchor pla te 2 reinforcement r i b welded toe
163 44 50
4 Bearing plate to anchor pla te 2 reinforcement r i b welded toe
163 12 18
The strain gauges are attached to the wires by removing the polyethylene pipe in Cross Sections A through D as shown in Figure 7. In Cross Sections A, B, and C , the strain gauges were attached to representative wires, and in Cross Section D they were attached to all wires in the outermost layer.
Test Methods Loading Method
The test apparatus was set up to reproduce the stress conditions of the stay cables, in which cyclic bending
with constant axial force was applied (Figure 8). The axial force was applied to the specimen using two 2-M N jacks and then fixed at both ends to the reaction beams. For applying the cyclic bending deformation, a hydraulic actuator (Figure 9) with a dynamic capacity of 250 kN was used for raising and lowering the cables by grasping the center of the cables.
Testing Conditions
The testing conditions are shown in Table 5. The angle of bending indicated as 9 in Figure 10 was set higher
Load ing plate
Stop-hole Re in forcement plate
Bear ing plate
Re in forcement plate
FIGURE 6 Location of cracks in colunm-type anchorage.
TABLE 4 Dimensions of Anchorage Specimens
Specimen No.
Socket Cable length
Nominal cross sectional area
Tensi le strength of wire
Breakage strength of cable
(m) (mm )̂ (MPa) (MN)
1 NS 10
2 NS 8
3 Hi Am 10 6,272 1,570 10
4 Hi Am 8
Specimen No. 1 (No. 2) 10,000^10(8,000 ±10)
Socket /
About 400 Heatshrinkabto Po '^ thy lene « , tube pipe Mouth
T-
• i . -9.680£10 0.6tO±lO)
(Unit: mm)
Specimen No. 3 (No. 4)
Overwrapped portion Polyethylene pipe
C a p Socket Mouth / Heat shrinkable 7 / y— L - ^ tube
10,000±12(8,COO±12)
HiAa Anchorage BucCQA head
HlAa coapound(scecl balls,zinc powder i ' epoxy resin)
(Unit: mm)
C^ .̂anl̂ red E^oy resin
^ j — n / polyethylene
KEU FUS Anchorage
5 Galvanized wire Caulking material
Specimen No. 1,2
Zinc-copper allor baulking material
Specimen No. 3, 4
Polyethylene pipe (t=7 mm) Filament tape
Galvanized wire 'diameter 7 mm)
^ a i \ g n i z e d wire (diameter? mm) p o l y e t h y l e n e pipe
Lubricant
FIGURE 7 Structural details of cables and sockets.
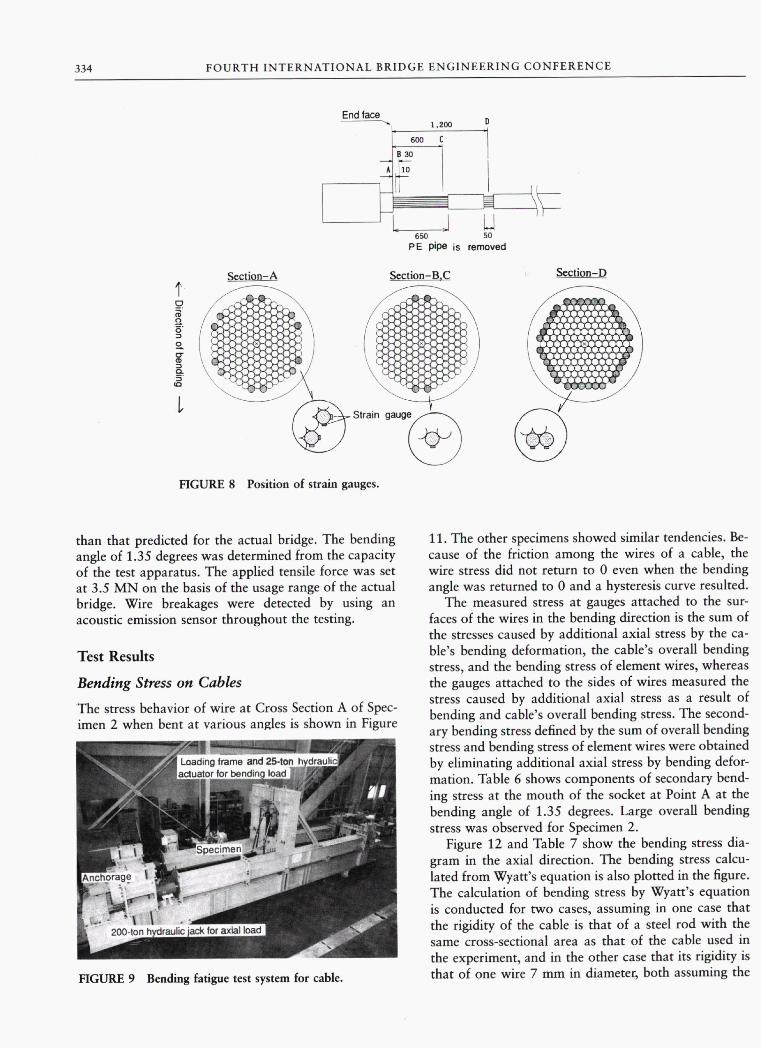
334 F O U R T H I N T E R N A T I O N A L B R I D G E E N G I N E E R I N G C O N F E R E N C E
End face 1 ,200
Section-A
650 50
P E pipe is removed
Section-B.C
Section-D
Strain gauge^—
FIGURE 8 Position of strain gauges.
than that predicted for the actual bridge. The bending angle of 1.35 degrees was determined from the capacity of the test apparatus. The applied tensile force was set at 3.5 M N on the basis of the usage range of the actual bridge. Wire breakages were detected by using an acoustic emission sensor throughout the testing.
Test Results
Bending Stress on Cables
The stress behavior of wire at Cross Section A of Specimen 2 when bent at various angles is shown in Figure
Loading frame and 25-ton hydraulic actuator for bendina load
Specimen r j
Anctiorage I
200-lon hydraulic lack for axial load
FIGURE 9 Bending fatigue test system for cable.
11. The other specimens showed similar tendencies. Because of the friction among the wires of a cable, the wire stress did not return to 0 even when the bending angle was returned to 0 and a hysteresis curve resulted.
The measured stress at gauges attached to the surfaces of the wires in the bending direction is the sum of the stresses caused by additional axial stress by the cable's bending deformation, the cable's overall bending stress, and the bending stress of element wires, whereas the gauges attached to the sides of wires measured the stress caused by additional axial stress as a result of bending and cable's overall bending stress. The secondary bending stress defined by the sum of overall bending stress and bending stress of element wires were obtained by eUminating additional axial stress by bending deformation. Table 6 shows components of secondary bending stress at the mouth of the socket at Point A at the bending angle of 1.35 degrees. Large overall bending stress was observed for Specimen 2.
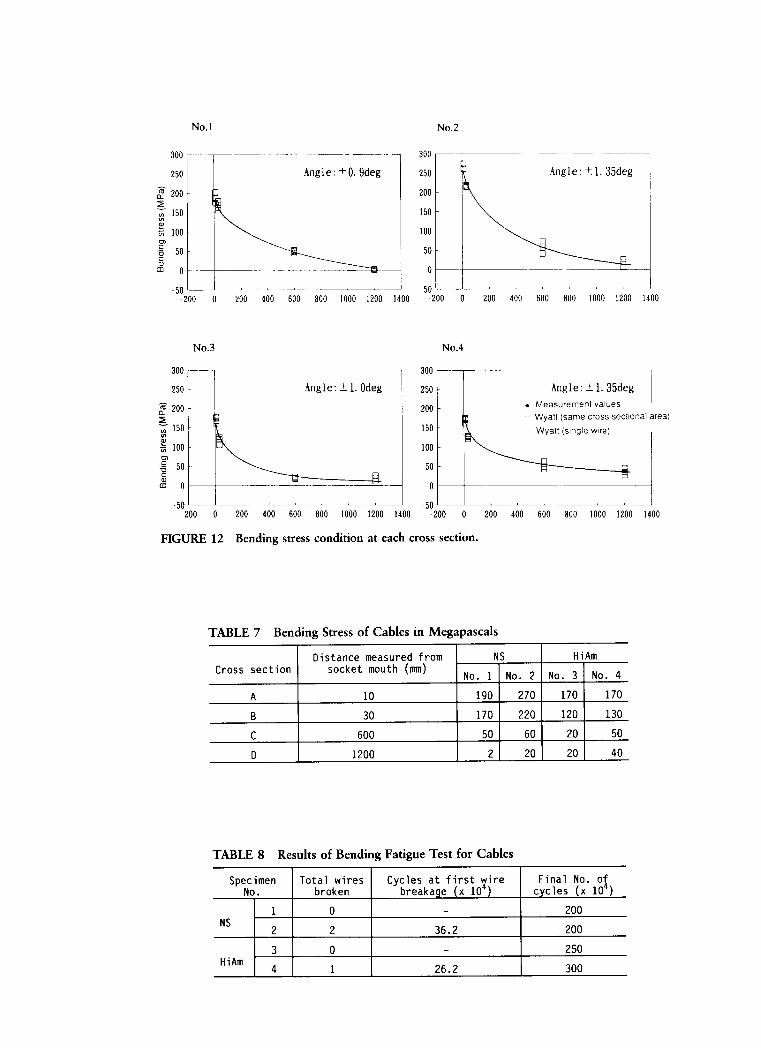
Figure 12 and Table 7 show the bending stress diagram in the axial direction. The bending stress calculated from Wyatt's equation is also plotted in the figure. The calculation of bending stress by Wyatt's equation is conducted for two cases, assuming in one case that the rigidity of the cable is that of a steel rod with the same cross-sectional area as that of the cable used in the experiment, and in the other case that its rigidity is that of one wire 7 mm in diameter, both assuming the
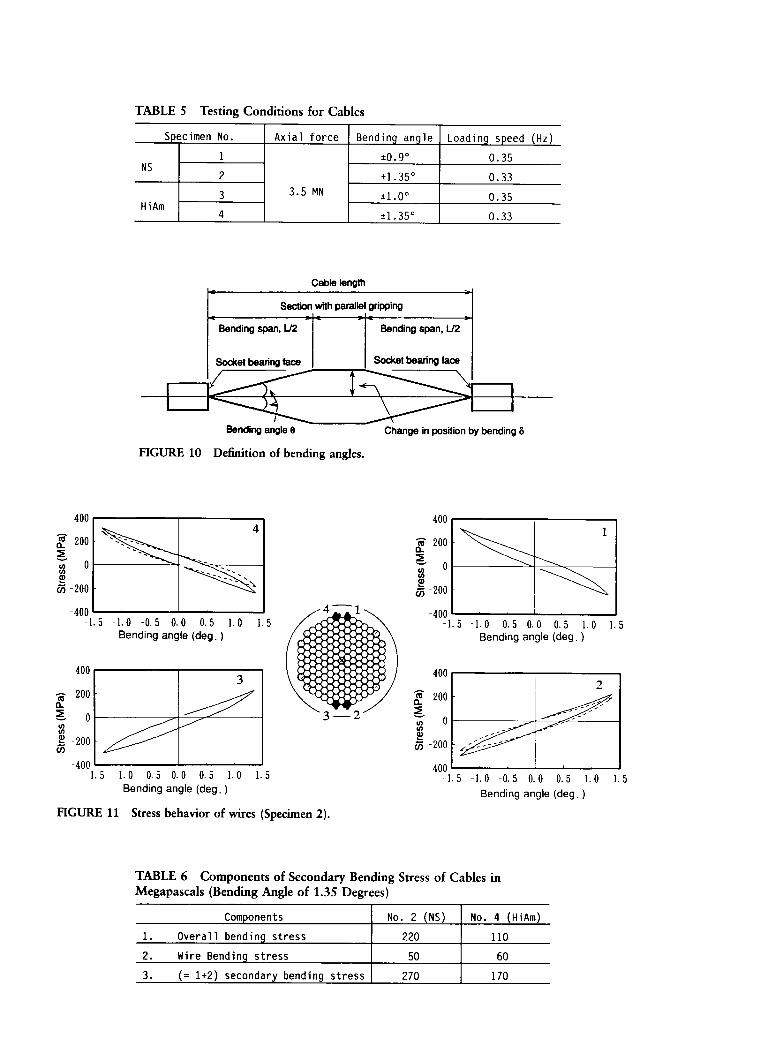
TABLE 5 Testing Conditions for Cables
Specimen No. Ax ia l f o r c e Bending angle Loading speed (Hz)
NS 1
3.5 MN
± 0 . 9 ° 0.35 NS
2
3.5 MN ± 1 . 3 5 ° 0.33
Hi Am 3 3.5 MN ± 1 . 0 ° 0.35
Hi Am 4
3.5 MN
± 1 . 3 5 ° 0.33
Cable length
Section with parallel gripping
Bending span, 112
Socket bearing face
Bending span, L/2
Socket bearing face
Bending angle 8 Change in position by bending 5
FIGURE 10 Definition of bending angles.
P 200
55 -200
-1.0 -0.5 0.0 0.5 1.0 Bending angle (deg.)
-1.0 -0.5 0.0 0.5 1.0 Bending angle (deg.)
1.5
200
I -200
1.5
FIGURE 11 Stress behavior of wires (Specimen 2).
io 200
K -200
-1.5 -1.0 -0.5 0.0 0.5 1.0 Bending angle (deg.)
1.5
™ 200
55 -200
-1.0 -0.5 0.0 0.5 1.0 Bending angle (deg.)
1.5
TABLE 6 Components of Secondary Bending Stress of Cables in Megapascals (Bending Angle of 1.35 Degrees)
Components No. 2 (NS) No. 4 (HiAm)
1. O v e r a l l bending s t r e s s 220 110
2. Wire Bending s t r e s s 50 60
3. (= 1+2) secondary bending s t r e s s 270 170
No.l No.2
1. 35deg Angle: ±0 . 9deg
5 100
1000 1200 1400 1000 1200 1400
No.3 No.4
Angle: ±1.35deg « Measurement values
Wyalt (same cross sectional area)
- Wyatt (single wire)
Angle: ± 1 . Odeg
« 200
-200 0 200 400 600 800 1000 1200 1400 -200 0 200 400 600 800 1000 1200 1400
FIGURE 12 Bending stress condition at each cross section.
TABLE 7 Bending Stress of Cables in Megapascals
Distance measured from NS HiAm Cross section socket mouth (mm) No. 1 No. 2 No. 3 No. 4
A 10 190 270 170 170 B 30 170 220 120 130 C 600 50 60 20 50 D 1200 2 20 20 40
TABLE 8 Results of Bending Fatigue Test for Cables
Specimen No.
Total wires broken
Cycles at f i r s t wire breakage (x 10 )
Final No. of cycles (x lO'')
1 0 _ 200 NS 2 2 36.2 200
3 0 _ 250 HiAm 4 1 26.2 300
TADA E T A L . 337
A - A 50
B - B 65
170
B
c - c
\Z
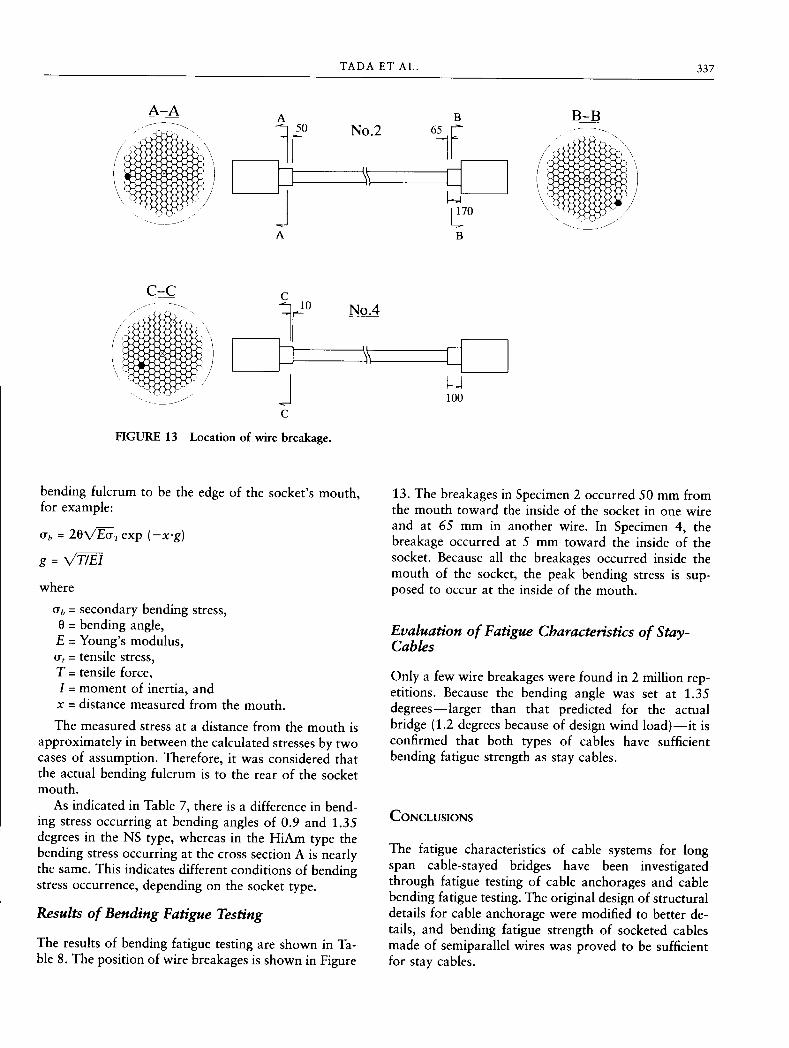
FIGURE 13 Location of wire breakage.
100
bending fulcrum to be the edge of the socket's mouth, for example:
CTfe = l e V E a r e x p {-x-g)
g = VTlEi
where
CTj, = secondary bending stress, e = bending angle, E - Young's modulus, a, = tensile stress, T = tensile force, / = moment of inertia, and X = distance measured from the mouth.
The measured stress at a distance from the mouth is approximately in between the calculated stresses by two cases of assumption. Therefore, it was considered that the actual bending fulcrum is to the rear of the socket mouth.
As indicated in Table 7, there is a difference in bending stress occurring at bending angles of 0.9 and 1.35 degrees in the NS type, whereas in the HiAm type the bending stress occurring at the cross section A is nearly the same. This indicates different conditions of bending stress occurrence, depending on the socket type.
Results of Bending Fatigue Testing
The results of bending fatigue testing are shown in Table 8. The position of wire breakages is shown in Figure
13. The breakages in Specimen 2 occurred 50 mm from the mouth toward the inside of the socket in one wire and at 65 mm in another wire. In Specimen 4, the breakage occurred at 5 mm toward the inside of the socket. Because all the breakages occurred inside the mouth of the socket, the peak bending stress is supposed to occur at the inside of the mouth.
Evaluation of Fatigue Characteristics of Stay-Cables
Only a few wire breakages were found in 2 million repetitions. Because the bending angle was set at 1.35 degrees—larger than that predicted for the actual bridge (1.2 degrees because of design wind load)—it is confirmed that both types of cables have sufficient bending fatigue strength as stay cables.
CONCLUSIONS
The fatigue characteristics of cable systems for long span cable-stayed bridges have been investigated through fatigue testing of cable anchorages and cable bending fatigue testing. The original design of structural details for cable anchorage were modified to better details, and bending fatigue strength of socketed cables made of semiparallel wires was proved to be sufficient for stay cables.