Embed Size (px)
Citation preview
Zhou et al. / J Zhejiang Univ-Sci A (Appl Phys & Eng) 2014 15(6):405-418 405
Seismic response study on a multi-span cable-stayed bridge scale model under multi-support excitations. Part II: numerical analysis*
Rui ZHOU†1, Zhou-hong ZONG†‡2, Xue-yang HUANG3, Zhang-hua XIA3
(1State Key Lab for Disaster Reduction in Civil Engineering, Tongji University, Shanghai 200092, China)(2School of Civil Engineering, Southeast University, Nanjing 210096, China)
(3School of Civil Engineering, Fuzhou University, Fuzhou 350108, China)†E-mail: [email protected]; [email protected]
Received Oct. 16, 2013; Revision accepted Apr. 22, 2014; Crosschecked May 21, 2014
Abstract: In recent years, local component destruction, collapse failure and the control of long-span cable-stayed bridges under strong multi-support excitations have received increasing attention. In this paper, two kinds of nonlinear finite element (FE) models are established to simulate the seismic responses and failure modes of a multi-span cable-stayed bridge scale model under multi-support excitations. One is the single girder model which is used to simulate the seismic response during four wave excita-tions. It can be concluded that the FE analysis results of the scale model are a good fit with those from the shaking table tests. The other one is the explicit dynamic FE model which is used to simulate the collapse and failure mechanisms of the scale model during strong earthquakes. The aggressive failure processes of the scale model under two different types of wave excitations were compared to reproduce the mechanisms in which the bearing at the middle tower failed under the El Centro (EC) wave (4.0 m/s2),and we also observed the connection failure of the cables and towers, and the elements failure of the upper beam in the middle tower, which occurred successively under a Jiangxin (JX) wave (4.0 m/s2). This simulation may be referenced as the basis for the collapse failure of a cable-stayed bridge with a large span during a strong earthquake.
Key words: Multi-span cable-stayed bridge, Multi-support excitations, Nonlinear finite element model, Nonlinear dynamic analysis, Collapse failure, Failure mode
doi:10.1631/jzus.A1300340 Document code: A CLC number: U448.27
1 Introduction
Over the past 20 years, rapid development has been made on modern cable-stayed bridges (Gimsing and Georgakis, 2011). Many researchers have studied the dynamic behavior during ambient vibration and seismic response under multi-support excitations on long-span cable-stayed bridges, where the influences of the traveling wave effect, coherence loss, and local
site conditions should be considered. For example, Wilson and Gravelle (1991), Ren et al. (2005), and Pantaleon et al. (2010) studied the dynamic behaviors of cable-stayed bridges through 3D finite-element (FE) models. In these studies, the modal behaviors predicted by the FE models were compared to the measured characteristics from ambient vibrations of full-scale cable-stayed bridges. On the other hand, 3Dnonlinear seismic response analyses of long-span cable-stayed bridges have been conducted (Abdel-Ghaffar and Nazmy, 1991; Nazmy and Abdel-Ghaffar, 1992; Zavoni and Vanmarcke, 1994; Allamand Datta, 1999; Ren and Makoto, 1999). In China, Fan et al. (2001), Li et al. (2005), Bao et al. (2008), as well as Lin et al. (2009) studied the linear and nonlinear response characteristics of long-span
Journal of Zhejiang University-SCIENCE A (Applied Physics & Engineering)ISSN 1673-565X (Print); ISSN 1862-1775 (Online)www.zju.edu.cn/jzus; www.springerlink.comE-mail: [email protected]
‡ Corresponding author* Project supported by the National Natural Science Foundation of China (Nos. 51178101 and 51378112), the Doctoral Program Project of the Ministry of Education (No. 20110092110011), and the National Key Laboratory of Civil Engineering Disaster Prevention of Tongji University (No. SLDRCE08-HZ-02), China© Zhejiang University and Springer-Verlag Berlin Heidelberg 2014
Zhou et al. / J Zhejiang Univ-Sci A (Appl Phys & Eng) 2014 15(6):405-418406
cable-stayed bridges during uniform excitations and non-uniform excitations. These investigations con-centrated on two-tower cable-stayed bridges.
A few researchers were involved in theoretical and numerical simulation to understand the seismic response mechanisms of multi-span cable-stayed bridges subjected to multi-support excitations. Fang et al. (2011) explored the influence of traveling-wave effects on the seismic responses of a multi-span cable-stayed bridge with different constraint mecha-nisms between the main towers and main girder. Okamoto and Nakamura (2011) studied seismic re-sponses of a multi-span cable-stayed bridge with steel/concrete hybrid towers subjected to medium and ultra-strong seismic waves specified in the “Japanese Seismic Code for Highway Bridges”. This study revealed that a new steel/concrete hybrid tower is feasible for multi-span cable-stayed bridges and is most effective for seismic forces when the main girder is connected with bi-linear springs.
Meanwhile, the collapse analysis of cable-stayed bridges under strong earthquakes has gradually gained attention after the recent experience of many strong earthquakes. For example, Self and Dilger(1990) described the behavior of planar prestressed concrete cable-stayed bridges until failure occurred, taking into account the geometric and material nonlinearities under static loads. Song and Kim(2007) discussed the analysis problem of the in-planeoverall collapse mechanisms during static loads, and the evaluation of the ultimate load-carrying capacities of cable-stayed bridges with various cable layouts using the bifurcation point instability approach. However, they did not study the structural behavior under dynamic loads. Luo et al. (2010) compared the collapse process of the concrete girder bridge (Baihua Bridge, China) during the Wenchuan earthquake between a simulation analysis and a practical situa-tion, which shows that the local components of the connecting devices were destroyed first. Yoo et al.(2012) proposed a new and simple method for esti-mating the collapse load of a steel cable-stayed bridge under static loads. The results demonstrated that the proposed method is a good substitute for a complex nonlinear inelastic analysis to approximately evaluate the collapse loads as well as the failure modes of steel cable-stayed bridges. Note that the collapse analysis and failure control of long-span cable-stayed bridges
during strong earthquakes have seldom been done, let alone analyzing the impact on multi-span cable-stayed bridges.
This paper focuses on the numerical simulation of a seismic response for a multi-span cable-stayed bridge scale model under uniform excitations and non-uniform excitations.
2 Scaled multi-span cable-stayed bridge
The Wuhan Erqi Yangtze River Bridge, a three-tower and double-cable-plane cable-stayed bridge, was selected as the prototype bridge for a multi-span cable-stayed bridge. A 1:100 scale model with a 17.32 m length for the main girder and a 2.05 m height for the main towers was tested by using earthquake shaking tables (Fig. 1). The analytical modeling discussed in this study simulates the seis-mic response of the scale model during multi-support excitations up to failure. For a detailed description of the prototype bridge and scale model, please refer to the relevant study of ‘Part I: shaking table tests’(Zong et al., 2014). Fig. 2 shows the scale model test setup.
3 Finite element modeling of the scale model
3.1 Single girder model
A 3D single girder FE model of the scale model was established based on ANSYS software (Nazmyand Abdel-Ghaffar, 1990a; 1990b; Wilson and Gravelle, 1991). Spatial beam-column elements (BEAM4) with six degrees of freedom at each node were adopted to model the main girder, cross beams, towers, and side piers. The truss elements (LINK10), having only tension stiffness, were used to model the cables. The main girder was modeled by using a sin-gle central spine with offset links to accommodate lumped masses and cable anchor points, and stiffness was assigned to the spine to simulate the actual stiffness of the main girder. The nonlinearity of thecables was accounted for by an equivalent tangent equation (Ernst, 1965; Nazmy and Abdel-Ghaffar,1990a; 1990b). The supplemental masses were mod-eled by using the mass elements (MASS21) defined by a single node. The vertical bearings among the towers, side piers, and superstructure were modeled

Zhou et al. / J Zhejiang Univ-Sci A (Appl Phys & Eng) 2014 15(6):405-418 407
by using spring-damper elements (COMBIN14) de-fined by two nodes of a spring constant and damping coefficients, and the other connections among the towers, side piers, and superstructure were simulated by coupling the corresponding rotational and lateral degrees of freedom. The bottom of the towers and the side piers were completely fixed, ignoring the influ-ence of the soil-pile-structure interactions. The single girder model of the scale model has 706 nodes and 1600 elements (Fig. 3). Fig. 2 Test setup of the scale model
Fig. 1 Three-tower cable-stayed bridge scale model (unit: cm): (a) longitudinal arrangement of the scale model;(b) dimension of the middle tower; (c) dimension of the side tower
21 3 4 65 7
616 616 9016090 1601732
Concrete beam
4 mx4 m shaking tableCantilever rigid base
2.5 mx2.5 m shaking table2.5 mx2.5 m shaking table
741 741
C3:2A,X+Y C6:2A,X+YE2:2LA,X+YD2:2LA,X+YA2:2A,X+YB1:2S,X A1:2A,X+Y
C1:2A,X+Y
Composite beam
Composite beam Composite beam Concrete beam
Composite beam
B2:2S,XD3:4S,X+Y
D1:4S,X+YC3:2A,X+Y E3:4S,X+Y
E1:4S,X+Y
D4:2LA,X+Y E4:2LA,X+Y
C5:2A,X+Y F2:2LA,X+YB4:2S,XA1:2A,X+Y
C8:2A,X+YB3:2S,XD3:4S,X+YF1:4S,X+Y
F4:2LA,X+Y
Cantilever rigid base Cantilever rigid base
C4:2A,X+Y C7:2A,X+Y
(a)
(b) (c)
Elevation of the middle towerElevation of the side tower
Zhou et al. / J Zhejiang Univ-Sci A (Appl Phys & Eng) 2014 15(6):405-418408
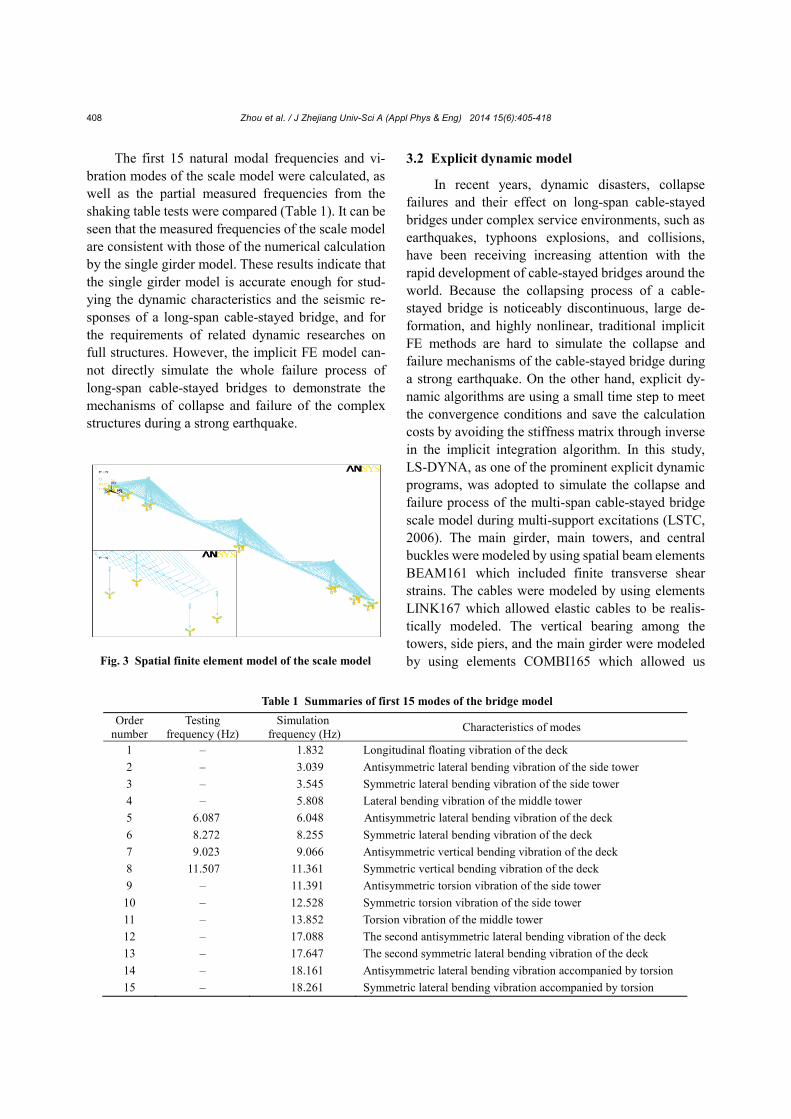
The first 15 natural modal frequencies and vi-bration modes of the scale model were calculated, as well as the partial measured frequencies from the shaking table tests were compared (Table 1). It can be seen that the measured frequencies of the scale model are consistent with those of the numerical calculation by the single girder model. These results indicate that the single girder model is accurate enough for stud-ying the dynamic characteristics and the seismic re-sponses of a long-span cable-stayed bridge, and for the requirements of related dynamic researches on full structures. However, the implicit FE model can-not directly simulate the whole failure process of long-span cable-stayed bridges to demonstrate the mechanisms of collapse and failure of the complex structures during a strong earthquake.
3.2 Explicit dynamic model
In recent years, dynamic disasters, collapse failures and their effect on long-span cable-stayed bridges under complex service environments, such as earthquakes, typhoons explosions, and collisions, have been receiving increasing attention with the rapid development of cable-stayed bridges around the world. Because the collapsing process of a cable-stayed bridge is noticeably discontinuous, large de-formation, and highly nonlinear, traditional implicit FE methods are hard to simulate the collapse and failure mechanisms of the cable-stayed bridge during a strong earthquake. On the other hand, explicit dy-namic algorithms are using a small time step to meet the convergence conditions and save the calculation costs by avoiding the stiffness matrix through inverse in the implicit integration algorithm. In this study,LS-DYNA, as one of the prominent explicit dynamic programs, was adopted to simulate the collapse and failure process of the multi-span cable-stayed bridge scale model during multi-support excitations (LSTC,2006). The main girder, main towers, and central buckles were modeled by using spatial beam elements BEAM161 which included finite transverse shear strains. The cables were modeled by using elements LINK167 which allowed elastic cables to be realis-tically modeled. The vertical bearing among the towers, side piers, and the main girder were modeled by using elements COMBI165 which allowed us
Table 1 Summaries of first 15 modes of the bridge modelOrder
numberTesting
frequency (Hz)Simulation
frequency (Hz) Characteristics of modes
1 – 1.832 Longitudinal floating vibration of the deck2 – 3.039 Antisymmetric lateral bending vibration of the side tower3 – 3.545 Symmetric lateral bending vibration of the side tower4 – 5.808 Lateral bending vibration of the middle tower5 6.087 6.048 Antisymmetric lateral bending vibration of the deck6 8.272 8.255 Symmetric lateral bending vibration of the deck7 9.023 9.066 Antisymmetric vertical bending vibration of the deck8 11.507 11.361 Symmetric vertical bending vibration of the deck9 – 11.391 Antisymmetric torsion vibration of the side tower10 – 12.528 Symmetric torsion vibration of the side tower11 – 13.852 Torsion vibration of the middle tower12 – 17.088 The second antisymmetric lateral bending vibration of the deck13 – 17.647 The second symmetric lateral bending vibration of the deck14 – 18.161 Antisymmetric lateral bending vibration accompanied by torsion15 – 18.261 Symmetric lateral bending vibration accompanied by torsion
Fig. 3 Spatial finite element model of the scale model

Zhou et al. / J Zhejiang Univ-Sci A (Appl Phys & Eng) 2014 15(6):405-418 409
to model simple spring or damper systems, and the attached masses were modeled by using MASS166 elements which are defined by a single node with concentrated mass components.
To preferably reflect the material property, anelastic-plastic model with kinematic hardening (MAT_PLASTIC_KINEMATIC3) was used to sim-ulate the polymethyl methacrylate (PMMA). The yielding stress and the failure strain of the PMMA were 5.5 MPa and 0.0325 in the failure criteria def-inition of the material, respectively. The modulus of elasticity and the mass density of the PMMA were 2690 MPa and 1180 kg/m3, respectively. The discrete beam element model (MAT_CABLE_DISCRETE_ BEAM) was used to model the high-tensile steel ca-bles, and the offset was set in the real constants of the cable elements. The modulus of elasticity and the mass density of the cables were 195000 MPa and 7850 kg/m3, respectively. The rigid arm of the main girder was simply modeled by the rigid body model through constraining the freedom degrees of the rigid body through the DEMP command, thus the compu-ting time was greatly reduced. The spring element model (MAT_SPRING_ELASTOPLASTIC) was adopted to model the vertical bearings among the towers, side piers, and main girder. Through the TBDATA command, the elastic stiffness and shear stiffness were set as 1.5 MPa and 5.5 MPa, respec-tively. The explicit dynamic relaxation method was adopted to consider the action of gravity, and the single automatic contact was used to simulate the dynamic contact problem in the process of the col-lapse. The explicit dynamic model of the three-tower cable-stayed bridge scale model has 706 nodes and 1600 elements (Fig. 4).
4 Single girder finite element model verification
Based on the above single girder FE model, the time-history analysis of the scale model during uni-form excitations and non-uniform excitations wasconducted by the Newmark- method.
Three synthetic seismic waves with the lengthof time of 20.5 s including the Wuchang (WC) wave, Jiangxin (JX) wave, Hankou (HK) wave, and El Centro (EC) wave were selected as the input excita-tions described in the relevant study of ‘Part I:shaking table tests’ (Zong et al., 2014) (Fig. 5,p.411). Since only the acceleration and strain pa-rameters were measured in the shaking table tests, the acceleration responses of the towers in the test and the FE analysis (FEA) were compared (Table 2). Table 2 indicates that the test results are in good agreement with the results from FEA, and most of the errors are less than 10% on the whole. The numerical simulation results are a little higher than those from the tests due to the simplified disposal of the deck in establishing the FE model and the errors of the equipment in the practical experimental measure-ment. The seismic responses of three towers are ap-proximately symmetric under horizontal earthquake excitations.
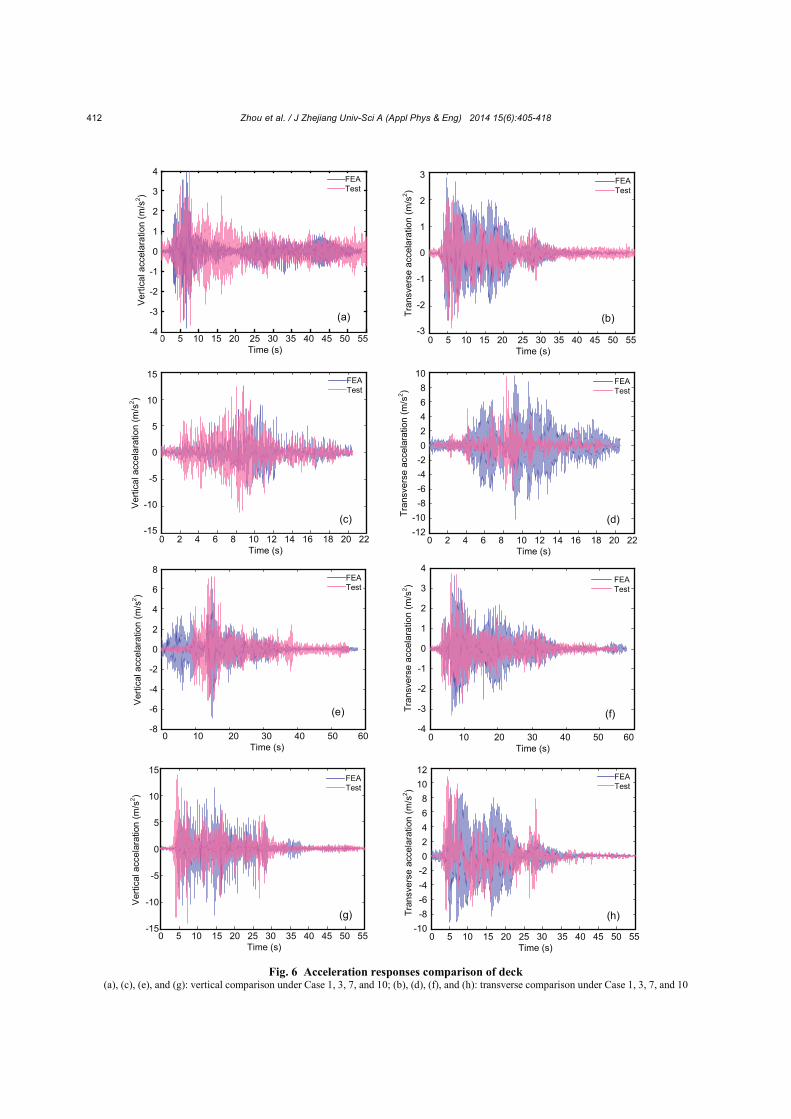
The time-history curves at the middle span of the main girder are described in Fig. 6 (p.412). It can be seen that the response tendencies of the FE analysis are consistent with those from the shaking table tests (Zong et al., 2014). The seismic responses in the vertical direction are larger than those in the transversal direction. From these comparisons, it can be concluded that the single girder FE model can be used to predict the seismic responses of the multi-span cable-stayed bridge during uniform excitations and non-uniform excitations.
5 Seismic response analysis of the singlegirder model
5.1 Displacement responses
The longitudinal displacement at the top of the tower, the displacement at the end of the main girder, the relative displacement between the tower and the main girder, and the vertical displacement of the mid-span of the main span in the scale model were calculated under uniform excitations. The peak value Fig. 4 Explicit dynamic model of the scale model

Zhou et al. / J Zhejiang Univ-Sci A (Appl Phys & Eng) 2014 15(6):405-418410
Table 2 Comparison of acceleration responses of the towers between test and FEA (unit: m/s2)
LocationEC wave of 1.0 m/s2 (Case 1) WC wave of 1.0 m/s2 (Case 2)
Longitudinal Transverse Longitudinal TransverseTest FEA Error Test FEA Error Test FEA Error Test FEA Error
L1 4.050 4.285 5.49% 2.957 3.044 2.87% 5.515 5.631 2.06% 4.345 4.416 1.60%L2 2.565 2.684 4.44% 1.905 1.911 0.31% 3.667 3.788 3.21% 2.381 2.523 5.60%M1 5.125 5.266 2.68% 3.629 3.786 4.16% 6.333 6.589 3.89% 4.856 4.946 1.83%M2 3.202 3.158 1.39% 2.129 2.145 0.75% 4.195 4.192 0.07% 2.587 2.702 4.27%R1 4.315 4.406 2.06% 3.184 3.291 3.24% 5.321 5.593 4.88% 4.274 4.398 2.83%R2 2.560 2.634 2.81% 1.917 1.911 0.29% 3.613 3.726 3.05% 2.421 2.485 2.60%
LocationJX wave of 1.0 m/s2 (Case 3) HK wave of 1.0 m/s2 (Case 4)
Longitudinal Transverse Longitudinal TransverseTest FEA Error Test FEA Error Test FEA Error Test FEA Error
L1 6.875 6.892 0.24% 5.072 5.193 2.32% 6.048 6.158 1.78% 4.648 4.678 0.65%L2 4.615 4.885 5.52% 3.562 3.175 12.18% 4.143 4.260 2.75% 2.789 2.900 3.83%M1 7.926 8.052 1.57% 6.126 6.267 2.25% 7.082 7.283 2.76% 5.639 5.652 0.23%M2 5.035 5.152 2.26% 3.108 3.160 1.65% 4.619 4.691 1.53% 2.731 2.933 6.91%R1 6.766 6.842 1.12% 5.255 5.323 1.29% 6.071 6.183 1.81% 4.653 4.737 1.77%R2 4.768 4.847 1.64% 3.084 3.172 2.78% 4.216 4.241 0.57% 2.777 2.893 4.03%
LocationEC wave of 1232 m/s (Case 5) EC wave of 616 m/s (Case 6)
Longitudinal Transverse Longitudinal TransverseTest FEA Error Test FEA Error Test FEA Error Test FEA Error
L1 15.424 15.840 2.62% 10.960 11.329 3.25% 9.426 9.504 0.82% 6.698 6.865 2.43%L2 9.250 9.363 1.21% 6.688 6.773 1.25% 5.905 6.081 2.90% 4.204 4.289 1.98%M1 18.578 18.749 0.92% 13.231 13.401 1.27% 11.585 12.006 3.50% 8.330 8.506 2.07%M2 11.137 11.294 1.39% 7.721 7.860 1.76% 6.947 7.068 1.71% 4.719 4.805 1.81%R1 15.786 15.885 0.62% 11.847 12.541 5.54% 9.369 9.531 1.70% 7.240 7.437 2.65%R2 9.482 9.773 2.98% 6.880 7.104 3.15% 5.794 5.864 1.18% 4.204 4.317 2.61%
LocationEC wave of 308 m/s (Case 7) EC wave of 2.0 m/s2 (Case 8)
Longitudinal Transverse Longitudinal TransverseTest FEA Error Test FEA Error Test FEA Error Test FEA Error
L1 7.284 7.503 2.92% 5.176 5.532 6.44% 7.532 7.658 1.64% 5.461 5.579 2.12%L2 4.563 5.100 10.54% 3.249 3.542 8.27% 5.037 5.156 2.32% 3.582 3.718 3.65%M1 8.952 9.841 9.03% 6.437 6.669 3.48% 10.053 10.187 1.32% 6.757 7.061 4.31%M2 5.368 6.227 13.79% 3.646 4.029 9.51% 6.316 6.405 1.39% 4.029 4.116 2.12%R1 7.490 8.410 10.93% 5.594 6.150 9.04% 8.412 8.563 1.77% 6.258 6.497 3.67%R2 4.477 5.082 11.89% 3.249 3.563 8.81% 5.068 5.208 2.70% 3.522 3.648 3.46%
LocationEC wave of 3.0 m/s2 (Case 9) EC wave of 4.0 m/s2 (Case 10)
Longitudinal Transverse Longitudinal TransverseTest FEA Error Test FEA Error Test FEA Error Test FEA Error
L1 11.911 12.055 1.20% 8.591 8.690 1.13% 16.296 16.385 0.54% 11.218 11.694 4.07%L2 7.381 7.553 2.28% 5.073 5.261 3.56% 9.736 9.856 1.22% 5.876 7.018 16.27%M1 15.080 15.203 0.81% 10.359 10.484 1.19% 19.064 19.997 4.67% 13.815 14.046 1.64%M2 8.736 8.886 1.69% 6.345 6.485 2.16% 12.362 12.540 1.42% 8.379 8.531 1.78%R1 12.222 12.325 0.84% 9.287 9.538 2.63% 16.624 16.865 1.43% 12.163 12.695 4.19%R2 7.714 7.883 2.15% 5.373 5.500 2.31% 10.254 10.410 1.50% 7.364 7.418 0.72%
L1, M1, R1: acceleration responses at the top of the left tower, the middle tower, and the right tower; L2, M2, R2: acceleration responses at the lower cross beam of the left tower, the middle tower, and the right tower

Zhou et al. / J Zhejiang Univ-Sci A (Appl Phys & Eng) 2014 15(6):405-418 411
of the displacement responses are presented (Table 3). It can be seen that the displacement re-sponses at the top of the three towers are different and the D2 value is the largest (exceed 10 mm), because there is no auxiliary pier and anchor cable in the two middle spans, leading to the lack of effective assis-tance from the stiffness of the main girder and ca-bles. Therefore, some measures should be adopted to improve the stiffness of the middle tower to control the larger deformation of the middle tower in the three-tower cable-stayed bridge as much as possible. Due to the restriction of the bearing, the displace-ment response of D6 is smaller than other dis-placement responses for the same case. Note that the vertical displacement at the mid-span of the main span cannot be ignored during horizontal earthquake excitations.
Meanwhile, the influence of the traveling wave on the displacement responses of the deck and tower should not be ignored in the seismic design of the floating system cable-stayed bridge. Three different apparent wave velocities of the EC wave, which were308 m/s, 616 m/s, and 1232 m/s, respectively, were
selected to calculate the displacement response ratios among the non-uniform excitations and the corre-sponding uniform excitations. The longitudinal and vertical displacement ratios of the main girder at mid-span are described (Fig. 7).
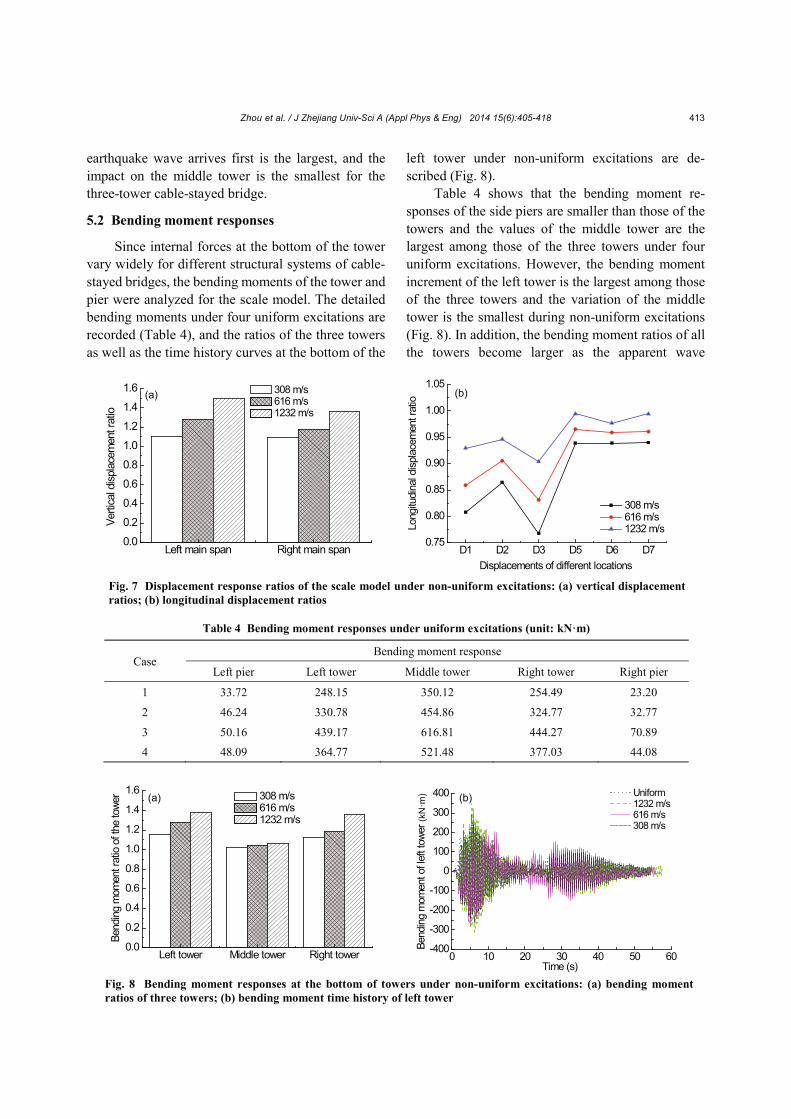
Fig. 7 indicates that all the vertical displacement ratios of the main spans are larger than 1.0 while all the longitudinal ratios of the scale model are smaller than 1.0 no matter how much the apparent wave ve-locity is. In other words, the vertical displacement of the main girder increases while the longitudinal dis-placement at the top of the tower and at the end of the deck decreases after considering the traveling wave effects. The displacement responses become larger as the apparent wave velocity increases, especially for the prominent amplification of 1232 m/s. Among the displacement response ratios at the top of the three towers, the variation of the middle tower is the smallest, and the variation of the left tower is the largest. The similar phenomenon is also occurring in the relative displacement between the tower and deck. Therefore, the influence of the apparent wave velocityon the displacement of the side tower where the
Table 3 Displacement responses of the scale model under uniform excitations (unit: mm)
Case Displacement responseD1 D2 D3 D4 D5 D6 D7 D8 D9 D10
1 6.6 7.6 6.5 2.4 2.2 2.2 2.2 2.3 5.6 5.9 2 7.0 10.9 7.1 3.1 2.8 2.9 2.8 3.1 7.4 7.6 3 8.0 12.4 7.8 4.1 3.8 3.9 3.8 4.2 10.0 10.2 4 7.6 11.5 7.4 3.6 3.3 3.4 3.3 3.5 8.3 8.5
D1, D2, D3: top displacements of the left tower, the middle tower, and the right tower; D4, D8: left and right end displacements of the main girder; D5, D6, D7: relative displacements between the main girder and the left tower, between the main girder and the middle tower, and between the main girder and the right tower; D9, D10: vertical displacements of the left mid-span and the right mid-span
Fig. 5 Three types of multi-support excitations (unit: cm)
No.1 Table No.2 Table No.3 Table
1. Uniform excitations:
2. Uniform excitations:
3. Non-uniform excitations:
Four different waves
four different values of EC wave
four different velocities of EC wave
616 61690 1601732
90160
EC wavesWC wavesJX wavesHK waves
Peak value of 1 m/s2
Arrival time of 0 s
Peak value of 2 m/s2
Peak value of 3 m/s2
Peak value of 4 m/s2
Arrival time of 0 sArrival time of 0 sArrival time of 0 s
EC wavesWC wavesJX wavesHK waves
Peak value of 1 m/s2
Arrival time of 0 s
Peak value of 2 m/s2
Peak value of 3 m/s2
Peak value of 4 m/s2
Arrival time of 0.5 sArrival time of 1 sArrival time of 2 s
EC wavesWC wavesJX wavesHK waves
Peak value of 1 m/s2
Arrival time of 0 s
Peak value of 2 m/s2
Peak value of 3 m/s2
Peak value of 4 m/s2
Arrival time of 1 sArrival time of 2 sArrival time of 4 s
Zhou et al. / J Zhejiang Univ-Sci A (Appl Phys & Eng) 2014 15(6):405-418412
Fig. 6 Acceleration responses comparison of deck(a), (c), (e), and (g): vertical comparison under Case 1, 3, 7, and 10; (b), (d), (f), and (h): transverse comparison under Case 1, 3, 7, and 10
0 5 10 15 20 25 30 35 40 45 50 55Time (s)
1210
86420
-2-4-6-8
-10
Tran
sver
seac
cela
ratio
n(m
/s2 )
FEATest
(h)
0 5 10 15 20 25 30 35 40 45 50 55Time (s)
15
10
5
0
-5
-10
-15
Ver
tical
acce
lara
tion
(m/s
2 )
FEATest
(g)
0 10 20 30 40 50 60Time (s)
8
6
4
2
0
-2
-4
-6
-8
Ver
tical
acce
lara
tion
(m/s
2 )
FEATest
(e)
0 10 20 30 40 50 60Time (s)
4
3
2
1
0
-1
-2
-3
-4
Tran
sver
seac
cela
ratio
n(m
/s2 ) FEA
Test
(f)
0 2 4 6 8 10 12 14 16 18 20 22Time (s)
15
10
5
0
-5
-10
-15
Ver
tical
acce
lara
tion
(m/s
2 )
FEATest
(c)
0 2 4 6 8 10 12 14 16 18 20 22Time (s)
1086420
-2-4-6-8
-10-12
Tran
sver
seac
cela
ratio
n(m
/s2 )
FEATest
(d)
0 5 10 15 20 25 30 35 40 45 50 55Time (s)
3
2
1
0
-1
-2
-3
Tran
sver
seac
cela
ratio
n(m
/s2 )
FEATest
(b)
0 5 10 15 20 25 30 35 40 45 50 55Time (s)
4
3
2
1
0
-1
-2
-3
-4
Ver
tical
acce
lara
tion
(m/s
2 )
FEATest
(a)
Zhou et al. / J Zhejiang Univ-Sci A (Appl Phys & Eng) 2014 15(6):405-418 413
earthquake wave arrives first is the largest, and the impact on the middle tower is the smallest for the three-tower cable-stayed bridge.
5.2 Bending moment responses
Since internal forces at the bottom of the tower vary widely for different structural systems of cable-stayed bridges, the bending moments of the tower and pier were analyzed for the scale model. The detailed bending moments under four uniform excitations are recorded (Table 4), and the ratios of the three towers as well as the time history curves at the bottom of the
left tower under non-uniform excitations are de-scribed (Fig. 8).
Table 4 shows that the bending moment re-sponses of the side piers are smaller than those of the towers and the values of the middle tower are the largest among those of the three towers under four uniform excitations. However, the bending moment increment of the left tower is the largest among those of the three towers and the variation of the middle tower is the smallest during non-uniform excitations (Fig. 8). In addition, the bending moment ratios of all the towers become larger as the apparent wave
Fig. 7 Displacement response ratios of the scale model under non-uniform excitations: (a) vertical displacement ratios; (b) longitudinal displacement ratios
Left main span Right main span0.0
0.2
0.4
0.6
0.8
1.0
1.2
1.4
1.6
Verti
cal d
ispla
cem
ent r
atio
308 m/s616 m/s1232 m/s
(a)
D1 D2 D3 D5 D6 D70.75
0.80
0.85
0.90
0.95
1.00
1.05
Long
itudi
nal d
ispla
cem
ent r
atio
Displacements of different locations
308 m/s616 m/s1232 m/s
(b)
Fig. 8 Bending moment responses at the bottom of towers under non-uniform excitations: (a) bending moment ratios of three towers; (b) bending moment time history of left tower
Left tower Middle tower Right tower0.0
0.2
0.4
0.6
0.8
1.0
1.2
1.4
1.6
Bend
ing
mom
ent r
atio
of t
he to
wer 308 m/s
616 m/s1232 m/s
(a)
0 10 20 30 40 50 60-400
-300
-200
-100
0
100
200
300
400
Bend
ing
mom
ent o
f lef
t tow
er
Uniform 1232 m/s 616 m/s 308 m/s
Time (s)
(b)
(kN
·m)
Table 4 Bending moment responses under uniform excitations (unit: kN·m)
CaseBending moment response
Left pier Left tower Middle tower Right tower Right pier
1 33.72 248.15 350.12 254.49 23.20
2 46.24 330.78 454.86 324.77 32.77
3 50.16 439.17 616.81 444.27 70.89
4 48.09 364.77 521.48 377.03 44.08

Zhou et al. / J Zhejiang Univ-Sci A (Appl Phys & Eng) 2014 15(6):405-418414
velocity increases. Therefore, the traveling wave effect has an adverse impact on the internal force of the towers. The influence on the side tower where the earthquake wave arrives first is also the largest, and that on the middle tower is also the smallest for the three-tower cable-stayed bridge.
6 Collapse and failure analysis
The explicit dynamic model established in LS-DYNA was also an FE model, which was similar to the above single girder model in ANSYS without the modal validation. Due to space limitation, only part of the numerical simulation analysis about the collapse and failure mode of the scale model during only two different seismic excitations were reported and the corresponding discussions were given in this study. To explore the failure mode of the scale model during strong earthquakes and to demonstrate the collapse process of the components, two earthquakewaves of the JX wave and EC wave with the accel-eration peak value of 4.0 m/s2 were selected as the bi-direction input excitations in the numerical simu-lation. The time history curves of the two waves are described (Fig. 9).
6.1 Failure mode of the scale model under the EC wave
The whole process of the components failure of the scale model can be demonstrated in an animation form using the software of LS-PREPOST and the failure conditions at several key times during the EC wave excitation are displayed (Fig. 10). The failure process indicated that the slight vibrations of the cable can be visible at 2.2 s which was the moment for the EC wave with the peak value, at the same time, which can also arouse the small horizontal displacement of the towers. However, the vibration effect can be re-duced when the earthquake was passing away. The vertical vibration of the main girder aggravated and the torsion phenomenon of the cables emerged at 53.7 s. During the whole action process, no obvious vibration of the towers occurred. The bearing springs of the middle tower were stretched sharply at 20.5 s, according to the profile chart, and the failure state of the bearing was assumed to occur at this time. This
kind of phenomenon was consistent with the shaking table test results (Zong et al., 2014).
6.2 Failure mode of the scale model under the JX wave
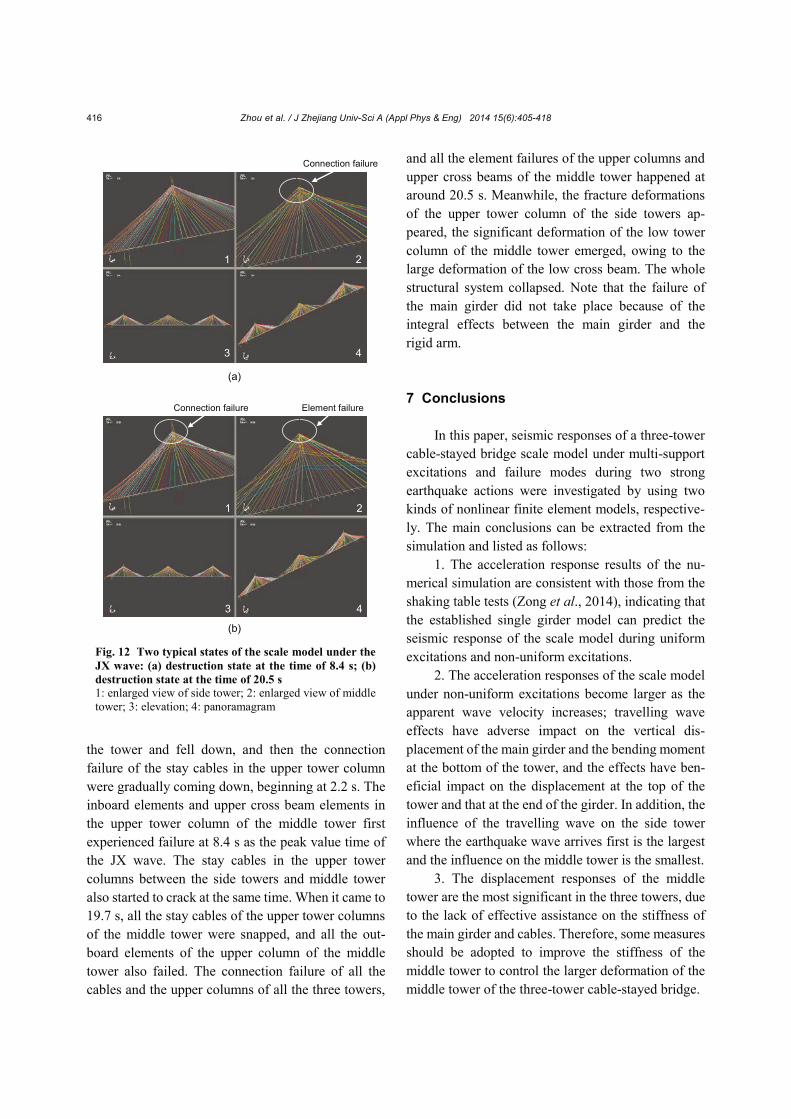
Considering that the seismic response of the scale model under the JX wave among the four wave excitations was the largest, the whole process for the components failure of the scale model under the JX wave was also simulated. The failure conditions of several key times are presented (Fig. 11), and two typical failure modes for the scale model under the JX wave with the LS-DYNA are shown (Fig. 12).
These results showed that the small deformation of the bearing spring elements between the middle tower and the main girder had occurred and the slight visible vibrations of the cables appeared at the time of 0.8 s, and then the deformation of the bearing devel-oped and the vibration of the cables gradually in-creased. The cable at the highest point of the upper tower column of the middle tower was separated from
0 3 6 9 12 15 18 21-4
-3
-2
-1
0
1
2
3
4
Time (s)
Acce
lerat
ion(m
/s2 )
0 5 10 15 20 25 30 35 40 45 50 55-5-4-3-2-101234
Time (s)
Acce
lera
tion
(m/s
2 )
Fig. 9 Time history curves of two input excitations: (a) EC wave; (b) JX wave
(a)
(b)

Zhou et al. / J Zhejiang Univ-Sci A (Appl Phys & Eng) 2014 15(6):405-418 415
Fig. 10 Failure mode of the scale model under the EC wave(a) 0 s; (b) 2.2 s (peak value point): slight vibration of the cables; (c) 20.5 s: failure of the bearing at the middle tower; (d) 53.7 s: torsional vibration of the cables
(a) (b) (c) (d)
Fig. 11 Failure mode of the scale model under the JX wave(a) 0 s; (b) 0.8 s: vibration of the cables; (c) 2.2 s: connection failure of the cables and middle tower; (d) 8.4 s (peak value point): element failure of the inner upper column of the middle tower; (e) 19.7 s: connection failure of all the cables and middle tower, and all element failure of the upper column of the middle tower; (f) 20.5 s: connection failure of all the cables and three upper towers, and all element failure of the upper column and cross beam of the middle tower
Left Right(a)
(b)
(c)
(d)
(e)
(f)
Connection failure Connection failure
Connection failure Connection failure Element failure
Connection failure Connection failure Element failure Element failure Element failure
Connection failure Connection failure Element failure
Zhou et al. / J Zhejiang Univ-Sci A (Appl Phys & Eng) 2014 15(6):405-418416
the tower and fell down, and then the connection failure of the stay cables in the upper tower column were gradually coming down, beginning at 2.2 s. The inboard elements and upper cross beam elements in the upper tower column of the middle tower first experienced failure at 8.4 s as the peak value time of the JX wave. The stay cables in the upper tower columns between the side towers and middle tower also started to crack at the same time. When it came to19.7 s, all the stay cables of the upper tower columnsof the middle tower were snapped, and all the out-board elements of the upper column of the middle tower also failed. The connection failure of all the cables and the upper columns of all the three towers,
and all the element failures of the upper columns and upper cross beams of the middle tower happened at around 20.5 s. Meanwhile, the fracture deformations of the upper tower column of the side towers ap-peared, the significant deformation of the low tower column of the middle tower emerged, owing to the large deformation of the low cross beam. The whole structural system collapsed. Note that the failure of the main girder did not take place because of the integral effects between the main girder and the rigid arm.
7 Conclusions
In this paper, seismic responses of a three-tower cable-stayed bridge scale model under multi-support excitations and failure modes during two strong earthquake actions were investigated by using two kinds of nonlinear finite element models, respective-ly. The main conclusions can be extracted from the simulation and listed as follows:
1. The acceleration response results of the nu-merical simulation are consistent with those from the shaking table tests (Zong et al., 2014), indicating that the established single girder model can predict the seismic response of the scale model during uniform excitations and non-uniform excitations.
2. The acceleration responses of the scale model under non-uniform excitations become larger as the apparent wave velocity increases; travelling wave effects have adverse impact on the vertical dis-placement of the main girder and the bending moment at the bottom of the tower, and the effects have ben-eficial impact on the displacement at the top of the tower and that at the end of the girder. In addition, the influence of the travelling wave on the side tower where the earthquake wave arrives first is the largest and the influence on the middle tower is the smallest.
3. The displacement responses of the middle tower are the most significant in the three towers, due to the lack of effective assistance on the stiffness of the main girder and cables. Therefore, some measures should be adopted to improve the stiffness of the middle tower to control the larger deformation of the middle tower of the three-tower cable-stayed bridge.
(a)
Connection failure
Fig. 12 Two typical states of the scale model under the JX wave: (a) destruction state at the time of 8.4 s; (b) destruction state at the time of 20.5 s1: enlarged view of side tower; 2: enlarged view of middle tower; 3: elevation; 4: panoramagram
4
21
3
(b)
Element failure Connection failure
4
21
3
4
21
3
Zhou et al. / J Zhejiang Univ-Sci A (Appl Phys & Eng) 2014 15(6):405-418 417
4. The constructed explicit dynamic model can predict the failure modes and collapse process of the scale model by using the LS-DYNA. Only the bearing of the middle tower failure occurred under the EC wave excitation of 4.0 m/s2. Under the JX wave ex-citation of 4.0 m/s2, the connection failure started between the cables and upper columns of all three towers, and then the elements failure occurred in the upper tower column and the upper cross beam in the middle tower. The whole structural system collapsed in the end. This kind of analysis may be referenced as the basis for the collapsed failure control of the cable-stayed bridge with large span during a strong earthquake.
ReferencesAbdel-Ghaffar, A.M., Nazmy, A.S., 1991. 3D nonlinear seis-
mic behavior of cable-stayed bridge. Journal of Struc-tural Engineering, 117(11):3456-3476. [doi:10.1061/(ASCE)0733-9445(1991)117:11(3456)]
Allam, S.M., Datta, T.K., 1999. Seismic behavior of cable-stayed bridges under multi-component random ground motion. Engineering Structures, 21(1):62-74. [doi:10.1016/S0141-0296(97)00141-7]
Bao, L.X., Li, X.Z., Wei, X., et al., 2008. Evaluation of seismic resistance capacity for Yibin Yangtze River Cable-stayed Bridge. Engineering Mechanics, 25(2):174-182.
Ernst, H.J., 1965. Der e-modul von seilen unter berücksichtigung des durchhanges. Der Bauingenieur,40(2):52-55 (in German).
Fan, L.C., Wang, J.J., Chen, W., 2001. Response characteris-tics of long-span cable-stayed bridges under non-uniform seismic action. China Journal of Computational Me-chanics, 18(3):359-364 (in Chinese). [doi:1007-4708(2001)03-0358-06]
Fang, Y., Li, J.Z., Peng T.B., et al., 2011. Influence of traveling-wave effect on seismic response of a long-span multi-span cable stayed bridge. Journal of Vibration and Shock,29(10):148-152 (in Chinese). [doi:10.3969/j.issn.1000-3835.2010.10.030]
Gimsing, N.J., Georgakis, C.T., 2011. Cable Supported Bridges: Concept and Design, 3rd Edition. Wiley, Chichester, UK, p.150-160.
Li, Z.X., Huang, J., Ding, Y., et al., 2005. Seismic responses of long-span cable-stayed bridges under different patterns of earthquake excitations. China Journal of Highway and Transport, 18(3):48-53 (in Chinese). [doi:1001-7372(2005)03-0048- 06]
Lin, J.Q., Bai, C.X., Chen, Y.S., et al., 2009. Study on the seismic response of cable-stayed bridges with multi-support excitations. Earthquake Engineering and Engi-
neering Vibration, 29(6):154-161 (in Chinese). LSTC (Livermore Software Technology Corporation), 2006.
LS-DYNA (V970) Keyword User’s Manual. LSTC,Livermore, USA.
Luo, R., Xu, H.R., Li, H.J., et al., 2010. Collapse simulation analysis of the Baihua bridge during the Wenchuan earthquake. The 8th Academic Conference Symposiumon the National Earthquake Engineering (I), Chongqing,China (in Chinese).
Nazmy, A.S., Abdel-Ghaffar, A.M., 1990a. Non-linear earth quake-response analysis of long-span cable-stayed bridges: applications. Earthquake Engineering & Struc-tural Dynamic, 19(1):63-76. [doi:10.1002/eqe.4290190107]
Nazmy, A.S., Abdel-Ghaffar, A.M., 1990b. Three-dimensionalnonlinear static analysis of cable-stayed bridges. Com-puter and Structures, 34(2):257-271. [doi:10.1016/0045-7949(90)90369-D]
Nazmy, A.S., Abdel-Ghaffar, A.M., 1992. Effects of ground motion spatial variability on the response of cable-stayed bridges. Earthquake Engineering & Structural Dynamics,21(1):1-20. [doi:10.1002/eqe.4290210101]
Okamoto, Y., Nakamura, S., 2011. Static and seismic studies on steel/concrete hybrid towers for multi-span cable-stayed bridges. Journal of Constructional Steel Research,67(2):203-210. [doi:10.1016/j.jcsr.2010.08.008]
Pantaleon, M.J., Ramos, O.R., Ortega, G., et al., 2010. Dy-namic analysis of a composite cable-stayed bridge:Escaleritas viaduct. Journal of Bridge Engineering, 15(6):653-660. [doi:10.1061/(ASCE)BE.1943-5592.0000116]
Ren, W.X., Makoto, O., 1999. Elastic-plastic seismic behavior of long span cable-stayed bridges. Journal of Bridge En-gineering, 4(3):194-203. [doi:10.1061/(ASCE)1084-0702(1999)4:3(194)]
Ren, W.X., Peng, X.L., Lin, Y.Q., 2005. Experimental and analytical studies on dynamic characteristics of a large span cable-stayed bridge. Engineering Structures, 27(4): 535-548. [doi:10.1016/j.engstruct.2004.11.013]
Self, S.P., Dilger, W.H., 1990. Nonlinear analysis and collapse load of PC cable-stayed bridge. Journal of Structural Engineering, 116(3):829-849. [doi:10.1061/(ASCE)0733-9445(1990)116:3(829)]
Song, W.K., Kim, S.E., 2007. Analysis of the overall collapse mechanism of cable-stayed bridges with different cable layouts. Engineering Structures, 29(9):2133-2142.[doi:10.1016/j.engstruct.2006.11.005]
Wilson, J.C., Gravelle, W., 1991. Modeling of a cable-stayed bridge for dynamic. Earthquake Engineering & Struc-tural Dynamic, 20(8):707-721. [doi:10.1002/eqe.4290200802]
Yoo, H., Na, H.S., Choi, D.H., 2012. Approximate method for estimation of collapse loads of steel cable-stayed bridges.Journal of Constructional Steel Research, 72:143-154.[doi:10.1016/j.jcsr.2011.12.003]

Zhou et al. / J Zhejiang Univ-Sci A (Appl Phys & Eng) 2014 15(6):405-418418
Zavoni, E.H., Vanmarcke, E.H., 1994. Seismic random vibra-tion analysis of multi-support structural system. Journal of Engineering Mechanics, 120(10):1107-1128. [doi:10.1061/(ASCE)0733-9399(1994)120:5(1107)]
Zong, Z.H., Zhou, R., Huang, X.Y., et al., 2014. Seismic
response study on a multi-span cable-stayed bridge scalemodel under multi-support excitations. Part I: shaking table tests. Journal of Zhejiang University-SCIENCE A(Applied Physics & Engineering), 15(5):351-363. [doi:10.1631/jzus.A1300339]
2Seismic response study on a multi-span cable-stayed bridge scale model under multi-support excitations. Part II: numerical analysis
Newmark- 34
4.0 m/s2 El-Centro4.0 m/s2