Embed Size (px)
Citation preview

9
Farm and Food Industry Reformsin the
Republic of Korea
byAllan N Rae
William C Bailey
CAPS

10
Farm and Food Industry Reformsin the
Republic of Korea
ByAllan N Rae and William C Bailey
Published byCentre for Applied Economics and Policy Studies
Massey University, Palmerston NorthNEW ZEALAND
September 1997

11
Foreword
The study of international farm and food industry developments has always been a major focus of theCentre, especially issues emerging in the Asia/Pacific region. The current report is the latest in thistradition, and was initiated through the desire to obtain improved understanding of likely structuraladjustments in Korea’s farm and food sectors over the medium term. The study formed part of acollaborative research project titled “Consequences of Farm and Food Industry Reforms in the Republic ofKorea and New Zealand”, and received funding under the Collaborative Research Projects of the Asia 2000Foundation of New Zealand. We are most grateful for that support.
The Korean institutions with whom we collaborated on this study were the Korea Rural Economics Institute(KREI), the Korea Food Research Institute (KFRI), Seoul National University (SNU) and the APECNational Study Centre at the Korea Institute for International Economic Policy. Under the CollaborativeResearch Program of the Foundation, the overseas collaborators may also be required to contributefinancially to the research, and this was the case in this study. We therefore gratefully thank KREI, KFRIand SNU for the assistance that they provided. We also gratefully acknowledge the inputs provided by stafffrom these organisations, and in particular would wish to recognise the considerable role that the respectivePresidents of KREI and KFRI played in initiating the research programme and helping to ensure itseventual funding. We should also acknowledge the assistance we obtained from the Ambassador and staff atthe New Zealand Embassy in Seoul, both during the project formulation stage and during its conduct, andfrom the New Zealand Dairy Board.
The study was a truly collaborative one and for this reason we prefer not to mention individualcontributions, but extend our thanks to all those with whom we held discussions in Korea. As far as theMassey members of the project were concerned, William Bailey lead research on Korean food distribution(Chapters 5 and 6), while Allan Rae lead the study of food policies, farm production and food consumption(Chapters 2 to 4).
Finally, we acknowledge Mrs Julia Fisher’s contribution in finalising the document for publication, and theassistance of the Centre’s Research Officer, Mr Peter Gardiner.
Allan N RaeWilliam C Bailey

12
Chapter 1
Introduction
RECENT MACROECONOMIC PERFORMANCEUp to about 30 years ago Korea was a poor economy heavily dependent on agriculture. Since theearly 1960s real gross domestic product (GDP) has grown over thirty times making Korea one of themost successful developing countries over the post-war period. Korea is one of the few countries inwhich the transition from a rural to an industrial economy has taken place in a single generation. Amajor factor in this performance was sustained export growth of about 20% annually, and Korea isnow the world’s 11th largest trading country. On 12 December 1996, Korea was admitted to theOrganisation for Economic Cooperation and Development (OECD).
During 1986-88 GDP growth averaged over 12% annually. Since then, economic growth has beensomewhat slower. Export growth began to slow in 1988, and the volume of exports declined by 2%the following year. GDP grew by only 6.2% in 1989, about half the rate of the previous year. Twofactors that contributed to this sudden economic slowdown were the escalation of wages andappreciation of the Korean currency, weakening the competitiveness of Korea’s export sector. Thethreat of deficit trade balances also re-emerged in the late 1980s due to the continued growth inimport demand, fuelled by import liberalisation measures and the currency appreciation. The tradedeficit of 1990 followed four consecutive years of surpluses.

13
Economic growth picked up to 8-9% annually in 1990 and 1991, although it remained slower thanduring the earlier decade. Export volumes recovered to show annual growth of 4-10% while strongimport demand continued and the trade deficit widened. Such faster growth was howeveraccompanied by accelerated inflation and it became clear that overheated domestic demand wasresulting in serious external and domestic imbalances. Tighter fiscal and monetary policies werepursued in 1992, along with efforts to curb investment and stabilise wages. As a result economicgrowth fell to around 5%, the slowest since 1980, but inflationary pressures were reduced as was thetrade deficit through a marked reduction in real import growth. Due to this economic slowdown,inflation continued to fall in 1993, but the sustained growth in exports and only a mild recovery inimport demand lead to a substantial improvement in the trade balance.
Table 1.1 Selected Macroeconomic Trends
Year Percentage change from previous year in Exchange rate Trade balance
Real GDP Real PCE Exportvolumes
Importvolumes
CPI (Won/US$) (US$million)
1987 12.0 7.8 23.8 20.8 3.0 823 7,6591988 11.5 8.8 13.0 14.4 7.2 731 11,4451989 6.2 14.3 -1.9 16.8 5.6 671 4,5971990 8.6 11.1 4.0 14.0 9.3 708 -2,0041991 9.1 10.8 9.9 16.7 9.3 733 -6,9801992 5.1 5.8 8.4 2.0 6.2 781 -2,1461993 5.8 6.3 6.8 6.5 4.8 803 1,8601994 8.6 7.7 14.9 21.5 6.2 803 -3,1461995 9.0 8.3 24.0 21.2 4.5 771 -4,7461996 6.4a na 19.2 11.9 5.0 804 na
a. Growth to the third quarter from a year earlier.Source: IMF
Economic growth recovered in 1994 and 1995 with annual growth rates of around 9%, due to strongexpansion of investment and exports. The demand for imports also increased rapidly over this period,and the trade balance again went into deficit. Inflation, at 4-6% annually, remained low by historicstandards over this period.
Over 1996-97, real GDP growth shows signs of moderating in response to concerns aboutoverheating, and GDP growth of 6.4% is projected for 1997 (Far Eastern Economic Review)following similar growth in 1996. The current account deficit reached a record level in 1996, and theworst labour unrest in the country’s history occurred in reaction to labour market reforms. Due to astrong world economy exports will grow steadily, but at slower rates than in 1995-96. Growth in realexports and imports is projected at 11% for 1997, and trade deficits are also forecast for 1997(PECC, 1996). In fact the trade deficit widened to US$5.5 billion two months into 1997 following astrike-induced drop in exports (Far Eastern Economic Review) and the Won has depreciated to

14
around 860 per US$. Consumer price inflation should also moderate to less than 4% in 1997 and thereduction in import demand has become a major priority.
Important factors in explaining Korea’s success include its strong outward orientation, economicincentives that reflected market realities and flexible macroeconomic management (World Bank).Further internationalisation is a policy challenge for Korea. During the last decade much progresswas made in trade liberalisation, but with the notable exceptions of agricultural products andservices. Agricultural trade barriers are now being lifted as the Uruguay Round AgriculturalAgreement is implemented, and further liberalisation of the services sector is also planned. Steps arealso being put in place to liberalise the financial and capital markets and to improve their integrationwith global markets. Other challenges for the future are the management of emerging environmentalissues, particularly air and water pollution and land degradation (see Rae and Meister 1995 for adiscussion of these issues with respect to Korean agriculture). Finally, despite substantialinvestments, economic growth is outstripping infrastructural capacity in several areas, including thetransport and distribution sectors.
THE RELATIVE DECLINE OF AGRICULTURE IN KOREAShare of output and employmentUp until the 1960s Korea was a developing agricultural economy, with the farm and food sectoremploying about half of the work force and contributing a similar proportion to GDP. But it is acommon observation that as an economy grows and develops through time, the relative contributionof agriculture to economic activity declines. Korea has been no exception, and resources have movedout of the agricultural sector to the rapidly developing industrial sectors, and agriculture’scontributions to national gross domestic product and employment have declined. By the mid-1980s,agriculture accounted for around 10% of gross domestic product and provided jobs for 20% of thelabour force. The structure of the Korean economy has continued to change rapidly, and by 1995agriculture contributed only 5% to the total output of the economy. Table 1.2 shows the rate atwhich this decline has occurred in recent times. While the nation’s output (measured by real GDP)has almost doubled between 1987 and 1995, that of agriculture increased very little. Henceagriculture’s share of total GDP almost halved over this period
The employment situation is not too different. The number of people employed in Korea increased byabout 25% from 1987 to 1995, while the number employed in the agricultural and forestry sector fellby almost 30%. Therefore agriculture and forestry’s share of total employment declined over thisperiod from around 20% to 12%. The total farm population has also declined in both relative andabsolute terms. While the total Korean population increased from 32.2 million in 1970 to 44.6million in 1995, the total farm population declined from 14.4 million to 4.8 million over the sameperiod. Thus over this time, the agricultural sector contributed about 400,000 persons annually to thenon-agricultural sector (Kim, 1995). Due to the emigration of young people out of the countryside,the average age of farmers has increased rapidly. In 1970, 54% of the farm population was under

15
the age of 20 years. This percentage had decreased to 25% by 1994, when about 44% of the farmpopulation was aged 50 years or older, and one-third was over the age of 60.
Table 1.2 Agriculture’s Declining Contribution to Output and Employment
Gross Domestic Product Employment
constant 1990 prices (billion Won) (‘000 persons)
Total Agriculture Agriculture Total Agriculture Agricultureas % total as % total
1987 138,499 12,745 9.2 16,354 3,400 20.81988 154,111 14,158 9.2 16,869 3,319 19.71989 163,950 13,948 8.5 17,560 3,291 18.71990 179,539 13,262 7.4 18,085 3,100 17.11991 195,936 13,442 6.9 18,612 2,935 15.81992 205,860 14,218 6.9 18,961 2,869 15.11993 217,699 13,650 6.3 19,253 2,713 14.11994 236,375 13,793 5.8 19,837 2,586 13.01995 257,536 14,405 5.6 20,377 2,424 11.9
Note: Agriculture comprises agriculture and forestry.Source: Ministry of Agriculture and Forestry
While the total area of land used in the agricultural sector has not declined as rapidly as has labouremployment, demands from other uses such as residential, industrial, recreational and forinfrastructural developments has drawn land out of farming. During the 1970s and 1980s, between10,000 and 15,000 ha of farmland were converted to other uses annually (Kim, 1995). From 1985 to1995, the total area of cultivated land declined from 2.59 million ha to 2.20 million hectares,resulting in an average loss of about 40,000 ha per year.
Comparative disadvantage in agricultureKorea’s comparative disadvantage in food production has steadily worsened over recent decades. In1970, the share of all food and agricultural raw materials in Korea’s total exports was 81% of theshare of the same commodities in global trade (see Table 1.3). By 1990 it had declined to 37%; thatis, while agriculture’s share of global exports had declined over the past two decades, its share ofKorean exports had declined even faster. This can be interpreted as an indicator of a strengthening ofKorea’s comparative disadvantage in agricultural production. Only for manufactured goods has theirshare in Korea’s total exports been greater than manufactures’ share of global exports, but even herethe Table suggests a decline in Korea’s manufacturing comparative advantage over the past decade.

16
Table 1.3 Korean Export Specialisation Indices
Commodity group 1970 1980 1990
Food & agric. raw materials 0.81 0.59 0.37Fuels & minerals 0.41 0.05 0.13Manufactures 1.26 1.65 1.32
Note: Indices are the commodity’s share of Korean exports relative to the same commodity’sshare of global exports
Source: UNCTAD
The decline in food self-sufficiencyWith its rapidly rising standard of living, real consumption expenditures of Korean households haveincreased almost threefold over the two decades following 1975. Expenditure on foods and beverageshas also increased, but by not as much. Thus the proportion of household expenditures spent on foodhas declined, and therefore that on non-food items has risen, giving rise to a relative decline in thedemand for food. Average household expenditure data show that the percentage of total consumptionexpenditure spent on food and beverages declined from 49% in 1975 to 38% in 1985 and 29% in1995 (National Statistical Office). There has also been a marked shift in consumption patterns, awayfrom traditional cereals to livestock products and fruit, along with a rapid increase in food purchasesoutside of the home.
Despite high levels of protection, food production in Korea has failed to keep up with the rapidgrowth in consumption and self-sufficiency levels for most major crops has fallen. Food selfsufficiency has declined for all products shown in Table 1.4, the most notable being for cereals andbeef. Grains self-sufficiency has fallen sharply as the livestock sector has expanded. Domesticutilisation of maize, primarily as animal feed, has increased by nearly three times since 1985 asconsumption of livestock products has rapidly expanded, and Korea is now almost totally reliant onimports for supplies of maize. With regard to beef, total supplies on the Korean market almostdoubled from 1985 to 1995, while domestic beef production remained the same in both years.

17
Table 1.4 Annual Food Self-sufficiency Rates (%)
Food group 1970 1980 1990 1995
Cereals 78.2 53.3 43.8 30.1 of which: rice 93.1 95.1 108.3 91.1 wheat 15.4 4.8 0.1 0.3 maize na 5.9 1.9 1.1Fruit 100.2 98.6 102.5 93.0Meat 100.0 97.4 92.9 89.2 of which: beef 98.0 93.0 53.6 51.4Milk products na 109.7 92.8 93.3Fish 115.1 132.7 121.7 100.6
Source: KREI (1995)
KOREA-NEW ZEALAND TRADETotal merchandise trade between New Zealand and Korea reached almost NZ $1.4 billion in the yearending December 1996, comprising about $1 billion in exports to and $0.4 billion in imports fromKorea (Table 1.5). New Zealand’s exports to Korea have been trending upwards at a somewhatfaster rate than the growth in New Zealand’s total exports, so the share of exports to Korea has risenfrom around 2% in the mid-1980s to over 5% in 1995. Korea’s share in New Zealand’s total importsappears to show little trend, remaining at a little over 1.5% throughout the 1990s. New Zealand’strade surplus with Korea in 1996 was larger than that with any other trading partner.
Table 1.5 New Zealand’s Merchandise Trade with Korea
Year endingDecember
Exports to Korea % of totalexports
Imports from Korea % of totalimports
(NZ$ millions fob) (NZ$ millions cif)
1988 312.6 2.4 269.5 2.41989 493.4 3.4 291.4 2.01990 672.3 4.4 256.5 1.61991 721.0 4.5 246.4 1.71992 753.6 4.3 262.9 1.51993 926.3 4.9 284.1 1.61994 985.1 5.0 322.1 1.61995 1,078.7 5.3 363.2 1.71996 (p) 983.3 4.8 395.3 1.8
(p) ProvisionalSource: Ministry of Foreign Affairs and Trade

18
Korea is a major market for some New Zealand commodities, particularly wood, hides, skins andleather and aluminium. Korea has become increasingly important as a market for wood andaluminium, but somewhat less so in the case of hides and skins. Korea has become an importantdestination for New Zealand beef since that market has been gradually opened from the late-1980s.Casein is the only dairy product exported from New Zealand for which Korea has been an importantdestination, although this entirely reflects the trade barriers in place. Korea imports around 4-5% ofNew Zealand’s total fish exports, and a small but increasing share of kiwifruit exports. Korea hasnever been a major market for sheepmeat, and less than 1% of New Zealand’s total exports areconsigned there. Korea’s share of New Zealand wool exports has also declined to less than 1%.
Table 1.6 Korean Market Share (%) for Selected New Zealand Commodity Exports
Yearended Dec.
Beef Hides,skins &leather
Casein Fish Wood Wood pulp Aluminium
1988 0.1 13.3 4.6 3.1 7.6 9.6 0.51989 0.6 19.7 7.2 5.4 8.6 10.4 6.61990 1.7 25.6 4.2 5.0 5.0 13.0 10.81991 3.5 30.7 5.5 7.5 15.2 10.1 6.71992 2.4 27.5 5.7 5.1 15.5 5.4 12.91993 3.5 24.4 5.4 3.7 20.7 10.4 15.51994 5.8 20.2 4.3 4.4 18.1 9.6 15.81995 6.6 17.4 4.8 3.7 24.1 9.9 17.41996 (p) 6.1 16.7 5.1 4.4 22.8 6.1 15.7
(p) ProvisionalSource: Ministry of Foreign Affairs and Trade

19
SUMMARYKorea has developed from a rural to an industrial country and a member of the OECD in little morethan a single generation. Although the rate of development has slowed down somewhat in recentyears, the economy has still been growing by 6-9% annually. Macroeconomic problems intensifiedduring the 1990s, including inflation approaching 10%, record trade deficits and periods of weakdemand.
Agricultural sector output has been static during the past 10 years, so its contribution to the totaleconomy has fallen significantly, as has its contribution to employment. Substantial reallocation oflabour and land from agriculture to other sectors in the economy continues. Despite high levels ofprotection, domestic food production could not keep pace with demand and self-sufficiency has fallenfor many products. New Zealand has taken advantage of the increase in food import demand, andKorea has become an increasingly important destination for New Zealand beef. Other productsexported from New Zealand for which Korea is a significant destination include wood, hides and skinand aluminium.
20
Chapter 2
Agricultural Policy Developments
INTRODUCTIONThe major objectives of Korean agricultural policy were prescribed in the Agricultural Basic Law of 1965,to provide adequate food supplies, to increase farm incomes and to achieve comparable living standards tourban residents, to maintain price stability and to preserve the vitality of rural communities. During the1960s and 1970s main emphases of policies were on increasing production and food self-sufficiency andraising farm incomes. More recently, improving the quality of rural life, preserving the environment,achieving greater market orientation and improving agricultural technologies and productivity have becomemore important. In the 1990s pressure from Korea’s trade partners to liberalise imports intensified, and wasmet with often vehement opposition and protest from powerful farmers’ organisations. This coincided withthe completion of the Uruguay Round of trade negotiations, and the Korean government’s agreement toundertake various agricultural and trade policy reforms.
High support prices, various subsidies to farmers, and trade barriers had in many cases driven food prices inKorea well above world levels. Estimates of the nominal rate of protection1 suggest movements through timefrom -15% (when domestic prices were estimated to be below international levels) in 1960, to 30% by theearly 1970s and to over 100% by 1988 (Kim, 1995 p180). For some commodities such as rice, beef, applesand dairy products, domestic prices have been well over 100% above world prices, for example over fivetimes as high in the case of rice. Estimates of producer subsidy equivalents (PSEs) for Korean agricultureinclude 71% for 1991, suggesting that over 70% of farmers’ revenues resulted from government policies ofone kind or another. For milk and beef, the PSEs were 69% and 76% respectively. While boosting farmincomes, such policies have also imposed considerable costs on Korean consumers and would havesuppressed the growth of the domestic market for such foods. Consumer costs for beef and milk, for 1The percentage by which domestic food prices exceed their import cost.
21
example, were estimated to have been raised by 72% and 82%, respectively, due to the protective policies(USDA).
In the livestock sector, border measures have been the main instruments used to provide support to farmerswith the objectives of maintaining and stabilising prices well above world levels. Prior to the late 1980s, theKorean government in some years would ban the import of beef (such as between 1985 and 1987). Theannual volume of beef imports was set by government reflecting their domestic supply and demandprojections, and exporters would tender for a share of the quota. Since 1993, the “simultaneous buy/sell”system was allocated a part of the quota, for which suppliers are able to negotiate conditions directly withorganisations representing the end-users. However, a “mark-up” had to be applied to prevent undercuttingof domestic price levels.
The Korean dairy industry has been effectively shut off from international competition through substantialnon-tariff barriers including shelf-life limits, quotas and import licensing. While the tariff rates have been inthe order of 20-40%, import volumes have generally been very low. For example in 1993, Korea’s totalimports of butter, cheese and milk powders was only 16,000 tonnes compared with imports of 199,000tonnes by Japan (Podbury et al, 1995). The latter publication also estimated that producer prices for milk inKorea were more than three times the average Australian price in 1993, such has been the effectiveness ofthe non-tariff barriers to imports. Casein has been New Zealand’s major dairy product export to Korea towhich a tariff of 20% applied.
Domestic pressures are building for comprehensive reforms of agricultural policies, in addition to thoseagreed during the Uruguay Round. The agricultural sector is now a much smaller contributor to nationaleconomic activity than was the case in the past, and industrial growth has drawn resources out ofagriculture. Farming does not appeal to many rural youth, who migrate to the cities for employment. Urbanresidents are beginning to demand lower food prices, and support within some government ministries forcontinuance of past levels of assistance to agriculture appears to be waning. Pressures for reform are alsoarising from participants in the land market, with growing demand for land for such non-agricultural usesas housing, roads and industrial use.
STRUCTURAL ADJUSTMENT AND DEVELOPMENT PLANS OF THE 1990sThe Agricultural and Fisheries Restructuring Plan (1991)In response to the changing agricultural policy environment, the Korean government introduced in 1991 a10-year plan (later shortened to a 1998 completion) that focussed on structural adjustment to improveagricultural productivity, competitiveness and rural living conditions. Named the “Agricultural andFisheries Restructuring Plan”, it was allocated a total budget of Won 42 trillion (NZ$74 billion).2 The Plangave major emphasis to land reform as a means toward realising economies of size in farming.“Agricultural promotion zones” were established, and self-employed young farmers within such zones werepermitted to own up to 20 ha of farmland, rather than the 3 ha previously allowed. Labour-oriented reformsincluded special job training programmes for those who wish to leave farming or take part-time work off
2 Using an exchange rate of won 567 per NZ$.

22
their farm, a retirement and welfare plan for those who wish to leave farming, and the provision of trainingand long-term credits for young farming successors. Of the Won 42 trillion budget, about Won 36 trillionwas allocated to restructuring the farm sector, and its planned distribution across the various programmes isgiven in Table 2.1.
Table 2.1 Investment Plans for Agricultural Restructuring: 1992-98
Aim Total funding 1992-98 Main activities
(Won trillion)
Fostering full-time farmers 2.4 Supporting future leaders and 150,000households in full-time farming
Modernised production base 8.6 Land improvement, drainage, irrigation,roading
Mechanisation 3.1 Credit for purchases, formation ofmachinery-users groups
Increasing farm size 2.5 Purchase and sale of farmland
Improvements to livestockstructures
5.5 Breeding, facilities and waste treatment
Development of technology 1.2 R&D and extension
Improvements in distribution 2.2 Wholesale and retail market facilities
Modernisation of horticulture
1.8 Modernising facilities and greenhouses, anddistribution support
Other 8.1 Structural improvements in forestry andfisheries
Total 35.4
Source: Anon (1996)
The Agriculture and Fisheries Development Plan (1994)In 1994 the Korean government introduced the Agriculture and Fisheries Development Plan. This newpackage of policies was introduced in response to rural concerns over the domestic impacts of the negotiatedUruguay Round international trade reforms. KREI (1993) for example had estimated a loss in producersurplus over the period 1995-2001 of Won 7.8 trillion (NZ$14 billion). This Plan is being financed from aspecial tax on the non-agricultural sector (for example, it is levied on stock market transactions, the sale ofcertain luxury goods and interest income), is viewed as compensation to agriculture for the effects oflowering agricultural trade barriers, and is to assist its adjustment to increased international competition. Itis anticipated that the tax will raise a total of Won 15 trillion (NZ$26 billion) over the 10 years 1995-2004.New programmes were introduced and government assistance to agriculture has soared, increasing by some50% per year over the past three years - from around Won 0.4 trillion per year prior to completion of theUruguay Round, to Won 6.0 trillion in 1994 and Won 8.2 trillion in 1995. Similar rates of increase wereexpected up to 1997.

23
The main objectives of these new programmes are structural reform and the achievement of greatercompetitiveness, involving the encouragement of capital-intensive agriculture, a reduction in the number offarms and an increase in farm size. This is to be achieved through the encouragement of retirement of olderfarmers and the entry of younger farmers, and enterprise diversification out of rice towards more profitablecrops (eg horticulture3) and livestock. A large number of programmes have been designed with the use ofsuch instruments as low interest loans and subsidies, which are compatible with Korea’s WTO obligations.Some are classified as “green box”, while others are included in Korea’s aggregate measure of support(AMS) and therefore subject to a reduction commitment. Of the total planned to be raised from the specialtax, 60% is to finance improvements in the competitiveness of farming and fisheries, through activities suchas further land market reforms to permit more flexible use of land, modernisation of farm capital andimprovements in the marketing system. A further 27% of the total expenditures is planned forimprovements to the rural living environment, primarily roading, housing and domestic water supplies. Allsupport programmes are now more transparent, and details have been published and are easily accessible tofarmers and others.
The land policy reforms of 1995/96 were aimed at assisting the increase in the scale of farming. Thereforms have two main components: (i) formerly, only farmers could own farm land. Under the newlegislation any person can own such land, and they need not live on the farm, provided they work for at least30 days each year on their farm; and (ii) the previous limit on farm size was removed - there is now no limiton farm size in the ‘prime land’ zones, and a 20 hectare limit for farms situated in the ‘poorer’ land zones.The prohibition on corporate ownership of farm land has also been removed. The new policy would appearto be encouraging growth in the number of larger farms situated on prime land, and a decline in the totalarea of farmed land in the poorer land zones as areas are converted to such uses as factory sites, hotels andrestaurants.
3For example, the number of greenhouses and glasshouses has increased rapidly over the past five years. Agovernment programme can provide up to 50% of the total investment as a grant and 30% as a subsidisedloan. Many of these enterprises, which might target export markets such as Japan, are said to be in financialdifficulties due to lack of managerial know-how, appropriate technology, marketing skills and the requiredproduct quality.

24
Table 2.2 Planned Allocations of the Special Agricultural Tax
Aim Main activities Total funding
(Won trillion)
Increasing competitiveness land improvement 4.3marketing restructuring 1.5others 3.3
Improving rural living conditions roads 1.2housing 0.8domestic water facilities 1.2others 0.9
Promoting welfare of farmers retirement programmes 0.8hospitals 0.5others 0.5
Total 15.0
Source: Anon (1996)
Rice policy reformRice policy is at the heart of Korea’s agricultural policy, and has also undergone changes in recent times.For many years, the government has operated a dual price system, setting prices and volumes for ricepurchases from producers, with the government’s reselling price lower than its purchase price. As a result,huge financial deficits accrued (reaching NZ$15 billion by 1995) and attracted criticism from the financeministry. Changes were introduced in 1993, with the object of reducing the level of assistance to, and thevolume of, rice production. It was planned to be achieved by reducing the gap between purchase andreselling prices, and using a competitive bidding system to establish a market-based reselling price. Thegovernment purchase price was increased by 4% in 1996 after having been frozen for the previous twoyears, but the quantity of rice purchased by government was reduced by 8% so as reduce direct support inline with Korea’s commitment on Aggregate Measure of Support as part of the Uruguay Round Agreement(see below). Further changes were planned for implementation in 1997, with the government to announce aguideline price and a purchase volume. Farmers may enter into a contract with government with 40% of theprocurement price paid in advance. At harvest time, farmers may then either sell their crop at the marketprice, or to the government. This programme has some obvious similarity to the USA “loan rate” system.
Despite the continued decline in per person and total rice consumption in Korea, there exists some concernwithin government that the diversion of land out of rice production has been too rapid, with stocks reachingvery low levels during 1996. While the government is aiming at a self-sufficiency rate of 96% by 2004(Korea must import the equivalent of 4% of consumption by that year), forecasts suggest that self-sufficiencyis more likely to be the range of 80-85% in 2004. The government is attempting to boost production andyields through a number of programmes, such as plant breeding research to improve yields and quality, andrequests for diversification grants have been declined recently in an attempt to slow the shift out of riceproduction. Also, the entry of younger farmers to rice production and the increase in farm size are bothlikely to provide yield increases. To encourage farm restructuring, a farmer retirement policy was
25
implemented in 1997 which permits direct annual payments to be made for three years to rice farmers aged65 or over who wish to retire and rent or sell their land to full-time farmers. Direct payments to compensatefor income reductions may also be introduced, perhaps tied to environmental objectives or targeted tofarmers in less-favoured regions.
THE URUGUAY ROUND AGREEMENTA summary of Korea’s commitmentsKorea, despite its subsequent entry to the OECD, was able to take advantage of developing countryprovisions in the Uruguay Round (UR) negotiations, and therefore its reduction commitments are less thanthose applied to developed countries. A 10-year, rather than a six-year implementation period also applies.
The “special treatment” clause was applied in the settlement on rice, and a decision on tariffication has beenpostponed till the year 2004. Minimum access quotas have been specified, increasing from 1% to 4% ofdomestic consumption over the period 1995-2004. The in-quota tariff will be maintained at 5% during those10 years, but has not been bound. This special arrangement is to be renegotiated in 2004. The 64,000 tonnesof rice imported during 1996 were sourced mainly from China.
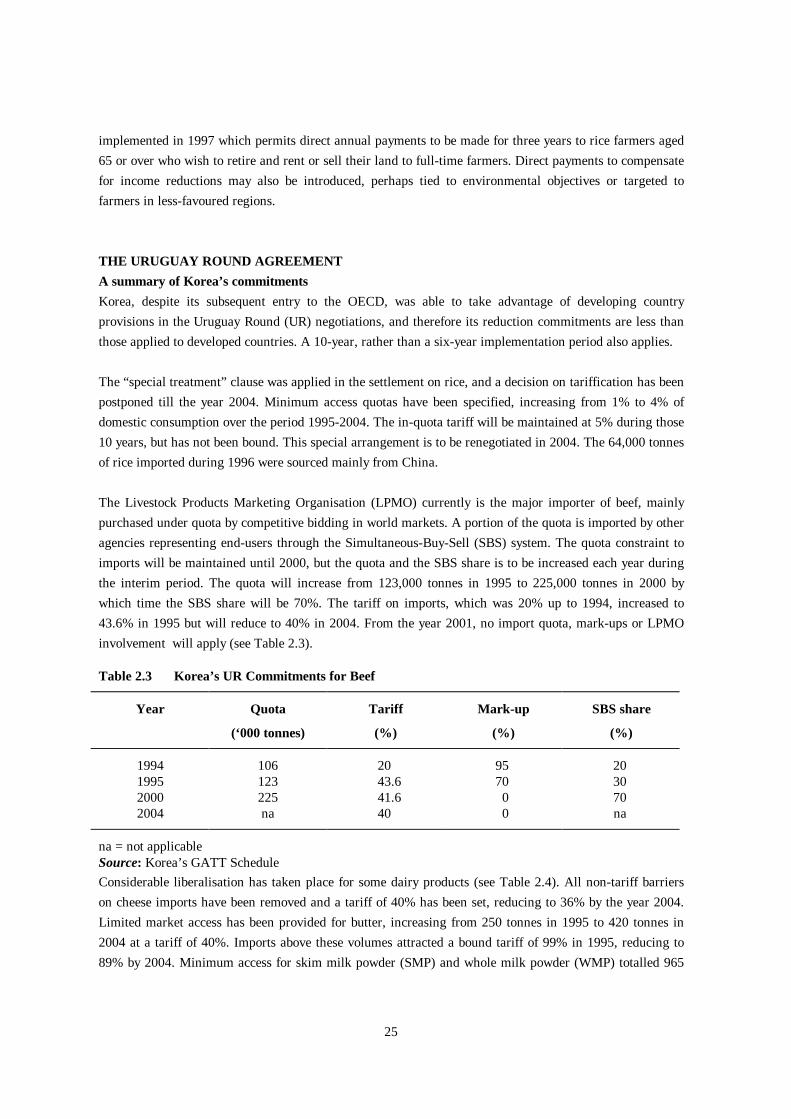
The Livestock Products Marketing Organisation (LPMO) currently is the major importer of beef, mainlypurchased under quota by competitive bidding in world markets. A portion of the quota is imported by otheragencies representing end-users through the Simultaneous-Buy-Sell (SBS) system. The quota constraint toimports will be maintained until 2000, but the quota and the SBS share is to be increased each year duringthe interim period. The quota will increase from 123,000 tonnes in 1995 to 225,000 tonnes in 2000 bywhich time the SBS share will be 70%. The tariff on imports, which was 20% up to 1994, increased to43.6% in 1995 but will reduce to 40% in 2004. From the year 2001, no import quota, mark-ups or LPMOinvolvement will apply (see Table 2.3).
Table 2.3 Korea’s UR Commitments for Beef
Year Quota Tariff Mark-up SBS share
(‘000 tonnes) (%) (%) (%)
1994 106 20 95 201995 123 43.6 70 302000 225 41.6 0 702004 na 40 0 na
na = not applicableSource: Korea’s GATT ScheduleConsiderable liberalisation has taken place for some dairy products (see Table 2.4). All non-tariff barrierson cheese imports have been removed and a tariff of 40% has been set, reducing to 36% by the year 2004.Limited market access has been provided for butter, increasing from 250 tonnes in 1995 to 420 tonnes in2004 at a tariff of 40%. Imports above these volumes attracted a bound tariff of 99% in 1995, reducing to89% by 2004. Minimum access for skim milk powder (SMP) and whole milk powder (WMP) totalled 965

26
tonnes in 1995 and rise to 1607 tonnes by 2004, with within-quota tariffs of 20% (SMP) and 40% (WMP).Imports of these powders over and above the quotas attracted tariffs of 220% in 1995, reducing to 176% in2004. These rates were set in line with base period estimates of the difference between domestic and worldprices. For whey and whey powders, the tariff quota was set at 23,000 tonnes for 1995, increasing to 54,233tonnes by 2004, and a within-quota tariff of 20%. Imports outside this quota will be levied tariffs of 99%(1995) falling to 49.5% by 2004.
Table 2.4 Korea’s UR Commitments for Selected Dairy Products
Product Initial quota Final quota In-quota Base tariff Final tariff
1995 (tonnes) 2004 (tonnes) tariff (%) 1995 (%) 2004 (%)
SMP 621 1,034 20 220 176WMP 344 573 40 220 176Whey/powder 23,000 54,233 20 99 49.5Butter 250 420 40 99 89Cheese na na na 40 36Cocoa & foodpreps.
na na na 30-40 19.7-36
Casein/ates na na na 25 22.5
na = not applicableSource: Korea’s GATT Schedule
For apples and kiwifruit, tariffs are to be progressively reduced from a 1995 base rate of 50% to 45% by theyear 2004. The tariff reductions for peaches and nectarines are from the base rate of 75% to 45%, and forcherries the tariff is to be reduced from 40% to 24%. However, phytosanitary issues currently prevent theexport of products such as apples and stonefruit (codlin moth) and potatoes (nematodes) from New Zealandto Korea. Discussions continue between the New Zealand authorities and those in Korea, and agreementmay eventually be reached over control processes in New Zealand that provide the Korean’s with anacceptable level of risk.
Korea has also agreed to cut back its domestic support expenditures, as measured by the Aggregate Measureof Support (AMS). Total AMS support was calculated at Won 2.25 trillion (NZ$4 billion) over the 1989-91base period, about 90% of which is accounted for by rice expenditures. This amount is to be reduced to afinal bound level of Won 1.49 trillion by the year 2004. This total is however only a portion of the totaldomestic assistance actually received by Korean farmers. This is because many programme payments wereclassified in the Uruguay Round Agreement as “green box” measures, such as structural adjustmentassistance and investment aids, and were exempt from the reduction commitments.
Forecast impacts of the Agreement on Korean agricultural structure and incomesThe assumptions about future price movements (in real terms), on which the following projections depend,are given in the top part of Table 2.5. These recognise that the Korean pork and chicken markets will beliberalised by mid-1997, and that for beef by the year 2001. The domestic prices of animal products areexpected to decline by more than those of crops - due for example to the expected growth in beef and dairy

27
imports. Future growth in imports of fruit, vegetables and rice will be restricted by the minimum marketaccess conditions of the Uruguay Round agreement.
Table 2.5 Uruguay Round Projections: Output Composition
1993 1998 2004 annual % change
Price assumptions (1990=100) rice 108.3 109.7 105.9 -0.20 fruit 107.0 109.1 99.2 -0.69 livestock products 93.0 87.8 77.4 -1.67 of which beef 100.4 98.0 74.2 -2.75
Value of output (Won billion) rice 6,237 6,140 6,072 -0.24 fruit 1,533 1,657 1,725 1.07 livestock products 5,033 5,514 5,782 1.26 of which beef 1,405 1,373 951 -3.55
Share of output (%) rice 31.9 30.4 28.3 fruit 7.8 8.2 8.0 livestock products 25.7 27.3 26.9 of which beef 7.2 6.8 4.4
Source:KREI(1994)
The remainder of Table 2.5 gives projections of the future gross value of domestic production of variousfoods. Intensive horticultural crops, to which Korea producers are currently diversifying, and livestockproduction with the exception of beef, are projected to exhibit the fastest growth rates - fruits and cash cropsby 1.0 - 1.7% annually and some specialist vegetable crops and livestock products (excluding beef) by over2.5% per year. The value of domestic beef output is projected to fall by over 3.5% per year, as will that ofrice by 0.2% annually. The relative contribution of various commodities to gross output changesaccordingly. The share of vegetables may rise from 22% in 1993 to over 25% in 2004, while that oflivestock products (excluding beef) may rise from 18.5% to 22.5% over the same period. Beef’s share oftotal output is projected to decline from 7% in 1993 to 4.4% by 2004, and the share of rice in total outputwill also decline.
Value-added in agriculture (at 1990 prices) may increase at the rate of just under 1% annually up to the year2004, but the rate of growth will be slower for crops than livestock even given the fall in beef production(Table 2.6). While horticultural crops are likely to grow at a faster rate, the reduction in the value of riceand other grains production pulls down the average growth rate for the crops sector. Thus the relativecontribution of this sector to total economic activity will continue to fall significantly given projections of 6 -7% in total Korean GDP growth.
Real incomes per farm household are projected to rise by almost 5% annually up to the year 2004 (Table2.6). The projected growth in incomes earned from farming is 3.3% annually, reflecting a decrease in the

28
number of farms, an increase in average farm size and increases in factor productivity, even thoughagricultural prices are projected to decline. The share of off-farm income in the total income of Korean farmhouseholds, which has always been low relative to that in other Northeast Asian economies, shows almostdouble the rate of growth than does on-farm income. Thus by the year 2004, income earned off the farmmay account for nearly 60% of farm households’ total income.
Table 2.6 Uruguay Round Projections: Farm Incomes and Value-added
1993 1998 2004 annual % change
Value Added (Won billion) crops 11,850 12,123 13,044 0.87 livestock 1,664 1,835 1,872 1.07 total agriculture 13,762 14,214 15,189 0.90
Farm incomes (Won ‘000) on-farm 6,885 8,063 9,851 3.26 off-farm 6,945 9,777 13,870 6.29 total 13,830 17,841 23,720 4.90
off-farm as % total 50.2 54.8 58.5
Source: KREI(1994)
Table 2.7 projects major changes in the agricultural labour force, both in terms of total numbers anddemographics. The total population living on farms is projected to decline by 5% per year up to 2004, butthat of children and teenagers may decline by more than double that rate as farming continues to appear arelatively unattractive career prospect. The total number under the age of 19 years will, by 2004, be only aquarter of the total number in this age group in recent times. Total numbers employed on farms will alsodecline, by between 4% and 5% per year. The projections suggest that teenage farm workers will numberclose to zero by 2004. The projections are made for two scenarios - the first assumes continuation of recenttrends, while the second takes account of implementation of the farmer retirement policy. Under scenario I,farm employees over the age of 60 years will comprise 53% of the total labour force in 2004, while theproportion may be reduced to 48% under scenario II (compared with 34% in 1993). In either case, theaverage age of farmers and farm workers will be above that of today.
Table 2.7 Uruguay Round Projections: Agricultural Population and Farm Size
1993 1998 2004 annual % change
Total farm population (‘000) <19 years 1,457 1,153 392 -11.94 20 - 59 years 2,684 2,389 1,427 -5.58 >60 years 1,267 1,302 1,273 0.04 Total 5,408 4,844 3,092 -5.08
Agricultural employment (‘000) 15 - 19 years 6 2 0 20 - 59 years 1,782 1,247 824 -6.77 >60 (I) 930 1,000 934 0.04

29
>60 (II) 930 934 769 -1.73 Total (I) 2,718 2,249 1,758 -3.96 Total (II) 2,718 2,183 1,593 -4.86
Number of farm households (‘000) 1,592 1,486 1,124 -3.15Persons per household 3.4 3.26 2.75 -1.93Cultivated area (‘000 ha) 2,055 1,975 1,890 -0.8Average farm size (ha) 1.29 1.33 1.68 2.43
Source: KREI (1994) and authors’ estimates
The total cultivated area in Korean agriculture has been projected as a continuation of the past decade’strend and this, combined with a likely 3% annual reduction in the number of farm households, could see theaverage land area per farm household increase from 1.3 ha in recent years to almost 1.7 ha by 2004.
In summary, the projections clearly indicate that Korean agriculture will become increasingly less labourintensive, as this factor of production is substituted by capital, improved managerial skills and moderntechnologies. Farms will be somewhat larger in terms of land area, but even with encouraged retirement theproportion of farmers over the age of 60 will be higher in future than is the case today. While householdincomes earned from farm production will rise due to productivity gains and shifts away from enterpriseslikely to be relatively less profitable in the future liberalised market, that earned off the farm will increaseeven more rapidly so that on average the total earned from non-farm activities will exceed farm income.
Projections of self-sufficiencyKorea’s rate of overall agricultural self-sufficiency is expected to continue to decline, and the same appliesto all major commodities (Table 2.8). KREI (1994) project a rice self-sufficiency of almost 96% by 2004, butthis may reflect the 4% minimum access agreement rather than the reality of Korean farmers’ productionintentions - self-sufficiency rates as low as 80% have been suggested by other analysts. The rates ofreduction in self-sufficiency are particularly marked in the cases of beef (from 56% in 1993 to 17% in 2004)and for milk (form 93% to 70%). Korea may also move from a position of self sufficiency in appleproduction, to a reliance on imports to fulfil 10% of total consumption. Although starting from a very lowbase, apple imports by the year 2001 may be over five times as large as the volume imported in 1995. Overthe same period, beef imports will increase substantially, perhaps by between 70 - 120%. The projectedincrease in maize imports reflects continued growth in Korean intensive livestock production, and the 150%projected increase in imports of malting barley is also of relevance to New Zealand exporters.
Table 2.8 Uruguay Round Projections: Imports and Self-sufficiency
1993 1998 2004 1995-2001total change (%)
Self-sufficiency (%) rice 96.7 96.5 95.8 apples 100.7 96.4 89.8 beef 55.5 40.2 17.2

30
pork 100.8 90.0 83.0 chicken 98.5 93.9 91.8 milk 93.0 82.6 69.6
Total growth in import volumes rice 149 maize 32 malting barley 149 apples 505 beef (a) 72 beef (b) 117
(a) KREI (1993) (b) Doyle et al
Sources: KREI (1993, 1994) and Doyle et al (1995)
The beef, dairy and apple situationThe volume of domestic beef production in 2000 could be only a little below that of 1995, but totalconsumption will have shown considerable growth on 1995 volumes. The growing gap between the two willbe taken up by imports, which could increase by 120,000 tonnes shipped weight (Doyle et al). Korea may infact import over this period more beef than the minimum volumes agreed to under the Uruguay Round ifescalating retail prices of beef are to be avoided. One lesson from the surge in imports following tarifficationof the Japanese beef import system was the inability of the distribution system to handle the increasedvolumes, and the consequent build up of stocks. This problem may be even more severe in Korea. While lastyear’s increase in the maximum shelf-life regulations from 15 to 90 days has assisted trade in chilled beef,very little is actually imported4 and the necessary cold-chain distribution system is not yet well developed.But by the year 2001, when the SBS system does not apply and the LPMO has lost its control over theimportation of beef, large food distribution and supermarket groups could be importing (chilled) beefdirectly, and by then such organisations could have the necessary distribution technologies in place.
The price of beef in Korea is likely to drop sharply in 2001 when the import quota is removed andprotection is provide only by a tariff of 40%. As a result, total consumption and imports could increase byaround 30% and 55% respectively from 2000 to the year 2003. Over this period, beef production in Koreahas been projected to decline as producer prices fall in line with retail prices (Doyle et al).
The non-tariff barriers that effectively prevented the import of many dairy products prior to the UruguayRound were all abolished with that Agreement, and replaced with tariffs and minimum market accesscommitments. As a result, imports of processed dairy products will increase sharply and domestic prices willfall, encouraging continued rapid growth in consumption. Prospects would appear to be particularlypromising for cheese, due to the relatively low tariff of 40% (reducing to 36% by the year 2004) coupledwith rapid growth in consumption of ‘fast foods’. The level of domestic milk production will fall onlymoderately, since at present around 85% of the total milk collected goes to the liquid market. However,domestic manufacture of dairy products, which had developed behind considerable protection, will nowincreasingly face foreign lower-cost competition and some down-scaling appears likely in the years ahead.
4 In 1996, total beef imports of 162,504 tonnes included just 32 tonnes of chilled product.

31
The next decade is likely to see the domestic milk industry focus increasingly on satisfying the growingliquid milk market, with imports gaining dominance in the manufactured products markets.
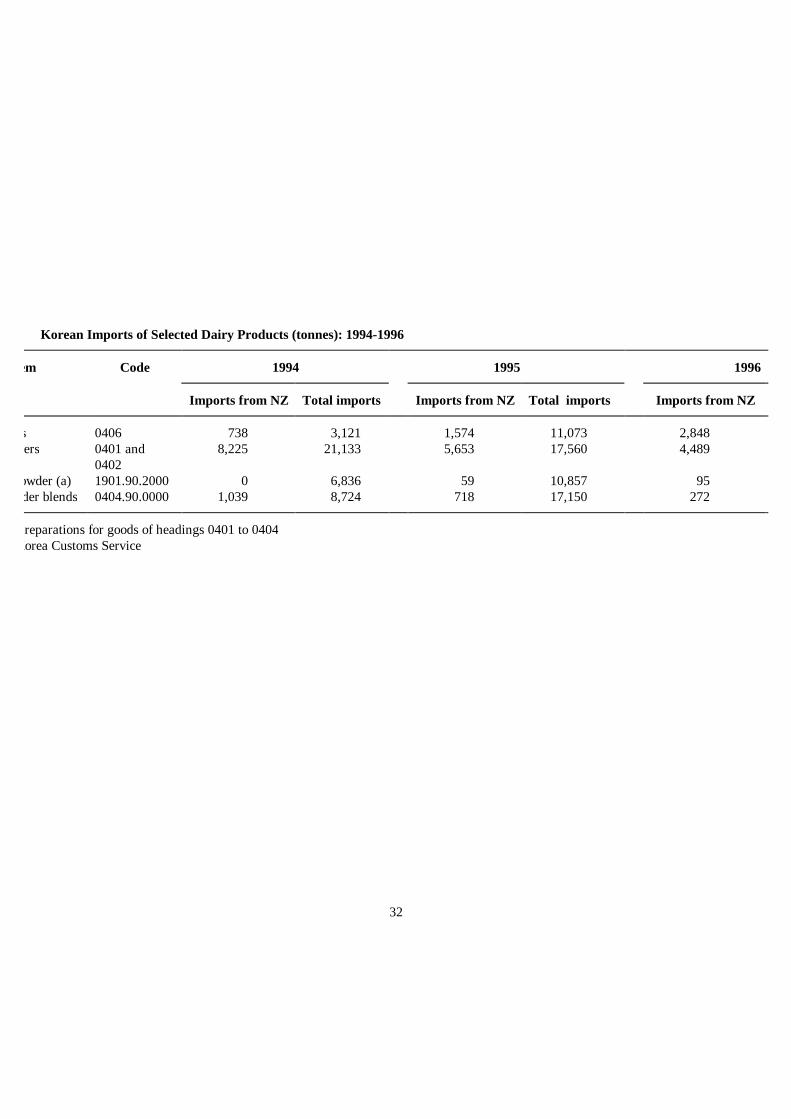
Table 2.9 indicates that import volumes of some dairy products have increased rapidly following marketliberalisation. Total cheese imports increased by 373% over the two years up to 1996, while imports fromNew Zealand increased by 285% over the same period. While the out-of-quota tariffs on skim and wholemilk powders were set at 220%, those on blended milk powders (such as cocoa blends with whey or skimmilk powder) were levied much lower rates of 30-40%. As a result, imports of these products were 80%higher in 1995 than a year earlier, and had increased by another 15% by 1996. At the same time, imports ofmilk powders declined considerably. These blended powders can be used in a variety of food products,including yoghurt, ice cream and bakery products. New Zealand may not be a competitive supplier ofblended powders due to the within-NZ cost of the added ingredients, and most of the growth in imports hasso far been supplied from the European Union. In 1996 the Korean National Livestock CooperativesFederation lobbied government to impose additional trade barriers as a safeguard measure in view of theclaimed damage to the domestic dairy industry. While the evidence of a causal link between the increasedimport volumes and domestic industry viability can be questioned, the Korean government neverthelessnotified quota restrictions on imported milk powder blends that were introduced on 1 March 1997. Quotashave been set at 20,521 tonnes for the year ended February 1998, increasing to 24,234 tonnes for the yearending February 2001. These compare with the 32,262 tonnes actually imported in the calendar year 1996(see Table 2.9).
32
2.9 Korean Imports of Selected Dairy Products (tonnes): 1994-1996
Item Code 1994 1995 1996
Imports from NZ Total imports Imports from NZ Total imports Imports from NZ
All cheeses 0406 738 3,121 1,574 11,073 2,848Milk powders 0401 and
04028,225 21,133 5,653 17,560 4,489
Blended powder (a) 1901.90.2000 0 6,836 59 10,857 95Other powder blends 0404.90.0000 1,039 8,724 718 17,150 272
a): Food preparations for goods of headings 0401 to 0404 Korea Customs Service

33
The majority of cheese imports are of processed and mozzarella types for the fast-food industry. Total cheeseimports were 255% higher in 1995 than a year earlier, although New Zealand’s share declined from 24% to14% by volume as the USA increased its share from 7% to 27%. Shelf-life restrictions remain a severeimpediment to increased imports of dairy products, for example in relation to UHT milk and yoghurts, andfuture growth in dairy imports will, like those of chilled beef, be constrained by the cold chain distributioninfrastructure. A well-publicised problem with Korean milk infection during 1996 lead to a substantial dropin consumption, and stocks of manufactured products reached relatively high levels - those of milk powderhave recently been about double the normal volumes. These events occurred at the same time as rising feedcosts, falling prices for dairy beef and increasing volumes of imports, and put the domestic dairy industry ina vulnerable position. Improved milk hygiene monitoring has been implemented at the farm level. At thetime of writing, discussions were underway in Korea on ways to further develop the domestic dairy industry.Ideas at that time included changes to the milk pricing system to encourage improved quality and hygiene,and the establishment of a new independent body “like the New Zealand Dairy Board” to oversee and adviseon the milk demand/supply balance and price situation. Another possibility deserving close attention wasthat of pricing raw milk for powder production so as to allow that product to be “competitive” with importedsupplies.
Opening of the Korean market to imports of fresh apples and apple juice will lead to a reduction in domesticproduction, partly due to imported juice replacing that produced from domestic fruit (KREI, 1993). Over theperiod 1989-91, wholesale prices of Korean apples were around 2.4 times as high as international prices,which provided a nominal rate of protection to the Korean apple industry of 140%. Korean exports of appleshad been exhibiting some growth during the 1980s, but volumes have since declined partly due to loss of theChinese Taipei market. Between 1995 and 2001, KREI (1993) predicts that production will declinesomewhat, but total fresh apple consumption in Korea will increase by 80,000 tonnes (or 12%) with importsincreasing five times, or by 100,000 tonnes, resulting in a projected self-sufficiency rate between 85-89%.
The futureUncertainty surrounds the future level of government assistance to Korean agriculture, with the financeministry appearing unwilling for the current level of spending on agriculture to continue and with thelikelihood of weakening of farmers’ political influence. A general election is to be held in December 1997,with the new government to be in place by February of the following year. Electoral boundaries are reviewedevery four years and the trend has been a reduction in the number of Congress members representing thefarmer population as it declines in numbers relative to the total population. But there are also other reasonswhy the political power of farmers is likely to decline substantially over the next 10-15 years. At presentmany Koreans have relatives in rural areas and thus maintain rural links, but over time these connectionswill be weakened as older people pass away or as they lease or sell their farms. The younger generation offarmers appears, relative to older farmers, to less-actively seek government support, perhaps because theyhave alternative employment opportunities available to them. Also, the younger generation of urbandwellers are likely to increasingly show less sympathy for rural affairs and the need for food self-sufficiency.At the same time, the struggle continues between the agricultural ministry and that responsible for thenational budget over financial allocations to the agricultural sector and the extent to which public fundsshould be expended on the support of less-productive sectors of the economy.

34
A government initiative taken in mid-1995 saw researchers, academics, private sector representatives andfarming organisations join with government officials in drawing up a vision for Korean agricultural policiesand prospects for the 21st century (Anon, 1996). These were considered in the light of likely developments,both domestic and international. The former included recognition of changing food consumption patterns inan increasingly consumer-oriented society, the resulting demand for high quality and processed foods andfor foods consumed away from the home, and the fact that the production sector will have to react to suchconsumer preferences in the face of increased competition from foreign suppliers. Major internationaldevelopments were seen to include further WTO-negotiated trade reforms, continuing instability in globalgrains markets, Korea’s international responsibilities as a member of the OECD and APEC, andpreparations for increasing interaction between South and North Korea. The long-term projectionspresented in this report (no detail of their derivation was given ) are that the share of agriculture, forestryand fishing in GDP will decline from 6.4% in 1995, to 2.0% in 2020, and between the same two yearsnumbers employed in these sectors will decline from 12.9% to 2.7% of the total labour force and averagefarm size will increase from 1.2 to 3.3 hectares.
Components of the envisioned plan to meet such developments included increased investment ininfrastructure including distribution systems, increasing farm size, investing in human capital, developinghigh-technology information systems and capital intensive production technologies (including geneticengineering and automatic control technologies), and increasing emphasis on conservation of the naturalenvironment. No estimates were made of the levels of public expenditure required to fulfil such aims, but agreater role would seem to be envisaged for local government, producers’ organisations and the privatesector. In terms of policy instruments that might be introduced, the report suggests that direct farmerpayments be introduced for income support to rice producers, and that such payments might be aimed alsoat promoting environmental conservation. The introduction of income insurance is also suggested, to coverboth production and price risks. The use of such farm support instruments in Korea would not beinconsistent with current trends in several developed economies, and may reflect a recognition on the part ofthe Koreans that as a member of the OECD, their agricultural policies will in future be under scrutiny asnever before.
SUMMARYThe objectives sought by agricultural policy-makers in Korea have changed, from a typical developingcountry focus on self-sufficiency and income-equality to now emphasise modernisation and competitiveness,infrastructural improvement and environmental concerns. Food production in Korea became heavilyprotected from international competition through the use of a variety of non-tariff barriers and domesticprices in many cases were well above world levels, and by and large remain so despite recent policy reforms.While providing incentives to producers, such high prices have reduced the well-being of consumers.Furthermore, such high protection was not always sufficient to maintain self-sufficiency at stable prices andin the case of beef for example, rising prices have persuaded government to reduce trade barriers.

35
Implementation of the Uruguay Round agreement over the period up to 2004 will have significant impactson some sectors of Korean agriculture. Aggregate output will increase little and the sector will becomeincreasingly capital intensive. Thus agriculture’s contribution to national output and employment willcontinue to decline. On the commodity level, the impacts could be most noticeable in the beef and dairyindustries. The extent of these impacts will depend upon how successful will be programmes to transformagriculture into a modern and capital-intensive sector, but prospects appear most promising for intensivehorticultural production rather than beef and dairy production or the traditional cropping sector. But evenwith the improved access conditions in place by the end of the implementation period, the domesticdistribution and marketing infrastructure may continue to be a constraint to increased foreign activity in theKorean market.
Pressures for further reform of Korea’s agricultural policies will likely intensify in future. On the domesticfront, urban links to the countryside will weaken, as will the political power of farmers. Current levels ofpublic support to agriculture may not be sustainable - already, there are conflicts between the agriculturalministry and that responsible for the national budget over this issue. International pressures for furtherpolicy reforms will arise through the process of future multilateral trade negotiations in the WTO, with thenext agricultural round due to start by 1999. Korea will face additional reform pressures now that it is amember of the OECD, such as regular and transparent examination of its policies and their costs. Pressuresfor policy change will also continue as APEC works its way through the process of implementing its visionof free trade by 2020. As a result, it could well be that Korea adopts farm support policies similar to thosenow being adopted in some other OECD countries, and which are encouraged by the OECD and permittedby WTO rules, such as decoupled direct payments to farmers, and support payments that recognise theproduction by farmers of environmental goods.

36
Chapter 4
Food Raw Material Supply: Changes in theStructure and Mix of Domestic Production
DECLINE IN THE NUMBER OF FARMSThe number of farms in Korea has declined from 2.5 million in 1970 to 1.5 million in 1995 (Table4.1). While the total area of farm land in the country has also fallen, the decline has not been so rapidso that average farm size has risen from 0.9 ha in 1970 to just over 1.3 ha in 1995. The LandReform Act of 1949 placed a ceiling of 3 ha on farm size and prohibited tenancy of farmland toenhance rural peoples’ chances of becoming farm owners, but did inhibit the growth of farm size. Arecent development has been the increase in the number of farms of over 3 ha in size, encouraged byland policy reforms. Some consolidation of smaller farms is occurring, encouraged by favourablemovements in machinery costs relative to wages, as well as the continuing depopulation of thecountryside.
The continuing industrialisation of Korea, and urbanisation of the population, has given rise to asharp increase in the number of part-time farms. While the latter comprised 21% of all farms in1985, the percentage had more than doubled to 43% by 1995.

37
Source: Ministry of Agriculture and Forestry
Figure 4.1 Changes in the Size and Status of Korean Farms
LABOUR AND CAPITAL INTENSITY AND TRENDS IN PRODUCTIVITYThe rapid development of the Korean economy has placed upward pressure on wage rates, andlabour has become relatively more expensive than capital. Figure 4.2 shows two capital-to-labourprice ratios, where capital costs are measured alternatively as the price index of farm implements andas that of machinery rentals. In either case, over the period 1983 to 1995, the cost of farm labour hasmore than doubled relative to that of capital. Korean farmers have responded by increasing thecapital intensity and mechanisation of their production, substituting capital for labour. Figure 4.2also shows that over the decade ending with 1995, the real capital input per hectare doubled whilethe labour input per hectare declined by 40%.
Source: Ministry of Agriculture and Forestry
Figure 4.2 Farmers’ Response to Changing Labour and Capital Prices
38
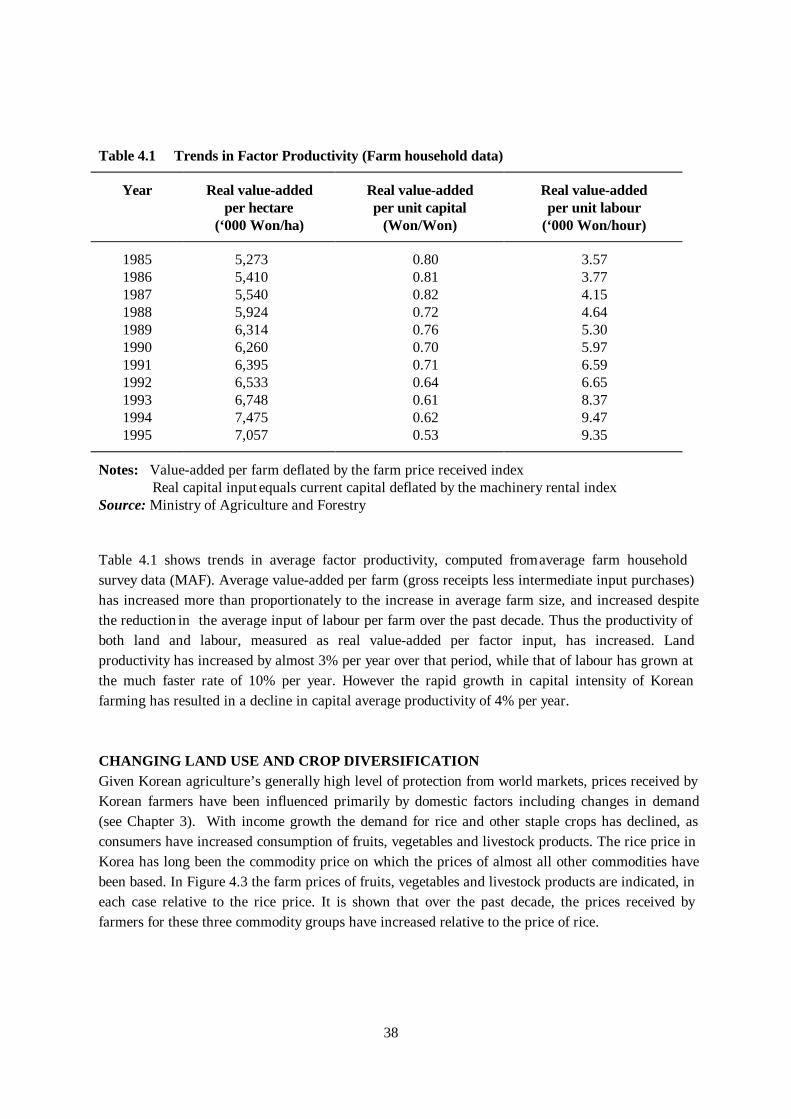
Table 4.1 Trends in Factor Productivity (Farm household data)
Year Real value-added Real value-added Real value-addedper hectare per unit capital per unit labour
(‘000 Won/ha) (Won/Won) (‘000 Won/hour)
1985 5,273 0.80 3.571986 5,410 0.81 3.771987 5,540 0.82 4.151988 5,924 0.72 4.641989 6,314 0.76 5.301990 6,260 0.70 5.971991 6,395 0.71 6.591992 6,533 0.64 6.651993 6,748 0.61 8.371994 7,475 0.62 9.471995 7,057 0.53 9.35
Notes: Value-added per farm deflated by the farm price received index Real capital input equals current capital deflated by the machinery rental indexSource: Ministry of Agriculture and Forestry
Table 4.1 shows trends in average factor productivity, computed from average farm householdsurvey data (MAF). Average value-added per farm (gross receipts less intermediate input purchases)has increased more than proportionately to the increase in average farm size, and increased despitethe reduction in the average input of labour per farm over the past decade. Thus the productivity ofboth land and labour, measured as real value-added per factor input, has increased. Landproductivity has increased by almost 3% per year over that period, while that of labour has grown atthe much faster rate of 10% per year. However the rapid growth in capital intensity of Koreanfarming has resulted in a decline in capital average productivity of 4% per year.
CHANGING LAND USE AND CROP DIVERSIFICATIONGiven Korean agriculture’s generally high level of protection from world markets, prices received byKorean farmers have been influenced primarily by domestic factors including changes in demand(see Chapter 3). With income growth the demand for rice and other staple crops has declined, asconsumers have increased consumption of fruits, vegetables and livestock products. The rice price inKorea has long been the commodity price on which the prices of almost all other commodities havebeen based. In Figure 4.3 the farm prices of fruits, vegetables and livestock products are indicated, ineach case relative to the rice price. It is shown that over the past decade, the prices received byfarmers for these three commodity groups have increased relative to the price of rice.

39
Korean farmers have reacted predictably to changes in relative prices, and Figure 4.4 shows thatland allocated to the staple crops has declined. Some hilly land used for rice production is now beingabandoned; rural labour shortages call for mechanised production methods which are ill-suited tohilly terrain. In 1995, around 50,000 ha of such rice land was abandoned, compared with an averageof 25,000 ha per year previously. At the same time there has been considerable growth in the landarea used for horticultural crops; the latter are also relatively capital and technology intensive, sochanges in land use reflect Korea’s changing comparative advantage. Between 1990 and 1995, thetotal area of cultivated land declined by 9%, but that used for rice production fell by 15%. On theother hand, the area of land planted in vegetables, fruit, or used for greenhouse crops, increased by16%, 30% and 104% respectively. Rice production still dominates Korean agriculture however,accounting for 48% of all cultivated land in both 1985 and 10 years later. As a result of crop pricechanges and the changes in land use, the share of rice in gross farm receipts has fallen markedly inrecent times (Figure 4.3). Rice contributed 52% of farm revenues in 1988, but had fallen to 34% by1995. Over the same time period, the contribution of fruits and vegetables combined rose from 22%to 31%, and that of livestock products from 14% to 25%.
Source: Ministry of Agriculture and Forestry
Figure 4.3 Diversification in Response to Changing Prices

40
Source: Ministry of Agriculture and Forestry
Figure 4.4 Changes in Land Use
Crop farming in Korea can be divided into paddy cropping and upland cropping. The former isconcentrated in the southwestern region of the country and primarily involves rice production (80%of total paddy land in 1995). Production on uplands is more diversified, comprising barley and othergrains, and fruits and vegetables. This type of cropping is located mainly in the eastern part of theKorean peninsula. The land use changes described above have impacted on both paddy and upland(Figure 4.5). Over the 5 years ending 1995, the total area of both paddy and upland declined. Thedecline in the case of paddy was 138,000 ha but the area of paddy used for rice declined even more,by over 180,000 ha. This allowed the production of vegetable and greenhouse crops to expanddespite the fall in total paddy land area - by 26,000 and 29,000 ha respectively. The total area ofcropped upland fell by 75,000 ha between 1990 and 1995, and that used for staple crop productiondeclined by 148,000 ha. The area of upland used in vegetable, fruit and greenhouse productionexpanded over the same period by a total of 73,000 ha.
Figure 4.6 indicates the relative importance of various crops on paddy and upland in 1995. Thedominance of staple crops other than rice, along with fruits and vegetables on upland is obvious,while greenhouse farming is more evenly distributed across both land classifications. Fruitproduction is one of the more rapidly expanding sectors within Korean agriculture, almost entirely

41
Source: Ministry of Agriculture and Forestry
Figure 4.5 Changes in Land Use by Land Type
Source: Ministry of Agriculture and Forestry
Figure 4.6 Major Crops on Paddy and Upland
on upland. The area planted in fruit trees expanded from 99,000 ha in 1980 to 172,000 ha in 1995.Over the same period, total fruit production rose from 0.8 to 2.3 million tonnes. The fruit industry isdominated by apples, and in 1995 716,000 tonnes were produced off 32,200 bearing hectares. Inaddition, another 17,900 hectares of apples were yet to come into production. The most rapid outputgrowth however has taken place with grapes and mandarin oranges.
To summarise, Korean crop farming is becoming more specialised as rice farmers (especially on theuplands) move into the production of horticultural crops and at the same time, out of cattle farming.

42
LIVESTOCK PRODUCTIONIn line with changes in consumption patterns and commodity prices, the numbers of livestock farmedin Korea have grown rapidly over the past couple of decades. In all categories except beef, animalnumbers have tended to display steady growth - comparing 1995 with 1980, the number of dairycattle had increased from 180,000 to 553,000 head, pig numbers rose from 1.8 million to 6.5 million,and the increase in chicken numbers was from 40.1 million to 85.5 million. Pig, chicken and eggproduction receives relatively little government assistance, is large scale, and foreign technology hasbeen successfully adopted.
The beef sector has been heavily protected in the past, and it has not been uncommon for domesticbeef prices to have been over three times as high as import prices. Such levels of protection havebeen falling in recent times however, as the allowed volume of imports has expanded. The Koreanbeef industry has also been subject to considerable cyclical instability, largely policy-induced. Beefcattle numbered 1.4 million in 1980 but increased to 2.6 million by 1985. Since then cattle numbersfell to a low of 1.5 million in 1989, but again expanded to over 2.6 million in 1996 (Figure 4.7).Government regulations allowed beef imports only during 1978-79, 1981-84 and since 1988, andthese periods corresponded to the peaks of the Korean cattle price cycle. Cyclical tendencies werealso amplified by loans for the purchase of calves and the Government’s ban on the slaughter ofcertain classes of cattle over the 1977-84 period, and the subsequent lifting of these controlsencouraged a rapid increase in slaughterings. A sustained rise in cattle prices relative to feed coststhen followed, and slaughterings fell to a trough in 1991 as the national herd was rebuilt.
Traditionally, the native beef cattle were fed a diet based on rice bran, straw and other vegetablematter. More recently the trend has been to increased quantities of compound feed in cattle rations,and the traditional farming system involving rice, forage crops and cattle production is disappearingas a non-competitive system for either rice or cattle production. While the number of beef cattle roseby 69% between 1989 and 1995, compound feed usage rose by 102%. However, the domestic feedmanufacturing industry is very dependent on imported raw materials. Even leaving aside Korea’s lowself-sufficiency in compound feedstuffs, her self-sufficiency in beef has fallen in recent times, fromover 80% in the 1980s to 51% in 1995.

43
Source: National Livestock Cooperatives Federation
Figure 4.7 Beef Cattle Statistics
Dairy farming in Korea is a relatively recent development, having commenced in the 1960s andassisted by heavy protection afforded through tight controls over dairy product imports. As shown inFigure 4.8, the numbers of both dairy cattle and dairy farms were still increasing steadily during thefirst half of the 1980s although the average herd size remained around 10 head. Since 1985, there hasbeen some further increase in the number of dairy cattle, but the more noticeable feature has been amore than doubling of average herd size and therefore a reduction in the total number of dairy farms.The trend to more intensive feeding has been more evident than in the beef sector - between 1989 and1995 dairy cattle numbers rose by just 7% while the output of dairy cattle compound feed rose by22%. Between 80-90% of milk production is consumed fresh, and Korea’s self-sufficiency has fallenfrom over 100% prior to 1990 to 93% in 1995.
Source: National Livestock Cooperatives Federation
Figure 4.8 Dairy Cattle and Farm Numbers

44
Trends in the distribution of beef and dairy herd sizes are evident from Figure 4.9. While only 8% ofthe beef cattle were farmed in herds greater than 20 head in 1985, this percentage had increased to28% by 1995. For dairy cattle, the proportion farmed in herds of at least 40 head increased from14% in 1985 to almost 30% in 1995.
Source: National Livestock Cooperatives Federation
Figure 4.9 The Trend Towards Larger Herd Sizes
Table 4.2 shows recent developments in livestock outputs, and uses production per livestock unit asan indicator of trends in productivity in Korean livestock production. Beef production has followed asimilar cyclical pattern to that of cattle slaughterings, while outputs of pork, poultry and milk haveincreased more steadily. However output per livestock unit appears to have trended downwards inthe case of both beef and pork production. While pork output was 2.7 times as large in 1995 as in1980, the number of pigs farmed in 1995 was 3.6 times the number in 1980. The decline in theproductivity of beef production reflects in part a relatively low feed conversion performance due tothe dominant use of native cattle and the reluctance to improve their performance throughcrossbreeding with specialist beef breeds, and inadequate nutrition and other environmentalconditions. On the other hand, milk output per cow increased over the 1980-95 period by an averageof 3.0% per year.

45
Table 4.2 Livestock Production and Performance
Production(‘000 tonnes)
Output per Livestock Unit(kg per animal)
Beef Pork Chicken Milk Beef Pork Chicken Milk
1980 93 235 90 452 68.3 131.7 2.2 2,5111985 116 345 126 1,006 45.4 120.9 2.5 2,5801990 95 506 172 1,752 58.6 111.7 2.3 3,4761991 98 499 207 1,741 55.3 98.9 2.8 3,5101992 100 601 231 1,816 49.5 110.0 3.2 3,5731993 130 618 239 1,858 57.5 104.3 3.3 3,3601994 147 614 245 1,917 61.4 103.1 3.0 3,4731995 155 639 277 1,999 59.8 98.9 3.2 3,615
Source: National Livestock Cooperatives Federation
SUMMARYThe structure of farm production in Korea is rapidly changing. Urbanisation of the population, andchanging relative prices of both inputs and outputs have been major influencing factors. Wage rateshave risen relative to capital costs and farm production is becoming increasingly capital intensive.Land is shifting from the production of traditional but relatively less profitable crops towards fruitand greenhouse production alternatives.
Livestock production has been expanding rapidly, although the beef industry has been plagued bycyclical instability and growth in the dairy sector appears to be levelling off. Trends are towardsmore modern and intensive feeding systems and larger herd sizes in the cattle sector. Output perlivestock unit has been steadily increasing in the poultry and dairy sectors, but this has not been thecase with beef and pork farming.
In future farming in Korea will be capital and technology intensive, in recognition of the economy’scomparative advantages and the imperative to increase competitiveness with respect to imported foodsupplies and part-time farming will become more prevalent. Recent changes to land marketregulations will encourage some increase in farm size and farm amalgamation, and therefore costreductions due to the realisation of size economies.

46
Chapter 5
Distribution System For Fruit, Beef, MusselsAnd Vegetables In Korea
INTRODUCTIONA marketing margin, broadly defined, is the difference between the price received by the farmer andthe price for the product paid by the consumer. An alternative definition is that marketing marginsare the total cost of all of the various marketing and processing services incurred in order to make aproduct available to the consumer. The array of services provided in the marketing process are vitalto providing products to consumers. Those services are normally divided into four categories ofproviding market utility: time, form, place and transfer (Downey and Erikson, 1987).
While each of these categories of utility are provided during the movement of a product from whereit is produced to where it is sold to the final consumer, the importance of marketing margins becomesmore pronounced when a product moves internationally. For those products, most of the marketingcosts (marketing functions) involved in exporting a domestic product are repeated at least threetimes as the product moves from the point of local production, through the domestic marketingsystem, into the export marketing system and then again into the domestic marketing system, but thislast time in the destination country. Time, place, form and transfer utility are created normally onlyone or two times during the domestic selling process. But when a product is sold internationally,time, place and transfer utility is provided during at least three different periods: in the originatingcountry, during the international movement and finally in the destination country. While form utility(either for a fresh product or a processed product) is normally provided only once, the other utilities
47
(place, time and transfer) are provided a number of times as the product moves through themarketing channels.
Consequently, for a product to remain competitive in overseas markets, the complete understandingof marketing margins - particularly margins which provide place, time and transfer utility - isimportant. And, as the understanding of those margins increases, so will the recognition of thesignificance of potential changes in the institutions which provide those utilities.
When discussing the distribution of foods in Korea, an inescapable fact is the high urbanisation ofthe country. For example, Seoul and its neighbouring cities account for 40% of the country's entirepopulation. Consequently, it is inevitable that Seoul should be the centre for distribution forimported food and beverage products.
While the economy of Korea has experienced remarkable growth during the past decade, theinfrastructure required for a modern distribution system has not kept pace with the growth of theremainder of the economy. This has meant that domestic producers of meat, fruits and vegetableswere constrained from selling their products to the urbanised markets. These constraints have alsomeant that domestic products often were at a price disadvantage to imported products. In addition,even for those domestic products which were not subject to competition from imported products, thehigh costs associated with delivering products using a relatively inefficient distribution systemresulted in some products being priced beyond the reach of many urbanised consumers. As aconsequence, the Korean government has established a series of public wholesale markets, operatedby municipal and provincial governments, as a step to improve the distribution of products. Whilethe initial intent was to improve the ability of domestic producers to meet the urbanised markets ofSeoul, the impact on importers has also been significant.
The Korean government began its programme to improve the agricultural distribution system in themid-1980s. This effort was increased in 1992 with the implementation of the Agricultural andFisheries Restructuring Plan (see Chapter 2) to restructure the Korean agricultural and fisheriesindustries. With the intention of improving the ability of domestic producers to compete withinternational sources of farm products, this plan has had, and is having, a significant impact in themarketing and distribution system.
Wholesale markets play a very significant role in the Korean food distribution system. While inother countries, including New Zealand, direct marketing is becoming more significant as auctionmarkets decline in importance, central markets - public wholesale markets, private wholesale marketsand co-operative marketing centres - remain the predominate characteristic of Korean distribution.Of these three marketing types, public wholesale markets are growing, often with governmentsupport, while private wholesale markets are declining in importance.
Public wholesale markets, such as Karak (below) are operated under the rules and regulationsestablished by the Korean government set out in "The Law of Marketing and Price Stabilisation ofAgricultural and Marine Products". These public markets are government funded and operated by

48
local governments or market authorities (Kim, 1996). The significance of these public markets isexpected to continue growing, in large part because of the great emphasis placed on these markets bythe Korean Ministry of Agriculture, Forestry and Fisheries.
Wholesale MarketsAs indicated above, an important characteristic of the Korean economy is its high degree ofurbanisation. At the centre of the urbanisation is the capital, Seoul, and it is appropriate that thelargest wholesale market in Korea, the Karak Market (also spelled as Garak in some documents),serves Seoul. This market, through which approximately 50% of all wholesale food sold in Seoul ismarketed, is administered by the Seoul Agricultural and Marine Products Wholesale MarketCorporation (SAMACO). The objectives of SAMACO are to assure the efficient mass-distributionof agro-marine products in Korea, to maintain reasonable prices, and to protect the interests ofproducers and consumers. Its roles include administration and management of Karak Market,maintenance of fair transaction procedures, supervision of wholesale market corporations andintermediate wholesalers, collection and distribution of marketing information (SAMACO, 1996).
The Karak Market is really a collection of markets and storage facilities: dried fish auction room,related dried marine products market, livestock market, meat direct-sales centre, marine productsmarket, fruit and vegetable direct sales market, vegetable market, dried pepper sales centre, garlicsales centre, fruit market, fruit and vegetable related items market, dried marine products storage andprocessing plant and freezer storage. An important constraint in the distribution chain is the absenceor very limited availability of chilling space or coolstores. While there is some freezer space atKarak and other markets, chillers and/or coldstores either do not exist or are very limited in size.These shortages are not limited to the wholesale markets and constitute a significant problemthroughout the distribution chain, including the retail sector.
At the base of the Karak Wholesale Market are wholesale market corporations. These are privatewholesale companies, sanctioned by the Seoul Metropolitan government. It is the role of thecorporations to collect and assemble goods from producers or shippers and to sell them tointermediate wholesalers and designated buyers through auction. In 1996, there were sevenwholesale market corporations, in addition to several co-operatives, operating at Karak.
Wholesale market corporations collect and sell products to either intermediate wholesalers ordesignated bulk buyers. There are approximately 2,300 intermediate wholesalers at Karak whocollect products at auctions and then sell the products to retailers or direct-sale merchants.Designated bulk buyers are large buyers, such as supermarkets or processors. These buyersparticipate at auctions with wholesalers.
There are two additional merchants at the Karak Market. Related-Items Merchants handle variouskinds of agro-marine products such as processed foods and packaging material. Direct-salesmerchants purchase products from intermediate wholesalers and sell them on to retailers orconsumers. There are about 1,900 direct sales merchants at Karak.

49
At the heart of the Karak Market are the 36 auctions conducted almost around the clock (no auctionsbetween 2400 - 0100). The wholesale market corporations pay producers or shippers for theproducts delivered and receive a commission from the products sold at the auctions. This means thatif the shipper is a domestic farmer or an importer, they are responsible for all costs involved inbringing the products to the auction floor. Also, when the products are sold, the shipper must deducta commission from the selling price. This commission will be paid to the wholesale marketcorporation.
Once a product is sold, either to an intermediate wholesaler or a designated bulk buyer, the product,for instance fruit, is then moved to retailers. The payment of the cost of transporting the productsfrom the auction to the retailer is normally negotiated. Larger users, such as hotels or supermarkets,depend on the wholesaler to deliver the product. Smaller retailers normally purchase the goods forcash and provide their own transportation.
As in standard business practice, the purchaser may negotiate with the wholesaler the terms ofpayment. When using the auction company, payment to the wholesaler is guaranteed by the auctioncompany. For sales which do not go through the auction market, payment may extend for severalmonths after delivery and even then, default is possible. Consequently, while auction markets mayresult in a higher price to the purchaser than direct negotiation, risk of payment must be borne bysomeone. So, with less risk, prices at auctions may be higher while direct sales may be moreattractive to buyers, but in direct sales it is the seller who must bear the risks of non-payment.
It is a usual practice for importers to deliver their products to the wholesaler. Transportation costsare normally paid by the importer.
MARKETING MARGINS FOR SELECTED FRUITS, VEGETABLES, SEAFOOD ANDBEEFGeneral vegetablesAlthough vegetables are basically distributed through free markets (Kim, 1995), the system iscomplicated and varies by type of vegetable - general vegetables, exotic vegetables and importedvegetables.
General vegetables are those which are predominately locally produced such as onions, potatoes,carrots, cabbages, tomatoes and pumpkins. While there may be some variation in the process, thesequence normally is from Producer to Collector to Jobber/Middleman to Wholesaler to Retailer toConsumer.
Because most producers in Korea are small-scale producers, the initial step in the domesticdistribution system is taken by local assemblers who collect the product and take it to a wholesalemarket. It is estimated that about 50% of marketed vegetables are sold through local assemblers

50
(Kim, 1995). Figure 5.1 indicates the general overview of market channels for fruit and vegetables.However, each fruit or vegetable category often has a unique channel as indicated in Figures 5.2 -5.5.
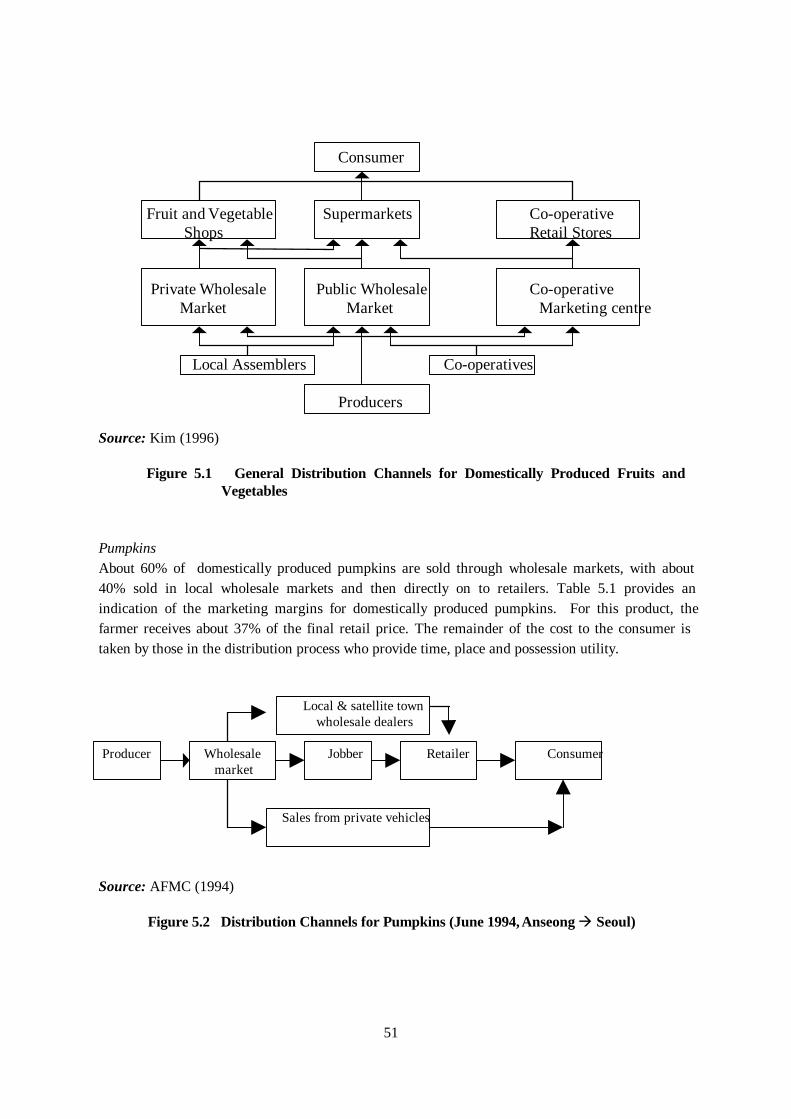
51
Consumer
Fruit and Vegetable Supermarkets Co-operative Shops Retail Stores
Private Wholesale Public Wholesale Co-operative Market Market Marketing centre
Local Assemblers Co-operatives
Producers
Source: Kim (1996)
Figure 5.1 General Distribution Channels for Domestically Produced Fruits andVegetables
PumpkinsAbout 60% of domestically produced pumpkins are sold through wholesale markets, with about40% sold in local wholesale markets and then directly on to retailers. Table 5.1 provides anindication of the marketing margins for domestically produced pumpkins. For this product, thefarmer receives about 37% of the final retail price. The remainder of the cost to the consumer istaken by those in the distribution process who provide time, place and possession utility.
Local & satellite town wholesale dealers
Producer Wholesale Jobber Retailer Consumer market
Sales from private vehicles
Source: AFMC (1994)
Figure 5.2 Distribution Channels for Pumpkins (June 1994, Anseong à Seoul)
50%

52
Table 5.1 Margins by Stage of Pumpkin Marketing (June 1994, Anseong à Seoul)
Classification Componentratio %
Margin bystages
Componentratio %
Ratio received by household farm 37.3 Total margin 62.7
Distributionmargin
Total marginDirect costIndirect & Profit
62.727.834.9
Shipping stageWholesale stageJobber stageRetail stage
16.53.4
15.727.1
Source: AFMC (1994)
A more detailed analysis of the marketing margin is given in Table 5.2. By the time the pumpkinsreach an auction market, the distribution margin has increased to over 50% of the final retail price.
Table 5.2 Analysis of Distribution Margins for Pumpkins (June 1994, Anseong à Seoul)
Classification Amount(Won/kg)
%
Received price by farm household 2,614 37.3
Producer
stage
Shipping
stage
Loading cost
Packaging cost
Freight
Unloading cost
550
216
300
80
7.9
3.1
4.3
1.2
Farm household sales price 3,760 53.8
Wholesale stage Auction fee 240 3.4
Sales price 4,000 57.2
Freight 100 1.4
Jobber Loss rate 80 1.1
Indirect cost & profit 920 13.2
Sales price 5,100 72.9
Freight 100 1.4
Loss 510 7.3
Retail stage Packaging cost 6 0.1

53
Indirect cost & profit 1,284 18.3
Sales price 7,000 100.0
Source: AFMC (1994)
TomatoesThe distribution channel for tomatoes is relatively simple. With only infrequent use of collectingmerchants, most of the collection and movement to market is done by co-operative shipping byfarmer groups. This means about 70% of tomatoes sold move directly to wholesale markets fromlocal producers. Distribution channels for tomatoes are detailed in Figure 5.3.
Collecting Merchant Jobber
Producer Wholesaler (Consignee) Retailer Consumer
Production Area’s Agricultural Co-operative Federation
Source: AFMC (1994)
Figure 5.3 Distribution Channels for Tomatoes (April 1994, Koreyong à Seoul)
Contrasted with pumpkins, Korean tomato growers receive a higher percent of the final retail price -almost 60% compared with 37% for pumpkin. The retail stage margin is comparable to pumpkins,but the wholesale stage, particularly moving the tomatoes to the wholesale market, is less. Table 5.3contains information about the distribution margins, and more detailed information is given in Table5.4.
Table 5.3 Margins by Stage of Tomato Marketing (April 1994, Koreyong à Seoul)
Classification Componentratio (%)
Margin by stages Componentratio (%)
Ratio received by farm household 59.8 Total margin 40.2
Distributionmargin
Total marginDistribution costIndirect & Profit
40.29.9
30.3
Producer stageWholesale stageRetail stage
6.95.3
28.0

54
Source: AFMC (1994)

55
Table 5.4 Analysis of Distribution Margins for Tomatoes (April 1994, Koreyong à Seoul)
Classification Amount(Won/kg
First grade)
%
Received price by farm household 1,495 59.8
Producer
stage
Shipping
stage
Packaging cost
Freight
Unloading cost
Auction fee
30
33
9
100
1.2
1.3
0.4
4.0
Sales price 1,667 66.7
Wholesale stage Freight
Indirect cost & profit
9
124
0.3
5.0
Sales price 1,800 72.0
Freight 67 2.7
Retail stage Indirect cost & profit 633 25.3
Sales price 2,500 100.0
Source: AFMC (1994)
CarrotsNo marketing channel diagram is available for domestic carrots. It is assumed its marketingchannels are similar to other vegetables. The return to the grower, at 43.3%, is higher than mostother vegetables and the retailer margin of 16.7% is lower than for other vegetables. Tables 5.5 and5.6 contain details.
Table 5.5 Margins by Stage of Carrot Marketing (September 1993, Pyungchang à Seoul)
Classification Componentratio (%)
Margin by stages Componentratio (%)
Ratio received by farm household 43.3 Total margin 56.7
Distributionmargin
Total marginDistribution costIndirect & Profit
56.718.038.7
Producer stageWholesale/jobber stageRetail stage
16.223.816.7
Source: AFMC (1994)

56

57
Table 5.6 Analysis of Distribution Margins for Carrots(September 1994, Pyungchang à Seoul )
Classification Amount(Won/kg,
Second class)
%
Received price by farm household 650.0 43.3
Producer
stage
Shipping
stage
Loading cost
Packaging cost
Freight
Other
Unloading cost
Indirect cost & profit
65.0
5.0
28.3
10.0
4.0
130.7
4.3
1.9
0.3
0.7
1.3
8.7
Farm household sales price 893.0 559.5
Wholesale stage Auction fee 57.0 3.8
Sales price 950.0 63.3
Freight 4.0 1.4
Selecting & cleaningfee
26.7 1.8
Other 3.3 0.2
Jobber Loss 98.4 6.6
Packaging fee 3.0 0.2
Indirect cost & profit 164.6 11.0
Sales price 1,250.0 83.3
Freight 12.5 0.8
Packaging cost 10.0 0.7
Retail stage Packaging cost 6.0 0.1
Indirect cost & profit 227.5 15.2
Sales price 1,500.0 100.0
Source: AFMC (1994)
Exotic vegetablesAs opposed to general vegetables, most of the domestic production of ‘exotic’ vegetables (capsicum,broccoli and cauliflower) is initially sold directly to wholesalers, rather than through wholesale

58
markets. A significant participant in the marketing channel, for these vegetables, is the United Statesmilitary. The industry has also experienced the increasing importance of large buyers such as thehotel and restaurant trade. The impact of distribution reforms on these marketing channels will beimportant, but not as significant as for other domestically produced 'non-exotic' vegetables becauseof the limited volume sold through wholesale markets.
Collector U. S. Military
Grower Jobber/ Wholesaler Retailer Consumer Middleman
Cooperative Large Consumers (eg hotels)
Source: AFMC (1994)
Figure 5.4 Distribution Channels for Local “Exotic” Vegetables
Imported vegetablesThe distribution channels faced by imported vegetables are similar to domestically producedvegetables, except the collection is done by the importer and the product moved directly to thewholesale market. As with locally produced vegetables, some of the imported produce movesdirectly to large buyers. Also, the Korean Tourist Hotel Supply Centre (KTHSC) purchasesimported vegetables directly for the hotel and restaurant trade.
A significant difference between imported vegetables brought to the wholesale market anddomestically produced vegetables at the same market is the uniformity of size, quality and packagingof imported products. Kim (1995) notes that grading and packing is very poor at the local collectionlevel where there are no standards for grading products. In fact, local producers often ship theirproducts unpacked and ungraded. Consequently, because value is added by importers when theyassist transfer of the vegetables by grading, classifying and boxing of their products, importedvegetables often receive higher prices. These higher prices may reflect some quality differences butmore probable, they reflect the additional costs incurred in grading, classifying and boxing.However, as wholesale markets increase in size and volume, it is expected that locally produced

59
vegetables will begin to become more standardised in their presentation and packaging. This meansa price premium which may be received by imports for superior packaging, labelling, etc. may beginto disappear as auction markets grow in size.
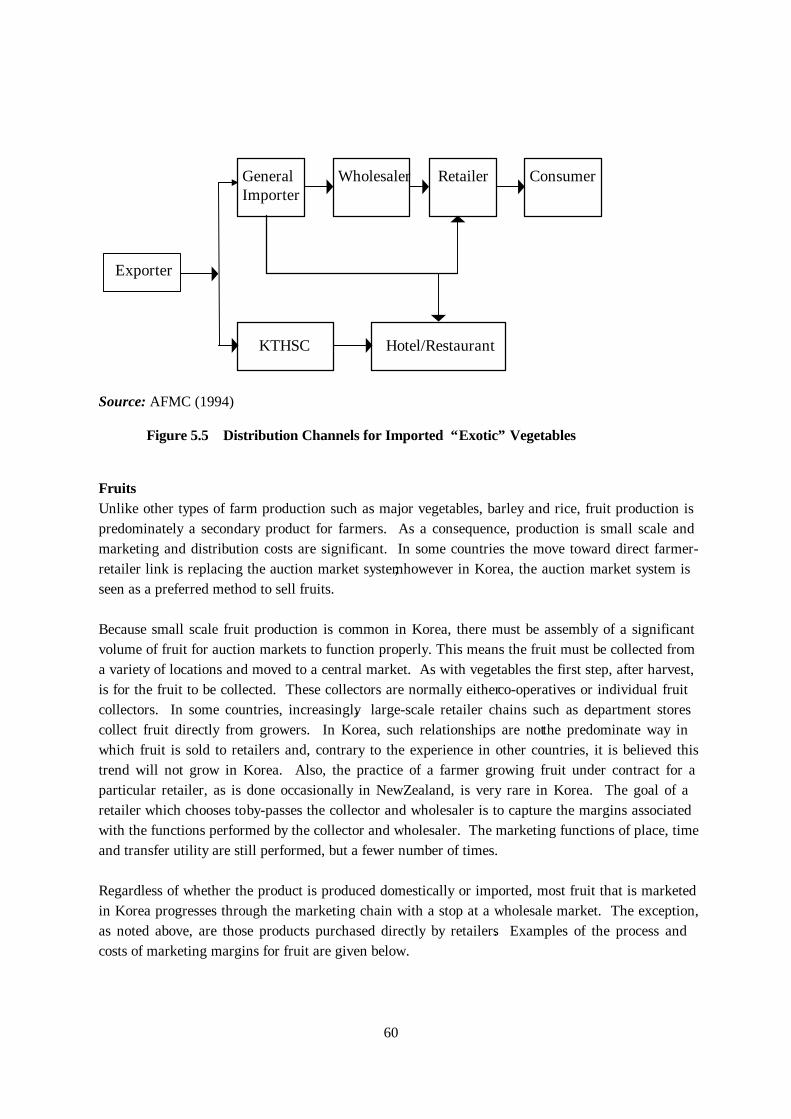
60
General Wholesaler Retailer ConsumerImporter
Exporter
KTHSC Hotel/Restaurant
Source: AFMC (1994)
Figure 5.5 Distribution Channels for Imported “Exotic” Vegetables
FruitsUnlike other types of farm production such as major vegetables, barley and rice, fruit production ispredominately a secondary product for farmers. As a consequence, production is small scale andmarketing and distribution costs are significant. In some countries the move toward direct farmer-retailer link is replacing the auction market system; however in Korea, the auction market system isseen as a preferred method to sell fruits.
Because small scale fruit production is common in Korea, there must be assembly of a significantvolume of fruit for auction markets to function properly. This means the fruit must be collected froma variety of locations and moved to a central market. As with vegetables the first step, after harvest,is for the fruit to be collected. These collectors are normally either co-operatives or individual fruitcollectors. In some countries, increasingly, large-scale retailer chains such as department storescollect fruit directly from growers. In Korea, such relationships are not the predominate way inwhich fruit is sold to retailers and, contrary to the experience in other countries, it is believed thistrend will not grow in Korea. Also, the practice of a farmer growing fruit under contract for aparticular retailer, as is done occasionally in New Zealand, is very rare in Korea. The goal of aretailer which chooses to by-passes the collector and wholesaler is to capture the margins associatedwith the functions performed by the collector and wholesaler. The marketing functions of place, timeand transfer utility are still performed, but a fewer number of times.
Regardless of whether the product is produced domestically or imported, most fruit that is marketedin Korea progresses through the marketing chain with a stop at a wholesale market. The exception,as noted above, are those products purchased directly by retailers. Examples of the process andcosts of marketing margins for fruit are given below.

61
KiwifruitAs with many other products, New Zealand exporters face competition from Korean-producedproducts, including kiwifruit. Approximately 30% of imported kiwifruit are sold through the Karakauction market (AFMC, 1996). It is estimated that 25-30% move directly to large distribution chains(department stores) with the remaining imported kiwifruit auctioned in wholesale markets other thanKarak. Industry observers believe the volume sold directly to large distribution chains anddepartment stores will decline as larger quantities are sold through conventional means, perhaps asthe popularity of kiwifruit increases and prices decline. This will place imported kiwifruit moredirectly into competition with domestically produced kiwifruit as the majority of the latter areauctioned. As a consequence price, rather than non-price factors, will become the primary drivingfactor of products sold in Korea. Tables 5.7 and 5.8 provide detail of distribution and marketingmargins for domestically-produced kiwifruit.
Table 5.7 Marketing Margins for Kiwifruit Produced in Korea - by Stage(February 1995)
Classification Componentratio (%)
Margin by stages Componentratio (%)
Ratio received by household farm 52.0 Total margin 48.0
Distributionmargin
Total marginDirect costIndirect & Profit
48.017.230.8
Collector stageWholesale stageRetail stage
24.08.0
16.0
Source: Various, including author’s estimates.

62
Table 5.8 Analysis of Marketing and Distribution Margins for Kiwifruit Produced in Korea (February 1995)
Classification Amount(Won/kg)
%
Farmer’s price to collector 1,295 52.0
Collector
stage
Packaging cost
Labour cost
Transportation cost
Commission for
auction
Indirect cost & profit
95
80
80
115
230
3.80
3.28
3.12
4.56
9.24
Sales price 1,895 76.00
Wholesale
stage
Transportation cost
Indirect cost & profit
10
185
0.48
7.52
Sales price 2,090 84.00
Freight 50 2.00
Retail Indirect cost & profit 350 14.00
stage Sales price 2,490 100.0
Source: Various, including author’s estimates.
Table 5.9 reflects margins by stage for imported kiwifruit. Note that the imported price is only 26%of the consumer price, compared with 52% for Korean kiwifruit. When tariffs are included (from1994) the landed price is about even with the farm price received by Korean producers of kiwifruit.Table 5.10 provides additional detail for imported kiwifruit margins. Compared to domestickiwifruit, margins, particularly retailer margins, are much higher.
Table 5.9 Margins by Stage of Imported Kiwifruit Marketing
Classification Ratio of margin (%)
Ratio of import price 26.1
Distribution margin 73.9
Margin by stages Import stageWholesale stage
28.512.1

63
Retail stage 33.3

64
Table 5.10 Analysis of Distribution Margin for Imported Kiwifruit (January 1994)
Classification Amount(Won/kg)
%
Imported unit cost C. I. F. 1,344 26.1
Importer TariffOther expenses & profitSales price
672797
2,813
13.015.554.6
Wholesaler Other expenses & profitSales price
6253,438
12.166.7
Retailer Other expenses & profitSales price
1,7185,176
33.3100.0
The European landed price for kiwifruit (Tables 5.10 and 5.11) as a percent of retail price, is muchgreater for New Zealand kiwifruit than the landed price percent for imported kiwifruit in Korea. ForNew Zealand kiwifruit into Europe, landed costs are slightly over 53% of the total retail price. InKorea, landed costs for kiwifruit (of which New Zealand accounted for most imports), are only 26%of the retail price. The European margin is certainly better than the Korean margin, on a percentagebasis, for imported kiwifruit. However, improvements in the Korean distribution system couldprovide relatively greater opportunities to improve the margin for imports into that country than intoEurope.
Table 5.11 Margins by Stage of Kiwifruit Marketing, Europe, 1995
Classification Ratio of margin (%)
Ratio of import price 53.9
Distribution margin 46.1
Margin by stages Import stageWholesale stageRetail stage
13.83.7
28.6
Source: NZ Kiwifruit Marketing Board.

65
Table 5.12 Analysis of Distribution Margin for Kiwifruit, Europe, 1995
Classification Amount(NZ$/Tray)
%
Imported unit cost C. I. F. 7.82 53.9
Importer TariffOther expenses & profitSales price
0.681.32
9.82
4.79.1
67.7
Wholesaler Other expenses & ProfitSales price
0.54
10.36
3.7
71.4
Retailer Other expenses & profit
Sales price
4.14
14.50
28.6
100.0
Source: New Zealand Kiwifruit Marketing Board
The data contained in Tables 5.8 and 5.10 indicate that imported kiwifruit are priced, at the retaillevel, over twice that of domestically produced kiwifruit. While the import duty is a significantfactor in this difference, margins for imported kiwifruit, particularly retailer margins, aresubstantially higher than margins for domestic products. If changes in the Korean distributionsystems are effective in reducing distribution and marketing costs, one possible outcome would bethat the distribution costs of imported products would equal domestic marketing and distributioncosts. Using data from Tables 5.8 and 5.10 as a base, the impact of lower distribution costs on theprice of imported kiwifruit was assessed. Tables 5.13, 5.14, 5.15 and 5.16 compare two differentoutcomes: lower distribution costs are absorbed into domestic margins either
(a) as a fixed monetary amount in each step in the marketing and distribution processafter the products are landed in Korea (Tables 5.13 and 5.14); or
(b) maintaining a fixed percent in each step in the marketing and distribution processafter the products are landed in Korea (Tables 5.15 and 5.16).
If the marketing and distribution costs for imported products equal domestic margins as in Tables5.13 and 5.14, there will be a reduction of approximately 40% in the retail price of importedkiwifruit. If the percent share of each margin remains constant as in Table 5.15 and 5.16, there couldbe a reduction of about 32% in the retail price from that of Table 5.10. Either way, improveddistribution and marketing systems in Korea will create downward pressure on prices at the retaillevel for both imported and domestic kiwifruit.

66
Table 5.13 Margins by Stage for Imported Kiwifruit, Assuming Constant Costs
Classification Componentratio (%)
Margin bystages
Componentratio (%)
Import price 43.2 Total margin 56.8
Distributionmargin
Total marginDirect costIndirect & Profit
56.832.224.6
Importer stageWholesale stageRetail stage
37.76.3
12.9
Table 5.14 Analysis of Distribution Margins by Imported Kiwifruit, by Stage, Assuming Constant Costs
Classification Amount(Won / kg)
%
Import price 1,344 43.20
Importer
stage
Import duty
Clearance cost
Inland transportationcost
Commission for auction
Indirect cost & profit
672
75
80
115
230
21.60
2.41
2.57
3.70
7.39
Sales price 2,516 80.87
Wholesale
stage
Transportation cost
Indirect cost & profit
10
185
0.32
5.95
Sales price 2,711 87.14
Transportation cost 50 1.61
Retailer Indirect cost & profit 350 11.25
stage Sales price 3,111 100.0
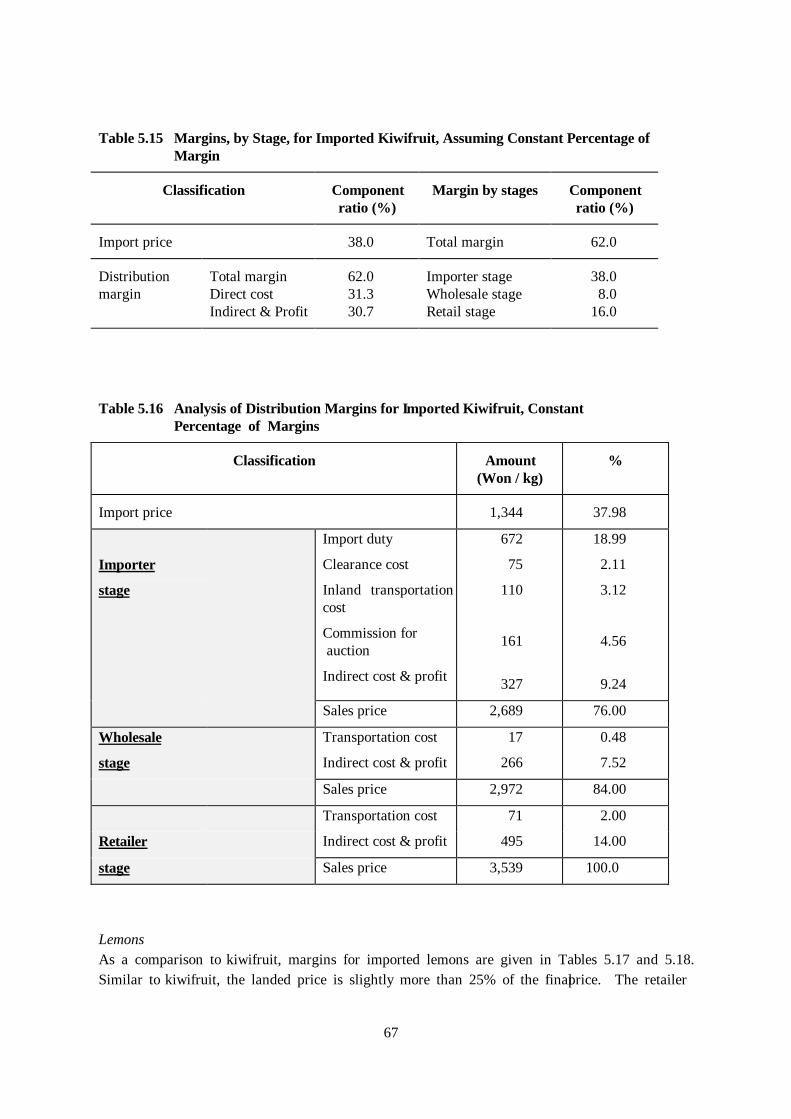
67
Table 5.15 Margins, by Stage, for Imported Kiwifruit, Assuming Constant Percentage of Margin
Classification Componentratio (%)
Margin by stages Componentratio (%)
Import price 38.0 Total margin 62.0
Distributionmargin
Total marginDirect costIndirect & Profit
62.031.330.7
Importer stageWholesale stageRetail stage
38.08.0
16.0
Table 5.16 Analysis of Distribution Margins for Imported Kiwifruit, Constant Percentage of Margins
Classification Amount(Won / kg)
%
Import price 1,344 37.98
Importer
stage
Import duty
Clearance cost
Inland transportationcost
Commission for auction
Indirect cost & profit
672
75
110
161
327
18.99
2.11
3.12
4.56
9.24
Sales price 2,689 76.00
Wholesale
stage
Transportation cost
Indirect cost & profit
17
266
0.48
7.52
Sales price 2,972 84.00
Transportation cost 71 2.00
Retailer Indirect cost & profit 495 14.00
stage Sales price 3,539 100.0
LemonsAs a comparison to kiwifruit, margins for imported lemons are given in Tables 5.17 and 5.18.Similar to kiwifruit, the landed price is slightly more than 25% of the final price. The retailer

68
receives a larger percent of the margin for lemons than for kiwifruit. Retailer margins for kiwifruitwere well above retailer margins for pumpkins, carrots and tomatoes. However, even at a retailmargin of 33.3% for imported kiwifruit, the retail margin for imported lemons was higher at 44.3%.Table 5.17 Margins by Stage of Lemon Marketing
Classification Ratio of margin (%)
Ratio of import price 27.6
Distribution margin 72.4
Margin by stages Import stageWholesale stageRetail stage
22.95.2
44.3
Table 5.18 Analysis of Distribution Margin for Imported Lemons (January 1994)
Classification Amount(Won/kg)
%
Imported unit cost C. I. F. 882 27.6
Importer Tariff (40 %)Other expenses & profitSales price
353376
1,611
11.111.850.4
Wholesaler Other expenses & ProfitSales price
1671,778
5.255.7
Retailer Other expenses & profitSales price
1,4163,194
44.3100.0
Source: AFMC (1994)
BeefDomestic BeefThe system for marketing beef has been, in the recent past, a reasonably simple process for domesticproducers and a complex process, bordering on Byzantine, for imported beef. For a variety ofreasons, discussed briefly below, the marketing system for domestically-produced beef is separatefrom the marketing system for imported beef.
The market for domestic beef in Korea can be broadly categorised as a free market. Cattle producershave a choice about how to sell their products - to local assemblers, to wholesale markets, or onconsignment to a co-operative or slaughter house. Figure 5.9 is a diagram of domestic marketing

69
channels for beef in Korea. Domestic beef producers have considerable flexibility about how to selltheir beef. Although about 30% is marketed through wholesale markets, in a manner similar to fruitand vegetables, a considerable amount of cattle are marketed outside the wholesale market chain. Inthis situation, the product goes directly to butcher shop owners or private meat suppliers which caterto restaurants. Instead of title transferring at a wholesale market, this local beef is sold at localmarkets, often purchased by a meat supplier acting as an agent for a customer.
Consumer
Butcher shops Supermarkets Co-operative Retail Stores
Wholesale Mkt Co-operativeWholesalers (slaughtering Marketing
& auctioning) Centre
Local Slaughter Houses
Country Dealers Cattle Markets Co-operatives
Producers
Source: Kim, 1996
Figure 5.6 Marketing Channels for Beef in Korea

70
Imported BeefImported beef has significantly different distribution channels than has domestic beef. Thisseparation of domestic and imported beef is driven by a recognition that "For consumers it is difficultto distinguish low price imported beef from Hanwoo beef, or even from imported grainfed beef"(NLCF, 1991) Because of this difficulty, it was believed that some butcher shops were sellingimported beef as higher-priced domestic beef and taking an unfair profit in the process.Consequently, separate distribution channels were established to assure maintenance of productidentity for domestic and imported beef. Imported beef channels were further separated intograssfed and grainfed channels. Government officials believed that by establishing separate channels(1) the consumption of beef would increase among lower income consumers; (2) price informationwould be provided to Korean cattle farmers so they could estimate if their production was undulyunderpriced; and (3) butchers would be prevented from gaining improper profits from sellingmislabelled meat, that is selling imported beef as higher-priced domestic beef.
Table 5.19 gives a comparison of the marketing margins for imported beef, grassfed carcass beef andgrainfed beef. An interesting aspect of the cost data is that retail margins for imported beef are verysimilar to retail margins for domestically-produced fruits and vegetables. However, the retailmargins for imported beef are considerably below retail margins for imported lemons and kiwifruit.Whether this difference, which is considerable, may be attributed to the ability of fruit and vegetablemarketers to effectively differentiate their products, and as a result receive a higher price, is unclear.What is clear is the significant margin for imported lemons and kiwifruit captured by retailers.
Table 5.19 Comparison of Marketing Margins for Beef Imported in Korea in Percent of Wholesale Price, 1995
KCSC Wholesale
Grassfed Carcas Grainfed Grainfed
Wholesale costsCIF 47.6 47.6 47.6Boning 12.1 11.2 2Tariff 9.5 10.8 9.4Consignment Fee for sale 3Listing Charge at Market 1.5Sales Agent Commission 4 4.5NLCF Consignment Fee 2.2 2.5LPMO Operating Expense 0.8 0.8Other 2.3 1.6Total Cost 78.5 79 63.5LDF 21.5 21 36.5Wholesale 100 100 100
CIF = Cargo, insurance and freight LPMO = Livestock Products Marketing Organisation

71
LDF = Livestock Development Fund NCLF = National Livestock Co-operative FederationWholesale = Retail price-retailer margin-transport cost-Brokers commission at auctionKCSC = Korea Cold Storage Corporation
Source: NLCF (1991)
72
MusselsUntil the late 1970s, the Korean seafood market was effectively closed to imported seafood.Progressively, the market has opened during the past two decades. Similar to fruits and vegetables,the auction market system is significant in the marketing of seafood. Until recently, the Koreangovernment required that all locally caught fish be sold through producer markets or governmentauthorised wholesale fish markets. These requirements were established in an attempt to assureeffective monitoring of fish as a resource and to collect taxes. Changes in the marketing system havetaken place. It is noteworthy that, unlike fruits and vegetables, the Korean government seems to beencouraging a range of marketing alternatives to the auction marketing system to improve marketingefficiencies (Smith et al, 1996).
While alternatives to auction markets are in the process of being developed, which would placeimported fish more directly into price competition with the domestic catch, all imports must meetinspection and labelling requirements, regardless of how they are marketed. These labelling andinspection requirements are different than those required for the domestic catch. For instance, unlikeimported fruits and vegetables, foreign analysis of imported fish is not accepted as an alternative todomestic inspection of the product. The Korean authorities undertake their own inspection of eachshipment. This means imported seafood products are inspected twice - once in the exporting countryand again when entering Korea. If problems with three consecutive import shipments appear, thenall shipments will be detained while tests are completed by Korean authorities. This inspection andtesting process takes about 10 days and effectively prevents shipments of fresh, chilled or liveproducts to be made at a competitive price under these conditions. Further, a failed consignmentmust be returned to the country of origin which further increases the cost of landed product in Korea.Domestic catches, which also must meet similar standards, are also subject to inspection but only ona random basis.
Although the delays and associated extra costs incurred with these inspections can be met by theimporter, the lack of control over the storage and handling during inspection, or delays duringinspection, remain a significant problem for importers. The risks associated with this step of themarketing process can be considerable. As discussed with other products, when risk is involved, theperson holding that risk expects to received a price premium for holding the risk. With inspectiondelays adding risk to imported fish products, the shipper can hold the risk and receive a higher pricefor the product. However, because the inspection process does not add much value to the product, itis difficult to pass higher costs on to the next buyer. So the exporter is left with the choice of holdingall risks internally and remaining price competitive, or attempting to shift the costs on to anotherbuyer and possibly no longer being price competitive.
Complete marketing margin information for mussels was not available. However, marketing margininformation for clearance from point of entry to the importer/distributor is in Tables 5.20 and 5.21.

73
Table 5.20 Margins, by Stage, for Imported Mussels
Classification Ratio of margin (%)
Ratio of import price 41.6
Distribution margin 58.4
Margin by stages Import stageWholesale stageRetail stage
23.415.020.0
Source: AFMC (1996)
Table 5.21 Analysis of Distribution Margin for Mussels (January 1994)
Classification Amount(Won/kg)
%
Imported unit cost C. I. F. 2,080 41.6
Importer Tariff (20 %)Other expenses & profitSales price
416754
3,250
8.315.1
65.0
Wholesaler Other expenses & profitSales price
750
4,000
15.0
80.0
Retailer Other expenses & profitSales price
1,000
5,000
20.0
100.0
Source: AFMC (1996)
Note the import price for mussels, as a percent of the total retail price, is identical to beef. The factthat over 40% of the final retail price is composed of a landed price means that less than 60% of theconsumer price is captured by marketing margins in Korea. This indicates that even with theconsiderable restructuring taking place in the Korean distribution system, such increased efficienciesmay not lead to New Zealand mussels becoming more price competitive with domestically producedseafood because of the high landed costs of the product.

74

75
Chapter 6
The Korean Food Distribution System -Current Reforms and Future Trends
The marketing costs involved in moving a product can be the difference between a profitable andsustainable commercial relationship or one that ends quickly when sufficient profit is no longeravailable. The difference in marketing margins between imported products and domesticallyproduced products constituted, in this study, between 40% and 75% of the final consumer price. Thisdifference is certainly sufficient to make a New Zealand exporter unprofitable unless the NewZealand produced product can receive a premium price from Korean consumers.
For New Zealand products which are moved into Korea, the difference between the landed price of aproduct and the final retail price in Korea (the distribution margin) is normally very significant.Further, the difference between the farm level price for products produced in Korea and the retailprice is much smaller than that of imported products. For example, for Korean producers ofkiwifruit, the distribution margin accounts for less than 50% of the final price. For kiwifruitimported from New Zealand, the landed price is approximately 25% of the retailer price - that is ifthe retail price of New Zealand kiwifruit is $1.00/kg, the landed price is only $0.25 while theremaining $0.75 is collected by those in the marketing chain who provide time, place or transferutility. For domestic tomato producers, however, less than 50% of the final price is devoted to off-farm marketing. This means the domestic tomato producer can absorb a significant change inmarketing margins and still be price competitive.
How best for an exporter to handle the difference between the landed price of an imported productand the farm-gate price of domestically-produced products is a very significant part of any marketing

76
strategy for selling New Zealand products into Korea. While both the imported and domesticproduct must pass through the marketing chain, an inefficient domestic marketing framework willwork toward the disadvantage of smaller domestic producers more than larger importers, eventhough domestic producers will normally have an absolute price advantage. This means thatincreased efficiencies in the distribution chain will accrue most directly to the benefit of localproducers. However, all involved in the marketing chain, including the consumer, will benefit fromincreased efficiencies.
KOREAN GOVERNMENT STRATEGY FOR DISTRIBUTION MARGINSIn recognition of the opportunity for increasing the competitiveness of domestic farmers andincreasing the welfare of the consumer, marketing margins have attracted attention from the Koreangovernment. The government believes that improvements in the marketing and distribution chain willlead to reduced food prices to consumers and work to keep domestically produced productscompetitive with imported products as trade barriers are reduced. The adoption of this strategyreflects the recognition by the government of Korea that as international trade negotiations reduceproduction distorting subsidies for Korean producers, the Korean government views improveddomestic marketing channels as an appropriate tool to keep Korean food production competitivelypriced against imports.
The Korean government, as discussed below, has turned its focus to the distribution industry as away to reduce costs of consumer products and encourage fair competition. This governmentalinitiative can be divided into five categories:
1. Expansion and innovation of distribution facilities;2. Building a large number of distribution centres;3. Encouraging the opening of more low price stores;4. Building additional wholesale centres;5. Opening of additional markets to imported items in order to reduce
consumer costs.
It is recognised that for the Korean government to be successful in the above categories will beneither easy nor inexpensive. In an attempt to address these challenges, the Korean government hastaken several steps. These steps include streamlining of governmental approval for building newdistribution centres and encouragement for the expansion of price discount centres. Further, inrecognition of the role of greater competition, the Korean government has indicated it will takeefforts at every step of the distribution process to encourage price competition. It is believed thatsuch competition will promote innovation and efficiency of the entire physical distribution system.
As noted above, the Korean government is devoting considerable resources to improve thedistribution system, particularly the marketing of agricultural and fishery products. The goal of theKorean government is to improve the marketing and distribution system of agricultural products. Itis believed that this goal can be reached through the following:

77
1. Construction of local shipping facilities to increase the volume of products shippedthrough co-operatives thereby reducing the importance of local assembly merchants;
2. Construction of public wholesale markets to meet the expected demand for greateropportunities for marketing to assure that almost every metropolitan area is serviced bypublic wholesale markets;
3. With agricultural co-operatives having a significant role in the construction of themarkets, these co-operatives will become increasingly active in food marketing.
Kim (1996) details these major investment plans:
(a) Improving marketing of agricultural products at the first handler level to include:- More active participation of producers' associations in marketing;- Investment on marketing infra-structure to enhance sorting, packaging,
storing and joint marketing;- Construction of 4,000 shipping points and 160 packing houses;- Quality assurance programs to develop producers' own brands.
(b) Diversify marketing channels to reduce marketing costs and provide producers withmore outlets to sell agricultural products. These efforts include:
- Construction of 34 public wholesale produce marketing centres by 1998;- To supplement marketing channels, 16 distribution centres will also be
constructed by 2001.
CHANGING KOREAN RETAILING SECTORThere are fundamental changes taking place in the distribution system of Korea. These changes aredriven, in part, by a view that marketing margins in Korea are too large. The Korean government isplanning to spend US$12.8 billion on construction of shipping and packing facilities in producingareas and on distribution facilities in urban areas (Kim, 1995). While there are obvious indicationsthat large retail stores are becoming more important in the food industry, today Korea remains acountry with more food stores per capita than any other country in the world. For example, there isone food store per 142 persons in Korea compared to 199 in Japan and over 1,400 persons in theUnited States (Kim, 1996). While larger retail stores may reduce distribution costs, the reality isthat a food exporter to Korea will probably have product in a large number of smaller stores, ratherthan a large volume in fewer stores.
Nevertheless, trends in Korea’s retailing sector are noteworthy. Following the gradual reduction ofgovernment control of the retail sector over the past several years, a variety of discount stores,membership wholesale clubs, and hypermarkets have been started. The focus of these stores is
78
similar to other retailing stores of similar size elsewhere in the world - low prices, high volume andgood quality. The growth is not limited to Seoul. The Makro Joint Venture Company opened amembership wholesale club in Inchon during January, 1996. According to Lee (1996), the numberof low price stores throughout Korea, as of August 1996 were:
Discount Stores: 44Membership Wholesale Clubs 13Hypermarkets 2Super Centres 2
In addition, it has been reported that over 30 conglomerates have expressed an interest in startingnew stores in the near future (Lee, 1996).
However, existing department stores in Korea remain a strong retailing force showing an increase insales of 13% from 1994 to 1995. The 132 department stores in Korea had sales of US$162 billionin 1995. Recent trends indicate continued growth for department stores, despite the increase incompetition from low price stores.
KOREAN IMPORT REGULATIONSKorea has, over the past several years, moved steadily toward a more free and open trading system,reducing import restrictions and protection of fair trade (KOTRA, 1993). Under existing WorldTrade Organisation guidelines, this trend will continue. However, there remains a complex set ofrules and regulations to bring food products into Korea. These rules and regulations affectmarketing margins and consequently their impact on place, form and transfer utility.
The Korean Customs Act provides direction for customs systems and procedures regardingtransportation facilities, bonded areas, transportation, customs clearance, etc. "The importation ofgoods requires a series of procedures ranging from the conclusion of a contract to import payments.Other general import procedures include the securing of import permission and customs clearance.Procedures included in the optional category depend of the type of transaction and the nature of thegood to be imported" (Lee, 1996). In addition to the Korean Customs Act there are other lawsrelated to customs formalities: Quarantine Act, Agricultural Product Inspection Act and MarineProduct Inspection Act. Liberalisation of the Korean import regime means that all of the aboveActs, and others, are being modified or have recently been modified to become consistent with theUruguay Round.

79
CONCLUSIONS
There are a large number of small shops in Korea, many with limited or no refrigeration. Thismeans that inventories of any product which requires special cooling or freezing must be kept quitesmall. Consequently, considerable dependence is placed on the distribution system to assureproducts are made available to the stores quickly and frequently. Despite the enormous dependenceon the distribution system, the efficiency of the physical distribution system in Korea appears to below. This apparent lack of efficiency in such a vital component of making products available toconsumers holds great promise, then, for government reform. It is very likely that the improvementsin the distribution system which the Korean government is undertaking will lead to greater systemefficiencies, lower distribution costs and, in turn, lower consumer prices.
An improved distribution system will encourage continued growth in the amount of retail salesgenerated by modern and larger scale retail stores. This means that considerable stress may be puton the continued viability of small neighbourhood food stores. Although this competitive pressuremay take a long time to have a noticeable impact on retailing in Korea, the trend is clearly beingestablished.
The growth in the amount of food sales which will take place in new and large retail stores willprobably reduce the need for large wholesale auction markets. It is believed that new marketingrelationships will develop as larger retail stores capture a greater percentage of consumer sales.These developments will most likely be similar to those formed in the marketing chain, in othercountries. In those countries, traditional auction markets have been replaced with other non-marketco-ordinating mechanisms such as contracts.
The huge amount of money spent by the Korean government is directed toward an area of the Koreaneconomy which is in considerable need of modernisation. However, the emphasis on new and largewholesale markets is not consistent with market trends in other parts of the world. It is believed thatthe interests of increasing price transparency, reducing consumer food costs and increasing thecompetitiveness of Korean-produced food products are positive and important interests addressed bythe reforms. However, market trends are away from large central markets to more direct farmer-to-retailer links, driven by the needs of large retail stores. These needs cannot be met as efficientlythrough wholesale markets as with other marketing structures.
Greater funding of improved infrastructure such as new cold stores, chilling facilities or otherrefrigeration capabilities is needed. The current distribution system was established to quickly servemany small stores which had limited storage space and often no freezers or refrigeration. Consumerfood products increasingly require refrigeration. If these smaller stores are to remain competitivewith new mega-stores, they must increase their refrigeration capacity. Indications are that exportersfrom New Zealand have been very limited in their success for some products because of the lack ofrefrigeration capacity in Korea.

80
The importance to New Zealand of the improvements in Korea's distribution system is notcompletely straight forward:
a. More narrow domestic margins mean domestic products will become muchmore price competitive with imported products;
b. It will be difficult for New Zealand products to compete against domesticproduction sold through an auction market where price is the only factorinvolved in transferring title.
c. Because it will be increasingly difficult for imported products to competeagainst domestic products based only on price, New Zealand exporters mustlook to establish non-market methods to sell their products. For instance, alarge amount of beef is purchased directly by the hotel and restaurant tradeoutside of auction markets. Such a model, wherein a direct link betweensuppliers in New Zealand and final customers in Korea is established, willprovide non-price-related opportunities for increased sales.
The impact of changes in Korea’s marketing and distribution system on the ability of New Zealandproducts to be competitive in Korea depends on the product imported. However, the researchindicates that improved distribution and marketing systems in Korea will create downward pressureon consumer food prices at the retail level.

81
References
AFMC (1994), Actual Condition of Distribution of Agricultural Products, Agricultural and FisheryMarketing Corporation, Seoul, Republic of Korea.
AFMC (1996), Marketing Margins, Agricultural and Fishery Marketing Corporation, Seoul,Republic of Korea.
Anon (1996), Korean Agricultural and Rural Prospects in the 21st Century: Policy Issues,Republic of Korea (in Korean).
Choi, J-H and Lee, K-I (1995), Changes in Food Consumption in Korea, R335, Korean RuralEconomics Institute, Seoul, Republic of Korea (in Korean).
Choi, J-H and Lee, K-I (1996), “Income and socio-demographic impacts on household foodexpenditures away from home in Korea”, Journal of Rural Development 19(1):37-52.
Downey, W. and Erickson, S. (1987), Agribusiness Management, McGraw-Hill, Inc., New York.
Doyle, S., Bui-Lan, A., Rodriguez, A., Benard, A. and Whish-Wilson, P. (1995), “Pacific Basin beeftrade: the influence of South Korea”, Australian Commodities 2(3):326-339.
Far Eastern Economic Review (various issues).
Huang, J. and David, C.C. (1993), “Demand for cereal grains in Asia: the effect of urbanisation”,Agricultural Economics 8:107-124.
IMF (various issues), International Financial Statistics, Washington, DC.
Kim, D-H. (1995), “Structure and features of food distributors in Korea”, Journal of RuralDevelopment 18(2):155-168.
Kim, D-H. (1996), “Food Marketing System in Korea: A Development Perspective”, presented toAsian Agricultural Economics Society Meeting, Indonesia.
Kim, J-S. (1995), Korean Agriculture 1995.

82
Koo, W-W, Yang, S-R and Lee, C-B. (1993), “Estimation of Demand for Meat in Korea” Journalof Rural Development 16: 205-222.
Korea Customs Service (various issues), Statistical Yearbook of Foreign Trade, Seoul, Republic ofKorea.
KOTRA (1993), How to Trade with Korea, Korea Trade Promotion Corporation, Seoul, Republicof Korea.
KREI (1993), Effect of the Uruguay Round Agreement, P9306, Korean Rural Economics Institute,Seoul, Republic of Korea (in Korean).
KREI (1994), Mid-Long Term Projections of the Agricultural Sector’s General Indicators, R314,Korean Rural Economics Institute, Seoul, Republic of Korea (in Korean).
KREI (1995), Food Balance Sheet, Republic of Korea, Korean Rural Economics Institute, Seoul.
Kwock, C-K (1996), “Republic of Korea” Ch.8 in Changing Dietary Intake and FoodConsumption, Asian Productivity Organisation, Tokyo.
Kwock, C-K. (1996), “The Food Industry in Korea”, in Quality Control in Processed Foods, KoreaFood Research Institute.
Lee, Kwang-Jong (1996), “Deciding what to import”, presented to Asia Food Marketing InstituteConference, Hong Kong, September.
Ministry of Agriculture and Forestry (various issues), Statistical Yearbook of Agriculture, Forestryand Fisheries, Seoul, Republic of Korea.
Ministry of Agriculture, Forestry and Fisheries (1996), Korean Agriculture, Republic of Korea.
Ministry of Foreign Affairs and Trade (various issues), New Zealand’s External Trade Statistics,Wellington, New Zealand.
Naran, R. (1996), “Korean Development, Agriculture and the Dairy Sector with Specific Referenceto Cheese”, BAgrEcon(Hons) thesis, Massey University, New Zealand.
National Livestock Cooperatives Federation (various issues), Materials on Price, Supply andDemand of Livestock Products, Seoul, Republic of Korea.
National Statistical Office (various issues), Annual Report on the Family Income and ExpenditureSurvey, Seoul, Republic of Korea.

83
National Statistical Office (various issues), Annual Report on the Price Survey, Seoul, Republic ofKorea.
NLCF (1991), Beef Marketing in Korea, The Marketing and Distribution Subcommittee Report,Joint Study Team, March (unpublished), Seoul, Republic of Korea.
PECC (1996), Pacific Economic Outlook, US National Committee for Pacific EconomicCooperation, Washington, DC.
Podbury, T., Ladlow, S., Roberts, I., Felton-Taylor, L. and Chaimun, S. (1995), “East and SouthEast Asian dairy markets: issues and challenges”, Australian Commodities 2(3):340-357.
Rae, A.N. (1995), East Asian Food Consumption Patterns: Projections for Animal Products,Agricultural Policy Paper No.18, Centre for Applied Economics and Policy Studies, MasseyUniversity, New Zealand.
Rae, A.N. (1997), “The effects of expenditure growth and urbanisation on food consumption EastAsia: a note on animal products”, (mimeograph).
Rae, A.N. and Meister, A.D. (1995), Environmental Constraints to Pacific Rim Agriculture,Agricultural Policy Proceedings No.18, Centre for Applied Economics and Policy Studies,Massey University, New Zealand.
SAMACO (1996), Total Wholesale Market, The Seoul Agricultural and Marine Products WholesaleMarket Management Corporation, Seoul, Republic of Korea.
Smith, P., Dennis, F. and Proctor, W. (1996) South Korean Market for Seafood, Research Report96.3, Australian Bureau of Agriculture and Resource Economics, Canberra, Australia.
UNCTAD (various issues), Handbook of International Trade and Development Statistics, UnitedNations, Geneva.
USDA (internet), Estimates of Producer and Consumer Subsidy Equivalents, Economic ResearchService, Washington, DC, www.econ.ag.gov.
World Bank (various issues), Trends in Developing Countries, Washington, DC.

84
Also of interest
Environmental Constraings to Pacific Rim Agriculture: Further Evidenceedited by Anton D Meister and Allan N Rae
Paper No. 1997 130 pages ISSN 0111-6339
Food Consumption Patterns in Indonesian Households:Segmenting the Market
Allan N RaeAgricultural Policy Paper No. 19
1996 60 pages ISSN 0110-5558
East Asian Food Consumption Patterns:Projections for Animal Products
Allan N RaeAgricultural Policy Paper No. 18
1995 75 pages ISSN 0110-5558
Environmental Legislation in EuropeThe European Union Nitrate Directive
Lessons for New ZealandAnton D Meister
Natural Resource Discussion Paper No. 181995 58 pages ISSN 0110 2044
For order and other information, please write to:
Centre for Applied Economics and Policy StudiesMassey UniversityPalmerston NorthNEW ZEALAND
Agricultural Policy Paper No. 20ISSN 0110-5558
September 1997 Price: $15.00

85