Embed Size (px)
Citation preview
Journal of Clinical Lipidology (2016) 10, 356–367
Familial lecithin:cholesterol acyltransferasedeficiency: First-in-human treatment withenzyme replacement
Robert D. Shamburek, MD*, Rebecca Bakker-Arkema, PharmD1,Bruce J. Auerbach, PhD, Brian R. Krause, PhD, Reynold Homan, PhD,Marcelo J. Amar, MD, Lita A. Freeman, PhD, Alan T. Remaley, MD, PhD
Cardiovascular and Pulmonary Branch, National Heart, Lung and Blood Institute, NIH, Bethesda, MD, USA (DrsShamburek, Amar, Freeman, Remaley); and AlphaCore Pharma, Ann Arbor, MI, USA (Drs Bakker-Arkema, Auerbach,Krause, Homan)
KEYWORDS:Cholesterol;HDL;Triglyceride;Renal disease;Lecithin cholesterolacyltransferase;Lecithin cholesterolacyltransferase deficiency;LCAT;Recombinant enzymereplacement;Lipoprotein-X
1 Present address. MedImmune, LLC
* Corresponding author. National In
MSC 1666, Bldg. 10/Rm. 8N-202, Beth
E-mail address: [email protected]
Submitted December 12, 2015. Acce
2015.
1933-2874/Published by Elsevier Inc.
http://dx.doi.org/10.1016/j.jacl.2015.1
BACKGROUND: Humans with familial lecithin:cholesterol acyltransferase (LCAT) deficiency (FLD)have extremely low or undetectable high-density lipoprotein cholesterol (HDL-C) levels and by early adult-hood develop many manifestations of the disorder, including corneal opacities, anemia, and renal disease.
OBJECTIVE: To determine if infusions of recombinant human LCAT (rhLCAT) could reverse the ane-mia, halt progression of renal disease, and normalize HDL in FLD.
METHODS: rhLCAT (ACP-501) was infused intravenously over 1 hour on 3 occasions in a dose optimi-zation phase (0.3, 3.0, and9.0mg/kg), then3.0or9.0mg/kgevery1 to2weeks for 7months inamaintenancephase. Plasma lipoproteins, lipids, LCAT levels, and several measures of renal function and other clinicallabs were monitored.
RESULTS: LCAT concentration peaked at the end of each infusion and decreased to near baseline over 7days. Renal function generally stabilized or improved and the anemia improved. After infusion, HDL-Crapidly increased, peaking near normal in 8 to 12 hours; analysis of HDL particles by various methodsall revealed rapid sequential disappearance of preb-HDL and small a-4 HDL and appearance of normala-HDL. Low-density lipoprotein cholesterol increased more slowly than HDL-C. Of note, triglycerideroutinely decreased after meals after infusion, in contrast to the usual postprandial increase in the absenceof rhLCAT infusion.
CONCLUSIONS: rhLCAT infusions were well tolerated in this first-in-human study in FLD; the anemiaimproved, as did most parameters related to renal function in spite of advanced disease. Plasma lipids tran-siently normalized, and therewas rapid sequential conversion of small preb-HDL particles tomature spher-ical a-HDL particles.Published by Elsevier Inc. on behalf of National Lipid Association.
, Gaithersburg, MD, USA.
stitutes of Health, 10 Center Dr.
esda, MD 20892-1666, USA.
pted for publication December 15,
on behalf of National Lipid Associatio
2.007
Introduction
Lecithin:cholesterol acyltransferase (LCAT) is a plasmaenzyme that catalyzes the production of cholesteryl esters(CEs) from free cholesterol (FC) and phosphatidylcholine(lecithin).1 In humans, about 90% of CE in plasma is
n.

Shamburek et al LCAT enzyme replacement therapy 357
synthesized by LCAT mainly in high-density lipoprotein(HDL).2 It is believed that newly formed CE accumulates inthe core of HDL particles, resulting in the maturation ofHDL particles from small discoidal particles tomature, spher-ical a-HDL.3 In humans, the resulting CE in mature HDL arethen directly removed by the liver (minor route) or transferredto apolipoprotein B–containing lipoproteins by CE transferprotein (CETP; major route) and cleared via the classical he-patic low-density lipoprotein (LDL) receptor pathway,2 origi-nally described by Glomset as reverse cholesterol transport.4
Inherited mutations in the gene for LCAT result in 2autosomal recessive forms of LCAT deficiency. Patients witha total loss of LCAT activity are classified as having familialLCAT deficiency (FLD) and have a marked decrease inHDL cholesterol (HDL-C) levels (,10 mg/dL), plasma CE,25% of total cholesterol (TC; normal .70%), mild-to-severe hypertriglyceridemia, lipoprotein-X (Lp-X) inplasma, corneal opacities, normochromic normocytic ane-mia, and progressive renal disease.5–8 FLD patients oftendevelop proteinuria as young adults and then go on todevelop nephrotic syndrome and end-stage renal diseasetypically in their 40s and 50s.1 There is no effective treat-ment except for dialysis or renal transplantation, and the dis-ease can rapidly reoccur in the transplanted kidney.9–11
Renal disease may develop secondary to the appearance ofLp-X, which is a vesicular-like abnormal lipoprotein particlerich in phospholipid (PL) and FC that accumulates in thekidney.12 Patients with fish-eye disease have a partialLCAT deficiency with some residual LCATactivity.1,8 Thesepatients are relatively asymptomatic with no Lp-X or renaldisease but have reduced HDL-C and corneal opacities.
FLD patients have an abnormal distribution of HDLsubfractions; most of their plasma apoA-I is found in small,disc-shaped, poorly lipidated preb-HDL particles and a-4HDL particles containing PL and FC.13 Interestingly, patientswith LCAT deficiency do not have a markedly increased riskfor cardiovascular disease in most studies,1,14 likely becausethey also have low levels of LDLcholesterol (LDL-C) becauseof the decreased formation ofCEonHDL,which are normallytransferred from HDL to LDL by CETP.
Recently, recombinant human LCAT (rhLCAT; ACP-501)was shown to be safe in a phase I study of subjects withstable cardiovascular disease15 (ClinicalTrials.govNCT01554800) and is being developed as a potential therapyfor acute coronary syndrome. In this report, we describe thefirst-in-human use of enzyme replacement therapy (ERT)with rhLCAT in a patient with FLD and its effect on lipopro-tein metabolism and hematologic and renal function.
Methods
Study design
This single-center study was approved by the NationalHeart, Lung and Blood Institute, Institute Review Board,before patient recruitment. The subject provided informed
consent before participation in the study. The study wasconducted after Food and Drug Administration reviewunder an Investigational New Drug 117100 as an ExpandedAccess Protocol. This is a first-in-human study of ACP-501(rhLCAT) in a subject with FLD.
The subject was administered 1-hour intravenous in-fusions of rhLCAT (ACP-501) during a dose escalationoptimization phase (0.9, 3.0, and 9.0 mg/kg over 22 days;Supplementary Fig. 1), followed by a maintenance phase of10 infusions of each of the 2 higher doses weekly orbiweekly over 7 months (Supplementary Table 1).
A detailed Methods section is available in theSupplementary data.
Statistics
Summary statistics were reported as percent change orfold change from prestudy levels or preinfusion baselinelevels.
Results
Demographics of subject
A 52-year-old man with FLD and end-stage renal diseasepreviously described16 was enrolled in an expanded accessuse protocol (IND 117,100) to determine whether dialysiscould be avoided or delayed. Over the 31 months before in-clusion, the patient’s renal function rapidly declined (creat-inine increasing from 2.5 to 5.6 mg/dL), necessitating theplacement of a fistula in his arm in anticipation of dialysiswithin weeks. Baseline labs included: blood urea nitrogen(BUN) 159 mg/dL, creatinine 5.6 mg/dL, estimated glomer-ular filtration rate (eGFR) 13 mLs/min/1.73 m2, 24-hoururine protein 2307 mg, hemoglobin (HGB) 8.2 g/dL, hemat-ocrit (HCT) 24.7%, TC 80 mg/dL, LDL-C 46 mg/dL, HDL-C ,5 mg/dL, and triglyceride (TG) 147 mg/dL. See fullclinical history in Supplementary data.
Summary of safety of rhLCAT
Over the 8-month course of rhLCAT (ACP-501) therapy(Supplementary Fig. 1), the patient received a total of 23 in-fusions that werewell tolerated by the patient. There were noinfusion site reactions or infusion toxicities. Other thanfavorable changes in creatinine, BUN, cystatin C, HGB,and HCT, as summarized in the following sections, therewere no other clinically meaningful shifts in clinical labora-tory parameters or physical examination during the study.There were 3 adverse events (AEs) (atrial fibrillation, amild viral syndrome, and elective hemodialysis at thecompletion of the study) that were not attributed toACP-501.
Atrial fibrillation, which occurred 72 hours afterreceiving the third dose of rhLCAT, was classified as anserious adverse event (SAE). The patient had a long history
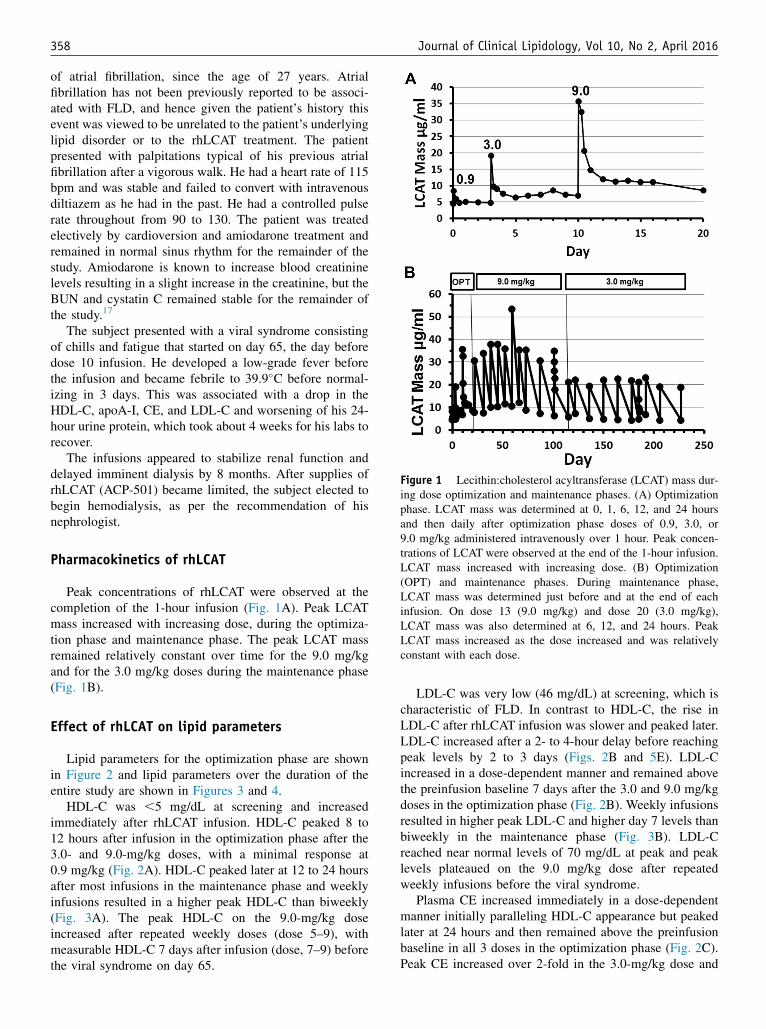
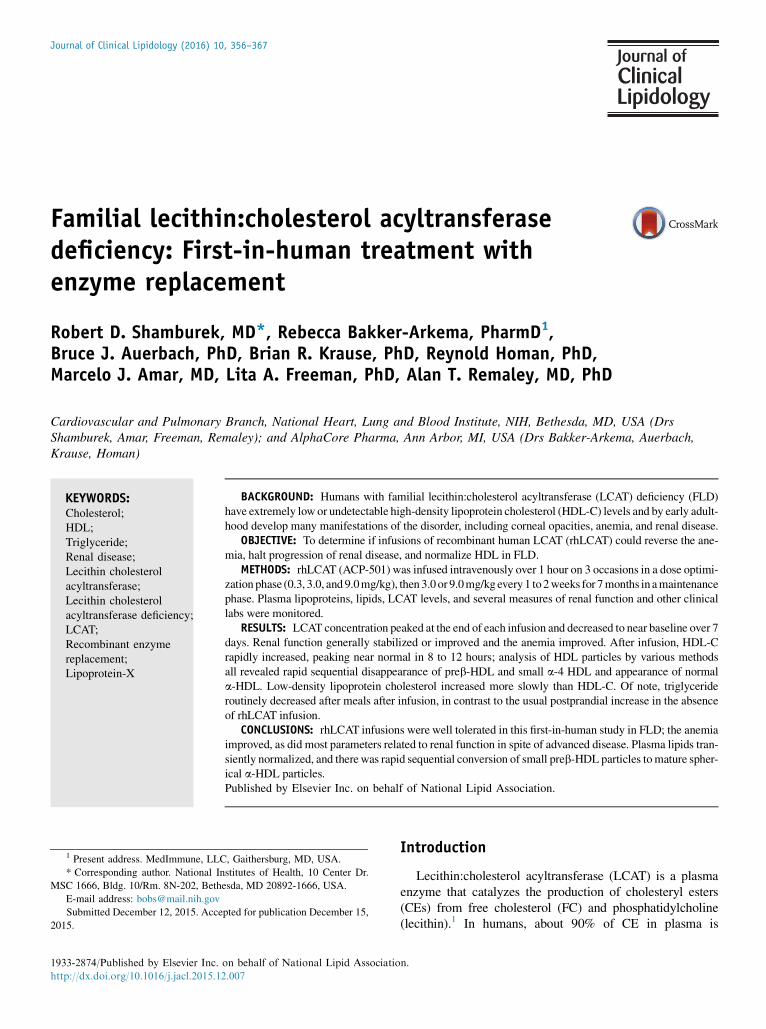
Figure 1 Lecithin:cholesterol acyltransferase (LCAT) mass dur-ing dose optimization and maintenance phases. (A) Optimizationphase. LCAT mass was determined at 0, 1, 6, 12, and 24 hoursand then daily after optimization phase doses of 0.9, 3.0, or9.0 mg/kg administered intravenously over 1 hour. Peak concen-trations of LCAT were observed at the end of the 1-hour infusion.LCAT mass increased with increasing dose. (B) Optimization(OPT) and maintenance phases. During maintenance phase,LCAT mass was determined just before and at the end of eachinfusion. On dose 13 (9.0 mg/kg) and dose 20 (3.0 mg/kg),LCAT mass was also determined at 6, 12, and 24 hours. PeakLCAT mass increased as the dose increased and was relativelyconstant with each dose.
358 Journal of Clinical Lipidology, Vol 10, No 2, April 2016
of atrial fibrillation, since the age of 27 years. Atrialfibrillation has not been previously reported to be associ-ated with FLD, and hence given the patient’s history thisevent was viewed to be unrelated to the patient’s underlyinglipid disorder or to the rhLCAT treatment. The patientpresented with palpitations typical of his previous atrialfibrillation after a vigorous walk. He had a heart rate of 115bpm and was stable and failed to convert with intravenousdiltiazem as he had in the past. He had a controlled pulserate throughout from 90 to 130. The patient was treatedelectively by cardioversion and amiodarone treatment andremained in normal sinus rhythm for the remainder of thestudy. Amiodarone is known to increase blood creatininelevels resulting in a slight increase in the creatinine, but theBUN and cystatin C remained stable for the remainder ofthe study.17
The subject presented with a viral syndrome consistingof chills and fatigue that started on day 65, the day beforedose 10 infusion. He developed a low-grade fever beforethe infusion and became febrile to 39.9�C before normal-izing in 3 days. This was associated with a drop in theHDL-C, apoA-I, CE, and LDL-C and worsening of his 24-hour urine protein, which took about 4 weeks for his labs torecover.
The infusions appeared to stabilize renal function anddelayed imminent dialysis by 8 months. After supplies ofrhLCAT (ACP-501) became limited, the subject elected tobegin hemodialysis, as per the recommendation of hisnephrologist.
Pharmacokinetics of rhLCAT
Peak concentrations of rhLCAT were observed at thecompletion of the 1-hour infusion (Fig. 1A). Peak LCATmass increased with increasing dose, during the optimiza-tion phase and maintenance phase. The peak LCAT massremained relatively constant over time for the 9.0 mg/kgand for the 3.0 mg/kg doses during the maintenance phase(Fig. 1B).
Effect of rhLCAT on lipid parameters
Lipid parameters for the optimization phase are shownin Figure 2 and lipid parameters over the duration of theentire study are shown in Figures 3 and 4.
HDL-C was ,5 mg/dL at screening and increasedimmediately after rhLCAT infusion. HDL-C peaked 8 to12 hours after infusion in the optimization phase after the3.0- and 9.0-mg/kg doses, with a minimal response at0.9 mg/kg (Fig. 2A). HDL-C peaked later at 12 to 24 hoursafter most infusions in the maintenance phase and weeklyinfusions resulted in a higher peak HDL-C than biweekly(Fig. 3A). The peak HDL-C on the 9.0-mg/kg doseincreased after repeated weekly doses (dose 5–9), withmeasurable HDL-C 7 days after infusion (dose, 7–9) beforethe viral syndrome on day 65.
LDL-C was very low (46 mg/dL) at screening, which ischaracteristic of FLD. In contrast to HDL-C, the rise inLDL-C after rhLCAT infusion was slower and peaked later.LDL-C increased after a 2- to 4-hour delay before reachingpeak levels by 2 to 3 days (Figs. 2B and 5E). LDL-Cincreased in a dose-dependent manner and remained abovethe preinfusion baseline 7 days after the 3.0 and 9.0 mg/kgdoses in the optimization phase (Fig. 2B). Weekly infusionsresulted in higher peak LDL-C and higher day 7 levels thanbiweekly in the maintenance phase (Fig. 3B). LDL-Creached near normal levels of 70 mg/dL at peak and peaklevels plateaued on the 9.0 mg/kg dose after repeatedweekly infusions before the viral syndrome.
Plasma CE increased immediately in a dose-dependentmanner initially paralleling HDL-C appearance but peakedlater at 24 hours and then remained above the preinfusionbaseline in all 3 doses in the optimization phase (Fig. 2C).Peak CE increased over 2-fold in the 3.0-mg/kg dose and

Figure 2 Optimization phase–lipoproteins and lipids. Dose optimization phase included the 0.9 mg/kg dose (black) observed for 3 days,then a 3.0 mg/kg dose (blue) observed for 7 days, and then a 9.0 mg/kg dose (red) observed for 7 days. The rhLCAT infusion was givenintravenously over 1 hour starting at time 0. Samples were taken at 0, 0.5, 1, 2, 4, 6, 8, 12, and 24 hours and then a fasting daily sample forup to 7 days. Atrial fibrillation occurred 3 days after the 9.0 mg/kg dose. The subject fasted for 12 hours before and during the infusion, andthen resumed his regular diet. (A) HDL-C, (B) LDL-C, (C) plasma CE, (D) percent CE, (E) plasma TC, (F) plasma FC, (G) TG, (H) plasmaPL, (I) ApoA-I, and (J) ApoB. CE, cholesteryl ester; FC, free cholesterol; HDL-C, high-density lipoprotein cholesterol; LDL-C, low-density lipoprotein cholesterol; rhLCAT, recombinant human lecithin:cholesterol acyltransferase; TC, total cholesterol; TG, triglyceride.
Shamburek et al LCAT enzyme replacement therapy 359
almost 3-fold in the 9.0-mg/kg dose. After the 0.9-mg/kgdose, peak plasma CE increased about 1.5-fold despiteonly a minimal change in HDL-C. During the maintenancephase, peak CE increased more than 3-fold after repeatedweekly doses on the 9.0-mg/kg but less on the biweekly
3.0-mg/kg doses (Fig. 4A). Peak and nadir levels were al-ways higher than baseline, during the weekly 9.0-mg/kgrhLCAT infusion.
The %CE peak occurred rapidly after infusion, reachingnormal levels of about 70%. During the optimization phase,
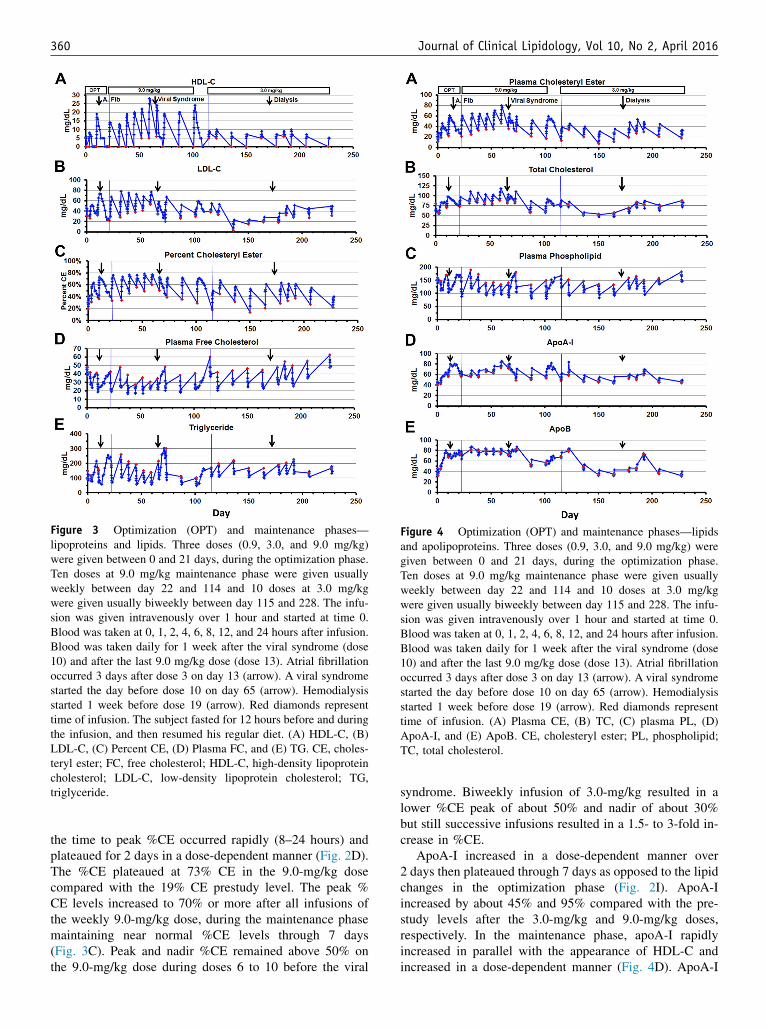
Figure 3 Optimization (OPT) and maintenance phases—lipoproteins and lipids. Three doses (0.9, 3.0, and 9.0 mg/kg)were given between 0 and 21 days, during the optimization phase.Ten doses at 9.0 mg/kg maintenance phase were given usuallyweekly between day 22 and 114 and 10 doses at 3.0 mg/kgwere given usually biweekly between day 115 and 228. The infu-sion was given intravenously over 1 hour and started at time 0.Blood was taken at 0, 1, 2, 4, 6, 8, 12, and 24 hours after infusion.Blood was taken daily for 1 week after the viral syndrome (dose10) and after the last 9.0 mg/kg dose (dose 13). Atrial fibrillationoccurred 3 days after dose 3 on day 13 (arrow). A viral syndromestarted the day before dose 10 on day 65 (arrow). Hemodialysisstarted 1 week before dose 19 (arrow). Red diamonds representtime of infusion. The subject fasted for 12 hours before and duringthe infusion, and then resumed his regular diet. (A) HDL-C, (B)LDL-C, (C) Percent CE, (D) Plasma FC, and (E) TG. CE, choles-teryl ester; FC, free cholesterol; HDL-C, high-density lipoproteincholesterol; LDL-C, low-density lipoprotein cholesterol; TG,triglyceride.
Figure 4 Optimization (OPT) and maintenance phases—lipidsand apolipoproteins. Three doses (0.9, 3.0, and 9.0 mg/kg) weregiven between 0 and 21 days, during the optimization phase.Ten doses at 9.0 mg/kg maintenance phase were given usuallyweekly between day 22 and 114 and 10 doses at 3.0 mg/kgwere given usually biweekly between day 115 and 228. The infu-sion was given intravenously over 1 hour and started at time 0.Blood was taken at 0, 1, 2, 4, 6, 8, 12, and 24 hours after infusion.Blood was taken daily for 1 week after the viral syndrome (dose10) and after the last 9.0 mg/kg dose (dose 13). Atrial fibrillationoccurred 3 days after dose 3 on day 13 (arrow). A viral syndromestarted the day before dose 10 on day 65 (arrow). Hemodialysisstarted 1 week before dose 19 (arrow). Red diamonds representtime of infusion. (A) Plasma CE, (B) TC, (C) plasma PL, (D)ApoA-I, and (E) ApoB. CE, cholesteryl ester; PL, phospholipid;TC, total cholesterol.
360 Journal of Clinical Lipidology, Vol 10, No 2, April 2016
the time to peak %CE occurred rapidly (8–24 hours) andplateaued for 2 days in a dose-dependent manner (Fig. 2D).The %CE plateaued at 73% CE in the 9.0-mg/kg dosecompared with the 19% CE prestudy level. The peak %CE levels increased to 70% or more after all infusions ofthe weekly 9.0-mg/kg dose, during the maintenance phasemaintaining near normal %CE levels through 7 days(Fig. 3C). Peak and nadir %CE remained above 50% onthe 9.0-mg/kg dose during doses 6 to 10 before the viral
syndrome. Biweekly infusion of 3.0-mg/kg resulted in alower %CE peak of about 50% and nadir of about 30%but still successive infusions resulted in a 1.5- to 3-fold in-crease in %CE.
ApoA-I increased in a dose-dependent manner over2 days then plateaued through 7 days as opposed to the lipidchanges in the optimization phase (Fig. 2I). ApoA-Iincreased by about 45% and 95% compared with the pre-study levels after the 3.0-mg/kg and 9.0-mg/kg doses,respectively. In the maintenance phase, apoA-I rapidlyincreased in parallel with the appearance of HDL-C andincreased in a dose-dependent manner (Fig. 4D). ApoA-I

Figure 5 Effect of rhLCAT infusion on lipid and lipoprotein levels. FPLC analysis of plasma lipids before (A) and 24 hours after (B) thefirst 9.0 mg/kg rhLCAT infusion (optimization phase). (A) FPLC at 0 hour just before infusion. Lp-X–like particles were identified asphospholipid-rich particles across broad size range. LDL-C was over 50% FC. Small nascent HDL predominates with near absence ofHDL. (B) FPLC at 24 hours. Small nascent HDL particles were converted to larger CE-rich HDL-sized particles. The increase in TC tonear normal levels was due to the formation of LDL-CE and HDL-CE because FC decreased. Baseline low LDL-C was increased tonear normal CE-rich LDL levels 24 hours after infusion. NMR analysis of small (s), medium (m), and large (l) HDL over 24 hours (C)and 240 hours (D) after the first 9.0 mg/kg infusion. Small HDL was the only particle present at baseline, consistent with the a-4 HDLobserved on the 1D and 2D gels. (C) The rhLCAT infusion was given intravenously over 1 hour starting at time 0. Small HDL, the substrateof rhLCAT, increased for 2 hours but then disappeared through 12 hours likely due to rapid precursor turnover. Medium HDL was absent attime 0 and after a brief delay peaked at 4 hours, the same time that large HDL appeared and HDL-C was measurable at 2 mg/dL. HDL-Cpeaked at 23 mg/dL at 8 hours concomitantly as large HDL peaked. (D) Small HDL reappeared by 24 hours correlating with a-4 HDL on 1-dimensional and 2-dimensional gels. Over the next 192 hours, HDL-C paralleled the slow decline and disappearance of large HDL. (E)Effect of rhLCAT infusion on HDL-C, LDL-C, and plasma CE: mg/dL change from time 0. Increased plasma CE and HDL-C appearedwithin 1 hour and initially increased at the same rate. LDL-C increased after a 2-hour delay. From 4 to 8 hours, plasma cholesteryl estercontinued to increase, approaching the sum of HDL-C and LDL-C. Data shown for dose 9 (9.0 mg/kg). CE, cholesteryl ester; FC, freecholesterol; HDL-C, high-density lipoprotein cholesterol; LDL-C, low-density lipoprotein cholesterol; Lp-X, lipoprotein X; NMR, nuclearmagnetic resonance; PL, phospholipid; rhLCAT, recombinant human lecithin:cholesterol acyltransferase; TC, total cholesterol; TG,triglyceride.
Shamburek et al LCAT enzyme replacement therapy 361
increased by more than 50% from baseline in the 9.0-mg/kgdose, during weekly infusions vs the biweekly infusion andtended to plateau with successive doses. ApoA-I decreasedduring the viral syndrome.
ApoB levels approached normal levels and then pla-teaued (9.0-mg/kg dose) similar to the pattern of apoA-I asopposed to the lipid changes. During the optimizationphase, apoB also gradually increased in a dose-dependentmanner after the 0.9-mg/kg and 3.0-mg/kg doses butremained elevated at the 9.0 mg/kg dose (Fig. 2J). ApoB
rapidly increased in a dose-dependent manner in the 9.0-mg/kg and 3.0-mg/kg dose in the maintenance phase(Fig. 4E). ApoB plateaued at normal levels during the9.0-mg/kg dose and remained stable with successive doses.ApoB levels were disturbed after the viral syndrome at day65 and transiently increased after the start of dialysis atdose 19 on day 178.
The overall effect of infusion of rhLCAT on lipidparameters was to convert a dyslipidemic profile charac-teristic of FLD to a nearly normal lipoprotein profile. TC
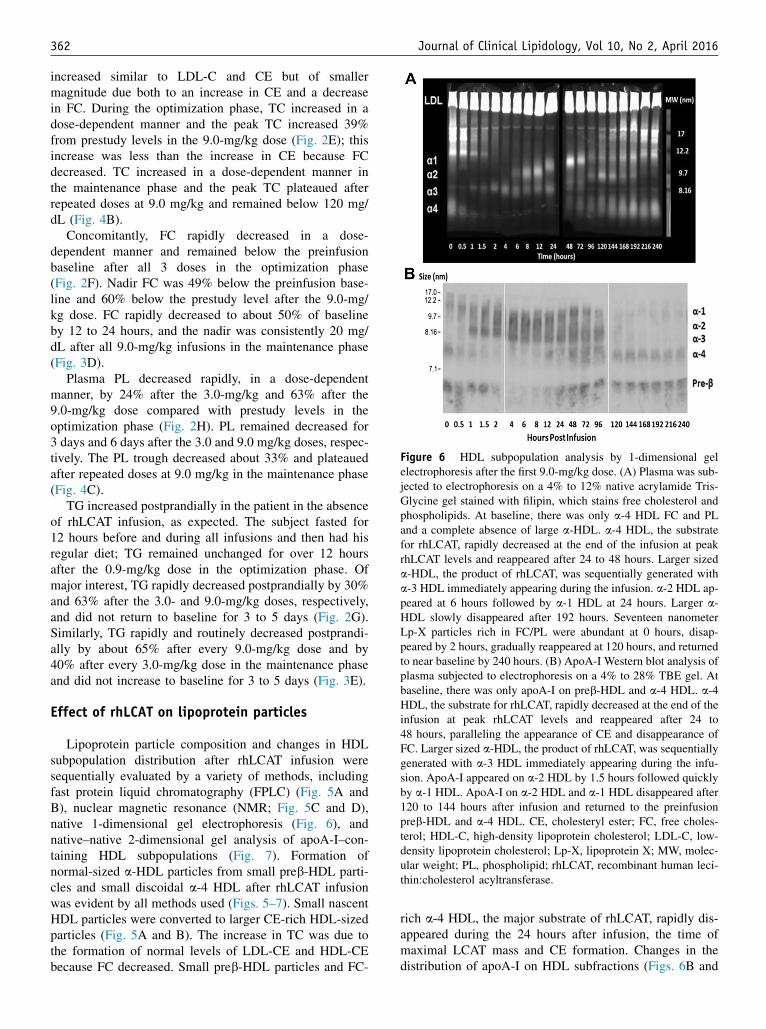
Figure 6 HDL subpopulation analysis by 1-dimensional gelelectrophoresis after the first 9.0-mg/kg dose. (A) Plasma was sub-jected to electrophoresis on a 4% to 12% native acrylamide Tris-Glycine gel stained with filipin, which stains free cholesterol andphospholipids. At baseline, there was only a-4 HDL FC and PLand a complete absence of large a-HDL. a-4 HDL, the substratefor rhLCAT, rapidly decreased at the end of the infusion at peakrhLCAT levels and reappeared after 24 to 48 hours. Larger sizeda-HDL, the product of rhLCAT, was sequentially generated witha-3 HDL immediately appearing during the infusion. a-2 HDL ap-peared at 6 hours followed by a-1 HDL at 24 hours. Larger a-HDL slowly disappeared after 192 hours. Seventeen nanometerLp-X particles rich in FC/PL were abundant at 0 hours, disap-peared by 2 hours, gradually reappeared at 120 hours, and returnedto near baseline by 240 hours. (B) ApoA-I Western blot analysis ofplasma subjected to electrophoresis on a 4% to 28% TBE gel. Atbaseline, there was only apoA-I on preb-HDL and a-4 HDL. a-4HDL, the substrate for rhLCAT, rapidly decreased at the end of theinfusion at peak rhLCAT levels and reappeared after 24 to48 hours, paralleling the appearance of CE and disappearance ofFC. Larger sized a-HDL, the product of rhLCAT, was sequentiallygenerated with a-3 HDL immediately appearing during the infu-sion. ApoA-I appeared on a-2 HDL by 1.5 hours followed quicklyby a-1 HDL. ApoA-I on a-2 HDL and a-1 HDL disappeared after120 to 144 hours after infusion and returned to the preinfusionpreb-HDL and a-4 HDL. CE, cholesteryl ester; FC, free choles-terol; HDL-C, high-density lipoprotein cholesterol; LDL-C, low-density lipoprotein cholesterol; Lp-X, lipoprotein X; MW, molec-ular weight; PL, phospholipid; rhLCAT, recombinant human leci-thin:cholesterol acyltransferase.
362 Journal of Clinical Lipidology, Vol 10, No 2, April 2016
increased similar to LDL-C and CE but of smallermagnitude due both to an increase in CE and a decreasein FC. During the optimization phase, TC increased in adose-dependent manner and the peak TC increased 39%from prestudy levels in the 9.0-mg/kg dose (Fig. 2E); thisincrease was less than the increase in CE because FCdecreased. TC increased in a dose-dependent manner inthe maintenance phase and the peak TC plateaued afterrepeated doses at 9.0 mg/kg and remained below 120 mg/dL (Fig. 4B).
Concomitantly, FC rapidly decreased in a dose-dependent manner and remained below the preinfusionbaseline after all 3 doses in the optimization phase(Fig. 2F). Nadir FC was 49% below the preinfusion base-line and 60% below the prestudy level after the 9.0-mg/kg dose. FC rapidly decreased to about 50% of baselineby 12 to 24 hours, and the nadir was consistently 20 mg/dL after all 9.0-mg/kg infusions in the maintenance phase(Fig. 3D).
Plasma PL decreased rapidly, in a dose-dependentmanner, by 24% after the 3.0-mg/kg and 63% after the9.0-mg/kg dose compared with prestudy levels in theoptimization phase (Fig. 2H). PL remained decreased for3 days and 6 days after the 3.0 and 9.0 mg/kg doses, respec-tively. The PL trough decreased about 33% and plateauedafter repeated doses at 9.0 mg/kg in the maintenance phase(Fig. 4C).
TG increased postprandially in the patient in the absenceof rhLCAT infusion, as expected. The subject fasted for12 hours before and during all infusions and then had hisregular diet; TG remained unchanged for over 12 hoursafter the 0.9-mg/kg dose in the optimization phase. Ofmajor interest, TG rapidly decreased postprandially by 30%and 63% after the 3.0- and 9.0-mg/kg doses, respectively,and did not return to baseline for 3 to 5 days (Fig. 2G).Similarly, TG rapidly and routinely decreased postprandi-ally by about 65% after every 9.0-mg/kg dose and by40% after every 3.0-mg/kg dose in the maintenance phaseand did not increase to baseline for 3 to 5 days (Fig. 3E).
Effect of rhLCAT on lipoprotein particles
Lipoprotein particle composition and changes in HDLsubpopulation distribution after rhLCAT infusion weresequentially evaluated by a variety of methods, includingfast protein liquid chromatography (FPLC) (Fig. 5A andB), nuclear magnetic resonance (NMR; Fig. 5C and D),native 1-dimensional gel electrophoresis (Fig. 6), andnative–native 2-dimensional gel analysis of apoA-I–con-taining HDL subpopulations (Fig. 7). Formation ofnormal-sized a-HDL particles from small preb-HDL parti-cles and small discoidal a-4 HDL after rhLCAT infusionwas evident by all methods used (Figs. 5–7). Small nascentHDL particles were converted to larger CE-rich HDL-sizedparticles (Fig. 5A and B). The increase in TC was due tothe formation of normal levels of LDL-CE and HDL-CEbecause FC decreased. Small preb-HDL particles and FC-
rich a-4 HDL, the major substrate of rhLCAT, rapidly dis-appeared during the 24 hours after infusion, the time ofmaximal LCAT mass and CE formation. Changes in thedistribution of apoA-I on HDL subfractions (Figs. 6B and
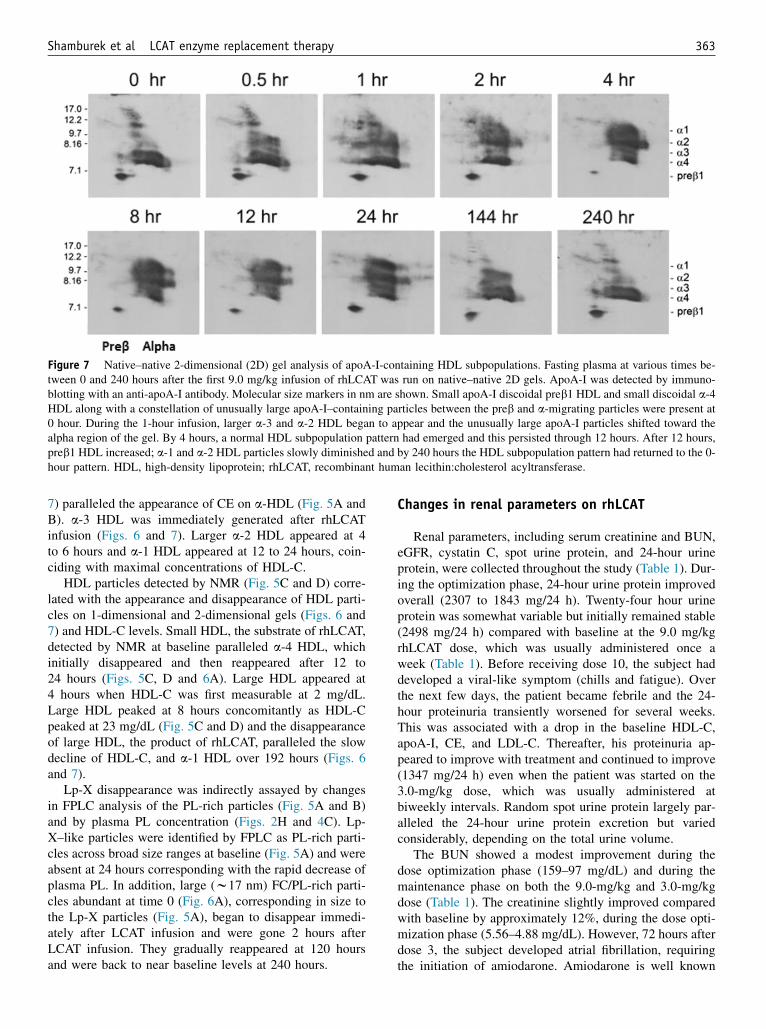
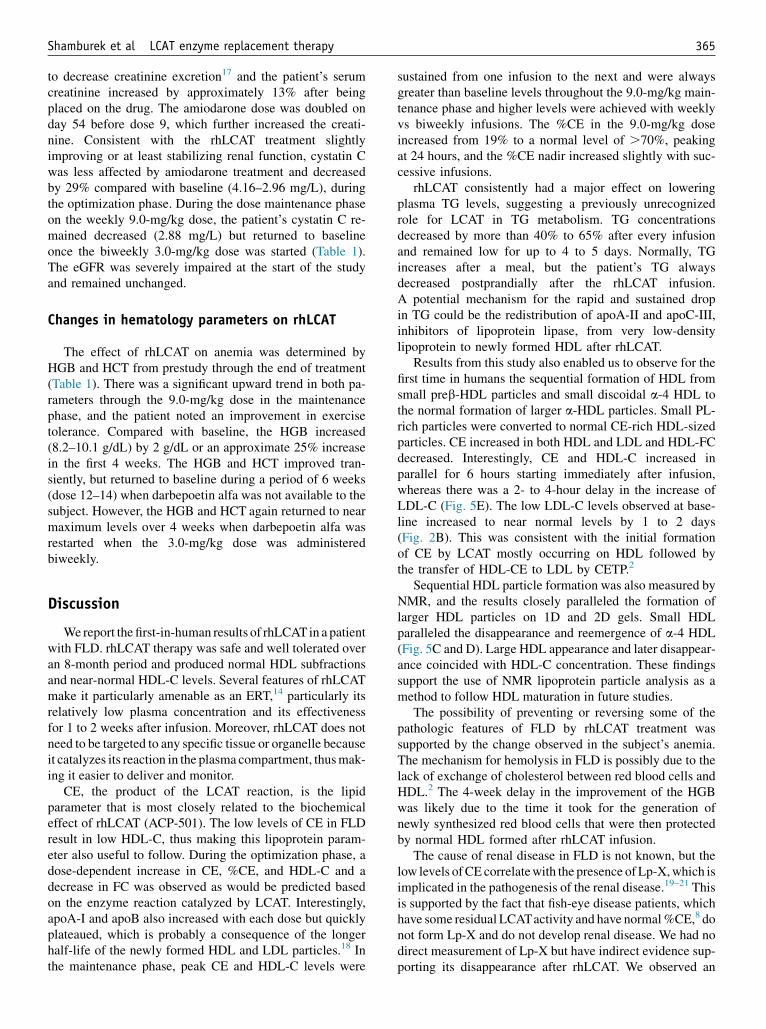
Figure 7 Native–native 2-dimensional (2D) gel analysis of apoA-I-containing HDL subpopulations. Fasting plasma at various times be-tween 0 and 240 hours after the first 9.0 mg/kg infusion of rhLCAT was run on native–native 2D gels. ApoA-I was detected by immuno-blotting with an anti-apoA-I antibody. Molecular size markers in nm are shown. Small apoA-I discoidal preb1 HDL and small discoidal a-4HDL along with a constellation of unusually large apoA-I–containing particles between the preb and a-migrating particles were present at0 hour. During the 1-hour infusion, larger a-3 and a-2 HDL began to appear and the unusually large apoA-I particles shifted toward thealpha region of the gel. By 4 hours, a normal HDL subpopulation pattern had emerged and this persisted through 12 hours. After 12 hours,preb1 HDL increased; a-1 and a-2 HDL particles slowly diminished and by 240 hours the HDL subpopulation pattern had returned to the 0-hour pattern. HDL, high-density lipoprotein; rhLCAT, recombinant human lecithin:cholesterol acyltransferase.
Shamburek et al LCAT enzyme replacement therapy 363
7) paralleled the appearance of CE on a-HDL (Fig. 5A andB). a-3 HDL was immediately generated after rhLCATinfusion (Figs. 6 and 7). Larger a-2 HDL appeared at 4to 6 hours and a-1 HDL appeared at 12 to 24 hours, coin-ciding with maximal concentrations of HDL-C.
HDL particles detected by NMR (Fig. 5C and D) corre-lated with the appearance and disappearance of HDL parti-cles on 1-dimensional and 2-dimensional gels (Figs. 6 and7) and HDL-C levels. Small HDL, the substrate of rhLCAT,detected by NMR at baseline paralleled a-4 HDL, whichinitially disappeared and then reappeared after 12 to24 hours (Figs. 5C, D and 6A). Large HDL appeared at4 hours when HDL-C was first measurable at 2 mg/dL.Large HDL peaked at 8 hours concomitantly as HDL-Cpeaked at 23 mg/dL (Fig. 5C and D) and the disappearanceof large HDL, the product of rhLCAT, paralleled the slowdecline of HDL-C, and a-1 HDL over 192 hours (Figs. 6and 7).
Lp-X disappearance was indirectly assayed by changesin FPLC analysis of the PL-rich particles (Fig. 5A and B)and by plasma PL concentration (Figs. 2H and 4C). Lp-X–like particles were identified by FPLC as PL-rich parti-cles across broad size ranges at baseline (Fig. 5A) and wereabsent at 24 hours corresponding with the rapid decrease ofplasma PL. In addition, large (w17 nm) FC/PL-rich parti-cles abundant at time 0 (Fig. 6A), corresponding in size tothe Lp-X particles (Fig. 5A), began to disappear immedi-ately after LCAT infusion and were gone 2 hours afterLCAT infusion. They gradually reappeared at 120 hoursand were back to near baseline levels at 240 hours.
Changes in renal parameters on rhLCAT
Renal parameters, including serum creatinine and BUN,eGFR, cystatin C, spot urine protein, and 24-hour urineprotein, were collected throughout the study (Table 1). Dur-ing the optimization phase, 24-hour urine protein improvedoverall (2307 to 1843 mg/24 h). Twenty-four hour urineprotein was somewhat variable but initially remained stable(2498 mg/24 h) compared with baseline at the 9.0 mg/kgrhLCAT dose, which was usually administered once aweek (Table 1). Before receiving dose 10, the subject haddeveloped a viral-like symptom (chills and fatigue). Overthe next few days, the patient became febrile and the 24-hour proteinuria transiently worsened for several weeks.This was associated with a drop in the baseline HDL-C,apoA-I, CE, and LDL-C. Thereafter, his proteinuria ap-peared to improve with treatment and continued to improve(1347 mg/24 h) even when the patient was started on the3.0-mg/kg dose, which was usually administered atbiweekly intervals. Random spot urine protein largely par-alleled the 24-hour urine protein excretion but variedconsiderably, depending on the total urine volume.
The BUN showed a modest improvement during thedose optimization phase (159–97 mg/dL) and during themaintenance phase on both the 9.0-mg/kg and 3.0-mg/kgdose (Table 1). The creatinine slightly improved comparedwith baseline by approximately 12%, during the dose opti-mization phase (5.56–4.88 mg/dL). However, 72 hours afterdose 3, the subject developed atrial fibrillation, requiringthe initiation of amiodarone. Amiodarone is well known
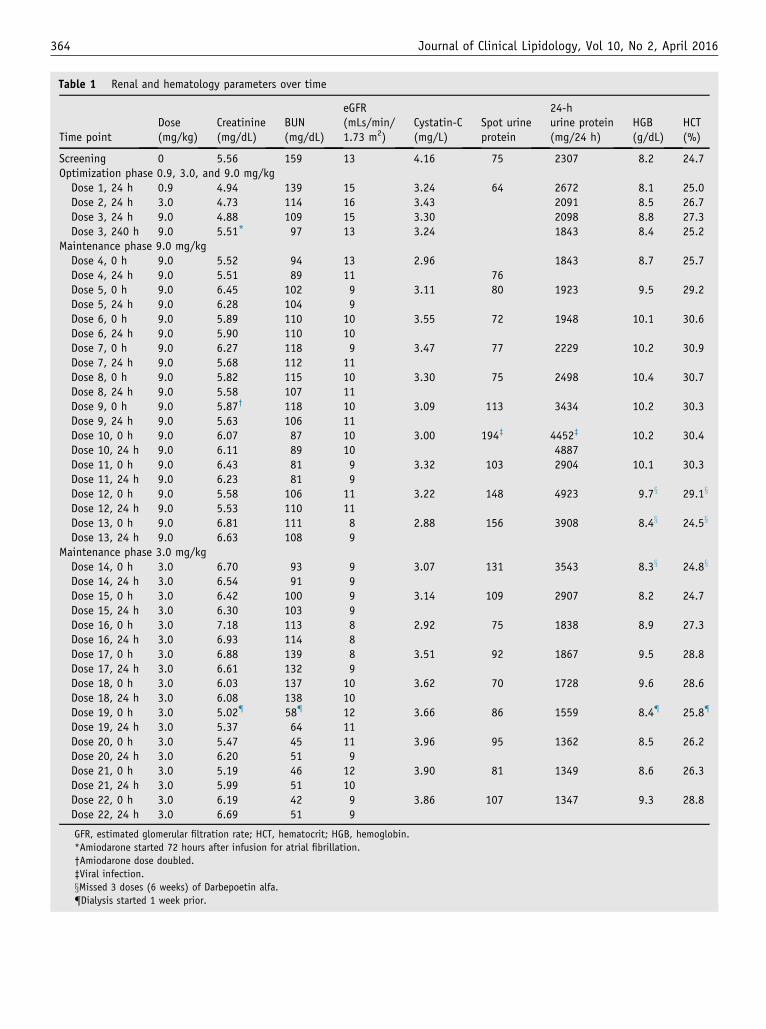
Table 1 Renal and hematology parameters over time
Time pointDose(mg/kg)
Creatinine(mg/dL)
BUN(mg/dL)
eGFR(mLs/min/1.73 m2)
Cystatin-C(mg/L)
Spot urineprotein
24-hurine protein(mg/24 h)
HGB(g/dL)
HCT(%)
Screening 0 5.56 159 13 4.16 75 2307 8.2 24.7Optimization phase 0.9, 3.0, and 9.0 mg/kgDose 1, 24 h 0.9 4.94 139 15 3.24 64 2672 8.1 25.0Dose 2, 24 h 3.0 4.73 114 16 3.43 2091 8.5 26.7Dose 3, 24 h 9.0 4.88 109 15 3.30 2098 8.8 27.3Dose 3, 240 h 9.0 5.51* 97 13 3.24 1843 8.4 25.2
Maintenance phase 9.0 mg/kgDose 4, 0 h 9.0 5.52 94 13 2.96 1843 8.7 25.7Dose 4, 24 h 9.0 5.51 89 11 76Dose 5, 0 h 9.0 6.45 102 9 3.11 80 1923 9.5 29.2Dose 5, 24 h 9.0 6.28 104 9Dose 6, 0 h 9.0 5.89 110 10 3.55 72 1948 10.1 30.6Dose 6, 24 h 9.0 5.90 110 10Dose 7, 0 h 9.0 6.27 118 9 3.47 77 2229 10.2 30.9Dose 7, 24 h 9.0 5.68 112 11Dose 8, 0 h 9.0 5.82 115 10 3.30 75 2498 10.4 30.7Dose 8, 24 h 9.0 5.58 107 11Dose 9, 0 h 9.0 5.87† 118 10 3.09 113 3434 10.2 30.3Dose 9, 24 h 9.0 5.63 106 11Dose 10, 0 h 9.0 6.07 87 10 3.00 194‡ 4452‡ 10.2 30.4Dose 10, 24 h 9.0 6.11 89 10 4887Dose 11, 0 h 9.0 6.43 81 9 3.32 103 2904 10.1 30.3Dose 11, 24 h 9.0 6.23 81 9Dose 12, 0 h 9.0 5.58 106 11 3.22 148 4923 9.7x 29.1x
Dose 12, 24 h 9.0 5.53 110 11Dose 13, 0 h 9.0 6.81 111 8 2.88 156 3908 8.4x 24.5x
Dose 13, 24 h 9.0 6.63 108 9Maintenance phase 3.0 mg/kgDose 14, 0 h 3.0 6.70 93 9 3.07 131 3543 8.3x 24.8x
Dose 14, 24 h 3.0 6.54 91 9Dose 15, 0 h 3.0 6.42 100 9 3.14 109 2907 8.2 24.7Dose 15, 24 h 3.0 6.30 103 9Dose 16, 0 h 3.0 7.18 113 8 2.92 75 1838 8.9 27.3Dose 16, 24 h 3.0 6.93 114 8Dose 17, 0 h 3.0 6.88 139 8 3.51 92 1867 9.5 28.8Dose 17, 24 h 3.0 6.61 132 9Dose 18, 0 h 3.0 6.03 137 10 3.62 70 1728 9.6 28.6Dose 18, 24 h 3.0 6.08 138 10Dose 19, 0 h 3.0 5.02{ 58{ 12 3.66 86 1559 8.4{ 25.8{
Dose 19, 24 h 3.0 5.37 64 11Dose 20, 0 h 3.0 5.47 45 11 3.96 95 1362 8.5 26.2Dose 20, 24 h 3.0 6.20 51 9Dose 21, 0 h 3.0 5.19 46 12 3.90 81 1349 8.6 26.3Dose 21, 24 h 3.0 5.99 51 10Dose 22, 0 h 3.0 6.19 42 9 3.86 107 1347 9.3 28.8Dose 22, 24 h 3.0 6.69 51 9
GFR, estimated glomerular filtration rate; HCT, hematocrit; HGB, hemoglobin.
*Amiodarone started 72 hours after infusion for atrial fibrillation.
†Amiodarone dose doubled.
‡Viral infection.
xMissed 3 doses (6 weeks) of Darbepoetin alfa.
{Dialysis started 1 week prior.
364 Journal of Clinical Lipidology, Vol 10, No 2, April 2016
Shamburek et al LCAT enzyme replacement therapy 365
to decrease creatinine excretion17 and the patient’s serumcreatinine increased by approximately 13% after beingplaced on the drug. The amiodarone dose was doubled onday 54 before dose 9, which further increased the creati-nine. Consistent with the rhLCAT treatment slightlyimproving or at least stabilizing renal function, cystatin Cwas less affected by amiodarone treatment and decreasedby 29% compared with baseline (4.16–2.96 mg/L), duringthe optimization phase. During the dose maintenance phaseon the weekly 9.0-mg/kg dose, the patient’s cystatin C re-mained decreased (2.88 mg/L) but returned to baselineonce the biweekly 3.0-mg/kg dose was started (Table 1).The eGFR was severely impaired at the start of the studyand remained unchanged.
Changes in hematology parameters on rhLCAT
The effect of rhLCAT on anemia was determined byHGB and HCT from prestudy through the end of treatment(Table 1). There was a significant upward trend in both pa-rameters through the 9.0-mg/kg dose in the maintenancephase, and the patient noted an improvement in exercisetolerance. Compared with baseline, the HGB increased(8.2–10.1 g/dL) by 2 g/dL or an approximate 25% increasein the first 4 weeks. The HGB and HCT improved tran-siently, but returned to baseline during a period of 6 weeks(dose 12–14) when darbepoetin alfa was not available to thesubject. However, the HGB and HCT again returned to nearmaximum levels over 4 weeks when darbepoetin alfa wasrestarted when the 3.0-mg/kg dose was administeredbiweekly.
Discussion
Wereport the first-in-human results of rhLCATin a patientwith FLD. rhLCAT therapy was safe and well tolerated overan 8-month period and produced normal HDL subfractionsand near-normal HDL-C levels. Several features of rhLCATmake it particularly amenable as an ERT,14 particularly itsrelatively low plasma concentration and its effectivenessfor 1 to 2 weeks after infusion. Moreover, rhLCAT does notneed to be targeted to any specific tissue or organelle becauseit catalyzes its reaction in the plasma compartment, thusmak-ing it easier to deliver and monitor.
CE, the product of the LCAT reaction, is the lipidparameter that is most closely related to the biochemicaleffect of rhLCAT (ACP-501). The low levels of CE in FLDresult in low HDL-C, thus making this lipoprotein param-eter also useful to follow. During the optimization phase, adose-dependent increase in CE, %CE, and HDL-C and adecrease in FC was observed as would be predicted basedon the enzyme reaction catalyzed by LCAT. Interestingly,apoA-I and apoB also increased with each dose but quicklyplateaued, which is probably a consequence of the longerhalf-life of the newly formed HDL and LDL particles.18 Inthe maintenance phase, peak CE and HDL-C levels were
sustained from one infusion to the next and were alwaysgreater than baseline levels throughout the 9.0-mg/kg main-tenance phase and higher levels were achieved with weeklyvs biweekly infusions. The %CE in the 9.0-mg/kg doseincreased from 19% to a normal level of .70%, peakingat 24 hours, and the %CE nadir increased slightly with suc-cessive infusions.
rhLCAT consistently had a major effect on loweringplasma TG levels, suggesting a previously unrecognizedrole for LCAT in TG metabolism. TG concentrationsdecreased by more than 40% to 65% after every infusionand remained low for up to 4 to 5 days. Normally, TGincreases after a meal, but the patient’s TG alwaysdecreased postprandially after the rhLCAT infusion.A potential mechanism for the rapid and sustained dropin TG could be the redistribution of apoA-II and apoC-III,inhibitors of lipoprotein lipase, from very low-densitylipoprotein to newly formed HDL after rhLCAT.
Results from this study also enabled us to observe for thefirst time in humans the sequential formation of HDL fromsmall preb-HDL particles and small discoidal a-4 HDL tothe normal formation of larger a-HDL particles. Small PL-rich particles were converted to normal CE-rich HDL-sizedparticles. CE increased in both HDL and LDL and HDL-FCdecreased. Interestingly, CE and HDL-C increased inparallel for 6 hours starting immediately after infusion,whereas there was a 2- to 4-hour delay in the increase ofLDL-C (Fig. 5E). The low LDL-C levels observed at base-line increased to near normal levels by 1 to 2 days(Fig. 2B). This was consistent with the initial formationof CE by LCAT mostly occurring on HDL followed bythe transfer of HDL-CE to LDL by CETP.2
Sequential HDL particle formation was also measured byNMR, and the results closely paralleled the formation oflarger HDL particles on 1D and 2D gels. Small HDLparalleled the disappearance and reemergence of a-4 HDL(Fig. 5C and D). Large HDL appearance and later disappear-ance coincided with HDL-C concentration. These findingssupport the use of NMR lipoprotein particle analysis as amethod to follow HDL maturation in future studies.
The possibility of preventing or reversing some of thepathologic features of FLD by rhLCAT treatment wassupported by the change observed in the subject’s anemia.The mechanism for hemolysis in FLD is possibly due to thelack of exchange of cholesterol between red blood cells andHDL.2 The 4-week delay in the improvement of the HGBwas likely due to the time it took for the generation ofnewly synthesized red blood cells that were then protectedby normal HDL formed after rhLCAT infusion.
The cause of renal disease in FLD is not known, but thelow levels ofCE correlatewith the presence ofLp-X,which isimplicated in the pathogenesis of the renal disease.19–21 Thisis supported by the fact that fish-eye disease patients, whichhave some residual LCATactivity and have normal%CE,8 donot form Lp-X and do not develop renal disease. We had nodirect measurement of Lp-X but have indirect evidence sup-porting its disappearance after rhLCAT. We observed an
366 Journal of Clinical Lipidology, Vol 10, No 2, April 2016
immediate 50% decrease in PL that was sustained over7 days, when CE was also increased, along with the rapiddisappearance of abnormal PL particles spread across theFPLC consistent with the disappearance of PL-rich Lp-Xparticles. Importantly, the sustained increased %CE abovebaseline, particularly on the 9.0-mg/kg dose, suggests thatsufficient CE levels may be formed from the rhLCAT treat-ment to prevent Lp-X formation.
The main objective of this study was to determine if therenal disease in FLD can be stabilized or even reversed byrhLCAT (ACP-501) therapy. At presentation, the patientalready had advanced renal disease, and it was uncertainwhether the loss in renal function would be reversible. Asshown in Table 1, the rhLCAT treatment appeared toslightly improve the subject’s renal function or at least sta-bilized it, which up until the time of the rhLCAT treatmentwas rapidly worsening. This will have to be carefully as-sessed in future clinical trials, but it may be necessary tostart rhLCAT therapy at an earlier stage in the disease pro-cess to be more effective. Fortunately, FLD patients typi-cally first present with proteinuria, and it can take as longas 20 to 30 years before end-stage renal disease develops.1
Hence, if the diagnosis is made early enough, the develop-ment of significant renal disease could possibly be pre-vented by rhLCAT treatment.
In summary, the beneficial changes in clinical, biochem-ical, and lipoprotein parameters in the first report of an FLDpatient treated by ERT are encouraging and supportcontinued development of rhLCAT therapy.
Acknowledgments
The authors thank nurses on the NIH Clinical Center5NW care unit, the NIH investigational pharmacy, and thepatient for participating in this study. The authors want tothank Dr E. Schaefer at Tufts University for advice andreferring the patient. The content of this article does notnecessarily reflect the views or policies of the Departmentof Health and Human Services, nor does it imply endorse-ment by the US government. AstraZeneca PLC and itsglobal biological arm MedImmune, LLC, acquired Alpha-Core Pharma, LLC.
The Intramural Research Program of the Cardiovascularand Pulmonary Branch, National Heart, Lung, and BloodInstitute of the National Institutes of Health reviewed andsupported the study. AlphaCore Pharma, LLC supplied theACP-501.
Financial disclosures
Rebecca Bakker-Arkema, Bruce J. Auerbach, Brian R.Krause, and Reynold Homan were employees of Alpha-Core Pharma, LLC (now owned by AstraZeneca PLC).Rebecca Bakker-Arkema is currently employed by MedI-mmune, LLC, Gaithersburg, MD.
Supplementary data
Supplementary data related to this article can be foundonline at http://dx.doi.org/10.1016/j.jacl.2015.12.007.
References
1. Santamarina-Fojo S, Hoeg JM, Assmann G, Brewer HB. Lecithin
cholesterol acyltransferase deficiency and fish eye disease. In:
Scriver CR, Beaudet D, Valle D, Sly WS, editors. The metabolic &
molecular basis of inherited disease. New York, NY: McGraw-Hill,
2001. p. 2817–2833.
2. Schwartz CC, VandenBroek JM, Cooper PS. Lipoprotein cholesteryl
ester production, transfer, and output in vivo in humans. J Lipid
Res. 2004;45:1594–1607.
3. Barter PJ. Hugh Sinclair lecture: the regulation and remodelling of
HDL by plasma factors. Atheroscler Suppl. 2002;3:39–47.
4. Glomset JA. The plasma lecithins:cholesterol acyltransferase reaction.
J Lipid Res. 1968;9:155–167.
5. Norum K, Gjone E, Glomset JA. Familial lecithin:cholesterol acyl-
transferase deficiency, including fish eye disease. In: Scriver CR,
Beaudet AL, Sly WS, editors. The metabolic basis of inherited dis-
ease. New York, NY: McGraw-Hill, 1989. p. 1181–1194.
6. Cogan DG, Kruth HS, Datilis MB, Martin N. Corneal opacity in LCAT
disease. Cornea. 1992;11:595–599.
7. Palmiero PM, Sbeity Z, Liebmann J, Ritch R. In vivo imaging of the
cornea in a patient with lecithin-cholesterol acyltransferase deficiency.
Cornea. 2009;28:1061–1064.
8. Calabresi L, Simonelli S, Gomaraschi M, Franceschini G. Genetic lec-
ithin:cholesterol acyltransferase deficiency and cardiovascular disease.
Atherosclerosis. 2012;222:299–306.
9. Weber CL, Frohlich J, Wang J, Hegele RA, Chan-Yan C. Stability of
lipids on peritoneal dialysis in a patient with familial LCAT defi-
ciency. Nephrol Dial Transplant. 2007;22:2084–2088.
10. Flatmark AL, Hovig T, Myhre E, Gjone E. Renal transplantation in pa-
tients with familial lecithin: cholesterol-acetyltransferase deficiency.
Transplant Proc. 1977;9:1665–1671.
11. Panescu V, Grignon Y, Hestin D, et al. Recurrence of lecithin choles-
terol acyltransferase deficiency after kidney transplantation. Nephrol
Dial Transplant. 1997;12:2430–2432.
12. Forte T, Nichols A, Glomset J, Norum K. The ultrastructure of plasma
lipoproteins in lecithin:cholesterol acyltransferase deficiency. Scand J
Clin Lab Invest Suppl. 1974;137:121–132.
13. Asztalos BF, Schaefer EJ, Horvath KV, et al. Role of LCAT in HDL
remodeling: investigation of LCAT deficiency states. J Lipid Res.
2007;48:592–599.
14. Rousset X, Shamburek R, Vaisman B, Amar M, Remaley AT. Lecithin
cholesterol acyltransferase: an anti- or pro-atherogenic factor? Curr
Atheroscler Rep. 2011;13:249–256.
15. Shamburek RD, Bakker-Arkema R, Shamburek AM, et al. Safety
and tolerability of ACP-501, a recombinant human lecithin:choles-
terol acyltransferase, in a phase 1 single-dose escalation study.
Circ Res. 2016;118:73–82.
16. Roshan B, Ganda OP, Desilva R, et al. Homozygous lecithin:choles-
terol acyltransferase (LCAT) deficiency due to a new loss of func-
tion mutation and review of the literature. J Clin Lipidol. 2011;5:
493–499.
17. Pollak PT, Sharma AD, Carruthers SG. Creatinine elevation in patients
receiving amiodarone correlates with serum amiodarone concentra-
tion. Br J Clin Pharmacol. 1993;36:125–127.
18. Nishiwaki M, Ikewaki K, Bader G, et al. Human lecithin:cholesterol
acyltransferase deficiency: in vivo kinetics of low-density lipoprotein
and lipoprotein-X. Arteriosclerosis. Thromb Vasc Biol. 2006;26:
1370–1375.

Shamburek et al LCAT enzyme replacement therapy 367
19. Borysiewicz LK, Soutar AK, Evans DJ, Thompson GR, Rees AJ.
Renal failure in familial lecithin: cholesterol acyltransferase defi-
ciency. The Q J Med. 1982;51:411–426.
20. Hovig T, Gjone E. Familial plasma lecithin: cholesterol acyltransfer-
ase (LCAT) deficiency. Ultrastructural aspects of a new syndrome
with particular reference to lesions in the kidneys and the spleen.
Acta Pathol Microbiol Scand A. 1973;81:681–697.
21. Imbasciati E, Paties C, Scarpioni L, Mihatsch MJ. Renal lesions in fa-
milial lecithin-cholesterol acyltransferase deficiency. Ultrastructural
heterogeneity of glomerular changes. Am J Nephrol. 1986;6:66–70.