Embed Size (px)
Citation preview

1
FALSE ALARMS AND COST ANALYSIS OF MONITORED FIRE DETECTION SYSTEMS
Michael Marks
Yaping He, Western Sydney University Greg Buckley, Fire and Rescue NSW
ABSTRACT Fire detection and alarm systems are recognised as key features of a building’s fire prevention and protection strategy. Whilst the issue of false alarms from monitored fire detection systems is known within the fire engineering community, there has been surprisingly little research undertaken on the subject in Australia in order to link this issue to fire safety engineering design and cost-benefit analysis. False alarms are a consequence of high sensitivity of fire detection and warning systems to the variations of conditions in the built environment. They lead to economic consequences as well as impacts on life safety. Reported in this paper is a research project that focussed on false alarm frequency in Class 3 tourist accommodation buildings and related costs to businesses and fire services. The raw data of automatically generated alarms from a sample of 106 buildings within the Sydney CBD was obtained from the Australian Incident Reporting System. Statistical analyses were conducted to obtain the annual false alarm frequency, false alarm intensity and the ratio of false alarms to genuine alarms. A comparison was made with the result reported in an international study. The expected costs to the tourist accommodation businesses and to fire services are also estimated. INTRODUCTION False alarms from monitored fire detection systems are a reality in today’s society. In 2015 Fire and Rescue NSW (2016) attended over 48,000 automatic fire alarms and 97% of these were found to be false upon arrival. The response protocol in NSW is to attend every automatically generated alarm. Each attendance incurs a cost to the fire authority, and therefore society. Net savings would be generated, particularly lives may be saved, by fire brigade attendance in the case of genuine fires. However, if the fire alarm in an incident is false, the fire brigade attendance cost is a complete waste, and even worse, someone’s life may be at risk in competing incidents. The problem of false alarms is not new. The issue is summarised well by Luck (1996) that after installation, ‘the remaining problem in automatic fire detection is detectivity, i.e. the capability to uniquely distinguish between the fire and not-fire cases’. Statistics in the literature seem to cast a grim picture of this capability. According to a research undertaken in by Dubivsky & Bukowski (1989) in the US, the ratio of false alarms to real alarms can be as high as 15.8:1, even though the fire detection and alarm systems might have successfully passed all relevant tests. The problem is prevalent in many parts of the world [e.g., Ahrens (2004)]. False alarms are an attribute of the reliability of fire detection and alarm systems. Reliability is, in turn, an attribute of effectiveness (Thomas, 2001) i.e. to operate as intended, being the early warning of smoke or fire from an actual fire event. The reliability of fire or smoke detection and alarm systems is not a pure property of the

2
systems themselves, but a function of the systems properties and the environment in which they operate (He, 2008). False fire alarms are result of local environmental impact on the performance of the alarm systems. Conversely, false alarms could affect the effectiveness of the fire alarm systems (Proulx, 2000). Too many false alarms could compromise the effectiveness of the alarm system even if the system is reliable in the sense that it is capable of detecting most, if not all true fires. There are many consequences as a result of false alarms. These consequences can directly or indirectly affect a variety of stakeholders such as individual building occupants, businesses, fire services, regulatory authorities, governments and society as a whole. Consequences can be economic, psychological or related to life safety. Consequences may be negligible in certain circumstances or conversely may be catastrophic in others. Whilst there is anecdotal evidence regarding false alarms in Australia, no studies similar to that conducted in the US (Dubivsky & Bukowski, 1989) has been reported in Australia. There has been a lack of formal research to quantify false alarm frequency and related costs. The aim of this study was to gain a better understanding of the frequency of false alarms, in a typical group of buildings, and to provide a cost estimate incurred by false alarms. METHODOLOGY Definition of False Alarms There is no widely accepted definition for the term ‘false alarm’ with regard to the fire industry nor is it an easy term to define. For the purposes of the research a modified version of the definition by Tu (2003) has been used. In the context of the current study, a false alarm is ‘a signal transmitted by an automatic fire detection system reporting a fire where on arrival of the fire brigade at the origin of the alarm a fire has not occurred and the attendance of the fire brigade is completely unnecessary’. The man-made false alarms with ill-intention is not included in the current study. Data Collection
Fire alarm data For the research, raw data was collected form a variety of sources including Fire and Rescue NSW, Australian Bureau of Statistics (ABS), government reports, interviews of experts/stakeholders. Data was obtained for a period of between one and five years (Productivity Commission, 2012) relating to Australia, NSW and the specific area of the Sydney CBD. The main two facets of the false alarm data were the total numbers of false alarms nationally (and per state and territory) and the specific 106 tourist accommodation buildings in the Sydney CBD. Raw data of automatically generated alarms for 106 Class 3 tourist accommodation buildings in the Sydney CBD was obtained from the Australian Incident Reporting System (AIRS). AIRS is a national standard for reporting and capturing fire data. Of importance is that AIRS has an incident report block for false alarms so this data is captured nationally.

3
The sampled buildings are all located in the geographical area of the Sydney CBD and are serviced by three fire stations being; City of Sydney, Darlinghurst and The Rocks. This covers an area of approximately 20 km2 with a relative static local population of around 183,000 and a dynamic visiting population of around 480,000. The data for the 106 buildings was for the calendar year of 2013 and included all automatically generated alarms, their nature and the time and date of alarms. The nature of alarm is identified in the data through the use of Fire and Rescue NSW stop codes (FRNSW, 2016). The stop codes were separated into six general groups depending on the verified causes of the fire alarms. Table 1 provides illustrations of the six categories and the associated causes.
Table 1. Categories of fire alarms and their causes. Category Code Cause
Genuine alarm 10 actual fire AFA false alarm 70 dust, blackout, electricity spike, extreme weather,
etc. Suspected malfunction
73 malfunction in the fire detection system
Simulated conditions
75 smoke generated from a non-fire heat source such as a heater, burnt toast, candles etc.
Unintentional alarm
76 particles form steam or aerosols, accidental activation from maintenance staff, etc.
FIP false alarm 77 alarm signalling equipment being isolated for too long
The collected data was further analysed to yield a number of statistical parameters such as the annual false alarm intensity, the false alarm to genuine alarm ratio, daily false alarm frequency, the detailed analyses are presented in the following section. An inference table was then generated to present a relationship between the reliability and fidelity of automatic fire detection and alarm systems in the sampled Class 3 buildings. See the discussion section.
Cost data Data for the costs analysis was obtained through financial reports, interviews and statistical data from the Australian Bureau of Statistics (ABS). Some limitations were found with the economic data, and as such some assumptions have had to be made. The costs were considered as ‘costs as a consequence’, being costs to businesses and building owners as a consequence of a false alarm and ‘costs of response’, being the costs incurred by the fire authority in attending as false alarm callout. The data collection items for costs to business and to fire service analysis are listed in Table 2.
4
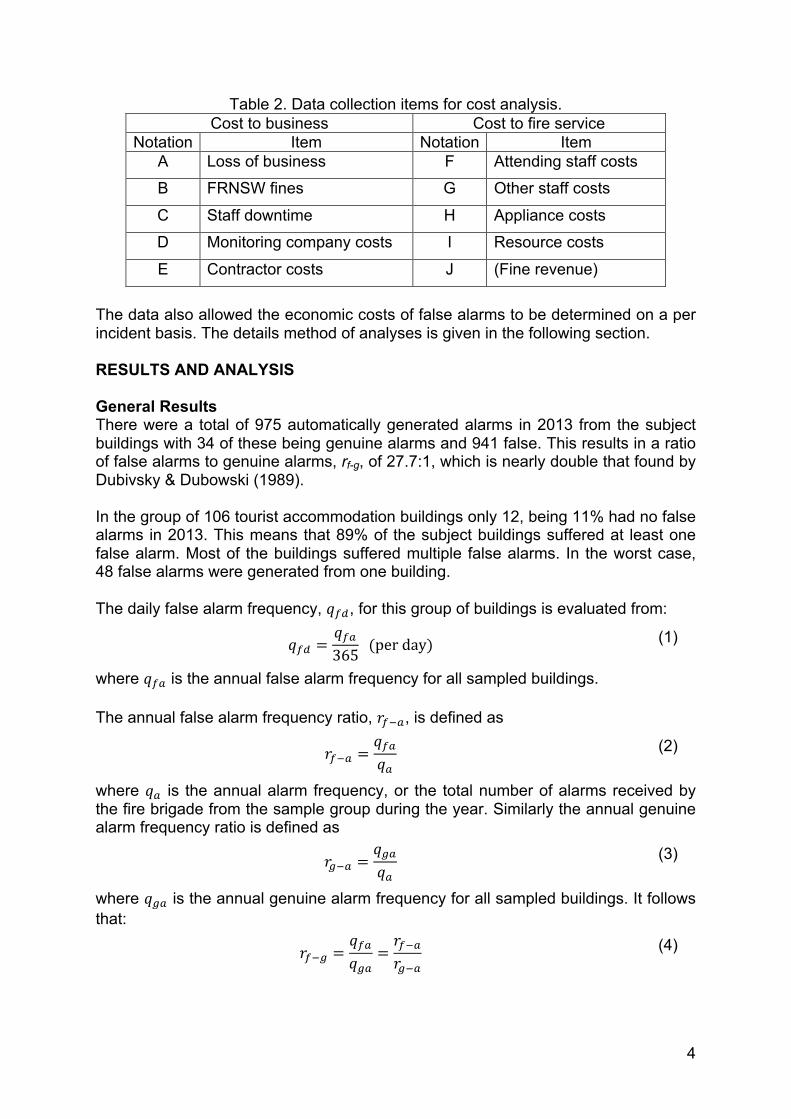
Table 2. Data collection items for cost analysis. Cost to business Cost to fire service
Notation Item Notation Item A Loss of business F Attending staff costs
B FRNSW fines G Other staff costs
C Staff downtime H Appliance costs
D Monitoring company costs I Resource costs
E Contractor costs J (Fine revenue)
The data also allowed the economic costs of false alarms to be determined on a per incident basis. The details method of analyses is given in the following section. RESULTS AND ANALYSIS General Results There were a total of 975 automatically generated alarms in 2013 from the subject buildings with 34 of these being genuine alarms and 941 false. This results in a ratio of false alarms to genuine alarms, rf-g, of 27.7:1, which is nearly double that found by Dubivsky & Dubowski (1989). In the group of 106 tourist accommodation buildings only 12, being 11% had no false alarms in 2013. This means that 89% of the subject buildings suffered at least one false alarm. Most of the buildings suffered multiple false alarms. In the worst case, 48 false alarms were generated from one building. The daily false alarm frequency, 𝑞!", for this group of buildings is evaluated from:
𝑞!" =𝑞!"365 (per day) (1)
where 𝑞!" is the annual false alarm frequency for all sampled buildings. The annual false alarm frequency ratio, 𝑟!!!, is defined as
𝑟!!! =𝑞!"𝑞!
(2)
where 𝑞! is the annual alarm frequency, or the total number of alarms received by the fire brigade from the sample group during the year. Similarly the annual genuine alarm frequency ratio is defined as
𝑟!!! =𝑞!"𝑞!
(3)
where 𝑞!" is the annual genuine alarm frequency for all sampled buildings. It follows that:
𝑟!!! =𝑞!"𝑞!"
=𝑟!!!𝑟!!!
(4)
5
The annual false alarm intensity, 𝐼!", for the group of tourist accommodation buildings is defined as the annual false alarm frequency per building and is expressed as:
𝐼!" =𝑞!"𝑆 (5)
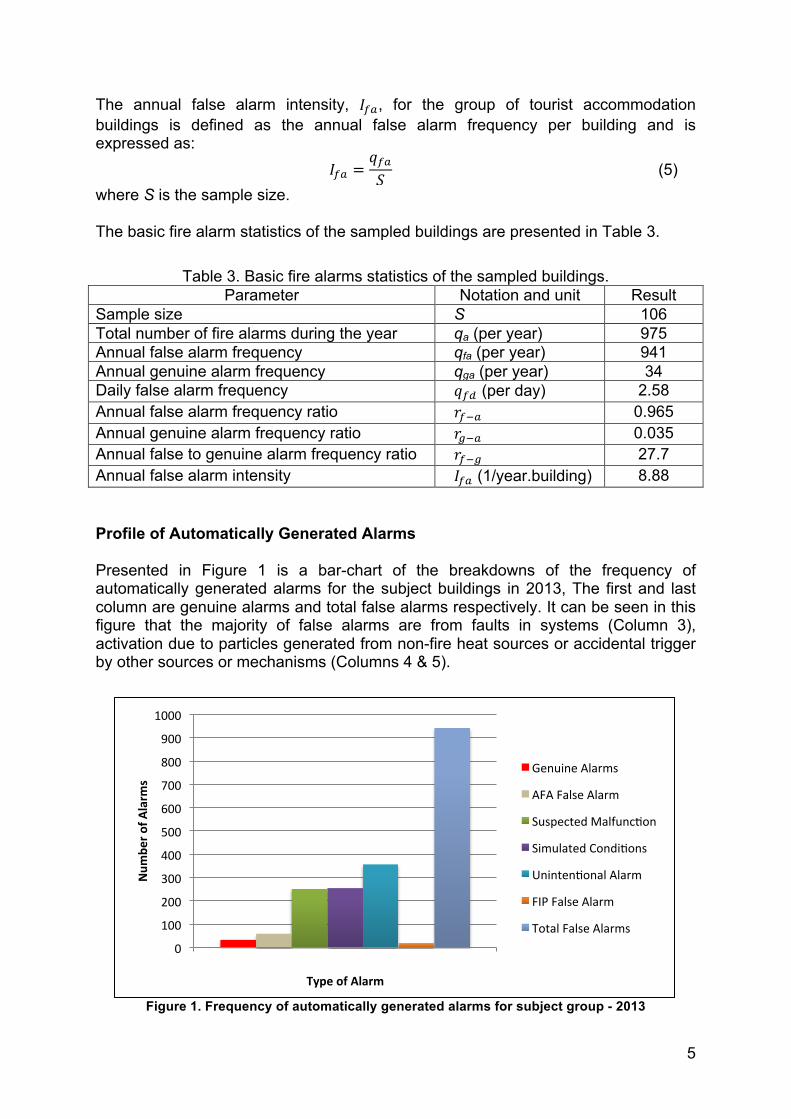
where S is the sample size. The basic fire alarm statistics of the sampled buildings are presented in Table 3.
Table 3. Basic fire alarms statistics of the sampled buildings. Parameter Notation and unit Result
Sample size S 106 Total number of fire alarms during the year qa (per year) 975 Annual false alarm frequency qfa (per year) 941 Annual genuine alarm frequency qga (per year) 34 Daily false alarm frequency 𝑞!" (per day) 2.58 Annual false alarm frequency ratio 𝑟!!! 0.965 Annual genuine alarm frequency ratio 𝑟!!! 0.035 Annual false to genuine alarm frequency ratio 𝑟!!! 27.7 Annual false alarm intensity 𝐼!" (1/year.building) 8.88 Profile of Automatically Generated Alarms Presented in Figure 1 is a bar-chart of the breakdowns of the frequency of automatically generated alarms for the subject buildings in 2013, The first and last column are genuine alarms and total false alarms respectively. It can be seen in this figure that the majority of false alarms are from faults in systems (Column 3), activation due to particles generated from non-fire heat sources or accidental trigger by other sources or mechanisms (Columns 4 & 5).
Figure 1. Frequency of automatically generated alarms for subject group - 2013
0
100
200
300
400
500
600
700
800
900
1000
TypeofAlarm
Num
bero
fAlarm
s
GenuineAlarms
AFAFalseAlarm
SuspectedMalfunc?on
SimulatedCondi?ons
Uninten?onalAlarm
FIPFalseAlarm
TotalFalseAlarms

6
To gain an understanding of the profile of false alarms, data was analysed for alarms occurring at particular times of day. Figure 2 shows the daily average of the total number of automatically generated alarms for each hour of the day over the year. We can see in this data that there is a significant spike from 8:00 to 10:00 am and again between 7:00 and 8:00 pm.
Figure 2. Automatically generated alarms per hour of day for subject group – 2013
To determine why the spikes were occurring at these times the data was separated into the six general alarm types as discussed at the beginning of this chapter, this is shown in Figure 3. This data identifies that the morning spike is mostly unintentional alarms. These alarms are mostly as a result of steam from bathrooms or kettles and hairsprays and other aerosols in the air (see Table 1). The period of between 8:00 to 10:00 am would be the time when most occupants would have showers and be preparing for the day and hence it seems correct that these factors result in increased alarm occurrences at these times.
Figure 3. Automatically generated alarms per time of day and nature of alarm for subject group
– 2013
0102030405060708090
00:00-
01:00-
02:00-
03:00-
04:00-
05:00-
06:00-
07:00-
08:00-
09:00-
10:00-
11:00-
12:00-
13:00-
14:00-
15:00-
16:00-
17:00-
18:00-
19:00-
20:00-
21:00-
22:00-
23:00-
Time(h)
NumberofFalseAlarms
NumberofGenuineAlarms
051015202530354045
00:00-
01:00-
02:00-
03:00-
04:00-
05:00-
06:00-
07:00-
08:00-
09:00-
10:00-
11:00-
12:00-
13:00-
14:00-
15:00-
16:00-
17:00-
18:00-
19:00-
20:00-
21:00-
22:00-
23:00-
Num
bero
fAlarm
s/ho
ur
TimeofDay-AlarmTypeGenuineAlarm
AFAFalseAlarm
SuspectedMalfunc?on
SimulatedCondi?ons
Uninten?onalAlarm
FIPFalseAlarm
Num
ber o
f ala
rms\
hour

7
The curve attributed to “Simulated conditions” has two peaks: one in the morning and the other in the evening. The morning peak may result from burnt toast during breakfast. The evening peak at 7:00 to 8:00pm is caused mostly due to smoke generated by non-fire sources. This could be from use of heaters, cooking of evening meal or smoking of cigarettes in the room. Again, the time profile fits that occupants would be in their room at these times and are likely to be preparing food or smoking. The most quiescent period is between 11:00 pm and 6:00 am (See Figure 2) during which most people are asleep. This means that fire alarms (both genuine and false alarms) are generally correlated with human activities. False alarms due to malfunctioning of alarm systems are reasonably consistent across all times of the day. This leads to the conclusion that false alarms of this category in the sampled tourist accommodation buildings are mostly independent of human activities. These results contradict the research conducted by Lamm et al. (2006) that showed false alarms in Auckland peak between 10am to 3pm. The research by Lamm et al. considered alarms for all types of buildings across Auckland and was not specifically concerned with residential buildings. The occupant usage across different types of buildings may be different to that of residential buildings. To further assess the profile of false alarms the data was analysed for false alarms by time of day and day of the week, shown in Figure 4. This confirmed the morning peak, with the exception of Wednesday and the evening peak with the exception of Tuesday and Sunday. There were few false alarms from 11:00pm to 05:00am for all days of the week. The middle of the day from around 11:00am to 4:00pm was inconsistent for the number of false alarms relative to the day of the week. This data would still suggest that occupant activity is a key factor in triggering false alarms. As with other day of the week analysis there seems to be little evidence that any particular day of the week has greater frequency of false alarms.
Figure 4. Automatically generated alarms per time of day and day of week for subject group during 2013
024681012141618
00:00-0
0:59
01:00-0
1:59
02:00-0
2:59
03:00-0
3:59
04:00-0
4:59
05:00-0
5:59
06:00-0
6:59
07:00-0
7:59
08:00-0
8:59
09:00-0
9:59
10:00-1
0:59
11:00-1
1:59
12:00-1
2:59
13:00-1
3:59
14:00-1
4:59
15:00-1
5:59
16:00-1
6:59
17:00-1
7:59
18:00-1
8:59
19:00-1
9:59
20:00-2
0:59
21:00-2
1:59
22:00-2
2:59
23:00-2
3:59
Num
bero
ffalseaalrm
s/ho
ur
TimeofdayanddayofweekMondayTuesdayWednesdayThursdayFridaySaturdaySunday

8
Table 4. Daily distribution of average false alarms during the week. Day Mon Tue Wed Thu Fri Sat Sun
Average No. of false alarms
2.71 2.21 2.58 2.62 2.58 2.42 2.94
Presented in Table 4 is the average daily distribution of average false alarms during the week. The overall average daily false alarm frequency 𝑞!" is 2.58/day from this group of 106 tourist accommodations with a standard deviation of 0.23/day. The daily average of false alarms is within 1 standard deviation for Monday, Wednesday, Thursday, Friday and Saturday and within 2 standard deviations for Tuesday and Sunday. There is therefore no particular day of the week which is more significantly susceptible to false alarms, as it can be concluded that all days of the week will almost certainly be within 2 standard deviations of 𝑞!". It is noted that the daily false alarm frequency of 2.58/day for the group of 106 tourist accommodations constitutes more than 11% of the total daily false alarm of 23/day from the Sydney CDB area (FRNSW, 2013). From a false alarm per business point of view, tourist accommodation is one of, if not the most, frequent false alarm generator(s). Cost Analysis The foregoing analysis has given a profile of false alarms relating to the tourist accommodation buildings. The most meaningful data is in relation to the nature of false alarms being mostly due to occupant behaviour and that there are spikes of false alarms at certain times of the day. This spike in alarms in the morning and evening time is significant for costs as a consequence because it is likely the tourist accommodation premises would have a high occupancy rate at these times and therefore damage to reputation and inconvenience to customers would be higher than if it occurred during low occupancy.
Costs as a consequence – cost to business The costs as a consequence from a false alarm for a tourist accommodation building within the Sydney CBD are listed in Table 5.
Table 5. Unit cost of false fire alarms to a business (Marks 2014). Notation Item Unit cost Source
A Loss of business $180.68/event ABS (2013) B FRNSW fine $1250/event FRNSW (2008) C Staff downtime $282/hour ABS (2013) D Monitoring company costs $160/event Marks (2014) E Contractor $93.75/event Marks (2014) Te Total per event $1825/event −

9
The total per event cost can be determined using the following, assuming an average event duration of 30 minutes, or 0.5 hrs:
Te = A + B + hC + D + E (6) where h is the expected duration of the event. Based on the FRNSW Annual Reports (2012), the average duration for the fire brigade to attend a false alarm event is 0.5 hr. It is assumed that the business staff downtime is the same as the fire brigade attendance time. The fine, i.e., item B, for sending a false alarm to the fire brigade is $1250. This fine is not applied to all occurrences and can only be applied to any second alarm within a 60 day period to enable upgrading works to take place. Interviews with Fire and Rescue NSW staff have also revealed that the fines can be waived or reduced depending on particular circumstances and (Marks, 2014). Taking all these into consideration results in the fine being issued for around a quarter of incidents. Therefore, the expected cost due to the fine is a quarter of the full amount, or $312/event. Notwithstanding, the full fine is included in Eq. (6) to give a conservative estimate of the total cost per event. Further assume that the cost per event to all investigated tourist accommodation business is the same. Then the total cost, T, of consequence for the 106 subject tourist accommodation buildings over one year is estimated according to:
T = qfaTe (7) The result is around $1,717,325 per year which yields an average of $16,201/building. The highest frequency building had 48 false alarm events and therefore would have incurred a cost of $87,600 to the business.
Costs of response – cost to the fire brigade
The unit costs of response for fire brigades attending a false alarm, based on the available data from FRNSW Annual Report 2011/12 (2012), Schedule 3 of the Fire Brigade Regulation 2008 and interviews with FRNSW staff. Several methods of determining costs were applied for each set of data to establish the most accurate costs. The preferred method of costs from the data is given in Table 6.
Table 6. Unit cost of false fire alarms to the fire service
Notation Item Unit cost Source F Attending staff
costs $576/hour Schedule 3 of Fire Brigade
Regulation 2008 G Other staff costs $137/hour FRNSW Annual Report
2011/12 H Appliance costs $846/hour Schedule 3 of Fire Brigade
Regulation 2008, Marks (2014)
I Resource costs $2092/hour FRNSW Annual Report 2011/12, Marks (2014)
Th Total hourly cost $3651/hour

10
The total hourly cost is the sum of all items above, or Th = F + G + H + I (8)
The total average cost for attending an event is estimated from
Ta = h Th – J (9) where h is the average time duration (hr) spent by the fire brigade on attending the event and is equal to 0.5 hr (FRNSW, 2012). There is also the revenue component J for the fire authority in the form of the false alarm fine. Although the full fine is $1250/event, the expected revenue per event J=$1250/4 = $312/event as explained earlier. Therefore, the estimated average incidents cost according to Eq. (9) is $1513/event. Given the average number of false alarms per day for all buildings served by the three fire stations in the CBD is 23 (FRNSW, 2013) and a half hour per attendance, the total number of hours for the fire brigade to attend false alarms equates to 11.5 hours per day. At a total hourly cost of $3651/hour, the annual cost of $15,325,072 is incurred directly to the fire authority and indirectly to the society. The costs of response for the 106 subject tourist accommodation buildings over one year is around $1,717,325 ($1,423,733 with fine revenue) being an average of $16,201/building. The building with the highest false alarm frequency would have alone resulted in a cost of $87,600 per annum to the fire brigade. DISCUSSION Fire Alarm Reliability and Fidelity False alarms mean errors in the detection and alarm systems. The possible response of an alarm system to events are listed in Table 7.
Table 7. Fire alarm system performance inference matrix. Response of alarm system Occurrence of event
Fire event occurred No fire event occurred Automatic alarm issued √ I Automatic alarm not issued II √
The 1st and the 4th performance quadrant of the table indicate the correct responses of the system to the reality. The 2nd performance quadrant marked by I represents the error of the first kind, i.e., a positive response to a negative event. This quadrant represents the false alarm. The 3rd quadrant marked by II represents the error of the second kind, i.e., a negative response to a positive event. This quadrant represent failure. From a fire safety point of view, the error of the second kind can be fatal or lead to disastrous consequences. Let N represent the total number of fire alarms issued by all means, including the automatic fire alarm systems and other systems, to the fire brigade. The numbers Nij (i, j = 1, 2) in the four performance quadrants of Table 8 register the quantified performance of the automatic fire alarm systems.

11
Table 8. Fire alarm system performance data matrix. Status of alarm Occurrence of event
Fire event occurred No fire event occurred Automatic alarm issued N11 N12
Automatic alarm not issued N21 N22
The following identities hold:
Total number of genuine fire events = 𝑁11 + 𝑁21 (10)
Total number of fire alarms = 𝑁11 + 𝑁12 (11)
The reliability, R, of a fire alarm system is defined by
𝑅 =𝑁11
𝑁11 + 𝑁21 (12)
This reliability is the probability that a fire alarm system will respond correctly to a genuine fire event. This reliability is used by fire safety engineers in their event tree analysis for risk based approach to fire safety engineering design and assessment (ABCB, 2005, Hurley, 2016). The false alarm rate of the automatic fire alarm system is defined by
𝑅! =𝑁12
𝑁!! + 𝑁!" (13)
This parameter is the probability of a received automatic fire alarm being a false one. Its complement
𝑅! = 1− 𝑅! =𝑁11
𝑁!! + 𝑁!" (14)
is the probability of received automatic fire alarm being a genuine one. This parameter can be termed as fire alarm signal fidelity. It is a measure of trustworthiness of a fire alarm. Although the definitions of reliability and fidelity, i.e., Eqs. (12) and (14), have a common factor, namely N11, their denominators are different, one contains N12 and the other N21. These two elements are apparently independent numbers and, therefore, there is no definitive relationship between the fire alarm system reliability and the fire alarm signal fidelity. However in reality, the fidelity may be correlated to reliability. Anecdotally, a reliable fire detection and alarm system is sensitive to changes in the parameters of the environment, which are caused by a fire event and of which the system is monitoring. On the other hand, high sensitivity could lead to responses to changes which are caused by non-fire events, resulting in false alarms. It is highly possible that high reliability of fire detection and alarm systems may lead to low fidelity. The correlation of these two parameters is beyond the scope of the current study. If no other fire alarms were included in the current study, then numerically
𝑅! = 𝑟𝑓−𝑎 (15)
and

12
𝑅! = 𝑟𝑔−𝑎 =1
1 + 𝑟!!! (16)
These two probabilities can be used by fire brigades in resource planning and management for fire emergencies. The raw data obtained for the current study is not sufficient to determine N21, or the number of genuine fire incidents that were not detected by the fire alarm system. Therefore, the reliability of the fire alarm systems could not be estimated. Generally, the number N22 in Table 8 cannot be collected, since no event will be registered if they do not occur and there is no detection. By all means, this data is redundant for current study and for the study of the reliability of fire alarm systems. False Alarm and Human Activity The research concluded that false alarms in the subject buildings were mostly due to occupant behaviour. Research carried out by Department of Resources Energy and Tourism (2012) on power profiles for times of day for residential buildings, yielded a strikingly similar profile to that in Figure 2. The power usage had a notable spike at 8:00am and another at 6:00 to 8:00pm. This would verify the assumption that these are the times residential buildings are most occupied. Accuracy of Cost Analysis The cost analysis presented in the foregoing section serves as an estimate for the tourist accommodation only. Due to uncertainties in the difficult to quantify data, particularly for the loss of business costs, some assumptions had to be made. The costs analysis methodology used here is may be suitable for use in other building types and further studies could be carried out to refine the methodology. For a wider range of businesses, more sophisticated models will be required. The costs used are derived from 2014 and have not been adjusted to current costs, or included the current increased Fire and Rescue NSW false alarm fine. CONCLUSIONS False alarm data of 106 tourist accommodations in Sydney CBD during 2013 was obtained from Australian Incident Reporting System. Statistical analyses were conducted to obtain the annual false alarm frequency and intensity of the fire detection systems in the sampled Class 3 buildings. The study has signified a high false alarm intensity. Of the subject buildings assessed the average false alarm intensity was 8.9/building/year and the false to genuine alarm ratio was markedly high (approximately 28:1). Such high frequency of false alarm incidents incurred significant costs to businesses and fire service. The analysis also established some correlations between the frequency of false alarms and time of year, day of week and hour of day. The results showed that false alarms peaked each day between 8:00 to 10:00 am and 07:00 to 08:00 pm and were mostly due to human behaviour, such as cooking, heating and showering. The results of the current study indicate that false alarms are a non-negligible problem in the Sydney CBD. To minimise the nuisance and the costs of false alarms,
13
consideration should be given to introducing new technologies and techniques with high fidelity for fire detection. Given that on average a tourist accommodation building experienced 8.9 false alarms annually, risk-cost-benefit analyses are warranted before the call for installing high sensitive fire/smoke detection and alarm systems. The correlation between the reliability and fidelity of the fire detection and alarm systems also warrant further studies. The similar studies can and should be conducted to other building classes. A complete time dependent distribution of false alarm rate vs building classes plus the knowledge of occupant density would assist fire services in prioritising emergency call attendance and make the best use of available resources. REFERENCES ABCB2005.InternationalFireEngineeringGuidelines,Canberra,Australia,AustralianBuildingCodes
Board.AHRENS,M.2004.FalseAlarmsandUnwantedActivations,fromUSExperiencewithSmokeAlarms
andOther Fire Detection/Alarm Equipment. Quincy,MA, USA: Fire Analysis and ResearchDivision,NationalFireProtectionAssociation
DEPARTMENT OF ENERGY, RESOURCES AND TOURISM, 2012, Proof of concept residential energymonitoringprogram
DUBIVSKY, M., BUKOWSKI, R., 1989, False alarm study of smoke detectors in Department ofVeterans Affairs Medical Centres (VAMCS), U.S. Department of Commerce, Gaithersburg,MD,USA
FIREANDRESCUENSW,2012,Gearingupforthefuture,AnnualReport2011-12,NSWGovernment,ISSN07292163
FIRE AND RESCUE NSW, 2013, Annual statistical reports, 2002/03 to 2006/07,www.fire.nsw.gov.au/page.php?id=171
FIREANDRESCUENSW,2016a,Automaticfirealarmshttp://www.fire.nsw.gov.au/page.php?id=77FIREANDRESCUENSW,2016b,GuidelineNo.4ApplicationtowaiveAFAfalsealarmfees,pp.11-12HE, Y.,NELSON,D. 2008. A Comparative Study of Effectiveness of SmokeAlarms in Two Types of
Buildings.JournalofFireSciences,26,415-434.HURLEY,M. J., ROSENBAUM, E. R. 2016. Performance-Based Design. In: HURLEY,M. J. (ed.) SFPE
HandbookofFireProtectionEngineering.5thed.NewYork:Springer.LAMM,F.,vanRossum,S.,Lomax,D.,Arthani,T.,&Li,M.,2006,Thecostfactorsandprofileoffalse
andunwantedfirealarmactivationsinNewZealand,AucklandUniServicesLtd,Wellington,NewZealand,ISBN1-877349-31-3
LUCK,H,1996,'Remarksonthestateoftheartinautomaticfiredetection',FireSafetyJournal,vol.29,pp.77-85
MARKS, M, 2014, Cost and data analysis of false alarms frommonitored fire detection systems,UniversityofWesternSydney
PRODUCTIVITY COMMISSION, 2012, Report on government services 2012, Commonwealkth ofAsutrlaia,ISBN978-1-74037-385-2
PROULX, G. 2000. Why do building occupants so often ignore fire alarm signals? : Institute forResearchinConstruction,NationalResearchCouncilofCanada.
THOMAS,I.R.2001.EffectivenessofFireSafetyComponentsandSystems.JournalofFireProtectionEngineering,12,63-78.
TU, Y., 2003, 'Assessment of the current false alrm situation from fire detection systems in NewZealand and the development of an expert system for their identifications' thesis. FireEngineeringDepartmentofCivilEngineering,UniversityofChristchurch,NewZealand