Embed Size (px)
Citation preview

FACTA UNIVERSITATISSeries: Mechanics, Automatic Control and Robotics Vol.3, No 13, 2003, pp. 533 - 552
FAILURE METHODOLOGY OF MODE-II LOADED CRACKS UDC 539.219.2 620.1
Jörg F. Kalthoff
Experimental Mechanics, Ruhr-University Bochum, 44780 Bochum, Germanye-mail: [email protected]
Abstract. Various aspects of the failure behaviour initiated from mode-II loaded cracksare discussed: validity criteria and minimum size specimen requirements for measuringthe fracture toughness KIIc; energy balance of the process of initiation of kinked cracksincluding compressive notch tip stress concentrations; failure mode transition fromtensile cracks to adiabatic shear bands at high loading rates; loading rate dependenceof the dynamic fracture toughness KIId in the regime of failure mode transition.Findings of studies on these subjects are presented and implications of the results forpractical applications are discussed. The failure behaviour of mode-II loaded cracks isfound very different and far more complicated than of mode-I loaded cracks,generalizations from mode-I to mode-II can therefore be severely misleading.
INTRODUCTION
Fracture mechanics investigations mostly deal with tensile mode-I situations of load-ing. One practical implication of this situation is that standards for measuring fractureproperties of materials subjected to tensile mode-I conditions of loading have been devel-oped and are available, but any standards for measuring mode-II or mixed mode-I/mode-II failure properties do not exist. Many applications in practice, however, deal with mode-II or mixed mode loading situations. These cases are often treated according to what isknown and specified for the mode-I loading case. This paper is aimed to show that thefailure behaviour of mode-II and mixed mode loaded cracks is principally different fromthe one of mode-I loaded cracks, that erroneous results can be obtained when failureproperties for mode-II or mixed mode loading situations are measured following the prin-ciples developed for mode-I loading, and, that the failure behaviour for mode-II loadingsituations at increasing levels of loading rate shows phenomena that do not become acti-vated and that do not exist for mode-I loading situations. Given are results and conclu-sions that have been presented at the Yokobori Conference on Complexity and Frontiersin Strength and Fracture in Sendai, Japan in 2001 [1].
Received October 20, 2002

534 J. F. KALTHOFF
VALIDITY CRITERIA FOR MEASURING THE MODE-II FRACTURE TOUGHNESS KIIC
For tensile mode-I conditions of loading validity criteria have been established thathave to be met in order to allow for an application of the concept of linear-elastic or smallscale yielding fracture mechanics and for measuring the fracture toughness of the mate-rial. These criteria, formulated for fracture toughness tests, are given in the form ofminimum specimen size requirements in the stand-ard ASTM E 399 [2]. When the char-acteristic measurement of the specimen in out-of-plain direc-tion, i.e. the thickness of thespecimen, is larger than 2.5(KIc/σYS)2, where KIc = plane strain fracture toughness, σYS =yield strength, a dominating state of plane strain applies at the crack tip. Further-more,when the characteristic measurements of the specimen in in-plane directions, i.e. theheight of the specimen, the length of the crack, and the length of the ligament, are largerthan this same quan-tity mentioned above, the conditions of linear-elastic or small scaleyielding fracture mechanics are fulfilled, i.e. a stress intensity factor description based onthe K-concept can be used to characterize the crack tip stress field. Under these condi-tions the concept of LEFM allows failure predictions with the plane strain fracture tough-ness KIc as material property. The criteria are based on the size of the crack tip plasticzones, specifically the dependency of the size of the zone across the thick-ness of thespecimen and the size in relation to the in-plane dimensions of the specimen. Equivalentminimum size requirements and validity criteria for in-plane shear (mode-II) conditionsof loading do not exist. Efforts were undertaken by Hiese and Kalthoff to develop suchcriteria [3,4].
Following in principle the argumentation that led to the well known minimum sizespecimen requirements in the mode-I case, the plastic zones at the tip of mode-II loadedcracks were considered and on this basis validity criteria were developed for mode-II test.For the two cases of plane strain and plane stress, Fig. 1 shows the mode-II crack tipplastic zones in comparison to equivalent (i.e. KII = KI) mode-I crack tip plastic zones.Two characteristic differences are recognized: First, for mode-II loading the overall sizeof the plastic zones is considerably larger, but, secondly, the differences of the plasticzones for the stress states of plane strain and plane stress are considerably smaller thanfor the equivalent case of mode-I loading.
Fig. 1. Crack tip plastic zones for mode-I and mode-II conditions of loading.

Failure Methodology of Mode-II Loaded Cracks 535
Because of these differences in the plastic zones it is concluded that the usual re-quirements for a KIc-test cannot be adopted for a KIIc-test. The relatively small differencesin size of the mode-II zones for the conditions of plane strain and plane stress will obvi-ously allow smaller minimum specimen thicknesses BII min for a mode-II test than for amode-I test. Because of the larger overall size of the plastic zones, however, the in-planespecimen dimensions, i.e. the height HII min and the ligament length (W-a) II min of thespecimen should be larger than for a mode-I test. If one assumes that the fracture behav-iour is controlled by the size of the plastic zone, where the size shall be given by the av-eraged radius of the plastic zone for the moment, one would speculate that the thicknessBII min should be about three times smaller, the height HII min and the ligament length (W-a)II min, however, should be about four times larger than for a mode-I test. With the quan-titative estimate of the mode-I size requirements transferred in an analogous manner tomode-II, the specimen size requirements for valid KIIc-tests would result in
2
YS
IIcII σ
K0.8B
> (1)
2
YS
IIc2
YS
IIcII σ
K10)aW(andσK10H
>−
> . (2)
In order to verify these postulated hypothesis, mode-I and mode-II fracture toughnesseswere measured with specimens of different sizes made of the aluminum alloy Al 7075 andthe tool steel 90 MnCrV 8. The relevant material properties of the aluminum alloy Al 7075in the condition as used for the investigations are: KIc = 27 MN/m3/2, σYS = 488 MPa (TL-orientation), and KIc = 30 MN/m3/2, σYS = 533 MPa (LT-orientation). The steel 90 MnCrV 8was used in different conditions that were achieved by different heat treatments: For thesame hardening temperature of 950 °C the tempering temperature was varied from 630 °Cto 570 °C to result in material properties varying from KIc = 70 MN/m3/2, σYS = 1000 MPato KIc = 56 MN/m3/2, σYS = 1130 MPa.
The fracture toughness tests were performed with loading fixtures of the modified Ar-can/Richard-type [5, 6], shown schematically in Fig. 2. The test specimens were equippedwith machined Chevron-type prenotches, which were subsequently fatigue loaded undermode-I conditions according to ASTM E 399 in order to achieve standard initial startercracks. The same mode-I fatigue loading procedure was applied to specimens used forboth the mode-II and the mode-I fracture tests. The test conditions have been chosen toresult to a large extent in invalid results in order to establish a data base for investigatingthe range where the validity of the data gets lost. In the invalid regimes, but also in theregime of valid tests, the mode-II and the mode-I fracture toughnesses were determinedusing the 5 % secant evaluation procedure as described in ASTM E 399. The measuredmode-II and mode-I fracture toughness values as determined after the test, without hav-ing been approved by validity conditions yet, are denoted KIIQ and KIQ respectively.

536 J. F. KALTHOFF
MODE-I MODE-I / MODE-II MODE-II
Fig. 2. Mixed mode loading fixture after Arcan, Richard.
The measured mode-II and mode-I fracture toughnesses are summarized in Figs. 3 and4. The data are shown as functions of the characteristic out-of-plane dimension, i.e. thethickness B of the specimen, and as functions of the characteristic in-plane dimensions, i.e.the height H and the ligament length (W-a) of the specimen. In order to allow for a jointpresentation of all the data determined for the different materials and conditions, the dataare normalized with respect to their respective fracture toughness values.
Fig. 3. Dependence of the mode-II fracture toughness from specimen thicknessin comparison to the mode-I behaviour. Normalized plots for datameasured with Al 7075 and steel 90 MnCrV 8.

Failure Methodology of Mode-II Loaded Cracks 537
As regards the specimen thickness requirement for determining valid fracture tough-nesses, the results indicate the usual behaviour when the mode-I fracture toughness KIc isconsidered: A practically constant value is obtained for thicknesses above 2.5(KIc/σYS)2;for thicknesses smaller than this value the measured fracture toughness values show anincreasing tendency. This behaviour is in full accordance with what is expected accordingto the standard ASTM E 399. For the mode-II fracture toughness KIIc, however, practi-cally constant toughness values are found for thicknesses below the critical thickness ofmode-I tests, i.e. constant mode-II fracture toughnesses are found in the regime of thick-nesses where the mode-I fracture toughnesses show a strongly increasing tendency. Prac-tically constant mode-II fracture toughnesses are obtained down to thicknesses of about0.5(KIIc/σYS)2, i.e. for thicknesses even somewhat lower than predicted by the postulatedhypothesis.
Fig. 4. Dependence of the mode-II fracture toughness from in-plane specimendimensions in comparison to the mode-I behaviour. Normalized plots fordata measured with Al 7075 and steel 90 MnCrV 8.
As regards the minimum in-plane dimensions of the specimen, i.e. H and (W-a), fordetermining valid fracture toughnesses, the data indicate the following behaviour. For themode-I fracture toughness KIc practically constant values were measured with specimensof in-plane dimensions H and (W-a) well above the value 2.5(KIc/σYS)2, as it is expectedaccording to ASTM E 399. For the mode-II fracture toughness KIIc, however, non-con-stant values are measured with specimens of dimensions H and (W-a) above the criticalin-plane dimensions for mode-I tests, i.e. non-constant mode-II fracture toughnesses arefound in the regime of in-plane dimensions of the specimen where the mode-I fracturetoughness does show constant values already. The data indicate that constant mode-IIfracture toughnesses are approached at larger dimensions of about 10(KIIc/σYS)2 only.

538 J. F. KALTHOFF
Thus, the experimental findings as regards the minimum thickness as well as the mini-mum in-plane dimensions of specimens fully verify the postulated hypothesis (1) and (2)for performing valid mode-II fracture toughness tests.
The investigations have shown that mode-II crack tip plastic zones are considerablylarger than equivalent mode-I crack tip plastic zones, and, therefore, that the in-planedimensions of mode-II test pieces have to be considerably larger than for mode-I cases tofulfill the conditions of linear-elastic or small scale yielding fracture mechanics. It isspeculated that many so called shear fracture toughness data reported in the literaturerepresent invalid data, since they were not determined according to these novel criteria,but in very many cases were measured with specimens following in principle the re-quirements for a mode-I test. The fact, that such literature data are not valid in the abovementioned sense may also be one of the reasons for such controversies that in some casesshear fracture toughnesses “KIIc” were reported lower but in other cases higher than thetensile fracture toughness KIc.
INSTABILITY PROCESS OF MODE-II LOADED CRACKS
The process of instability of a mode-I loaded crack is rather simple in nature: The crackextends straight in its original direction, and, as a consequence, the mode-I crack tip stressfield before instability stays a mode-I stress field after instability. The situation is morecomplex for a mode-II loaded crack: the direction of propagation of the initiated crack afterinstability is different from the direction of the initial mother crack; the crack propagates atan angle of about 70° with respect to the ligament and, in conjunction with it, the crack tipstress field changes from mode-II before instability to mode-I after instability.
The instability process of mode-II loaded cracks has been investigated by Podleschnyand Kalthoff [7, 8]. In these studies not only the phase directly before instability is con-sidered - which is the phase that is usually considered in investigations of the instabilityevent - but also the phase after instability is considered, i.e. the phase of propagation ofthe initiated kinked crack.
In the investigations the instability process of mode-II loaded cracks has been moni-tored by means of the shadow optical method of caustics in combination with high speedphotography. Figure 5 shows shadowgraphs of the situation a short time after instability.A review on the principles of the shadow optical method of caustics for measuring stressconcentrations is given in [9]. In addition to the mode-I stress intensification field whichbuilds up at the tip of the kinked crack that is initiated from the mode-II loaded mothercrack - this stress intensification field is trivially expected - another stress concentrationfield is found which builds up at the notch that is formed between the initiated kinkedcrack and the original mother crack (see dark shadow spot in Fig. 5, lower part). Figure 6shows the result of equivalent photo-elastic investigations performed with a model ex-periment. The fringe patterns Fig. 6b and c which simulate the loading situation after in-stability in a quasi-static saw cut approximation show a tensile (mode-I) loading at the tipof the simulated kinked crack and an additional stress concentration at the formed notch,i.e. the fringe patterns give evidence of the same behaviour as derived from the shadowoptical picture. The stress concentration field that additionally builds up at the notch tip isa compressive field, as is demonstrated by the character of the shadow pattern (see [9]).Thus, the shear mode-II stress intensification field around the tip of a starter crack before
Failure Methodology of Mode-II Loaded Cracks 539
instability is not only transferred into a tensile mode-I stress intensification field at the tipof the initiated kinked crack after instability, but, parts of the original shear mode-II fieldare also transferred into a compressive stress concentration field at the notch that isformed.
Fig. 5. Shadow optical simulation of the post instability loading situation of a shearmode-II loaded mother crack, indicating a tensile mode-I loading at the tip of theinitiated kinked crack (real shadowgraph, z0 > 0, upper part) and an additionalcompressive stress concentration at the notch formed between the initiatedkinked crack and the original mother crack (virtual shadowgraph, z0 < 0, lowerpart). Shadowgraphs recorded in transmission with an epoxy resin specimen.
Fig. 6. Photoelastic visualization of changes of the loading situation of a shearmode-II loaded mother crack from (a) before to (b), (c) after instability.Quasi-static investigation with saw cut model.

540 J. F. KALTHOFF
Figure 7 illustrates this behaviour (lower graphs) and shows the situation in compari-son to the simpler case of mode-I loading (upper graphs). Completely analogous behav-iour results for cracks under mixed mode-II/mode-I conditions of loading. Of course, thelarger the mode-I contribution, the shallower the notch; and, trivially, for non-existingmode-II contributions, the notch does not exist and the crack shows the usual straightpropagation behaviour. With respect to these post instability processes, which are verydifferent in nature for mode-I and mode-II loaded cracks, it is concluded that the mode-Iinstability process represents a much simpler event than the mode-II instability process.Thus, any attempts to transfer fracture mechanics criteria and validity conditions frommode-I to mode-II loading in one way or another must principally fail, since completelynew and different processes which do not exist for mode-I loading come additionally intoplay for mode-II loading.
Fig. 7. Differences in the instability process of tensile mode-Iand shear mode-II loaded cracks, schematically.
The elastic energies stored in the three types of stress concentration fields that controlthe instability process of mode-II loaded cracks, i.e. a mode-II and a mode-I crack tipfield, and the compressive notch tip field, have been quantified. In addition to the puremode-II loading situation, the general case of mixed mode-II/mode-I loading, and, conse-quently, compressive notch tip fields of various notch angles, are considered. In order toallow for an easy comparison of data, all energy quantities are given in normalized formrelative to the energy stored at the tip of a tensile mode-I loaded crack. The different sin-gularities of the crack tip stress field (r-0.5) and of the notch tip field (r-0.415 for a 70°notch) have been taken care of in the calculations; but, whereas exact expressions werede-rived for the crack tip energies only approximate relationships are given for the notchtip energy [7].
For clarity of presentation, in addition to the subscripts ‛I’ and ‛II’ for characterizationof the stress intensity factors for conditions of mode-I and mode-II loading respectively,the subscripts ‛MM’ are added when mixed mode loading conditions apply and both stress

Failure Methodology of Mode-II Loaded Cracks 541
intensity factors KI and KII exist simultaneously, whereas the subscript ‛PM’ is addedwhen pure conditions of either mode-I or mode-II loading apply. Using this nomenclaturethe following expressions are derived for the crack tip energy UC and the notch tip energyUN (see [8])
2/5
MMIIMMI
MMII
MMC,
MMN,2PMI
2MMI
2MMI
PMC,
MMC,
KKK
41
UU
andK
1K1κ23κ2K
UU
+
=
−++= (3)
with κ = (3-ν)/(1+ν) for plane stress,κ = 3-4ν for plane strain,
whereUC = elastic energy stored around a crackUN = elastic energy stored around a notch that is formed
by a crack initiation under mixedmode loading conditionsK = stress intensity factorPMI, PMII = subscripts characterizing a pure mode-I or a pure mode-II
loading conditionMM = index characterizing mixed mode conditions of loadingMMI, MMII = indices characterizing the mode-I or the mode-II portion of a
mixed mode loading condition.Figure 8 shows the dependence of the crack tip energy UC and of the notch tip energy
UN as function of the ratio of mode mixity assuming equivalent loading conditions, i.e..KK)K(K PMIIPMI
2/12MMII
2MMI ==+ Data are given for the states of plane stress and plane
strain and different values of Poisson’s ratio.
Fig. 8. Elastic energies of crack tip and notch tip stress fields for different mode mixities.
It is recognized: First, for a mode-II loaded crack the stored elastic energy is roughlya factor of three larger than the elastic energy stored at a mode-I loaded crack, providedthat an equivalency of the form KPMI = KPMII is given. Secondly, for a mode-II loadedcrack the elastic energy stored at the notch that is additionally formed between the initi-ated kinked crack and the original mother crack is roughly one quarter of the elastic en-
542 J. F. KALTHOFF
ergy stored at the original mode-II loaded mother crack. Consequently, for the first stepof crack propagation after instability only the difference of these two energy quantitiesrepresents the energy that is available for building up the stress concentration at the tip ofthe initiated kinked crack. Only this difference energy is available for crack extension,i.e. represents the crack driving energy. For mixed mode conditions of loading shallowernotches result and the energy quantities are accordingly lower; for a crack under puremode-I loading the notch tip energy is trivially zero. On the basis of this difference en-ergy approach an expression for the strain energy release rate for kinked crack propaga-tion has been developed, given in [7, 8].
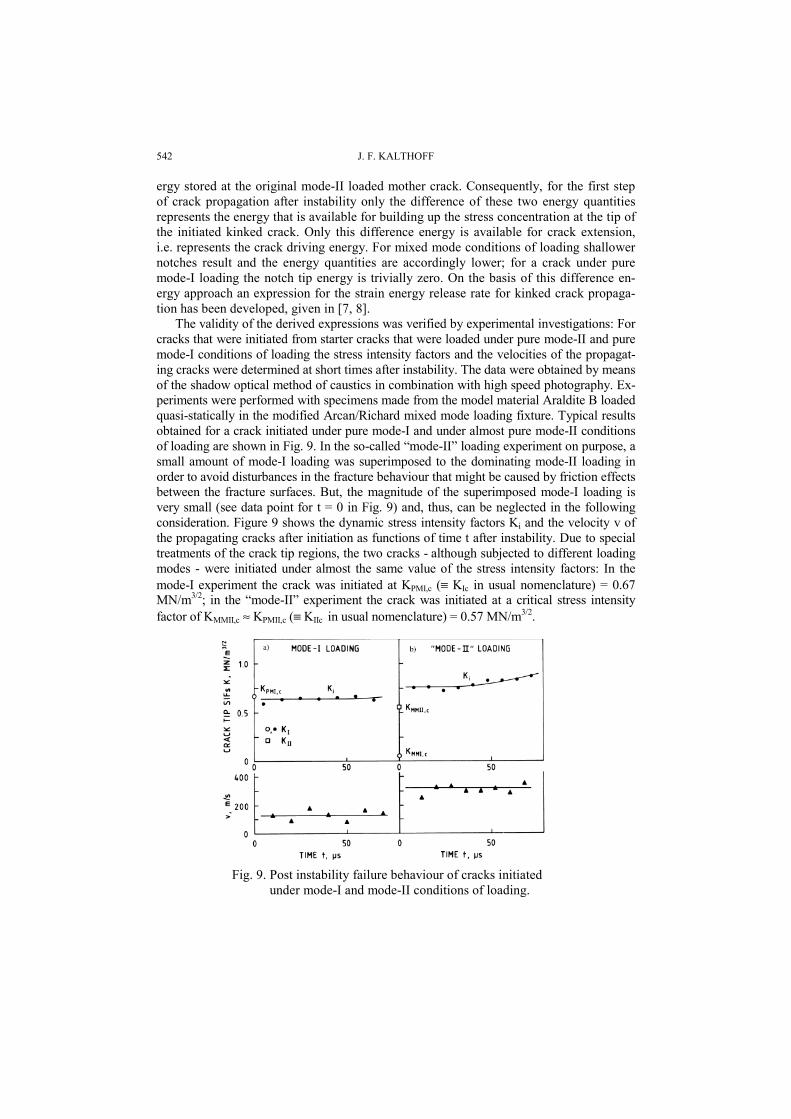
The validity of the derived expressions was verified by experimental investigations: Forcracks that were initiated from starter cracks that were loaded under pure mode-II and puremode-I conditions of loading the stress intensity factors and the velocities of the propagat-ing cracks were determined at short times after instability. The data were obtained by meansof the shadow optical method of caustics in combination with high speed photography. Ex-periments were performed with specimens made from the model material Araldite B loadedquasi-statically in the modified Arcan/Richard mixed mode loading fixture. Typical resultsobtained for a crack initiated under pure mode-I and under almost pure mode-II conditionsof loading are shown in Fig. 9. In the so-called “mode-II” loading experiment on purpose, asmall amount of mode-I loading was superimposed to the dominating mode-II loading inorder to avoid disturbances in the fracture behaviour that might be caused by friction effectsbetween the fracture surfaces. But, the magnitude of the superimposed mode-I loading isvery small (see data point for t = 0 in Fig. 9) and, thus, can be neglected in the followingconsideration. Figure 9 shows the dynamic stress intensity factors Ki and the velocity v ofthe propagating cracks after initiation as functions of time t after instability. Due to specialtreatments of the crack tip regions, the two cracks - although subjected to different loadingmodes - were initiated under almost the same value of the stress intensity factors: In themode-I experiment the crack was initiated at KPMI,c (≡ KIc in usual nomenclature) = 0.67MN/m3/2; in the “mode-II” experiment the crack was initiated at a critical stress intensityfactor of KMMII,c ≈ KPMII,c (≡ KIIc in usual nomenclature) = 0.57 MN/m3/2.
Fig. 9. Post instability failure behaviour of cracks initiatedunder mode-I and mode-II conditions of loading.

Failure Methodology of Mode-II Loaded Cracks 543
The following behaviour is recognized: Although the critical stress intensity factors atinstability for the mode-II and for the mode-I experiment are (very roughly) similar, or,more precisely, although the critical stress intensity factor in the mode-II experiment waseven somewhat lower than the critical stress intensity factor in the mode-I experiment,the stress intensity factors Ki of the crack initiated under mode-II conditions of loadingare considerably higher than those measured for the crack initiated under mode-I condi-tions of loading. The higher stress intensity factors are supported by the accompanyinghigher crack propagation velocities. These experimental findings are in qualitativeagreement with the theoretical speculations on the driving energy that is available forcrack extension after initiation, in particular, that larger energies are stored at mode-IIstress fields than at mode-I stress fields.
In summary, the investigations have shown: for the case of mode-II loaded cracksabout one quarter of the energy stored of the tip of the original mother crack is used forbuilding up the energy of the compressive notch tip stress field; thus, only the differenceenergy is available for subsequent crack propagating. Despite of this fact, much moreenergy remains for the failure event than for an equivalent mode-I case. Of course, anidealistic situation has been considered: The effect would become even larger for KIIc >KIc, but smaller for KIIc < KIc.
FAILURE MODE TRANSITION AT INCREASING LOADING RATES
Mode-I cracks when loaded dynamically show an instability and failure behaviourwhich is essentially the same as if the load would have been applied quasi-statically –with the only difference that certain characteristic values become changed [10, 11]. Whenmode-II cracks are loaded dynamically, e.g. by an impact event, however, the failure be-haviour changes completely with respect to the quasi-static one; a failure mode transitionis observed when the loading rate exceeds a certain limit value.
Fig. 10. Experimental set-up of the technique of loading edge cracksby edge impact and instrumentation, schematically.
The LECEI-technique (Loading of Edge Cracks by Edge Impact) [12-14], is used forgenerating high rate mode-II crack tip loading conditions. The principle of the loading tech-

544 J. F. KALTHOFF
nique is shown in Fig. 10. An edge cracked specimen is asymmetrically impacted at thecracked edge by a projectile accelerated by an air gun to velocities up to 100 m/s. The im-pinging projectile initiates a compressive wave to one side (above) the crack. To the otherside of the crack (below) the specimen remains stress free. The displacements associatedwith the stress wave field generate a mode-II loading at the crack tip. The mode-II crack tiploading develops for the early time range of the impact event only, i.e. before waves that arereflected at the finite boundaries of the specimen will interfere with the crack tip again; thisis the range of interest for high rate failure investigations. Since the boundary of the speci-men is not of any influence for the time range of interest, it is not necessary to hold thespecimen in a special loading fixture; the specimen is completely free.
Shadow optical investigations [13] have shown that the LECEI-technique yields analmost undisturbed mode-II loading for times before elastic waves reflected at the finiteboundaries of the specimen interfere with the crack tip again. Some influence of a su-perimposed mode-I loading results for the very beginning of the impact event, which isdue to lateral deformations associated with the compressive stress wave generated by theimpact event; for later times, however, the mode-II loading is dominating and the su-perimposed mode-I loading becomes negligible.
Failure Surfaces:
-70°-70°
Transition in Failure Mechanisms:Low loading rate
⇒⇒⇒⇒ Tensile CracksHigh loading rate
⇒⇒⇒⇒ Adiabatic Shear Bands
Small Energy Dissipationduring Propagation
Large Energy Dissipationduring Propagation
Mode-II Mode-II
long failure path short failure path
Failure Surfaces:
-70°-70°
Transition in Failure Mechanisms:Low loading rate
⇒⇒⇒⇒ Tensile CracksHigh loading rate
⇒⇒⇒⇒ Adiabatic Shear Bands
Small Energy Dissipationduring Propagation
Large Energy Dissipationduring Propagation
Mode-II Mode-II
long failure path short failure path
Fig. 11. Failure mode transition from tensile cracks to adiabatic shear bandsat increasing levels of loading rate.
The failure behaviour at increasing levels of loading rate has been investigated by testswith impact velocities ranging from 10 to 100 m/s. Specimens made of the steel X2 NiCoMo18 9 5 where tested. The typical specimen dimensions were about 100 × 200 mm; a projec-tile was utilized made of the same steel as the specimen, measuring 50 mm in diameter. Thefollowing results were obtained (see Fig. 11): At low loading rates, a failure behaviour isobserved similar as in the quasi-static case: The mode-II loaded crack fails by a tensilemode-I crack propagating at an angle of about -70° with respects to the ligament; the gener-ated failure surface shows the usual characteristics of a fracture surface, i.e. roughness as it istypical for the steel investigated and shear lips at the edges of the specimen. At high loadingrates, the mode-II loaded crack fails by another mechanism, by an adiabatic shear band

Failure Methodology of Mode-II Loaded Cracks 545
propagating almost in the direction of the ligament (more precisely, the band propagates atan angle of a few degrees in the positive direction, i.e. to the opposite side of the ligament themode-I crack would propagate). The failure surface has a smeared over, mirror-like, shinyappearance; shear lips at the edges of the specimen cannot be identified at all. In the high rateexperiments, carried out with high impact velocities by which large amounts of energy aretransferred to the specimen, the generated adiabatic shear bands come to arrest after a shortpropagation length only. In low rate experiments, carried out with low impact velocities bywhich smaller amounts of energy are transferred to the specimen, the generated crackspropagate entirely through the specimen separating the specimen into two halves and, thus,result in considerably larger propagation lengths. It is speculated, therefore, that adiabaticshear bands absorb more energy for propagation than cracks [13, 14]. Tests with initialcracks/notches of different bluntness have shown that the limit velocity for failure modetransition is the higher the more blunted the initial crack or notch.
The failure mechanism of adiabatic shear bands is less well understood than the usualfracture process: Due to the quasi-adiabatic conditions that control the high rate failureprocess of adiabatic shear bands, the generation of plastic deformations at the tip of theinitial crack results in high temperature values leading to a thermal softening and shearlocalization in turn, processes which represent the basis for the formation of adiabaticshear bands. The adiabatic shear bands either show a deformed structure (deformedbands) or phase transformations to a martensitic structure take place, which are madevisible by a white edging band (transformed bands); examples are given in Fig. 12. Thehardness and the strength of the material inside the adiabatic shear band are considerablyhigher than of the base material, in particular this is the case for transformed bands. Thefinal failure of adiabatic shear bands can be caused by fracture or by void growth andcoalescens processes, mechanisms which require small amounts of energy compared tothe energy necessary for the formation of the adiabatic shear band itself. For further in-formation on adiabatic shear bands in general see e.g. [15].
Fig. 12. Micrographs of adiabatic shear bands; (a) deformed band, steel:X2 NiCoMo 18 9 5, (b) transformed band, steel: 42 CrMo 4.

546 J. F. KALTHOFF
INFLUENCE OF LOADING RATE ON SHEAR FRACTURE TOUGHNESSFOR FAILURE MODE TRANSITION
The dependence of the impact shear mode-II fracture toughness, denoted KIId, hasbeen investigated by Bürgel and Kalthoff [16, 17] as a function of loading rate, in par-ticular in the regime of failure mode transition from cracks to adiabatic shear bands; i.e.in the regime where the failure mode changes from a low to a high energy dissipationprocess.
High rate shear mode-II experiments are performed using the LECEI-technique as de-scribed in the previous chapter. For determining mode-II intensity factors during thephase of loading, a strain gauge measuring technique has been developed following theideas introduced by Dally, Sandford [18] for the mode-I case. The principle of this tech-nique was adopted and modified to apply for mode-II loading situations [16, 19]. Thespecimen in the region near the crack tip is instrumented by a strain gauge. With respectto the crack tip the strain gauge location is characterized by the polar coordinates r and ϕ,the measuring direction is given by the angle α, Fig. 13.
ϕ
r
α
y
xPlastic Zone
Fig. 13. Strain Gauge Location
The principle for determining stress intensity factors from the intensity of 1/√r-cracktip stress singularity, on the one hand, requires small application distances r for achievinghigh accuracy results. Due to plasticity effects, i.e. the formation of a plastic zone aroundthe crack tip, however, the minimum application distance r is limited; it has to be suffi-ciently large with respect to the size of the crack tip plastic zone to ensure that the stressfield is dominated by the 1/√r-dependence. For large distances from the crack tip, on theother hand, the influence of higher order terms of the crack tip stress field increases and,consequently, their disturbing influence has to be considered. The two free applicationparameters, the angles ϕ and α, can now be chosen in such a way that the two higher or-der terms are eliminated or minimized. For ν = 0.3 the optimum application angles are
ϕopt ≈ 10°, αopt ≈ 60°. (4)
Because of the still remaining and principally unavoidable influence of next higherorder terms, two strain gauges are used (as shown in Fig. 10) in order to allow for an ex-trapolation of the data towards the actual crack tip position. Furthermore, the straingauges are calibrated in a quasi-static pre-experiment at a low load level, which does notinfluence the loading situation of the later main experiment. Verification studies [16]showed good agreement.
Failure Methodology of Mode-II Loaded Cracks 547
The time at which instability occurs, i.e. instability due to failure by a crack or by anadiabatic shear band, is deduced from the strain gauge records as well. When failure oc-curs by a tensile crack propagating at an angle of about -70° with respect to the ligament,the distance between the advancing crack tip and the strain gauge becomes larger (seeFig. 10) and the strain gauge signal in turn will decrease. On the other hand, when failureoccurs by an adiabatic shear band propagating almost in the direction of the ligament -more precisely at an angle of a few degrees in the positive direction with respect to theligament - the adiabatic shear band propagates directly towards the strain gauge (see Fig.10), i.e. the distance between the tip of the advancing shear band and the strain gaugebecomes smaller and the strain gauge signal in turn will increase. These characteristics ofthe strain gauge record for times at and after instability represent clear indications notonly of the time of onset of failure but also on the type of failure (in addition to directobservations).
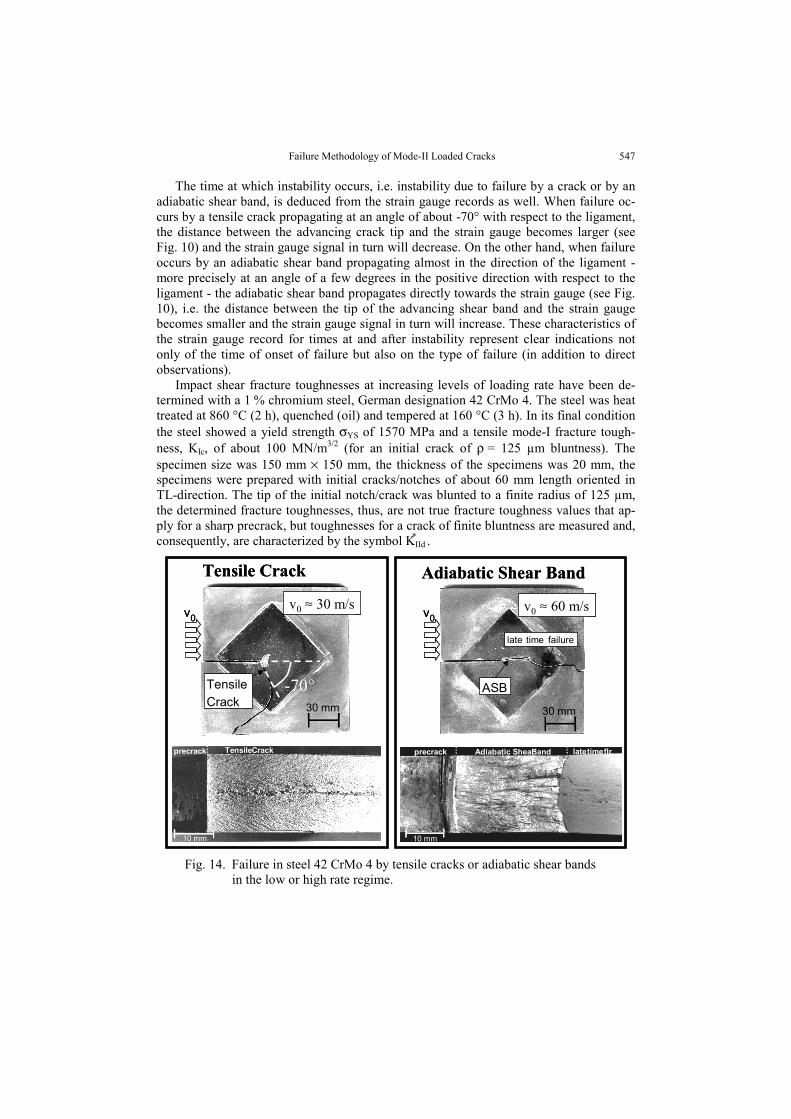
Impact shear fracture toughnesses at increasing levels of loading rate have been de-termined with a 1 % chromium steel, German designation 42 CrMo 4. The steel was heattreated at 860 °C (2 h), quenched (oil) and tempered at 160 °C (3 h). In its final conditionthe steel showed a yield strength σYS of 1570 MPa and a tensile mode-I fracture tough-ness, KIc, of about 100 MN/m3/2 (for an initial crack of ρ = 125 µm bluntness). Thespecimen size was 150 mm × 150 mm, the thickness of the specimens was 20 mm, thespecimens were prepared with initial cracks/notches of about 60 mm length oriented inTL-direction. The tip of the initial notch/crack was blunted to a finite radius of 125 µm,the determined fracture toughnesses, thus, are not true fracture toughness values that ap-ply for a sharp precrack, but toughnesses for a crack of finite bluntness are measured and,consequently, are characterized by the symbol KIId
* .
v0 ≈ 60 m/s
ASB
v0
10 mm10 mm
Tensile Crack Adiabatic Shear Band
v0 ≈ 30 m/sv0
-70°30 mm 30 mm
late time failure
precrack Adiabatic ShearBand latetimeflr.precrack
TensileCrack
TensileCrack
v0 ≈ 60 m/s
ASB
v0
10 mm10 mm
Tensile Crack Adiabatic Shear Band
v0 ≈ 30 m/sv0
-70°30 mm 30 mm
late time failure
precrack Adiabatic ShearBand latetimeflr.precrack
TensileCrack
TensileCrack
Fig. 14. Failure in steel 42 CrMo 4 by tensile cracks or adiabatic shear bandsin the low or high rate regime.

548 J. F. KALTHOFF
Typical results from the series of experiments with impact velocity ranging from 20m/s to 90 m/s are given in Fig. 14. Failure paths and failure surfaces are shown on the lefthand side of the figure for a low rate experiment (30 m/s impact velocity) and on the righthand side of the figure for a high rate experiment (60 m/s impact velocity). In the low rateexperiment, failure occurs by a tensile crack propagating at an angle of about –70° withrespect to the ligament (for the beginning of the failure path); the failure surface is a typi-cal fracture surface with roughness (plus additional indications of delamination in themiddle of the specimen) and shear lips at the edges of the specimen, although small insize because of the high yield strength of the material. In the high rate experiment, failuredue to an adiabatic shear band is observed propagating almost straight in the direction ofthe ligament (more precisely in the direction of few degrees to the opposite side of theligament tensile cracks would propagate). The adiabatic shear band propagates over aconsiderable length (about 30 mm) and then is arrested. The length of the shear band atthe edges of the specimen in all cases is larger than in the middle of the specimen, a be-haviour opposite to the one observed for cracks. The failure following the adiabatic shearband is due to late time effects, e.g. due to arbitrary impact events in the catcher tank,when the specimen is decelerated. The adiabatic shear band has the typical shiny, mirror-like appearance; shear lips cannot be identified.
til initiation til initiation
SG 1 SG 2 SG 1
SG 2
SG 1 SG 2
SG 1 SG 2
Initiation
Initiation
Failure by Tensile Crack Failure by Adiabatic Shear Band
til initiation til initiation
SG 1 SG 2 SG 1
SG 2
SG 1 SG 2
SG 1 SG 2
Initiation
Initiation
Fig. 15. Strain gauge response for failure by tensile cracks and adiabatic shear bandsin steel 42 CrMo 4.
Figure 15 gives typical strain gauge signals with the strains converted to stress intensityfactors obtained in a low and a high rate test. The signals of both strain gauges SG1 andSG2 are shown. During the loading phase, a more or less constant rise of the stress intensityfactor KII results with time t. In the low rate experiment, an abrupt change of the signal to adecreasing slope is observed, indicating failure by a tensile crack. In the high rateexperiment, on the other hand, the slope of the strain gauge signal from a certain time ongets steeper, indicating failure by an adiabatic shear band. The times for these characteristicchanges of the slope represent the times of instability, i.e. of onset of failure; thecorresponding stress intensity factors represent the fracture toughness values KIId
* .

Failure Methodology of Mode-II Loaded Cracks 549
Fig. 16. Dependence of shear fracture toughness from loading ratefor failure mode transition in steel 42 CrMo 4.
The shear mode-II fracture toughnesses measured as function of loading rate are shownin Fig. 16. Depending on which failure mode gets activated a different rate dependence isobserved. For failure by tensile cracks which is obtained in low rate tests for loading rates
IIK < 7 ⋅ 106 MNm-3/2s-1, the shear mode-II fracture toughness K*IId decreases with loading
rate, a behaviour as it is regularly observed for mode-I loading as well. But, for failure byadiabatic shear bands, which results in the high rate tests for loading rates IIK > 7 ⋅ 106
MNm-3/2s-1, the shear mode-II fracture toughness K*IId shows an increasing trend with load-
ing rate. The change between the two failure modes is not abrupt, a transition regime is ob-served for which the one or the other failure mode can become activated. There is no jumpof the shear mode-II fracture toughness in this transition regime, the two curves overlapwith their individual tendencies maintained. Data on specimens with different crack/notchtip bluntness show an equivalent behaviour [16].
The decreasing trend of the fracture toughness with loading rates for crack failure iscertainly due to the regular strain rate hardening effects: with increasing loading rate theyield strength of the material increases, i.e. the resulting plastic zone at the crack tip andin turn the fracture toughness decreases. The increasing trend of the fracture toughnesswith loading rate for failure by adiabatic shear bands is speculated to be caused by ther-mal softening effects which are a result of the adiabatic conditions and extreme increasesin temperature that control the process of adiabatic shear band failure: yielding of thematerial and plasticity effects become more pronounced which dissipate more energy,and thus, result in higher fracture toughness values with increasing loading rate. The pro-cesses in detail are more complicated in nature of course. Figure 17 shows micrographsof regions underneath the failure surfaces formed by a tensile crack and by an adiabaticshear band. In the case of failure by the tensile crack, the base material with its charac-teristic structure extends completely up to the failure surface. In the case of failure by theadiabatic shear band, the extreme heating effects result in phase transformations of theshear band zone adjacent to the failure surface which are accompanied by an increase ofthe hardness of the material.

550 J. F. KALTHOFF
ASB-SURFACE
FRACTURE SURFACE
martensitic structure
transf. struct.
martensiticstructure
15 µm15 µm
Microhardness
Dis
tanc
e to
ASB
, µm
a) b)
ASB-SURFACE
FRACTURE SURFACE
martensitic structure
transf. struct.
martensiticstructure
15 µm15 µm
Microhardness
Dis
tanc
e to
ASB
, µm
a) b)
Fig. 17. Transformation of the microstructure and increase in micro-hardness in the vicinityof an adiabatic shear band (b) compared to the behaviour near a fracture surface (a).
SUMMARY AND CONCLUSIONS
The presented results show that the failure behaviour of mode-II loaded cracks is verydifferent and far more complicated than the failure behaviour of mode-I loaded cracks:
1) Mode-II crack tip plastic zones are considerably larger than equivalent mode-Icrack tip plastic zones, and, therefore, the in-plane dimensions of mode-II testpieces have to be considerably larger than for mode-I cases to fulfill the conditionsof linear-elastic or small scale yielding conditions.
2) The instability process of mode-II loaded cracks is very different from the one ofmode-I loaded cracks: in the mode-II case, a notch is formed between the initiatedkinked crack and the original mother crack at which a compressive stress concen-tration builds up. The energy for building up this stress concentration field is takenfrom the energy field around the mode-II loaded mother crack and, thus, is notavailable for propagation of the initiated kinked crack. Despite of this effect, thestrain energy release rate of a mode-II initiated crack is considerably higher thanof an equivalent mode-I initiated crack, since the energy density of a mode-IIcrack tip stress field is much higher than of an equivalent mode-I crack tip field.
3) When mode-II loading of a crack is applied dynamically, a failure mode transitionis observed when the loading rate exceeds a certain limit value: at low loadingrates a kinked tensile mode-I crack is initiated propagating at an angle of about70° with respect to the ligament, at high loading rates above a certain limit valuefailure by an adiabatic shear band is initiated, propagating practically in the direc-tion of the ligament.
4) The shear mode-II fracture toughness KIId decreases with loading rate when failureoccurs by tensile cracks; but, it increases with loading rate when failure results byadiabatic shear bands.

Failure Methodology of Mode-II Loaded Cracks 551
The established findings show that a generalization of the mode-I case to a mode-IIcase is not possible on principle grounds, it can lead to erroneous results; only the mode-II case which is more general in nature can be reduced to the simpler mode-I case.
REFERENCES
1. Kalthoff, J.F., Failure Methodology of Mode-II Loaded Cracks, Int. J. on Complexity and Frontiers inStrength and Fracture, to be published
2. ASTM E399-90, Standard Test Method for Plane-Strain Fracture Toughness of Metallic Materials, AmericanSociety for Testing and Materials, Annual Book of ASTM Standards, Vol. 03.01, Philadelphia, pp. 412.
3. Hiese, W. and Kalthoff, J.F. (1998) Determination of Valid Mode-II Fracture Toughnesses KIIc, Mixed-ModeCrack Behavior, ASTM STP 1359, (McDowell, D.L. and Miller, K.J., Editors), American Society for Testingand Materials, West Conshohocken, PA, pp. 74.
4. Hiese, W. (1999) Gültigkeitskriterien zur Bestimmung von Scherbruchzähigkeiten (Validity Criteria forDetermining Shear Fracture Toughnesses), Dissertation, Ruhr-Universität Bochum, Germany.
5. Banks-Sills, L. and Arcan, M. (1983) An Edge-Cracked Mode II Fracture Specimen, ExperimentalMechanics, vol.23, pp. 257.
6. Richard, H.A. (1981) Eine Bruchmechanikprobe zur Bestimmung von KIIc-Werten (A FractureMechanics Specimen for Determining KIIc-Values), Schweißen und Schneiden, vol.33, pp. 606.
7. Podleschny, R. (1995) Untersuchungen zum Instabilitätsverhalten scherbeanspruchter Risse (On the In-stability Behavior of Shear Loaded Cracks), Dissertation, Ruhr-Universität Bochum, Germany.
8. Podleschny, R. and Kalthoff, J.F. (1994) A Novel Mode-II Fracture Criterion, Proc. 10th EuropeanConference on Fracture, Structural Integrity: Experiments, Models and Applications, (Berger, C. andSchwalbe, K.-H., Editors), Engineering Materials Advisory Services Ltd., West Midlands, UK, pp. 211.
9. Kalthoff, J.F. (1993) Shadow Optical Method of Caustics, Chapter 9, In Handbook on Experimental Me-chanics, (Kobayashi, A.S., Editor), Second Revised Edition, VCH Publishers, New York, pp. 407.
10. Klepaczko, J.R. (1982) Discussion of a New Experimental Method in Measuring Fracture Initiation Tough-ness at High Loading Rates by Stress Waves, J. Engng. Mat. and Tech., Trans ASME, vol.104, pp. 29.
11. Kalthoff, J.F. (1986) Fracture Behavior Under High Rate Loading, Engineering Fracture Mechanics,vol.23 Special Issue on Dynamic Fracture Mechanics, pp. 289.
12. Kalthoff, J.F. and Winkler, S. (1988) Failure Mode Transition at High Rates of Shear Loading, Proceed-ings of the International Conference on Impact Loading and Dynamic Behavior of Materials (Chiem,C.Y., Kunze, H.-D. and Meyer L.W., Editors), Deutsche Gesellschaft für Metallkunde, DGM-Verlag,Oberursel, pp. 185.
13. Kalthoff, J.F. (1990) Transition in the Failure Behaviour of Dynamically Shear Loaded Cracks, Pro-ceedings of the 11th U.S. National Congress of Applied Mechanics (Chen, D.F., Editor), Tuscon, Arizona,May 21-25 1990, also Applied Mechanics Review, vol.43, pp. 247.
14. Kalthoff, J.F. (2000) Modes of Dynamic Shear Failure in Solids, International Journal of Fracture,vol.101, pp. 1.
15. Bai, Y. and Dodd, B. (1992) Adiabatic Shear Localization - Occurrence, Theories and Applications,Pergamon Press, Oxford
16. Bürgel A. (2000) Bruchmechanische Kennwerte beim Wechsel im Versagensverhalten dynamisch scher-beanspruchter Risse (Fracture Mechanics Properties for Failure Mode Transition of Dynamically ShearLoaded Cracks), Dissertation, Ruhr-Universität Bochum, Germany.
17. Kalthoff, J.F. and Bürgel, A. (2001) Influence of Loading Rate on Shear Fracture Toughness for FailureMode Transition, Proceedings of the 10th Conference on Fracture, (Ravi-Chandar, Editor), Elsevier Sci-ence, Oxford, UK, 1096.
18. Dally, J.W. and Sanford, R.J. (1987) Strain-Gage Methods for Measuring the Opening-Mode Stress In-tensity Factor KI , Exp. Mech., vol.27, pp. 381.
19. Bürgel, A., Shin, H.S., Bergmannshoff, D. and Kalthoff, J.F. (1999) Optimization of the Strain-Gauge-Method for Measuring Mode-II Stress Intensity Factors, Proc. VII. Bilateral Czech/German Symposium:Significance of Hybrid Method for Assessment of Reliability and Durability in Engineering Sciences,13.-15. April 1999 Liblice, Czech Republic, pp. 11.

552 J. F. KALTHOFF
METODIKA LOMA OPTEREĆENIH PRSLINA MODA IIJörg F. Kalthoff
Razmatraju se različiti aspekti ponašanja pri lomu koji započinju iz opterećenih prslina modaII: kriterijumi validnosti i minimalni prohtevi veličine uzorka za merenje žilavosti loma KIIc;ravnoteža energije procesa inicijacije uvojitih prslina uključujući kompresivne koncentracijenapona vrhova ureza; prelaz moda loma sa tegljivih prslina na adijabatske smicajne trake privisokim stopama opterećenja; zavisnost stope opterećenja dinamične žilavosti loma KIId u režimuprelaza moda loma. Prikazani su nalazi studija na ove teme, i razmotrene implikacije rezultata zapraktične primene. Utvrdjeno je da je ponašanje pri lomu opterećenih prslina moda II veomadrugačije i daleko složenije od opterećenih prslina moda I, tako da uopštavanja sa moda I na modII mogu dovesti do jako velikih grešaka.


![PARAMETERS AFFECTING THE DYNAMIC RESPONSE OF LIGHT …facta.junis.ni.ac.rs/macar/macar2000/macar2000-16.pdf · mention the extended review reported by Fryba [15] in his excellent](https://img.pdfslide.us/doc/110x75/5e7846d44184ff2dde148daa/parameters-affecting-the-dynamic-response-of-light-factajunisniacrsmacarmacar2000macar2000-16pdf.jpg)