Embed Size (px)
Citation preview
FACTA UNIVERSITATISSeries: Mechanics, Automatic Control and Robotics Vol.3, No 12, 2002, pp. 443 - 455
STRESS STATE AND DEFORMATION (STRAIN) ENERGYDISTRIBUTION AHEAD CRACK TIP
IN A PLATE SUBJECTED TO TENSION
UDC 531:620.136:620.10
Dragan B. Jovanović
Faculty of Mechanical Engineering, University of NišBeogradska 14, 18000 Niš
E-mail: [email protected]
Abstract. Three-dimensional model of the plate, with the elliptical crack contour isused for analyzing of stress state and deformation energy, in this paper. It is assumedthat tensile forces are applied at the direction perpendicular on the crack plane, andthat stress state is two-dimensional in general (in remote regions). Three-dimensionalstress state at the vicinity of crack front zone is evaluated by using of finite elementmethod. Evidently, variation of stress tensor components is related to the coordinateperpendicular to the middle plane of the plate, and σz is different from zero at theregion nearby around the crack.In this paper obtained results on stress and deformation (strain) energy distribution areanalyzed, and conclusions about the three-dimensional stress state and three-dimensional energy distribution in the region close to crack front line are obtained.
Key words: crack, stress state, specific deformation (strain) energy, reconstruction ofdeformation (strain) energy surfaces.
1. INTRODUCTION, FRAMEWORK
The conventional plate theories assume that the stress variations in terms of thethickness coordinate are known as a priori [14], [26], and [27]. For plane stress state, thetransverse normal stress component σz is assumed to be zero throughout the plate, and in-plane stresses σx, σy and τxy are independent on thickness coordinate [1], [4], [15]. Theseassumptions are valid under very limited circumstances, and in the very narrowframework [22], [23], [27], and [28].
Three-dimensional model of the plate, with the crack of elliptical contour is acceptedfor the analysis. It is assumed that axial tensile forces are applied in directionperpendicular to the crack plane, and that general stress state in plate is two-dimensional.Three-dimensional stress state at the crack tip zone by using of finite element method is Received February 5, 1999, in revised form June 15, 2002

444 D. B. JOVANOVIĆ
evaluated. Evidently varying of stress tensor components is related to the coordinateperpendicular to the middle plane of the plate and σz is different from zero in the regionaround the crack.
Diagrams of stress components, in sections x=0, y=0 and z=0 are presented. Strainenergy for directions y = 0, z = 0,±1,±2,±3,±4,±5 mm and z = 0, x = 0, 2.3, 3.35, 4.5,6.15, 7.03, 9.3, 10,76, 14.4, 20.93, 25, 30.32, 35, 40, 45, 48,5 mm is calculated. Surfaceof the strain energy for points in the middle plane and plane perpendicular to it, in frontof the crack tip, by using relations for strain energy, best fitting curve, best fitting surface,and iteration procedure is reconstructed. Variation of stress components and distributionof strain energy three-dimensionally related in the region close to crack is obtained.However, at the most part of the plate is "undisturbed state" where strain energy hasconstant value [4].
According to the Griffith theory it is assumed that cracks exist or can be initiated in asolid body when tensile stresses overpass some limiting (critical) value, or when thestrain energy release rate is higher then the rate of the energy gained by forming of cracknew free surfaces [25]. Crack is considered as a elliptical hole, where one of semi axes isclose to zero, and ellipse is degenerating to a straight slit [9], [25].
Square plate 100×100 mm, and 10 mm thick, loaded with tensile forces in y directionis taken as an example for analyzing stress state and deformation energy (strain energy)state. Elliptical hole at the middle of the plate is taken as model of Griffith crack [25].Elliptical crack presented on Fig. 1 has semi-major axis a = 5 mm and semi-minor axisb = 0.5 mm. As material of the plate is taken polyester Palatal P-6 with Young's elasticitymodulus E = 4460 N/mm2 and Poisson's ratio ν =0.38.
Cartesian coordinates x, y and z with origin in the middle of the plate are used. So,coordinate x is varying between −50 mm and +50 mm, y is varying between −50 mm and+50 mm, and z is varying from −5 mm and up to +5 mm. Remote load is regularlydistributed on the edge side of the plate and it has value q = 1 N/mm2. Direction ofloading force is in y - direction and it is perpendicular to the semi-major axis of theelliptical crack. Scheme of the plate with crack and loading is presented on Fig. 1.
crack tip front
Fig. 1. Scheme of the plate with crack Fig. 2. Three-dimensional meshand loading of finite elements

Stress State and Deformation (Strain) Energy Distribution Ahead Crack Tip in a Plate Subjected to Tension 445
2. STRESS DISTRIBUTION
Analytical methods like Williams polynomial method, and Westergaard's method aredetermining the stress components like two-dimensional stress state is valid even close tothe crack tip, what is in disagreement with physical reality. It is possible to obtainanalytical solution for stress state in a cracked plate by using Mushelishvili method [1],[5], [6], [7], [8], [9], and [10], but it is valid only in plates where two-dimensional stressstate is omnipresent. Experimental experience shows evidently three-dimensional stressstate on the crack tip [17], [18], [19], [20].
For determination of the stress tensor components in the vicinity of an elliptical crackthe finite element method is used. Three-dimensional mesh of finite elements isgenerated, as it is presented on Fig. 2. It is generated manually in this way to simulatehyperbolic-elliptical coordinate system. Standard isoparametric, eight node brickelements are employed, precluding any erroneous to the imposition of an incorrectsingularity [15].
By taking selected sections and directions it is determined distribution of normal andshear stresses for x, y and z-axes in the selected points of the plate. Stress distribution forplane z = 0 or the middle plane of the plate is determined.
Under given loading conditions, crack has tendency to increase semi-minor axis b,and to decrease semi-major axis a, of elliptical contour, or by common words to increaseopening.
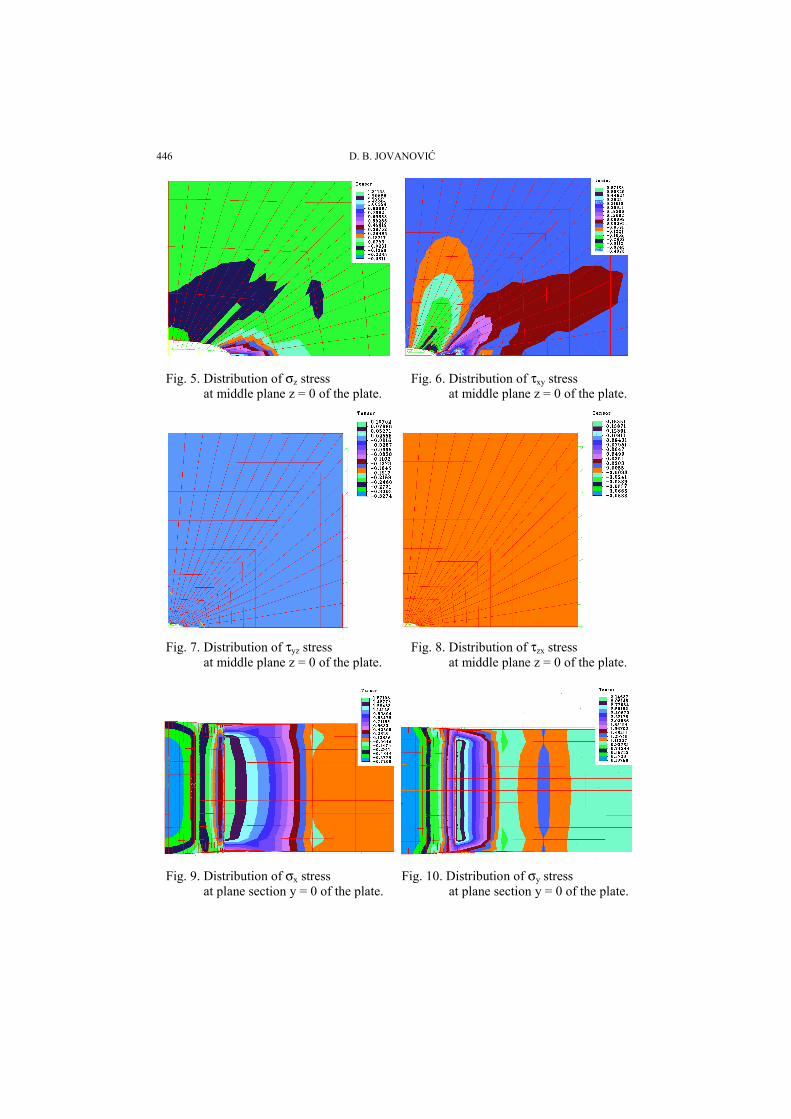
Stress components σx, σy, σz, τxy, τyz, and τzx, at middle plane z = 0 of the plate, in theregion close to crack, are presented in Figures 3, 4, 5, 6, 7, and 8.
Stress components σx, σy, σz, τxy, τyz, and τzx, at plane section y = 0 of the plate, in theregion close to crack, are presented in Figures 9, 10, 11, 12, 13, and 14. Previous twosection planes are perpendicular to each other. Hence, stress components have equalvalues in direction y = 0, z = 0.
Fig. 3. Distribution of σx stress Fig. 4. Distribution of σy stressat middle plane z = 0 of the plate. at middle plane z = 0 of the plate.
446 D. B. JOVANOVIĆ
Fig. 5. Distribution of σz stress Fig. 6. Distribution of τxy stressat middle plane z = 0 of the plate. at middle plane z = 0 of the plate.
Fig. 7. Distribution of τyz stress Fig. 8. Distribution of τzx stressat middle plane z = 0 of the plate. at middle plane z = 0 of the plate.
Fig. 9. Distribution of σx stress Fig. 10. Distribution of σy stressat plane section y = 0 of the plate. at plane section y = 0 of the plate.

Stress State and Deformation (Strain) Energy Distribution Ahead Crack Tip in a Plate Subjected to Tension 447
Fig. 11. Distribution of σz stress Fig. 12. Distribution of τxy stressat plane section y = 0 of the plate. at plane section y = 0 of the plate.
Fig. 13. Distribution of τyz stress Fig. 14. Distribution of τzx stressat plane section y = 0 of the plate. at plane section y = 0 of the plate.
Diagrams of the stress components σx, σy, σz, τxy, τyz, and τzx, for y = 0 and z = 0 arepresented in Fig. 15, for y = 0 and z = 2 mm are presented in Fig. 16, for y = 0 andz = 4 mm are presented in Fig. 17, for x = 0 and z = 0 are presented in Fig. 18, forx = 4.5 mm and z = 0 are presented in Fig. 19, and for x = 7.028 mm and z = 0 arepresented in Fig. 20. It is visible on Fig. 15, 16, and 17 that the highest values of σx, σy,σz and τxy are on the crack tip front, and that τxy changes sign on about one platethickness from the crack tip. For direction x = 0 and z = 0 in Fig. 18 is visible that σx, andσz have sign minus in the region close to the crack edge up to 0.7 of the plate thicknessfor σx, and 0.5 of the plate thickness for σz . Stress component σy has increasing valuefrom zero at the edge of crack up to value 1 N/mm2 on distance 2.5 plate thickness fromthe crack edge. Stresses σx, σz and τxy are changing sign at the region in front of crack, asit is visible in Fig. 19 and Fig. 20.

448 D. B. JOVANOVIĆ
Fig. 15. Distribution of the stress Fig. 16. Distribution of the stresscomponents for y = 0 and z = 0. components for y = 0 and z = 2 mm.
Fig. 17. Distribution of the stress Fig. 18. Distribution of the stress componentscomponents for y = 0 and z = 4mm. for x = 0 and z = 0.
Fig. 19. Distribution of the stress Fig. 20. Distribution of the stress componentsfor x = 4.5 mm and z = 0. for x = 7.028 mm and z = 0.

Stress State and Deformation (Strain) Energy Distribution Ahead Crack Tip in a Plate Subjected to Tension 449
3. DISTRIBUTION OF THE DEFORMATION (STRAIN) ENERGY
When the elastic body is loaded, the work done by the applied forces is stored as aform of potential energy, which is frequently referred to as "strain energy" or, "elasticenergy", or "deformation energy". If the body contains a crack, and that crack grows by asmall amount under the applied loading conditions, the deformation energy stored in thebody will be changed.
Specific deformation (strain) energy is calculated by using data from diagrams ofstress tensor components presented on previous figures (see Fig.15 - 20), whereinterpolation and smoothing of stress function is previously done. For calculation ofstrain energy in selected characteristic directions FORTRAN program named "Defen" iscreated. Expression (1) well known in theory of elasticity [4], [11], [15], [27] is used.
)])(1( 2)( 2)[(E2
1 A 2zy
2zx
2yxzyzxyx
2z
2y
2xdef τ+τ+τν+⋅+σσ+σσ+σσν⋅−σ+σ+σ
⋅=′ (1)
Diagram of specific deformation energy (energy of elastic deformation per unit ofvolume) for direction y = 0, z = 0 is presented in Fig. 21. Diagrams of specific deformationenergy for directions x = 0, z = 0, and z = 0, x = 2.3, 4.5, 10.76 are presented in Fig. 22, 23,24, 25 respectively.
Fig. 21.Distribution of specific deformation Fig. 22. Distribution of specific deformation(strain) energy for direction y = 0, z = 0. (strain) energy for direction x = 0, z = 0.
Fig. 23.Distribution of specific deformation Fig. 24. Distribution of specific deformationenergy for direction z = 0, x = 2.3 mm. energy for direction z = 0, x = 4.5 mm.

450 D. B. JOVANOVIĆ
Fig. 25.Diagram of specific deformation energy Fig. 26.Reconstructed surface of thefor direction z = 0, x = 10.76 mm. specific deformation (strain) energy
F = F(x,z) for plane y = 0.
By using data from diagrams of the specific deformation energy for various directionsand by gridding, and smoothing the surfaces which are presenting distribution of specificdeformation energy in planes z = 0, F = F(x,y), and y = 0, F = F(x,z) are reconstructed.Surface of the specific deformation energy F = F(x,z) for plane 0y = is presented in Fig. 26.
Fig. 27.Diagram of specific deformation energy Fig. 28.Reconstructed surface of theat the crack tip front specific deformation (strain) energyx = 4.5 mm, y = 0. F = F(x,z) for plane z = 0.
It is visible that peaks of the deformation energy are on the crack front. Specificdeformation energy is A'def = 2230⋅10−3 J/mm3 at the distances higher than one platethickness, and it is distance of undisturbed area. Diagram of specific deformation energyat the crack tip front 0y,mm5.4x == is presented in Fig. 27. The higher value ofdeformation energy is close to the plate, surfaces z = ±5 mm, and it isA'def = 17261.2⋅10−3 J/mm3 for z = ±4 mm. From that values deformation energy isdecreasing by parabolic function, and when we are going to the middle of the plate, it hasvalue A'def = 14517.6⋅10−3 J/mm3 for z = 0. It is visible on Fig. 28 that distribution of

Stress State and Deformation (Strain) Energy Distribution Ahead Crack Tip in a Plate Subjected to Tension 451
strain energy resulted with high value of energy in front of crack tip, where the peak ofenergy stored in material exists. It is visible on Fig. 26 as well as on Fig. 27 that specificdeformation (strain) energy is increasing from middle plane 0z = to front and back freesurface of the plate, and that peaks of energy are close to free surfaces off the plate. Thisis observed only in region close to the crack front, up to distance of about 0.25 of platethickness, from the crack front. This results are consistent with results of Sih G. C., LeeY. D., [23] and their comment: "The inability of the elasticity theory to account forsurface effects were not recognized and frequently left unexplained with the impressionthat they could be attributed to numerical inaccuracies". (Compare Fig. 26 and 27 withFig. 11 in reference [23]). "The volume energy in Fig. 11 [23] at z ≈ 0.233 cm becameeven higher than at the mid-plane z = 0. This is contrary to physical intuition where thelargest volume energy density should occur inside the plate, not near the surface. Thesuccess of this investigation lies not only in completing the three-dimensional finiteelement analysis but even more important is in understanding the near boundarybehaviour of the elasticity solution that may not agree with physical intuition because itneglects the interaction of surface and volume effects [23]".
Values of deformation energy normalized to general level of deformation energyA'def = 2230⋅10−3 J/mm3 and with normalized coordinates z are given in Tab. 1.
Tab. 1. Specific deformation energy and normalized specific deformation energyat the crack tip front x = 4.5 mm, y = 0
z Specific def. energyA'def [10−3 J/mm3]
Normalized specificdef. energy def'A
0.8 17261.2 7.740.6 15446.2 6.930.4 14801 6.640.2 14558.1 6.530.0 14517.6 6.51
Surface of the specific deformation energy F = F(x,y) for plane z = 0 is presented onFig. 28. It is visible in Fig. 28 that redistribution of deformation energy resulted with highenergy on crack front, where is peak of the "mountain of energy". On the other side thereis valley, with energy level lower than general (or global) energy level 1Adef = . Thebottom of the valley has 185.0Adef = .
Depression of energy level is up to three plate thickness from the crack edge indirection of y-axis, as it is presented by diagram in Fig. 22.
It is clear that each material has (limiting or critical) energy level that observedmaterial could tolerate without braking of inter-atomic or inter-molecular bonds. Thatmeans, crack will not propagate if critical energy level is not overpassed. By usingexperimental procedure it is possible to determine critical energy level (CEL) for everymaterial, and for all typical general stress states [19], [20].
Value of CEL can be used as criteria in determination of strength of materials andconstructions to the process of crack development. Critical level of specific deformationenergy is also important inherent characteristic of material.

452 D. B. JOVANOVIĆ
4. COEFFICIENT OF ENERGY REDISTRIBUTION
If we establish ratio of peak value of specific deformation energy on the crack frontagainst general value of specific deformation (strain) energy, this value could be named "coefficient of energy increasing":
)G(def
)P(defI A
AC
′′
= (2)
where:A'def(P) - is peak value of specific deformation energy, and A'def(G) - is general value of
specific deformation energy.On the other side at the region of valley, energy is decreasing under the general level.
There, relation between bottom value of energy and general energy level could be named" coefficient of energy decreasing":
)G(def
)B(defD A
AC
′′
= (3)
where: A'def(B) - is bottom value of specific deformation energy.Relation between coefficient of energy increasing CI , and coefficient of energy
decreasing CD gives third coefficient which could be named coefficient of energyredistribution CR .
D
IR C
CC = (4)
It is clear that coefficient of energy redistribution depends on crack geometry(relations between crack length, thickness of the plate, radius of the curvature on thecrack tip, shape of the crack etc.), and it depends also on general stress state at thesurrounding of the crack. Higher value of coefficient of energy redistribution means thatconcentration of energy at the crack tip is higher.
By using simple experiment can be determined coefficients CI , CD and CR fordifferent crack parameters as useful tool for engineers.
5. LOCAL EFFECT OF THE CRACK
Analysis in this work shows that influence of the crack on the general stress state andenergy state is local, and in the presented example local effect takes place up to one platethickness from the crack tip. In other direction perpendicularly to crack length decreasingof energy happens up to three plate-thickness from the crack. On Fig. 15, 16, 17, 18, 19,20, is visible that changing of stresses takes effect only in region of crack. Evidently thatphenomenon of crack results at local changing of stress state, and local distribution of thespecific deformation energy, at the region close to the crack.
General stress state in plate can be described by using well-known analytical solutionsfor plane stress state, generalized plane stress state and bending of plates [4], [27].Meanwhile, at the region of crack exist three-dimensional stress state and three-dimensional distribution of specific deformation energy.

Stress State and Deformation (Strain) Energy Distribution Ahead Crack Tip in a Plate Subjected to Tension 453
It would be the next step to introduce function of local three-dimensional stressredistribution DS , and function of local three-dimensional specific deformation energyredistribution DE .
Local function depends on three coordinates:
)z,y,x(EE DD = (5)
So, distribution of specific deformation energy is:
A'def = DE(x,y,z)⋅A'def R (6)
Where A'def R - is general value of specific deformation energy, when crack does notexist.
Function DE(x,y,z) is undimensional:
RD
def
defE 'A
'A)z,y,x( = (7)
and it gives local distribution of deformation energy.
6. CONCLUSIONS
This paper presents stress state at the surrounding of an elliptical hole in elastic plate.From the diagrams of the stress components is visible that stress state is three-dimensional close to the crack. Normal stress σz is different than zero on distance up tothree quarters of the plate thickness from the crack front at the direction of crackpropagation and up to half of the plate thickness at the direction perpendicular to crack. Itis also visible that stresses σx, σy, σz are depending on coordinate z up to one platethickness from the crack front at the crack direction. Specific deformation energy iscalculated at second step, and at the third step surfaces which are presenting distributionof the specific deformation energy are reconstructed. From these diagrams and surfaceswhich are presenting specific deformation energy is visible that crack is initiatingredistribution of the deformation energy at the surrounding. Deformation energy isincreasing up to one plate thickness in front of the crack tip at the direction of the crack,and decreasing up to three plate-thickness at direction perpendicular to the middle of thecrack. Reconstructed specific energy surfaces are presenting visually, how crackinfluence deformation energy distribution at the plane stressed plate. Regions of the platefurther from the crack remind undisturbed and deformation energy is clearly constant.Also, stress state on distance further than one plate thickness is evidently two-dimensional, and stresses are independent of thickness coordinate. This gives usopportunity to draw conclusion that influence of the crack is evidently local and the restof the plate stays "undisturbed". This analysis is suggesting that analytical solutionsshould be locally three-dimensional.
Introduction of three-dimensional function that is presenting disturbing influence ofthe crack to stress state and distribution of deformation energy of the plate, could beappropriate direction to look forward.
Acknowledgment. This research supported by Science Ministry of Serbia, grant number 04M03A throughMathematical Institute SANU, Belgrade. The author is grateful to Professor Dr. Katica Hedrih for her valuablesuggestions.

454 D. B. JOVANOVIĆ
REFERENCES
1. England A., (1971), Complex variable Methods in Elasticity, London. 2. Gdoutos E. E., Fracture Mechanics, Kluwer Academic Publishers, Dordrecht, 1993 3. Gdoutos E. E., Problems of mixed mode crack propagation, Martinus Nijhoff Publishers, Kluwer
Academic Publishers, The Hague, 1984 4. Hedrih K., (1988), Izabrana poglavlja Teorije elastičnosti, Mašinski fakultet, Niš 5. Hedrih K., Jecić S., Jovanović D., (1990), Glavni naponi u tačkama konture eliptično-prstenaste ploče
ravno napregnute parovima koncentrisanih sila, Mašinstvo br. 39, Beograd 6. Hedrih K., Jovanović D., (1990), Primena funkcije kompleksne promenljive i konformnog preslikavanja
za određivanje eliptično-hiperboličkih koordinata tenzora napona ravno napregnutih ploča, XIXJugoslovenski kongres teorijske i primenjene mehanike, Ohrid
7. Hedrih K., Jovanović D., The stress state of the elliptical-annular plate by the complex variable functionand conformal mapping method, 15 str., 73-87, časopis, Teorijska i primenjena mehanika, br. 17,Jugoslovensko društvo za mehaniku, Beograd, 1991.
8. Hedrih K., Jovanović D., The strain state of the elliptical - annular plate by the complex variablefunction and conformal mapping method, 17 str., 29-45, časopis, Teorijska i primenjena mehanika, br.21, Jugoslovensko društvo za mehaniku, Beograd, 1995.
9. Hedrih K., Jovanović D., Stress state around elliptical cracks in elastic plates, Internationalminisymposium MF Recent Advances in Fracture and Damage Mechanics, Zbornik radova, Str. 153-157,YUCTAM Vrnjačka Banja, 1997
10. Jovanović D., (1990), Primena metode fotoelastičnosti za ispitivanje naponskog stanja eliptično-prstenaste ploče opterećene koncentrisanim silama, XIX Jugoslovenski kongres teorijske i primenjenemehanike, Ohrid
11. Kojić M., (1975), Teorija elastičnosti, Mašinski fakultet, Kragujevac 12. Love A.E.H., (1952), A Treatise on Mathematical Theory of Elasticity, Cambridge and University Press,
Cambridge 13. Milne - Thompson L. M., (1960), Plane elastic Systems, Gottingen-Heildelberg, Springer, Berlin 14. Mushelishvili N.I., (1953), Some Basic problems of the Mathematical Theory of Elasticity, P. Noordhof
LTD., Groningen - Holland. 15. Parsons I. D., Hall J. F., Rosakis A. J., A Finite Element Investigation of the Elastostatic State Near a
Three Dimensional Edge Crack, SM Report 86-29, Division of Engineering and Applied Science,California Institute of Technology, Pasadena, California, 1986
16. Rašković D., (1985), Teorija elastičnosti, Naučna knjiga, Beograd. 17. Pindera J. T., Three-Dimensional Stress Analysis of Composite Structures Using Isodyne Techniques,
Polymer Composites, Vol. 10, No. 5, 270-284, October 1989 18. Pindera J. T., and Wen B., Isodyne Evaluation of Three-Dimensional Stresses in Standard Compact
Specimen, SEM Spring Conference on Experimental Mechanics, Proceedings, 895-902, June,Milwaukee, Wisconsin, 1991
19. Pindera J. T., Josepson J. and Jovanović D.B., Electronic Techniques in Isodyne Stress Analysis: Part 1.Basic Relations, Experimental Mechanics, Vol. 37, No. 1, 33-38, March 1997
20. Pindera J. T., Josepson J. and Jovanović D.B., Electronic Techniques in Isodyne Stress Analysis: Part 2.Illustrating Studies and Discusion, Experimental Mechanics, Vol. 37, No. 2, 106-110, June 1997
21. Sedmak S. Uvod u mehaniku loma i konstruisanje sasigurnošću od loma, monografija, SmederevskaPalanka, Goša-TMF Beograd, 1980
22. Sih G. C., Mechanics of Fracture Initiation and Propagation, Kluwer Academic Publishers, Dordrecht,1990
23. Sih G. C., Lee Y. D., Review of Triaxial Crack Border Stress and Energy Behavior, Theroretical andApplied Fracture Mechanics, No. 12, pp. 1-17, Elsevier Science Publishers, B. V., 1989
24. Shedon J. S. and Very D. S., (1958), The Classical Theory of Elasticity, Hand-Buch der Physik, S. Fluge,Band VI, Springer Verlag
25. Sneddon, I. N., Lowengrub, M., Crack Problems in the Classical Theory of Elasticity, John Wiley &Sons, Inc., New York, 1969
26. Sokolnikoff I. S., (1956), Mathematical Theory of Elasticity, McGraw Hill Book Company, London. 27. Timoshenko S. P. and Goodier J. N., (1951), Theory of Elasticity, New York 28. Theocaris P. S., The Minimum Elastic Strain Energy Criterion for Mode I and II Fractures, Proc. of
Symp. on Absorbed Spec. Energy / Strain Energy Density Criterion, pp. 17-32, Budapest, Hungary, 1980

Stress State and Deformation (Strain) Energy Distribution Ahead Crack Tip in a Plate Subjected to Tension 455
STANJE NAPONA I RASPORED ENERGIJE DEFORMACIJE(DILATACIJE) ISPRED VRHA PRSLINE
U PLOČI IZLOŽENOJ ZATEZANJUDragan B. Jovanović
U ovom radu je korišćen trodimenzionalni model ploče sa eliptičnom prslinom za analizustanja napona i energije deformacije. Pretpostavljeno je dejstvo zatežućih sila u pravcu upravnomna ravan prsline i ravno stanje napona kao opšte (u području udaljenom od prsline).trodimenzionalno stanje napona Ustanovljeno je korišćenjem metode konačnih elemenata da uoblasti prsline vlada trodimenzionalno stanje napona. Promena komponenti tenzora napona je ufunkciji koordinate upravne na srednju ravan ploče i σz je različito od nule u oblasti neposrednooko prsline.
U radu su analizirani dobijeni rezultati o rasporedu napona i rasporedu deformacione energijei dobijeni su zaključci o trodimenzionalnom stanju napona i trodimenzionalnom rasporedu energijeu neposrednoj okolini linije fronta prsline.
Ključne reči: prslina, stanje napona, specifična energija deformacije,rekonstrukcija površina energije