Embed Size (px)
Citation preview

FACTORS THAT DETERMINE THE CONTINUANCE INTENTION OF PEOPLE
TO USE ONLINE SOCIAL NETWORKS FOR BUSINESS TRANSACTIONS
by
AKWESI ASSENSOH-KODUA
Submitted in fulfilment of the requirements of the Master of Technology degree in
Information Technology in the Department of Information Technology, Faculty of
Accounting and Informatics, Durban University of Technology, Durban, South Africa
Februry, 2014
Supervisor: Professor Oludayo O. Olugbara
Co-supervisor: Professor Thiruthlall (Nips) Nepal

ii
DECLARATION
I, Akwesi Assensoh-Kodua declare that this dissertation is a representation of my own work
both in conception and execution. This work has not been submitted in any form for another
degree at any university or institution of higher learning. All information cited from
published or unpublished works have been acknowledged.
___________________ _____________________
Student Name Date
Submission approved for examination
___________________ _______________________
Supervisor Date
iii
ACKNOWLEDGEMENTS
My greatest debt of gratitude is owed to the accounting and informatics faculty of Durban
University of Technology for allowing me to be part of the 2011 year group, especially my
supervisor, Prof. Olugbara, who bore the greatest burden of this important exercise. I wish the
whole world joins me in thanking them.
I also feel deeply indebted to all the commentaries and other sources I have used in this work
not forgetting individuals who made the minutest contribution, in various ways.
My supervisor and I will feel amply rewarded, if those who use this work as a reference kit,
channel their comments to [email protected] for future attention.
iv
TABLE OF CONTENTS
DECLARATION ....................................................................................................................... ii
ACKNOWLEDGEMENTS ..................................................................................................... iii
LIST OF FIGURES ............................................................................................................... viii
LIST OF TABLES .................................................................................................................... ix
LIST OF EQUATIONS ............................................................................................................. x
DEDICATION .......................................................................................................................... xi
PUBLICATION FROM THIS THESIS .................................................................................. xii
ABSTRACT ........................................................................................................................... xiii
CHAPTER 1: INTRODUCTION .............................................................................................. 1
1.1 Background ................................................................................................................. 1
1.2 Problem Statement ...................................................................................................... 3
1.3 Research Questions ..................................................................................................... 4
1.4 Research Aim and Objectives ..................................................................................... 5
1.5 Theoretical Frameworks .............................................................................................. 5
1.6 Study Contributions .................................................................................................... 6
1.7 Synopsis ...................................................................................................................... 6
CHAPTER 2: LITERATURE REVIEW ................................................................................... 8
2.1 Search engines and Search parameters........................................................................ 8
2.2 Evaluation and synthesis ............................................................................................. 9
2.3 Online social networking .......................................................................................... 10
2.4 Web 2.0 for Business ............................................................................................... 12
2.4.1 Doing business on Web 2.0 ..................................................................... 13
2.4.2 Business models of LinkedIn .................................................................. 14
v
2.4.3 Business model of Twitter ....................................................................... 16
2.5 Selecting an OSN Vendor for Business .................................................................... 17
2.6 Expectation-Confirmation Theory (ECT) ................................................................. 18
2.6.1 Customer satisfaction .............................................................................. 20
2.6.2 Continuance Intention ............................................................................. 21
2.6.3 Habit ........................................................................................................ 23
2.7 Theory of Socio-Cognitive Trust .............................................................................. 24
2.8 Theory of Planned Behaviour ................................................................................... 27
2.8.1 Perceived Behavioural Control ................................................................ 27
2.8.2 Social (subjective) norm .......................................................................... 29
2.9. Summary of literature findings ................................................................................. 33
2.10. Chapter summary ...................................................................................................... 35
CHAPTER 3: HYPOTHESIS DEVELOPMENTS ................................................................. 36
3.1 User satisfaction ........................................................................................................ 36
3.2 Perceived trust ........................................................................................................... 37
3.3 Social norm ............................................................................................................... 38
3.4 Perceived behavioural control .................................................................................. 39
3.5. Chapter summary ...................................................................................................... 40
CHAPTER 4: RESEARCH METHODOLOGY ..................................................................... 41
4.1 Research Design ........................................................................................................ 41
4.1.1 Model design process .............................................................................. 41
4.2 Research method ....................................................................................................... 42
4.2.1 Respondents and sampling procedure .................................................... 43
4.2.2 Surveys .................................................................................................... 43
4.2.3 Survey Model Used ................................................................................. 44
vi
4.2.4 Rationale for selected statistical Methods ............................................... 44
4.2.5 Ethical Considerations ............................................................................. 46
4.2.6 Confidentiality ......................................................................................... 47
4.3 Authenticity of the Data ............................................................................................ 47
CHAPTER 5: DATA ANALYSIS AND INTERPRETATION .............................................. 48
5.1 Research instruments development ........................................................................... 48
5.2 Data collection........................................................................................................... 49
5.2.1 Subject ..................................................................................................... 49
5.2.2 Measurement items .................................................................................. 50
5.2.3 Descriptive statistics ................................................................................ 52
5.3 Measurement model .................................................................................................. 53
5.3.1 Structural model ...................................................................................... 56
5.3.2 Hypothesis testing ................................................................................... 57
5.4 Effect size .................................................................................................................. 59
5.5 Model fit .................................................................................................................... 60
5.6 Warped and linear relationships between latent variables ........................................ 61
5.7 Moderating effects..................................................................................................... 67
5.7.1 Habit as moderating factor ...................................................................... 67
5.7.2 Interpreting moderating effects .............................................................. 70
5.8 Case for comparison and evaluation of two models ................................................. 73
5.9 Empirical findings ..................................................................................................... 75
5.10 Theoretical contributions........................................................................................... 76
5.11 Business implications ................................................................................................ 78
5.12 Limitations ................................................................................................................ 79
CHAPTER 6: SUMMARY AND CONCLUSION ................................................................. 80
vii
6.1 Summary ................................................................................................................... 80
6.2 Suggestions for further research ................................................................................ 81
6.3 Conclusion ................................................................................................................. 81
BIBLIOGRAPHY .................................................................................................................... 82
APPENDIX………………………………………………………………………………………95
viii
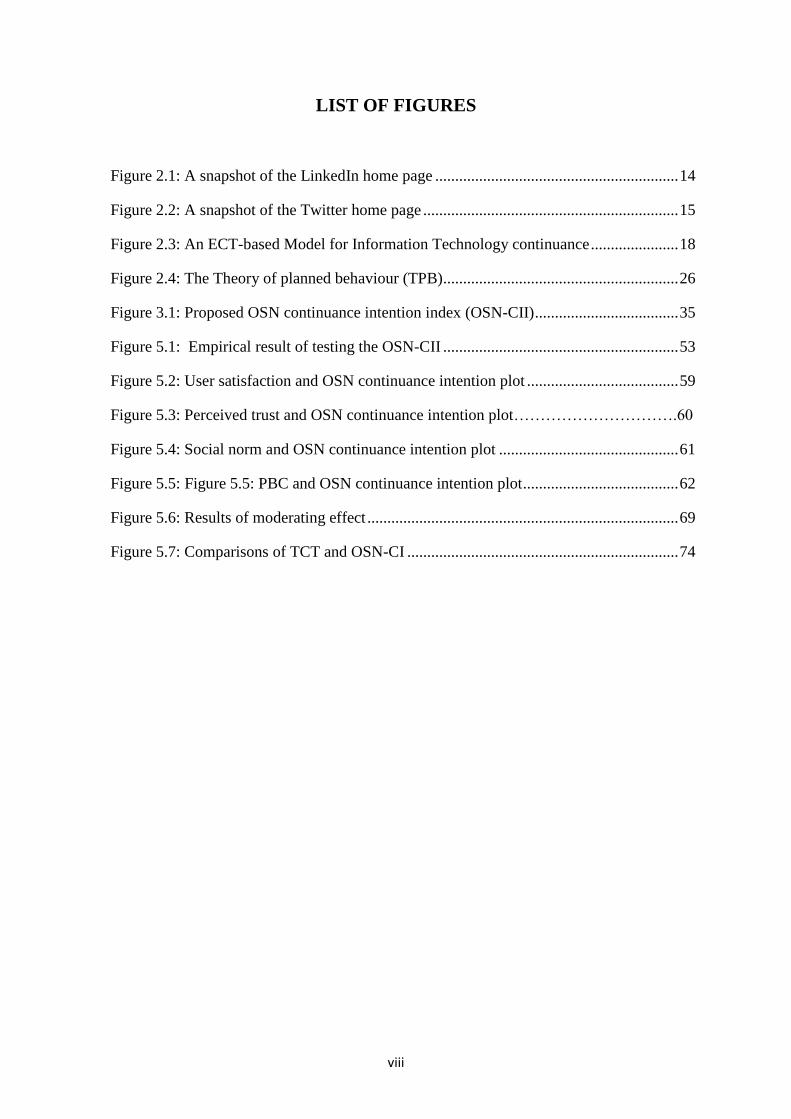
LIST OF FIGURES
Figure 2.1: A snapshot of the LinkedIn home page ............................................................. 14
Figure 2.2: A snapshot of the Twitter home page ................................................................ 15
Figure 2.3: An ECT-based Model for Information Technology continuance ...................... 18
Figure 2.4: The Theory of planned behaviour (TPB)........................................................... 26
Figure 3.1: Proposed OSN continuance intention index (OSN-CII) .................................... 35
Figure 5.1: Empirical result of testing the OSN-CII ........................................................... 53
Figure 5.2: User satisfaction and OSN continuance intention plot ...................................... 59
Figure 5.3: Perceived trust and OSN continuance intention plot………………………….60
Figure 5.4: Social norm and OSN continuance intention plot ............................................. 61
Figure 5.5: Figure 5.5: PBC and OSN continuance intention plot ....................................... 62
Figure 5.6: Results of moderating effect .............................................................................. 69
Figure 5.7: Comparisons of TCT and OSN-CI .................................................................... 74
ix
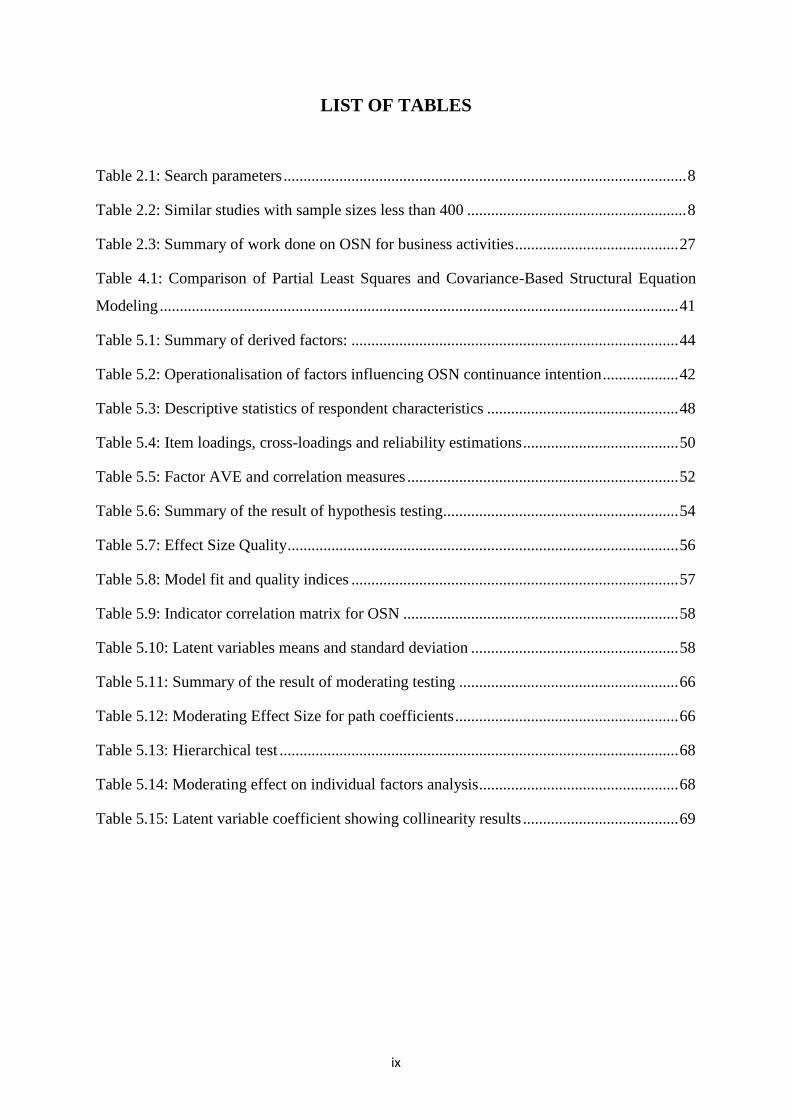
LIST OF TABLES
Table 2.1: Search parameters ..................................................................................................... 8
Table 2.2: Similar studies with sample sizes less than 400 ....................................................... 8
Table 2.3: Summary of work done on OSN for business activities ......................................... 27
Table 4.1: Comparison of Partial Least Squares and Covariance-Based Structural Equation
Modeling .................................................................................................................................. 41
Table 5.1: Summary of derived factors: .................................................................................. 44
Table 5.2: Operationalisation of factors influencing OSN continuance intention ................... 42
Table 5.3: Descriptive statistics of respondent characteristics ................................................ 48
Table 5.4: Item loadings, cross-loadings and reliability estimations ....................................... 50
Table 5.5: Factor AVE and correlation measures .................................................................... 52
Table 5.6: Summary of the result of hypothesis testing ........................................................... 54
Table 5.7: Effect Size Quality .................................................................................................. 56
Table 5.8: Model fit and quality indices .................................................................................. 57
Table 5.9: Indicator correlation matrix for OSN ..................................................................... 58
Table 5.10: Latent variables means and standard deviation .................................................... 58
Table 5.11: Summary of the result of moderating testing ....................................................... 66
Table 5.12: Moderating Effect Size for path coefficients ........................................................ 66
Table 5.13: Hierarchical test .................................................................................................... 68
Table 5.14: Moderating effect on individual factors analysis .................................................. 68
Table 5.15: Latent variable coefficient showing collinearity results ....................................... 69
x
LIST OF EQUATIONS
Equation 1: Cronbach Alpha ………………………………………………………………..50
Equation 2: Composite Reliability ………………………………………………………….50
Equation 3: Average Variance Expected……………………………………………………51
Equation 4: Discriminant Validity…………………………………………………………..52
Equation 5: Variance Accounted For Coefficient of………………………………………..52
Equation 6: Goodness of Fit Index…………………………………………………………52
Equation 7: Effect Size………………………………………………………………...........56
Equation 8: F-test…………………………………………..……………………………….68
Equation 9: Statistical significance………………………………………………………….68

xi
DEDICATION
To my dear daughter Ama Nkazimulo Assensoh
(The sacrificial lamb)

xii
PUBLICATION FROM THIS STUDY
Assensoh-Kodua, A., Olugbara, O. O. and Nepal, T. 2013. Psychosocial factors influencing
continuance intention of people using online social networking for business transactions
(Pending journal publication)
xiii
ABSTRACT
Social computing researchers are devoting efforts to understand the complex social behaviour
of people using social networking platforms, such as Twitter, LinkedIn and Facebook, so as
to inform the design of human-centered and socially aware systems. This research study
investigates the factors of perceived trust, user satisfaction, social norm and perceived
behavioural control, to develop a model for predicting the continuance intention of people to
use online social networking for business transactions. In order to validate the predictive
capability of the model developed, an online survey was used to collect 300 useable
responses from people who have used LinkedIn and Twitter social networking platforms for
business transactions at least once. The Partial Least Square (PLS) mathematical analysis tool
was thereafter used to perform confirmatory factor analysis, analysis of measurement and
structural models.
The study results provide significant evidence in support of the factors of perceived trust,
social norm and user satisfaction, as determinants of the continuance intention of people
using online social networking platforms for business transactions. Perceived trust was found
to exhibit a strong relationship with social norm and explains a variance of (R2=0.47). In
addition, social norm explains a variance of (R2=0.44) and user satisfaction explains a
variance of (R2=0.42), resulting in the model predicting (R2=0.56) continuance intention.
In addition, the research model was tested for the moderating effects of usage habit, which
were found to significantly moderate relationships between continuance intention and
perceived trust, PBCand social norm, resulting in an improved predictive capability of
(R2=0.89). The moderating result indicates that a higher level of habit increases the effect of
perceived trust, Perceived Behavioural Control (PBC) and social norm on continuance
intention. This result confirms the theoretical argument that the strength of user satisfaction to
predict continuance, is strengthened by usage habit.
The results of this research study generally have practical implications for individuals who
desire to offer commercial services on online social networking technologies, to seriously
consider building trust and maintaining user satisfaction to sustain their businesses. They
should also think of strategies embedded in peer pressure, to attract, retain and establish
trustworthy relationships with customers.
1
CHAPTER 1: INTRODUCTION
1.1 Background
The study of factors that determine the continuance intention of people to use online social
networking technologies for business transactions can be classified into the category of
behavioural science research in the information systems discipline. The behavioural science
research is a hotbed of information systems, which is concerned with the underlying theories
providing insight that informs researchers about interactions among people, technology and
organization. The behavioural science research complements the design science research to
address the fundamental problems facing the productive application of information
technology (Hevner et al. 2004, March and Storey 2008, Venable et al. 2011). In the current
information and knowledge society, the prospects of gaining competitive advantages have
prompted the revolutionizing of adopting information and communication technology (ICT)
to improve organizational efficiency.
As a result, many companies have built high performance systems relying on internet
applications, such as search engines, e-business and social networks, to improve business
performance. The explosion of business activities on online social networking technologies
continues to surge higher, providing opportunities and perils for a variety of businesses.
Social networking features have given rise to social media, Web 2.0 and more recently cloud
based social applications whereby consumer can ubiquitously access the services that are
provided by vendors. The growth of online social networking in terms of membership and
usage is significant over the last few years. This growth presents huge business opportunities
for the information age, which, if properly managed could address many of the
socioeconomic problems experienced in recent times.
In particular, business transactions conducted over the Internet have offered
new opportunuties, which have resulted in the folowing:
changing human perception of traditional business practices,
enabled corporate presence on the Internet,
improved customer support,
made business information easily available, at the fingertips of customers,
2
reduced costs of business transactions,
facilitated low start up costs, and
provided the capability to do business 24 hours a day, 7 days a week.
Internet-based business transactions are rapidly growing and becoming highly competitive.
The most prevalent being those business transactions, using online social networks (OSNs),
which has become a $1.8 billion industry, with 246 social media sites/networks, currently up
and running (Engeldinger 2011). However, privacy and trust, perceived usefulness and social
impacts are some of the challenges identified by researchers, that are faced by this new model
of business transaction (McCole et al. 2010, Pallis et al. 2010, Shakimov et al. 2011).
Similarly, other concepts, such as loyalty, usability and continuation intention by participants,
are acquiring a particular interest, because of the important roles they play in the provision of
services through the Internet. Another interesting finding is that overall, OSN websites are
said to be the most popularly ranked by the average time spent per usage (NielsenWire 2010).
The LinkedIn OSN is reported to host over 100 million users (Qualman 2011), while Twitter,
a micro blogging OSN site, hosts 106 million users (DigitalSurgeons 2010). In addition, 845
million active users, representing eight percent of the world`s population, are said to be
involved in Facebook OSN (Facebook 2012).
These statistics suggest that OSN have become a fundamental part of the online experience
throughout the world, providing a base and much needed source for business and economic
development. Online social networks (OSNs) are virtual communities for users to create
public profiles, build social collaborations, interact with friends and meet people based on
shared interests (Boyd and Ellison 2008, Kuss and Griffiths 2011). Historically, OSNs are not
meant for business purposes, but to establish and maintain relationships with people. Only
recently, have OSNs attracted business professionals, to the extent that LinkedIn and Twitter
could be pointed out to be among the OSNs that have intriguing business models for their
customers.
3
The growth of OSNs, in terms of membership and usage, is significant over the last few
years. For instance, it is reported that 39% of adults (30 years and older) using the Internet,
currently use OSNs and one out of such adults (39%), on a typical day, visit OSNs (Hampton
et al. 2011). It therefore comes as no surprise that, OSN is undergoing intense research to
establish usage patterns, motivating factors, user personality and to learn about emerging
lifestyles that may affect traditional business models (Cachia et al. 2007, Kuss and Griffiths
2011, Lee et al. 2011, Al-Hawari and Mouakket 2012).
However, the current literature has primarily focused on the general issues surrounding
online trading, architecture of social networking services applied to business, trends of OSNs
and identification of key users of OSNs (Gopi and Ramayah 2007, Wolcott et al. 2008,
Fortino and Nayak 2010, Kaplan and Haenlein 2010, Ostrom et al. 2010, Pallis et al. 2010,
Shiau and Luo 2013). Based on the systematic review of literature conducted by this study,
not much has been written to understand the influence of factors that determine the
continuance intention of people using OSNs for business transactions.
With this gap in mind, this research will investigate the influence of the factors of user
satisfaction, perceived trust, social norm and perceived behavioural control, on the
continuance intention of people using OSNs to transact business activities in international
markets. In the context of this study, business transaction is the interaction between
customers, vendors and network providers, with respect to business conducted on OSNs. The
researcher is not aware of extant studies that have researched the relationship between these
factors and how they influence continuance intention.
1.2 Problem Statement
There are several problems facing online business implementation, some of these mainly
revolve around the issues of trust, privacy, security and satisfaction. The absence of
standardised technologies for secure payment, shortage of profitable business models,
consumer fears of divulging personal data, and a lack of faith between business and consumer
satisfaction, are among the factors inhibiting the continuing usage of online service models
(Pearson and Benameur 2010, Teece 2010, Zott et al. 2011).
4
In addition, not having specific policies and regulatory frameworks, in relation to online
commercial activities is problematic, notwithstanding the fact that the virtual environment
represents a very recent phenomenon (Wolcott et al. 2008, Shakimov et al. 2011). Moreover,
overlay networking security of distributed systems and social network analysis, privacy, trust,
knowledge discovery, business and social impact, are serious issues to be considered before
online systems can be adequate for business transactions (Pallis et al. 2010, Shakimov et al.
2011).
The technological challenges, such as issues of navigation and usage of sites, have received
much attention and have been measured for ease of use of the referent information system
(Davis. 1989, Bhattacherjee 2001, Liao et al. 2009). These problems are faced by the
business world, whose main concern is to transact business with the most convenient means.
Further to the above mentioned problems facing online business implementations, privacy,
information disclosure, and uncertainty matters are among the top issues discussed in resent
OSN studies (Debatin, et al. 2009, Weiss, 2009, Antheunis, et al. 2010, Humphreys 2011,
Kim 2011, Men and Tsai 2011, Stutzman et al. 2011, Tokunaga 2011, Waters and Ackerman
2011).
Social networking has introduced novel, collaboration paradigms between users (Fortino and
Nayak 2010). However, one of the most prominent research challenges, is how to use social
networking for external communications, customer support and for business activities (Zhang
et al. 2010).
Whenever users find OSN platform that better serves their personal needs, they may be
inclined to switch. Therefore, recent studies have started to investigate why users switch
between OSNs or online service platforms, as well as how online service providers can retain
their users (Hsieh et al. 2012, Zhang et al. 2012, Choi et al. 2013, Haj-Salem and Chebat
2013)
1.3 Research Questions
This study is guided by the following research questions, arising from the problem statement
on OSN:
5
(i) What are the factors that determine the continuance intention of people to use
OSN for business transactions?
(ii) To what extent do these factors predict the continuance intention of people
using OSN for business transactions?
(iii) What are the influences of moderating factors (if any) on the continuance
intention of people using OSN for business transactions?
1.4 Research Aim and Objectives
The aim of this research is to discover, empirically, factors that determine the continuance
intention of people to use OSN for business transactions. This will help online vendors to
develop a coherent methodology for determining what blend of services, products and
processes complement their core business and technology strategy to make people continue to
use their social network for business transactions.
The objectives to realise the aim of this study are enunciated as follows:
(i) To discover the factors that determine the continuance intention of people to
use OSN for their business transactions.
(ii) To determine the extent that these factors predict the continuance intention of
people using OSN for business transactions.
(iii) To examine the influences of moderating factors (if any) on the continuance
intention of people using OSN for business transactions.
1.5 Theoretical Frameworks
This study applies the expectation-confirmation theory (ECT) (Bhattacherjee 2001), theory of
planned behaviour (TPB) (Ajzen 1991) and theory of social-cognitive trust (TST)
(Castelfranchi and Falcone 2010), to investigate the factors that determine the continuance
intention of people to use OSN for business transactions. The selected factors from these
theories, which form the theoretical frameworks of the OSN model proposed in this study, are
shown to converge to OSN continuance intention.
6
1.6 Study Contributions
This research study contributes substantially to the body of knowledge in information
systems literature.
One important contribution of this research study is the discovery of factors of customer
satisfaction, perceived trust, social norm and perceived behavioural control, as determinants
of continuance intention of people to use OSN for business transaction.
The second important contribution of this study is the development of a model to predict
OSN continuance intention.
Lastly but not least, the study makes a contribution to the information system continuance
model, by confirming the theoretical argument that the strength of user satisfaction to predict
continuance, is reinforced by usage habit.
In practice, by understanding the factors that have an impact on behavioural intentions,
individual vendors can develop operational and marketing strategies that foster positive
intentions, such as purchase intent or customer loyalty. This research study can therefore be
seen to offer practical and theoretical contributions to knowledge.
1.7 Synopsis
This dissertation is succinctly outlined as follows:
Chapter 1 introduces the study reported, by providing the problem statement, stating the
research questions, followed by the aim and objectives of the research, then the theoretical
framework, and a summary of research.
Chapter 2 discusses the related literature and covers important issues around OSN.
Chapter 3 develops research hypotheses from the theoretical framework and demonstrates
how they interconnect with each other to form the research model.
Chapter 4 presents the methodology of the research, design process, the kind of respondents
used and sampling procedures, including methods followed to collect data, the rationale for
selected statistical methods, ethical and confidentiality issues and how data collected were
validated to minimize biases.

7
Chapter 5 deals with data analysis and the interpretation thereof. It also summarizes the
themes and the findings of the study, before discussing contributions from the study.
Chapter 6 concludes the dissertation, by summarising the work done, making
recommendations and drawing conclusions.
8
CHAPTER 2: LITERATURE REVIEW
The methodology followed, as set out in this chapter, to conduct an empirical study is that of
a systematic literature review. An analytical review scheme is necessary for systematically
evaluating the contribution of a given body of literature (Ginsberg and Venkatraman 1985
Tranfield et al. 2003, Maritz et al. 2014, Roth and Wilks 2014). This provides a model for
identifying, summarizing and critiquing past studies that are found to be related to the study
at hand. The systematic literature review of academic papers, published over 30 years, should
reveal sufficient evidence towards a maturing research methodology (Fiegen 2010, Crossan
and Apaydin 2010, Zhang et al. 2012).
The main steps for carrying out a systematic review (Higgins and Green 2009, Hidalgo et al.
2011, Odunaike et al. 2014), are drawn from the following:
Define the search parameters to use to initiate web search.
Identify scholastic databases and search engines to use for literature searches.
Decide on filters for inclusion of relevant papers and exclusion of irrelevant papers.
Ensure the resulting articles are representative enough by repeating the filtering
process.
2.1 Search engines and Search parameters
The literature review was conducted using search engines of IEEE, PubMed and Science
Direct. Free web service search engines such as Google, Google Scholar and Bing were also
used to discover relevant online resources. Some academic databases and search engines
(Google and Bing) provided XML interfaces for automatic querying, which prompted further
investigation. The majority of research material downloaded used information systems or
technology (IS/IT) continuance intention as endogenous constructs in their models and are
published in English.
All conference proceedings and journal articles that were collected had to meet the following
critical criteria for inclusion as relevant (Hidalgo et al. 2011):
Are the supporting evidences shown and complete?
Are there (unacceptable) conflicts of or vested interests?
Is it repeatable, that is, rigorous?
9
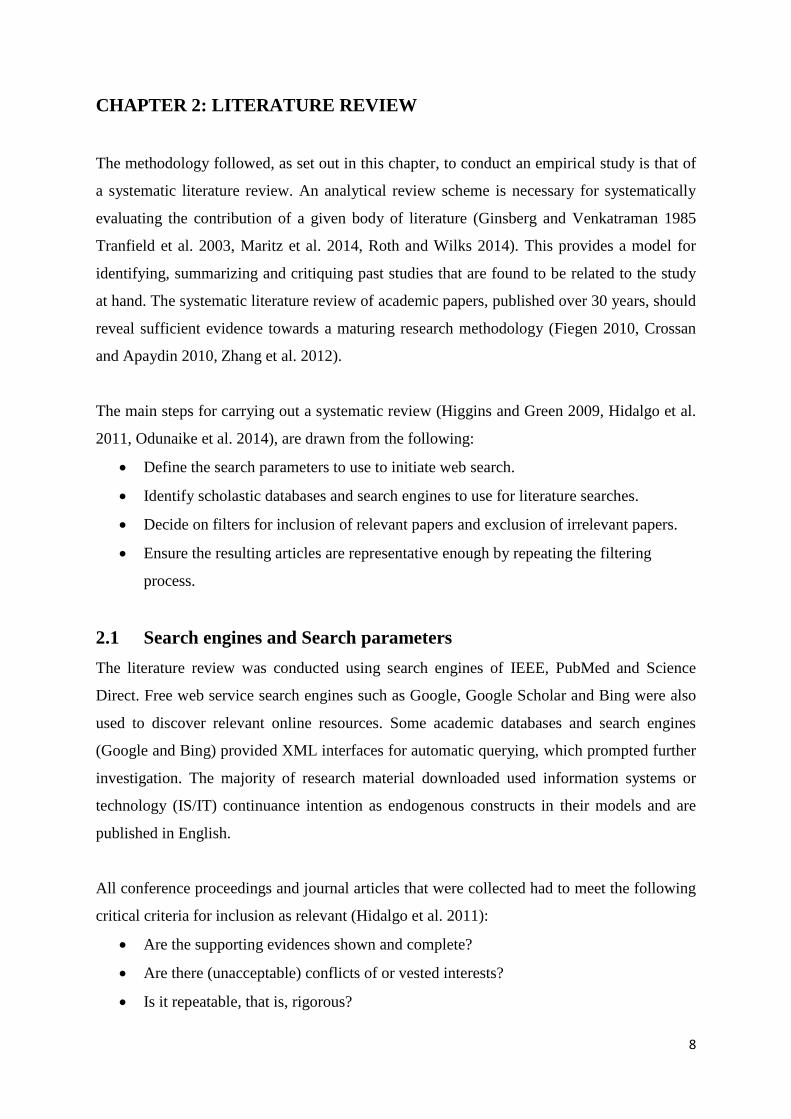
Collected papers dealing more with technology diffusion than technology continuance were
dropped because they were judged as divergent from the context of this study. Moreover,
papers that discussed the main issues, such as the technology adoption model expectation-
conformation theory and the theory of planned behaviour, were put into one folder for further
refinement. The researcher scanned through this folder for items, to identify a total of 211
research papers that were found to be more appropriate for the study at hand. Table 2.1 shows
the search parameters used to initiate the search mechanism to discover relevant research
papers for this study.
Table 2.1: Search parameters
Search Parameter Synonym
Online continuance intention Internet continuance intention
Repurchase intention -
Website loyalty Online loyalty
Website stickiness Online stickiness
Continue to shop online Online shopping
Customer’s intention to return Client’s intention to return
Technology continuance intention Information system continuance intention
Most of the articles used in this study were peer reviewed papers in information system (IS)
and electronic commerce (e-commerce) studies. More than half of the studies investigated
user satisfaction as an important determinant of continuance intention and some studies
suggested cloud computing, Web 2.0 and OSN as emerging technology for business
transactions. This demonstrates the keen interest researchers are showing in Web 2.0 or OSN
research. The Google scholar sample of papers on IS continuance intention (398), were
authored or co-authored by Asians (76 percent), North Americans (14 percent) and
Europeans (10 percent).
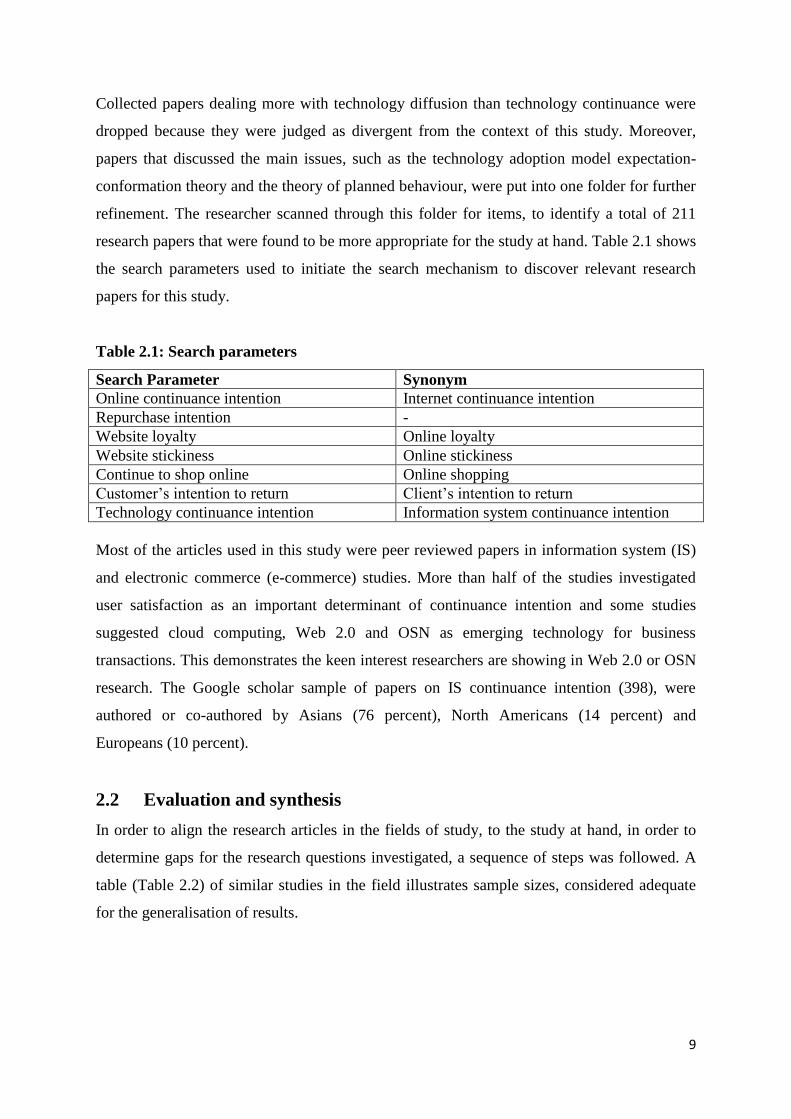
2.2 Evaluation and synthesis
In order to align the research articles in the fields of study, to the study at hand, in order to
determine gaps for the research questions investigated, a sequence of steps was followed. A
table (Table 2.2) of similar studies in the field illustrates sample sizes, considered adequate
for the generalisation of results.
10
Table 2.2: Similar studies with sample sizes less than 300
Author Year No. of Responses
Bhattacherjee 2001 122
Bhattacherjee 2001 179
Lynch, et al 2001 299
Koufaris 2002 280
Shankar et al. 2003 144, 190
Devaraj et al. 2003 134
Bhattacherjee and Sanford 2009 81
Kassim and Ismail 2009 103
Kim, 2010 207
Fand et al. 2010 142
Kuss et al. 2011 131, 187
Kim et al. 2012 241
Chen et al. 2012 226
Blanchi et al. 2012 176
Dabholkar and Sheng 2012 116
2.3 Online social networking
Online social networking (OSN) is the act of connecting and building relationships with
others online, which is a subset of social media. It can take place via Facebook, Twitter,
LinkedIn, MySpace and other OSN, but it simply describes the act of engaging in a dialogue
in a web-based forum. A good point to start analyzing OSN continuance intention literature,
is to identify the current trends across some of the most popular OSNs.
During this exercise, the following statistics came to light: 201 billion videos were found to
be viewed per month on Google sites, 350 million Facebook users log-in via mobile phone,
2.1 billion Internet users, 555 million websites, 1 trillion video playbacks on YouTube, 5.9
billion mobile subscriptions, 100 billion photos on Flickr, 71 percent of email traffic is spam,
Apple`s iPad share of global tablet web traffic is 88 percent. (royal pingdom.com 2012:
internet). This certainly presents a business opportunity for the strong hearted entrepreneur
and the knowledgeable business man who cares to stay on top of his game. Being
knowledgeable demands a swift understanding of the compelling factors that drive people to
the OSN phenomenonl and how to manipulate these factors to the best interest of
participating agents.
11
Millions of people all over the world have been lured into this recent phenomenon of
interaction defined as “web-based services” (Boyd and Ellison 2008) that allow individuals
to:
Construct a public or a semi-public profile within a bounded system,
Articulate a list of other users with whom they share a connection and
Traverse their list of connections within the system.
The names used to describe these connections may vary from one website to another,
depending on the level of sophistication. Nevertheless, they all serve almost the same
purpose. Participation in OSNs consists of joining as a member and interacting with other
network members by, for instance sharing audio-visual content (e.g. Flickr, MySpace and
YouTube), contributing to forum discussions, exchanging views and ideas within
communities of practice (e.g. Orkut4 and Yahoo groups), sharing sources of information
(such as bookmarks in del.icio.us and Digg), collaborating towards a common goal (such as
the online encyclopedia, Wikipedia) and searching for and socializing with members with
similar interests (most OSNs) (Cachia et. al. 2007).
The growth of OSNs is impressive, with some of these networks reported to have tens of
millions of members from across the world (Cachia et. al. 2007). It is worth noting that this
phenomenon is currently undergoing intense research in e-commerce and information
systems (Huang and Yen 2003, Ridings and Gefen 2004). The private sector companies are
also attempting to investigate OSNs, in order to learn about emerging lifestyles that may
affect traditional business models (Cachia et. al. 2007).
Among academics, higher education faculty members have also adopted OSNs in growing
numbers (Moran et al. 2011). In an example, Moran et al. (2011) found that between 1 921
higher education faculties surveyed, over 90 percent were at least aware of the major OSNs,
such as Facebook and Twitter and more than 50 percent of all surveyed had visited Facebook
in the previous month, with over 40 percent posting something to Facebook at that time.
Additionally, 45 percent of reporting faculties use Facebook for both professional and non-
classroom purposes, with 11 percent using OSN on a daily basis to pursue professional goals
(Moran et al. 2011). All these attest to the fact that OSNs have assumed the centre stage of
our social life, consequently requiring critical research.
12
2.4 Web 2.0 for Business
Web 2.0 is a new approach to web design and content creation that encourages dynamic
interaction. It allows dynamic participation through social networking, social media sites and
a wide variety of user-generated content. Social media facilitates the act of social networking,
although social media sites have capabilities that go well beyond social networking, and are
subsets of Web 2.0.
For example, YouTube is mainly a video sharing site, however, the comments section is a
form of social networking. Web 2.0 is a technology that enhances interaction on the internet.
O’Reilly (2007) posits that: “Web 2.0 is the business revolution in the computer industry,
caused by the move to the internet as platform, and an attempt to understand the rules for
success on that new platform. Chief among those rules, in the view of O’Reilly, is this:
“Build applications that harness network effects to get better the more people use them”
(O’Reilly 2007).
Further to this definition, O’Reilly (2007) stipulates the following:-
Don’t treat software as an artifact, but as a process of engagement with users (“The
perpetual beta”)
Open these data and services for re-use by others, and re-use the data and services of
others whenever possible.(“Small pieces loosely joined”)
Don’t think of applications that reside on either client or server, but build applications
that reside in the space between the devices. (“software above the level of single
device”)
Remember that in a network environment, open application programming interfaces
and standard protocol win, but this doesn’t mean that the idea of competitive
advantage goes away (“the law of conservation of attractive profits”).
Chief among the future sources of lock in and competitive advantage will be data,
whether through increasing return from user-generated data, through owning name
space, or through proprietary file formats.
From the above synopsis, it can be seen that, O’Reilly is trying to move OSN as part of Web
2.0 and cloud 1.0 computing to cloud 2.0 computing, where computing is done in the cloud
anytime, anywhere, without the sky posing as the limit this time around. O’Reilly sought to
13
better clarify the Web 2.0 concept in light of many other discussions on the subject and it was
evident that, by evaluating definitions provided by several academics, one can conclude that
Web 2.0 is a collaborative development, with higher participation expectations from users, to
generate content and continue to use such contents (Olson et al. 2010, Bettinger et al. 2014,
Wu et al. 2014).
The concept of Web 2.0 relies heavily on its users to participate and contribute. It is,
specifically, important to be on the internet, to be able to share knowledge and to link people
(DiLoreto 2007). Aguiton and Cardon (2007) describe the concept of Web 2.0 in more of a
functional manner, stating that “Web 2.0 services can be characterized by the astonishing rise
of the interpersonal relations in mediated communities, the extension of the number of
contacts and the growth of a new form of weak friendship”.
Accordingly, services on Web 2.0 are offered in three different forms (Hoegg et al. 2006):
Platforms, which offer the means for users to express themselves,
Online collaboration tools, which aim to improve processes by making information
accessible from every location, and
Community services: unifying users through a common objective.
2.4.1 Doing business on Web 2.0
Organisations are beginning to recognise and utilize the power of Web 2.0, allowing them to
interactively communicate and engage with their supplier chain and provide their customers
with a sense of empowerment (Bughin and Chui 2010, Oliver 2010, Baxter and Connolly
2014, Wirtz et al. 2014). Innovapost is one of such organizations that have started developing
strategies to make the most of the opportunities in this new environment (Xarchos and
Charland 2008). Innovapost used Web 2.0 technologies to develop a new portal that allowed
its employees to seek new opportunities within the companies, while allowing managers to
post opportunities. The continuous practices of such actions have the potential of giving rise
to a business model, especially if other technologies are developed to further exploit the
capabilities of Web 2.0.
LinkedIn and Twitter are the two of the numerous OSNs that have made remarkable efforts in
using this OSN for business purposes (Pallis et al. 2011, Murphy et al. 2014).
14
Accessing and interacting with Web 2.0 is provided by the principle of facilitating interaction
between users and computer, using an application programming interface and software
middleware that are used to gather geographically dispersed resources (Odunaike et al. 2014).
This makes the phenomenon attractive and easy to use and OSNs, such as LinkedIn and
Twitter, have played a leading role in this regard.
This study, therefore, sampled people using Twitter and LinkedIn for business transactions
because of growing popularity of these platforms, for business models (Pallis et al 2011).
Twitter is a microblogging service that grew rapidly within three years of its existence. In that
period, it commanded more than 41 million users, over 41.7 million user profiles, 1.47 billion
social relations, 4 262 trending topics, and 106 million tweets (Kwak et al. 2010). In addition,
if an OSN is to be used as a facility geared toward career management or business goals, an
OSN with a more serious corporate image, such as LinkedIn is preferred (Cutillo et al. 2009).
2.4.2 Business models of LinkedIn
LinkedIn, often considered the business world’s version of Facebook (Murphy et al. 2014,
Wu et al. 2014), was founded in 2003 by Reid Hoffman. It is an interconnected network of
experienced professionals from around the world, representing 150 industries and 200
countries. In December 2009, LinkedIn had more than 55 million registered users. The scope
of LinkedIn is mainly for business, allowing users to maintain a list of contact details of
people they know and trust in business. Through this network people can find jobs and
business opportunities, whereas employers can post and distribute job listings for potential
candidates.
LinkedIn is a user-oriented OSN site, where registered users create networks by sending
personal invitations. A key feature of LinkedIn is that registered users can be recommended
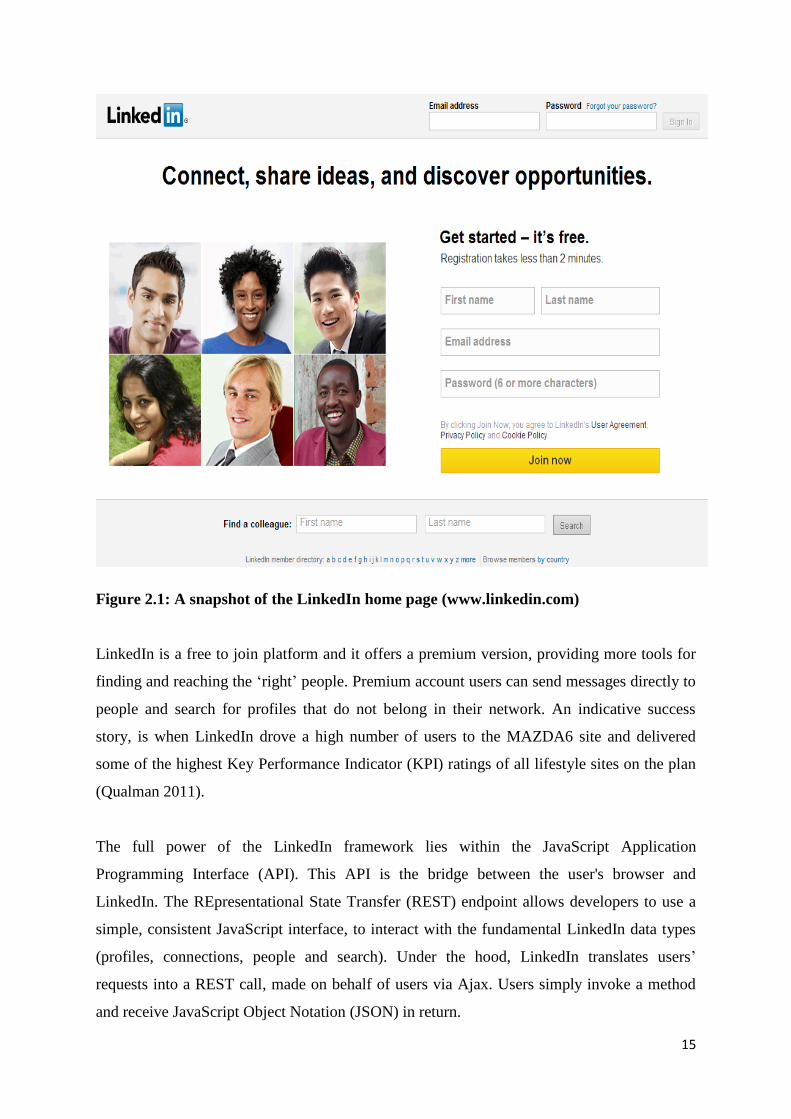
by someone in one's contact network. Figure 2.1 shows a screen shot of the LinkedIn home
page (www.linkedin.com).
15
Figure 2.1: A snapshot of the LinkedIn home page (www.linkedin.com)
LinkedIn is a free to join platform and it offers a premium version, providing more tools for
finding and reaching the ‘right’ people. Premium account users can send messages directly to
people and search for profiles that do not belong in their network. An indicative success
story, is when LinkedIn drove a high number of users to the MAZDA6 site and delivered
some of the highest Key Performance Indicator (KPI) ratings of all lifestyle sites on the plan
(Qualman 2011).
The full power of the LinkedIn framework lies within the JavaScript Application
Programming Interface (API). This API is the bridge between the user's browser and
LinkedIn. The REpresentational State Transfer (REST) endpoint allows developers to use a
simple, consistent JavaScript interface, to interact with the fundamental LinkedIn data types
(profiles, connections, people and search). Under the hood, LinkedIn translates users’
requests into a REST call, made on behalf of users via Ajax. Users simply invoke a method
and receive JavaScript Object Notation (JSON) in return.
16
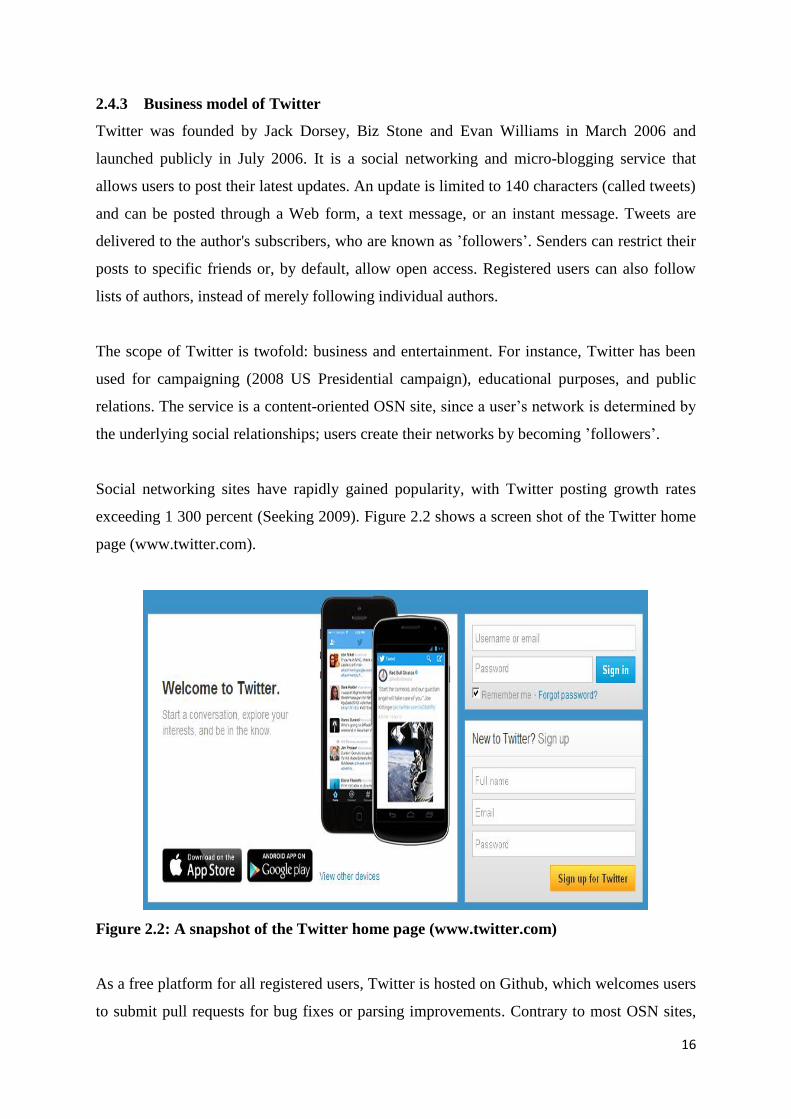
2.4.3 Business model of Twitter
Twitter was founded by Jack Dorsey, Biz Stone and Evan Williams in March 2006 and
launched publicly in July 2006. It is a social networking and micro-blogging service that
allows users to post their latest updates. An update is limited to 140 characters (called tweets)
and can be posted through a Web form, a text message, or an instant message. Tweets are
delivered to the author's subscribers, who are known as ’followers’. Senders can restrict their
posts to specific friends or, by default, allow open access. Registered users can also follow
lists of authors, instead of merely following individual authors.
The scope of Twitter is twofold: business and entertainment. For instance, Twitter has been
used for campaigning (2008 US Presidential campaign), educational purposes, and public
relations. The service is a content-oriented OSN site, since a user’s network is determined by
the underlying social relationships; users create their networks by becoming ’followers’.
Social networking sites have rapidly gained popularity, with Twitter posting growth rates
exceeding 1 300 percent (Seeking 2009). Figure 2.2 shows a screen shot of the Twitter home
page (www.twitter.com).
Figure 2.2: A snapshot of the Twitter home page (www.twitter.com)
As a free platform for all registered users, Twitter is hosted on Github, which welcomes users
to submit pull requests for bug fixes or parsing improvements. Contrary to most OSN sites,
17
Twitter does not provide any advertising policy. In addition, it does not support any premium
accounts. Nowadays, Twitter is in beta test, providing enterprise subscriptions that are able to
target corporate customers.
The idea to provide enterprise subscriptions is based on the assumption that the more that
businesses use Twitter, the more ways the company will find to monetize their traffic. From
the above review, it can be seen that OSN is a business model that intends to serve a
community and falls into both commercial and non-commercial communities.
2.5 Selecting an OSN Vendor for Business
Today, with literally hundreds of OSNs, which seem to have some kind of business models
for their participants, probably the most challenging issue faced by customers is the selection
of an appropriate vendor. There are many reasons for limiting the number of preferred
vendors on OSN platform. These include, the pressure to purchase locally, environmental
concerns, product availability and other factors, which may influence the decisions of
customers in selecting a vendor, regardless of the degree of product, performance or
interpersonal satisfaction derived from that vendor (Vermeir and Verbeke 2008).
The reliance on codified knowledge stresses formal analysis and rationality in decision
making (Foss and Klein 2013). Analogously, product satisfaction and performance
satisfaction rely on rational analysis, while interpersonal satisfaction relies on tacit
knowledge. Such tacit knowledge may be developed through years of experience, is
subjective, and is highly individualized (Dalkir 2013). It may also be influenced, especially
with the advent of e-commerce these days, and may include knowledge regarding efficient
ways of approaching vendors online.
Participants of OSN may succumb to pressure from peers to buy products online and may not
be aware that they are applying tacit knowledge in their decisions (Dalkir 2013). It is
proposed, in this study, that decision makers use satisfaction, trustworthiness and especially
interpersonal satisfaction, as a form of tacit knowledge in the decision making process for
continuance purchases, as a driving force for choosing among otherwise acceptable
alternatives.
18
Since overall customer satisfaction is comprised of satisfaction, with multiple aspects of the
acquisition and use of a product or service, the model shows that the component parts of
overall satisfaction play a major role in the decision of whether or not to repurchase from
particular suppliers due to the OSN that he or she operates on. The component of overall
satisfaction that is examined in this research study, is user satisfaction with OSN
performance, including on-time performance and billing accuracy (performance satisfaction)
enabled by choice of OSN.
2.6 Expectation-Confirmation Theory (ECT)
In continuance intentions studies, such as that of expectation-confirmation theory (ECT) in
information system, the object is to find consumer satisfaction and repeat behaviour for
transactions. The basic logic of the ECT is stated by Oliver (1999), Bhattacherjee (2001),
Kim et al. (2009), Venkatesh et al. (2011) and Brown et al. (2012). They postulate the
following: first, a consumer shapes an expectation of the special goods or services form to a
contract. After a time of use, the consumer shapes the senses about his/her transaction
behaviour. Second, the consumer calculates his/her perceived deed, compared to initial
expectation, and decides the measure to which the expectation is met.
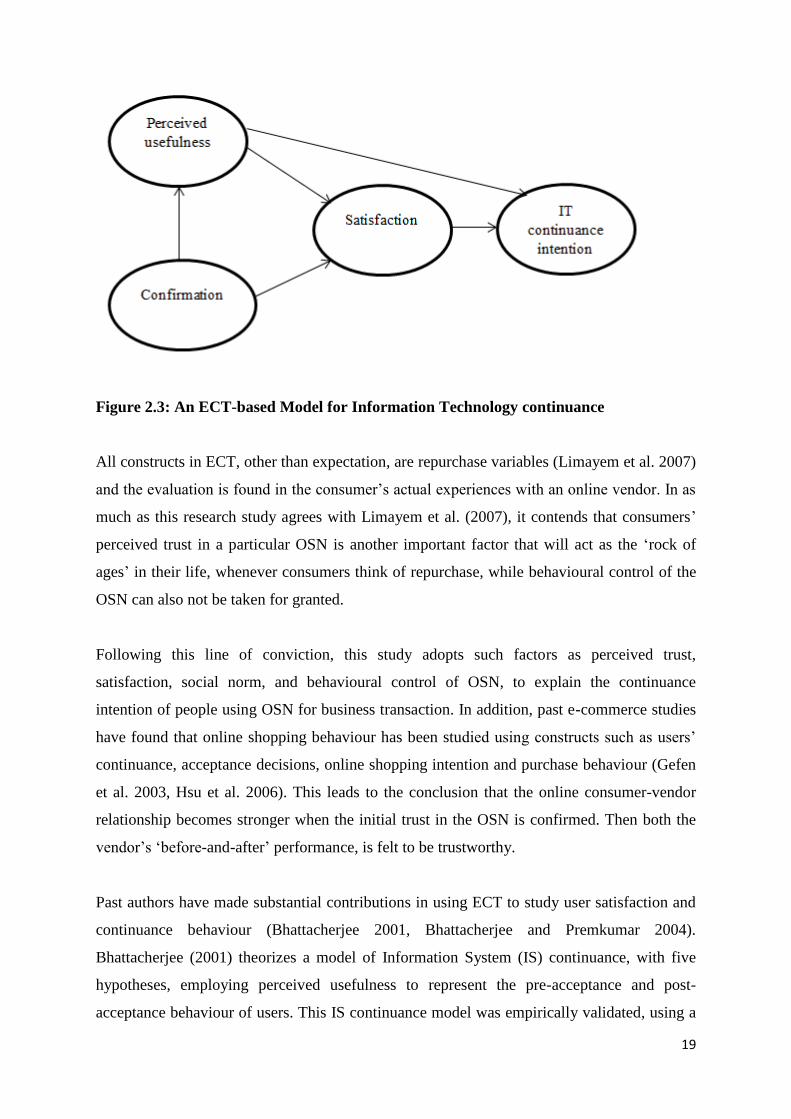
Consequently, the consumer accumulates the satisfaction decision, based on the degree of
validation and expectation on which that validation was built. In the end, the consumer forms
the repeat purchase or continuance intention and behaviour, built on the degree of
satisfaction. Figure 2.3 shows the ECT model for Information Technology (IT) continuance
intention, with the main constructs of perceived usefulness and user satisfaction determining
IT continuance intention.
19
Figure 2.3: An ECT-based Model for Information Technology continuance
All constructs in ECT, other than expectation, are repurchase variables (Limayem et al. 2007)
and the evaluation is found in the consumer’s actual experiences with an online vendor. In as
much as this research study agrees with Limayem et al. (2007), it contends that consumers’
perceived trust in a particular OSN is another important factor that will act as the ‘rock of
ages’ in their life, whenever consumers think of repurchase, while behavioural control of the
OSN can also not be taken for granted.
Following this line of conviction, this study adopts such factors as perceived trust,
satisfaction, social norm, and behavioural control of OSN, to explain the continuance
intention of people using OSN for business transaction. In addition, past e-commerce studies
have found that online shopping behaviour has been studied using constructs such as users’
continuance, acceptance decisions, online shopping intention and purchase behaviour (Gefen
et al. 2003, Hsu et al. 2006). This leads to the conclusion that the online consumer-vendor
relationship becomes stronger when the initial trust in the OSN is confirmed. Then both the
vendor’s ‘before-and-after’ performance, is felt to be trustworthy.
Past authors have made substantial contributions in using ECT to study user satisfaction and
continuance behaviour (Bhattacherjee 2001, Bhattacherjee and Premkumar 2004).
Bhattacherjee (2001) theorizes a model of Information System (IS) continuance, with five
hypotheses, employing perceived usefulness to represent the pre-acceptance and post-
acceptance behaviour of users. This IS continuance model was empirically validated, using a
20
field survey of online banking users and the results show that IS continuance intention is
determined by user satisfaction and the perceived usefulness of continued IS (OSN) usage.
User satisfaction is, in turn, influenced by confirmation of expectation from prior IS use and
perceived usefulness. Moreover, Bhattacherjee (2001) conducted a similar work by proposing
and validating an electronic commerce service continuance model and subsequently proposed
a temporal model of belief and attitudinal change (Bhattacherjee and Premkumar 2004), by
drawing on ECT and the extant usage literature. Bhattacherjee and Premkumar (2004)
conducted research for this hypothesized model and the results show the emergent constructs,
such as disconfirmation and customer satisfaction, as being critical in understanding changes
in IT users` beliefs and attitudes.
2.6.1 Customer satisfaction
The ECT states that customer satisfaction develops from a customer’s comparison of post-
purchase evaluation of a product or a service, with pre-purchase expectations. Satisfaction
has been discussed extensively as a central concept and is a hot topic of interest throughout e-
commerce and information systems literature (Oliver 1999, Brown et al. 2012, Bhattacherjee
and Lin 2014, Hsu et al. 2014, Fan and Suh 2014) and has been found to have a direct impact
on continuity of IS services and products (Bhattacherjee et al. 2008, Roca et al. 2009, Liao et
al. 2009).
For example, Bhattacherjee and Lin 2014, Gao and Bai 2014, Hsu et al. 2014) propose that
satisfaction plays a key role in building and retaining a consumer’s repurchase decisions and
IS continuance behaviour. Customer satisfaction is a post-purchase attitude, formed through a
mental comparison of the service and product quality that a customer is expected to receive
from an exchange, and the level of service and product quality the customer perceives from
the exchange.
Different customer satisfaction models and theories have been developed in order to define
and explain the concept. Satisfaction is generally referred to as the state resulting from a
consumer’s assessment of a vendor’s past performance. It is an attitude, formed through a
mental comparison of service or product quality, that a customer expects to receive from an
exchange, with the level of quality the consumer perceives after actually having received the
service or product (Kim et al. 2009). Again, Oliver (1981) summarizes satisfaction as a
21
"summary of psychological” state, resulting when the emotion, surrounding disconfirmed
expectations, is coupled with the consumer's prior feelings about the consumption experience.
These satisfaction judgments are based on perceived performance and not on actual
performance.
When the perceived performance of a product is close to the expected level of performance, it
is said to fall into the zone of indifference. Only when perceived performance is outside the
zone of indifference does disconfirmation occur. If the performance is higher/lower than
expected and falls into a zone of disconfirmation, expectations are positively/negatively
disconfirmed. If expectations are positively/negatively disconfirmed, (dis)satisfaction occurs
(Oliver 1981). In Internet contexts, many studies have indicated the relationship between
overall satisfaction levels and repurchase intention to be critical and worth the attention of
investors (Limayem et al. 2007).
2.6.2 Continuance Intention
Current research (e.g. Choi et al. 2011, Zhou 2011) argues that studies on continuance
behaviour are becoming increasingly important, particularly for firms seeking to achieve
profitability and sustainable, competitive advantage, through online business activities. The
understanding of the factors that influence continuance behaviour, at this stage of the
Internet’s diffusion as a business avenue, is important.
Online participant retention will ensure OSN continuity. No wonder this subject of continuity
has become current research issue in both the IS and e-commerce areas whereby researchers
have studied online customer retention in different contexts, (Venkatesh and Zhang 2010,
Venkatesh et al. 2011, Brown et al 2012, Gao and Bai 2014, Al-Debei et al. 2013, Zheng et
al. 2013, Sun and Jeyaraj 2013, Shiau and Luo 2014, Lehto and Oinas-Kukkonena 2014,
Ajjan et al. 2014, Hsu et al. 2014, Lankton et al. 2014).
Both IS continuance intention and repurchase intention are influenced by the initial use or
purchase experience through the medium of technology. As noted earlier on, technology
switching is not completely new phenomenon in IS research (Fun and Suh 2014) because
users are in constant search to find OSN platform that better serves their personal needs. They
may be inclined to switch or at worst become members of multiple platforms when such new
ones are discovered. Therefore, recent studies have started to investigate why users switch
22
between OSNs or online service platforms, as well as how online service providers can retain
their users (Hsieh et al. 2012, Zhang et al. 2012, Choi et al. 2013, Haj-Salem and Chebat
2013)
It has been examined variously as a post-adoption behaviour, where users consider changing
to another service provider or product after they evaluate theie experience. Nevertheless, IS
continuance intention in an OSN context is slightly different from the online repurchase
intention. IS continuance emphasizes the continued usage of e-commerce sites, such as OSN,
for business, instead of the use of physical stores, while online repurchase underlines
consumer behaviour (Wen et al. 2011).
Online repurchase intention is a construct combining IS theory and marketing theory. Given
OSNs successful acceptance rate and popularity, retention and continuity of the systems
become crucial. Such a continuance intention is not only needed for literature’s sake, but for
business and investment purposes. Bhattacherjee 2001, Gao and Bai 2014, Hsu et al. 2014,
Ajjan et al. 2014) defines IS continuance intention in the ECT as an individual’s intention to
continue using an information system (in contrast to initial use or acceptance).
Continuance intention has been shown to have correlation with actual IS continuance
(Venkatesh and Zhang 2010, Venkatesh et al. 2011, Brown et al 2012) and is used as the
endogenous construct in many models, including this study. The phenomenon becomes more
important for OSN systems because, such systems, being a Web 2.0 system of cloud
computing, typically have some benefits that could only be realized in the long run.
For instance, the issue of trust in OSN can build up because of familiarity and the
continuance visit of a particular OSN. Furthermore, Limayem et al. (2007) suggest that IS
continuance behaviour or IS continuous usage described behavioural patterns, reflect the
continued use of a particular IS. Over the years, a number of constructs have been proposed
in connection with the continuance intention in IS (Hsu and Chiu 2004, Bhattacherjee and
Lin 2014, Hsu et al. 2014)
In light of the fact that attracting and retaining online participants are the keys to the success
of OSN, many scholars have studied continuance intention from a number of perspectives.
Notably, the technology acceptance model (TAM), to predict continuance intention based on
23
perceived usefulness (Bhattacherjee 2001, Premkumar and Bhattacherjee 2008) and
perception of utility (Premkumar and Bhattacherjee 2008). Likewise, continuous online
service usage behaviour was examined, with the extending expectation-confirmation model
(ECM) accompanied with self-image congruity and regret. The result supports the salient of
self-image congruity and regret on continuous behaviour in the context of a social network
service (Kang et al. 2009).
Moreover, a synthesised model of ECT, the TAM, the theory of planned behaviour (TPB)
and the flow theory, explain and predict the users’ intentions to continue using a Web-based
learning program (which is good news for OSN continuance). How to enforce the habitual
behaviour and participation in Web 2.0 systems, therefore, contributes greatly to an OSN’s
continued existence. This is an area worthy of pursuit because of the business value of OSN
as a tool of both leisure and convenience, a way of communication and a new business
venture (Wirtz 2010, Wirtz et al. 2014, Wu et al. 2014, Baxter and Connally 2014).
2.6.3 Habit
Prior research in IS usage indicates that habit determines much of IS continued usage
(Limayem et al. 2007) and using it to investigate the possible roles of moderation is common
in this domain of study. A study, of the roles of habit and website quality in e-commerce,
found that habit has a significantly positive effect on trust, perceived usefulness and
continuance intention (Liao et al. 2006, Shiau and Luo 2013). Guinea et al. (2009) define
habit as “a well –learned action sequence, originally intent that may be repeated as it was
learned without conscious intention, when triggered by environmental cues in a table
context” (Guinea et al. 2009).
When IS use is habitual, it ceases to be guided by conscious planning and is instead triggered
by specific environmental cues in an unthinking or automatic manner (Bhattacherjee and
Barfar 2011). Guinea et al. (2009) maintain that the mere presence of IS, or a specific task
that a user is confronted with, for instance, to communicate with a colleague about writing a
report, are important cues that may trigger habitual IS usage.
Previous research has found a strong relationship between habit and continuance behaviour in
IS and many efforts have been made by different researchers in showing how habit influences
IT usage. The conclusion is almost invariable the same. For instance, habit refers to “the
24
extent to which people tend to use IS automatically, as a result of prior learning” (Limayem
et al. 2007, Venkatesh et al. 2012, Bhattacherjee and Lin 2014), it is automatic behaviour,
from known practice.
Understanding the IS feature that develops habitual behaviour among OSN participants, in
addition to showing how it moderates these feature(s), is crucial in promoting habitual use of
OSN in the long run. Past research reports that habit is a major driver of affect (Nayak 2014)
and an ‘emotional response to the thought of the behaviour’ (Nayak 2014). By giving rise to a
favorable feeling towards behaviour, habit can affect trust, behavioural control and social
norm directly. In other words, this study believes that a customer is likely to be more trusting
and more influenced by behavioural factors of OSNs stores, when the habit of shopping
online has been acquired.
In summary, the logic of the expectation-confirmation theory (ECT) posits user satisfaction
to be the most important determinant of an individual’s continuance intention (Oliver 1999,
Bhattacherjee 2001, Zhao and Lu 2012, Akter et al. 2013, Ajjan and 2014, Al-Debai et al.
2014). The parsimonious nature of the theory allows it to be used as a guideline to develop a
successful information system (Venkatesh and Davis 2000, Venkatesh et al. 2011, Brown et
al. 2012). However, attention on IS acceptance has shifted to a continuance model
(Bhattacherjee 2001, Liao et al. 2009, Akter et al. 2013, Shiau and Luo 2013). ECT was
adapted from the customer satisfaction/dissatisfaction model (CS/D) (Oliver 1981, Churchill
and Suprenant 1982, Oliver and Burke 1999), which was originally designed in marketing
research to model customer repurchase behaviour.
It is worth mentioning that CS/D is not dedicated to modeling IS continuance per se, but is a
general model for describing a person's reiterative behaviour, in performing certain tasks
(Oliver 1980).
2.7 Theory of Socio-Cognitive Trust
Despite the massive studies into customer perceived trust, to make them feel at ease when
doing business on OSN, it appears that consumers continue to perceive that using the Internet
for purchasing, is risky (McCole et al. 2010). Therefore, the issue of trust may be even more
important in OSN than traditional commerce because OSN is based on the consumer’s trust
25
in the processes. This is in contrast with that of traditional business, where trust is based on
personal relationships and on interactions between the consumer and the merchant.
The theory of socio-cognitive trust (TST) defines trust as a notion that is appraised by agents,
in terms of cognitive ingredients (Castelfranchi and Falcone 2010). TST treats cognitive trust
as a relational factor between a trustor (trust giver) and a trustee (trust receivers).
This relationship can be established in a given environment or context and most importantly,
about a defined activity or task to be fulfilled. Individuals choose who they will trust and base
this decision on what they believe are ‘good reasons’ (McAllister 1995). The choice to trust
and the search for ‘good reasons’ suggest a process, by which one determines that an
individual, group or organization is trustworthy (McAllister 1995).
Trust is a significant psychological factor of electronic loyalty and is crucial for users to
embrace risk that comes with online transactions (McCole et al. 2010, Xu and Liu 2010).
According to Deng et al. (2010) and Constanza and Lynda (2012), trust makes customers
comfortable when sharing personal information, making purchases, creating relationships and
acting on advice which is behavioural and essential to the widespread adoption of electronic
commerce. The issue of trust is particularly relevant when it comes to business, let alone
conducting such business in an environment, such as OSN, where users do not see each other
physically. The lack of trust therefore could impact negatively on users (Zhang 2012, Zhou
2012).
Trust is considered a multidimensional concept categorising it into several referents in an
oline settings (Hsu et al. 2014). For instance, Teo et al. (2008-2009) classified trust into trust
in government, trust in technology, and trust in e-government web site whiles Lu et al. (2010)
and (Shu and Chuang 2011) classified trust in the vendor (Lu et al. 2010), trust in the
auction’s initiator (Kauffman et al. 2010) and trust in group members (Lu et al. 2010, Shu
and Chuang, 2011). Trust in technology and group members are of interest to this study.
Based on the theory of reasoned action (TRA) (Fishbein and Ajzen, 1975), beliefs directly
affect attitudes, and the higher the level of trust, the more favourable the attitude (Hsu et al.
2014). Chen and Dibb (2010) find that trust in a web site (OSN) is significantly associated
with shoppers’ attitudes toward the site whereas Keen et al. (2004) found that the choice of
26
the internet (OSN) over other business models is conditioned by an individuals` subjective
norms and the amount of control perceived during the purchasing process.
This again lends support to Bart et al. (2005), who on the determinants of trust in different
types of websites discloses that electronic vendors whose websites have easy-to-use features
and have the capability to direct their customers to their destinations quickly can easily gain
the trust of their customers (Bartet al. 2005) due to the efficacy of the site. Chau, Hu, Lee,
and Au (2007) claim that the ease of using and navigating a website significantly influenced
customers’ trust in the electronic vendor, especially during the initial encounter, when
customers were still searching for information.
It therefor comes with no surprise that, experts believe the lack of trust between transacting
parties and the system facilitating the exchange (OSN) is impeding the rate at which this
potential has yet to be realised (e.g. Dinev et al. 2006, McCole et al. 2010).
It has been noted that trust in e-business also incorporates the notion of trust in the
infrastructure and the underlying control mechanism (technology trust) which deals with
transaction integrity, authentication, confidentiality, and non-repudiation (Ratnasingam et al.
2002, McCole et al. 2010). Lee and Turban (2001) state that “human trust in an automated or
computerised system depends on three factors: (1) the perceived technical competence of the
system, (2) the perceived performance level of the system, and (3) the human operator's
understanding of the underlying characteristics and processes governing the system's
behaviour.” These factors, in the opinion of this study are related to the perceived ability of
the OSN to perform the task it is expected to, as well as the speed, reliability and availability
of the system. To draw an anology to explain the above statements, a user who uses MTN as
a network to communicate with friends will be frustrated and distrust the network if most of
his efforts to reach these friends are thwarted most of the day by the non availability of the
network. He might even not trust his peers who uses the same network and tries to convince
him into using it to transact business online.
As already hinted above (especially in the section of Social Norm), trust can also occur at
both the interpersonal and group level, with individuals trusting members of their own group
more than members of other groups (Foddy et al. 2009, Saeri et al 2014) and this is known as
a depersonalized ingroup trust.
27
In summary, the investigation of trustworthiness of technology has been given some attention
in the recent past (Jarvenpaa et al. 1999, McCole et al. 2010, Kim et al. 2009, Luo et al. 2010,
Lin 2011, Zhou 2012) and the examination of the extent to which consumers place their trust
in online vendors (Jarvenpaa et al. 1999). The result has shown that, trust is a critical factor
for OSN providers to create within their site in order to attract participants.
McCole et al. (2010) find that this factor positively influences attitude towards online
purchasing, while existing evidence suggests that familiarity with an online store (OSN) also
has a positive influence (Stranahan and Kosiel 2007).
2.8 Theory of Planned Behaviour
The Theory of Planned Behaviour (TPB) discusses how one possesses the salient factors
needed to perform an act, being it an IT system or behaviour decision-making.
2.8.1 Perceived Behavioural Control
One well known and applied model, used extensively to explain the extent of the impact of
the behavioural decision-making process, by identifying the important predictors of
individual behaviour, is the TPB by Ajzen (1985,1991). The TPB posits that individuals’
intentions are the closest determinants of their behaviour, with intention as a concept, to
capture the individuals’ motivation to perform a given behaviour (Ajzen 1991).
Ajzen`s TPB was recently applied to social networking by Baker and White (2010) to predict
adolescents` use of social networking. The study confirmed the TPBs components of attitude,
perceived behavioural control, and group norms, in predicting intentions to use social
networking sites, finding support that intention predicts behaviour.
One`s ability to use OSN for business transactions depends by and large, on the availability
and accessibility of IT equipment needed to carry out the function, such as computers and
other mobile computing devices. When these are perceived to be within reach, it impacts on
behavioural intention to use OSN continually. Accordingly, PBC reflects one’s perceptions of
the availability of resources or opportunities necessary for performing the behaviour (Ajzen
and Madden 1986).
28
According to the standard TPB model, intention is determined by three constructs:
1) attitude
2) subjective norm and
3) perceived behavioural control.
Firstly, attitude is conceptualized as referring to individuals’ overall evaluations, either
positive or negative, towards performing a given behaviour, and is posited to comprise
affective (e.g., pleasant/unpleasant) and instrumental (e.g., easy/difficult) evaluations towards
the behaviour. Secondly, social norm refers to individuals’ perceptions of social pressure
from important referents to perform or not to perform the behaviour, and thirdly, perceived
behavioural control refers to the amount of control individuals perceive they have over
performing the behaviour.
Thus, when people are confident in their ability to perform a behaviour, engaging in the
behaviour is thought to be achievable, which in turn, increases their likelihood of forming a
stronger behavioural intention (Ajzen and Madden 1986). In other words, the more
participants of OSN for business transactions perceive control over IT equipment needed to
carry out a transaction, the more the chances of continuing using them to carry out their
business and thus achieving the objectives of IS continuous usage.
The TPB provides such a model, to predict the factors that lead to purchase intentions and is a
respected framework applied by academics to a wide variety of behaviours. For instance,
Pelling and White (2009) used the TPB to investigate predictive factors of high-level SNS
use among a sample of young people. Figure 2.4 shows the TPB model for Information
Technology (IT) usage behaviour with the main constructs of perceived behavioural control
and intention to use, determining IT Usage behaviour.
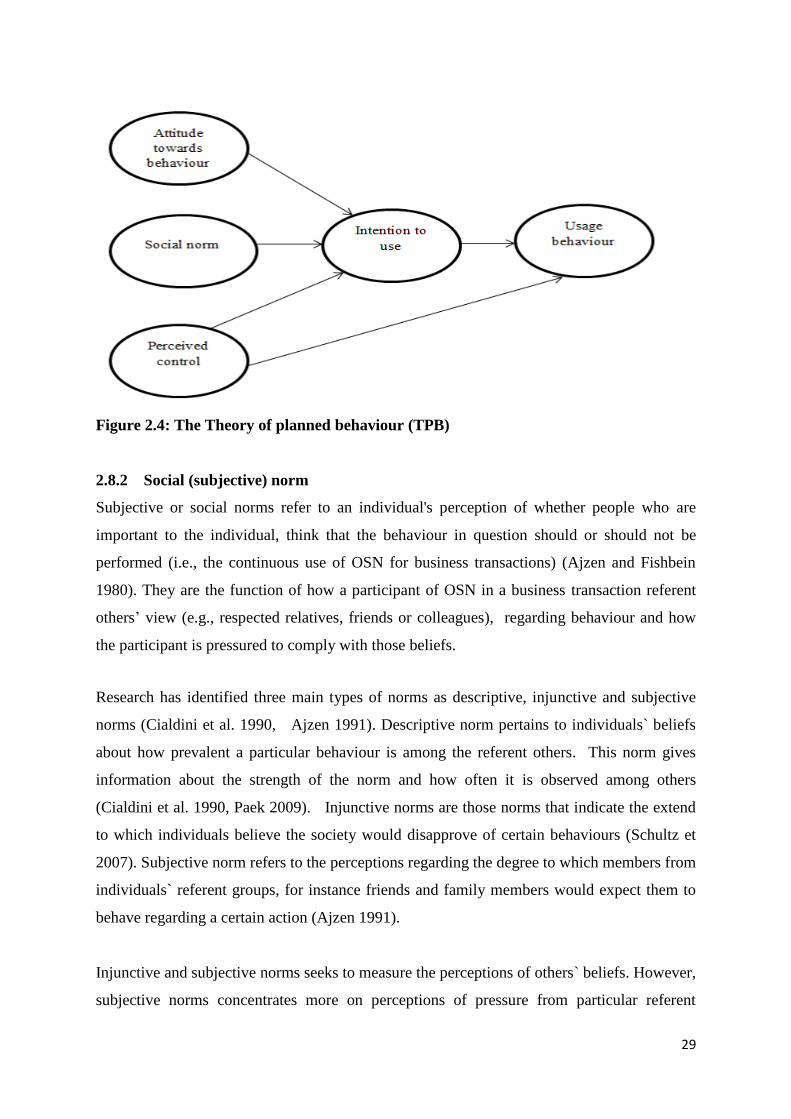
29
Figure 2.4: The Theory of planned behaviour (TPB)
2.8.2 Social (subjective) norm
Subjective or social norms refer to an individual's perception of whether people who are
important to the individual, think that the behaviour in question should or should not be
performed (i.e., the continuous use of OSN for business transactions) (Ajzen and Fishbein
1980). They are the function of how a participant of OSN in a business transaction referent
others’ view (e.g., respected relatives, friends or colleagues), regarding behaviour and how
the participant is pressured to comply with those beliefs.
Research has identified three main types of norms as descriptive, injunctive and subjective
norms (Cialdini et al. 1990, Ajzen 1991). Descriptive norm pertains to individuals` beliefs
about how prevalent a particular behaviour is among the referent others. This norm gives
information about the strength of the norm and how often it is observed among others
(Cialdini et al. 1990, Paek 2009). Injunctive norms are those norms that indicate the extend
to which individuals believe the society would disapprove of certain behaviours (Schultz et
2007). Subjective norm refers to the perceptions regarding the degree to which members from
individuals` referent groups, for instance friends and family members would expect them to
behave regarding a certain action (Ajzen 1991).
Injunctive and subjective norms seeks to measure the perceptions of others` beliefs. However,
subjective norms concentrates more on perceptions of pressure from particular referent
30
groups whereas injunctive norms focuses on the perceptions of the society as a whole on the
individual (Rimal and Real 2003, Ho et al. 2014).
Bearman`s idea of peer proximity, positing that peer effects task at proximal (For instance,
close peers) and distal (For instance, groups of friends) levels, add to explain the differences
between subjective and injunctive norm. In other words referent groups in subjective norm
are closer in terms of social distance than the referent groups in injunctive norm (Ho et al.
2014) and therefore are more influencial in subjective norm than injunctive norm.
The above authors (Ho et al. 2014), contend that, perceived norms at the personal level have
a larger effect on behavioural intention than perceived norms at the societal level in most
cases. Their studies also revealed that, adolescents non-drinkers consider pro-drinking
advertisement messages to be considerable convincing to their peers than anti-drinking
messages. This outcome was found to be consistent with previous studies by Gunther et al.
(2006). Among the drinkers, peers` attention to pro-and anti-drinking messages affected
social norm (Ho et al. 2014). In effect, the proximal referent groups are likely to exert
stronger and more immediate effects on adolescents` intentions to drink than general
perceptions of societal approval.
This assertion is no different from what is anticipated from this study as people tend to regard
close peers as an in-group with a common identity more than distance peers (Tajfel 1982, Ho
et al. 2014). For instance, before actual usage, users who perceive that many of their peers
have registered with a particular social network website perceive a higher level of usefulness
and value in registering with the same social networking website (Kim 2011). This influence
could be extended into group purchases to attract bulk discount thus establishing business
among peers on the same OSN. In short, people have a greater tendency to be influenced by
perceptions of in-group behaviour than that of out-groups because they always base their
behaviour on social comparisons of important peers (Yanovitzky et al. 2006).
Nickerson et al. (2008) found that, processes of peer pressure and the desire to be accepted by
peers can urge bystanders to join in bullying in OSN whiles Pozzoli and Gini (2010) revealed
that positive peer pressure for intervention positively predicted defending behaviour in OSN.
Further more, Paek and Gunt (2007) found in a study that adolescents tent to have positive
attitudes towards smoking if they perceive that smoking is prevalent among their peers.
31
Again, the power of peer pressure is known in a study, where adolescents who believe that
peer norms had been influenced by sexual content report more favourable attitudes toward
risky sexual behaviours and greater likelihood to engage in sexual activities (Chia 2006).
Given these highlights, it is in the interest of the current studies to focus on how subjective
norm influences OSN for business intentions through peer pressure.
The effects of social norms on individuals have been investigated extensively, and there exist
evidence that young people as a section of social grouping influences themselves more than
the older segments through peer pressure. For instance, Thorbjornsen et al. (2007) and
Kwong and Park (2008), indicate that peer pressure apply more to young people. Wang et al.
(2009) confirm that in conforming to the SNs of groupings, the effect of group behaviour
apply to young peer groups, when it comes to illegally downloading music from the Internet.
One reason given for these findings, was the susceptibility of young users in the social
development and learning stage, to peer influence (Shiau and Luo 2013).
Peer influence can arise in settings where social norms and observed peer behaviour pressure
the individual toward expected choices (Mas and Morretti 2009, Bettinger et al. 2014). It
could occur in social settings (Fullerton and West 2009) and as already mentioned, a growing
literature documents how peers affect performance, friendships and college students
behaviour and attitudes (Zimmerman 2003, Kremer and Levy 2008, Olson et al. 2010,
Bettinger et al. 2014, Wu et al. 2014).
Bettinger et al. (2014) hints that, technology has made many old peers interactions virtual and
enabled new ones online. An understanding of OSN peer effect may therefore improve
productivity in OSNs relying on such networking for business. What is more, information
availability on peer interactions and influence allows researchers to view the effect on
individual characteristics and particular behaviours that such individuals affects their peer
with. This understanding can enable policy implementations on OSNs to alter peer behaviour
(Correll et al. 2011) for business transactions.
In relation to Bettinger et al`s (2014) study, it was made known that peer effects matter even
in online settings. The study elucidated that, peers may establish norms of behaviour through
the timing and concentration of their posts.
32
A similar study on Wikipedia also found that active participants can substantially increase the
participation of otherwise passive participants (Olson et al. 2010, Bettinger et al. 2014). The
study posit that increase on Wikipedia`s network is driven by active participants catching the
attention of passive ones. OSN for business is a classic two-sided market where
complimentary goods and services are provided for a collection of customer groups including
user group, content provider proup, solution provider group and advertiser group (Kim et al.
2014). OSN users perceive that as the size of the OSN user network to which they are
members become bigger, they can build a relationship with more people and share more
information (Kim et al. 2014). Such sharing impact peers behaviour towards continuance
usage as evinced by Lin and Lu (2011). They proved that the number of peers influence
continuance intention to use OSN.
Drawing on the above expositions expecially that of Wang et al. (2009), it could be stated
that, if peers were able to influence their mates into the downloading of music ilegagally on a
social network (thus selling that particular site to them indirectly), they could as well lure
them into the payment of other items that the group cherishs, hence enabling business
transactions. The current study builds on the above by testing the extent to which peers
influence themselves through the medium of social norm to continue using OSN for business.
In conclusion, the TPB (Ajzen 1991) is an extension of the theory of reasoned action, which
is the result of some limitations found in the original model (Fishbein and Ajzen 1975). TPB
posits that intentions of individuals are the closest determinants of their behaviour, with
intention as a concept to capture the motivation of an individual to perform a given behaviour
(Ajzen 1991). TPB is a well-grounded framework for conceptualizing, measuring and
empirically identifying factors that determine behavioural intention, which is an immediate
originator of behaviour (Ajzen 2008, Vermeir and Verbeke 2008).
According to TPB, behavioural intention depends on three major factors of A towards
performing behaviour, SN and PBC. These factors represent the subjective probability that an
individual will engage in a behaviour (Wu 2006). The stronger the intention of an individual
to perform a particular behaviour, the greater the likelihood of that individual engaging in the
behaviour (Ajzen 2008). TPB was recently applied to confirm factors of A, SN and PBC, as
predicting intentions to use social networking sites (Baker and White 2010).
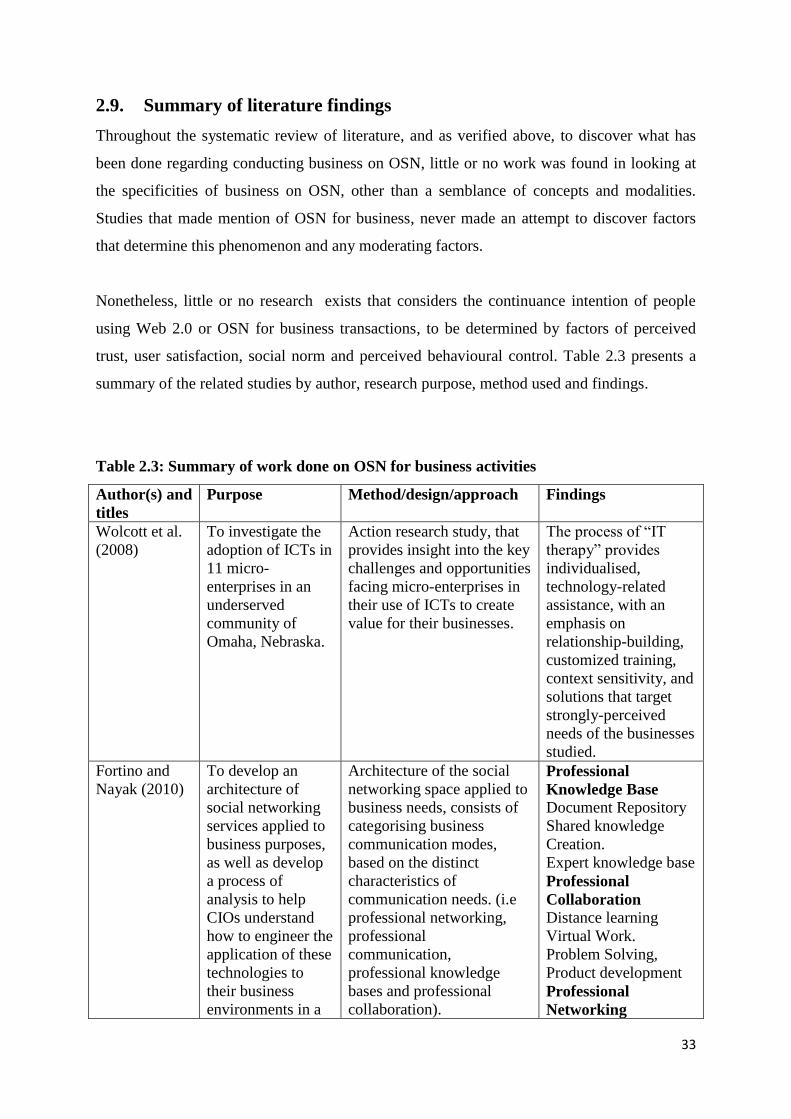
33
2.9. Summary of literature findings
Throughout the systematic review of literature, and as verified above, to discover what has
been done regarding conducting business on OSN, little or no work was found in looking at
the specificities of business on OSN, other than a semblance of concepts and modalities.
Studies that made mention of OSN for business, never made an attempt to discover factors
that determine this phenomenon and any moderating factors.
Nonetheless, little or no research exists that considers the continuance intention of people
using Web 2.0 or OSN for business transactions, to be determined by factors of perceived
trust, user satisfaction, social norm and perceived behavioural control. Table 2.3 presents a
summary of the related studies by author, research purpose, method used and findings.
Table 2.3: Summary of work done on OSN for business activities
Author(s) and
titles
Purpose Method/design/approach Findings
Wolcott et al.
(2008)
To investigate the
adoption of ICTs in
11 micro-
enterprises in an
underserved
community of
Omaha, Nebraska.
Action research study, that
provides insight into the key
challenges and opportunities
facing micro-enterprises in
their use of ICTs to create
value for their businesses.
The process of “IT
therapy” provides
individualised,
technology-related
assistance, with an
emphasis on
relationship-building,
customized training,
context sensitivity, and
solutions that target
strongly-perceived
needs of the businesses
studied.
Fortino and
Nayak (2010)
To develop an
architecture of
social networking
services applied to
business purposes,
as well as develop
a process of
analysis to help
CIOs understand
how to engineer the
application of these
technologies to
their business
environments in a
Architecture of the social
networking space applied to
business needs, consists of
categorising business
communication modes,
based on the distinct
characteristics of
communication needs. (i.e
professional networking,
professional
communication,
professional knowledge
bases and professional
collaboration).
Professional
Knowledge Base
Document Repository
Shared knowledge
Creation.
Expert knowledge base
Professional
Collaboration
Distance learning
Virtual Work.
Problem Solving,
Product development
Professional
Networking
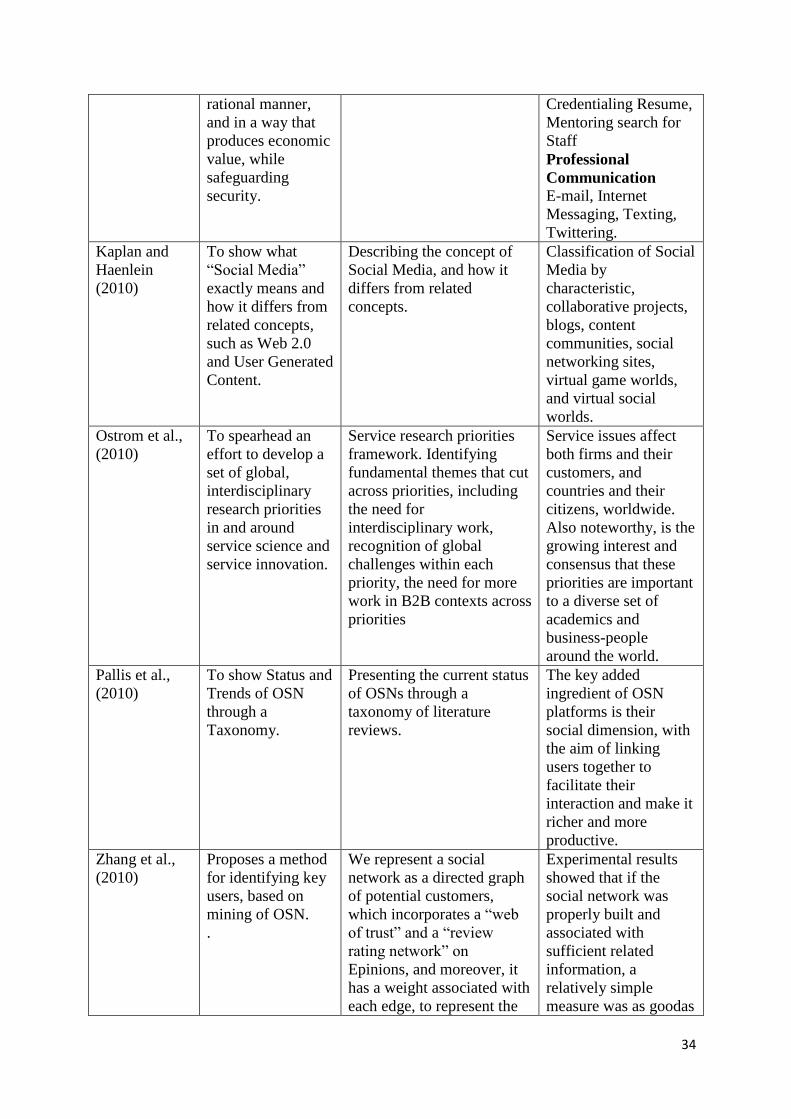
34
rational manner,
and in a way that
produces economic
value, while
safeguarding
security.
Credentialing Resume,
Mentoring search for
Staff
Professional
Communication
E-mail, Internet
Messaging, Texting,
Twittering.
Kaplan and
Haenlein
(2010)
To show what
“Social Media”
exactly means and
how it differs from
related concepts,
such as Web 2.0
and User Generated
Content.
Describing the concept of
Social Media, and how it
differs from related
concepts.
Classification of Social
Media by
characteristic,
collaborative projects,
blogs, content
communities, social
networking sites,
virtual game worlds,
and virtual social
worlds.
Ostrom et al.,
(2010)
To spearhead an
effort to develop a
set of global,
interdisciplinary
research priorities
in and around
service science and
service innovation.
Service research priorities
framework. Identifying
fundamental themes that cut
across priorities, including
the need for
interdisciplinary work,
recognition of global
challenges within each
priority, the need for more
work in B2B contexts across
priorities
Service issues affect
both firms and their
customers, and
countries and their
citizens, worldwide.
Also noteworthy, is the
growing interest and
consensus that these
priorities are important
to a diverse set of
academics and
business-people
around the world.
Pallis et al.,
(2010)
To show Status and
Trends of OSN
through a
Taxonomy.
Presenting the current status
of OSNs through a
taxonomy of literature
reviews.
The key added
ingredient of OSN
platforms is their
social dimension, with
the aim of linking
users together to
facilitate their
interaction and make it
richer and more
productive.
Zhang et al.,
(2010)
Proposes a method
for identifying key
users, based on
mining of OSN.
.
We represent a social
network as a directed graph
of potential customers,
which incorporates a “web
of trust” and a “review
rating network” on
Epinions, and moreover, it
has a weight associated with
each edge, to represent the
Experimental results
showed that if the
social network was
properly built and
associated with
sufficient related
information, a
relatively simple
measure was as goodas
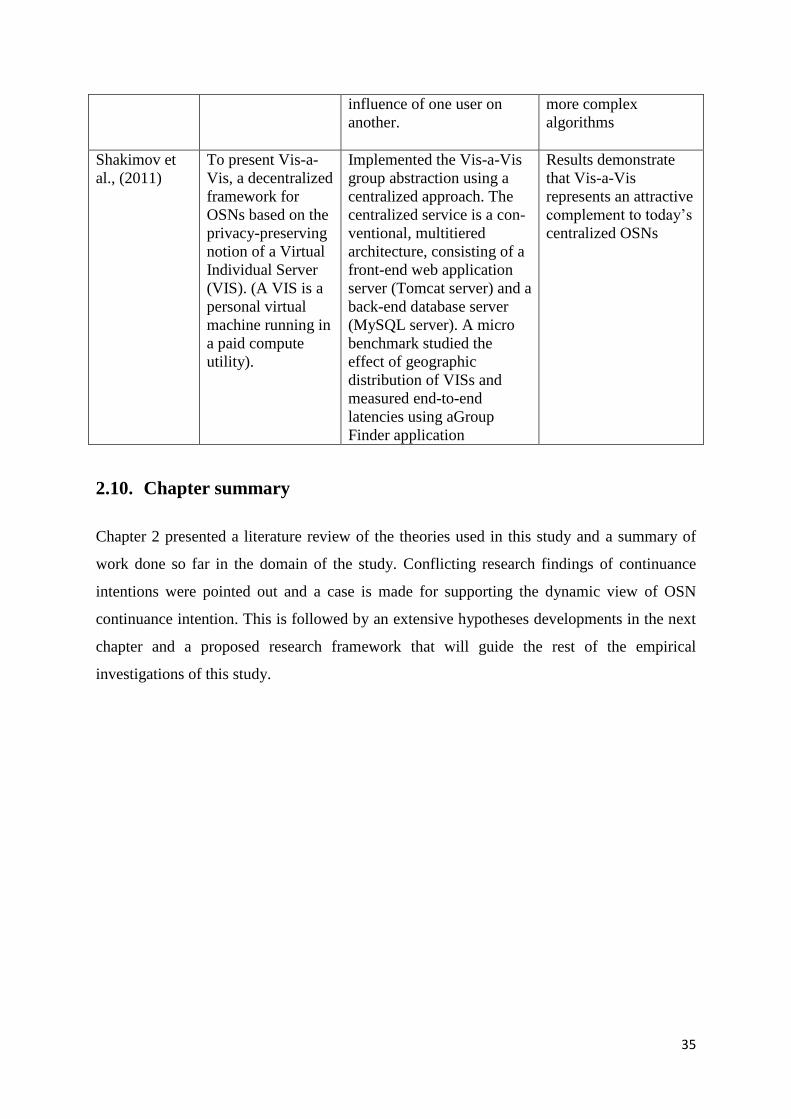
35
influence of one user on
another.
more complex
algorithms
Shakimov et
al., (2011)
To present Vis-a-
Vis, a decentralized
framework for
OSNs based on the
privacy-preserving
notion of a Virtual
Individual Server
(VIS). (A VIS is a
personal virtual
machine running in
a paid compute
utility).
Implemented the Vis-a-Vis
group abstraction using a
centralized approach. The
centralized service is a con-
ventional, multitiered
architecture, consisting of a
front-end web application
server (Tomcat server) and a
back-end database server
(MySQL server). A micro
benchmark studied the
effect of geographic
distribution of VISs and
measured end-to-end
latencies using aGroup
Finder application
Results demonstrate
that Vis-a-Vis
represents an attractive
complement to today’s
centralized OSNs
2.10. Chapter summary
Chapter 2 presented a literature review of the theories used in this study and a summary of
work done so far in the domain of the study. Conflicting research findings of continuance
intentions were pointed out and a case is made for supporting the dynamic view of OSN
continuance intention. This is followed by an extensive hypotheses developments in the next
chapter and a proposed research framework that will guide the rest of the empirical
investigations of this study.
36
CHAPTER 3: HYPOTHESIS DEVELOPMENTS
In this chapter, the study will develop a set of hypotheses to create a research model that
enables the researcher to realise the study objectives. The hypotheses will be logically
developed, on the basis of the factors of user satisfaction, perceived trust and social norm,
and perceived behavioural control. User satisfaction and continuance intention are selected
from ECT because of their strong relationship. Social norm and perceived behavioural
controls are selected from TPB because of their influence on behavioural intention. Finally,
perceived trust is selected from TST because trust plays important roles in business
transactions.
3.1 User satisfaction
Past electronic commerce studies have investigated online shopping intention, using factors
such as user continuance, acceptance decisions and purchase behaviour (Gefen et al. 2003,
Hsu et al. 2006). In particular, Bhattacherjee and Premkumar (2004) made a substantial
contribution in using ECT to study user satisfaction and continuance behaviour. User
satisfaction is posited as a linear function that is proportional to disconfirmation, which
defines the discrepancy between a user pre-adoption expectation and perceived performance
(Oliver 1980, Churchill and Suprenant 1982). The relationship between user satisfaction and
continuance intention is well supported by several research findings (Bhattacherjee 2001,
Liao et al. 2009, Yusliza and Ramayah 2011, Akter et al. 2013, Shiau and Luo 2013).
This premise leads us to the following hypothesis of OSN continuance intention:
H1: Users’ satisfaction with OSNs will positively influence their continuance intention to
use OSNs for business transactions.
Since user satisfaction is an important determinant of continuance intention, it could be
implied that a dissatisfied user will not only discontinue with the use of OSN, but may
influence other users that are deemed important to him/her. This behaviour, of users
influencing others or being influenced by others, is often called social norm, subjective norm,
peer influence or bandwagon effect (Kassim and Abdullah 2008, Ifinedo 2011). From TPB,
social norm refers to the perceived peer pressure to perform or not to perform a behaviour or
the perception of an individual that important people would approve/ disapprove of his/her
37
performing a given behaviour (Ajzen 2008). Extant studies on customer satisfaction scarcely
address the influence of satisfaction on social norm, creating a strong justification for further
investigation (Hsu and Chiu 2004).
This important premise leads us to the following hypothesis:
H2. Users’ satisfaction with OSNs will positively influence their ability to succumb to
pressure or to put pressure on others to use OSNs for business transactions.
Customer satisfaction is an overall customer attitude towards a service provider or an
emotional reaction to the difference between what customers expect and what they receive,
regarding the fulfillment of some need, goal or desire (Hansemark and Albinson 2004,
Danesh et al. 2012). Ultimately, customers will be expected to raise satisfaction with services
that are offered by an OSN when they trust the OSN (Kassim and Abdullah 2008). The trust
would develop when customers have confidence in the integrity of service providers (Wu et
al. 2010) and would decide to do business with OSN of their choice, because they are
satisfied with that platform (Stranahan and Kosiel 2007). Previous studies have suggested
that customer satisfaction has influence on perceived trust and vice versa (Kassim and
Abdullah 2008, Kim et al. 2009, Deng et al. 2010, Suki 2011, Danesh et al. 2012).
Consequently, the following research hypothesis is stated:
H3: Users’ satisfaction with OSNs will positively influence their perceived trust in OSNs
for business transactions.
3.2 Perceived trust
Several studies have focused on various issues of trust in electronic business (Bhattacherjee
2000, Awad and Ragowsky 2008, Choudhury and Karahanna 2008, Kim et al. 2008, Vance et
al. 2008, Urban et al. 2009, Lu et al. 2010, Beatty et al. 2011). Trust is found on personal
correlations and interactions between customers and vendors, it affects customer confidence
in vendor’s performance and can grow the customer’s positive feeling to repeat visits to the
website (Xu and Liu 2010).
Trust is what we do; it is a calculation of the likelihood of future cooperation and the
manifestation of one’s belief in thoughts and actions. For example, trust says the Twitter
38
OSN can be used for business transactions and I will use it to transact business. Moreover,
TST appears to suggest that perceived trust for OSN has a relationship with continuance
intention. Since perceived trust influences user satisfaction (Kassim and Abdullah 2008, Kim
et al. 2009, Deng et al. 2010) and user satisfaction influences continuance intention
(Bhattacherjee 2001, Liao et al. 2009, Yusliza and Ramayah 2011, Akter et al. 2013, Shiau
and Luo 2013), one could then say that, by transitivity, perceived trust will influence
continuance intention.
Consequently, the following hypothesis is stated:
H4: Perceived trust in OSNs will positively influence continuance intention of users to use
OSNs for business transactions.
If customers do not trust an OSN, they will possibly be dissatisfied with the services provided
by the OSN and their intentions for continued patronage could be negatively affected. This
negative radiance of user satisfaction can potentially be communicated to seven to 15
important persons. This statement is supported by a popular saying that “every satisfied
customer goes to tell one to three persons, but an unsatisfied customer tells seven to 15
others”. The greater the perceived trust among people, the more favourable will be the social
norm, with respect to knowledge sharing (Chow and Chan 2008).
Consequently, the following hypothesis is put forward:
H5: Perceived trust in OSNs will positively influence the ability of users to succumb to
pressure or to put pressure on others, to use OSNs for business transactions.
3.3 Social norm
Previous technology acceptance studies have provided evidence for the relationship between
social norm (SN) and adoption intention (Taylor and Todd 1995, Venkatesh and Davis 2000,
Anderson and Agarwal 2010). Their measure of social norm is similar to interpersonal
influence, in which interpersonal and external influences are two components, explaining
social norm as an important predictor of intention to use electronic brokerage services
(Bhattacherjee 2000).
In other words, social norm is related to normative belief about the expectation from another
person. This could be formed as the normative belief of an individual, concerning a reference
39
that is influenced by the motivation to comply with the referent under discussion (Liao, et al.
2006). There are research findings, which provide strong justification for the relationship
between social norm and continuance intention (Kwong and Park 2008, Anderson and
Agarwal 2010, Lee 2010).
The following hypothesis is therefore proposed:
H6: The ability of users to succumb to pressure or to put pressure on others to use OSNs,
will positively influence their continuance intention to use OSNs for business
transactions.
3.4 Perceived behavioural control
The TPB is widely applied to explain the impact of the behavioural decision-making process,
of which perceived behavioural control (PBC) is a predictor of behaviour (Taylor and Todd
1995, Ajzen 2008). PBC is the extent to which one believes to have adequate control over his
or her behaviour (Ajzen 1991). In essence, the inclusion of PBC into this OSN model allows
us to generalize the model. Many researchers have performed numerous empirical
evaluations of TPB in psychology literature, to discover that PBC is a combination of two
distinct, but related components of self-efficacy and controllability (Sparks et al. 1997,
Armitage and Connor 1999, Ajzen 2002, Bhattacherjee et al. 2008).
Self-efficacy reflects one’s conviction in his or her ability to independently perform an
intended behaviour, while controllability refers to one’s perceived control over external
resources needed to perform that behaviour (Ajzen 2002). These two components have been
shown to be associated with user satisfaction and continuance intention (Manstaed and
Eekelen 1998, Armitage and Connor 1999, Joo et al. 2000, Eastin 2002, Trafimow et al.
2002, Hsu and Chiu 2004).
The below hypotheses are therefore stated:
H7: PBC over OSNs will positively influence users’ satisfaction with OSNs for business
transactions.
H8: PBC over OSNs will positively influence continuance intention of users to use OSNs
for business transactions.
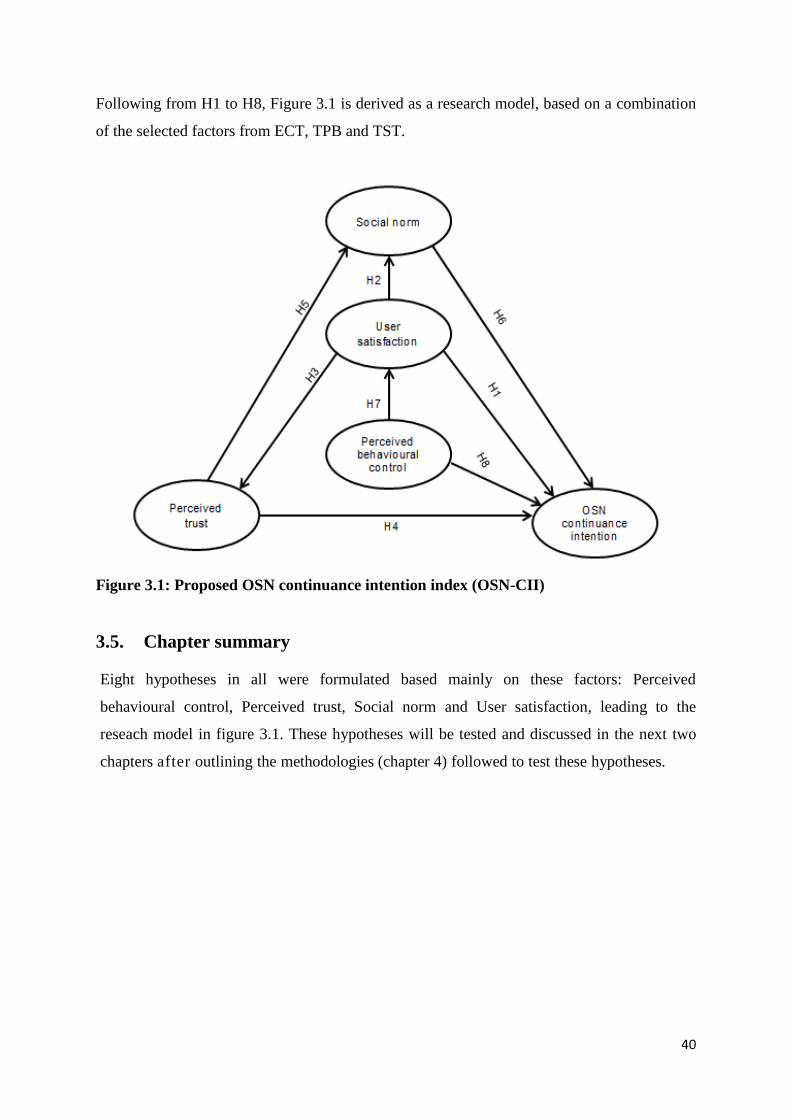
40
Following from H1 to H8, Figure 3.1 is derived as a research model, based on a combination
of the selected factors from ECT, TPB and TST.
Figure 3.1: Proposed OSN continuance intention index (OSN-CII)
3.5. Chapter summary
Eight hypotheses in all were formulated based mainly on these factors: Perceived
behavioural control, Perceived trust, Social norm and User satisfaction, leading to the
reseach model in figure 3.1. These hypotheses will be tested and discussed in the next two
chapters after outlining the methodologies (chapter 4) followed to test these hypotheses.
41
CHAPTER 4: RESEARCH METHODOLOGY
This chapter discusses the methodology of this study. In an attempt to validate the research
hypotheses, the following steps were followed: First the model design process is set out,
followed by the research method, respondents and sampling procedure, surveys procedure
and the survey model used. The rationale for the selected statistical methods is discussed,
while ethical considerations, and matters of confidentiality are also presented. Lastly,
authenticity of the data collection process is presented.
4.1 Research Design
The research design is the general plan on how the research questions will be addressed
(Saunders et al. 2007), and conveys both the structure of the research problem and the plan of
investigation. A research model was developed to address issues raised in this thesis, based
on the three theoretical frameworks used. The instrument is a qualitative framework to
explore the factors for business transactions on OSN. The constructs used as survey items,
were drawn from a host of pre-validated ECM, TST and TPB studies, including:
Bhattacherjee (2001), (modified for OSNs for business transactions) and Devaraj et al.
(2002), Davis (1989) and Davis (1989); Gefen et al (2003) (modified for OSNs for business
transactions).
The above factors were reworded to fit this study, and categorized into:
Dependent variable: OSN continuance intention for business transactions.
Independent variables: demographics, perceived trust, user satisfaction, perceived
behavioural control, social norm and continuation intention.
A 5-point Likert-scale, ranging from (1) strongly disagree to (5) strongly agree, was used to
measure the factors, and the model was hosted online for data collection.
4.1.1 Model design process
The assessment model, having used the items mentioned above, ended up as a ten factor
model, including demographics and was forwarded to postgraduate students at Durban
University of Technology (DUT) to complete and comment on. Comments, ranging from
inconsistency of wording, to ambiguity in understanding of questions, were received and used
42
to fine tune the model before hosting it. The instrument was examined to ensure content
validity and reliability, and divergent validity within the target context. Factors such as OSN
demographics, PBC, social norm, satisfaction, Perceived trust and continuance intention,
were the factors tested, among a targeted population sample of 300 participants (Bearden et
al. 1982).
There are three types of research; exploratory, descriptive and casual. Each of these is more
valuable than the other, depending on the circumstances, the nature of the issue at stake and
the audience it is meant for. Exploratory studies provide a valuable means in analysing
current situations; seeking new insights and assessing developments in different contexts
(Robson 2002).
If the nature of the problem is unclear or the area of investigation is very new, (as in this case
of OSN for business transactions), an exploratory research can be very useful (Cooper and
Schindler 2003, Saunders et al. 2007). According to Saunders et al. (2007) there are three
principle methods of conducting an exploratory research: searching existing literature,
interviewing ‘experts’ in the subject, and conducting focus group interviews.
A key characteristic is the flexibility of this approach (Ghauri and Gronhaug 2005). However,
on review of the literature for a more concise investigation, this study revised the method for
this thesis, due to the robustness and the nature of the issue this study intends to address,
making it an empirical analysis, with the below method.
4.2 Research method
After three months of hosting the assessment model on the researcher`s online social
network, for friends to fill in, the survey responses were very poor, which led the researcher
to seek the assistance of the online survey agent ‘SurveyMonkey’, to collect data on the web
by sending the model to respondents in their database. The questions were formulated in such
a way, that only people using OSN to transact business would find it meaningful to answer,
as it addresses key and technical concepts not common to unfamiliar persons.
The survey model asked, the participants a series of pre-established questions with a limited
set of response categories, meant to disqualify intruders. A 5-point Linkert scale rating, as
43
indicated earlier on, was used, ranging from (1) strongly disagree to (5) strongly agree, to
measure the relative importance of constructs.
Through this agent, who has a database of respondents specifically for this targeted sample,
clients were contacted who qualify as target persons for such an assignment, sending them
the web address for the model. The survey, whils on the web and through the web link
address, allowed the researcher to monitor respondents through the IP address accompanying
all responses, ensuring respondents were within the targeted group.
4.2.1 Respondents and sampling procedure
Data were collected from online buyers and sellers who have accounts with Twitter and
LinkedIn, and are members of Survey Monkey’s panel of networks. A sample population of
317 (Bearden et al. 1982) was collected, with 17 disqualified due to various inconsistencies.
Physical evidence, in the form of printouts of responses, was collected and filed for reference
during analyses and write ups. The advantages of such data collection are
(1) Faster responses,
(2) Lower cost, and
(3) A geographically unrestricted sample (Bhattacherjee 2001).
4.2.2 Surveys
In business research there is great use of questionnaires (Saunders et al. 2007). This is
explained by Hutton (1990) as “The method of collecting information, by asking a set of pre-
formulated questions, in a predetermined sequence, in a structured questionnaire, to a sample
of individuals drawn so as to be representative of a defined population”. This method was
deemed appropriate to solicit information from people who visit Social Networking Sites
(ONSs) because such users of ONSs, are widely dispersed but can be reached with
technology such as Web 2.0.
This method was selected, due to its low cost and time efficient nature. Another benefit of
using this method is that it allowed targeting of a larger audience, without territorial
boundaries, rather than a narrow selection; yielding important, quantifiable data.
44
4.2.3 Survey Model Used
Using a questionnaire was an ideal method for this contemporary study, as it works best with
standardized questions, which does not leave much room for different interpretations
(Saunders et al. 2007). The targeted audience received details of the survey model through
the use of electronic mail, instructing them to either go to a social networking site or a web
address, sent to them for participation.
The selection, by using a digital format over a traditional format (i.e. mail/web), was a well-
considered decision, as the former has a higher level of cost efficiency, can reach a wider
audience and the data are more easily transferable for analysis purposes, Again, this allowed
a real-time collation of results, as this study could observe participation directly from the web
site (while the latter is expensive, time consuming and has a very low rate of response).
The design and content of the questionnaire was deemed very important, as it can determine
the response rate (Saunders et al. 2007). The questions were developed considering the
research questions and the literature review. The final questionnaire had 10 close ended
questions (Appendix A), with a matrix of options under each question, and divided over 10
categories, giving respondents a more realistic impression and creating a better overview of
ONSs.
The model was developed using the sophisticated software of SurveyMonkey, which enabled
the author to exploit useful features, including live statistics and the output of data, in a
format used for SPSS and any other analytical software. SurveyMonkey also allowed the
author to design an accessible and powerful model, with the researcher`s choice of colors,
line spacing and display styles. The font size and colors can impact the reader; hence special
attention was paid to selecting the most comfortable setting. The model could be completed
by anyone who is a user of OSN sites, without being contacted by an agent.
4.2.4 Rationale for selected statistical Methods
By conducting a further literature review, the researcher had a better understanding of what
knowledge exists and what knowledge needs to be created, in order to accomplish the
research objectives. This led to a review of a number of existing methods, after which it was
decided to select the Partial Least Square Structural Equation Modelling (PLS-SEM)
45
methods, with which to evaluate the continuation intention of OSN sites for business
transactions.
PLS is a strong approach for work intended to develop and refine theories. In contrast to
techniques for structural modelling, such as Amos and Lisrel, PLS makes less severe
assumptions about theoretical closure in models (Chin and Newsted 1999, and Gefen et al.
2003). Where Amos and Lisrel are strong approaches to testing the fit of fully developed
models, PLS is a superior approach for developing and refining theoretical models (Table
4.1).
PLS is an advanced statistical method that allows optimal empirical assessment of a structural
(theoretical) model, together with its measurement model (Gefen et al. 2003). It first
estimates loading of indicators on constructs and then iteratively estimates causal
relationships among constructs (Fornell 1982).
SEM is a second generation, multivariate analysis technique that combines features of first
generation techniques, such as principal component and linear regression analysis (Fornell
1982). SEM is particularly useful for the process of developing and testing theories and has
become a quasi-standard in research (Hair et al. 2012, Ringle et al. 2012). When estimating
structural equation models, researchers must choose between two different statistical
methods: covariance-based (CB) SEM and variance-based partial least squares (PLS) path
modelling, also referred to as PLS-SEM (Hair et al. 2012, Chin and Newsted 1999).
These two approaches to SEM differ greatly in their underlying philosophy and estimation
objectives (Henseler et al. 2009). CB-SEM is a confirmatory approach that can test model’s
theoretically established relationships. In contrast, PLS-SEM is a prediction-oriented,
variance-based approach that focuses on endogenous target constructs in the model and aims
at maximizing their explained variance (i.e., their R2 value).
WarpPLS software specifies nonlinear relationships among latent variables. It can perform a
standard PLS regression, robust path analysis, or a WarpPLS regression analysis and allows
for the use of three alternative resampling algorithms, namely: bootstrapping, jackknifing,
and blindfolding (Kock 2010).
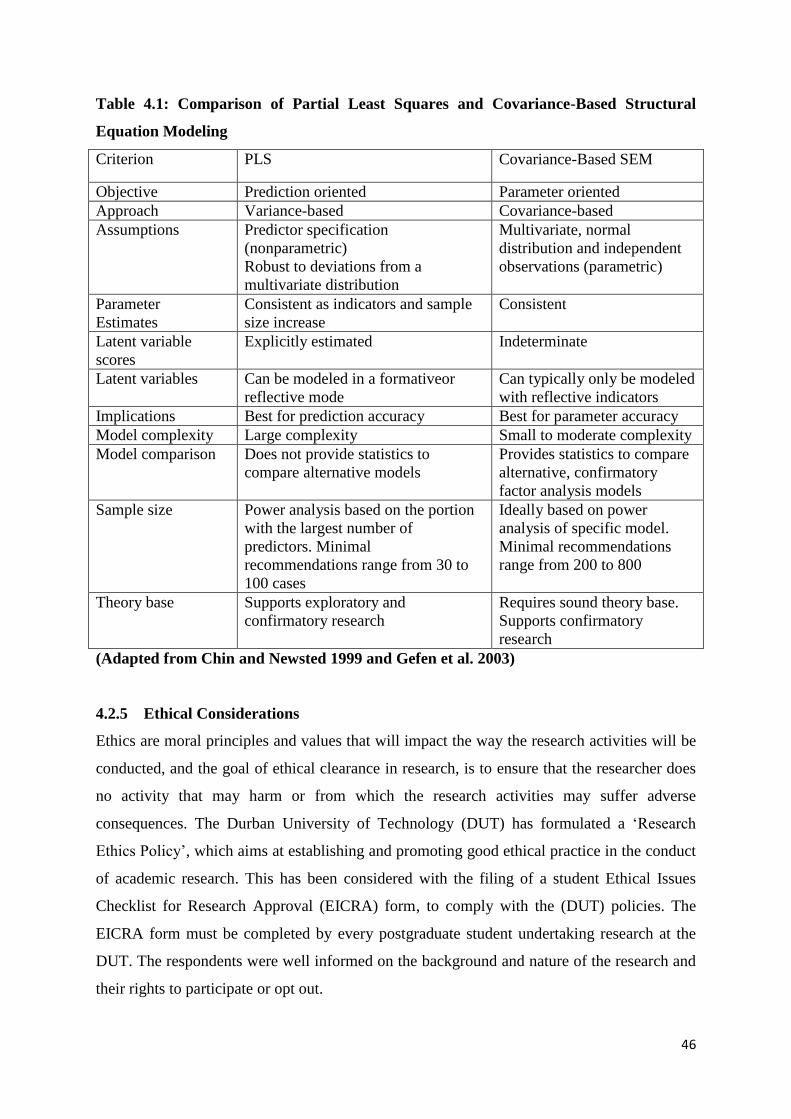
46
Table 4.1: Comparison of Partial Least Squares and Covariance-Based Structural
Equation Modeling
Criterion PLS Covariance-Based SEM
Objective Prediction oriented Parameter oriented
Approach Variance-based Covariance-based
Assumptions Predictor specification
(nonparametric)
Robust to deviations from a
multivariate distribution
Multivariate, normal
distribution and independent
observations (parametric)
Parameter
Estimates
Consistent as indicators and sample
size increase
Consistent
Latent variable
scores
Explicitly estimated Indeterminate
Latent variables Can be modeled in a formativeor
reflective mode
Can typically only be modeled
with reflective indicators
Implications Best for prediction accuracy Best for parameter accuracy
Model complexity Large complexity Small to moderate complexity
Model comparison Does not provide statistics to
compare alternative models
Provides statistics to compare
alternative, confirmatory
factor analysis models
Sample size Power analysis based on the portion
with the largest number of
predictors. Minimal
recommendations range from 30 to
100 cases
Ideally based on power
analysis of specific model.
Minimal recommendations
range from 200 to 800
Theory base Supports exploratory and
confirmatory research
Requires sound theory base.
Supports confirmatory
research
(Adapted from Chin and Newsted 1999 and Gefen et al. 2003)
4.2.5 Ethical Considerations
Ethics are moral principles and values that will impact the way the research activities will be
conducted, and the goal of ethical clearance in research, is to ensure that the researcher does
no activity that may harm or from which the research activities may suffer adverse
consequences. The Durban University of Technology (DUT) has formulated a ‘Research
Ethics Policy’, which aims at establishing and promoting good ethical practice in the conduct
of academic research. This has been considered with the filing of a student Ethical Issues
Checklist for Research Approval (EICRA) form, to comply with the (DUT) policies. The
EICRA form must be completed by every postgraduate student undertaking research at the
DUT. The respondents were well informed on the background and nature of the research and
their rights to participate or opt out.
47
4.2.6 Confidentiality
Though there were no issues of confidentiality, as respondents’ names and identities were not
sought, the study followed DUT guidelines. Respondents were assured of confidentiality, to
alleviate the concerns of those who might not realise that confidentiality threats are absent
from the survey.
4.3 Authenticity of the Data
Due to the understanding of the respondents not being checked first hand, though some initial
work was done during the pre-testing stage with DUT post-graduates, issues of accuracy can
be raised (Blaxter et al. 2001). This issue was resolved by striving to maintain straightforward
questions, leaving no space for misinterpretation. Again, as the survey was web-based, the
responses were monitored through the web link address, and through the IP address that
accompanies all responses, to ensure respondents remained within the targeted group.
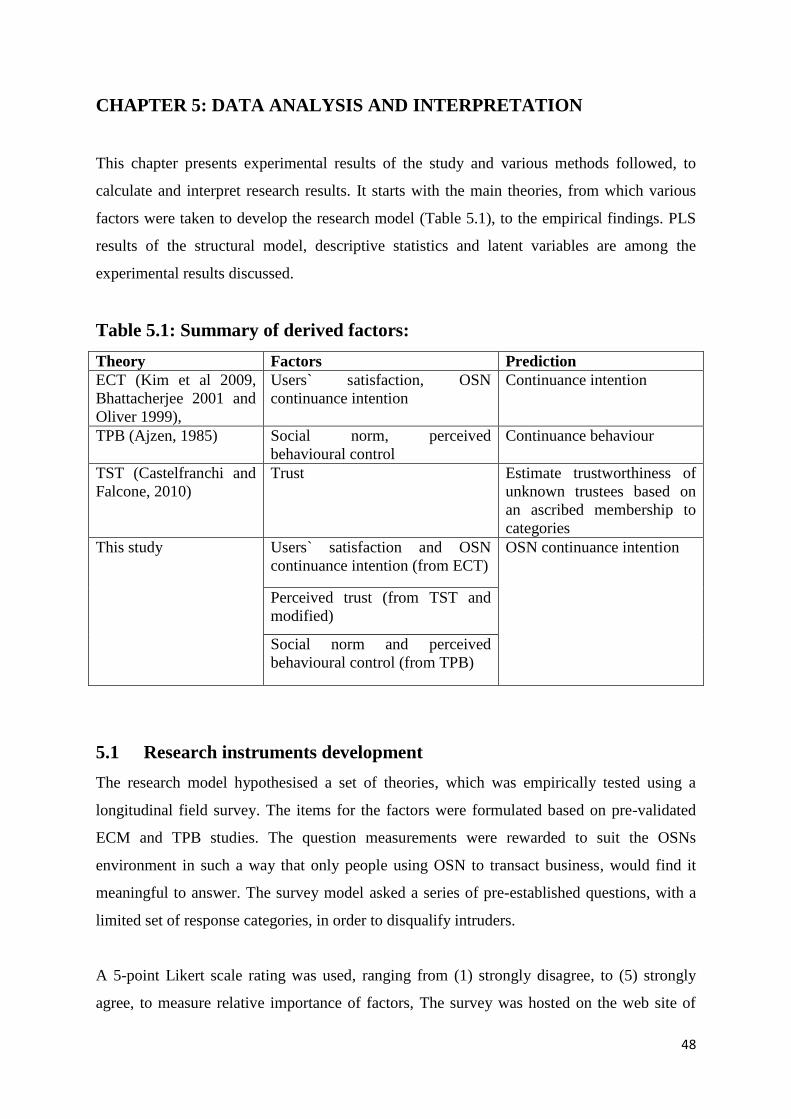
48
CHAPTER 5: DATA ANALYSIS AND INTERPRETATION
This chapter presents experimental results of the study and various methods followed, to
calculate and interpret research results. It starts with the main theories, from which various
factors were taken to develop the research model (Table 5.1), to the empirical findings. PLS
results of the structural model, descriptive statistics and latent variables are among the
experimental results discussed.
Table 5.1: Summary of derived factors:
Theory Factors Prediction
ECT (Kim et al 2009,
Bhattacherjee 2001 and
Oliver 1999),
Users` satisfaction, OSN
continuance intention
Continuance intention
TPB (Ajzen, 1985) Social norm, perceived
behavioural control
Continuance behaviour
TST (Castelfranchi and
Falcone, 2010)
Trust Estimate trustworthiness of
unknown trustees based on
an ascribed membership to
categories
This study Users` satisfaction and OSN
continuance intention (from ECT)
OSN continuance intention
Perceived trust (from TST and
modified)
Social norm and perceived
behavioural control (from TPB)
5.1 Research instruments development
The research model hypothesised a set of theories, which was empirically tested using a
longitudinal field survey. The items for the factors were formulated based on pre-validated
ECM and TPB studies. The question measurements were rewarded to suit the OSNs
environment in such a way that only people using OSN to transact business, would find it
meaningful to answer. The survey model asked a series of pre-established questions, with a
limited set of response categories, in order to disqualify intruders.
A 5-point Likert scale rating was used, ranging from (1) strongly disagree, to (5) strongly
agree, to measure relative importance of factors, The survey was hosted on the web site of
49
SurveyMonkey, and through the web link address, respondents were monitored through their
IP address and emails that accompany all responses, to ensure there were no repetitions of
responses. The model was administered to Twitter and LinkedIn buyers and sellers doing
business on OSN.
5.2 Data collection
Collecting psychological data over the World-Wide Web (WWW) is becoming a common
phenomenon, particularly in the form of online surveys and psychometric testing (Silverstein
et al. 2007). However, researchers who have no skill in computer programming or are pressed
for time, will have to pay a programmer to undertake the work, or else utilise pre-existing
applications (such as SurveyMonkey).
SurveyMonkey has been used by numerous researchers (Wright 2005, Buchanan and
Hvizdak 2009, Hegarty et al. 2009, Custin and Barkacs 2010, Lambeth 2013) to administer
online surveys, resulting in exceptional results. This survey instrument was designed with
SurveyMonkey`s applications and co-conducted at www.surveymonkey.com, with data
finally collated on August 23, 2013, by means of an online survey, accessible for evaluation
at SurveyMonkey.
Web-based surveys have many advantages over traditional, paper-based methods
(Bhattacherjee 2001, Wright 2005), such as being convenient, cheap, fast, more accurate, and
with the ability to survey hard-to-reach respondents who are only loyal to certain agents.
Even though only respondents who are able to access the Internet were able to participate in
this survey, this bias is exactly what was desired for this study; people who do business on
OSN will have to have access to the Internet.
5.2.1 Subject
The online survey was administered to respondents who use OSNs to buy and sell products,
as an example of OSN business transactions. Although users of other OSNs were
accommodated in the survey, the emphasis was on Twitter and LinkedIn because of their
growing popularity for business models (Pallis et al 2011). Twitter is a microblogging service
that has grown rapidly in the three years of its existence. In that period, it commanded more
50
than 41 million users, over 41.7 million user profiles, 1.47 billion social relations, 4 262
trending topics and 106 million tweets (Kwak et al. 2010).
In addition, if an OSN is to be used as a facility geared toward career management or
business goals, an OSN with a more serious corporate image, such as LinkedIn, is preferred
(Cutillo et al. 2009). Finally, the online survey tool from SurveyMonkey was used to collect
data from respondents. Online surveys have several advantages such as allowing for fast
response, lower cost, hard to reach subjects, and vast geographical boundaries, as opposed to
traditional, paper-based surveys (Bhattacherjee 2001, Wright 2005).
Subjects were drawn from SurveyMonkey’s database, which posted a message on the online
survey and invited interested individuals to fill out the survey. An introductory letter
explained the essence of the survey to the subjects and assured them of confidentiality. The
online survey yielded a total of 317 responses, with 300 of these being valid responses, that
were used for analysis.
5.2.2 Measurement items
Five factors were measured by multiple item scales, adopted from pre-validated measures in
social science, marketing and information system studies. The measurement items were
reworded to suit the OSN context. In order to ensure the modified measurement items are
applicable, a pre-test was performed using lecturers and postgraduate students at DUT in
South Africa.
Several issues regarding semantic wordings, consistency of format and length of texts were
raised and were factored into the model design, to fine tune the measurement instrument. The
measurement instrument consisted of two parts, the first dealt with demography about the
subjects and the second with items to measure the theoretical factors of the proposed OSN
model. The demographic information included gender, age and rating of the residential area,
among others. In order to be more precise, subjects were asked to rate using the 5-point
Likert scale ratings already mentioned. Table 5.2 shows these measurement items, their
operational measurements and closely related sources.
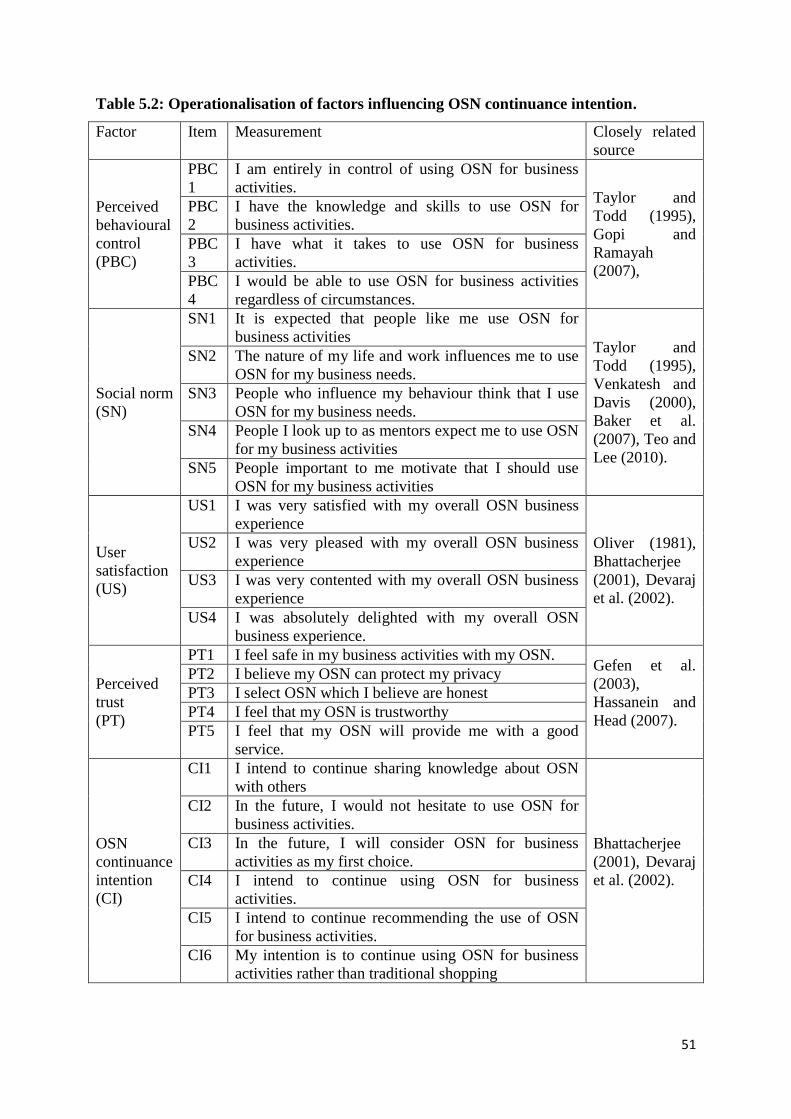
51
Table 5.2: Operationalisation of factors influencing OSN continuance intention.
Factor Item Measurement Closely related
source
Perceived
behavioural
control
(PBC)
PBC
1
I am entirely in control of using OSN for business
activities. Taylor and
Todd (1995),
Gopi and
Ramayah
(2007),
PBC
2
I have the knowledge and skills to use OSN for
business activities.
PBC
3
I have what it takes to use OSN for business
activities.
PBC
4
I would be able to use OSN for business activities
regardless of circumstances.
Social norm
(SN)
SN1 It is expected that people like me use OSN for
business activities Taylor and
Todd (1995),
Venkatesh and
Davis (2000),
Baker et al.
(2007), Teo and
Lee (2010).
SN2 The nature of my life and work influences me to use
OSN for my business needs.
SN3 People who influence my behaviour think that I use
OSN for my business needs.
SN4 People I look up to as mentors expect me to use OSN
for my business activities
SN5 People important to me motivate that I should use
OSN for my business activities
User
satisfaction
(US)
US1 I was very satisfied with my overall OSN business
experience
Oliver (1981),
Bhattacherjee
(2001), Devaraj
et al. (2002).
US2 I was very pleased with my overall OSN business
experience
US3 I was very contented with my overall OSN business
experience
US4 I was absolutely delighted with my overall OSN
business experience.
Perceived
trust
(PT)
PT1 I feel safe in my business activities with my OSN. Gefen et al.
(2003),
Hassanein and
Head (2007).
PT2 I believe my OSN can protect my privacy
PT3 I select OSN which I believe are honest
PT4 I feel that my OSN is trustworthy
PT5 I feel that my OSN will provide me with a good
service.
OSN
continuance
intention
(CI)
CI1 I intend to continue sharing knowledge about OSN
with others
Bhattacherjee
(2001), Devaraj
et al. (2002).
CI2 In the future, I would not hesitate to use OSN for
business activities.
CI3 In the future, I will consider OSN for business
activities as my first choice.
CI4 I intend to continue using OSN for business
activities.
CI5 I intend to continue recommending the use of OSN
for business activities.
CI6 My intention is to continue using OSN for business
activities rather than traditional shopping
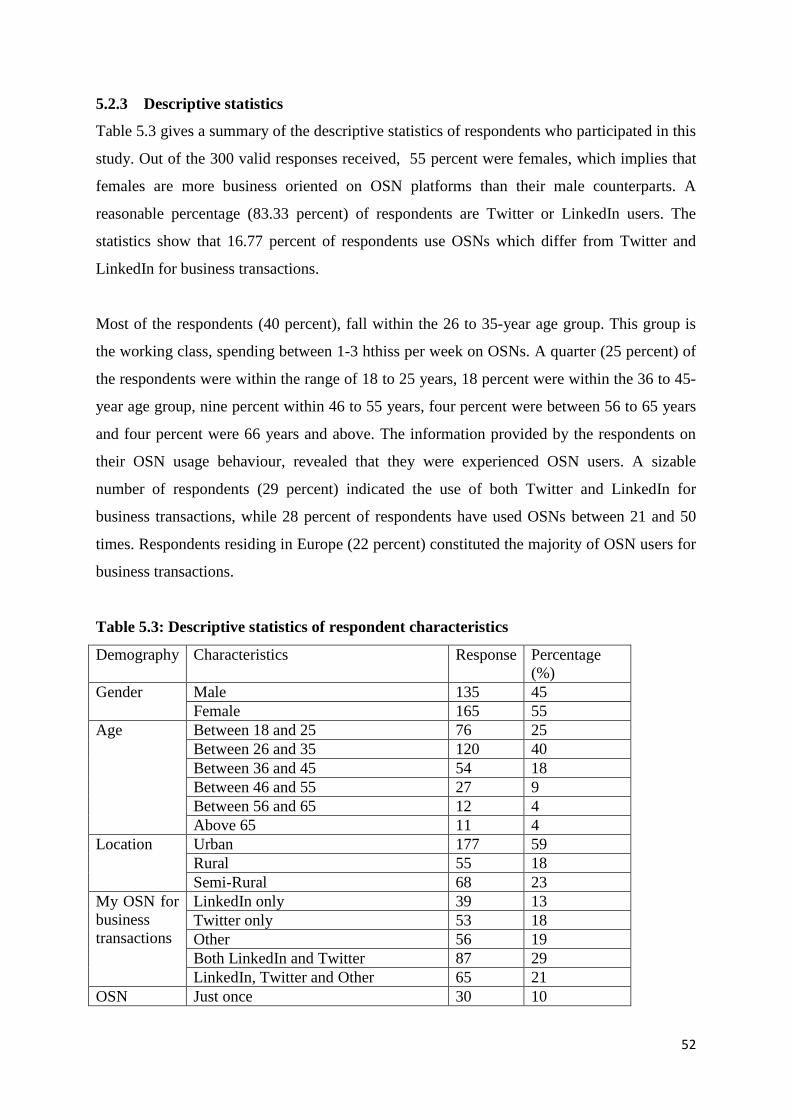
52
5.2.3 Descriptive statistics
Table 5.3 gives a summary of the descriptive statistics of respondents who participated in this
study. Out of the 300 valid responses received, 55 percent were females, which implies that
females are more business oriented on OSN platforms than their male counterparts. A
reasonable percentage (83.33 percent) of respondents are Twitter or LinkedIn users. The
statistics show that 16.77 percent of respondents use OSNs which differ from Twitter and
LinkedIn for business transactions.
Most of the respondents (40 percent), fall within the 26 to 35-year age group. This group is
the working class, spending between 1-3 hthiss per week on OSNs. A quarter (25 percent) of
the respondents were within the range of 18 to 25 years, 18 percent were within the 36 to 45-
year age group, nine percent within 46 to 55 years, four percent were between 56 to 65 years
and four percent were 66 years and above. The information provided by the respondents on
their OSN usage behaviour, revealed that they were experienced OSN users. A sizable
number of respondents (29 percent) indicated the use of both Twitter and LinkedIn for
business transactions, while 28 percent of respondents have used OSNs between 21 and 50
times. Respondents residing in Europe (22 percent) constituted the majority of OSN users for
business transactions.
Table 5.3: Descriptive statistics of respondent characteristics
Demography Characteristics Response Percentage
(%)
Gender Male 135 45
Female 165 55
Age Between 18 and 25 76 25
Between 26 and 35 120 40
Between 36 and 45 54 18
Between 46 and 55 27 9
Between 56 and 65 12 4
Above 65 11 4
Location Urban 177 59
Rural 55 18
Semi-Rural 68 23
My OSN for
business
transactions
LinkedIn only 39 13
Twitter only 53 18
Other 56 19
Both LinkedIn and Twitter 87 29
LinkedIn, Twitter and Other 65 21
OSN Just once 30 10
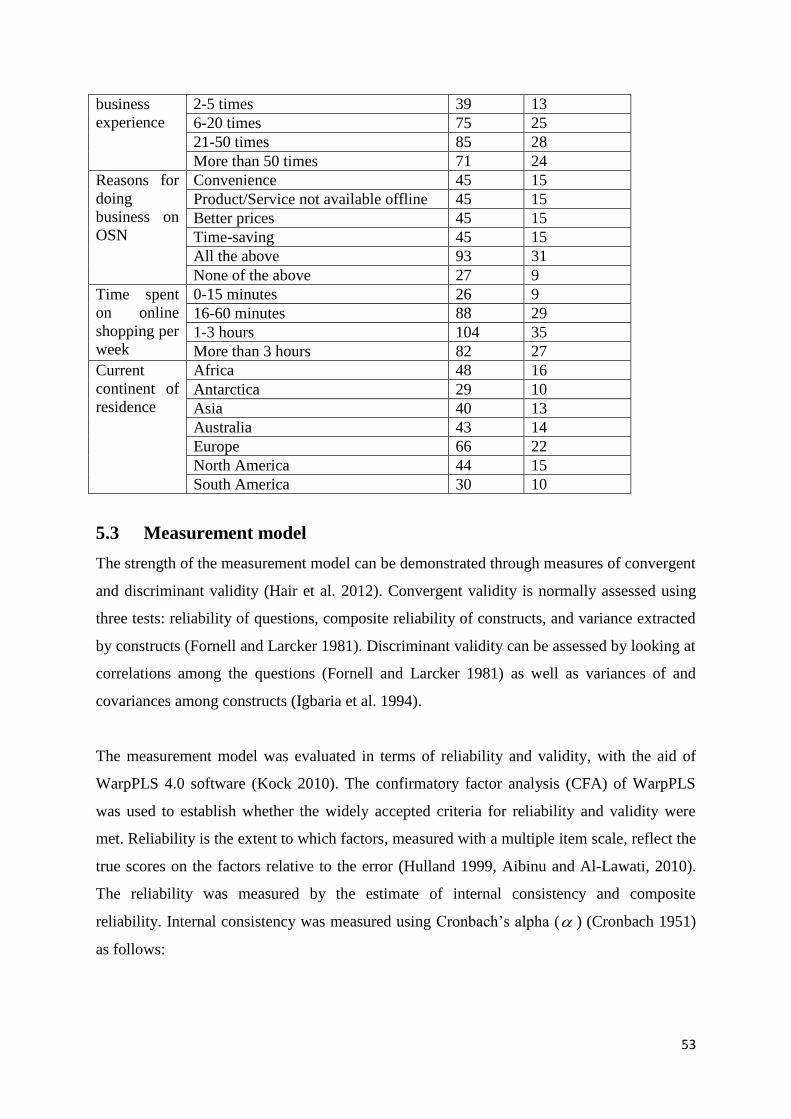
53
business
experience
2-5 times 39 13
6-20 times 75 25
21-50 times 85 28
More than 50 times 71 24
Reasons for
doing
business on
OSN
Convenience 45 15
Product/Service not available offline 45 15
Better prices 45 15
Time-saving 45 15
All the above 93 31
None of the above 27 9
Time spent
on online
shopping per
week
0-15 minutes 26 9
16-60 minutes 88 29
1-3 hours 104 35
More than 3 hours 82 27
Current
continent of
residence
Africa 48 16
Antarctica 29 10
Asia 40 13
Australia 43 14
Europe 66 22
North America 44 15
South America 30 10
5.3 Measurement model
The strength of the measurement model can be demonstrated through measures of convergent
and discriminant validity (Hair et al. 2012). Convergent validity is normally assessed using
three tests: reliability of questions, composite reliability of constructs, and variance extracted
by constructs (Fornell and Larcker 1981). Discriminant validity can be assessed by looking at
correlations among the questions (Fornell and Larcker 1981) as well as variances of and
covariances among constructs (Igbaria et al. 1994).
The measurement model was evaluated in terms of reliability and validity, with the aid of
WarpPLS 4.0 software (Kock 2010). The confirmatory factor analysis (CFA) of WarpPLS
was used to establish whether the widely accepted criteria for reliability and validity were
met. Reliability is the extent to which factors, measured with a multiple item scale, reflect the
true scores on the factors relative to the error (Hulland 1999, Aibinu and Al-Lawati, 2010).
The reliability was measured by the estimate of internal consistency and composite
reliability. Internal consistency was measured using Cronbach’s alpha ( ) (Cronbach 1951)
as follows:
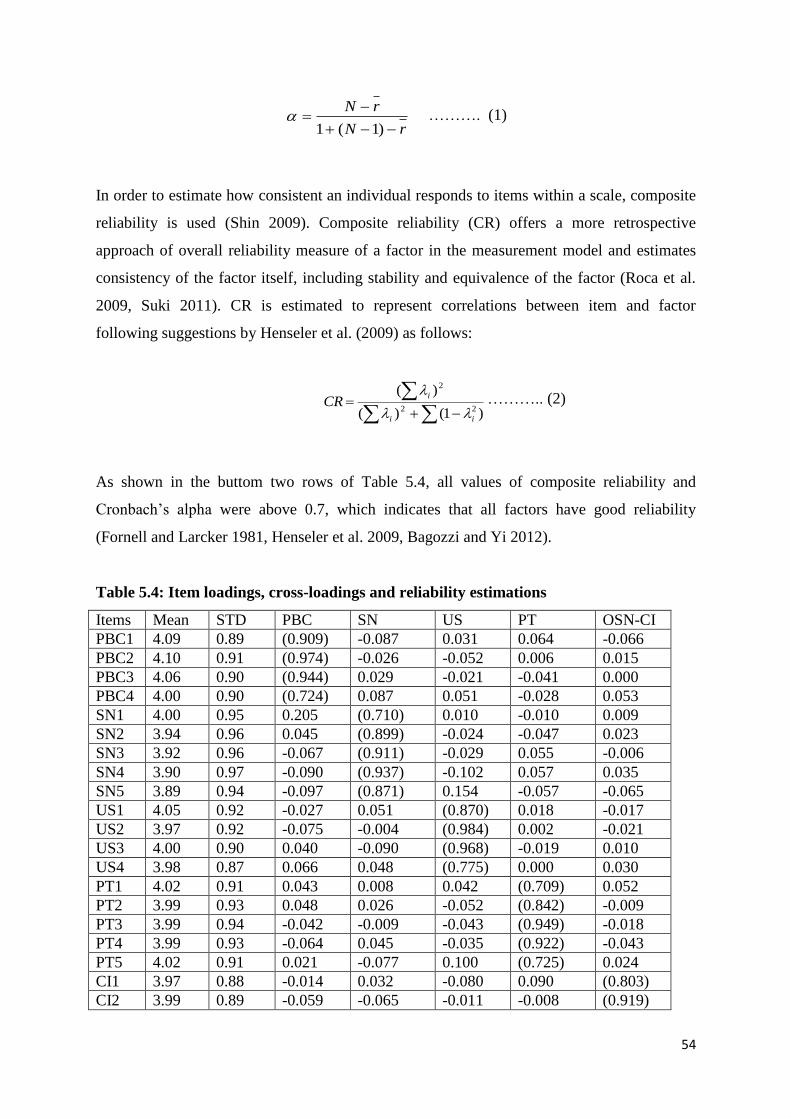
54
rN
rN
)1(1 ………. (1)
In order to estimate how consistent an individual responds to items within a scale, composite
reliability is used (Shin 2009). Composite reliability (CR) offers a more retrospective
approach of overall reliability measure of a factor in the measurement model and estimates
consistency of the factor itself, including stability and equivalence of the factor (Roca et al.
2009, Suki 2011). CR is estimated to represent correlations between item and factor
following suggestions by Henseler et al. (2009) as follows:
)1()(
)(
22
2
ii
iCR
……….. (2)
As shown in the buttom two rows of Table 5.4, all values of composite reliability and
Cronbach’s alpha were above 0.7, which indicates that all factors have good reliability
(Fornell and Larcker 1981, Henseler et al. 2009, Bagozzi and Yi 2012).
Table 5.4: Item loadings, cross-loadings and reliability estimations
Items Mean STD PBC SN US PT OSN-CI
PBC1 4.09 0.89 (0.909) -0.087 0.031 0.064 -0.066
PBC2 4.10 0.91 (0.974) -0.026 -0.052 0.006 0.015
PBC3 4.06 0.90 (0.944) 0.029 -0.021 -0.041 0.000
PBC4 4.00 0.90 (0.724) 0.087 0.051 -0.028 0.053
SN1 4.00 0.95 0.205 (0.710) 0.010 -0.010 0.009
SN2 3.94 0.96 0.045 (0.899) -0.024 -0.047 0.023
SN3 3.92 0.96 -0.067 (0.911) -0.029 0.055 -0.006
SN4 3.90 0.97 -0.090 (0.937) -0.102 0.057 0.035
SN5 3.89 0.94 -0.097 (0.871) 0.154 -0.057 -0.065
US1 4.05 0.92 -0.027 0.051 (0.870) 0.018 -0.017
US2 3.97 0.92 -0.075 -0.004 (0.984) 0.002 -0.021
US3 4.00 0.90 0.040 -0.090 (0.968) -0.019 0.010
US4 3.98 0.87 0.066 0.048 (0.775) 0.000 0.030
PT1 4.02 0.91 0.043 0.008 0.042 (0.709) 0.052
PT2 3.99 0.93 0.048 0.026 -0.052 (0.842) -0.009
PT3 3.99 0.94 -0.042 -0.009 -0.043 (0.949) -0.018
PT4 3.99 0.93 -0.064 0.045 -0.035 (0.922) -0.043
PT5 4.02 0.91 0.021 -0.077 0.100 (0.725) 0.024
CI1 3.97 0.88 -0.014 0.032 -0.080 0.090 (0.803)
CI2 3.99 0.89 -0.059 -0.065 -0.011 -0.008 (0.919)
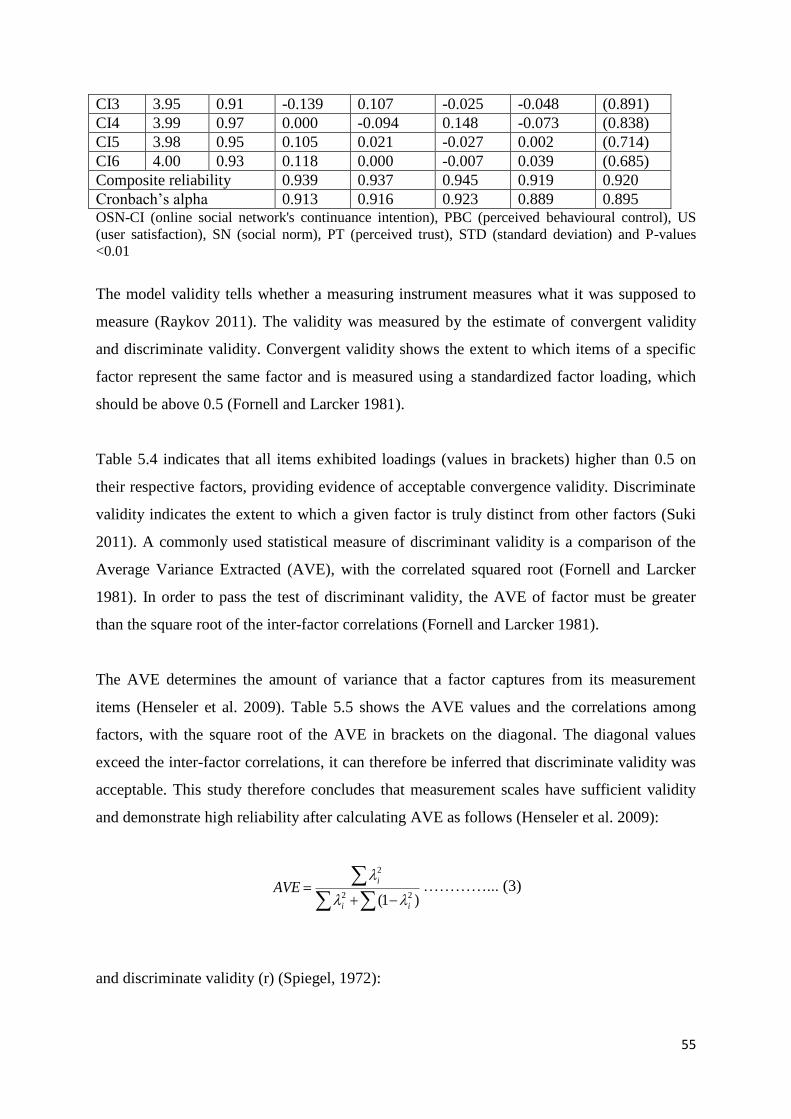
55
CI3 3.95 0.91 -0.139 0.107 -0.025 -0.048 (0.891)
CI4 3.99 0.97 0.000 -0.094 0.148 -0.073 (0.838)
CI5 3.98 0.95 0.105 0.021 -0.027 0.002 (0.714)
CI6 4.00 0.93 0.118 0.000 -0.007 0.039 (0.685)
Composite reliability 0.939 0.937 0.945 0.919 0.920
Cronbach’s alpha 0.913 0.916 0.923 0.889 0.895 OSN-CI (online social network's continuance intention), PBC (perceived behavioural control), US
(user satisfaction), SN (social norm), PT (perceived trust), STD (standard deviation) and P-values
<0.01
The model validity tells whether a measuring instrument measures what it was supposed to
measure (Raykov 2011). The validity was measured by the estimate of convergent validity
and discriminate validity. Convergent validity shows the extent to which items of a specific
factor represent the same factor and is measured using a standardized factor loading, which
should be above 0.5 (Fornell and Larcker 1981).
Table 5.4 indicates that all items exhibited loadings (values in brackets) higher than 0.5 on
their respective factors, providing evidence of acceptable convergence validity. Discriminate
validity indicates the extent to which a given factor is truly distinct from other factors (Suki
2011). A commonly used statistical measure of discriminant validity is a comparison of the
Average Variance Extracted (AVE), with the correlated squared root (Fornell and Larcker
1981). In order to pass the test of discriminant validity, the AVE of factor must be greater
than the square root of the inter-factor correlations (Fornell and Larcker 1981).
The AVE determines the amount of variance that a factor captures from its measurement
items (Henseler et al. 2009). Table 5.5 shows the AVE values and the correlations among
factors, with the square root of the AVE in brackets on the diagonal. The diagonal values
exceed the inter-factor correlations, it can therefore be inferred that discriminate validity was
acceptable. This study therefore concludes that measurement scales have sufficient validity
and demonstrate high reliability after calculating AVE as follows (Henseler et al. 2009):
)1( 22
2
ii
iAVE
…………... (3)
and discriminate validity (r) (Spiegel, 1972):
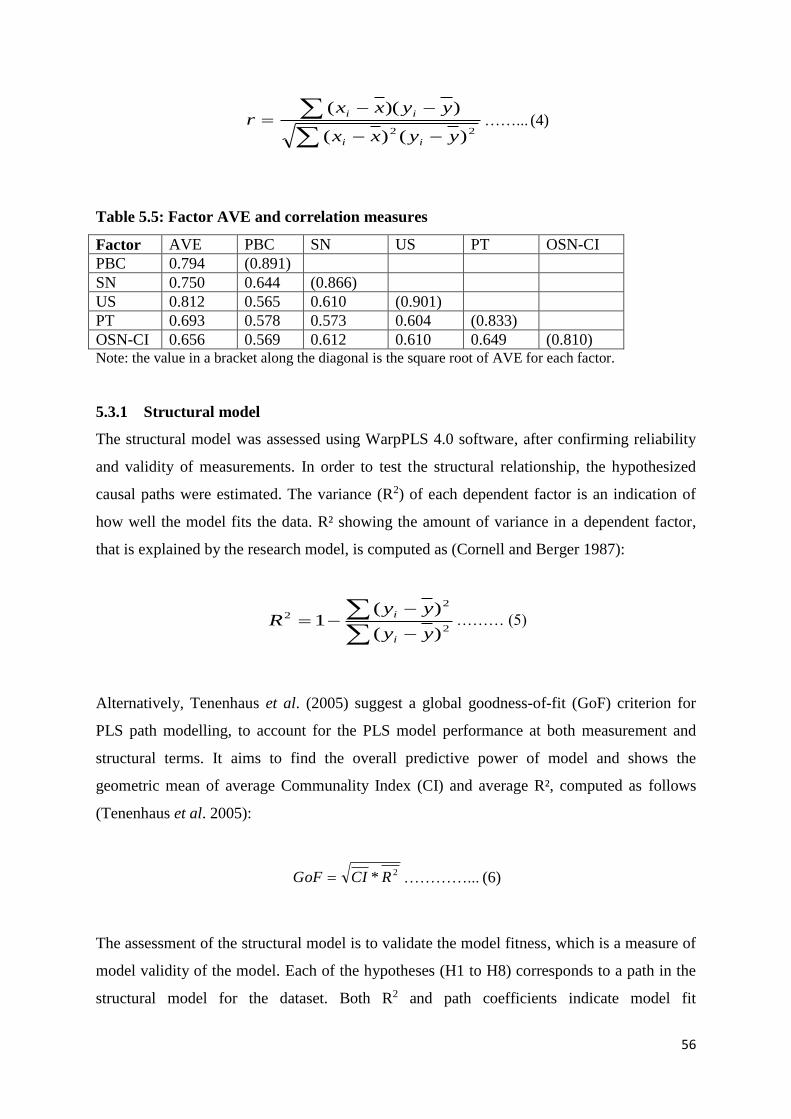
56
22 )()(
))((
yyxx
yyxxr
ii
ii……... (4)
Table 5.5: Factor AVE and correlation measures
Factor AVE PBC SN US PT OSN-CI
PBC 0.794 (0.891)
SN 0.750 0.644 (0.866)
US 0.812 0.565 0.610 (0.901)
PT 0.693 0.578 0.573 0.604 (0.833)
OSN-CI 0.656 0.569 0.612 0.610 0.649 (0.810) Note: the value in a bracket along the diagonal is the square root of AVE for each factor.
5.3.1 Structural model
The structural model was assessed using WarpPLS 4.0 software, after confirming reliability
and validity of measurements. In order to test the structural relationship, the hypothesized
causal paths were estimated. The variance (R2) of each dependent factor is an indication of
how well the model fits the data. R² showing the amount of variance in a dependent factor,
that is explained by the research model, is computed as (Cornell and Berger 1987):
2
2
2
)(
)(1
yy
yyR
i
i……… (5)
Alternatively, Tenenhaus et al. (2005) suggest a global goodness-of-fit (GoF) criterion for
PLS path modelling, to account for the PLS model performance at both measurement and
structural terms. It aims to find the overall predictive power of model and shows the
geometric mean of average Communality Index (CI) and average R², computed as follows
(Tenenhaus et al. 2005):
2* RCIGoF …………... (6)
The assessment of the structural model is to validate the model fitness, which is a measure of
model validity of the model. Each of the hypotheses (H1 to H8) corresponds to a path in the
structural model for the dataset. Both R2 and path coefficients indicate model fit
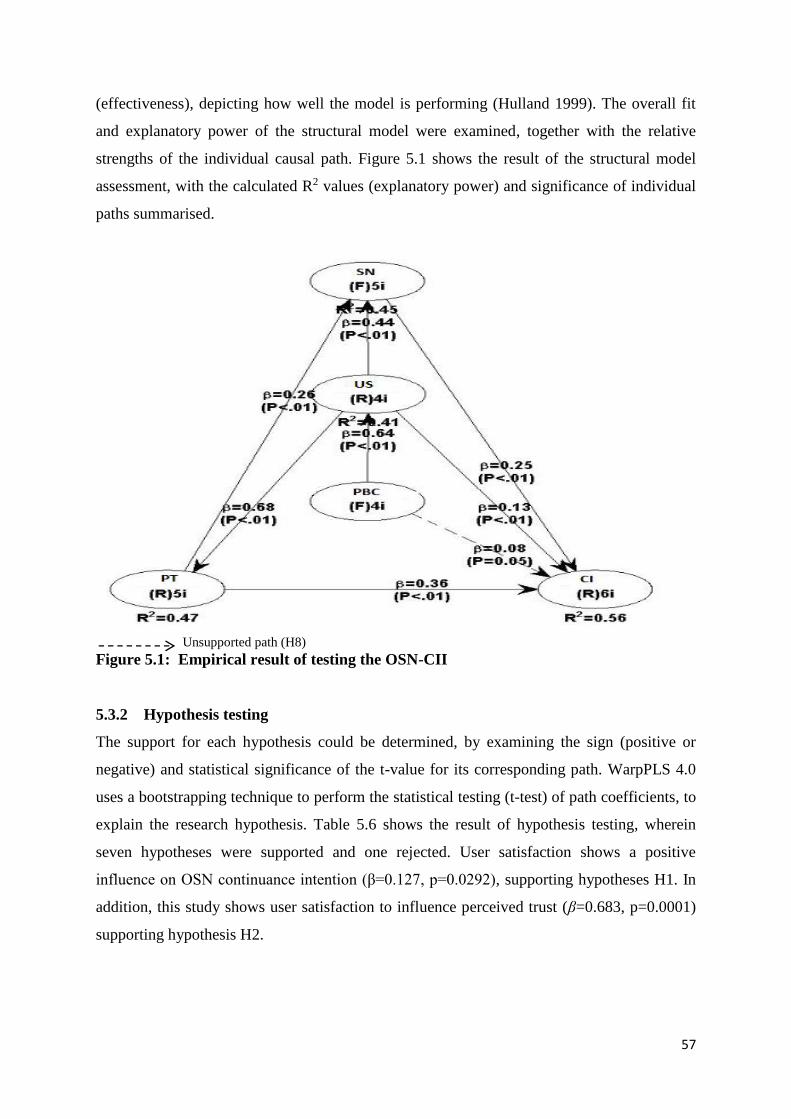
57
(effectiveness), depicting how well the model is performing (Hulland 1999). The overall fit
and explanatory power of the structural model were examined, together with the relative
strengths of the individual causal path. Figure 5.1 shows the result of the structural model
assessment, with the calculated R2 values (explanatory power) and significance of individual
paths summarised.
Unsupported path (H8)
Figure 5.1: Empirical result of testing the OSN-CII
5.3.2 Hypothesis testing
The support for each hypothesis could be determined, by examining the sign (positive or
negative) and statistical significance of the t-value for its corresponding path. WarpPLS 4.0
uses a bootstrapping technique to perform the statistical testing (t-test) of path coefficients, to
explain the research hypothesis. Table 5.6 shows the result of hypothesis testing, wherein
seven hypotheses were supported and one rejected. User satisfaction shows a positive
influence on OSN continuance intention (β=0.127, p=0.0292), supporting hypotheses H1. In
addition, this study shows user satisfaction to influence perceived trust (β=0.683, p=0.0001)
supporting hypothesis H2.
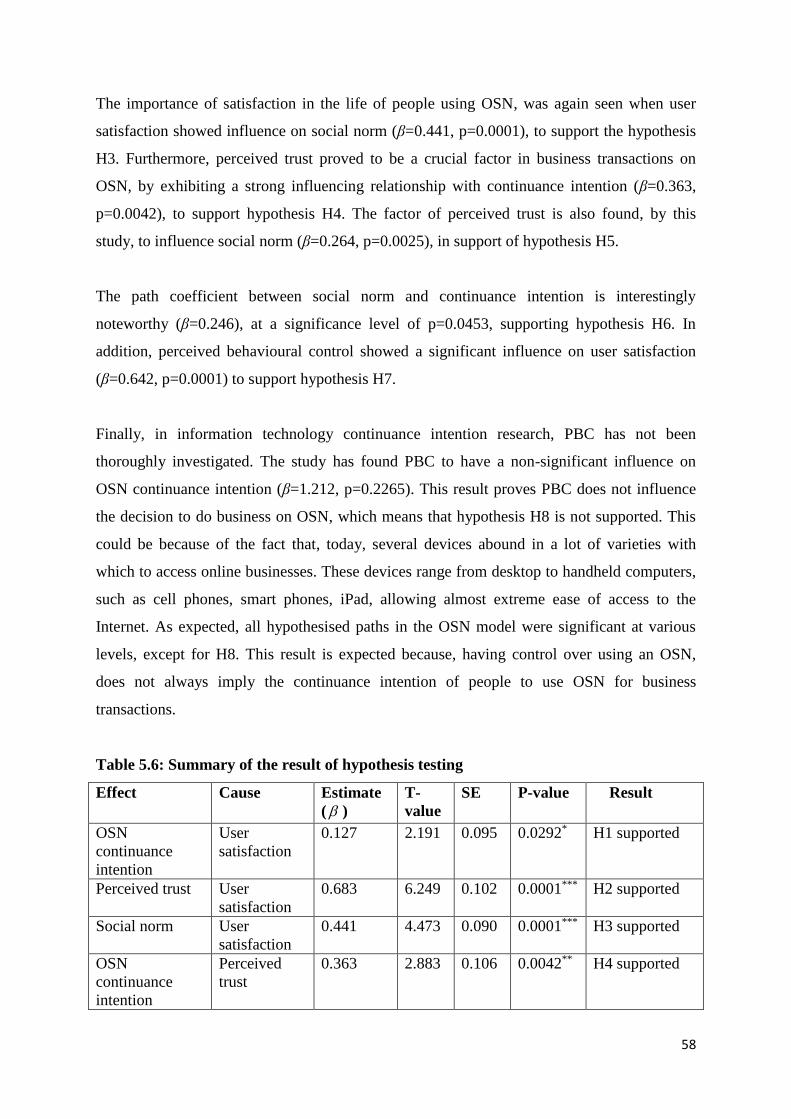
58
The importance of satisfaction in the life of people using OSN, was again seen when user
satisfaction showed influence on social norm (β=0.441, p=0.0001), to support the hypothesis
H3. Furthermore, perceived trust proved to be a crucial factor in business transactions on
OSN, by exhibiting a strong influencing relationship with continuance intention (β=0.363,
p=0.0042), to support hypothesis H4. The factor of perceived trust is also found, by this
study, to influence social norm (β=0.264, p=0.0025), in support of hypothesis H5.
The path coefficient between social norm and continuance intention is interestingly
noteworthy (β=0.246), at a significance level of p=0.0453, supporting hypothesis H6. In
addition, perceived behavioural control showed a significant influence on user satisfaction
(β=0.642, p=0.0001) to support hypothesis H7.
Finally, in information technology continuance intention research, PBC has not been
thoroughly investigated. The study has found PBC to have a non-significant influence on
OSN continuance intention (β=1.212, p=0.2265). This result proves PBC does not influence
the decision to do business on OSN, which means that hypothesis H8 is not supported. This
could be because of the fact that, today, several devices abound in a lot of varieties with
which to access online businesses. These devices range from desktop to handheld computers,
such as cell phones, smart phones, iPad, allowing almost extreme ease of access to the
Internet. As expected, all hypothesised paths in the OSN model were significant at various
levels, except for H8. This result is expected because, having control over using an OSN,
does not always imply the continuance intention of people to use OSN for business
transactions.
Table 5.6: Summary of the result of hypothesis testing
Effect Cause Estimate
( )
T-
value
SE P-value Result
OSN
continuance
intention
User
satisfaction
0.127 2.191 0.095 0.0292* H1 supported
Perceived trust User
satisfaction
0.683 6.249 0.102 0.0001*** H2 supported
Social norm User
satisfaction
0.441 4.473 0.090 0.0001*** H3 supported
OSN
continuance
intention
Perceived
trust
0.363 2.883 0.106 0.0042** H4 supported
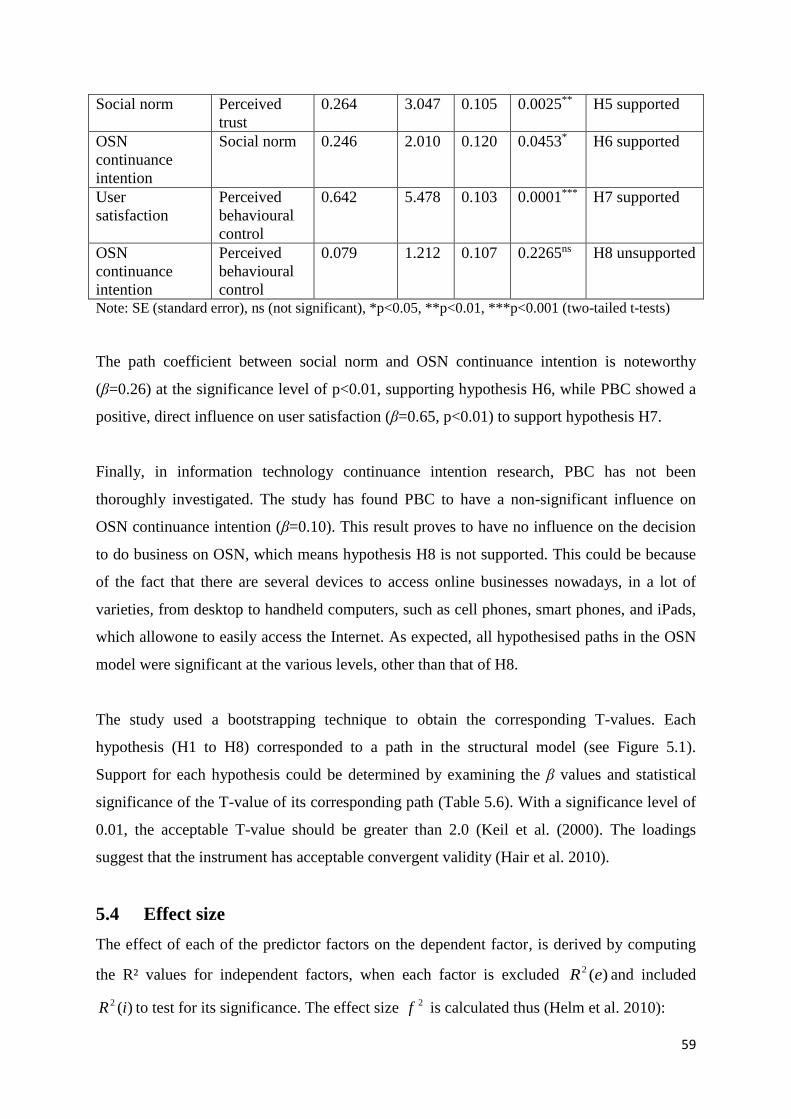
59
Social norm Perceived
trust
0.264 3.047 0.105 0.0025** H5 supported
OSN
continuance
intention
Social norm 0.246 2.010 0.120 0.0453* H6 supported
User
satisfaction
Perceived
behavioural
control
0.642 5.478 0.103 0.0001*** H7 supported
OSN
continuance
intention
Perceived
behavioural
control
0.079 1.212 0.107 0.2265ns H8 unsupported
Note: SE (standard error), ns (not significant), *p<0.05, **p<0.01, ***p<0.001 (two-tailed t-tests)
The path coefficient between social norm and OSN continuance intention is noteworthy
(β=0.26) at the significance level of p<0.01, supporting hypothesis H6, while PBC showed a
positive, direct influence on user satisfaction (β=0.65, p<0.01) to support hypothesis H7.
Finally, in information technology continuance intention research, PBC has not been
thoroughly investigated. The study has found PBC to have a non-significant influence on
OSN continuance intention (β=0.10). This result proves to have no influence on the decision
to do business on OSN, which means hypothesis H8 is not supported. This could be because
of the fact that there are several devices to access online businesses nowadays, in a lot of
varieties, from desktop to handheld computers, such as cell phones, smart phones, and iPads,
which allowone to easily access the Internet. As expected, all hypothesised paths in the OSN
model were significant at the various levels, other than that of H8.
The study used a bootstrapping technique to obtain the corresponding T-values. Each
hypothesis (H1 to H8) corresponded to a path in the structural model (see Figure 5.1).
Support for each hypothesis could be determined by examining the β values and statistical
significance of the T-value of its corresponding path (Table 5.6). With a significance level of
0.01, the acceptable T-value should be greater than 2.0 (Keil et al. (2000). The loadings
suggest that the instrument has acceptable convergent validity (Hair et al. 2010).
5.4 Effect size
The effect of each of the predictor factors on the dependent factor, is derived by computing
the R² values for independent factors, when each factor is excluded )(2 eR and included
)(2 iR to test for its significance. The effect size 2f is calculated thus (Helm et al. 2010):
60
)(1
)()(2
222
iR
eRiRf
………… (7)
Table 5.7 shows the quality of effect size, of the model factors. By investigating effect sizes,
researchers are able to ascertain if the effects of the path coefficients are small, medium or
large, according to these recommended values: 0.02, 0.15 or 0.3,5 respectively (Kock 2010).
Values below 0.02 are too weak to be considered effective (Kock 2010), thus all values of
this research model are effective.
Table 5.7: Effect Size Quality
PBC SN US PT OSN-CI
PBC
SN 0.286 0.161
US 0.413
PT 0.466
OSN-CI 0.052 0.165 0.085 0.255
5.5 Model fit
The strength of the measurement model can be demonstrated through measures of convergent
and discriminant validity (Hair et al. 2010). Convergent validity is normally assessed using
three tests: reliability of questions, composite reliability of constructs, and variance extracted
by constructs (Fornell and Larcker 1981). Discriminant validity can be assessed by looking at
correlations among the questions (Fornell and Larcker 1981), as well as variances of and
covariances among constructs (Igbaria et al. 1994).
The overall model fit was assessed using six measures of the average path coefficient (APC),
the average R-squared (ARS), the average block inflation factor (AVIF), the goodness of fits
(GoF), the average adjusted R-square (AARS) and the R-square contribution ratio (RSCR), to
indicate how the model is good. Each of the model fit metrics is discussed according to Kock
(2010). Based on the results depicted in Table 5.5, the OSN model has a good fit. The values
of APC and ARS are significant at a five percent level, while AVIF is still lower than five.
This concludes that a good fit exists between model and data (Rosenthal and Rosenow 1991,
Kock 2010).
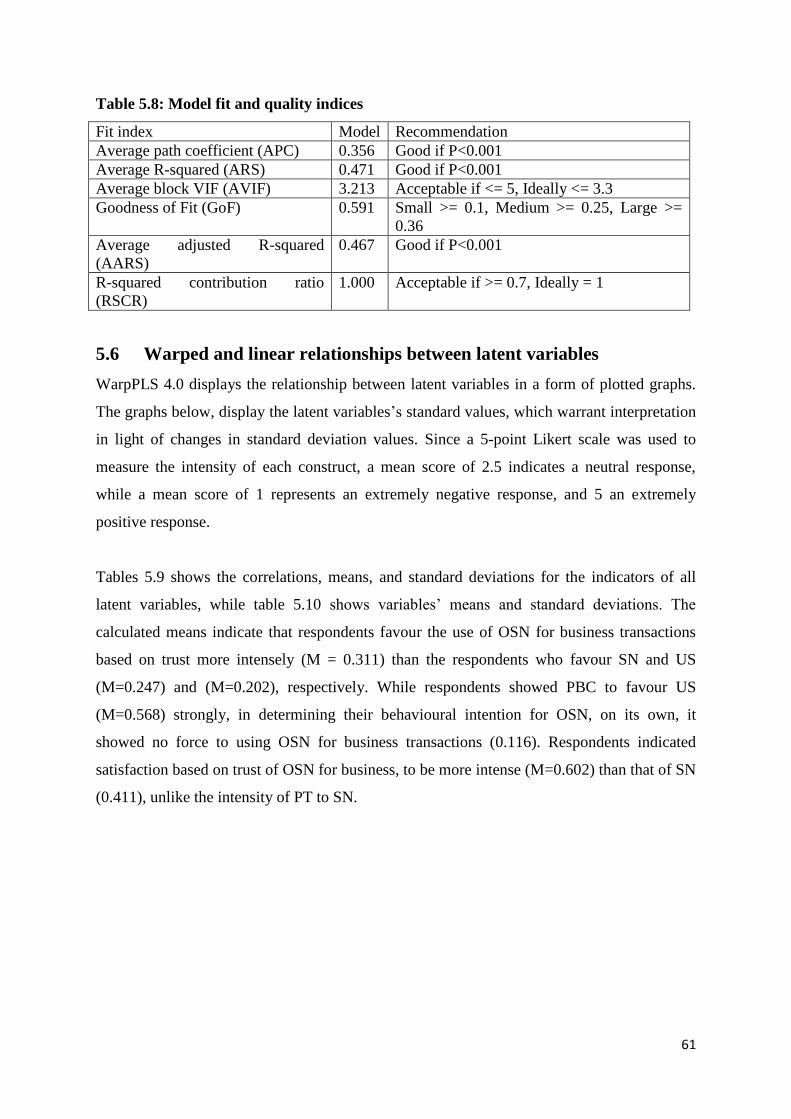
61
Table 5.8: Model fit and quality indices
Fit index Model Recommendation
Average path coefficient (APC) 0.356 Good if P<0.001
Average R-squared (ARS) 0.471 Good if P<0.001
Average block VIF (AVIF) 3.213 Acceptable if <= 5, Ideally <= 3.3
Goodness of Fit (GoF) 0.591 Small >= 0.1, Medium >= 0.25, Large >=
0.36
Average adjusted R-squared
(AARS)
0.467 Good if P<0.001
R-squared contribution ratio
(RSCR)
1.000 Acceptable if >= 0.7, Ideally = 1
5.6 Warped and linear relationships between latent variables
WarpPLS 4.0 displays the relationship between latent variables in a form of plotted graphs.
The graphs below, display the latent variables’s standard values, which warrant interpretation
in light of changes in standard deviation values. Since a 5-point Likert scale was used to
measure the intensity of each construct, a mean score of 2.5 indicates a neutral response,
while a mean score of 1 represents an extremely negative response, and 5 an extremely
positive response.
Tables 5.9 shows the correlations, means, and standard deviations for the indicators of all
latent variables, while table 5.10 shows variables’ means and standard deviations. The
calculated means indicate that respondents favour the use of OSN for business transactions
based on trust more intensely (M = 0.311) than the respondents who favour SN and US
(M=0.247) and (M=0.202), respectively. While respondents showed PBC to favour US
(M=0.568) strongly, in determining their behavioural intention for OSN, on its own, it
showed no force to using OSN for business transactions (0.116). Respondents indicated
satisfaction based on trust of OSN for business, to be more intense (M=0.602) than that of SN
(0.411), unlike the intensity of PT to SN.
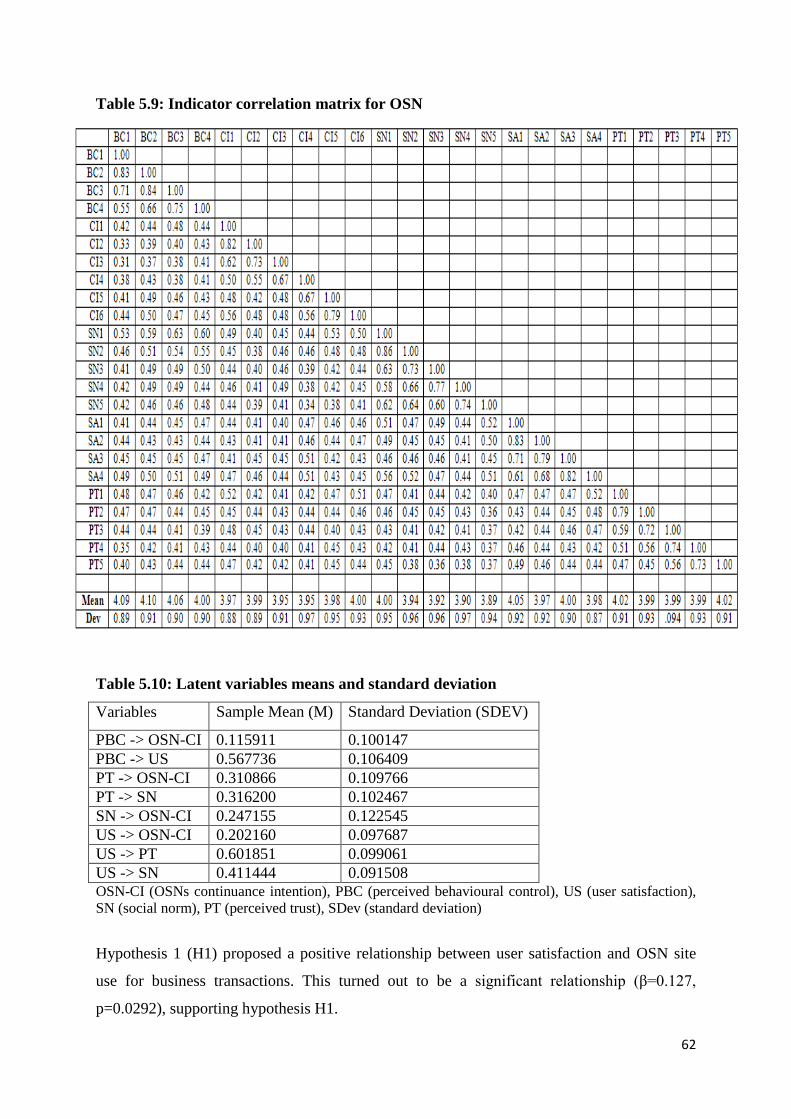
62
Table 5.9: Indicator correlation matrix for OSN
Table 5.10: Latent variables means and standard deviation
Variables Sample Mean (M) Standard Deviation (SDEV)
PBC -> OSN-CI 0.115911 0.100147
PBC -> US 0.567736 0.106409
PT -> OSN-CI 0.310866 0.109766
PT -> SN 0.316200 0.102467
SN -> OSN-CI 0.247155 0.122545
US -> OSN-CI 0.202160 0.097687
US -> PT 0.601851 0.099061
US -> SN 0.411444 0.091508 OSN-CI (OSNs continuance intention), PBC (perceived behavioural control), US (user satisfaction),
SN (social norm), PT (perceived trust), SDev (standard deviation)
Hypothesis 1 (H1) proposed a positive relationship between user satisfaction and OSN site
use for business transactions. This turned out to be a significant relationship (β=0.127,
p=0.0292), supporting hypothesis H1.
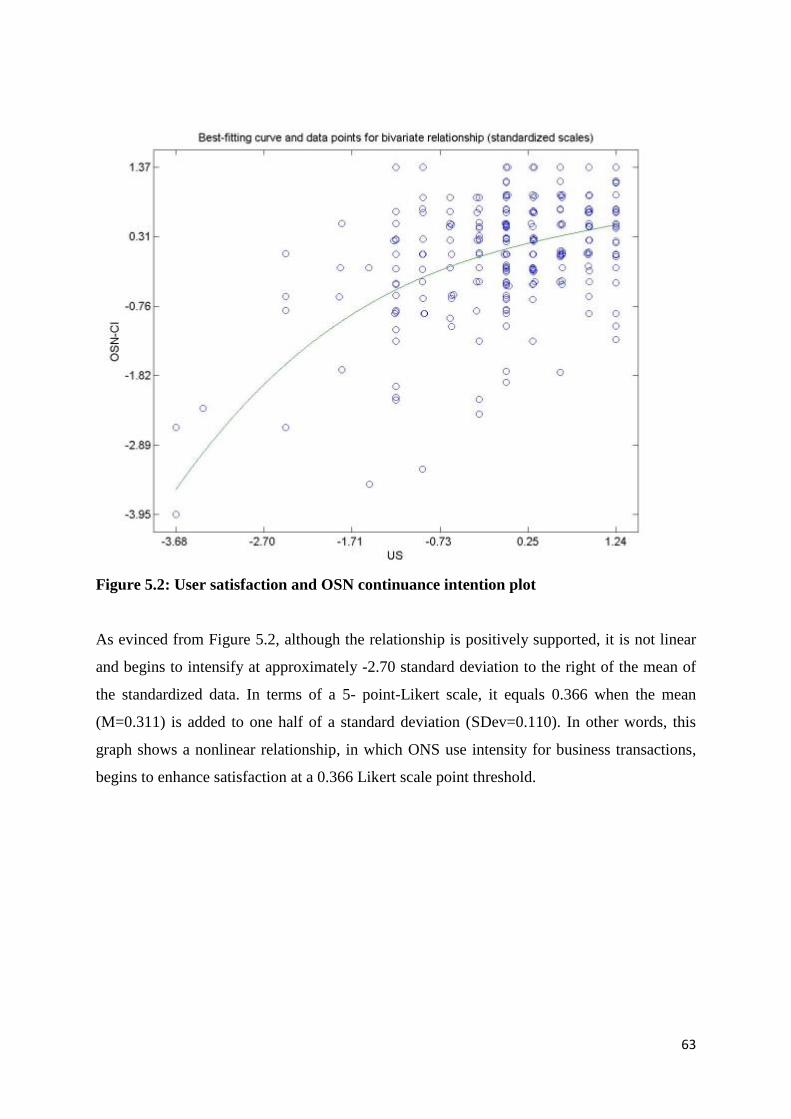
63
Figure 5.2: User satisfaction and OSN continuance intention plot
As evinced from Figure 5.2, although the relationship is positively supported, it is not linear
and begins to intensify at approximately -2.70 standard deviation to the right of the mean of
the standardized data. In terms of a 5- point-Likert scale, it equals 0.366 when the mean
(M=0.311) is added to one half of a standard deviation (SDev=0.110). In other words, this
graph shows a nonlinear relationship, in which ONS use intensity for business transactions,
begins to enhance satisfaction at a 0.366 Likert scale point threshold.
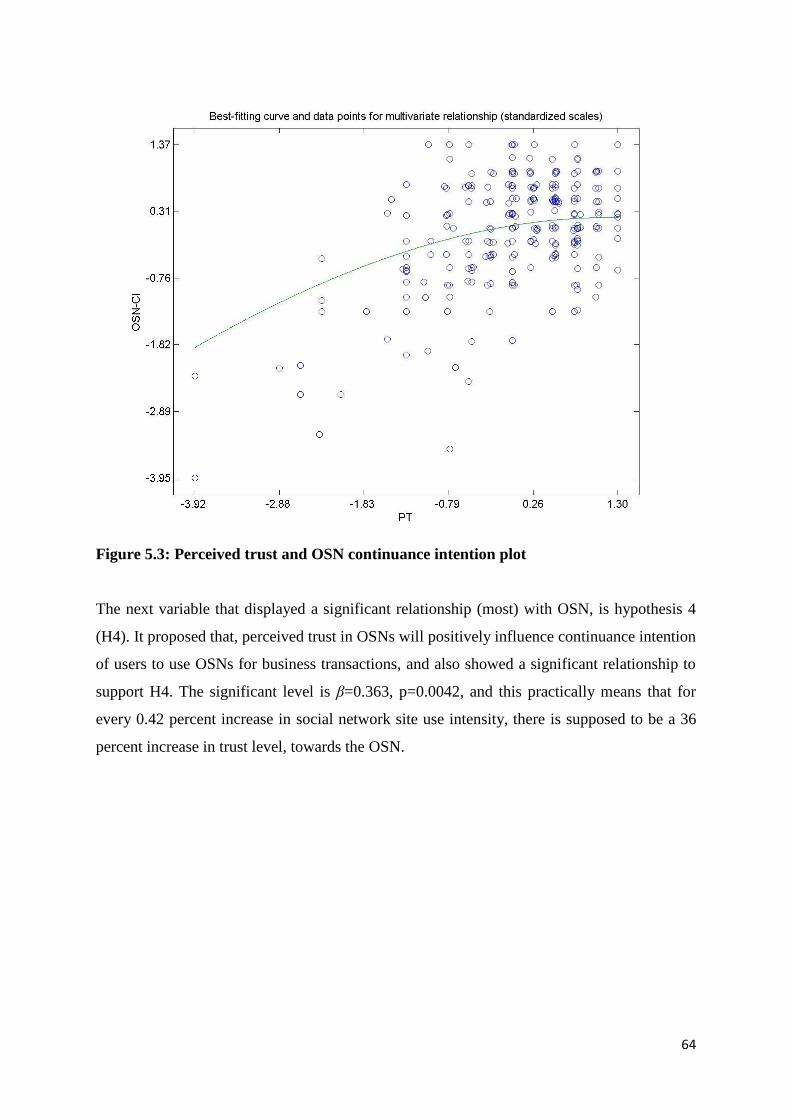
64
Figure 5.3: Perceived trust and OSN continuance intention plot
The next variable that displayed a significant relationship (most) with OSN, is hypothesis 4
(H4). It proposed that, perceived trust in OSNs will positively influence continuance intention
of users to use OSNs for business transactions, and also showed a significant relationship to
support H4. The significant level is β=0.363, p=0.0042, and this practically means that for
every 0.42 percent increase in social network site use intensity, there is supposed to be a 36
percent increase in trust level, towards the OSN.
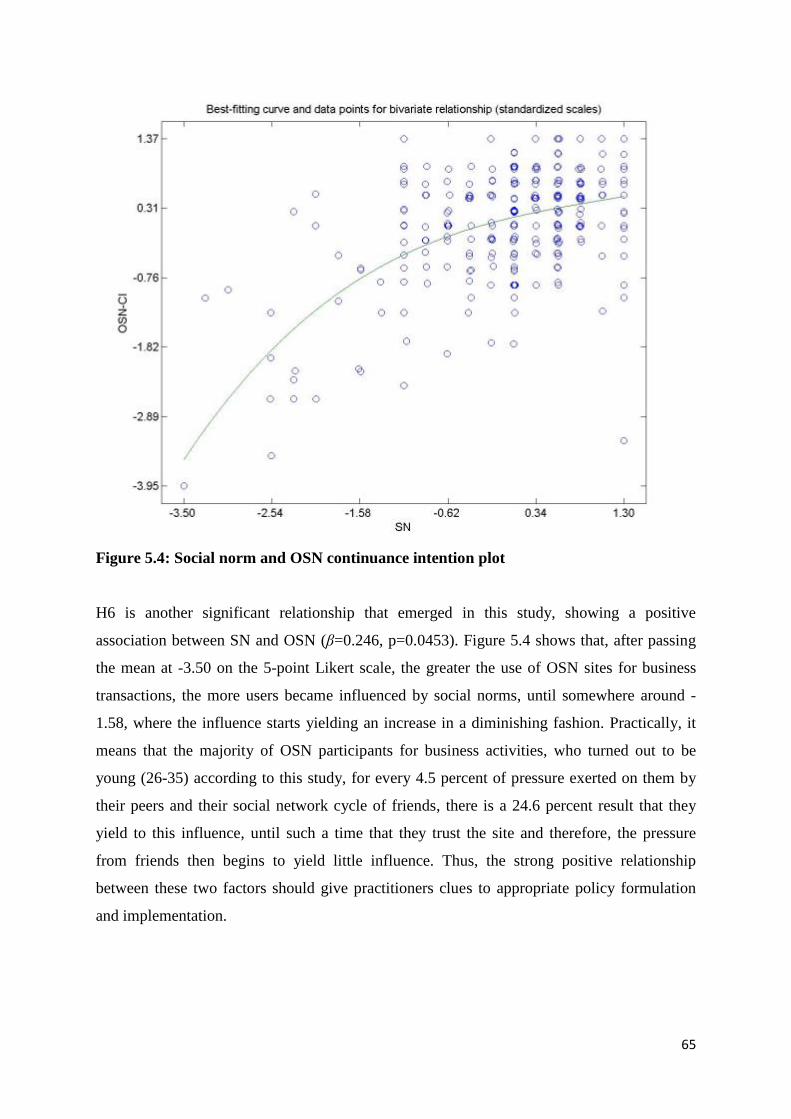
65
Figure 5.4: Social norm and OSN continuance intention plot
H6 is another significant relationship that emerged in this study, showing a positive
association between SN and OSN (β=0.246, p=0.0453). Figure 5.4 shows that, after passing
the mean at -3.50 on the 5-point Likert scale, the greater the use of OSN sites for business
transactions, the more users became influenced by social norms, until somewhere around -
1.58, where the influence starts yielding an increase in a diminishing fashion. Practically, it
means that the majority of OSN participants for business activities, who turned out to be
young (26-35) according to this study, for every 4.5 percent of pressure exerted on them by
their peers and their social network cycle of friends, there is a 24.6 percent result that they
yield to this influence, until such a time that they trust the site and therefore, the pressure
from friends then begins to yield little influence. Thus, the strong positive relationship
between these two factors should give practitioners clues to appropriate policy formulation
and implementation.
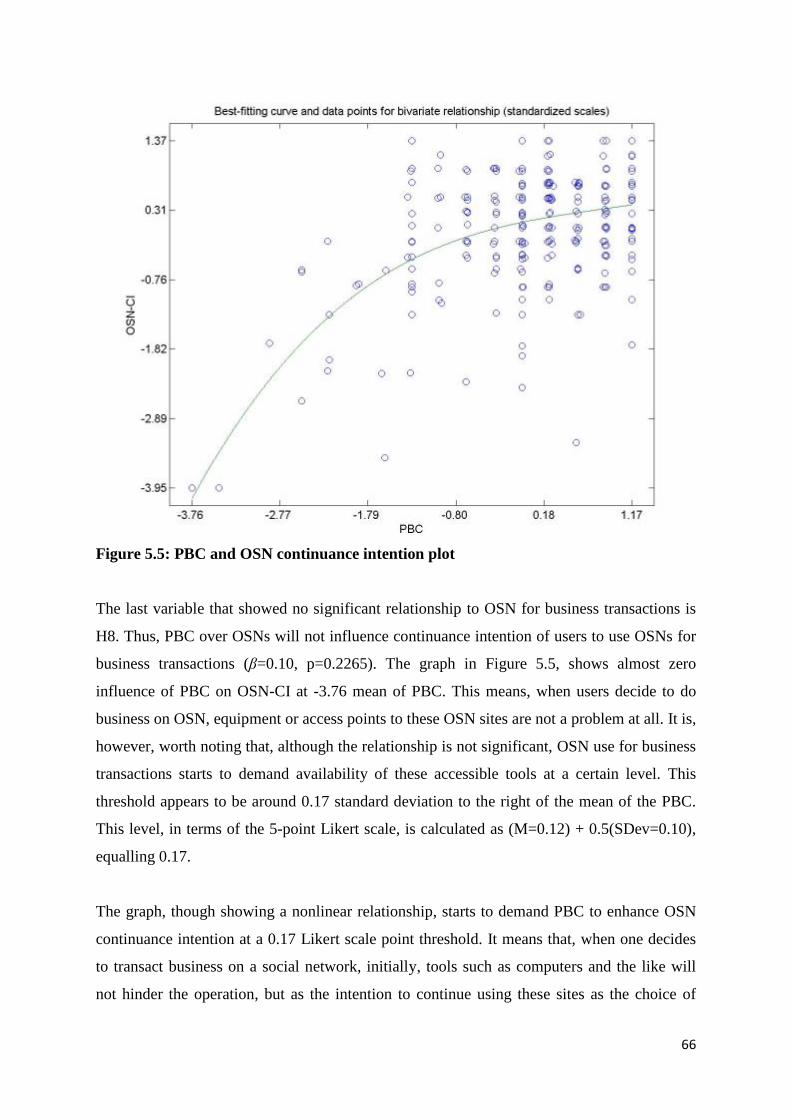
66
Figure 5.5: PBC and OSN continuance intention plot
The last variable that showed no significant relationship to OSN for business transactions is
H8. Thus, PBC over OSNs will not influence continuance intention of users to use OSNs for
business transactions (β=0.10, p=0.2265). The graph in Figure 5.5, shows almost zero
influence of PBC on OSN-CI at -3.76 mean of PBC. This means, when users decide to do
business on OSN, equipment or access points to these OSN sites are not a problem at all. It is,
however, worth noting that, although the relationship is not significant, OSN use for business
transactions starts to demand availability of these accessible tools at a certain level. This
threshold appears to be around 0.17 standard deviation to the right of the mean of the PBC.
This level, in terms of the 5-point Likert scale, is calculated as (M=0.12) + 0.5(SDev=0.10),
equalling 0.17.
The graph, though showing a nonlinear relationship, starts to demand PBC to enhance OSN
continuance intention at a 0.17 Likert scale point threshold. It means that, when one decides
to transact business on a social network, initially, tools such as computers and the like will
not hinder the operation, but as the intention to continue using these sites as the choice of
67
business medium increases, these gadgets will become necessary, in order to shape the
behaviour to continue use.
5.7 Moderating effects
The study explored a different model, to find out how habit might moderate the effects of the
main determining factors, PT, SN and PBC on OSN-CI, in order to contribute a more
scientific knowledge to the research community. Neglect of moderating effects leads to a lack
of relevance (Henseler and Fassott 2010), assuming that relationships that hold true,
regardless of the context factors, are perfect and work under all conditions. Despite the
importance of developing a model, without showing the moderating effect and the injustice
this causes to the research communities, to date only a few methodologically oriented studies
have been dedicated to the showing of moderating effects in PLS path models, among which
are Chin et al. (2003) and Eggert et al. (2005). Moderating effects are suggested by variables,
whose variation impacts the strength or the direction of a relationship between an exogenous
and an endogenous variable (Baron and Kenny 1986, p. 1174).)
5.7.1 Habit as moderating factor
The notion of habit being a potential moderator is not new, though it has received relatively
little attention, in comparison to showing it in main models. Researchers have realised the
need to investigate this habit moderator concept, in order to uncover the real picture of its
effect on both exogenous and edogenous factors. Some of these are Limayem et al. (2007),
Bhattacherjee and Barfar (2011), Limayem and Cheung (2011) and Shiau and Luo (2013).
To test the moderating effect, the researcher revisited the developed research model and
plugged in habit (HB), to experiment with the influence of the exogenous variables (PT,
PBC, SN) on the endogenous variable (OSN-CI). Moderator hypothesis is confirmed if the
interaction effect of other determinants (i.e., path coefficient ( ) is significant, and
independent of the magnitude of the path coefficients of other determinant variables (Baron
and Kenny 1986). This study did not hypothesise on the direction of the moderator variable,
(HB), therefore a two-sided test of significance is applied.
Though e-satisfaction has an impact on e-loyalty (i.e continuous behaviour), user satisfaction
is not considered for moderation in this study because satisfaction measures are likely to be
68
positively biased (Peterson and Wilson 1992), and establishing the relationship between
satisfaction and repurchase behaviour has been intangible for many firms (Mittal and
Kamakura 2001). This stems from the unfinished business surrounding the satisfaction
element and since this study is meant to contribute practically to the body of knowledge, it
does not intend to invest in controversy.
Peterson and Wilson (1992) note that satisfaction ratings are determined in part by
measurement artifacts or personal characteristics of the survey customers, hence caution
needs to be exercised when interpreting or using them in decision making. By this statement,
the authors mean that satisfaction ratings are tinted with so many biases, it no longer serves
any good purpose.
Peterson and Wilson (1992) go on to assert that satisfaction measurement and research design
studies share the following common biases: “virtually all self-reports of customer satisfaction
process are distribution, in which a majority of the responses indicate that customers are
satisfied and the distribution itself is negatively skewed”. Moreover, the modal response to a
satisfaction question, is typically the most positive response allowed (Peterson and Wilson
1992). This study takes these criticisms seriously because it is noted by other researchers, for
instance (Hunt 1977, LaBarbara and Mazursk 1983, Oliver 1981) to the extent that
Westbrook (1980), even tried to develop a scale that would produce a more normal
distribution.
As hinted earlier on (research design section) the satisfaction measurement items used in this
study were borrowed from prior research studies and therefore cannot be exonerated from
these biases. For instance, Anderson and Srinivasan (2003), noted that the relationship
between satisfaction and continuous behaviour seems almost intuitive, and several research
works have attempted to confirm this in their work (Cornin and Taylor 1992, Newman and
Werbel 1973, Woodside et al. 1989).
This intuitive appeal notwithstanding, the strength of the relationship between satisfaction
and continuous behaviour, has been found to differ significantly under different conditions.
For example, Jones and Sasser (1995) show that the strength of the relationship depends on
the competitive structure of the industry, while Oliver (1999) finds that satisfaction leads to
continuous behaviour. Nevertheless, true loyalty can only be achieved when other factors,
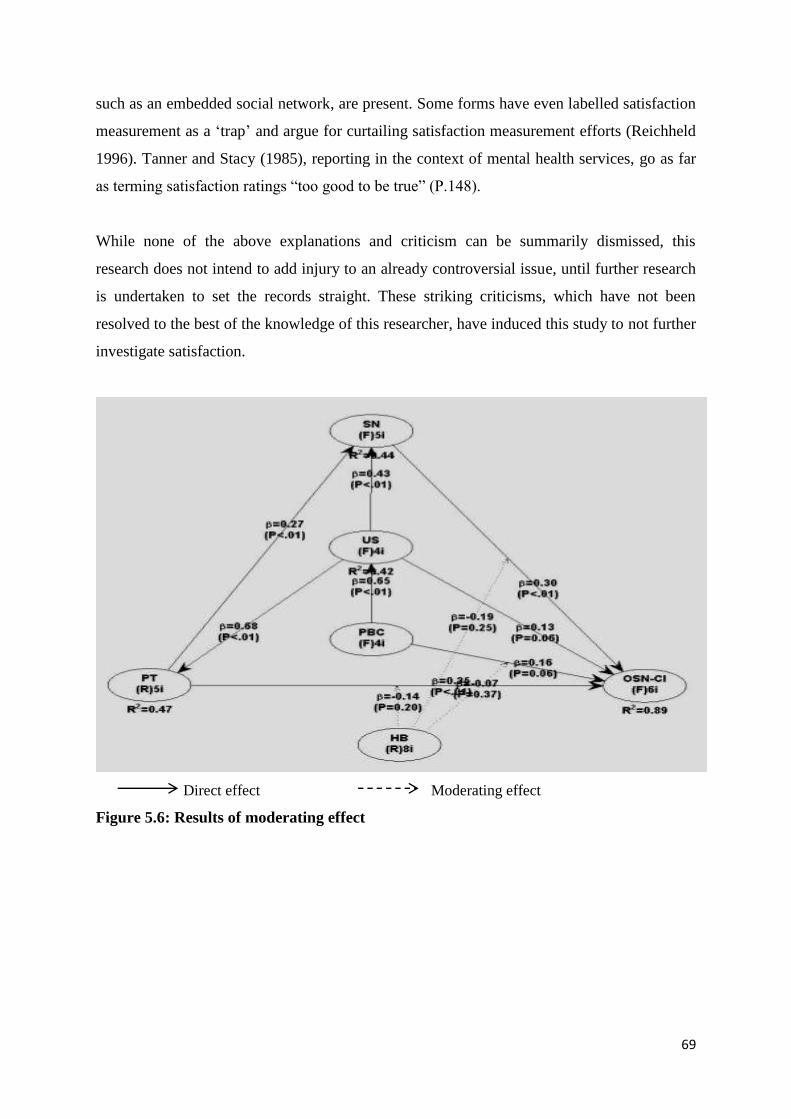
69
such as an embedded social network, are present. Some forms have even labelled satisfaction
measurement as a ‘trap’ and argue for curtailing satisfaction measurement efforts (Reichheld
1996). Tanner and Stacy (1985), reporting in the context of mental health services, go as far
as terming satisfaction ratings “too good to be true” (P.148).
While none of the above explanations and criticism can be summarily dismissed, this
research does not intend to add injury to an already controversial issue, until further research
is undertaken to set the records straight. These striking criticisms, which have not been
resolved to the best of the knowledge of this researcher, have induced this study to not further
investigate satisfaction.
Direct effect Moderating effect
Figure 5.6: Results of moderating effect
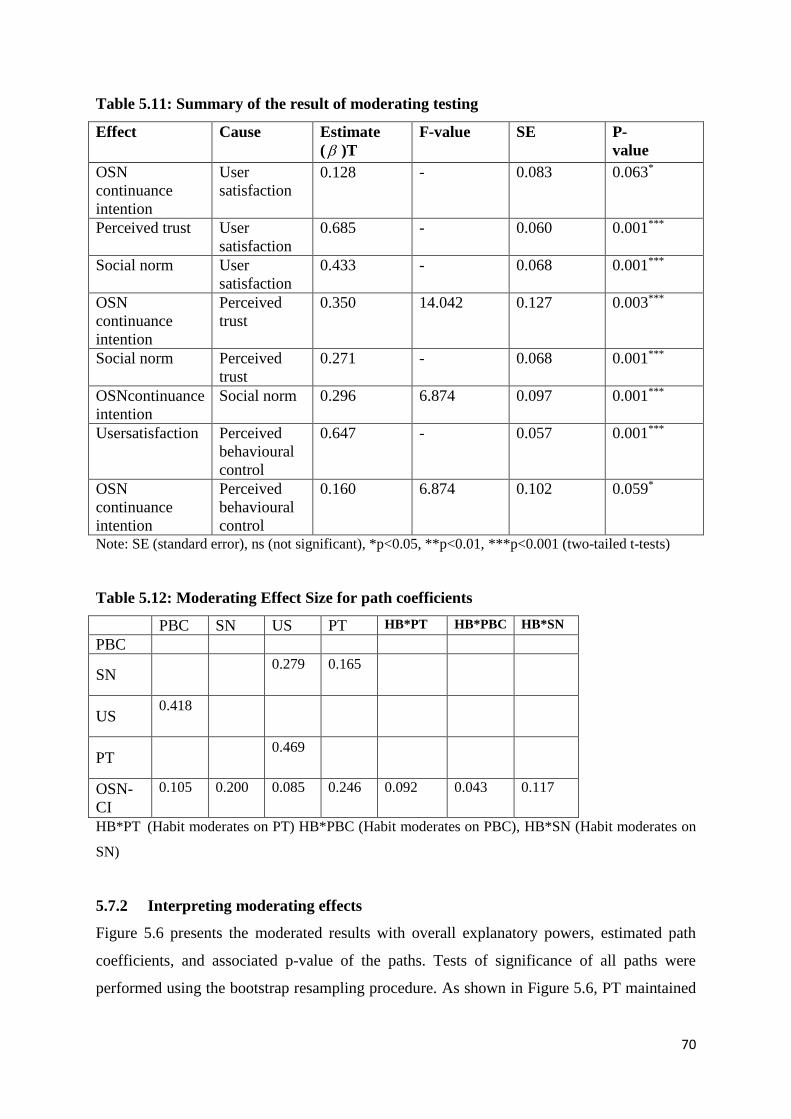
70
Table 5.11: Summary of the result of moderating testing
Effect Cause Estimate
( )T
F-value SE P-
value
OSN
continuance
intention
User
satisfaction
0.128 - 0.083 0.063*
Perceived trust User
satisfaction
0.685 - 0.060 0.001***
Social norm User
satisfaction
0.433 - 0.068 0.001***
OSN
continuance
intention
Perceived
trust
0.350 14.042 0.127 0.003***
Social norm Perceived
trust
0.271 - 0.068 0.001***
OSNcontinuance
intention
Social norm 0.296 6.874 0.097 0.001***
Usersatisfaction Perceived
behavioural
control
0.647 - 0.057 0.001***
OSN
continuance
intention
Perceived
behavioural
control
0.160 6.874 0.102 0.059*
Note: SE (standard error), ns (not significant), *p<0.05, **p<0.01, ***p<0.001 (two-tailed t-tests)
Table 5.12: Moderating Effect Size for path coefficients
PBC SN US PT HB*PT HB*PBC HB*SN
PBC
SN 0.279 0.165
US 0.418
PT 0.469
OSN-
CI
0.105 0.200 0.085 0.246 0.092 0.043 0.117
HB*PT (Habit moderates on PT) HB*PBC (Habit moderates on PBC), HB*SN (Habit moderates on
SN)
5.7.2 Interpreting moderating effects
Figure 5.6 presents the moderated results with overall explanatory powers, estimated path
coefficients, and associated p-value of the paths. Tests of significance of all paths were
performed using the bootstrap resampling procedure. As shown in Figure 5.6, PT maintained
71
its variance explanation on OSN-CI, but with a slightly higher coefficient ( =35), followed
by SN ( =0.30) and PBC ( =0.16), as compared to Figure 5.1. This moderated result
underscores the salient effect habit plays on these variables. Detail report of differences in
various ( ) and P-values is shown in table 5.11.
Regarding moderating variable habit (HB), it is shown that it negatively moderated the path
PT, (HB*PT: = -0.14 p=0.20), PBC (HB*PBC: = -0.07 p=0.37) and US (HB*US: = -
0.19 p=0.25), increasing the contribution of these variables to endogenous variable slightly
above original contribution. User satisfaction to OSN-CI was not moderated since, to take
care of collinearity. What this means is that, though these moderated variables are important
in predicting user behavioural intention of OSN-CI, there is a another factor of users (habit),
which when taken into account, reveals the actual intentions of these users.
The negative impacts could be inferred to mean the lower the habitual tendencies of users on
PT, PBC and SN, the higher their level of trust for OSN-CI, behavioural control over OSN
and more easily convinced to continue using OSN for business transactions. Since PBC was
initially less of an influencer in the main effect model, it means PBC will move to neutral
(zero) until it becomes positive to impact on OSN at this point. These effects, together with
the contribution of user satisfaction, results in a larger effect in the model’s predictive power
(R²=0.89).
Overall, the antecedent of OSN continuance explains 89 percent of the variance. In testing for
interaction effects using PLS, the hierarchical process, similar to multiple regression, is used
to compare the R² for the interaction model, with the R² for the ‘main effects’ model, which
excludes the interaction construct (Chin 1998). The difference in R-squares is used to assess
the overall effect size f² for the interaction, where 0.02, 0.15 and 0.35 have been suggested as
small, moderate and large effects, respectively (Cohen 1988).
As indicated in Table 5.13, the model in which habit is proposed to moderate the link
between PT, PBC, SN and OSN continued usage, possesses a significantly higher
explanatory power than the main effect model. As effect size for the interaction effect is 3.00
(large), it is important to understand that this (large) f² does imply an important conclusion
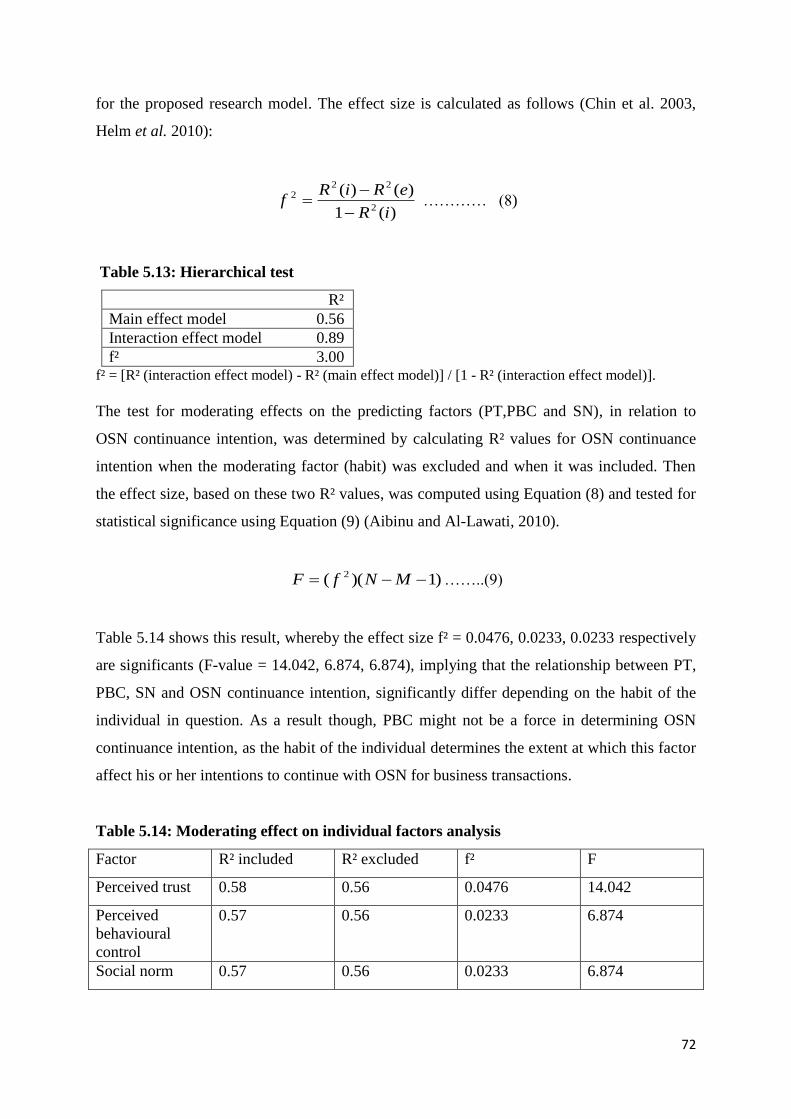
72
for the proposed research model. The effect size is calculated as follows (Chin et al. 2003,
Helm et al. 2010):
)(1
)()(2
222
iR
eRiRf
………… (8)
Table 5.13: Hierarchical test
R²
Main effect model 0.56
Interaction effect model 0.89
f² 3.00 f² = [R² (interaction effect model) - R² (main effect model)] / [1 - R² (interaction effect model)].
The test for moderating effects on the predicting factors (PT,PBC and SN), in relation to
OSN continuance intention, was determined by calculating R² values for OSN continuance
intention when the moderating factor (habit) was excluded and when it was included. Then
the effect size, based on these two R² values, was computed using Equation (8) and tested for
statistical significance using Equation (9) (Aibinu and Al-Lawati, 2010).
)1)(( 2 MNfF ……..(9)
Table 5.14 shows this result, whereby the effect size f² = 0.0476, 0.0233, 0.0233 respectively
are significants (F-value = 14.042, 6.874, 6.874), implying that the relationship between PT,
PBC, SN and OSN continuance intention, significantly differ depending on the habit of the
individual in question. As a result though, PBC might not be a force in determining OSN
continuance intention, as the habit of the individual determines the extent at which this factor
affect his or her intentions to continue with OSN for business transactions.
Table 5.14: Moderating effect on individual factors analysis
Factor R² included R² excluded f² F
Perceived trust 0.58 0.56 0.0476 14.042
Perceived
behavioural
control
0.57 0.56 0.0233 6.874
Social norm 0.57 0.56 0.0233 6.874
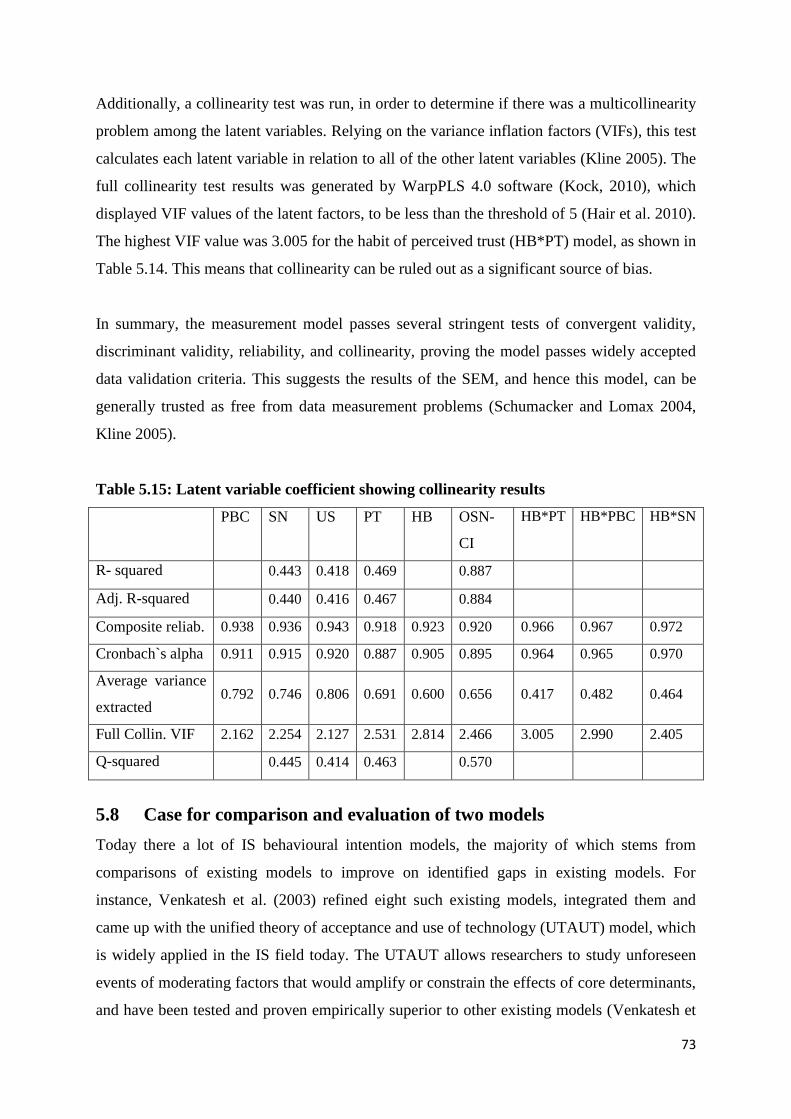
73
Additionally, a collinearity test was run, in order to determine if there was a multicollinearity
problem among the latent variables. Relying on the variance inflation factors (VIFs), this test
calculates each latent variable in relation to all of the other latent variables (Kline 2005). The
full collinearity test results was generated by WarpPLS 4.0 software (Kock, 2010), which
displayed VIF values of the latent factors, to be less than the threshold of 5 (Hair et al. 2010).
The highest VIF value was 3.005 for the habit of perceived trust (HB*PT) model, as shown in
Table 5.14. This means that collinearity can be ruled out as a significant source of bias.
In summary, the measurement model passes several stringent tests of convergent validity,
discriminant validity, reliability, and collinearity, proving the model passes widely accepted
data validation criteria. This suggests the results of the SEM, and hence this model, can be
generally trusted as free from data measurement problems (Schumacker and Lomax 2004,
Kline 2005).
Table 5.15: Latent variable coefficient showing collinearity results
PBC SN US PT HB OSN-
CI
HB*PT HB*PBC HB*SN
R- squared 0.443 0.418 0.469 0.887
Adj. R-squared 0.440 0.416 0.467 0.884
Composite reliab. 0.938 0.936 0.943 0.918 0.923 0.920 0.966 0.967 0.972
Cronbach`s alpha 0.911 0.915 0.920 0.887 0.905 0.895 0.964 0.965 0.970
Average variance
extracted 0.792 0.746 0.806 0.691 0.600 0.656 0.417 0.482 0.464
Full Collin. VIF 2.162 2.254 2.127 2.531 2.814 2.466 3.005 2.990 2.405
Q-squared 0.445 0.414 0.463 0.570
5.8 Case for comparison and evaluation of two models
Today there a lot of IS behavioural intention models, the majority of which stems from
comparisons of existing models to improve on identified gaps in existing models. For
instance, Venkatesh et al. (2003) refined eight such existing models, integrated them and
came up with the unified theory of acceptance and use of technology (UTAUT) model, which
is widely applied in the IS field today. The UTAUT allows researchers to study unforeseen
events of moderating factors that would amplify or constrain the effects of core determinants,
and have been tested and proven empirically superior to other existing models (Venkatesh et
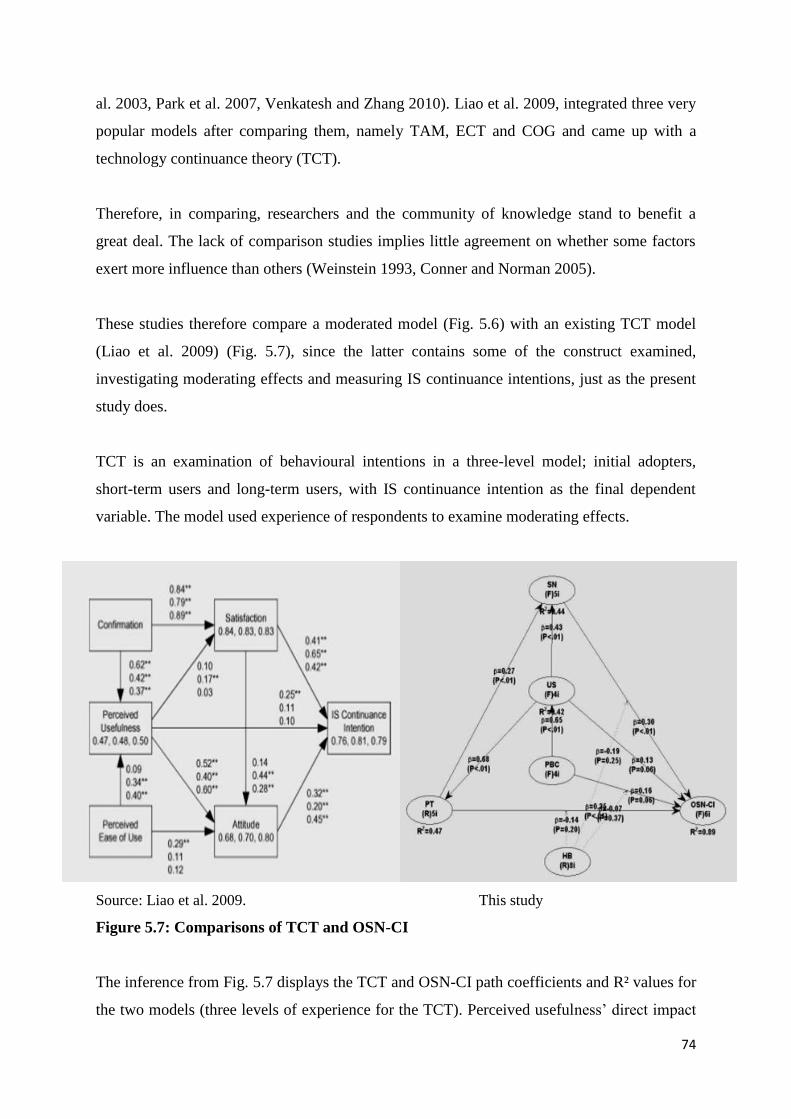
74
al. 2003, Park et al. 2007, Venkatesh and Zhang 2010). Liao et al. 2009, integrated three very
popular models after comparing them, namely TAM, ECT and COG and came up with a
technology continuance theory (TCT).
Therefore, in comparing, researchers and the community of knowledge stand to benefit a
great deal. The lack of comparison studies implies little agreement on whether some factors
exert more influence than others (Weinstein 1993, Conner and Norman 2005).
These studies therefore compare a moderated model (Fig. 5.6) with an existing TCT model
(Liao et al. 2009) (Fig. 5.7), since the latter contains some of the construct examined,
investigating moderating effects and measuring IS continuance intentions, just as the present
study does.
TCT is an examination of behavioural intentions in a three-level model; initial adopters,
short-term users and long-term users, with IS continuance intention as the final dependent
variable. The model used experience of respondents to examine moderating effects.
Source: Liao et al. 2009. This study
Figure 5.7: Comparisons of TCT and OSN-CI
The inference from Fig. 5.7 displays the TCT and OSN-CI path coefficients and R² values for
the two models (three levels of experience for the TCT). Perceived usefulness’ direct impact
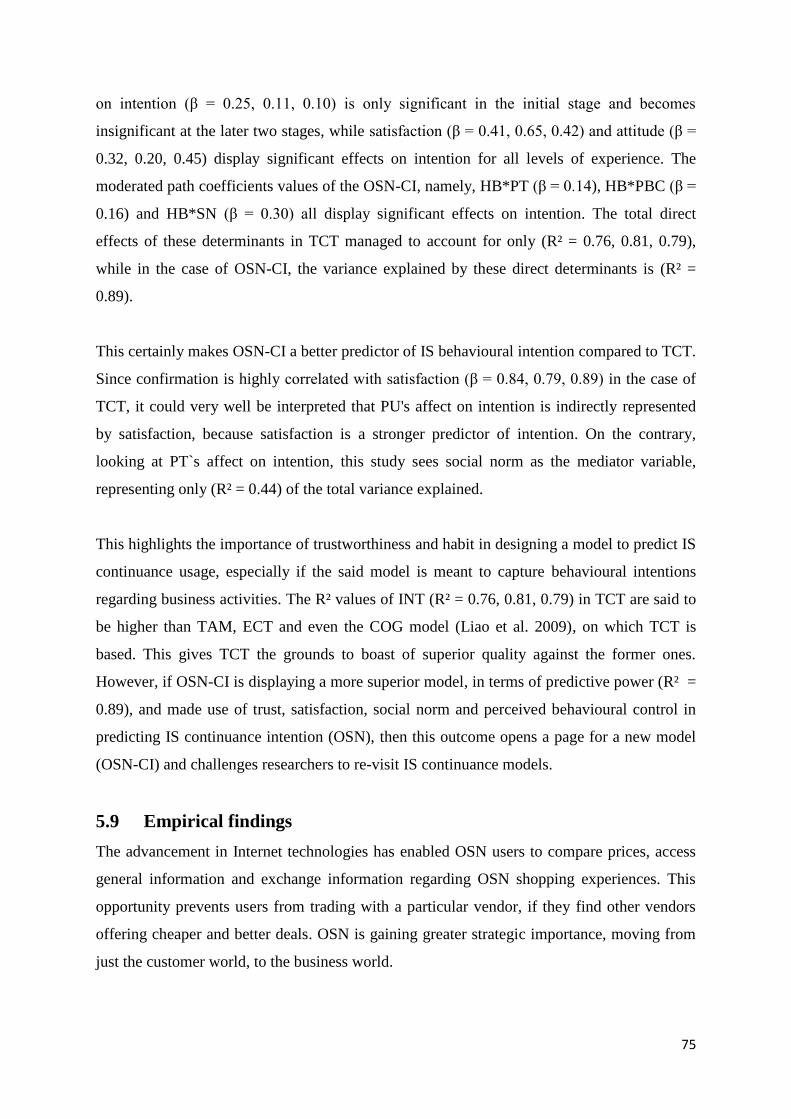
75
on intention (β = 0.25, 0.11, 0.10) is only significant in the initial stage and becomes
insignificant at the later two stages, while satisfaction (β = 0.41, 0.65, 0.42) and attitude (β =
0.32, 0.20, 0.45) display significant effects on intention for all levels of experience. The
moderated path coefficients values of the OSN-CI, namely, HB*PT (β = 0.14), HB*PBC (β =
0.16) and HB*SN (β = 0.30) all display significant effects on intention. The total direct
effects of these determinants in TCT managed to account for only (R² = 0.76, 0.81, 0.79),
while in the case of OSN-CI, the variance explained by these direct determinants is (R² =
0.89).
This certainly makes OSN-CI a better predictor of IS behavioural intention compared to TCT.
Since confirmation is highly correlated with satisfaction (β = 0.84, 0.79, 0.89) in the case of
TCT, it could very well be interpreted that PU's affect on intention is indirectly represented
by satisfaction, because satisfaction is a stronger predictor of intention. On the contrary,
looking at PT`s affect on intention, this study sees social norm as the mediator variable,
representing only (R² = 0.44) of the total variance explained.
This highlights the importance of trustworthiness and habit in designing a model to predict IS
continuance usage, especially if the said model is meant to capture behavioural intentions
regarding business activities. The R² values of INT (R² = 0.76, 0.81, 0.79) in TCT are said to
be higher than TAM, ECT and even the COG model (Liao et al. 2009), on which TCT is
based. This gives TCT the grounds to boast of superior quality against the former ones.
However, if OSN-CI is displaying a more superior model, in terms of predictive power (R² =
0.89), and made use of trust, satisfaction, social norm and perceived behavioural control in
predicting IS continuance intention (OSN), then this outcome opens a page for a new model
(OSN-CI) and challenges researchers to re-visit IS continuance models.
5.9 Empirical findings
The advancement in Internet technologies has enabled OSN users to compare prices, access
general information and exchange information regarding OSN shopping experiences. This
opportunity prevents users from trading with a particular vendor, if they find other vendors
offering cheaper and better deals. OSN is gaining greater strategic importance, moving from
just the customer world, to the business world.
76
However, what is more crucial, is to uncover the factors that compel customers and vendors
to converge on OSN for business activities and the possible clues to determine their future
continuance intentions. This study has revealed the factors of perceived trust, social norm and
user satisfaction, in that order, to play important roles in influencing continuance intention.
The study result generally suggests that, when the confidence level of trust is attained among
groups or individuals, they automatically become satisfied with the act they are performing.
This act may be doing business on OSN.
This result generally gives credence to the argument that user satisfaction is an important
determinant of continuance intention (Oliver 1980, Bhattacherjee 2001). However, this study
found perceived trust to be the most important determinant of continuance intention and not
user satisfaction. This could be attributed to the fact that the study is about business, but
Bhattacherjee (2001) does not consider perceived trust in his model of continuance intention.
PBC and social norm played a more prominent role in user satisfaction, not forgetting that
PBC entails the means by which one can access OSN. The pervasiveness of portable devices,
such as smart phones and iPads, makes it easy to access the Internet these days, hence PBC is
shown not to directly influence OSN continuance intention.
5.10 Theoretical contributions
This work has investigated the factors of social norm, PBC, user satisfaction and perceived
trust, to predict OSN continuance intention. Perceived trust was the most important, direct
determinant of OSN continuance intention. On one hand, users might fear supplying their
credit card information to any commercial OSN business provider, because of online security
threats, which is a common phenomenon nowadays. On the other hand, a commercial OSN
service provider may fear the effort of network hackers, who may intend to steal credit card
numbers.
This cycle of suspicion obviously borders on trust, which is an important issue to be
considered when talking about intention to do business, whether online or offline. These
findings are therefore not surprising, when perceived trust emerged as the greatest
influencing factor that will compel users to indulge in OSN for business transactions. This
gives support to several other studies that have focused on various issues of trust in electronic
77
commerce (Awad and Ragowsky 2008, Choudhury and Karahanna 2008, Kim et al. 2008,
Vance et al. 2008).
It can be deduced from this analysis that users will only deal with OSNs that they perceive to
be trustworthy in providing them with services or products. However, trust does not happen
overnight, but through a process and continuous interactions between a particular OSN and
customers. This study, therefore makes this first theoretical contribution, by suggesting that
OSN vendors search for holistic strategies to build the initial trust that users look for, before
deciding on their choice of OSN for business transactions.
The social norm or peer pressure factor is found to be the next direct determinant of OSN
continuance intention. Following the line of argument that social norm is a strong influencing
factor to create an intention (Sripalawat et al. 2011), this study lends support to that result, by
finding social norm to be the second most important determinant of OSN continuance
intention. Consequently, the second theoretical contribution of this study is that OSN
business providers who intend to win more customers, should adopt the strategy of peer
pressure to motivate users to use their websites. In particular, the popularity of social media
can be explored to create interpersonal interactions on blogs and in networking communities.
After they come to the OSN, electronic vendors should be honest, mindful of privacy and
security of the users, as well as provide them with improved services and products.
The bulk of these respondents are young people, between the age of 18 and 35, who do
business online. As a result, before making any decision to use OSN for business, young
people are far more likely to consult their social networks for advice (Thorbjornsen et al.
2007, Wang and Xiao 2009). The social networks created through LinkedIn, Twitter,
Facebook and other social platforms, are more than just a static hobby, they are also a
complex support circle. For these young people, an OSN mirrors the social groups
established by the older generations. We all sometimes rely on advice from people that we
trust, to support this decision-making process.
The third most important, direct determinant of OSN continuance intention, according to the
results of this study, is user satisfaction. These findings add confirmation to the several
discussions and extensive studies that user satisfaction has received as a topic of interest
throughout the psychology, marketing, management and information system literature
78
(Bhattacherjee and Lin 2014, Hsu et al. 2014). Support is lent by this study, to the popular
theory that customer satisfaction is a post-purchase attitude, formed through a mental
comparison of service and product quality that a customer expects to receive from an
exchange, as well as the level of service and product quality the customer perceives from the
exchange (Bhattacherjee and Lin 2014, Hsu et al. 2014).
This study, therefore contributes to the body of user satisfaction knowledge, that OSN
vendors should strive to make customers happy by being honest, and providing quality
services and products, in as much as they receive these from their social network providers.
5.11 Business implications
Results of this research suggest that user satisfaction of a particular OSN, in addition to
perceived trust and social norm impact users` continuance intention to do business on that
platform.
Although this study looked at only one aspect, customer satisfaction is said to be composed
of multiple components. These components include satisfaction with the product (product
satisfaction) (Homburg and Rudolph 2001); the supplier's performance (performance
satisfaction) (Sheth 1973); and the relationship with the individual salesperson (interpersonal
satisfaction, also referred to as relationship satisfaction) (Manning and Reece 2001).
Understanding these differences could be useful to both OSN vendors and practitioners, to
better understand decision-making processes and explain why different users, given similar
information, select different OSNs for business transactions.
The indirect influence of PBC on OSN continuance intention through user satisfaction, the
greatest coefficient factor (β=0.642) suggests that when infrastructures, needed to access
OSNs, are within reach (user reach), the user satisfaction level rises and users would intend to
continue using OSN for business transactions. Findings from this research add confirmation
to the important role that technology plays in solving numerous customer problems. These
findings are consistent with previous offline research, where customer participation in OSN
was shown to lead to greater satisfaction (Cermak et al. 2011) and higher expected benefits
from OSN.
79
The notion that customers actively participate in the process of co-creating value with firms,
is attracting increasing attention from academia (Prahalad and Ramaswamy 2004). Based on
the strong influence of user participation in OSN found in this study, the current research can
be viewed as adding value to existing knowledge and extending this stream of academic
research in a new direction (i.e. doing business with OSN).
The concept of PBC has been discussed to be the means by which an individual can access a
technology and the confidence with which he or she is capable of performing a given
behaviour (Ajzen 2008). In addition, this implies the perception of volitional control or the
perceived difficulty towards the behaviour affecting the intent (Chang 1998). Yet, the
findings of this research' proved that PBC is not significant when it comes to directly forming
intention.
This again supports Al-Debai et al. (2013), Ajjan et al. (2014), Kwong and Park (2008) who
find that the influence of PBC on continuance intention is not insignificant in research
conducted on college students. This could be attributed to the computer and knowledge of
Internet services, which are now common skills among the youth, who believe they would be
able to use OSN for business transactions, regardless of circumstances. External control
factors, such as financial resources, might be more important for younger users, as opposed to
internal control factors, such as abilities and skills (Thorbjornsen et al. 2007). With the
upsurge of electronic learning these days proving to be the highest mode of learning, it could
probably take the youth only a few seconds to master transacting business on OSN platforms.
5.12 Limitations
Online surveys generally have some intrinsic limitations and this study is no exception.
Respondents to the survey were self selected, and may have their own agenda for
participating in the study, rather than being randomly or scientifically selected. Moreover, if
the data were self-reported, there is no guarantee that participants would provide accurate
information (Bhattacherjee 2001, Wright 2005). Future research studies should take the
above limitations of the survey study into account.
80
CHAPTER 6: SUMMARY AND CONCLUSION
This chapter presents the overall summary of the research and recommendations accruing
from the work is submitted as well. Finally, a conclusion is drawn.
6.1 Summary
This study synthesized other research approaches to venture into quite a new dimension of
OSN for business transactions (social business) and demonstrated the different types of Web
2.0. It also sought to unravel the factors that influence people using OSN for business, instead
of the well-known e-commerce models. The two platforms are not the same, but with a
traditional e-commerce mind set, it is hard to see the difference between a presence on
Twitter, LinkedIn and Facebook as distinct from e-commerce websites. OSN is more than
just a platform for social interaction, where first time users (adults) are influenced by
bandwagon effects and social media adverts, among other possible factors.
After adopting the theory of socio-cognitive trust (TST), PBC theory and ECT to build a new
model that predicts intentions for social business, findings suggest that trust, social norm and
satisfaction are crucial when doing business on this platform. PBC was not seen to play a
significant role in continuance intention, but is significant in relation to satisfaction. In
considering OSN when buying online for the first time, this study could suggests users were
influenced by peers and social media adverts, among other possible factors, or have
developed a level of initial trust with any web site where they have purchased, as suggested
in Wu et al. (2010).
With regards to social norm, it came to light that, for young people who normally form the
bulk percentage of these platforms, the opinions and purchase decisions of others possess
great value for them. This means that, in an effort to have a business on OSN, networks and
e-vendor sites should think of strategies embedded in peer pressure, to win a greater market
share. In this sense, belonging and social pressure play critical roles in predicting behaviour.
People, especially the younger generation, seem to be looking for approval from other people
who are important to them, and therefore e-vendors should keep these influences in mind
when designing their web sites. The study demonstrates that the use of norm based
81
advertisement messages may be effective in attracting potential customers through the
strategy of group buying discounts.
Providing quality services and products seem to be the reasons why people become happy on
the social business platform. However, it should be borne in mind by e-vendors on this
platform that it is more about interaction than just products. Consequently, vendors should
listen to what customers say and provide positive and timely feedback, seeing it as an
opportunity to co-create new products and services.
6.2 Suggestions for further research
Researching OSN has gained prominence in recent years. However, the majority of these
works concentrate on the antecedents of continuance intention and continuance behaviour
without giving any consideration to the OSN, Web 2.0 and cloud computing models fit for
business activities, in terms of technicalities and regulatory policies. The researcher could not
find any such comparable model, so could not compare to drawing a rigorous expository
analysis. This study, therefore, recommends further studies in this light as many more are
switching from brick and mortar business structures to OSN.
6.3 Conclusion
A social business does not simply sell products, but also customer experience and
satisfaction. In conclusion, this implies that the more users become satisfied, the more they
trust the seller and vice versa. In turn, user satisfaction affects their post-expectation and their
future behavioural intention, such as repurchase intention. Building user trust is obviously the
most essential mission for doing business on OSN according to this study, because there are
no standard and universally acceptable regulations and policies to safeguard user interest. The
purchasing decision of a user is considered as trust related behaviour (Urban et al. 2009),
purely based on the trustworthiness of the OSN vendor.
82
BIBLIOGRAPHY
Aguiton, C. and Cardon, D., 2007. The Strengths of Weak Cooperation and Attemptto
Understand the Meaning of Web 2.0. Communications and strategies, 65 (1st quarter),
pp. 51-65.
Aibinu, A. A., and Al-Lawati, A. M. 2010. Using PLS-SEM technique to model construction
organizations' willingness to participate in e-bidding. Automation in Construction,
19(6), 714 -724.
Ajjan, H., Hartshorne, R., Cao, Y., and Rodriguez, M. 2014. Continuance use intention of
enterprise instant messaging: a knowledge management perspective. Behaviour &
Information Technology(ahead-of-print), 1-15.
Ajzen, I. 1985. From intentions to actions: A theory of planned behavior. In J.Kuhl and
J.beckmann (Eds.), Action-control: From cognition to behavior (pp.11-39).
Heidelberg, Germany: Sprnger.
Ajzen, I. and Fishbein, M. 1980. Understanding attitudes and predicting social behavior.
Upper Saddle River, NJ: Prentice-Hall.
Ajzen, I., and Madden, Thomas J. 1986. Prediction of goal-directed behavior: Attitudes,
intentions, and perceived behavioral control. Journal of experimental social
psychology, 22(5), 453-474.
Ajzen, I. 1991. The theory of planned behavior. Organizational behavior and human decision
processes, 50(2), 179-211.
Ajzen, I., 2002. Perceived behavioral control, self‐efficacy, locus of control and the theory of
planned behavior1. Journal of applied social psychology, 32(4), 665-683.
Ajzen, I., 2008. Consumer attitudes and behavior. Handbook of Consumer Psychology, 525-
548.
Akter, S., D’Ambra, J., Ray, P., and Hani, U., 2013. Modelling the impact of mHealth service
quality on satisfaction, continuance and quality of life. Behavior and Information
Technology, 32(12), 1225–1241.
Al-Debei, M. M., Al-Lozi, E., and Papazafeiropoulou, A. 2013. Why people keep coming
back to Facebook: Explaining and predicting continuance participation from an
extended theory of planned behaviour perspective. Decision Support Systems, 55(1),
43-54.
83
Al-Hawari, M. A., and Mouakket, S., 2012. Do offline factors trigger customers' appetite for
online continual usage? A study of online reservation in the airline industry. Asia
Pacific Journal of Marketing and Logistics, 24(4), 640-657.
Anderson, C.L., and Agarwal, R., 2010. Practicing safe computing: a multimedia empirical
examination of home computer user security behavioral intentions. MIS Quarterly,
34(3), 613-643.
Anderson, R. E, and Srinivasan, S. S. 2003. E‐satisfaction and e‐loyalty: A contingency
framework. Psychology & Marketing, 20(2), 123-138.
Antheunis, M. L., Valkenburg, P. M., and Peter, J. 2010. Getting acquainted through social
network sites: Testing a model of online uncertainty reduction and social attraction.
Computers in Human Behavior, 26(1), 100–109
Armitage, C. J., and Conner, M., 1999. The theory of planned behavior: assessment of
predictive validity and perceived control. British Journal of Social Psychology, 38(1),
35-54.
Awad, N. F., and Ragowsky, A., 2008. Establishing trust in electronic commerce through
online word of mouth: an examination across genders. Journal of Management
Information Systems, 24(4), 101-121.
Bagozzi, R. P., and Yi, Y., 2012. Specification, evaluation and interpretation of structural
equation models. Journal of the Academy of Marketing Science, 40(1), 8-34.
Baker, E. W., Al-Gahtani, S. S., and Hubona, G. S., 2007. The effects of gender and age on
new technology implementation in a developing country: testing the theory of planned
behavior (TPB). Information Technology and People, 20(4), 352-375.
Baker, R. K., and White, K. M., 2010. Predicting adolescents’ use of social networking sites
from an extended theory of planned behavior perspective. Computers in Human
Behavior, 26(6), 1591-1597.
Baron, R., and Kenny, D. 1986. The moderator-mediator variable distinction in social
psychological research: Conceptual, strategic, and statistical considerations. Journal
of Personality and Social Psychology, 51(6), 1173–1182.)
Bart, Y., Shankar, V., Sultan, F., and Urban, G. L. 2005. Are the drivers and role of online
trust the same for all web sites and consumers? A large-scale exploratory empirical
study. Journal of Marketing, 69, 133–152.
Bearden, W.O and Sharma, S and Teel, J.E. 1980. Sample size effect on chi square and other
statistics used in evaluating causal models. Journal of marketing research: 425-430
84
Beatty, P., Reay, I., Dick, S., and Miller, J., 2011. Consumer trust in e-commerce web sites: a
meta-study. ACM Computing Surveys (CSUR), 43(3), 14.
Bettinger, E, Loeb, S, and Taylor, E. 2014. Remote but Influential: Peer Effects and
Reflection in Online Higher Education Classrooms.
Bhattacherjee, A., 2000. Acceptance of e-commerce services: the case of electronic
brokerages. IEEE Transactions on Systems, Man and Cybernetics - Part A: Systems
and Humans., 30(4), 411-420.
Bhattacherjee, A., 2001. Understanding information systems continuance: an expectation-
confirmation model. MIS Quarterly, 25, 351-370.
Bhattacherjee, A., and Barfar, A. 2011. Information technology continuance research: current
state and future directions. Asia Pacific Journal of Information Systems, 21(2), 1-18.
Bhattacherjee, A. and Lin, C-P. 2014. A unified model of IT continuance: three
complementary perspectives and crossover effects. European Journal of Information
Systems.
Bhattacherjee, A., and Premkumar, G., 2004. Understanding changes in belief and attitude
toward information technology usage: a theoretical model and longitudinal test. MIS
quarterly, 28(2), 229-254.
Bhattacherjee, A., Perols, J., and Sanford, C., 2008. Information technology continuance: a
theoretical extension and empirical test. Journal of Computer Information Systems,
49(1), 17-26.
Bhattacherjee, A., and Sanford, C. 2009. The intention–behaviour gap in technology usage:
the moderating role of attitude strength. Behaviour & Information Technology, 28(4),
389-401
Bianchi, C. and Andrews, L. 2012. Risk, trust, and consumer online purchasing behaviour: a
Chilean perspective. International Marketing Review, 29(3), 253-275.
Blaxter, L., Hughes, C. and Tight, M., 2001. How to research. 2nd ed. Buckingham: Open
University Press.
Boston, M.A, McGrow H., Schumacker, R. E., and Lomax, R. G. 2004. A beginner's guide to
structural equation modeling. Mahwah, N.J.: Lawrence Erlbaum Associates.
Boyd, D. M., and Ellison, N. B., 2008. Social network sites: definition, history and
scholarship. Journal of Computer-Mediated Communication, 13(1), 210-230.
Brown, S.A., Venkatesh, V., Goyal, S., 2012. Expectation confirmation in technology use.
Information Systems Research 23 (2), 474–487.
85
Buchanan, E A, and Hvizdak, E.E. 2009. Online survey tools: Ethical and methodological
concerns of human research ethics committees. Journal of Empirical Research on
Human Research Ethics: An International Journal, 4(2), 37-48.
Bughin, J. and Chui, M. 2010, “The rise of the networked enterprise: Web 2.0 finds its
payday”, McKinsey Quarterly, December, pp. 1-9.
Cachia, R., Compañó, R., and Da Costa, O., 2007. Grasping the potential of online social
networks for foresight. Technological Forecasting and Social Change, 74(8), 1179-
1203.
Castelfranchi, C., and Falcone, R., 2010. Trust theory: a socio-cognitive and computational
model. Wiley Series in Agent Technology, John Wiley and Sons Ltd., Chichester.
Cermak, D. S.P, File, K.M., and Prince, R. A., 2011. Customer participation in service
specification and delivery. Journal of Applied Business Research (JABR), 10(2), 90-
97.
Chang, M. K., 1998. Predicting unethical behavior: a comparison of the theory of reasoned
action and the theory of planned behavior. Journal of business ethics, 17(16), 1825-
1834.
Chau, P. Y. K., Hu, P. J. H., Lee, B. L. P., and Au, A. K. K. 2007. Examining customers’
trust in online vendors and their dropout decisions: An empirical study. Electronic
Commerce Research and Applications, 6, 171–182.
Chen, J. and Dibb, S. 2010, “Consumer trust in the online retail context: exploring the
antecedents and consequences”, Psychology and Marketing, Vol. 27 No. 323-346.\
Chen, Y-T. and Chou, T-Y. 2012. Exploring the continuance intentions of consumers for
B2C online shopping: Perspectives of fairness and trust. Online Information Review,
36(1), 104-125.
Chia, S. 2006. How peers mediate media influence on adolescents’ sexual attitudes and
sexual behavior. Journal of Communication, 56, 585–606.
Cialdini, R., Reno, R., and Kallgren, C. 1990. A focus theory of normative conduct:
Recycling the concept of norms to reduce littering in public places. Journal of
Personality and Social Psychology, 58, 1015–1026.
Chin, W. W. 1998. The partial least squares approach to structural equation modeling.In:
Marcoulides, G. A. ed. Modern methods for business research. Mahwah, NJ:
Lawrence Erlbaum, 195-336.
86
Chin, W.W and Newsted P.R., 1999. Structural equation modeling analysis with small
samples using partial least squares. In Hoyle, R. (Ed.), Statistical strategies for small
sample research, Sage Publications, California (1999), pp. 307–341
Chin, W. W., Marcolin, B. L., and Newsted, P. N. 2003. A partial least squares latent variable
modeling approach for measuring interaction effects: results from a monte carlo
simulation study and an electronic-mail emotion/adoption study. Information Systems
Research, 14(2), 189–217.
Choudhury, V., and Karahanna, E., 2008. The relative advantage of electronic channels: a
multidimensional view. MIS Quarterly, 32(1), 179.
Choi, H., Kim, Y., and Kim, J. 2011. Driving factors of post adoption behavior in mobile data
services. Journal of Business Research, 64(11), 1212-1217.
Choi, J., Jung, J., and Lee, S. W. 2013. What causes users to switch from a local to a global
social network site? The cultural, social, economic and motivational factors of
Facebook’s globalization. Computers in Human Behavior, 29(6), 2665–2673.
Chow, W.S., and Chan, L.S., 2008. Social network, social trust and shared goals in
organizational knowledge sharing. Information and Management, 45(7), 458-468.
Churchill, G.A., and Surprenant, C., 1982. An investigation into the determinants of customer
satisfaction. Journal of Marketing Research, 491-504.
Cohen, J. 1988. Statistical power analysis for the behavioural sciences. Hillsdale, NJ:
Lawrence Erlbaum.
Constanza, B., and Lynda, A., 2012. Risk, trust, and consumer online purchasing behavior: a
Chilean perspective. International Marketing Review, 29(3), 253 – 275.
Conner, M. and Norman, P. 2005. Predicting health behavior: a social cognition approach,
England: Open University Press Maidenhead.
Cooper, D. R, and Schindler, P. S. 2003. Business research methods.
Cornell, J. A. and Berger, R. D. 1987. Factors that influence the value of the coefficient of
determination in simple linear and nonlinear regression models. Phytopathology,
77(1), 63-70.
Cornin, J. J., Jr., and Taylor, S. A. 1992. Measuring service quality: A re-examination
and extension. Journal of Marketing, 56, 55–68.
Cronbach, L. 1951. Coefficient alpha and the internal structure of tests. Psychometrika,
16(3): 297-334.
Crossan, M. M. and Apaydin, M. 2010. A Multi-Dimensional Framework of
Organizational Innovation: A Systematic Review of the Literaturejoms.
87
Custin, R., and Barkacs, L. 2010. Developing sustainable learning communities through
blogging. Journal of Instructional Pedagogies, 4, 1-8.
Cutillo, L.A., Molva, R., and Strufe, T., 2009. Safebook: a privacy-preserving online social
network leveraging on real-life trust. IEEE Communications Magazine. 47(12), 94-
101.
Dabholkar, P. A, and Sheng, X. 2012. Consumer participation in using online
recommendation agents: effects on satisfaction, trust, and purchase intentions. The
Service Industries Journal, 32(9), 1433-1449.
Dalkir, K. 2013. Knowledge management in theory and practice: Routledge.
Danesh, S.N., Nasah, S.S., and Ling, K.C., 2012. The study of customer satisfaction,
customer trust and switching barriers on customer retention in Malaysia
hypermarkets. International Journal of Business and management, 7(7), 141-150.
Davis, F.D. 1989. Perceived usefulness, perceived ease of use, and user acceptance of
information technology. MIS quarterly, 319-340.
Davis, F. D., Bagozzi, R. P., and Warshaw, P. R., 1989. User acceptance of computer
technology: A comparison of two theoretical models. Management Science, 35, 982-
1003.
Debatin, B., Lovejoy, J. P., Horn, A. K., and Hughes, B. N. 2009. Facebook and online
privacy: Attitudes, behaviors, and unintended consequences. Journal of Computer-
Mediated Communication, 15(1), 83–108.
Deng, Z., Lu, Y., Wei, K. K., and Zhang, J., 2010. Understanding customer satisfaction and
loyalty: An empirical study of mobile instant messages in China. International
Journal of Information Management, 30(4), 289-300.
Devaraj, S., Fan, M., and Kohli, R., 2002. Antecedents of B2C channel satisfaction and
preference: validating e-commerce metrics. Information Systems Research, 13(3),
316-333.
Devaraj, S., Fan, M., and Kohli, R. 2003. E-loyalty: elusive ideal or competitive edge?
Communications of the ACM, 46(9), 184-191.
Digital Surgeons 2010. Facebook Vs Twitter Statistics Available at:
www.digitalsurgeons.com/facebook-vs- twitter-infographic.
Dinev T, Bellotto M, Hart P, Russo V, Serra I., and Colautti C. 2006. Privacy calculus model
in e-commerce—a study of Italy and the United States. Eur J Inf Syst;15:389–402.
Di Loreto, I., 2007. Web 2.0 as a challenge for social networking and communitybuilding.
Communities and Action, pp. 1-4
88
Eastin, M.S., 2002. Diffusion of e-commerce: an analysis of the adoption of fthis e-commerce
activities. Telematics and Informatics, 19(3), 251-267.
Eggert, A., Fassott, G., and Helm, S. 2005. Identifizierung und Quantifizierung mediierender
und moderierender Effekte in komplexen Kausalstrukturen. 101-116.
Engeldinger, B.L., 2011. Current trends and future issues. In: Brymer and Johanson, eds.
From Hospitality: An Introduction. Dubuque, Iowa, Kendall Hunt Publishing
Company. 21-28.
Facebook. 2012. “Fact Sheet” Available at: http://newsroom.fb.com/content/default
.aspx?NewsA
Fan, L., and Suh, Y-H. 2014. Why do users switch to a disruptive technology? An empirical
study based on expectation-disconfirmation theory. Information & Management,
51(2), 240-248.
Fang, Y-H, and Chiu, C-M. 2010. In justice we trust: Exploring knowledge-sharing
continuance intentions in virtual communities of practice. Computers in Human
Behavior, 26(2), 235-246.
Fiegen, A.M. 2010. "Systematic review of research methods: the case of business
instruction", Reference Services Review, Vol. 38, No. 3, pp. 385-397.
Fishbein, M., and Ajzen, I., 1975. Belief, attitude, intention and behavior: an introduction to
theory and research. Addison-Wesley.
Foddy, M., Platow, M. J., and Yamagishi, T. 2009. Group-based trust in strangers.
Psychological Science, 20, 419–422.
Fornell, C., and Larcker, D.F., 1981. Evaluating structural equation models with
unobservable variables and measurement error. Journal of Marketing Research, 39-
50.
Fornell, C. 1982. A second generation of multivariate analysis. 2. Measurement and
evaluation (Vol. 2): Praeger Publishers.
Fortino, A., and Nayak, A., 2010. An architecture for applying social networking to business.
In: Proceedings of Applications and Technology Conference (LISAT), 7-7 May, Long
Island Systems, 1-6.
Foss, N. J, and Klein, P.G. 2013. Hayek and Organizational Studies: forthcoming in: Paul
Adler, Paul du Gay, Glenn Morgan, and Mike Reed, eds. Oxford Handbook of
Sociology, Social Theory and Organization Studies: Contemporary Currents. Oxford:
Oxford University Press.
89
Gao, L., and Bai, X. 2014. An empirical study on continuance intention of mobile social
networking services: Integrating the IS success model, network externalities and flow
theory. Asia Pacific Journal of Marketing and Logistics, 26(2), 168-189. doi:
10.1108/apjml-07-2013-0086
Gefen, D., Karahanna, E., and Straub, D.W., 2003. Trust and TAM in online shopping: an
integrated model. MIS Quarterly, 51-90.
Gerbranda, M., 2007. De Gebruikers aan de Macht: Een nieuwe discipline voor
Arbeidsmarktcommunicatie. [online] Msc thesis, Universiteit van Tilburg. Available
from: http://merkme.nl/thesis.pdf [Accessed 10/08/2013]
Ghauri, P. N and Grønhaug, K. 2005. Research methods in business studies: A practical
guide: Pearson Education.
Ginsberg, A. and Venkatraman, N. 1985. ‘Contingency perspective of organizational
strategy: a critical review of the empirical research’. Academy of Management
Review, 10, 421–34.
Gopi, M., and Ramayah, T., 2007. Applicability of theory of planned behavior in predicting
intention to trade online: some evidence from a developing country. International
Journal of Emerging Markets, 2(4), 348-360.
Guinea, D, Ortiz, A., and Markus, M. L. 2009. Why break the habit of a lifetime? Rethinking
the roles of intention, habit, and emotion in continuing information technology use.
Mis Quarterly, 33(3), 433-444.
Gunther, A., Bolt, D., Borzekowski, D., Liebhart, J., and Dillard, J. 2006. Presumed influence
on peer norms: How mass media indirectly affect adolescent smoking. Journal of
Communication, 56, 52–68.
Haj-Salem, N. and Chebat, J. 2013. The double-edged sword: The positive and negative
effects of switching costs on customer exit and revenge. Journal of Business Research
(inpress). http://www.sciencedirect.com/science/article/pii/S0148296313002543
Accessed 25.10.13.
Hampton, K., Goulet, L. S., Rainie, L., and Purcell, K., 2011. Social networking sites and this
lives. Pew Internet and American Life Project.
Hansemark, O.C., and Albinson, M, 2004. Customer satisfaction and retention: the
experiences of individual employees. Managing Service Quality, 14(1), 40-57.
Hart, C. 1998. Doing a literature review, London:Sage.
90
Hair, J.F, Sarstedt, M., Ringle, C.M, and Mena, J. 2012. An assessment of the use of partial
least squares structural equation modeling in marketing research. Journal of the
Academy of Marketing Science, 40(3), 414-433.
Hair, J.F., William, C.B., Barry, J.B., and Rolph E.A. 2010, Multivariate Data Analysis,
Englewood Cliffs, NJ: Prentice Hall.
Hassanein, K., and Head, M., 2007. Manipulating perceived social presence through the web
interface and its impact on attitude towards online shopping. International Journal of
Human-Computer Studies, 65(8), 689-708.
Hegarty, N, Hayden, H., and Foley, D. 2009. Supposing is good, but finding out is better: a
survey of research postgraduate students at WIT Libraries. SCONUL Focus, 46, 91-
95.
Helm, S., Eggert, A. and Garnerfeld, I. 2010. Modelling the impact of corporate reputation on
customer satisfaction and loyalty using partial least square. In: V. Esposito, et al, ed.
Handbook of partial least squares. Berlin: Springer, 515 – 534.
Henseler, J., and Fassott, G. 2010. Testing moderating effects in PLS path models: An
illustration of available procedures Handbook of partial least squares (pp. 713-735):
Springer.
Henseler, J., Ringle, C., and Sinkovics, R. 2009. The use of partial least squares path
modeling in international marketing. Advances in International Marketing, 8(20),
277-319.
Hsieh, K. J., Hsieh, Y. C., Chiu, H. C., and Feng, Y. C. 2012. Post-adoption switching
behavior for online service substitutes: A perspective of the push–pull–mooring
framework. Computers in Human Behavior, 28(5), 1912–1920.
Hevner, A. R., March, S. T., Park, J. & Ram, S. 2004. Design science in information systems
research. MIS quarterly, 28, 75-105.
Hidalgo, L.A., Szabo, I., Le Brun, L., Owen, I., and Fletcher, G. 2011, "Evidence Based
Scoping Reviews", The Electronic Journal Information Systems Evaluation, Vol. 14,
No. 1, pp. 46-52.
Higgins, J.P.T and Green, S. 2009. Cochrane handbook for systematic reviews of
interventions version 5.0. 2 [updated September 2009]. The Cochrane Collaboration,
2009.
Ho, S. S., Poorisat, T.N., Rachel L, and Detenber, B. H. 2014. Examining how presumed
media influence affects social norms and adolescents' attitudes and drinking behavior
intentions in rural Thailand. Journal of health communication, 19(3), 282-302.
91
Hoegg, R., Martignoni, R., Meckel, M., and Stanoevska-Slabeva, K.. 2006. Overview of
business models for Web 2.0 communities. Proceedings of GeNeMe, 2006, 23-37.
Homburg, C. and Rudolph, B. 2001. Customer satisfaction in industrial markets: dimensional
and multiple role issues. Journal of Business Research, 52(1), 15-33.
Hsu, C-L, Yu, C-C, and Wu, C-C. 2014. Exploring the continuance intention of social
networking websites: an empirical research. Information Systems and e-Business
Management, 12(2), 139-163.
Hsu, M-H., and Chiu, C-M., 2004. Predicting electronic service continuance with a
decomposed theory of planned behavithis. Behavithis and Information Technology,
23(5), 359-373.
Hsu, M-H, Chuang, L-W, and Hsu, C-S. 2014. Understanding online shopping intention: the
roles of four types of trust and their antecedents. Internet Research, 24(3), 332-352.
Hsu, M-H., Yen, C-H., Chiu, C-M, and Chang, C-M., 2006. A longitudinal investigation of
continued online shopping behavior: An extension of the theory of planned behavior.
International Journal of Human-Computer Studies, 64(9), 889-904.
Huang, A.H, and Yen, D.C. 2003. Usefulness of instant messaging among young users:
Social vs. work perspective. Human Systems Management, 22(2), 63-72.
Humphreys, L. 2011. Who’s watching whom? A study of interactive technology and
surveillance. Journal of Communication, 61(4), 575–595.
Hunt, H. K. 1977. CS/D-overview and future research directions. Conceptualization and
measurement of consumer satisfaction and dissatisfaction, 455-488
Hulland, J., 1999. Use of partial least squares (PLS) in strategic management research: a
review of four recent studies. Strategic Management Journal, 20(2), 195-204
Hutton, P., 1990. Survey Research for Managers: How to use Surveys in Management
Decision-making. 2nd ed. Basingstoke: MacMillan
Ifinedo, P., 2011. An empirical analysis of factors influencing Internet/e-business
technologies adoption by SMES in Canada. International Journal of Information
Technology Decision Making, 10 (4), 731–766.
Igbaria, M., Parasuraman, S., and Badawy, M.K. 1994. Work experiences, job involvement,
and quality of work life among information systems personnel. MIS quarterly, 175-
201.
Jarvenpaa, S. L., Tractinsky, N., and Saarinen, L. 1999. Consumer Trust in an Internet Store:
A Cross‐Cultural Validation. Journal of Computer‐Mediated Communication, 5(2),0-
0.
92
Jones, T. and Sasser, E. W. 1995, Why satisfied customers defect. Harvard Business Review,
88–99.
Joo, Y-J., Bong, M., and Choi, H-J., 2000. Self-efficacy for self-regulated learning, academic
self-efficacy and Internet self-efficacy in Web-based instruction. Educational
Technology Research and Development, 48(2), 5-17.
Kang, Y. S., H., S., and Lee, H. 2009. Exploring continued online service usage behavior:
The roles of self-image congruity and regret. Computers in Human Behavior, 25(1),
111-122.
Kaplan, A.M., and Haenlein, M., 2010. Users of the world, unite! the challenges and
opportunities of social media. Business Horizons, 53(1), 59-68
Kassim, N.M., and Abdullah, N.A., 2008. Customer loyalty in e‐commerce settings: an
empirical study. Electronic Markets, 18(3), 275-290.
Kassim, N. M. and Ismail, S. 2009. Investigating the complex drivers of loyalty in e-
commerce settings. Measuring Business Excellence, 13(1), 56-71.
Kauffman, R.J., Lai, H. and Ho, C.T. 2010. “Incentive mechanisms, fairness and participation
in online group-buying auctions”, Electronic Commerce Research and Applications,
Vol. 9 No. 3, pp. 249-262.
Keen C, Wetzels M, De Ruyter K, Feinberg R. 2004 E-tailers versus retailers: which factors
determine consumer preferences. J Bus Res 57(7):685–695
Keil, M., Tan, B.C.Y., Wei, K-K., Saarinen, T., Tuunainen, V., Wassenaar, A. 2000. A cross-
cultural study on escalation of commitment behavior in software projects. MIS
Quarterly, 24(2) pp. 299-325
Khalifa, M. and Liu, V. 2007. Online consumer retention: contingent effects of online
shopping habit and online shopping experience. European Journal of Information
Systems, 16(6), 780-792.
Kim, B. 2010. An empirical investigation of mobile data service continuance: Incorporating
the theory of planned behavior into the expectation–confirmation model. Expert
Systems with Applications, 37(10), 7033-7039.
Kim, B. 2011. Understanding antecedents of continuance intention in social networking
services. Cyberpsychol Behav Soc Netw 14(4):199–205
Kim, D.J., Ferrin, D. L., and Rao, H.R., 2008. A trust-based consumer decision-making
model in electronic commerce: the role of trust, perceived risk and their antecedents.
Decision support systems, 44(2), 544-564.
93
Kim, D.J., Ferrin, D.L, and Rao, H.R., 2009. Trust and satisfaction, two stepping stones for
successful e-commerce relationships: a longitudinal exploration. Information Systems
Research, 20(2), 237-257.
Kim, G., Shin, B., & Lee, H. G. (2009). Understanding dynamics between initial trust
and usage intentions of mobile banking. Information Systems Journal, 19(3),
283–311.
Kim, J. B. 2012. An empirical study on consumer first purchase intention in online shopping:
integrating initial trust and TAM. Electronic Commerce Research, 12(2), 125-150.
Kim, Y. 2011. The contribution of social network sites to exposure to political difference:
The relationships among SNSs, online political messaging, and exposure to cross-
cutting perspective.
Kim, Y-J, Kang, J-J, and Cho, B-Y. 2013. Investigating the Role of Network Exteranlities
and Perceived Value in User Loyalty Toward a SNS Site: Integrating Network
Externalities and VTSL Model.
Kline, R. B. 2005. Principles and practice of structural equation modeling. New York:
Guilford Press.
Kock, N., 2010. Using WarpPLS in e-collaboration studies: an overview of five main
analysis steps. International Journal of e-Collaboration, 6(4), 1-11.
Koufaris, M. 2002. Applying the technology acceptance model and flow theory to online
consumer behavior. Information systems research, 13(2), 205-223.
Kuss, D.J., and Griffiths, M.D., 2011. Online social networking and addiction—a review of
the psychological literature. International Journal of environmental research and
public health, 8(9), 3528-3552.
Kwak, H., Lee, C., Park, H., and Moon, S., 2010.What is Twitter, a social network or a news
media. In: Proceedings of the 19th International Conference on World Wide Web.
ACM New York, NY, USA, 591-600.
Kwong, S.W., and Park, J., 2008. Digital music services: consumer intention and adoption.
The Service Industries Journal, 28(10), 1463-1481.
LaBarbara, P. A., and Mazursky, D. 1983. A longitudinal assessment of consumer
satisfaction/dissatisfaction: The dynamic aspect of the cognitigve process. Journal of
Marketing Research, 20, 393-404.
Lambeth, J.M. 2013. Research foci for career and technical education: Findings from a
national Delphi study.
94
Lankton, N., McKnight, D H., and Thatcher, J. B. 2014. Incorporating trust-in-technology
into Expectation Disconfirmation Theory. The Journal of Strategic Information
Systems, 23(2), 128-145.
Lee, C.H., Eze, U.C., and Ndubisi, N. O., 2011. Analyzing key determinants of online
repurchase intentions. Asia Pacific Journal of Marketing and Logistics, 23(2), 200-
221.
Lee, M-C., 2010. Explaining and predicting users’ continuance intention toward e-learning:
An extension of the expectation–confirmation model. Computers and Education,
54(2), 506-516.
Lee MKO, Turban E. 2001. A trust model for consumer internet shopping. Int J Electron
Commer. 6(1):75–91.
Lehto, T., and Oinas-Kukkonen, H. 2014. Explaining and predicting perceived effectiveness
and use continuance intention of a behaviour change support system for weight loss.
Behaviour & Information Technology(ahead-of-print), 1-14.
Liao, C, Palvia, P., and Chen, J-L. 2009. Information technology adoption behavior life
cycle: toward a technology continuance theory (TCT). International Journal of
Information Management, 29(4), 309-320.
Liao, C., Palvia, P. and Lin, H-N. 2006. The roles of habit and web site quality in e-
commerce. International Journal of Information Management, 26(6), 469-483
Limayem, M and Cheung, C M K. 2011. Predicting the continued use of Internet-based
learning technologies: the role of habit, Behavithis and Information Technology, 30:1,
91-99.
Limayem, M. Hirt, S., and Cheung, C. 2007. How habit limits the predictive power of
intentions: the case of IS continuance, MIS Quarterly 31 (2007) 705–737.
Lindenlab.com Site Info". Alexa Internet. Retrieved 2013-12-27.
Lin, H.-F. (2011). An empirical investigation of mobile banking adoption: The effect
of innovation attributes and knowledge-based trust. International Journal of
Information Management, 31(3), 252–260.
Lin, K.-Y. and Lu, H.-P. 2011. Why people use social networking sites: An empirical study
integrating network externalities and motivation theory. Computers in Human
Behavior, 27, 1152-1161.
Lu, Y., Zhao, L., and Wang, B., 2010. From virtual community members to C2C e-commerce
buyers: trust in virtual communities and its effect on consumers’ purchase intention.
Electronic Commerce Research and Applications, 9(4), 346-360.
95
Luo, X., Li, H., Zhang, J., & Shim, J. P. (2010). Examining multi-dimensional trust and
multi-faceted risk in initial acceptance of emerging technologies: An empirical
study of mobile banking services. Decision Support Systems, 49(2), 222–234.
Lynch, P. D., Kent, R. J, and Srinivasan, S. S. 2001. The global internet shopper: evidence
from shopping tasks in twelve countries. Journal of Advertising Research, 41(3)15-24
Manning, G. L, and Reece, B. L. 2001. Selling today: building quality partnerships: Olma
Media Group.
Manstead, A.S.R, and Eekelen, S.A.M., 1998. Distinguishing between perceived behavioral
control and self‐efficacy in the domain of academic achievement intentions and
behaviors. Journal of Applied Social Psychology, 28(15), 1375-1392.
March, S.T. and Storey, V.C. 2008. Design science in the information systems discipline: an
introduction to the special issue on design science research. MIS quarterly, 32, 725-
730.
Maritz, A., Waal, A. D., Buse, S., Herstatt, C., Lassen, A., and Maclachlan, R. 2014.
Innovation education programs: toward a conceptual framework. European Journal of
Innovation Management, 17(2), 166-182. doi: 10.1108/ejim-06-2013-0051
Mark, K-P, and Vogel, D. R. 2009. An Exploratory Study of Personalization and Learning
Systems Continuance. Paper presented at the PACIS.
Mattheos, N, Schoonheim‐Klein, M., Walmsley, A.D, and Chapple, I.L.C. 2010. Innovative
educational methods and technologies applicable to continuing professional
development in periodontology. European Journal of Dental Education, 14(1), 43-52.
McAllister, D.J., 1995. Affect-and cognition-based trust as foundations for interpersonal
cooperation in organizations. Academy of Management Journal, 38(1), 24-59.
McCole, P., Ramsey, E., and Williams, J., 2010. Trust considerations on attitudes towards
online purchasing: The moderating effect of privacy and security concerns. Journal of
Business Research, 63(9), 1018-1024.
Men, L. R., and Tsai, W. H. S. 2012. How companies cultivate relationships with publics on
social network sites: Evidence from China and the United States. Public Relations
Review, 38(5), 723–730.
Miles, M.B, and Huberman, A.M. 1994. Qualitative data analysis: An expanded sourcebook:
Sage.
Mittal, V. and Kamakura, W. A. 2001. Satisfaction, Repurchase Intent, and repurchase
behavior: Investigating the moderating effect of customer characteristics Journal of
Marketing Research, 38(1) pp. 131-142
96
Moran, M., Seaman, J., and T-K., H. 2011. Teaching, Learning, and Sharing: How Today's
Higher Education Faculty Use Social Media. Babson Survey Research Group.
Murphy, J, Hill, C. A. and Dean, E. 2014. Social Media, Sociality, and Survey Research.
Social Media, Sociality, and Survey Research, 1-33.
Nayak, P. K. 2014. The Chilika Lagoon social-ecological system: an historical analysis.
Ecology and Society, 19(1), 1.
Newman, J. W., and Werbel, R. A. 1973. Multivariate analysis of brand loyalty for major
household appliances. Journal of Marketing Research, 10, 404–409.
Nickerson, A. B., Mele, D., and Princiotta, D. 2008. Attachment and empathy as
predictors of roles as defenders or outsiders in bullying interactions. Journal of
School Psychology, 46(6), 687–703.
NielsenWire 2010. “Led by Facebook, Twitter, Global Time Spent on Social Media Sites up
82% Year over Year”. Accessed on 2013-01-20 at
http://blog.nielsen.com/nielsenwire/global/led-by-facebook-twitter-global-time-spent-
on-social-media-sites-up-82-year-over-year/.
Odunaike, S.A., Olugbara, O.O, and Ojo, S.O. 2014. Mitigating Rural E-Learning
Sustainability Challenges Using Cloud Computing Technology IAENG Transactions
on Engineering Technologies (pp. 497-511): Springer.
Oliver, J.D. 2010, “How can Web 2.0 help increase consumer adoption of sustainable
products?”, in Tuten, T.L. Ed., Enterprise 2.0: How Technology, eCommerce, and
Web 2.0 Are Transforming Business Virtually. Volume 1: The Strategic Enterprise,
Praeger, Santa Barbara, CA, pp. 117-129.
Oliver, R. L., 1980. A cognitive model of the antecedents and consequences of satisfaction
decisions. Journal of Marketing Research, 17, 460-469.
Oliver, R.L.,1981. Measurement and evaluation of satisfaction processes in retail settings.
Journal of Retailing, 57(3), 25-48.
Oliver, R. L. 1999. Whence customer loyalty. Journal of Marketing, 63, 33–44.
Oliver, R.L., and Burke, R.R., 1999. Expectation processes in satisfaction formation a field
study. Journal of Service Research, 1(3), 196-214.
Olson, J.F., Howison, J. ; Carley, K.M. 2010. “Paying Attention to Each Other in Visible
Work Communities: Modeling Bursty Systems of Multiple Activity Streams,” Social
Computing 276-281.
O'Reilly, T., 2007. What is Web 2.0: Design Patterns and Business Models for the
NextGeneration of Software. Communications & Strategies, 1(65), pp. 17-37
97
Ostrom, A. L., Bitner, M. J., Brown, S.W., Burkhard, K.A., Goul, M., Smith-Daniels, V.,
Rabinovich, E., 2010. Moving forward and making a difference: research priorities
for the science of service. Journal of Service Research, 13(1), 4-36.
Paek, H. S. 2009. Differential effects of different peers: Further evidence of the peer
proximity thesis in perceived peer influence on college students’ smoking. Journal of
Communication, 59, 434–455.
Paek, H. S., and Gunther, A. 2007. How peer proximity moderates indirect media influence
on adolescent smoking. Communication Research, 34, 407–432.
Pallis, G., Zeinalipour-Yazti, D. and Dikaiakos, M.D., 2011. Online social networks: status
and trends. New Directions in Web Data Management, 213-234.
Park, Y. A., and Gretzel, U. 2007. Success factors for destination marketing web sites: a
qualitative meta-analysis. Journal of Travel Research, 46(1), 46–63.
Park, J. K., Yang, S.J. and Lehto, X., 2007. “Adoption of mobile technologies for Chinese
consumers,” Journal of Electronic Commerce Research, Vol. 8, No. 3: 196-206.
Pearson, S., and Benameur, A. 2010. Privacy, security and trust issues arising from cloud
computing. Paper presented at the Cloud Computing Technology and Science
(CloudCom), 2010 IEEE Second International Conference on.
Pelling, E.L, and White, K.M. 2009. The theory of planned behavior applied to young
people's use of social networking web sites. Cyber Psychology & Behavior, 12(6),
755-759.
Peterson, R. A. and Wilson, W. R. 1992. "Measuring Customer Satisfaction: Fact and
Artifact," Journal of the Academy of Marketing Science, 20 (1), 61-71.
Pozzoli, T., and Gini, G. 2010. Active defending and passive bystanding behavior in
bullying: the role of personal characteristics and perceived peer pressure.
Journal of Abnormal Child Psychology, 38(6), 815–827
Prahalad, C. K., and Ramaswamy, V., 2004. The future of competition: co-creating unique
value with customers: Harvard Business Press.
Qualman, E., .2011. 100 million on linkedin-infographic by country Available at:
http://www.socialnomics.net/2011/03/28/linkedin-hits-100-million-breakdown-by-
country-graphic/
Ratnasingam P., Pavlou P.A., Tan Y. The importance of technology trust for B2B electronic
commerce. Proceeding, 15th bled electronic commerce conference 2002.
http://ecom.fov.unimb.si/proceedings.nsf/pdf. Accessed 27 November 2013.
Raykov, T., 2011. Evaluation of convergent and discriminant validity with multitrait–
98
multimethod correlations. British Journal of Mathematical and Statistical Psychology,
64 (1), 38-52.
Reichheld, F. 1996. The loyalty effect: The hidden force behind growth, profits, and lasting
value. Boston: Harvard business school Press.
Ridings, C.M, and Gefen, D. 2004. Virtual community attraction: Why people hang out
online. Journal of Computer‐Mediated Communication, 10(1), 00-00.
Rimal, R., and Real, K. 2003. Understanding the influence of perceived norms on behaviors.
Communication Theory, 13, 184–203.
Ringle, C., Sarstedt, M., and Straub, D. 2012. A Critical Look at the Use of PLS-SEM in MIS
Quarterly. MIS Quarterly (MISQ), 36(1).
Robson, C. (2000). Real world research: Blackwell publishing. Oxford.
Roca, J.C., Garcia, J. J., and De La Vega, J.J., 2009. The importance of perceived trust,
security and privacy in online trading systems. Information Management and
Computer Security, 17 (2), 96-113.
Rosenthal, R., and Rosenow, R.L., 1991. Essentials of behavioral research: methods and
data analysis.
Roth, N, and Wilks, M.F. 2014. Neurodevelopmental and neurobehavioural effects of
polybrominated and perfluorinated chemicals: A systematic review of the
epidemiological literature using a quality assessment scheme. Toxicology letters.
Saeri, A. K., Ogilvie, C., La Macchia, S. T, Smith, J. R, and Louis, W. R. 2014. Predicting
Facebook users’ online privacy protection: Risk, trust, norm focus theory, and the
theory of planned behavior. The Journal of Social Psychology(just-accepted).
Schultz, P. W., Nolan, J. M., Cialdini, R. B., Goldstein, N. J., and Griskevicius, V. 2007. The
constructive, destructive, and reconstructive power of social norms. Psychological
Science, 18, 429–434.
Seeking A., 2009. Twitter posts meteoric 1,384% YoY growth. Available
from:http://seekingalpha.com/article/127580-twitter-posts-meteoric-1-384-yoy-
growth [Accessed 03/24 /2012]
Shakimov, A., Lim, H., Cáceres, R., Cox, L. P, Li, K., Liu, D., and Varshavsky, A. 2011.
Vis-a-vis: Privacy-preserving online social networking via virtual individual servers.
Paper presented at the Communication Systems and Networks (COMSNETS), 2011
Third International Conference.
99
Shankar, V., Smith, A. K, and Rangaswamy, A. 2003. Customer satisfaction and loyalty in
online and offline environments. International journal of research in marketing, 20(2),
153-175.
Sheth, J. N. 1973. A model of industrial buyer behavior. The Journal of Marketing, 50-56.
Shiau, W., and Luo, M.M., 2013. Continuance intention of blog users: the impact of
perceived enjoyment, habit, user involvement and blogging time. Behavior and
Information Technology, 32( 6), 570–583.
Shiau, W-L, and Luo, M. M. 2013. Continuance intention of blog users: the impact of
perceived enjoyment, habit, user involvement and blogging time. Behaviour &
Information Technology, 32(6), 570-583.
Shin, D. H. 2009. An empirical investigation of a modified technology acceptance model of
IPTV. Behavior and Information Technology, 28 (4), 361-372.
Shu, W. and Chuang, Y.-H. 2011, “The perceived benefits of six-degree-separation social
networks”, Internet Research, Vol. 21 No. 1, pp. 26-45.
Silverstein, S.M., Berten, S., Olson, P., Paul, R., Williams, L.M., Cooper, N., and Gordon, E.
2007. Development and validation of a World-Wide-Web-based neurocognitive
assessment battery: WebNeuro. Behavior Research Methods, 39(4), 940-949.
Smith, H.L. 2010. Interpersonal trust and cooperative behavior in a strategic alliance.
(Doctoral dissertation)
Sparks, P., Guthrie, C. A, and Shepherd, R., 1997. The dimensional structure of the perceived
behavioral control construct. Journal of applied social psychology, 27(5), 418-438.
Spiegel, M. R. 1972. Schaum's outline of theory and problems of statistics, McGraw-Hill,
New-York, USA.
Sripalawat, J., Thongmak, M., and Ngarmyarn, A., 2011. M-banking in metropolitan
Bangkok and a comparison with other countries. The Journal of Computer
Information Systems, 51(3), 67-76.
Stranahan, H., and Kosiel, D., 2007. E-tail spending patterns and the importance of online
store familiarity. Internet Research, 17(4), 421-434.
Stutzman, F., Capra, R., and Thompson, J. 2011. Factors mediating disclosure in social
network sites. Computers in Human Behavior, 27(1), 590–598.
Sun, Y, and Jeyaraj, A. 2013. Information technology adoption and continuance: A
longitudinal study of individuals’ behavioral intentions. Information & Management,
50(7), 457-465.
100
Suki, N.M., 2011. A structural model of customer satisfaction and trust in vendors involved
in mobile commerce. International Journal of Business Science and Applied
Management, 6(2), 18-29.
Tajfel, H. (Ed.). 1982. Social identity and intergroup relations. Cambridge, England:
Cambridge University Press.
Tanner, B. A, and Stacy Jr, W. 1985. A validity scale for the Sharp consumer satisfaction
scales. Evaluation and program planning, 8(2), 147-153.
Taylor, S., and Todd, P. A. 1995. Understanding information technology usage: a test of
competing models. Information systems research, 6(2), 144-176.
Teece, D. J. 2010. Business models, business strategy and innovation. Long range planning,
43(2), 172-194.
Tenenhaus, M., vinzi, V. E., Chatelin, Y. M. and Lauro, C. 2005. PLS path modeling.
Computational Statistics and Data Analysis, 48, 159-205.
Teo, T., and Lee, C.B., 2010. Explaining the intention to use technology among student
teachers: an application of the theory of planned behavior (TPB). Campus-Wide
Information Systems, 27(2), 60-67.
Teo, T.S.H., Srivastava, S.C. and Jiang, L. (2008-2009), “Trust and electronic government
success: an empirical study”, Journal of Management Information Systems, Vol. 25
No. 3, pp. 99-132.
Thackeray, R. and McCormack B.K.R., 2008. Enhancing PromotionalStrategies within the
social marketing programs: Use of web 2.0 Social Media. HealthPromotion Practise,
9(4), pp. 338-343.
Thorbjørnsen, H., Pedersen, P.E., and Nysveen, H., 2007. This is who I am: identity
expressiveness and the theory of planned behavior. Psychology and Marketing, 24(9),
763-785.
Tokunaga, R. S. 2011. Social networking site or social surveillance site? Understanding the
use of interpersonal electronic surveillance in romantic relationships. Computers in
Human Behavior, 27(2), 705–713.
Trafimow, D., Sheeran, P., Conner, M., and Finlay, K.A., 2002. Evidence that perceived
behavioral control is a multidimensional construct: Perceived control and perceived
difficulty. British Journal of Social Psychology, 41(1), 101-121.
Tranfield, D., Denyer, D. and Smart, P. 2003. ‘Towards a methodology for developing
evidence-informed management knowledge by means of systematic review’. British
Journal of Management, 14, 207–22.
101
Urban, G.L., Amyx, C., and Lorenzon, A., 2009. Online trust: state of the art, new frontiers,
and research potential. Journal of Interactive Marketing, 23(2), 179-190.
Vance, A., Elie-Dit-C., C., and Straub, D.W., 2008. Examining trust in information
technology artifacts: the effects of system quality and culture. Journal of Management
Information Systems, 24(4), 73-100.
Venable, J. R., Pries-Heje, J., Bunker, D. and Russo, N. L. 2011. Design and diffusion of
systems for human benefit: toward more humanistic realisation of information
systems in society. Information Technology & People, 24, 208-216.
Venkatesh, V., and Davis, F.D., 2000. A theoretical extension of the technology acceptance
model: fthis longitudinal field studies. Management Science, 46 (2), 186-204.
Venkatesh, V., Morris, M. G., Gordon, B. D. and Davis, F. D. 2003. User acceptance of
information technology: toward a unified view. MIS Quarterly, 27(3): 425-478.
Venkatesh, V., Thong, J.Y.L., Chan, F.K.Y., Hu, P.J.H., and Brown, S.A., 2011. Extending
the two phase information systems continuance model: incorporating UTAUT
predictors and the role of context. Information Systems Journal 21 (6), 527–555.
Venkatesh, V., Thong, J.Y.L and Xu, X. 2012. Consumer acceptance and use of information
technology: extending the unified theory of acceptance and use of technology. MIS
quarterly, 36(1), 157-178.
Venkatesh, V. and Zhang, X. 2010. “Unified theory of acceptance and use of technology:
U.S. vs. China,” Journal of Global Information Technology Management, Vol. 13,
No. 1: 5-27, 2010.
Vermeir, I., and Verbeke, W., 2008. Sustainable food consumption among young adults in
Belgium: theory of planned behavithis and the role of confidence and values.
Ecological Economics, 64(3), 542-553.
Wang, J., and Xiao, J.J., 2009. Buying behavior, social support and credit card indebtedness
of college students. International Journal of Consumer Studies, 33(1), 2-10.
Waters, S., and Ackerman, J. 2011. Exploring privacy management on Facebook:
Motivations and perceived consequences of voluntary disclosure. Journal of
Computer-Mediated Communication, 17(1), 101–115.
Weinstein, W. D. 1993. Testing fthis competing theories of health-protective behavithis.
Health Psychology, 12(4): 324–33.
Wen, C., Prybutok, V. R, and Xu, C. 2011. An integrated model for customer online
repurchase intention. Journal of Computer Information Systems, 52(1), 14-23.
102
Westbrook, R. A. 1980. Consumer satisfaction as a function of personal competence/efficacy.
Journal of the Academy of Marketing Science, 8(4), 427-437.
Wirtz B. W., Mory L. and Piehler R. 2014. Web 2.0 and Digital Business Models.
Wirtz, B. W., Schilke, O. and Ullrich, S. 2010. Strategic development of business models:
Implications of the web 2.0 for creating value on the internet. Long Range Planning,
43(2/3), 272–290.
Wolcott, P., Kamal, M., and Qureshi, S., 2008. Meeting the challenges of ICT adoption by
micro-enterprises. Journal of Enterprise Information Management, 21(6), 616-632.
Woodside, A. G., Frey, L. L., and Daly, R. T. 1989. Linking service quality, customer
satisfaction, and behavioral intention. Journal of Health Care Marketing,9, 5–17.
Wright, K.B., 2005. Researching internet‐based populations: advantages and disadvantages of
online survey research, online questionnaire authoring software packages and web
survey services. Journal of Computer‐Mediated Communication, 10(3), 00-00.
Wu, S-I., 2006. A comparison of the behavior of different customer clusters towards Internet
bookstores. Information and Management, 43(8), 986-1001.
Wu, J-J., Chen, Y-H., and Chung, Y-S., 2010. Trust factors influencing virtual community
members: a study of transaction communities. Journal of Business Research, 63(9),
1025-1032.
Wu, Y-L, Tao, Y-H, Li, C-P, Wang, S-Y, and Chiu, C-Y. 2014. User-switching behavior in
social network sites: A model perspective with drill-down analyses. Computers in
Human Behavior, 33, 92-103.
Xarchos, Chris, & Charland, M Brent. (2008). Innovapost uses Web 2.0 tools to engage its
employees. Strategic HR Review, 7(3), 13-18.
Xu, J., and Liu, Z. 2010. Study of online stickiness: its antecedents and effect on repurchase
intention. In: Proceedings of International Conference on e-Education, e-Business, e-
Management, and e-Learning (IC4E '10), 22-24. January, Sanya, China,. Los
Alamitos, 116-120.
Yanovitzky, I., Stewart, L. P., and Lederman, L. C. 2006. Social distance, perceived drinking
by peers, and alcohol use by college students. Health Communication, 19, 1–10.
Yusliza, M.Y, and Ramayah, T., 2011. Explaining the intention to use electronic HRM
among HR professionals: results from a pilot study. Aust. J. Bas. Appl. Sc, 5(8), 489-
497.
103
Yu-Lung Wu, Yu-Hui Tao, Ching-Pu Li, Sheng-Yuan Wang, Chi-Yuan Chiu. 2014. User-
switching behavior in social network sites: A model perspective with drill-down
analyses.
Zhang, A., Sun, H., and Wang, X. 2012. Serum metabolomics as a novel diagnostic approach
for disease: a systematic review. Analytical and bioanalytical chemistry, 404(4),
1239-1245.
Zhang, J., Qu, Y., Cody, J., and Wu, Y. 2010. A case study of micro-blogging in the
enterprise: use, value, and related issues. Paper presented at the Proceedings of the
28th international conference on Human factors in computing systems.
Zhang, K. Z. K., Cheung, C. M. K., & Lee, M. K. O. 2012. Online service switching
behavior: The case of blog service providers. Journal of Electronic Commerce
Research, 13(3), 184–197.
Zhao, Ling, and Lu, Yaobin. 2012. Enhancing perceived interactivity through network
externalities: An empirical study on micro-blogging service satisfaction and
continuance intention. Decision Support Systems, 53(4), 825-834.
Zheng, YiMing, Zhao, Kexin, & Stylianou, Antonis. 2013. The impacts of information
quality and system quality on users' continuance intention in information-exchange
virtual communities: An empirical investigation. Decision Support Systems, 56, 513-
524.
Zhou, T. 2011. An empirical examination of users' post-adoption behaviour of mobile
services. Behaviour & Information Technology, 30(2), 241-250.
Zott, C., Amit, R. and Massa, L. 2011. The business model: recent developments and future
research. Journal of Management, 37(4), 1019-1042.
104
APPENDIX A: DATA COLLECTION INSTRUMENT
FACTORS THAT DETERMINE THE CONTINUANCE INTENTION OF PEOPLE TO
USE ONLINE SOCIAL NETWORKS FOR BUSINESS TRANSACTIONS
COVERING LETTER
Researcher: Akwesi Assensoh-Kodua 0782898210 / [email protected].
Supervisor : Prof. Oludayo O. Olugbara (PhD)0780428567 / 0313735591
Co-supervisor: Prof. T. Nepal (PhD) 0313735591
Dear Participant,
Thank you for being part of this survey. Your participation is greatly appreciated. This survey
is being conducted from Durban University of Technology (DUT) in South Africa and will
take approximately 5 minutes to complete. The purpose of this survey is to gather
information from online social network participants who use the model for business
transactions, for academic research purposes only. The results from this study will be used for
research and publications purposes only and will be made available online and DUT library,
in the form of a published thesis.
Confidentiality: We would like to assure you that the information that you offer in this
survey is strictly confidential and that no personal details are required of you. Your name will
not appear on the survey and the answers you give will be treated as strictly confidential.
Answers on the survey will be coded to ensure anonymity. You cannot be identified in person
based on the answers you give.
Persons to Contact in the Event of Any Problems or Queries:
Please contact the researcher (+27782898210 : [email protected]),
my supervisor (0780428560 : [email protected]) or the Institutional Research Ethics
administrator on 031 373 2900.
Complaints can be reported to the DVC: TIP, Prof F. Otieno on 031 373 2382 or
105
Kindly proceed with this survey if you have read this letter in its entirety, understand it
contents and agree to voluntarily participate in this study.
Please answer the questionnaire as completely and honestly as possible, and do not answer it
if you do not wish to participate in the study.
Thank you for your kind assistance.
CONSENT
Statement of Agreement to Participate in the Research Study:
• I hereby confirm that I have been informed by the researcher, Akwesi Assensoh-Kodua,
about the nature, conduct, benefits and risks of this study - Research Ethics Clearance
Number: _,
• I have also received, read and understood the above written information (Participant Letter
of Information) regarding the study.
• I am aware that the results of the study, including personal details regarding my sex, age,
date of birth, initials and diagnosis will be anonymously processed into a study report.
• In view of the requirements of research, I agree that the data collected during this study can
be processed in a computerised system by the researcher.
• I may, at any stage, without prejudice, withdraw my consent and participation in the study.
• I have had sufficient opportunity to ask questions and (of my own free will) declare myself
prepared to participate in the study.
• I understand that significant new findings developed during the course of this research
which may relate to my participation will be made available to me.
I have read the consent form and hereby agree to participate in the study (Click next to accept
participation/Otherwise exist).
Next
Powered by SurveyMonkey
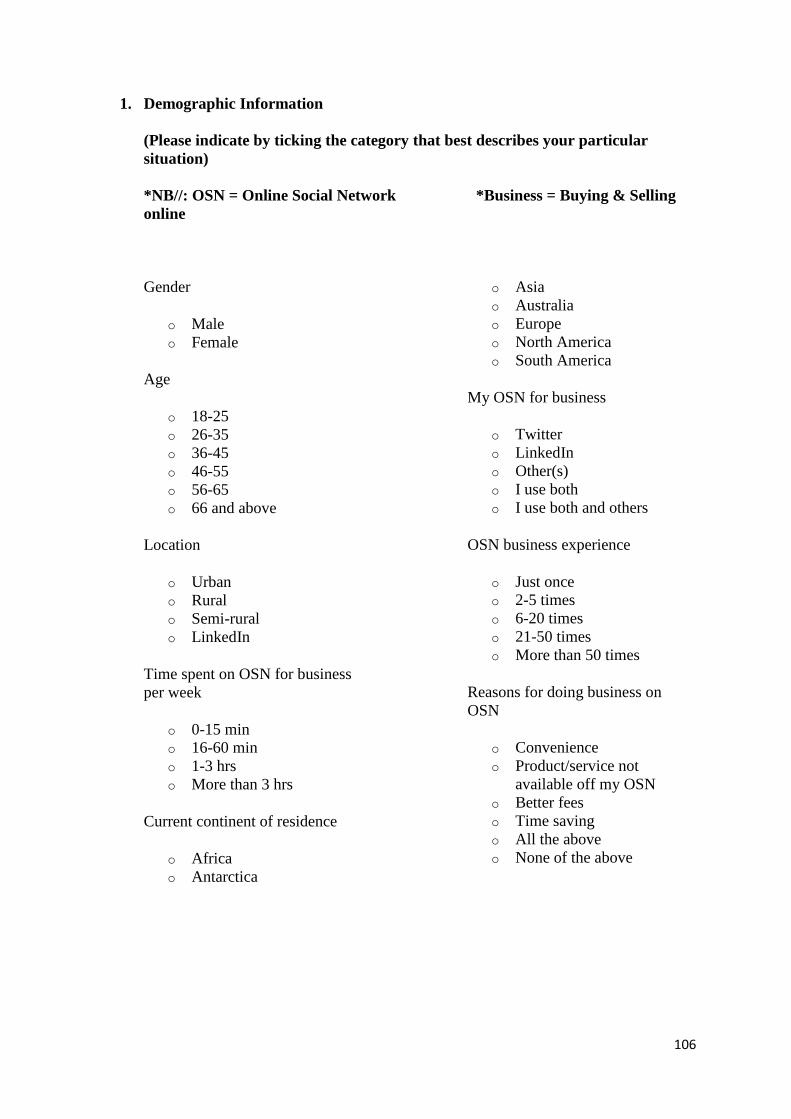
106
1. Demographic Information
(Please indicate by ticking the category that best describes your particular
situation)
*NB//: OSN = Online Social Network *Business = Buying & Selling
online
Gender
o Male
o Female
Age
o 18-25
o 26-35
o 36-45
o 46-55
o 56-65
o 66 and above
Location
o Urban
o Rural
o Semi-rural
o LinkedIn
Time spent on OSN for business
per week
o 0-15 min
o 16-60 min
o 1-3 hrs
o More than 3 hrs
Current continent of residence
o Africa
o Antarctica
o Asia
o Australia
o Europe
o North America
o South America
My OSN for business
o Twitter
o LinkedIn
o Other(s)
o I use both
o I use both and others
OSN business experience
o Just once
o 2-5 times
o 6-20 times
o 21-50 times
o More than 50 times
Reasons for doing business on
OSN
o Convenience
o Product/service not
available off my OSN
o Better fees
o Time saving
o All the above
o None of the above
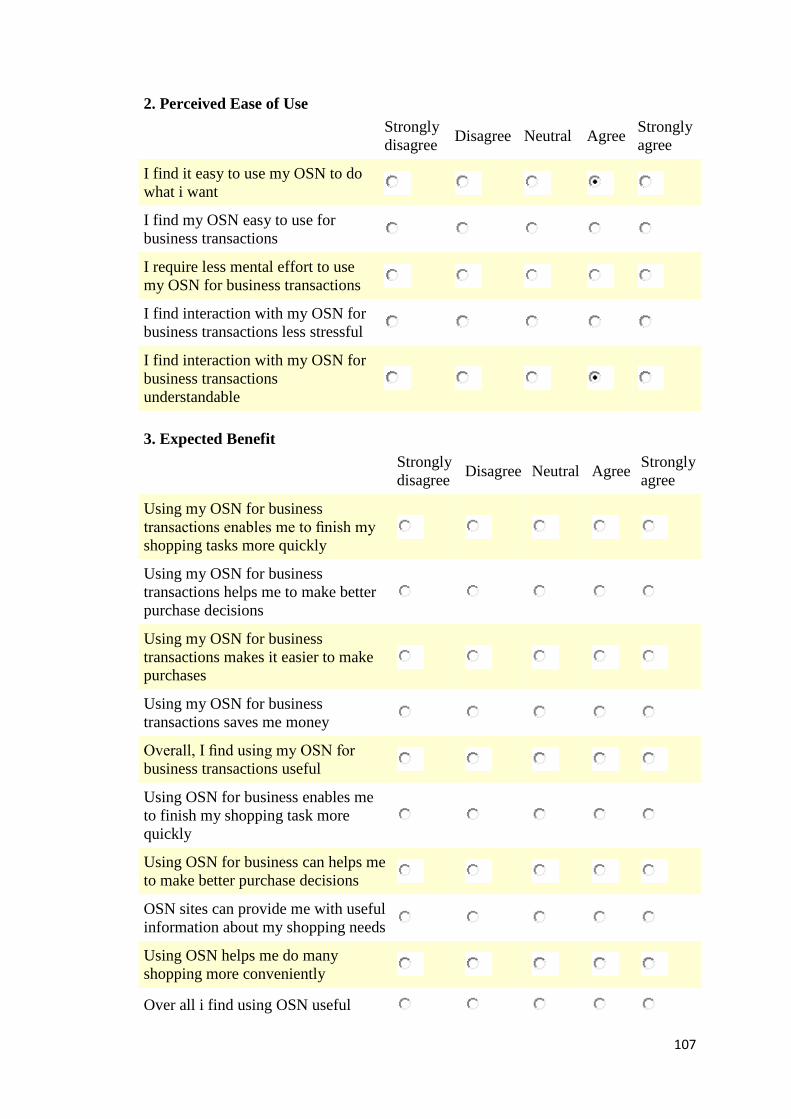
107
2. Perceived Ease of Use
Strongly
disagree Disagree Neutral Agree
Strongly
agree
I find it easy to use my OSN to do
what i want
I find my OSN easy to use for
business transactions
I require less mental effort to use
my OSN for business transactions
I find interaction with my OSN for
business transactions less stressful
I find interaction with my OSN for
business transactions
understandable
3. Expected Benefit
Strongly
disagree Disagree Neutral Agree
Strongly
agree
Using my OSN for business
transactions enables me to finish my
shopping tasks more quickly
Using my OSN for business
transactions helps me to make better
purchase decisions
Using my OSN for business
transactions makes it easier to make
purchases
Using my OSN for business
transactions saves me money
Overall, I find using my OSN for
business transactions useful
Using OSN for business enables me
to finish my shopping task more
quickly
Using OSN for business can helps me
to make better purchase decisions
OSN sites can provide me with useful
information about my shopping needs
Using OSN helps me do many
shopping more conveniently
Over all i find using OSN useful
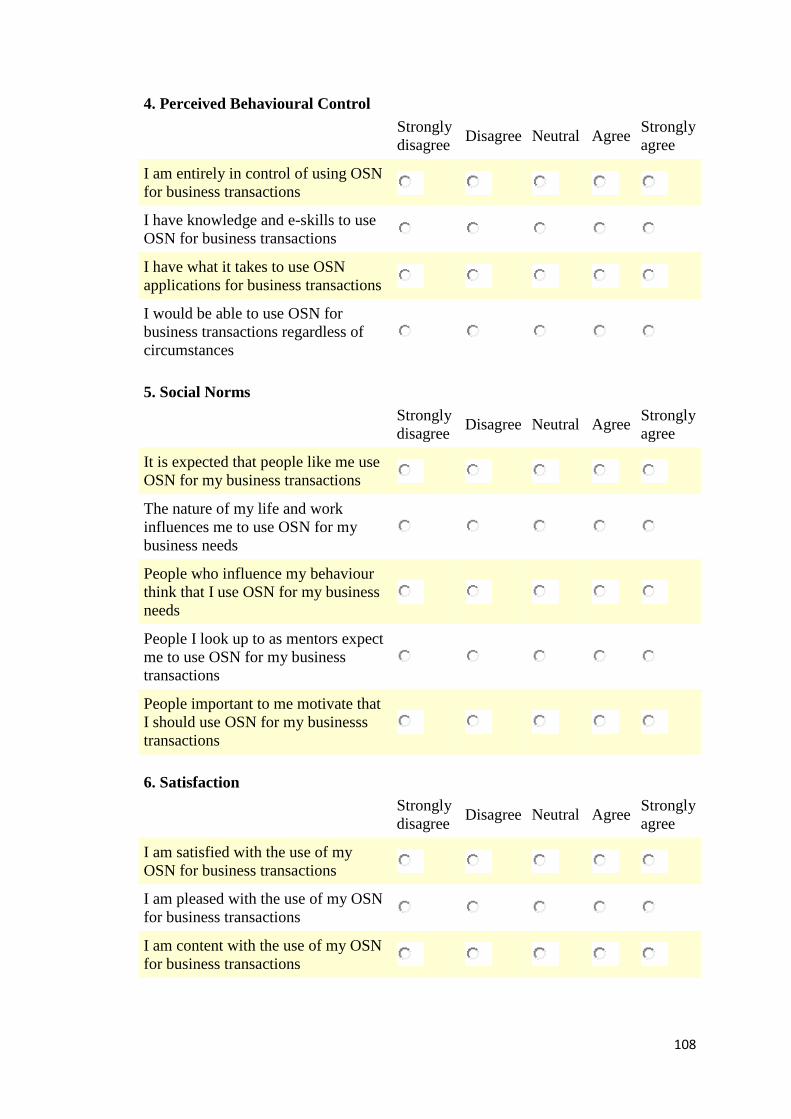
108
4. Perceived Behavioural Control
Strongly
disagree Disagree Neutral Agree
Strongly
agree
I am entirely in control of using OSN
for business transactions
I have knowledge and e-skills to use
OSN for business transactions
I have what it takes to use OSN
applications for business transactions
I would be able to use OSN for
business transactions regardless of
circumstances
5. Social Norms
Strongly
disagree Disagree Neutral Agree
Strongly
agree
It is expected that people like me use
OSN for my business transactions
The nature of my life and work
influences me to use OSN for my
business needs
People who influence my behaviour
think that I use OSN for my business
needs
People I look up to as mentors expect
me to use OSN for my business
transactions
People important to me motivate that
I should use OSN for my businesss
transactions
6. Satisfaction
Strongly
disagree Disagree Neutral Agree
Strongly
agree
I am satisfied with the use of my
OSN for business transactions
I am pleased with the use of my OSN
for business transactions
I am content with the use of my OSN
for business transactions
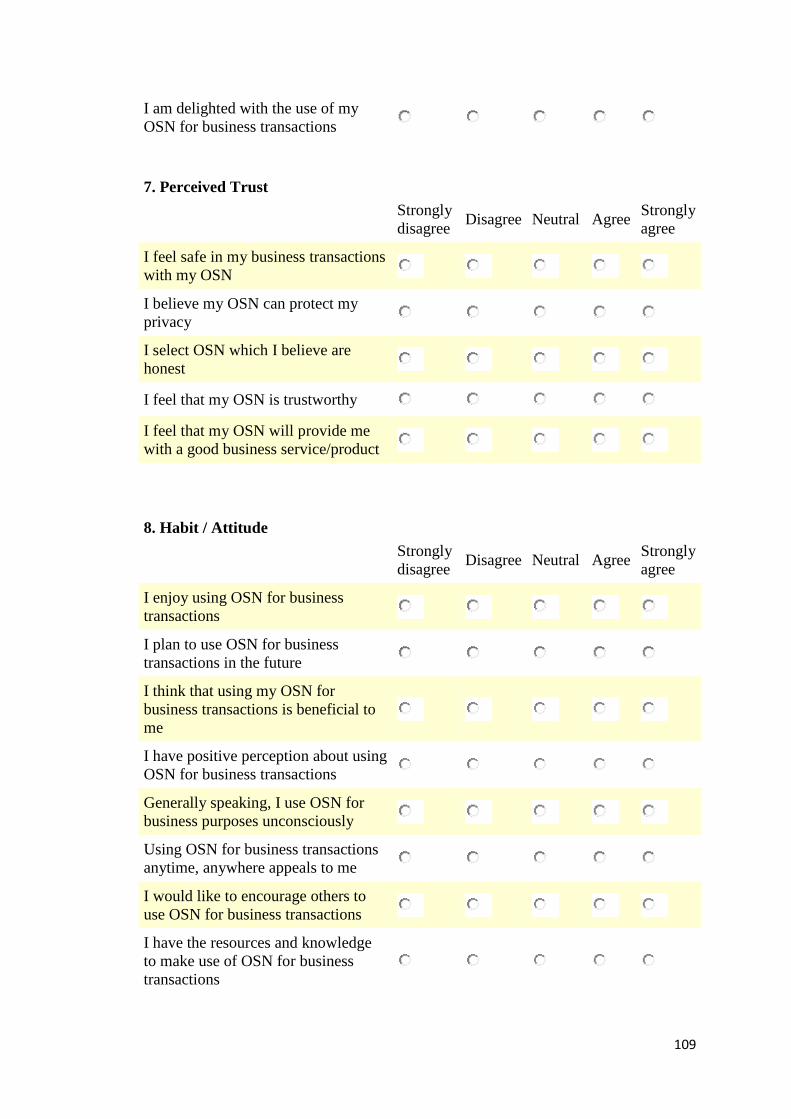
109
I am delighted with the use of my
OSN for business transactions
7. Perceived Trust
Strongly
disagree Disagree Neutral Agree
Strongly
agree
I feel safe in my business transactions
with my OSN
I believe my OSN can protect my
privacy
I select OSN which I believe are
honest
I feel that my OSN is trustworthy
I feel that my OSN will provide me
with a good business service/product
8. Habit / Attitude
Strongly
disagree Disagree Neutral Agree
Strongly
agree
I enjoy using OSN for business
transactions
I plan to use OSN for business
transactions in the future
I think that using my OSN for
business transactions is beneficial to
me
I have positive perception about using
OSN for business transactions
Generally speaking, I use OSN for
business purposes unconsciously
Using OSN for business transactions
anytime, anywhere appeals to me
I would like to encourage others to
use OSN for business transactions
I have the resources and knowledge
to make use of OSN for business
transactions
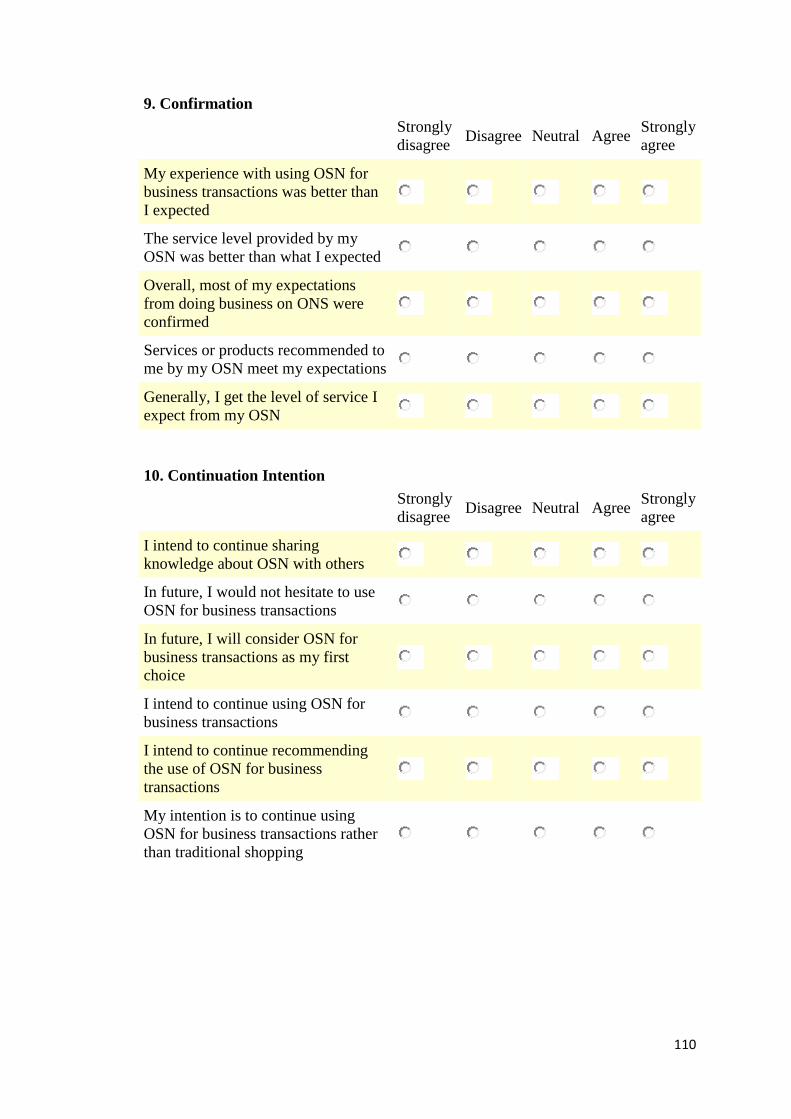
110
9. Confirmation
Strongly
disagree Disagree Neutral Agree
Strongly
agree
My experience with using OSN for
business transactions was better than
I expected
The service level provided by my
OSN was better than what I expected
Overall, most of my expectations
from doing business on ONS were
confirmed
Services or products recommended to
me by my OSN meet my expectations
Generally, I get the level of service I
expect from my OSN
10. Continuation Intention
Strongly
disagree Disagree Neutral Agree
Strongly
agree
I intend to continue sharing
knowledge about OSN with others
In future, I would not hesitate to use
OSN for business transactions
In future, I will consider OSN for
business transactions as my first
choice
I intend to continue using OSN for
business transactions
I intend to continue recommending
the use of OSN for business
transactions
My intention is to continue using
OSN for business transactions rather
than traditional shopping